


Abstract
To address the technical bottleneck of the trade-off between fluidity and anti-dispersion performance in traditional underwater anti-dispersion cement pastes, this paper performs composite modification on the paste using polyacrylate (PAE) emulsion and nonionic waterborne epoxy resin (NEP) compounded with silica fume. The results show that both polymer components improve paste fluidity, whereas the silica-fume-free mixtures exhibit pronounced composition-dependent fluctuations in fluidity. Silica fume improves the stability of the paste’s fresh-state behavior but adversely affects its fluidity. Within the investigated dosage ranges, increasing the NEP dosage generally reduced turbidity and improved underwater anti-dispersion performance, whereas increasing the PAE dosage produced the opposite trend; silica fume exhibited a dosage-dependent effect, with an appropriate dosage contributing to lower turbidity. Experiments were conducted based on the Box–Behnken response surface methodology to establish second-order regression prediction models for fluidity and underwater anti-dispersion performance respectively. The RSM analysis identified model-derived candidate dosage ranges of 15–25% PAE solids, 9–15% NEP, and approximately 5–15% silica fume by cement mass. An independent validation batch prepared at the predicted optimum of 15.54% PAE solids, 13.69% NEP, and 4.95% silica fume exhibited a fluidity of 142 mm and a turbidity of 148 NTU. The validation results support the local predictive reliability of the models and confirm that the candidate composition satisfies the predefined fresh-state fluidity and turbidity criteria; its hardened-state and engineering-scale performance remains to be evaluated.
1. Introduction
Non-dispersible underwater cement-based materials are specialized materials essential for underwater repair and reinforcement in water conservancy and infrastructure engineering. They have been widely used in dam rehabilitation, underwater pile foundation strengthening, tunnel backfilling, and other submerged construction scenarios [1,2,3]. With the increasing use of these materials in long-distance pipeline pumping grouting, they are exposed to the coupled effects of complex shear action, extended construction duration, and aggressive aqueous environments. These service and construction conditions impose higher requirements on paste fluidity, time-dependent flow retention, and underwater forming stability [4,5,6]. During transportation and underwater placement, these materials may exhibit excessive pumping resistance, rapid fluidity loss, and insufficient resistance to underwater dispersion, thereby compromising pumpability and placement stability. Consequently, coordinated control of rheology, fluidity, and anti-dispersion performance is essential for the preliminary design of mixtures intended for long-distance underwater grouting [7,8,9,10].
At present, flocculating admixtures are widely used as modification agents for underwater cement-based materials. Among them, nonionic waterborne epoxy resin (NEP) has attracted considerable attention because of its favorable water solubility, strong wet-interface adhesion, and good compatibility with cement-based systems [11,12,13]. Previous studies by Nasr et al. [14,15] have shown that NEP-based modification can promote the formation of a flocculation network within the paste and enhance the bonding and encapsulation effects among cementitious particles. As a result, the loss of cement particles and paste segregation in aqueous environments can be effectively inhibited, thereby improving the underwater anti-dispersion performance and ensuring the stability and integrity of the paste during underwater forming. Nevertheless, single NEP-modified systems still present notable limitations. The incorporation of epoxy resin tends to increase paste viscosity, which raises pumping resistance during long-distance transportation. Meanwhile, the paste structure evolves rapidly under static conditions, leading to significant time-dependent flow loss and making it difficult to satisfy the requirements of prolonged continuous grouting. In addition, the attenuation of cohesion under underwater conditions may weaken the hardened mechanical properties, thereby restricting the engineering applicability of single-component NEP-modified systems [12].
To overcome the limitations of single-component modification, polymer blending has been proposed as a more effective approach for regulating the performance of cement-based materials. In cementitious pastes, “mesoscopic rheological properties” refer to the collective flow response arising from interparticle interactions and flocculated-network organization at the colloidal-to-supramolecular scale, operationally characterized in this study by yield stress and plastic viscosity. Previous studies [12,16,17,18,19] demonstrated that the macroscopic working performance of cement-based materials is inherently governed by the coupled evolution of mesoscopic rheological properties and microstructural characteristics. Compared with single-admixture systems, blended polymers may regulate the paste particle network through multiple effects, including adsorption, molecular association, changes in particle dispersion, and modification of the liquid-phase environment. As cement hydration proceeds, the interfacial properties and liquid-phase composition of the system continuously evolve, resulting in pronounced time-dependent rheological behavior in composite-modified pastes. However, existing studies have mainly focused on the effects of admixture dosage on macroscopic material properties and have relied primarily on single-factor macroscopic tests. The intrinsic correlations between mesoscopic rheological evolution and macroscopic pumping, anti-dispersion, and flow-retention properties remain insufficiently clarified. In particular, the coupling mechanism among microstructure, rheological properties, and engineering performance has not been systematically established, which limits the rational performance optimization of specialized materials for long-distance underwater grouting.
Statistical design-of-experiments methods are increasingly used in cement-based materials to efficiently evaluate multiple formulation variables, interaction effects, and nonlinear responses. Recent research has further demonstrated the applicability of experimental-statistical modeling to multivariable mixture optimization in cementitious systems [20]. Accordingly, this study employed response surface methodology (RSM) with a three-factor, three-level Box–Behnken design to investigate the coupled and potentially nonlinear effects of PAE, NEP, and silica fume on fluidity and turbidity. The design enables the estimation of linear, interaction, and quadratic effects and the fitting of second-order response models using 17 experimental runs, thereby reducing the experimental burden relative to a full three-level factorial design.
Against this background, this study investigates the fresh-state behavior of non-dispersible underwater cement pastes modified with PAE, NEP, and silica fume under static-water conditions. The specific objectives are to: (1) quantify the main, interaction, and quadratic effects of the three components on fluidity and turbidity using response surface methodology and a Box–Behnken design; (2) establish empirical relationships between mesoscopic rheological parameters and macroscopic fresh-state responses, including fluidity and underwater anti-dispersion performance; and (3) identify and independently validate a candidate mixture satisfying the predefined fresh-state performance criteria. This study aims to address the difficulty of balancing fluidity and underwater stability in conventional underwater cement-based materials, contribute to refining the rheological framework for polymer-modified grouting materials, and provide theoretical support for the mixture design and engineering application of high-performance non-dispersible underwater grouting materials.
2. Experimental Scheme
2.1. Raw Materials
Portland cement P·I 52.5R produced by Jiangnan Onoda Cement Co., Ltd., Nanjing, China. was used, and its physical properties, experimentally measured by the authors, are shown in Table 1. Tap water was used for all experiments. The admixtures used were polyacrylate emulsion (PAE) produced by Nanjing R&D High-Tech Co., Ltd., Nanjing, China. and non-ionic waterborne epoxy resin (NEP) from Changzhou Guangshu Chemical Technology Co., Ltd., Changzhou, China. Their properties, obtained from the manufacturers’ technical data sheets, are shown in Table 2 and Table 3, respectively.
Table 1.
Physical properties of Portland cement P·I 52.5R.
Table 2.
Properties of polyacrylate emulsion.
Table 3.
Properties of nonionic waterborne epoxy resin.
2.2. Sample Preparation
Response Surface Methodology (RSM) was employed to construct predictive models for evaluating the effects of polyacrylate emulsion (PAE), nonionic waterborne epoxy resin (NEP), and silica fume on the working performance of modified cement pastes. Based on the findings of Sun et al. [21,22], the water–binder ratio was kept constant at 0.30 throughout the experiment. The dosage ranges of PAE, NEP, and silica fume were preliminarily set at 10–30%, 5–15%, and 0–20% of the cement mass, respectively. The PAE dosage was calculated as the mass ratio of dry polymer solids to cement.
To systematically investigate the individual and interactive effects of these three components, a three-factor, three-level Box–Behnken design was adopted. PAE, NEP, and silica fume were selected as independent variables, while the fluidity and turbidity of the modified cement pastes were defined as the response variables. This experimental design enabled the quantitative relationships between component dosages and working performance to be established, while also allowing the interaction effects among the variables to be evaluated. The modified cement pastes were designated as PCP1~PCP17, among which PCP13~PCP17 served as center-point replicates for estimating experimental error and verifying the reliability of the regression models. The detailed mix proportions are shown in Table 4. All 17 mixtures were cement pastes prepared without sand or any other fine aggregate; therefore, no sand-to-binder ratio or aggregate gradation was involved in the experimental program.
Table 4.
Mix Proportions of Non-dispersible Underwater Pastes.
2.3. Experimental Design and Statistical Analysis
The response variables were fitted using second-order polynomial models, and the regression coefficients were estimated by the least-squares method using all 17 Box–Behnken design runs. The statistical significance of the fitted models and individual regression terms was evaluated by analysis of variance. The significance level was set at α = 0.05, and terms with p < 0.05 were considered statistically significant. Model adequacy was evaluated using the model F-value, p-value, coefficient of determination (R2), adjusted R2, adequate precision, and lack-of-fit test. Non-significant terms were removed only when their elimination did not violate model hierarchy.
The F-value evaluates whether the variation explained by the model is significant relative to the residual error, whereas the p-value indicates the statistical significance of the model or individual regression term under the null hypothesis.
2.4. Test Methods
2.4.1. Rheological Property Test
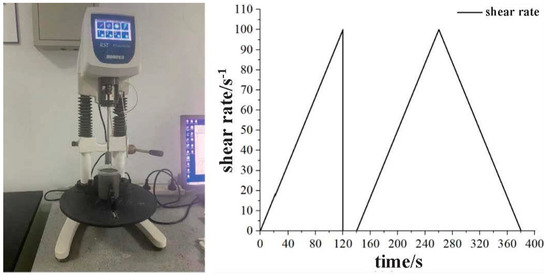
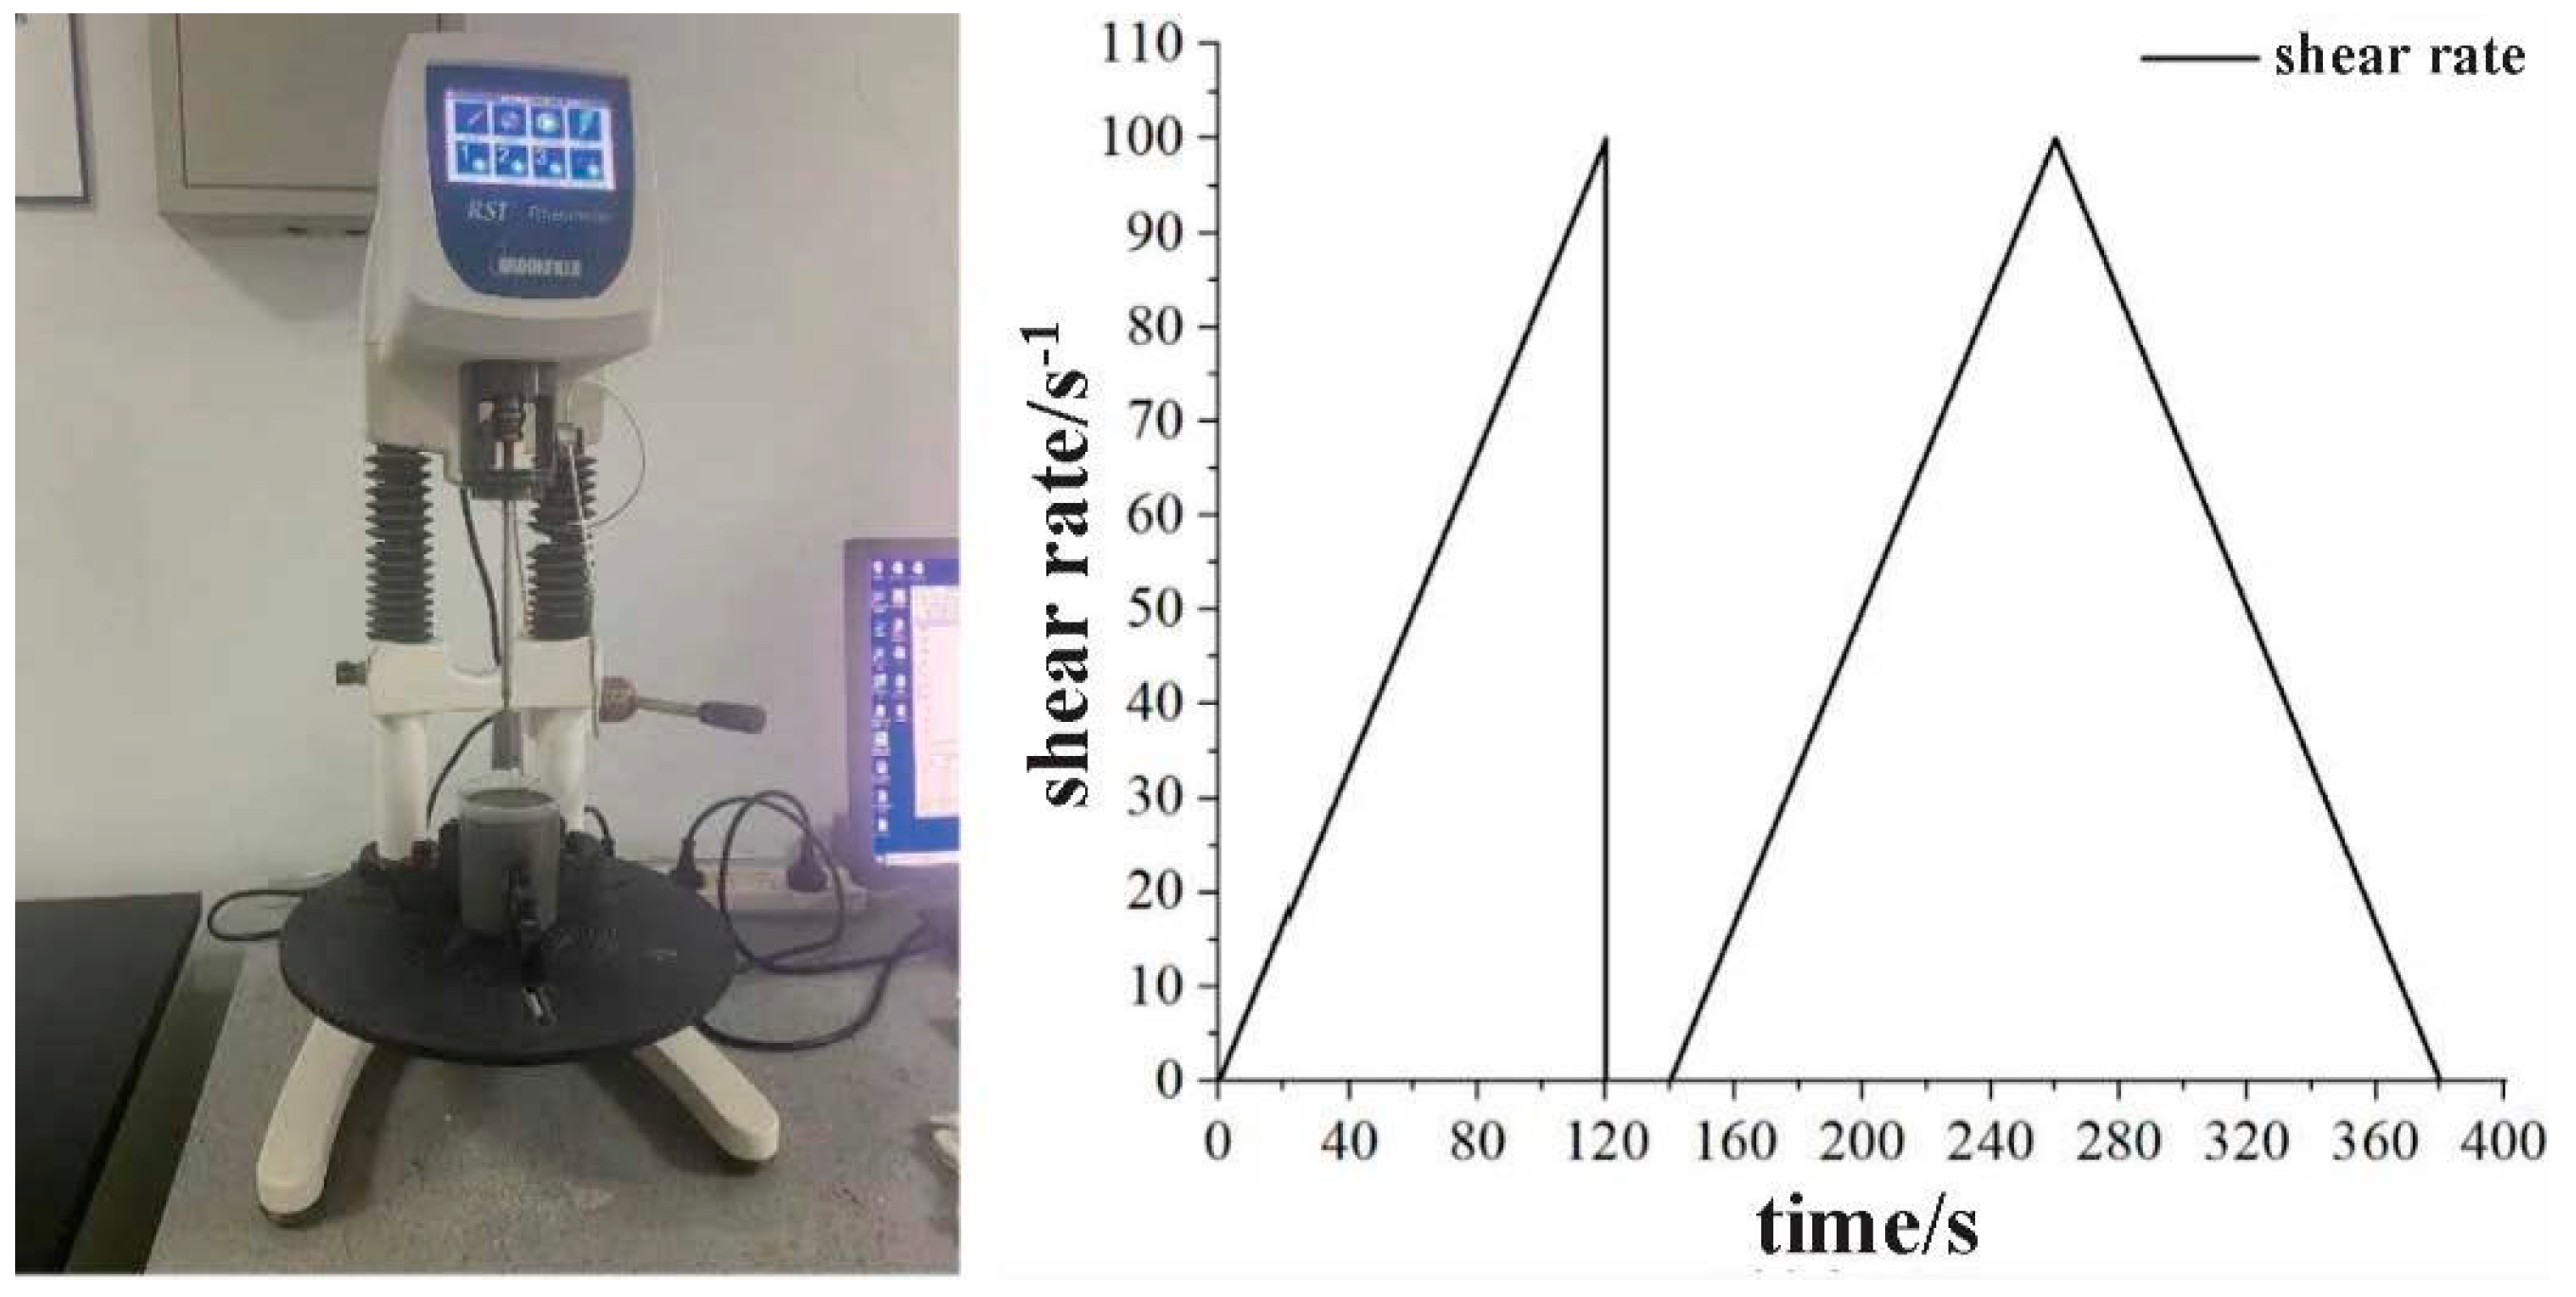
The rheological properties of non-dispersible underwater pastes were measured using a Brookfield RST-SST touchscreen rheometer (AMETEK Brookfield, Middleboro, MA, USA). A paddle rotor with a diameter of 20 mm and a height of 30 mm was selected and placed in a beaker with a diameter of 70 mm and a height of 100 mm. During the test, the rotor was strictly centered in the beaker and immersed 10 mm below the surface of the cement paste. The rheological parameters were measured according to the following procedure: Immediately after the modified cement paste was mixed, it was poured into the pre-prepared beaker. After adjusting the rotor position, the rheological parameter measurement was carried out. The Brookfield RST-SST touchscreen rheometer and the variation in shear rate with time are shown in Figure 1.
Figure 1.
Brookfield RST-SST touchscreen rheometer and rheological test scheme.
2.4.2. Fluidity Test
The fluidity of the freshly mixed cement pastes was measured using the truncated-cone spread method in accordance with “Methods for Testing Uniformity of Concrete Admixture” (GB/T 8077-2012) [23]. The truncated-cone mold had an upper internal diameter of 36 mm, a lower internal diameter of 60 mm, and a height of 60 mm. The freshly mixed paste was poured into the mold placed on a horizontal glass plate, after which the mold was lifted vertically at a constant speed. The paste was allowed to spread freely for 30 s, and two mutually perpendicular spread diameters were measured and averaged. The reported fluidity was the mean value obtained from three independently prepared specimens.
2.4.3. Underwater Anti-Dispersion Performance Test
The underwater anti-dispersion performance of cement pastes was determined in accordance with “Test Code on Anti-washout Underwater Concrete” (DL/T 5117-2021) [24]. No sand or other fine aggregate was incorporated into the tested mixtures. Paste mass loss was determined using the gravimetric method, and turbidity was measured to quantitatively characterize the underwater anti-dispersion performance.
For the gravimetric test, a 1500 mL glass beaker was placed at the center of a plastic bucket, which was then filled with water to a depth of 500 mm. Subsequently, 2000 g of freshly mixed cement paste was poured slowly and uniformly into the beaker from the water surface. After the specimen was allowed to stand for 5 min, the beaker was lifted slowly and steadily out of the water. The residual water in the beaker was then drained, and the remaining material was weighed to calculate the mass loss rate of the cement paste. The final mass loss rate was reported as the average of three replicate measurements.
For the turbidity test, a 1000 mL beaker containing 800 mL of distilled water was prepared. A total of 500 g of freshly mixed cement paste was divided into ten equal portions, and each portion was slowly and uniformly dropped into the water from the surface using a hand trowel. After standing for 3 min, 150 mL of supernatant was collected with a pipette and transferred to a WZS-188 turbidimeter (Shanghai INESA Scientific Instruments Co., Ltd., Shanghai, China) for turbidity measurement. The final turbidity value was calculated as the average of three measurements.
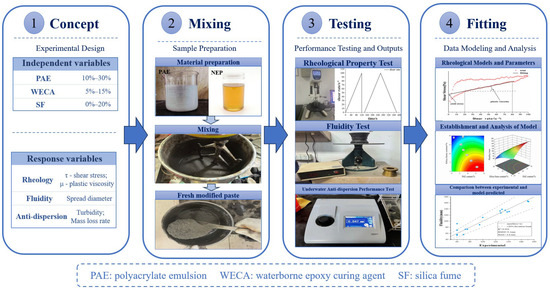
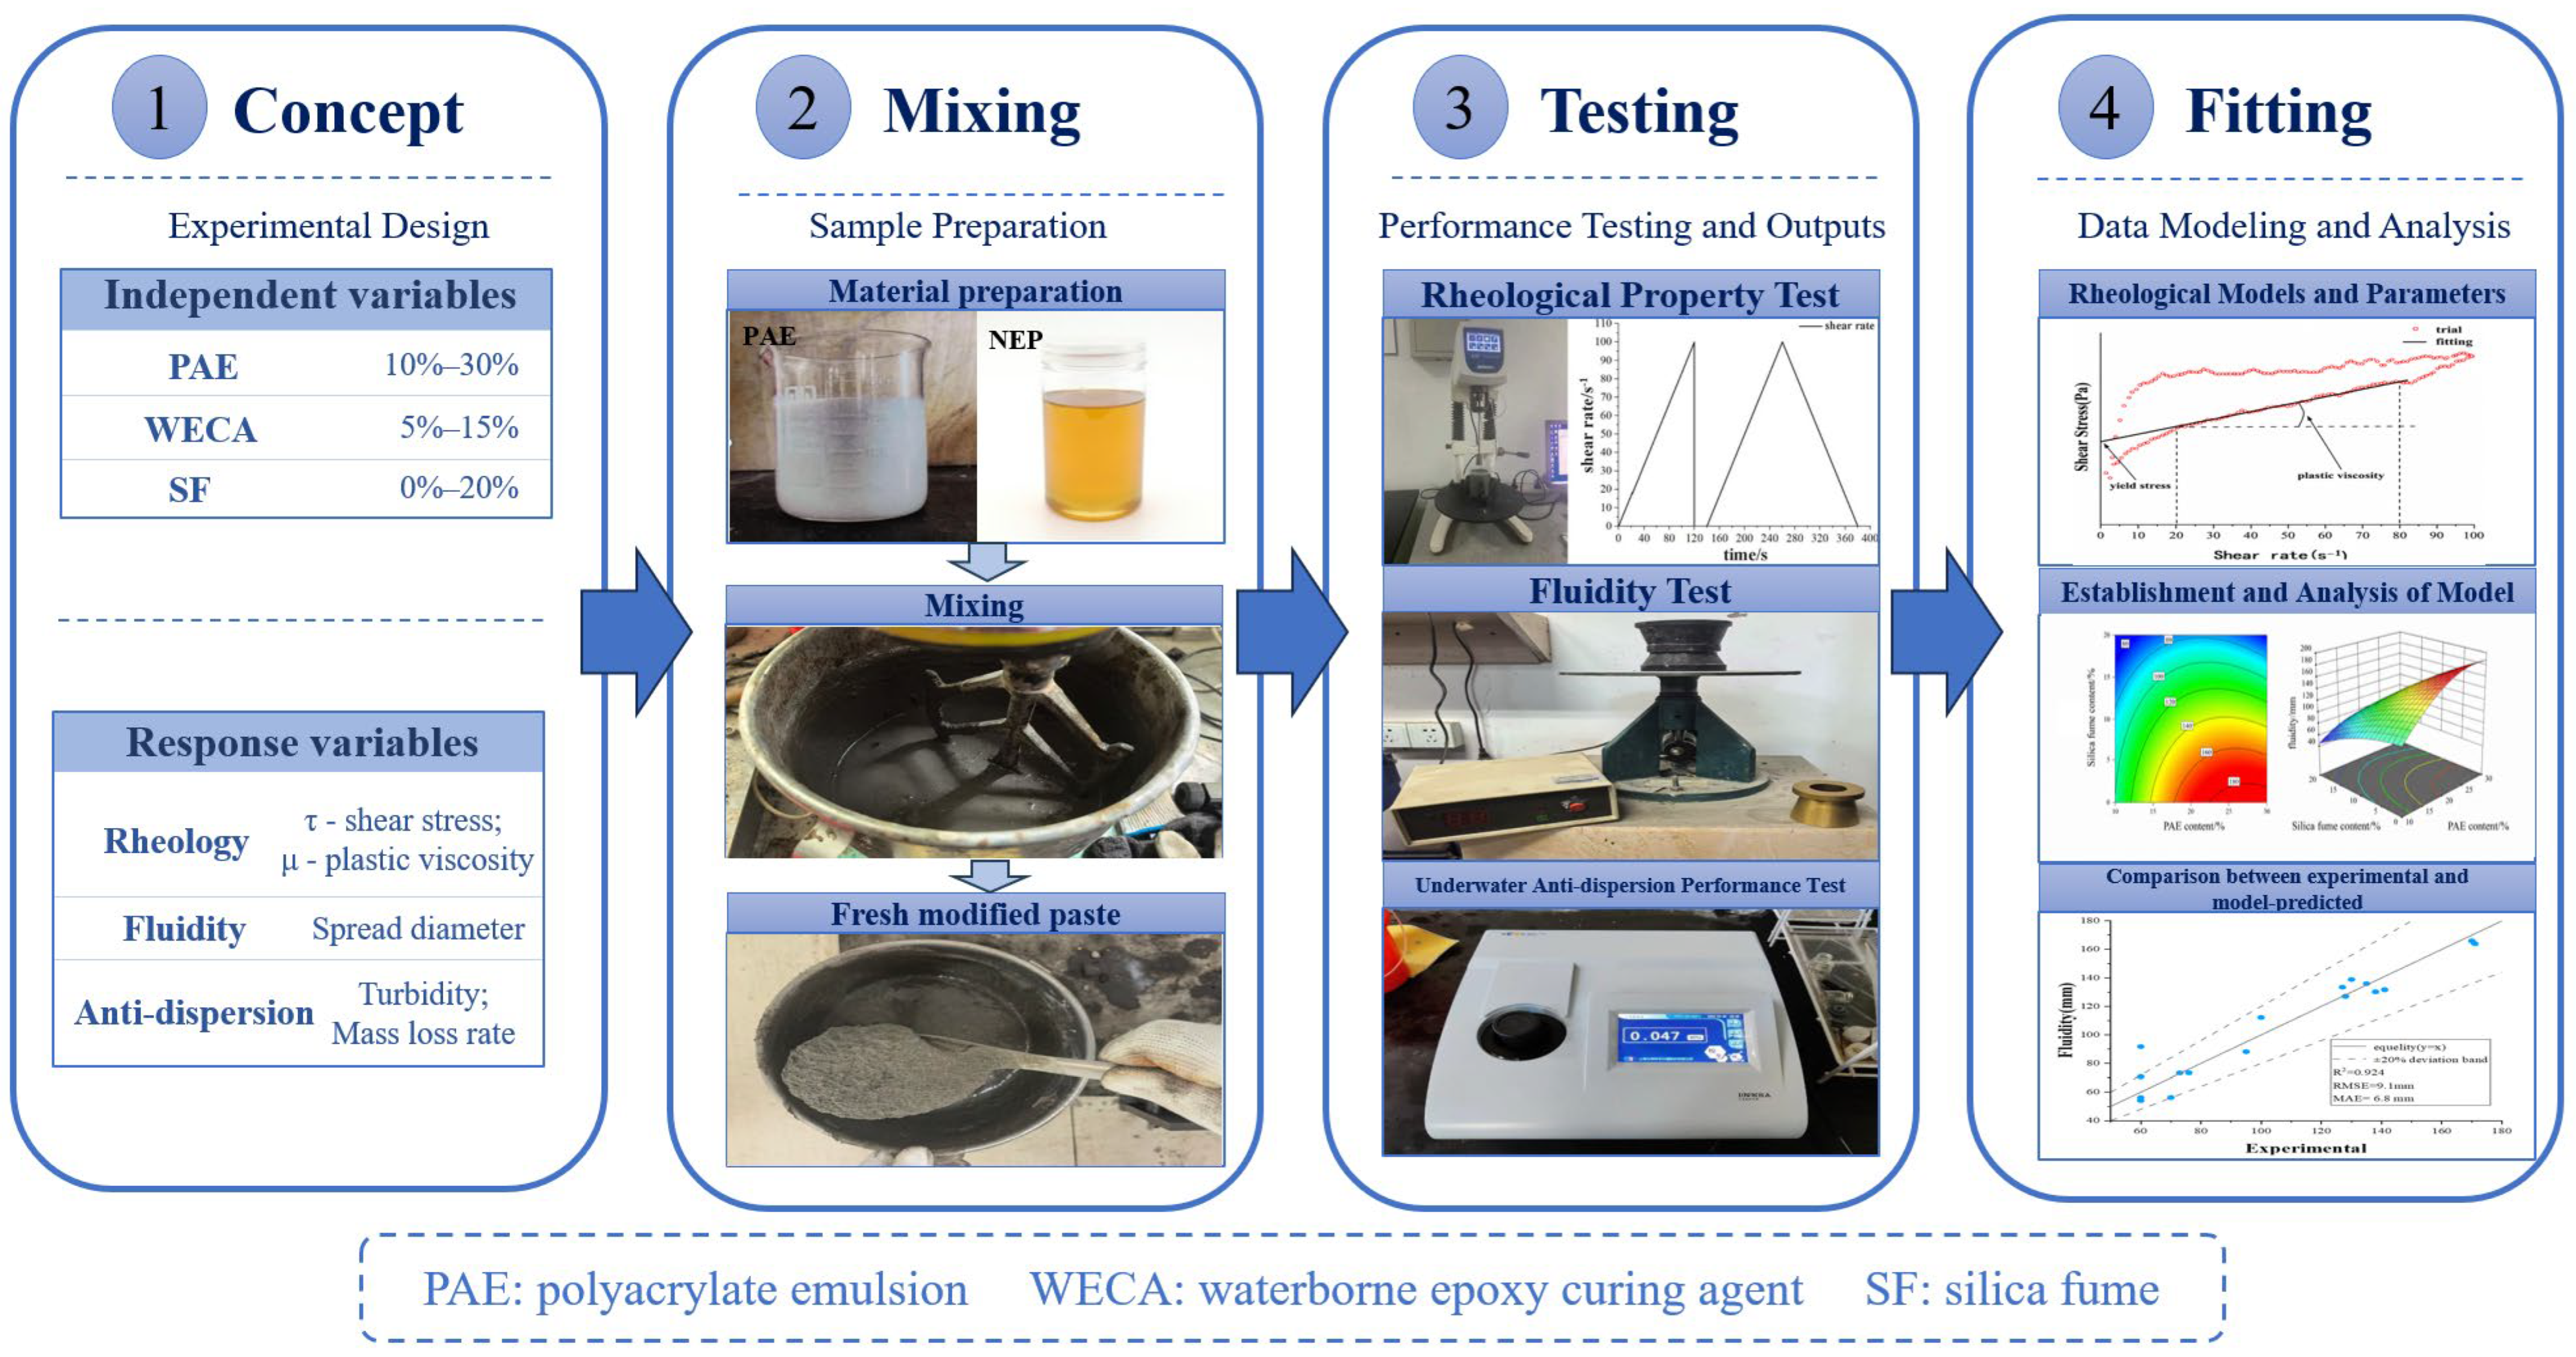
For a more intuitive presentation of the experimental procedure, the Schematic Illustration of the Experimental Workflow is shown in Figure 2.
Figure 2.
Schematic Illustration of the Experimental Workflow.
3. Results
3.1. Rheological Models and Parameters
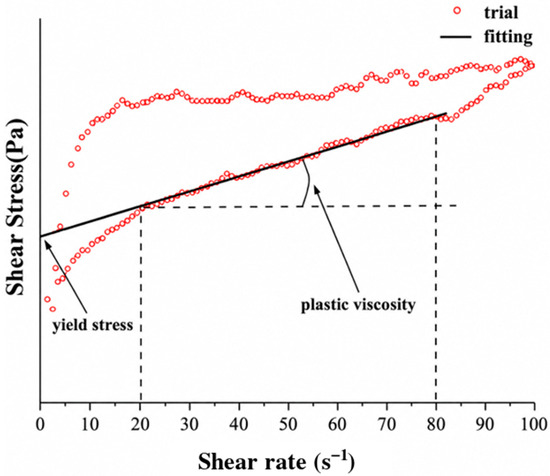
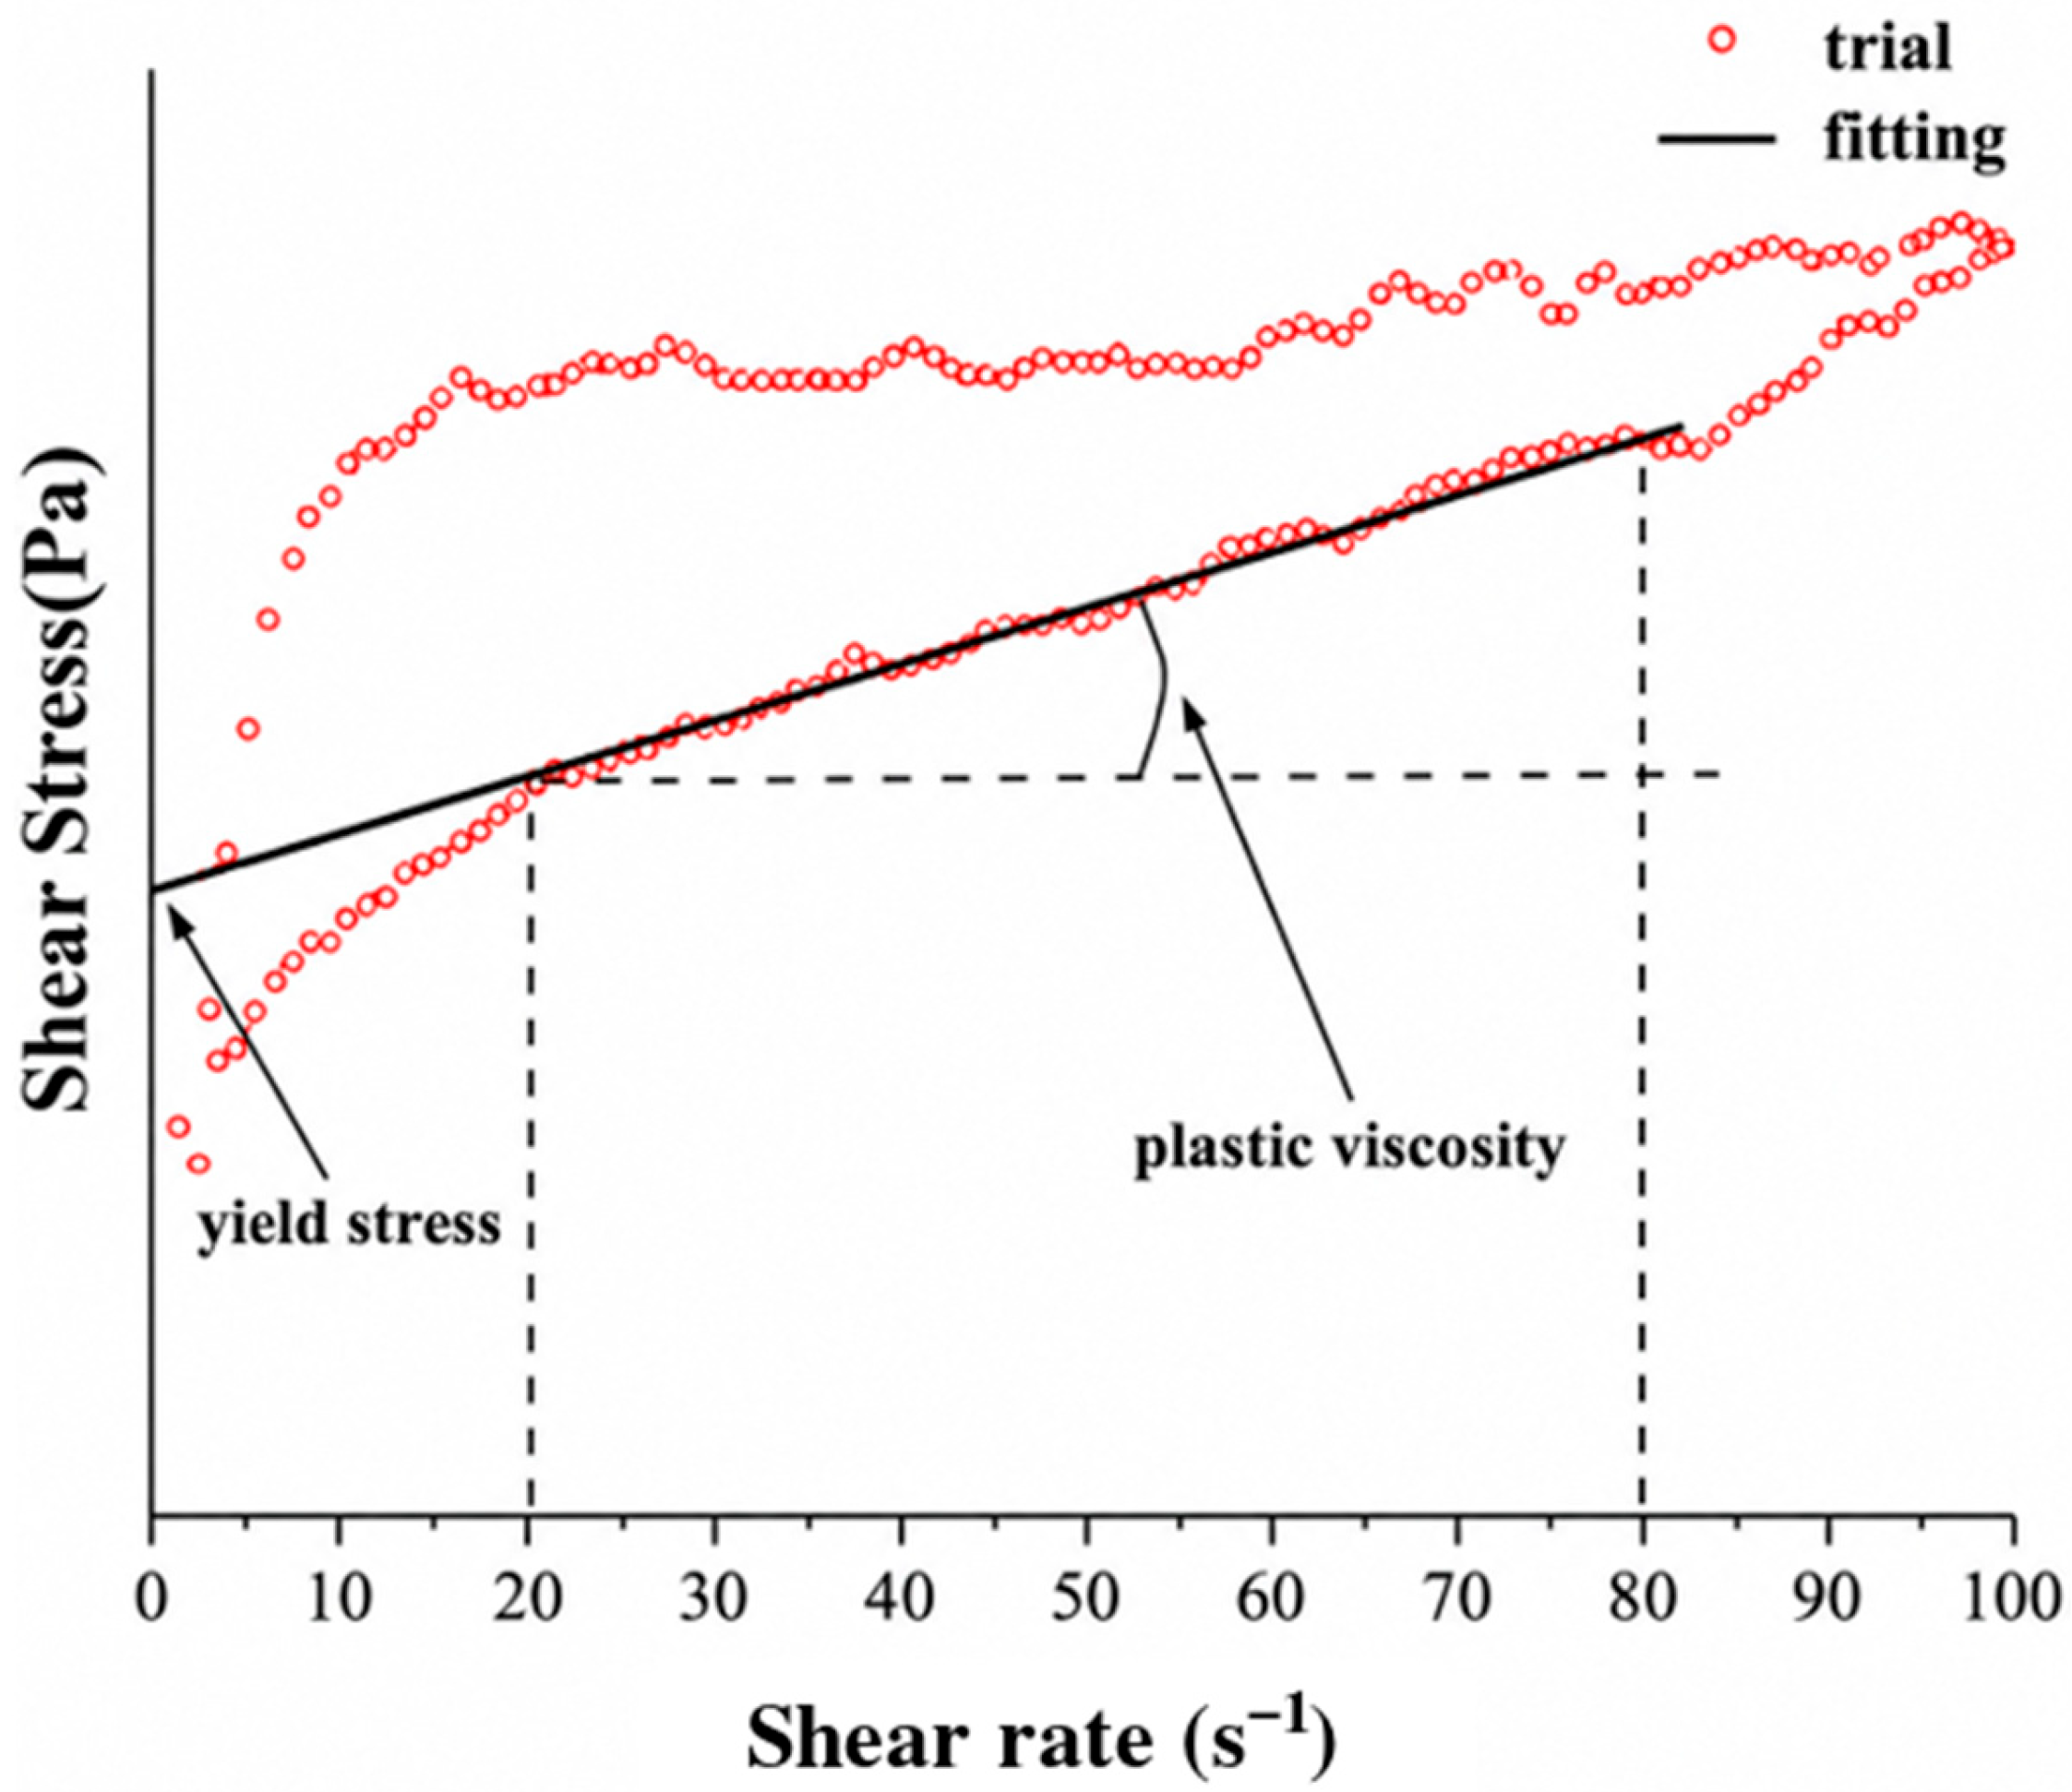
The rheological behavior of cementitious pastes is commonly described using the Bingham and Herschel–Bulkley models. The Bingham model characterizes the material in terms of yield stress and plastic viscosity: yield stress represents the critical stress required to initiate paste flow, whereas plastic viscosity reflects the resistance to flow after yielding. The Herschel–Bulkley model additionally introduces a flow behavior index to describe nonlinear shear-thinning or shear-thickening behavior. Because the descending branches of the flow curves obtained in this study were approximately linear within the selected shear-rate range, the Bingham model was adopted to determine the yield stress and plastic viscosity.
Based on the research results of Huang et al. [25], the descending segment of the hysteresis loop with gentle and stable characteristics was selected, and data within the shear rate range of 80 s−1 to 20 s−1 were adopted for fitting using the Bingham model, as shown in Figure 3. The correlation coefficient R2 for most groups was greater than 0.98 during fitting, indicating that the Bingham model exhibits excellent fitting performance.
Figure 3.
Rheological parameter measurement diagram.
The Bingham-model fitting results, together with the corresponding measured fluidity and turbidity values for the 17 Box–Behnken design runs, are summarized in Table 5.
Table 5.
Measured rheological parameters and fresh-state responses of the 17 Box–Behnken design runs.
Table 5 summarizes the measured rheological parameters, fluidity, and turbidity of the 17 Box–Behnken design runs. Within the investigated composition range, fluidity varied from 60 to 171 mm, while turbidity ranged from 155 to 639 NTU, indicating substantial variation in the fresh-state responses. PCP13-PCP17 were replicate runs at the design center and were used to estimate the pure experimental error. These results are presented only as a descriptive overview; the linear, quadratic, and interaction effects of PAE, NEP, and silica fume are evaluated using the complete experimental matrix through regression and ANOVA in Section 3.2 and Section 3.3.
3.2. Establishment and Analysis of Fluidity Model
Response surface fitting was further performed on the response values of each experimental scheme in Table 5. The significance test and analysis of variance results for the fitted model equation with respect to the variables x1 (PAE), x2 (NEP), x3 (silica fume) are presented in Table 6.
Table 6.
Analysis of Variance Results for Fluidity Regression Model.
At α = 0.05, the full quadratic model was statistically significant (F = 119.43, p < 0.0001), whereas the lack of fit was not significant (p = 0.8366). All linear, interaction, and quadratic terms were statistically significant and were therefore retained in the model. The fitted second-order polynomial equation is expressed as follows in Equation (1):
where Yfluidity is the predicted fluidity, x1 is the PAE content, x2 is the NEP content, and x3 is the silica fume content.
The fitted model exhibited a high coefficient of determination (R2 = 0.9935) and an adequate precision of 30.5261, indicating satisfactory agreement between the predicted and experimental fluidity values. The ANOVA results showed that the linear, quadratic, and two-factor interaction terms were statistically significant within the investigated design space.
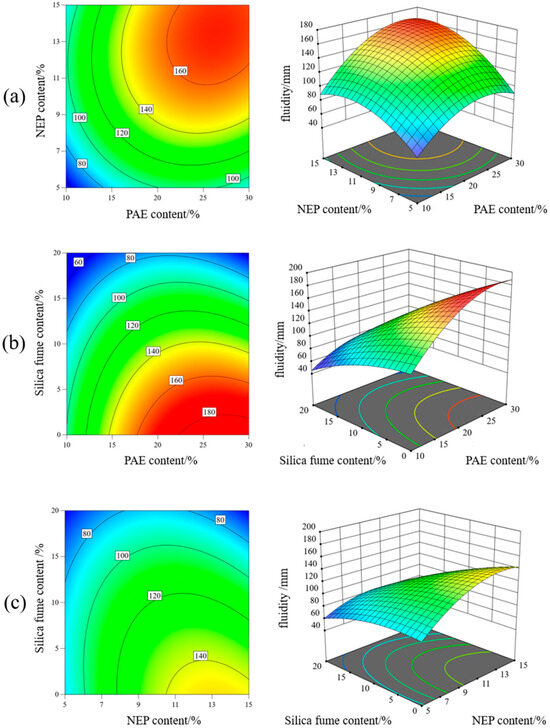
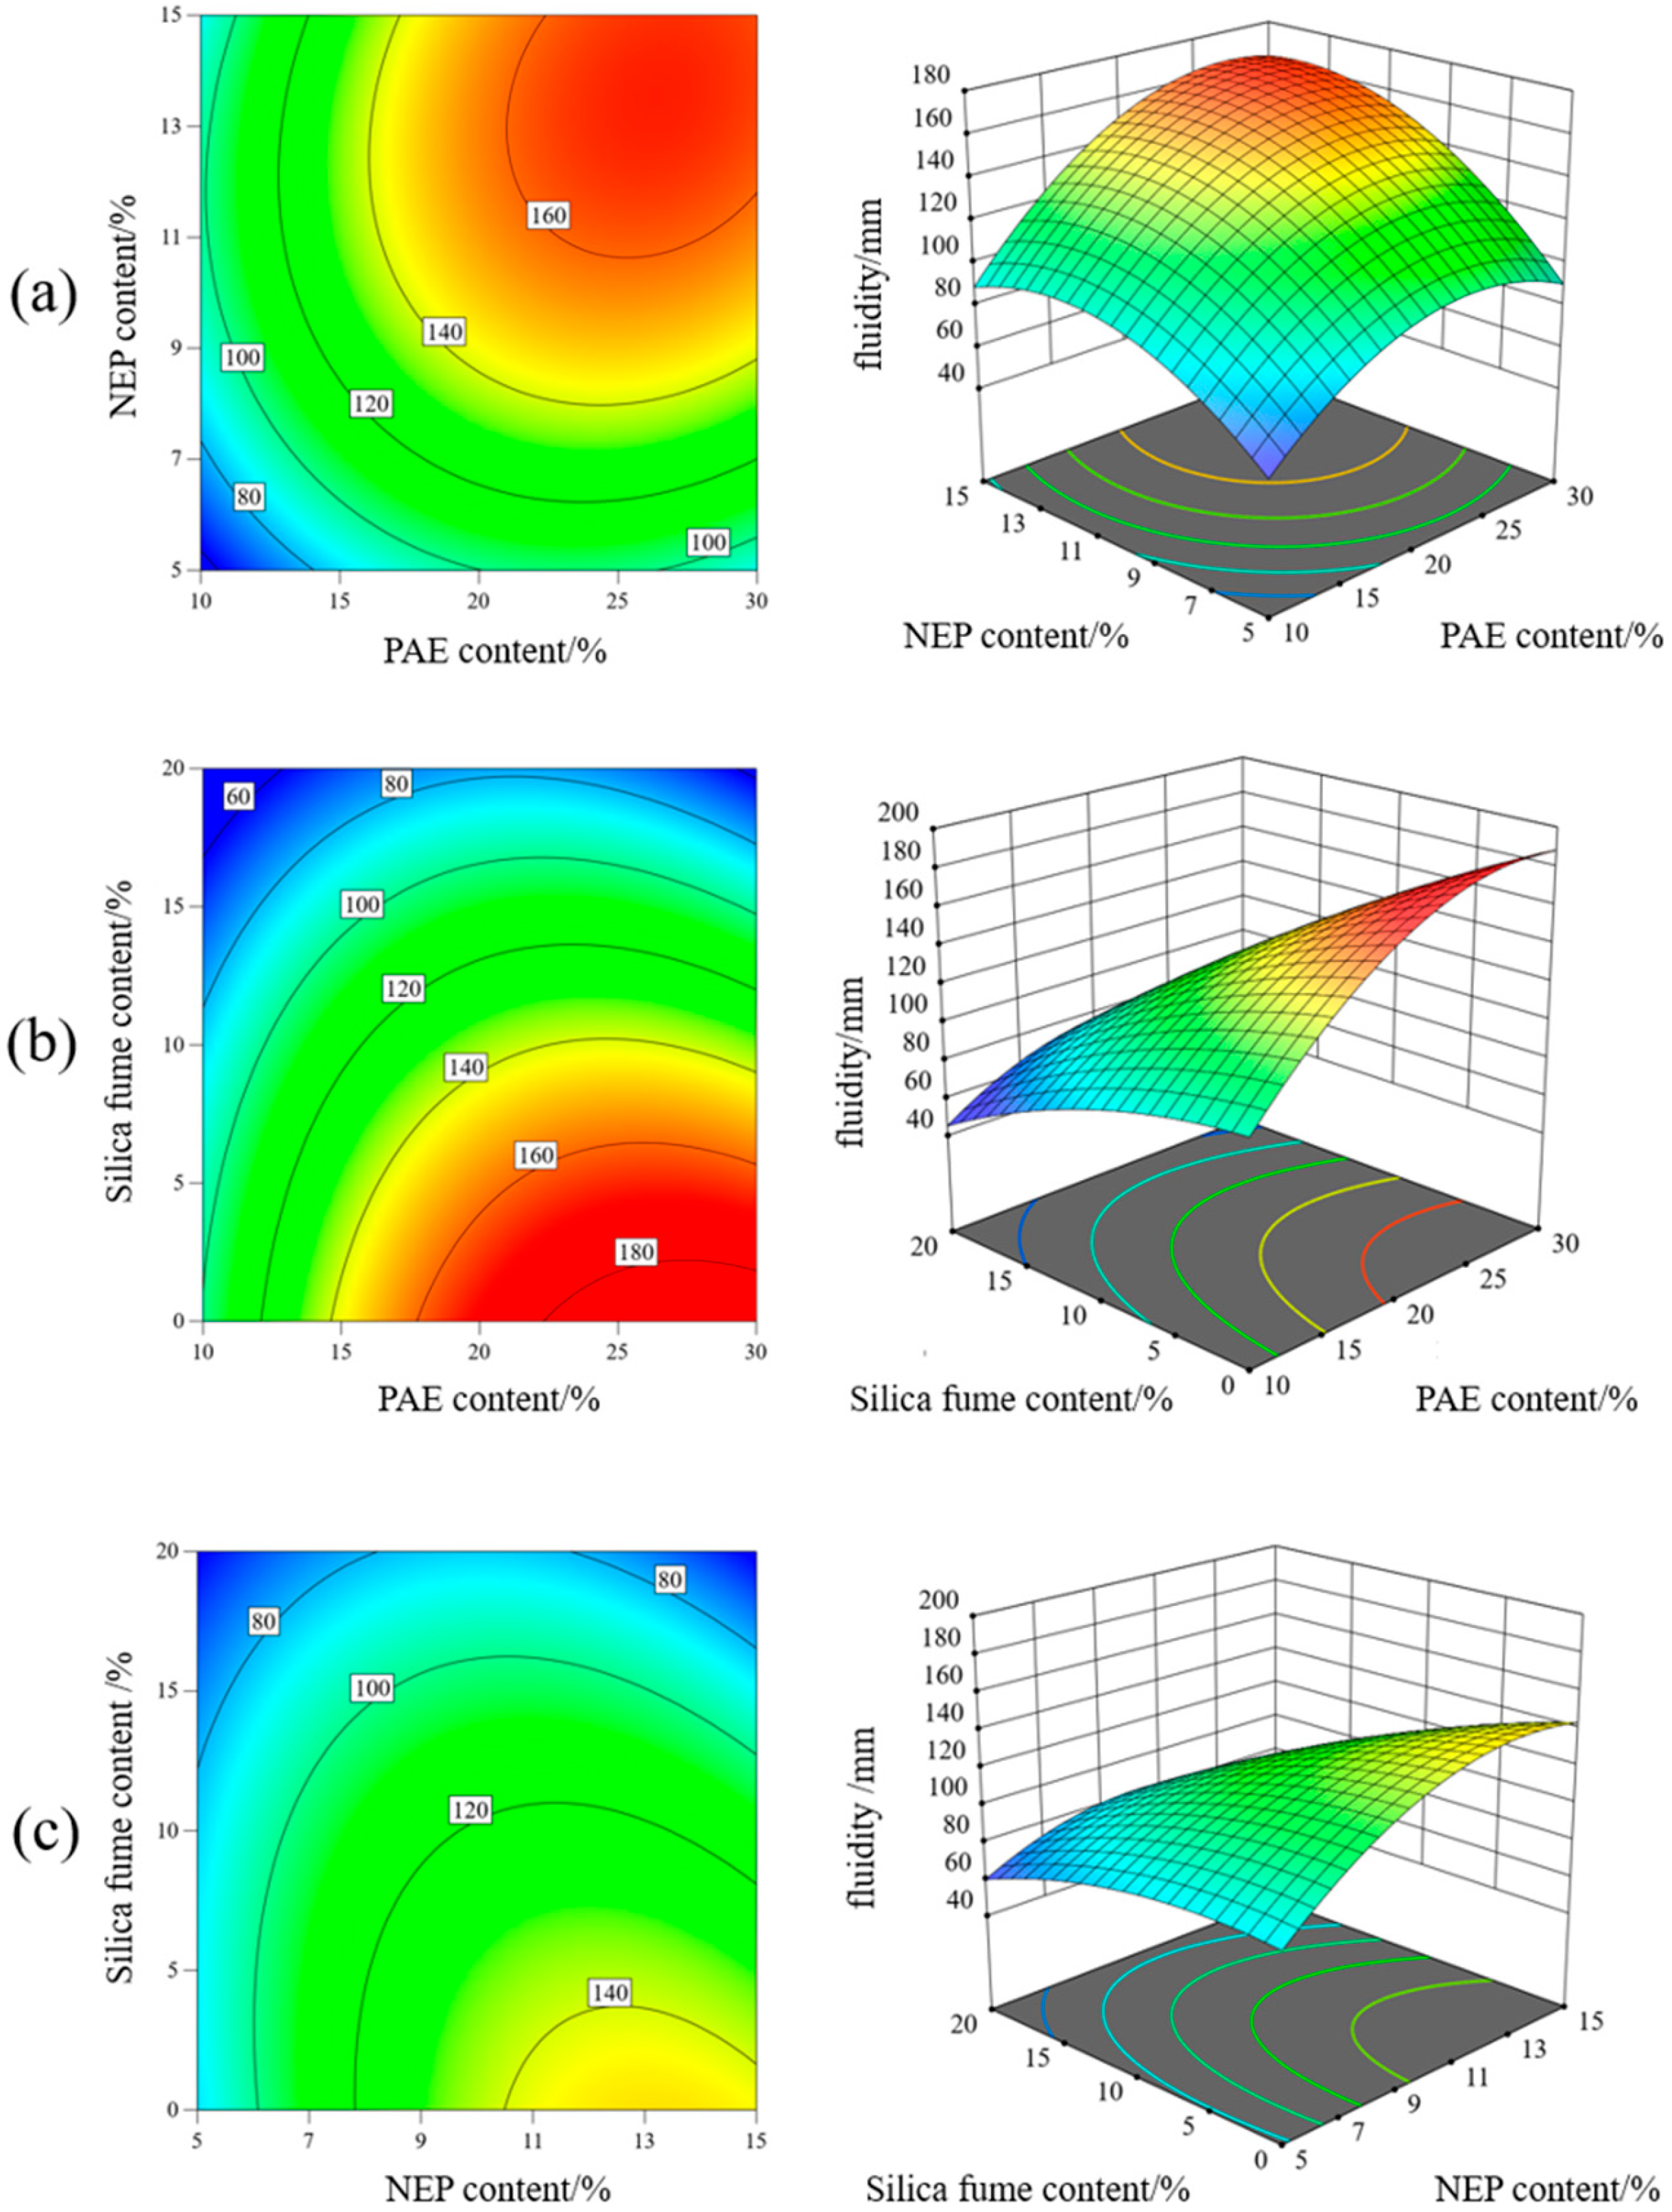
The statistically significant interaction effects identified by ANOVA were further visualized using response-surface plots. For each plot, the third factor was fixed at its value in the multi-response numerical optimum reported in Section 3.4: 4.95% silica fume in Figure 4a, 13.69% NEP in Figure 4b, and 15.54% PAE in Figure 4c. These values were not used in model fitting; they were selected only to display two-dimensional slices of the fitted response surface near the candidate optimum.
Figure 4.
Response surface plots of fluidity: (a) effect of PAE and NEP on fluidity at fixed silica fume content = 4.95%; (b) effect of PAE and silica fume on fluidity at fixed NEP content = 13.69%; (c) effect of NEP and silica fume on fluidity at fixed PAE content = 15.54%.
As shown in Figure 4, increasing the PAE and NEP dosages generally improved fluidity, although their marginal contributions diminished at higher dosages, whereas increasing the silica fume dosage reduced fluidity. The significant PAE-NEP, PAE–silica-fume, and NEP–silica-fume interactions indicate that the effect of each component depends on the dosages of the other components. The three modifying components should therefore be considered jointly when selecting candidate mixture proportions.
The improvement in fluidity associated with PAE may be related to polymer adsorption and surfactant-assisted particle dispersion, which help retain free water and reduce flow resistance [26,27]. NEP may also facilitate paste flow by reducing interparticle friction as a dispersed liquid phase [28,29,30,31]. By contrast, the high specific surface area of silica fume increases water demand and strengthens the particle network, thereby increasing flow resistance [32]. These interpretations are consistent with the observed macroscopic trends but require direct microstructural and chemical characterization for further verification.
3.3. Establishment and Analysis of Underwater Anti-Dispersion Performance Model
The turbidity data from all 17 Box–Behnken design runs were fitted using a second-order polynomial model. The ANOVA results for the effects of x1 (PAE), x2 (NEP), and x3 (silica fume) are presented in Table 7.
Table 7.
Analysis of Variance Results for Underwater Anti-dispersion Performance (Turbidity) Regression Model.
Following the model-reduction procedure described in Section 2.3, the non-significant terms x1x2, x2x3, and x22 were removed. The final reduced turbidity model was statistically significant (F = 35.77, p < 0.0001), with R2 = 0.9555 and adjusted R2 = 0.9288. The lack of fit was not significant (p = 0.0879), indicating that the reduced model adequately represented the turbidity response within the investigated design space. The retained terms included the linear effects of x1, x2, and x3; the x1x3 interaction; and the quadratic effects of x12 and x32. The resulting equation is expressed as follows:
where Yturbidity is the predicted turbidity (NTU), and x1, x2, and x3 are the actual dosages of PAE, NEP, and silica fume, respectively, expressed as percentages of the cement mass.
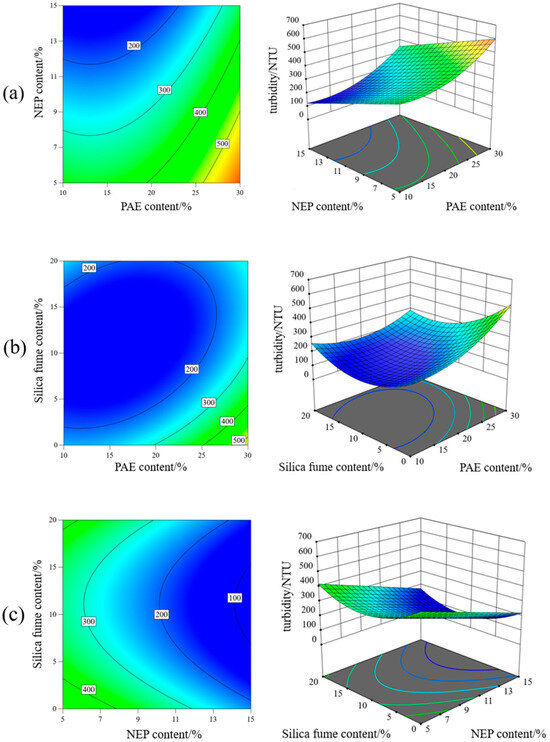
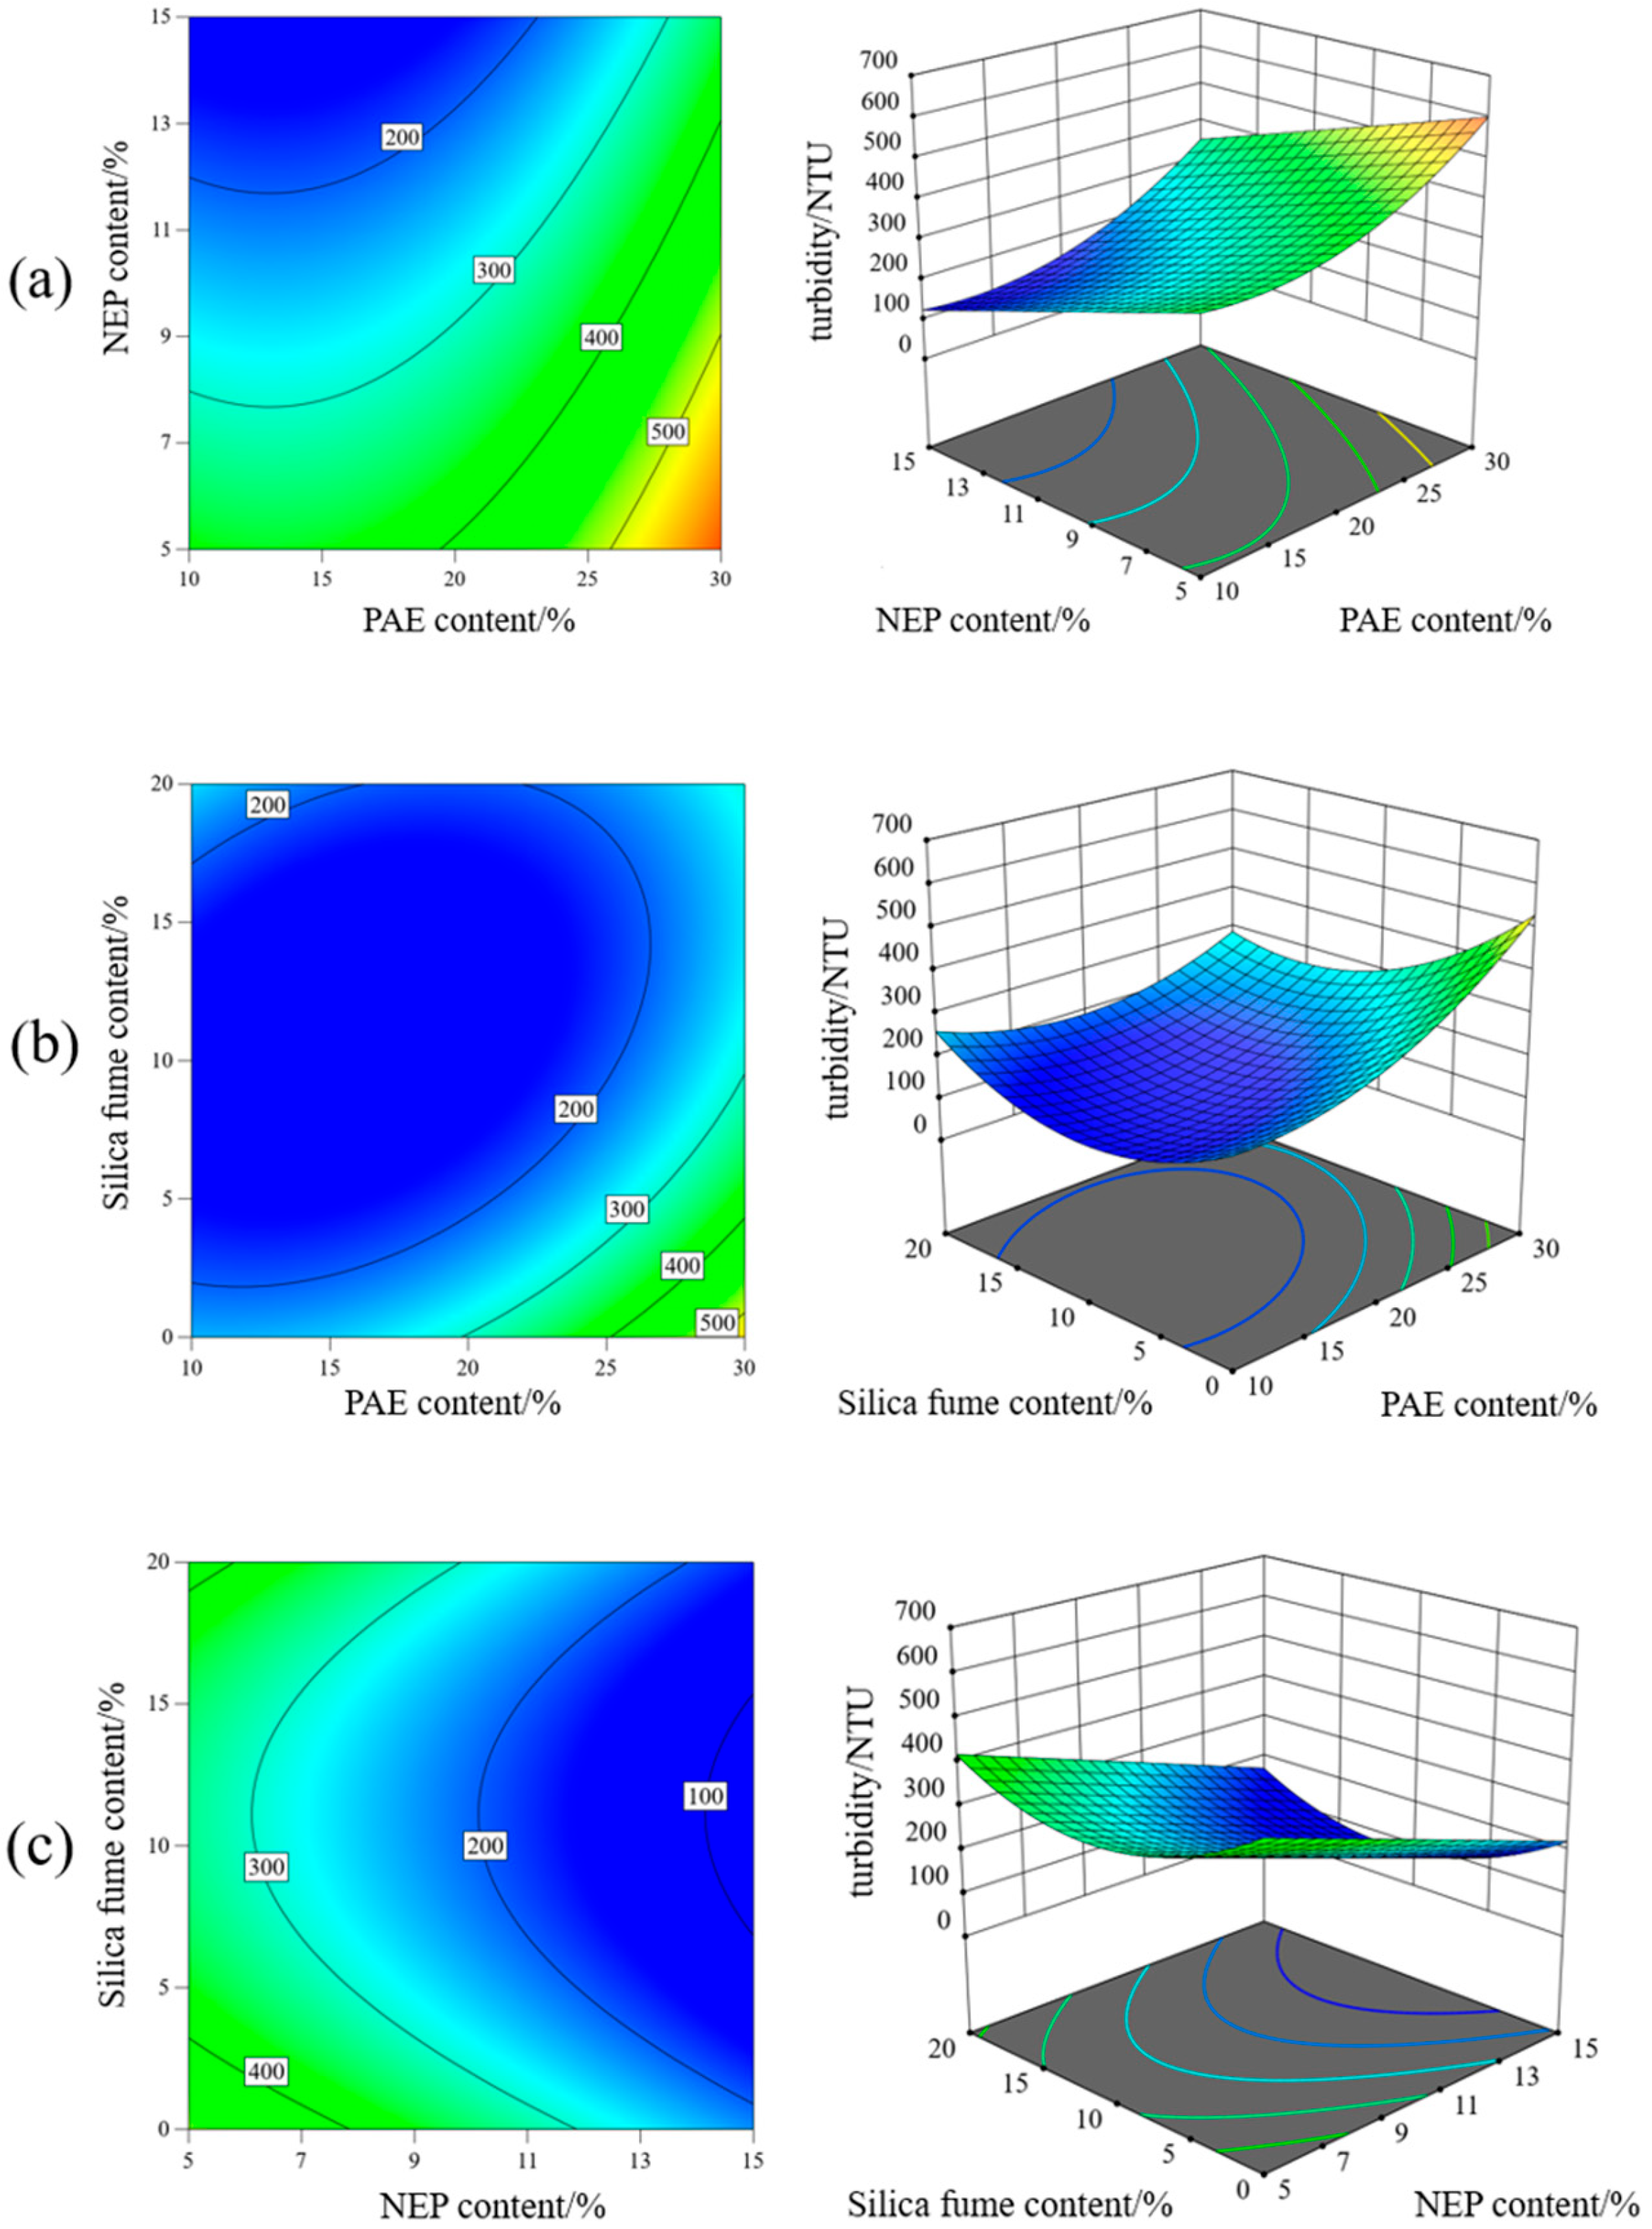
For each response-surface plot, the non-displayed factor was fixed at its value in the model-selected validation composition identified by the fresh-state multi-response numerical screening in Section 3.4: silica fume = 4.95% in Figure 5a, NEP = 13.69% in Figure 5b, and PAE = 15.54% in Figure 5c. These values are neither the Box–Behnken center-point levels nor additional data used for model fitting; they were used only to obtain two-dimensional slices of the fitted turbidity surface near the selected candidate composition.
Figure 5.
Response surface plots of turbidity: (a) effect of PAE and NEP on turbidity at fixed silica fume content = 4.95%; (b) effect of PAE and silica fume on turbidity at fixed NEP content = 13.69%; (c) effect of NEP and silica fume on turbidity at fixed PAE content = 15.54%.
As shown in Figure 5, NEP dosage was negatively associated with turbidity, whereas PAE and silica fume exhibited nonlinear and composition-dependent effects. Among the two-factor terms, only the PAE–silica-fume interaction (x1x3) was statistically significant. Accordingly, Figure 5b visualizes this significant interaction, whereas Figure 5a,c should be interpreted as two-factor response slices showing combined main-effect trends rather than statistically significant interactions. Within the investigated design space, lower turbidity was generally obtained at moderate PAE dosage, relatively high NEP dosage, and an intermediate silica-fume dosage.
3.4. Fresh-State Multi-Response Screening and Experimental Validation
Multi-response numerical screening was conducted exclusively using the two fresh-state responses investigated in this study, namely fluidity and turbidity. The purpose was to identify a candidate composition satisfying the predefined criteria of fluidity ≥ 120 mm and turbidity ≤ 300 NTU, rather than to determine a comprehensive engineering-optimal mixture incorporating hardened-state performance and durability. The numerical screening identified a model-selected validation composition containing 15.54% PAE, 13.69% NEP, and 4.95% silica fume. These values were obtained exclusively from the fluidity and turbidity models and therefore represent a candidate composition satisfying the investigated fresh-state criteria rather than a comprehensive engineering-optimal mixture.
To evaluate the local predictive accuracy of the models, an additional batch was prepared at the model-selected validation composition. This batch was independent of the 17 Box–Behnken design runs and was not used for model fitting. The measured fluidity and turbidity were 142 mm and 148 NTU, respectively, and the corresponding relative errors were 4.4% and 4.9%. These results demonstrate satisfactory local predictive accuracy for the two investigated fresh-state responses and confirm that the selected composition satisfies the predefined criteria for fluidity and turbidity.
4. Comprehensive Discussion
4.1. Quantitative Relationships Between Mesoscopic Rheological Parameters and Macroscopic Fresh-State Performance
The rheological properties of modified cement pastes provide insight into the internal structural state that governs their macroscopic working performance. In particular, yield stress and plastic viscosity are key rheological parameters for evaluating the flow resistance, deformation behavior, and structural stability of cement paste systems. Compared with conventional macroscopic workability tests alone, rheological characterization can provide a more comprehensive basis for understanding the working performance of modified cement pastes. However, the direct use of rheometers on construction sites remains limited because of their high equipment cost, strict testing conditions, and demanding operational requirements. Therefore, establishing a quantitative relationship between mesoscopic rheological properties and macroscopic working performance is of practical significance. Such a relationship enables rheological parameters to be estimated through simple workability tests on site and provides a basis for targeted adjustment of the rheological characteristics of modified cement pastes to meet practical construction requirements.
Previous studies have established several representative relationships between rheological parameters and conventional workability indices. Hu et al. developed and validated relationships between slump and yield stress for soft-to-fluid concrete, while also specifying the applicable range of plastic viscosity [33]. Roussel further examined the correlation between yield stress and slump through numerical simulations and comparisons among concrete rheometers [34]. Roussel et al. subsequently derived a relationship for estimating the yield stress of cement-based materials from cone-spread geometry [35]. Ferraris and de Larrard proposed a modified slump test and piecewise expressions relating plastic viscosity to slump and slumping time over different slump ranges [36]. These representative relationships are summarized in Table 8.
Table 8.
Mathematical Equations for the Relationship Between Rheological Parameters and Fluidity.
The models summarized above mainly correlate rheological parameters with the slump or spread of conventional cementitious materials. In contrast, the present study incorporates paste density together with yield stress and plastic viscosity and develops response-specific empirical models for PAE-NEP–silica-fume-modified non-dispersible underwater pastes. Specifically, fluidity is correlated with plastic viscosity and density, whereas turbidity and mass loss rate are correlated with yield stress and plastic viscosity. Therefore, the contribution of this study lies in extending conventional flowability-oriented correlations to the parallel quantitative assessment of fluidity and underwater anti-dispersion performance within the investigated mixture range.
The results of rheological parameters, density, fluidity and underwater anti-dispersion performance of modified cement pastes in each group are shown in Table 9.
Table 9.
Results of Rheological Parameters, Density and Working Performance of Cement Pastes in Experimental Groups.
Multiple linear regression analysis was performed on the relevant parameters, and the relationship models between mesoscopic rheological parameters and macroscopic working performance were obtained as shown in Equations (3)–(5).
where τ0 is the yield stress, μ is the plastic viscosity, and ρ is the material density.
The reliability of the fitted multiple linear regression models was evaluated by examining two key assumptions: the absence of significant autocorrelation in the residuals and the absence of severe multicollinearity among the independent variables. Residual autocorrelation was assessed using the Durbin–Watson statistic, for which values between 1.5 and 2.5 generally indicate no evident autocorrelation. Multicollinearity was evaluated using the variance inflation factor (VIF), with values below 5.0 commonly regarded as acceptable for regression analysis.
The diagnostic parameters of the fitted multiple linear regression models are listed in Table 10. The Durbin–Watson statistics for Equations (3)–(5) were 2.566, 2.278, and 1.602, respectively, while the corresponding VIF values were 1.031, 1.010, and 1.010. These results indicate that the regression models generally satisfy the assumptions required for multiple linear regression, with no severe multicollinearity observed among the explanatory variables. In addition, the coefficients of determination, R2, for the three models were 0.924, 0.914, and 0.889, respectively, suggesting good agreement between the predicted and experimental values. Therefore, the established functional models linking rheological parameters with fluidity and underwater anti-dispersion performance show good reliability and predictive capability.
Table 10.
Parameters of Multiple Linear Regression Analysis Models.
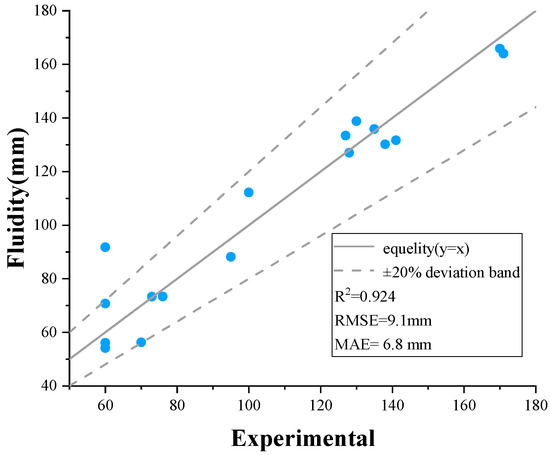
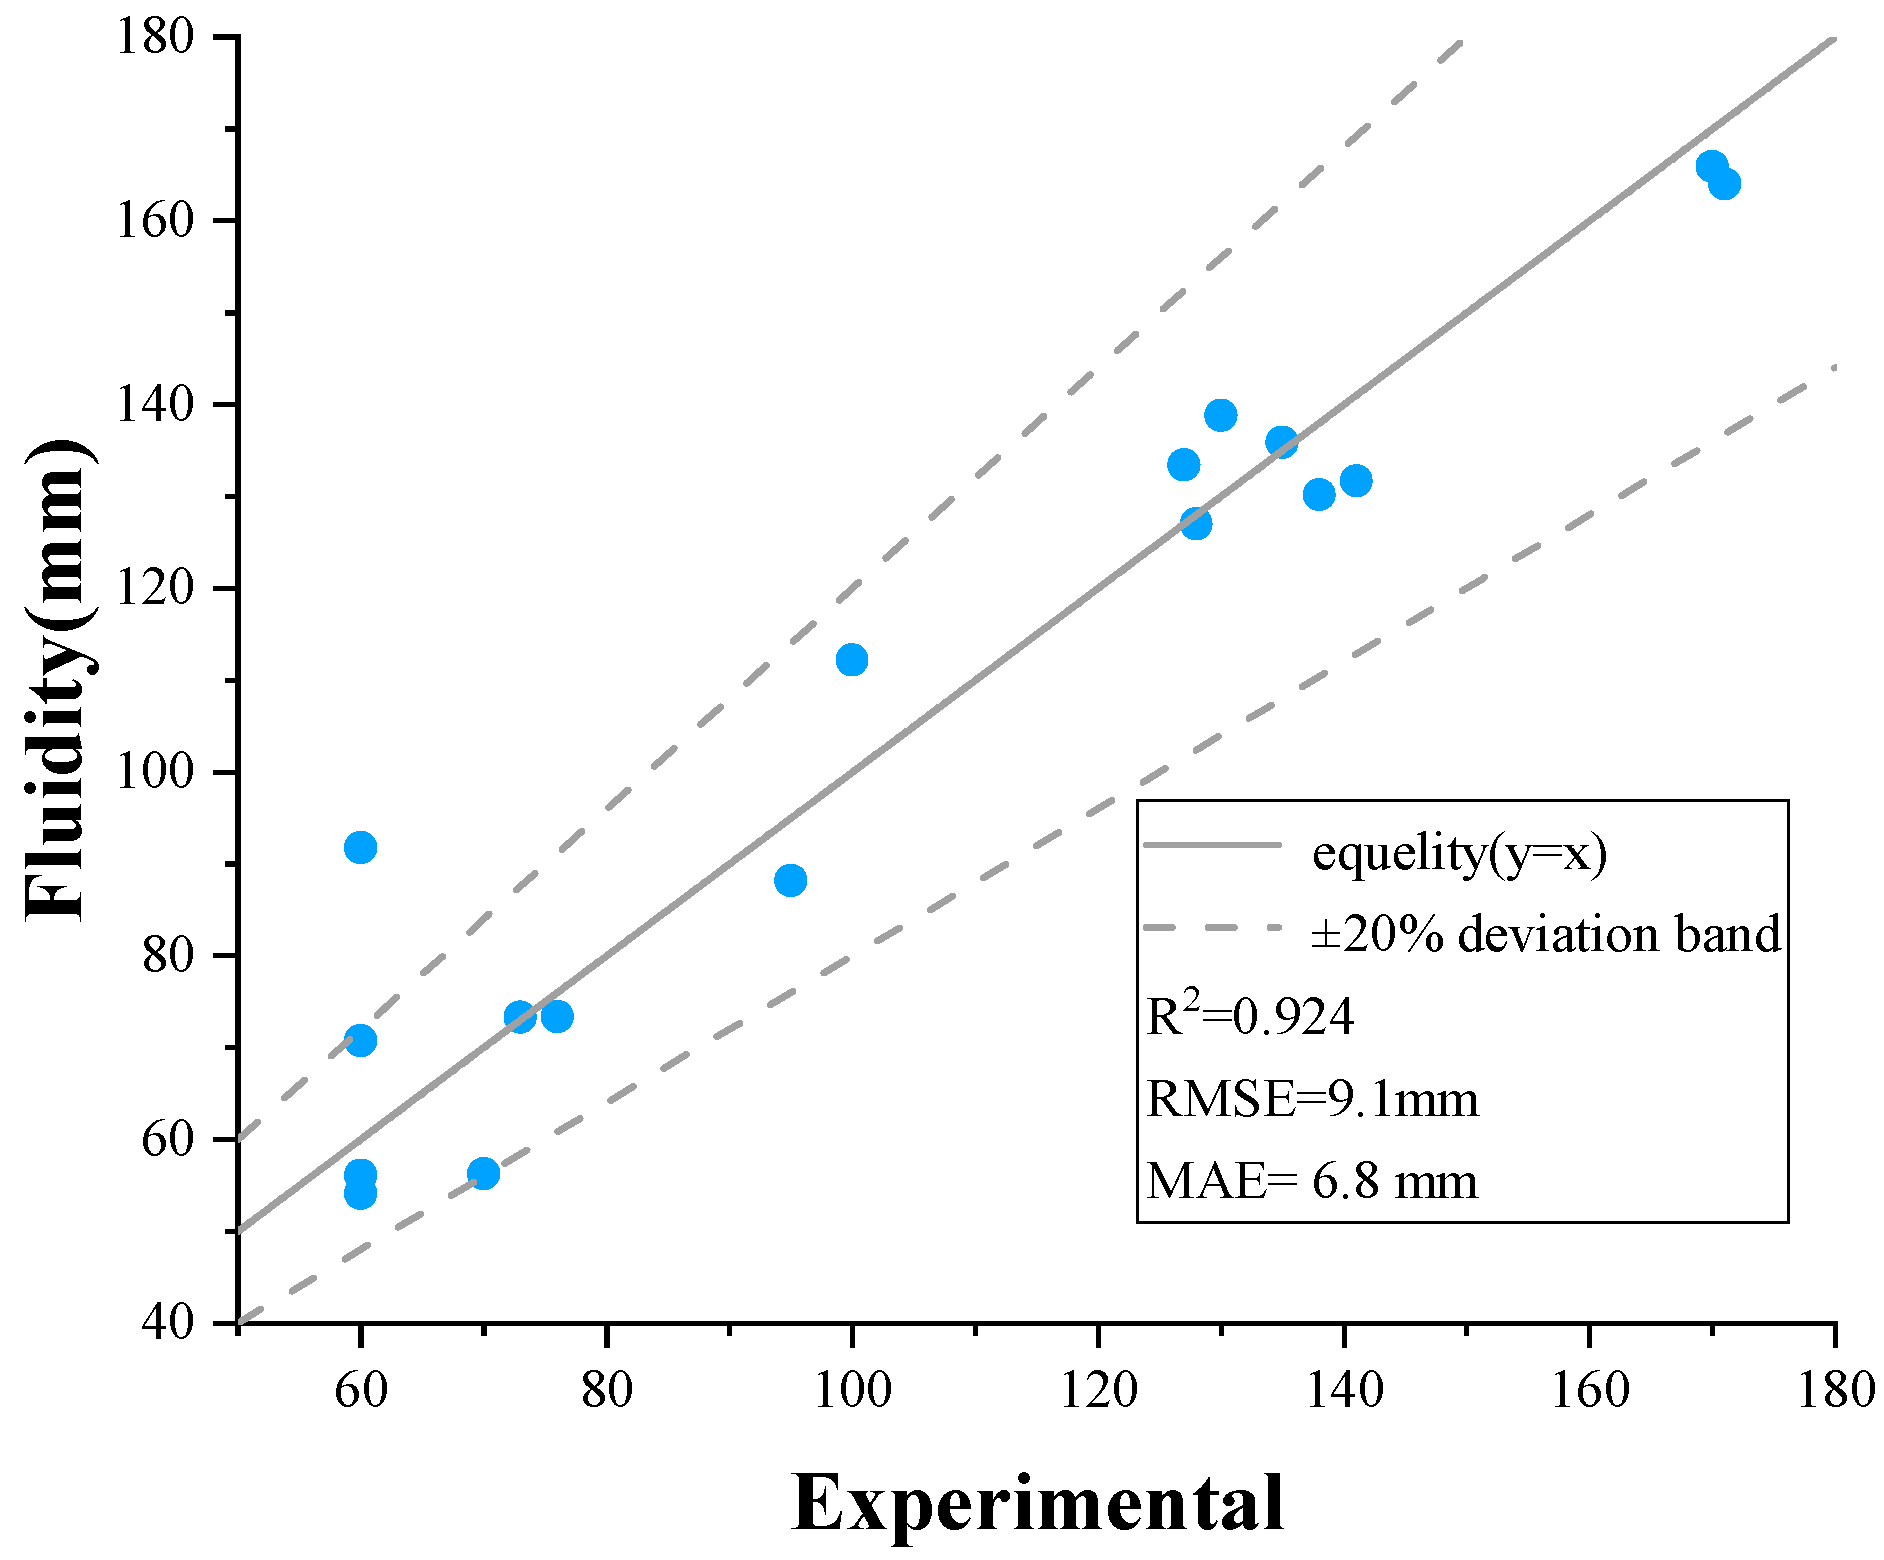
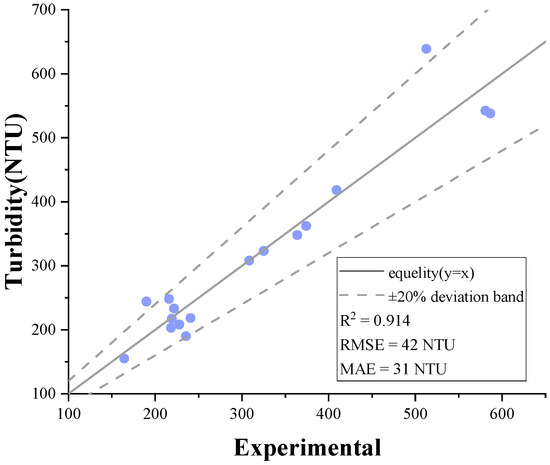
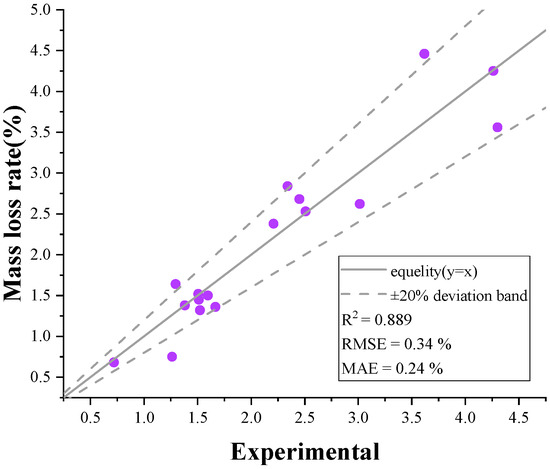
To visually evaluate the predictive capability of the established multiple linear regression models, Figure 6, Figure 7 and Figure 8 compare the model-predicted and experimental values of fluidity, turbidity, and mass loss rate, respectively. The solid line represents perfect agreement between the predicted and experimental values (y = x), whereas the dashed lines indicate the ±20% deviation band. Overall, the data points for all three performance indicators are primarily distributed near the perfect-agreement line, with most observations falling within the ±20% deviation band. This result indicates that the established models adequately reproduce the variations in the macroscopic working performance of the modified cement pastes.
Figure 6.
Comparison between experimental and model-predictedfluidity.
Figure 7.
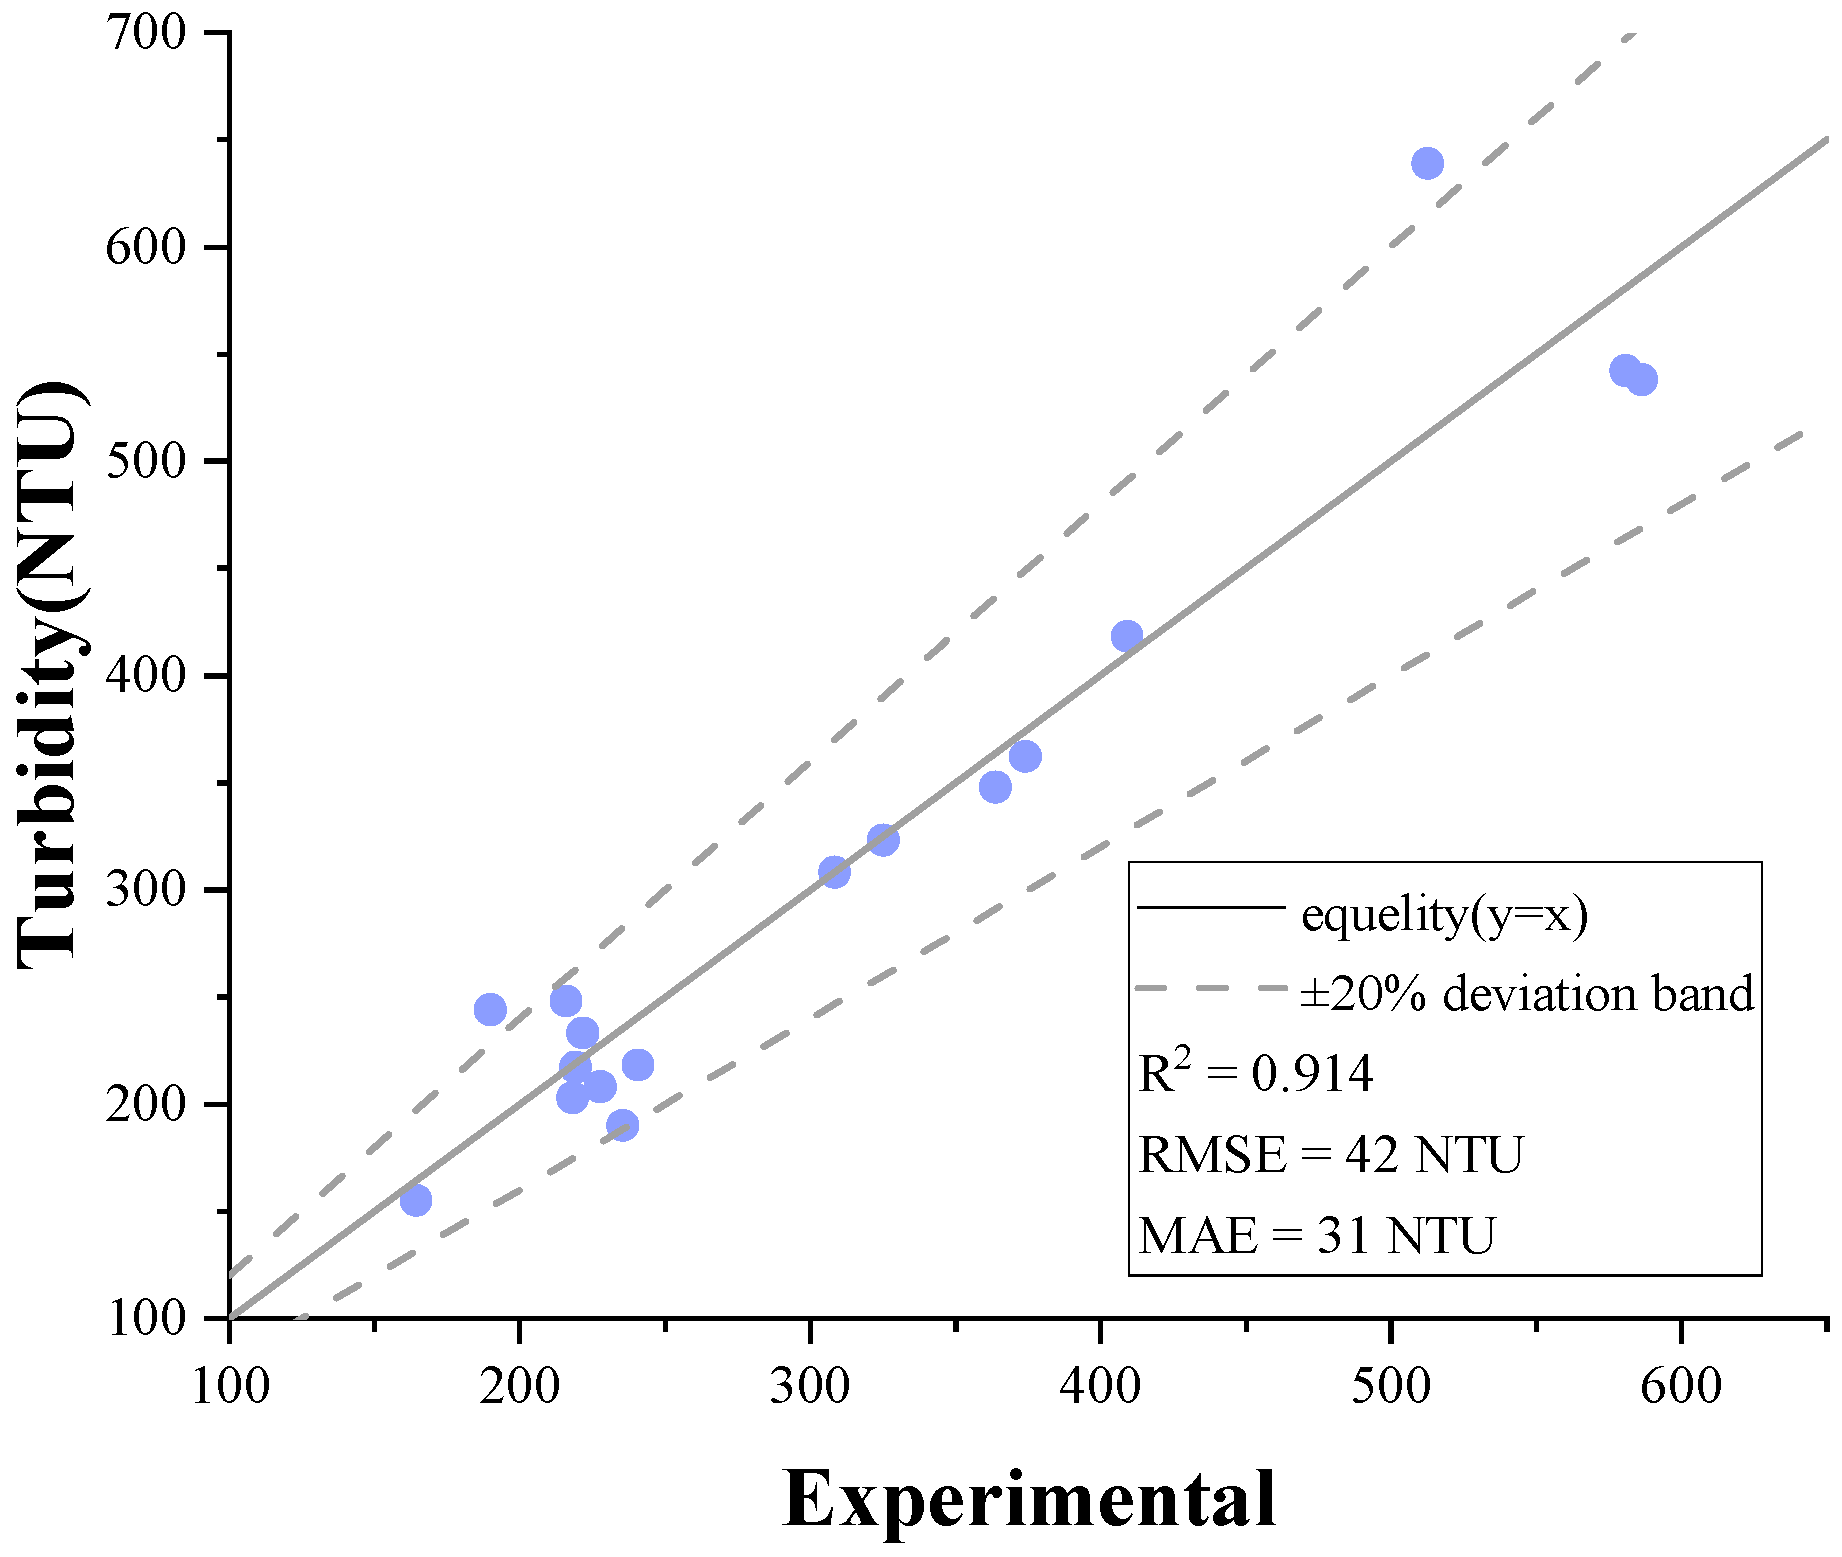
Comparison between experimental and model-predicted turbidity.
Figure 8.
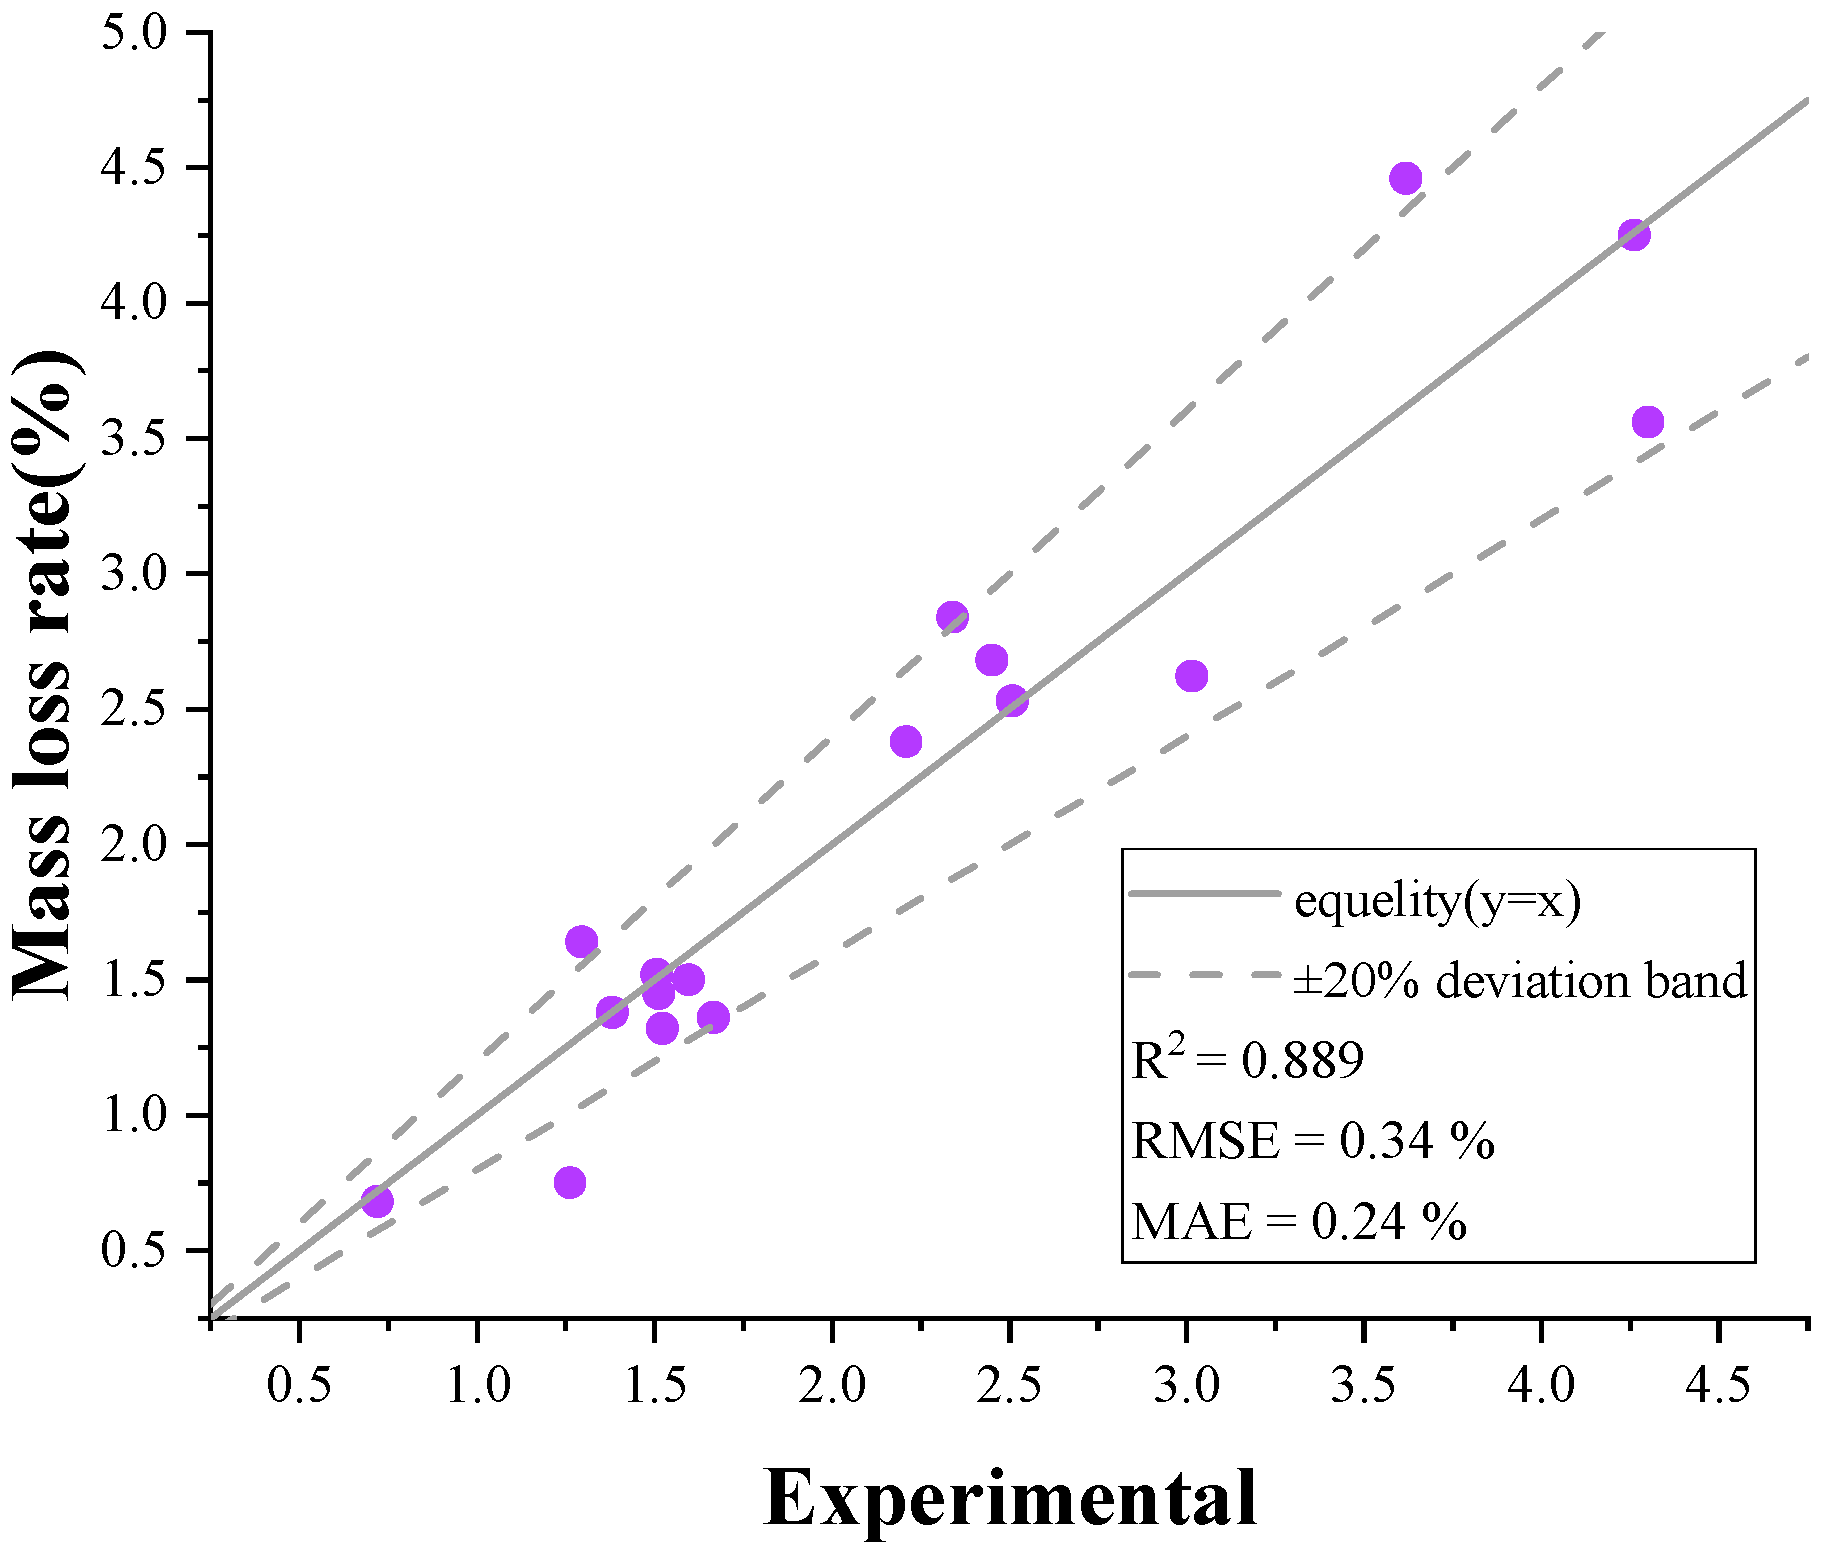
Comparison between experimental and model-predicted mass loss rate.
As shown in Figure 6, the predicted fluidity values agree closely with the experimental results, with the data points generally concentrated around the perfect-agreement line. The model yields an R2 value of 0.924, an RMSE value of 9.1 mm, and an MAE value of 6.8 mm, representing the highest predictive accuracy among the three models. These results indicate that plastic viscosity and material density effectively characterize the flowability of the modified cement pastes.
Figure 7 also demonstrates good agreement between the predicted and experimental turbidity values. The turbidity model provides an R2 value of 0.914, an RMSE value of 42 NTU, and an MAE value of 31 NTU. Although the scatter increases slightly in the high-turbidity region, most observations remain within the ±20% deviation band, confirming that the model can effectively distinguish differences in the underwater anti-dispersion performance of the pastes.
By comparison, the mass loss rate data in Figure 8 exhibit relatively greater scatter, with several high-response observations approaching or exceeding the ±20% deviation limits. Nevertheless, the model achieves an R2 value of 0.889, an RMSE value of 0.34%, and an MAE value of 0.24%, indicating that it reasonably captures the overall variation in mass loss rate. Its slightly lower predictive accuracy suggests that mass loss rate may be influenced not only by the rheological state of the paste but also by the underwater placement process, particle detachment, and local variations in the flocculated structure.
Taken together, Figure 6, Figure 7 and Figure 8 demonstrate that all three models possess satisfactory fitting and predictive capabilities. The fluidity model exhibits the highest agreement, followed by the turbidity model, whereas the mass loss rate model shows relatively greater scatter but remains acceptable. These findings confirm the feasibility of quantitatively predicting macroscopic working performance using mesoscopic rheological parameters and material density and provide a reliable basis for further evaluating the relative contributions of these parameters to flowability and underwater anti-dispersion performance.
Analysis of the multiple linear regression equations shows that, as indicated by Equation (3), the fluidity of the modified cement pastes is mainly associated with plastic viscosity and material density, whereas the contribution of yield stress is not statistically evident. When paste density remains constant, each 1.00 Pa·s increase in plastic viscosity corresponds to an 11.15 mm decrease in fluidity, indicating a pronounced negative correlation between plastic viscosity and paste fluidity. By contrast, material density shows a positive correlation with fluidity within the investigated range.
This relationship can be explained by the physical meaning of plastic viscosity. Plastic viscosity reflects the frictional resistance among solid particles and the viscous resistance of the liquid phase during paste flow. A higher plastic viscosity restricts the relative movement of particles and increases internal flow resistance, which is macroscopically reflected by reduced fluidity. The positive correlation between density and fluidity may be related to the denser particle packing structure of the paste. Under relatively stable particle gradation and water content, a more compact packing state may improve particle rearrangement during flow, thereby contributing to higher measured fluidity.
Equations (4) and (5) further indicate that the underwater anti-dispersion performance of the pastes is jointly affected by yield stress and plastic viscosity. However, these two rheological parameters influence turbidity and mass loss rate in different ways. Yield stress reflects the structural strength of the initial flocculation network in the paste. A higher yield stress generally indicates stronger interparticle bonding and improved resistance to external disturbance, which can restrict the migration and diffusion of cementitious particles in water. As a result, both turbidity and mass loss rate decrease, indicating improved underwater stability.
In contrast, plastic viscosity shows an adverse effect on underwater anti-dispersion performance within the fitted regression models. As plastic viscosity increases, turbidity and mass loss rate tend to increase, suggesting a reduction in underwater stability. A comparison of the regression coefficients shows that the absolute coefficients of plastic viscosity are greater than those of yield stress. This indicates that plastic viscosity plays a more dominant role in governing the underwater anti-dispersion performance of the pastes, whereas yield stress mainly serves as a secondary regulatory factor.
4.2. Engineering Implications and Limitations
The quantitative relationships established in this study link yield stress, plastic viscosity, and paste density with fluidity, turbidity, and mass loss rate, thereby providing a rheology-based basis for the preliminary proportioning of polymer-modified non-dispersible underwater cement pastes. For long-distance underwater grouting, these relationships can facilitate the screening of candidate mixtures that balance pumpability and resistance to underwater dispersion under static-water conditions, reduce the number of trial mixtures, and provide measurable indices for laboratory formulation and subsequent engineering-scale verification.
However, the mechanical properties and durability under flowing-water conditions were not evaluated in this study. Because no direct spectroscopic, thermal, or reaction-specific microscopic characterization was performed, any potential interaction between PAE and NEP remains a working hypothesis rather than a verified chemical mechanism. Further studies should address these limitations before the proposed mixture-design approach is applied in engineering practice.
5. Conclusions
This study systematically investigated the relationships between the dosages of PAE, NEP, and silica fume and the rheological parameters, fluidity, and underwater anti-dispersion performance of cement pastes within the investigated mixture ranges under static-water conditions. The main conclusions are as follows:
- (1)
- The Box–Behnken design and response surface analysis demonstrated that the effects of the three components were strongly coupled and nonlinear. PAE and NEP generally improved fluidity, whereas silica fume enhanced the stability of fresh-state behavior at the expense of fluidity. All three pairwise interactions had significant effects on fluidity, while underwater anti-dispersion performance was mainly governed by the beneficial effect of NEP together with the nonlinear effects of PAE and silica fume. Therefore, balancing fluidity and underwater stability requires coordinated multi-component proportioning.
- (2)
- The established empirical relationships showed that different macroscopic fresh-state responses were governed by different rheological parameters. Fluidity was primarily associated with plastic viscosity and paste density, whereas turbidity and mass loss rate were jointly influenced by yield stress and plastic viscosity. These response-specific relationships extend conventional rheology–flowability correlations to the characterization of underwater anti-dispersion performance and indicate that rheological parameters can serve as complementary indicators for preliminary mixture screening.
- (3)
- Multi-response screening and independent experimental validation demonstrated that the Box–Behnken design and response surface methodology could identify a candidate composition that simultaneously satisfied the predefined fluidity and turbidity requirements within the investigated design space. The selected composition is applicable to the investigated material system, dosage ranges, and static-water conditions; however, its placement performance under flowing-water conditions, hardened-state mechanical properties, and durability require further investigation.
Author Contributions
Conceptualization, H.W. and X.H.; Methodology, C.L.; Validation, X.H.; Formal analysis, A.C. and C.L.; Investigation, H.W., C.L. and J.G.; Resources, H.W. and X.H.; Data curation, H.W., C.L., X.H. and J.G.; Writing—original draft, H.W. and A.C.; Writing—review & editing, A.C., X.H. and J.G.; Visualization, A.C.; Supervision, A.C., C.L. and J.G.; Project administration, H.W., C.L. and J.G.; Funding acquisition, H.W. All authors have read and agreed to the published version of the manuscript.
Funding
This research was supported by the following funding: Research on Multi-Scale Coupling Mechanism and Construction Technology of Wet-Sprayed Mortar for PCCP (No. Yj426013); Key Technologies for High-Water-Pressure Tunnel Stability and Lining under Complex Hydrogeological Conditions, and for PCCP Pipeline Upgrading under Complex Environmental Conditions in the Guangdong Section of the Ring Beibu Gulf Water Resources Allocation Project (No. Hj422013).
Data Availability Statement
The original contributions presented in this study are included in the article. Further inquiries can be directed to the corresponding authors.
Conflicts of Interest
The authors declare that this study received funding from Guangdong Yuehai Yuexi Water Supply Co., Ltd. The funder had the following involvement with the study: providing research funds, test-site conditions and participating in the cement-paste-related experiments of this paper.
References
- Luo, D.; Niu, D.; Su, L. Research Progress on Durability of Stressed Concrete under Environmental Actions. Eng. Mech. 2019, 36, 1–14+43. [Google Scholar]
- Looney, T.; Leggs, M.; Volz, J.; Floyd, R. Durability and corrosion resistance of ultra-high performance concretes for repair. Constr. Build. Mater. 2022, 345, 128238. [Google Scholar] [CrossRef] [Scilit]
- Xiang, Y.; Meng, Y.; Hu, Y.; Su, Z. Research progress on positioning methods of submersibles for underwater detection of dams in the deepwater environment. Sci. Sin. (Technol.) 2023, 53, 317–329. (In Chinese) [Google Scholar] [CrossRef] [Scilit]
- Li, B.; Wang, G.; Lyu, G.; Ren, J.; Yu, B. Particle Flow Simulation of Underwater Concrete Filling Thickness by Tremie Method. J. Archit. Civ. Eng. 2020, 37, 118–126. [Google Scholar]
- Zhang, C.; Yang, J.; Fu, J.; Ou, X.-F.; Xie, Y.-P.; Dai, Y.; Lei, J.-S. A new clay-cement composite grouting material for tunnelling in underwater karst area. J. Cent. South Univ. 2019, 26, 1863–1873. [Google Scholar] [CrossRef] [Scilit]
- Zhang, C.; Fu, J.; Yang, J.; Ou, X.; Ye, X.; Zhang, Y. Formulation and performance of grouting materials for underwater shield tunnel construction in karst ground. Constr. Build. Mater. 2018, 187, 327–338. [Google Scholar] [CrossRef] [Scilit]
- Jiang, Z. Thoughts on Concrete Repair Based on Holistic Methodology. Mater. Rep. 2009, 23, 81–83+95. [Google Scholar]
- Lee, H.X.D.; Wong, H.S.; Buenfeld, N.R. Self-sealing of cracks in concrete using superabsorbent polymers. Cem. Concr. Res. 2016, 79, 194–208. [Google Scholar] [CrossRef] [Scilit]
- Rong, Q.; Bai, Y.; Wang, X.; Hou, X. The application of the underwater repair of concrete lining slabs in the south-to-north water diversion project. Buildings 2023, 13, 2815. [Google Scholar] [CrossRef] [Scilit]
- Song, X.; Song, X.; Liu, H.; Huang, H.; Anvarovna, K.G.; Ugli, N.A.D.; Huang, Y.; Hu, J.; Wei, J.; Yu, Q. Cement-based repair materials and the interface with concrete substrates: Characterization, evaluation and improvement. Polymers 2022, 14, 1485. [Google Scholar] [CrossRef] [Scilit]
- Song, B.D.; Park, B.G.; Choi, Y.; Kim, T.-H. Determining the engineering characteristics of the hi-FA series of grout materials in an underwater condition. Constr. Build. Mater. 2017, 144, 74–85. [Google Scholar] [CrossRef] [Scilit]
- Li, S.; Zhang, J.; Li, Z.; Gao, Y.; Qi, Y.; Li, H.; Zhang, Q. Investigation and practical application of a new cementitious anti-washout grouting material. Constr. Build. Mater. 2019, 224, 66–77. [Google Scholar] [CrossRef] [Scilit]
- Pei, R.; Liu, J.; Wang, S. Use of bacterial cell walls as a viscosity-modifying admixture of concrete. Cem. Concr. Compos. 2015, 55, 186–195. [Google Scholar] [CrossRef] [Scilit]
- Nasr, A.A.; Chen, S.; Jin, F. Washout resistance of self-protected underwater concrete in freshwater and seawater. Constr. Build. Mater. 2021, 289, 123186. [Google Scholar] [CrossRef] [Scilit]
- Lu, H.; Sun, X.; Ma, H. Anti-washout concrete: An overview. Constr. Build. Mater. 2022, 344, 128151. [Google Scholar] [CrossRef] [Scilit]
- Flatt, R.J. Towards a prediction of superplasticized concrete rheology. Mater. Struct. 2004, 37, 289–300. [Google Scholar] [CrossRef] [Scilit]
- Lomboy, G.; Sundararajan, S.; Wang, K.; Subramaniam, S. A test method for determining adhesion forces and Hamaker constants of cementitious materials using atomic force microscopy. Cem. Concr. Res. 2011, 41, 1157–1166. [Google Scholar] [CrossRef] [Scilit]
- Roussel, N.; Lemaître, A.; Flatt, R.J.; Coussot, P. Steady state flow of cement suspensions: A micromechanical state of the art. Cem. Concr. Res. 2010, 40, 77–84. [Google Scholar] [CrossRef] [Scilit]
- Bartos, P.J.M. Special Concretes—Workability and Mixing; CRC Press: London, UK, 2014. [Google Scholar]
- Kryzhanovskyi, V.; Orlowsky, J. Sustainable Alkali-Activated Self-Compacting Concrete for Precast Textile-Reinforced Concrete: Experimental-Statistical Modeling Approach. Materials 2024, 17, 6280. [Google Scholar] [CrossRef] [Scilit]
- Sun, Q.; Jiang, D.; Li, Q.; Wu, Y.; Rong, H.; Zhao, P. Mechanical properties and anti-efflorescence of cement-based coating containing silicon-aluminum based powder and modified-polyacrylate emulsion. Constr. Build. Mater. 2023, 408, 133614. [Google Scholar] [CrossRef] [Scilit]
- Soleimani, M.; Bagheri, E.; Mosaddegh, P.; Rabiee, T.; Fakhar, A.; Sadeghi, M. Stable waterborne epoxy emulsions and the effect of silica nanoparticles on their coatings properties. Prog. Org. Coat. 2021, 156, 106250. [Google Scholar] [CrossRef] [Scilit]
- GB/T 8077-2012; Standardization Administration of China. Methods for Testing Uniformity of Concrete Admixture. Standards Press of China: Beijing, China, 2012.
- DL/T 5117-2021; National Energy Administration of China. Test Code on Anti-Washout Underwater Concrete. China Electric Power Press: Beijing, China, 2021.
- Huang, H.; Jiang, Y.; Pan, T.; Ji, X. Research on the Rheological Model of Cement Paste with Large Fluidity. J. Nanjing Norm. Univ. (Nat. Sci. Ed.) 2021, 44, 20–23. [Google Scholar]
- Fei, S.; Peng, L. Development of High-Performance Microfine Cementitious Grout with High Amount of Fly Ash, Silica Fume, and Slag. J. Mater. Civ. Eng. 2021, 33, 04021270. [Google Scholar] [CrossRef] [Scilit]
- Ge, J.; Zhuang, H.; Xu, F.; Han, X.; Zhan, Y.; Meng, X.; Wei, H.; Qian, W. Chloride enrichment induced by magnetic field of stray current and coupled deterioration mechanism in concrete under salt freeze-Thaw conditions. Results Eng. 2025, 27, 107014. [Google Scholar] [CrossRef] [Scilit]
- Sun, S.; Chen, Y.; Zhang, M.; Zhao, B.-B.; Deng, P.; Cheng, Y. Preparation and Properties of Ymer N120 Modified Non-Ionic Waterborne Epoxy Emulsion. J. Sichuan Univ. (Nat. Sci. Ed.) 2022, 59, 138–144. [Google Scholar]
- Wang, K.; Li, Y.; Sang, S.; Zhang, S.; Chen, L.; Tang, J. Preparation and properties of nonionic waterborne epoxy resin. J. Appl. Polym. Sci. 2022, 139, 51655. [Google Scholar] [CrossRef] [Scilit]
- Gao, J.; Zhang, X.; Zhu, K.; Wang, B.; Cai, J.; Sun, H.; Sun, Y.; Hu, H. Curing kinetics of epoxy resin/organic urea system. China Synth. Resin Plast. 2020, 37, 11–14. [Google Scholar]
- Ma, B.; Peng, Y.; Tan, H.; Lv, Z.; Deng, X. Effect of Polyacrylic Acid on Rheology of Cement Paste Plasticized by Polycarboxylate Superplasticizer. Materials 2018, 11, 1081. [Google Scholar] [CrossRef] [Scilit]
- Jiang, L. Experimental Research and Engineering Application of Polysilica Ashand Fly Ash Cement-based Grouting Materials. Master’s Thesis, Shenyang University of Technology, Shenyang, China, 2024. [Google Scholar]
- Hu, C.; De Larrard, F.; Sedran, T.; Boulay, C.; Bosc, F.; Deflorenne, F. Validation of BTRHEOM, the new rheometer for soft-to-fluid concrete. Mater. Struct. 1996, 29, 620–631. [Google Scholar] [CrossRef] [Scilit]
- Roussel, N. Correlation between yield stress and slump: Comparison between numerical simulations and concrete rheometers results. Mater. Struct. 2006, 39, 501–509. [Google Scholar] [CrossRef] [Scilit]
- Roussel, N.; Stefani, C.; Leroy, R. From mini-cone test to Abrams cone test: Measurement of cement-based materials yield stress using slump tests. Cem. Concr. Res. 2005, 35, 817–822. [Google Scholar] [CrossRef] [Scilit]
- Ferraris, C.F.; De Larrard, F. Modified slump test to measure rheological parameters of fresh concrete. Cem. Concr. Aggreg. 1998, 20, 241–247. [Google Scholar] [CrossRef] [Scilit]

Disclaimer/Publisher’s Note: The statements, opinions and data contained in all publications are solely those of the individual author(s) and contributor(s) and not of MDPI and/or the editor(s). MDPI and/or the editor(s) disclaim responsibility for any injury to people or property resulting from any ideas, methods, instructions or products referred to in the content. |
© 2026 by the authors. Licensee MDPI, Basel, Switzerland. This article is an open access article distributed under the terms and conditions of the Creative Commons Attribution (CC BY) license.