


Abstract
Informal learning spaces (ILS) in university teaching buildings support self-directed learning, collaboration, and social interaction. However, the correspondence between configurational visual accessibility and users’ perceived accessibility remains unclear. This study investigates informal learning spaces in two studio-based teaching buildings at Zhejiang University of Technology by integrating Space Syntax analysis and Post-Occupancy Evaluation (POE). A Configurational Visual Accessibility Index (CVAI), Perceived Accessibility Index (PAI), and Willingness to Stay (WTS) were used to examine relationships among spatial configuration, user perception, and behavioural intention. Quadrant analysis and regression models were employed to identify spatial mismatch patterns and examine the environmental factors associated with them. CVAI was not significantly associated with PAI, and approximately half of the investigated spaces exhibited mismatches between CVAI and subjective evaluations. Environmental qualities, particularly facility convenience and learning support, were significantly associated with perceived-accessibility and WTS mismatch patterns. Supplementary VGA analysis further showed that Isovist Compactness and Visual Clustering Coefficient provided additional explanation for part of these mismatches. The proposed CVAI–PAI–WTS framework establishes an integrated evaluation pathway linking spatial configuration, environmental support conditions, user perception, and behavioural intention. It provides a diagnostic approach for identifying mismatches between configurational potential and user experience, supporting the evaluation and optimisation of informal learning spaces.
1. Introduction
As higher education shifts from teacher-centred to student-centred learning, educational buildings are increasingly expected to support not only formal teaching but also self-directed learning, collaboration, and social interaction [1,2]. Learning activities have consequently extended beyond conventional classrooms into more flexible and open settings, making public shared spaces an important component of contemporary learning environments [3,4].
Informal learning spaces (ILS) refer to settings beyond formally scheduled teaching spaces that support self-directed, collaborative, and social learning activities [2,5]. They are particularly important in programmes characterised by studio-based learning (SBL), such as architecture and design, where design practice, teamwork, critique, and peer exchange frequently extend beyond scheduled teaching and continue across both shared spaces and studios [6,7]. Public shared spaces in studio-based teaching buildings therefore provide important settings for discussion, collaboration, and disciplinary exchange. However, the spatial performance of these informal settings and their capacity to support learning remain comparatively underexplored [8].
During the architectural design stage, designers often need to anticipate how alternative spatial configurations may influence subsequent patterns of use before a space is occupied. Space Syntax provides a quantitative approach for such prospective evaluation. Among its methods, Visibility Graph Analysis (VGA) represents a building plan as a network of mutually visible locations and quantifies their visual and configurational relationships. It has been widely used to investigate relationships between spatial layout and behaviours such as movement and unplanned encounters [9,10]. In this sense, VGA provides a measure of configurational visual accessibility, reflecting a location’s visual connectivity and configurational position within the spatial system and providing a parsimonious indicator of its potential spatial performance.
However, spatial configuration represents the probabilistic potential for behaviour rather than actual user experience. Research on Space Syntax by Sailer and colleagues has shown that higher integration and connectivity generally increase opportunities for movement, co-presence, and unplanned interaction, but specific activities are not determined by configurational properties alone [9]. Spatial function, activity purpose, facility provision, and users’ needs for privacy and freedom from disturbance may all influence how a space is actually used [9,11]. Similar evidence has been reported in educational environments. Wu et al., for example, found that visual openness was associated with visually oriented activities such as waiting and looking around, whereas individual study was more strongly related to functional arrangements and lower levels of pedestrian and noise disturbance [12]. Therefore, even favourable visual configurational conditions do not necessarily correspond with positive perceptions of accessibility or a stronger willingness to stay.
This distinction suggests that discrepancies between configurational visual accessibility and users’ evaluations should not simply be interpreted as errors in spatial analysis, but as diagnostically meaningful manifestations of spatial performance. Favourable configurational conditions may not correspond with positive user evaluations, whereas configurational disadvantages may be compensated for by functional, environmental, or socio-psychological qualities. Although previous studies have examined spatial configuration, learning-space quality, and some have combined Space Syntax with POE or user evaluation, it remains unclear to what extent configurational visual accessibility corresponds with perceived accessibility and willingness to stay, and which environmental conditions facilitate, weaken, or compensate for this process [13,14,15,16]. This question is particularly relevant to ILS, where different forms of staying, self-directed learning, and collaborative interaction place diverse demands on the spatial environment.
Accordingly, this study investigates ILS in the Art Building and the Architecture and Civil Engineering Building (ACE Building) at Zhejiang University of Technology. It integrates a VGA-based Configurational Visual Accessibility Index (CVAI) with the Perceived Accessibility Index (PAI), Willingness to Stay (WTS), and questionnaire-based Post-Occupancy Evaluation (POE). The study examines correspondence and discrepancy patterns in the CVAI-PAI and CVAI-WTS relationships and uses multidimensional POE indicators to identify environmental conditions associated with these patterns. By treating discrepancies between configurational assessment and user evaluation as explicit diagnostic information, the framework links spatial configuration, user perception, and behavioural intention and provides evidence for both pre-occupancy design evaluation and post-occupancy optimisation of informal learning spaces.
This study addresses the following research questions:
RQ1:
To what extent does configurational visual accessibility correspond with users’ perceived accessibility in studio-based learning environments?
RQ2:
What patterns of correspondence and discrepancy emerge among configurational visual accessibility, perceived accessibility, and willingness to stay, and what spatial-configurational characteristics distinguish these patterns?
RQ3:
What environmental factors are associated with these discrepancy patterns, and what implications can be derived for the design optimisation of informal learning spaces?
2. Literature Review
2.1. Informal Learning and Spatial Characteristics of Learning Environments
With shifts in higher education philosophies and pedagogies, educational buildings have undergone significant transformation. Traditional enclosed classrooms are increasingly replaced by flexible, open, and multifunctional learning environments [17,18]. Learning spaces are thus no longer seen merely as knowledge transmission settings but as environments supporting communication, collaboration, exploration, and self-directed learning [8], drawing increasing attention to the relationship between spatial organisation and learning behaviour [19].
In architecture, planning, and design disciplines, the design studio is the primary learning setting [20,21]. Akande et al. found that interactive spaces within architecture school buildings play a significant role in facilitating learning exchange, collaborative activities, and student engagement, and that their spatial quality is closely related to students’ learning experiences and patterns of space use [22]. Design education buildings should therefore support not only formal teaching but also informal learning and social interaction.
Regarding spatial characteristics, Wu et al. identified key environmental dimensions associated with students’ preferences in ILS, including comfort, flexibility, functionality, spatial hierarchy, openness, and facilities, and reported significant relationships between these factors, patterns of space use, and learning activities [2]. Similarly, Harrop and Turpin highlighted that informal learning environments are defined by multiple interrelated spatial attributes and should be designed as a network of diverse and connected settings to accommodate varied learning preferences [23]. More recent studies have further expanded this line of inquiry to include students’ experiential outcomes [14].
Compared with general higher education contexts, informal learning in studio-based environments is more disciplinarily embedded and community-dependent, and closely connected to everyday routines and material practices [24,25,26]. Wang found that much architectural learning occurs beyond formal classes through peer interaction, collaboration, and “learning guerrilla” practices extending the studio beyond scheduled teaching [6]. From a spatial perspective, hot-desking studios have been shown to promote intra- and inter-group interaction and foster collective rather than individual community identity [27].
However, existing research has mainly focused on learning activities such as critique, discussion, and collaboration, with limited attention to the spatial structures that support them and their relationships with learning behaviour intention. Moreover, quantitative studies addressing the specific spatial requirements of studio-based learning remain limited despite growing interest in spatial organisation and user behaviour in informal learning environments.
2.2. Integrating Configurational Visual and Perceived Accessibility in Educational Buildings
Space Syntax has been widely applied to examine how spatial configuration influences movement, visibility, and space use in educational buildings. Among its methods, VGA quantifies the visual and configurational relationships among locations through measures such as integration and connectivity, providing a configuration-based representation of spatial accessibility. For example, Hammadamin et al. employed axial and depth analyses to compare architecture schools and demonstrated that different spatial layouts were associated with variations in spatial efficiency and use patterns [28]. Similarly, Soares et al. combined Space Syntax with users’ experiences in university public spaces, showing that spatial configuration influences opportunities for movement, co-presence, and encounter [29]. These studies demonstrate the value of configurational analysis for assessing the potential spatial performance of educational environments.
At the same time, evidence suggests that the relationship between configurational properties and spatial use is contingent on activity, user characteristics, and functional context. For instance, Sak-Acur and Sailer found that visual depth significantly predicted children’s location choices, but that these relationships varied across age and gender groups and interacted with the functional organisation of playground areas [11]. Similar discrepancies have been identified in university environments. Yao et al. integrated Space Syntax with subjective evaluations to investigate university public spaces and found that objectively accessible spaces were not always perceived positively by students [30]. These findings indicate that configurational analysis captures an important dimension of spatial performance, but does not in itself account for how users evaluate and engage with a space.
Perceived accessibility provides a complementary user-centred perspective. It refers to users’ subjective judgement of how easily a place can be located, reached, recognised, and used, and may be influenced by familiarity, environmental cues, previous experience, and cognitive processes [31,32]. Although the distinction between calculated and perceived accessibility has been increasingly recognised, most research has focused on transport and urban contexts [33,34]. In educational environments, existing studies have more commonly combined Space Syntax with POE, behavioural observation, or general satisfaction measures, while perceived accessibility itself has received comparatively limited attention.
Accordingly, an unresolved issue is how configurational visual accessibility corresponds with users’ perceived accessibility and behavioural intention within ILS. Existing studies have established the relevance of both spatial configuration and user-centred evaluation, but the discrepancies between these dimensions have rarely been examined as an explicit component of learning-space performance. Addressing this relationship may therefore provide a more differentiated basis for evaluating how configurational characteristics are experienced and used in informal learning spaces.
2.3. POE for User-Centred Learning Space Assessment
POE is a systematic, user-centred approach to assessing building performance after occupancy. Since its introduction by Preiser et al. [35], POE has shifted from technical performance assessment to examining how built environments support users’ activities, experiences, and wellbeing, informing design improvement and facility management.
In educational contexts, POE has become a key approach for examining the relationship between learning environments and student experience. Recent studies have extended evaluation beyond physical conditions to include learning support, behavioural patterns, and social interaction. Tookaloo and Smith emphasised that learning space effectiveness depends on the interaction between spatial functionality, facilities, and user perception [36]. In design education, Shaheen et al. further argued that learning environments should be assessed not only in physical terms but also in relation to collaboration, creativity, and diverse learning activities [20].
Alongside this shift, POE research has increasingly adopted multidimensional frameworks. Abisuga et al. proposed an integrated model combining spatial attributes, indoor environmental quality, facility provision, and socio-psychological factors [37], suggesting that learning-space performance emerges from the interaction of multiple environmental dimensions rather than physical conditions alone.
However, existing POE studies still largely focus on overall environmental performance and user satisfaction, with limited explanation of why spatial accessibility does not consistently corresponds with perceived quality or behavioural intention. Moreover, many evaluation frameworks are developed for general educational buildings and insufficiently capture the specificities of architecture schools, where prolonged occupancy, collaborative learning, informal interaction, and disciplinary identity play central roles.
Building on existing frameworks, this study synthesises key indicators to develop a context-specific POE instrument for informal learning spaces in architecture schools. These indicators are organised into four dimensions: Spatial Use Support, Indoor Environmental Comfort, Facility and Learning Support, and Socio-Psychological and Spatial Identity Support. Rather than functioning solely as an evaluative tool, this framework also helps explain mismatches between configurational visual accessibility and perceived accessibility, offering a more comprehensive understanding of students’ willingness to remain in informal learning spaces.
3. Study Area and Methods
3.1. Study Area
This study was conducted in the Art Building and the Architecture and Civil Engineering Building (ACE Building) at Zhejiang University of Technology (Table 1). The two buildings were selected according to three criteria. First, both accommodate architecture-, planning-, design-, and engineering-related programmes in which studio-based learning (SBL) is widely adopted. Second, both contain a variety of shared and semi-shared spaces that support learning and other activities beyond scheduled classes. Third, although the two buildings are situated within the same institutional context, they differ in spatial configuration, spatial organisation, and the distribution of shared learning spaces. Selecting two buildings within the same university also helped reduce contextual variation associated with institutional management and academic scheduling.
Table 1.
Distribution of Observation Nodes.
In this study, ILS were operationally defined as indoor environments within SBL buildings that were accessible beyond scheduled instruction and supported self-directed or peer-based activities. Studios were included when they remained accessible for such activities outside scheduled teaching. Based on the ILS typology proposed by Salih et al. [14], the investigated settings mainly corresponded to public indoor and semi-public indoor spaces. Field investigation examined accessibility conditions, spatial functions, activity characteristics, and spatial boundaries of each candidate space. Spaces were included when they were accessible to students, supported staying or informal learning activities, and had identifiable spatial boundaries. Circulation-only areas, service spaces, and inaccessible functional areas were excluded. The 34 investigated ILS nodes served as the final analysis units, including 18 nodes in the Art Building (A1–A18) and 16 nodes in the ACE Building (B1–B16). For enclosed spaces, boundaries were defined by physical enclosure elements; for open and transitional spaces, boundaries were determined according to spatial configuration and activity areas.
3.2. Data Sources and Pre-Processing
The study employed two primary quantitative data sources: architectural floor plans and questionnaire survey responses. Architectural floor plans were used to construct VGA models and calculate CVAI. Questionnaire surveys were conducted to collect students’ evaluations of PAI, WTS, and POE ratings of the spatial environment. Preliminary field investigation supported the identification and delineation of candidate spatial nodes by verifying their functions and access conditions.
To ensure comparability between the two datasets, spatial nodes were adopted as the common unit of analysis. The nodes identified in Section 3.1 were assigned a unified coding system. Each questionnaire response was linked to the specific node evaluated by the participant, and responses were aggregated to obtain node-level mean scores. The resulting questionnaire indicators were then matched with the corresponding Space Syntax metrics.
Prior to analysis, the VGA indicators were standardised to eliminate dimensional differences. Questionnaire data were screened for missing values, and the internal consistency of multi-item constructs was assessed before statistical analysis.
3.3. Research Framework
A node-level analytical approach integrating Space Syntax analysis and questionnaire-based POE was employed to investigate the relationships among CVAI, PAI, and WTS in the investigated ILS.
As illustrated in Figure 1, the study consisted of four stages. First, VGA models were developed based on the floor plans of the two buildings. Visual Integration and Connectivity were calculated and subsequently used to construct the CVAI, while Isovist Compactness and the Visual Clustering Coefficient (VCC) were additionally extracted as supplementary local visual-field measures for subsequent mismatch interpretation. Second, questionnaire surveys were conducted to collect students’ evaluations of PAI, WTS, and POE satisfaction. Third, the indicators were integrated to examine the correlations between CVAI and PAI and to identify spatial patterns through CVAI-PAI and CVAI-WTS quadrant analyses. Two directional discrepancy scores were also calculated to retain the continuous differences between the indicators. Finally, OLS regression and group comparisons were conducted to examine the environmental characteristics associated with different discrepancy patterns. Model robustness and quadrant stability were further assessed through VIF diagnostics, leave-one-out sensitivity analysis, and alternative mean-based cut-points.
Figure 1.
Research framework.
Based on the classification results, comparative analyses were further conducted among representative mismatch types to examine their configurational and environmental characteristics and to derive corresponding spatial optimisation strategies.
3.3.1. Preliminary Field Investigation
A preliminary field investigation was conducted before the questionnaire survey to verify the spatial characteristics and typical use patterns of the selected spatial nodes. Following the behavioural research approach adopted by Wu et al. [2] in informal learning space studies, non-participant observation was conducted to record users’ locations, staying behaviours, and primary activity types within each spatial node.
Observations were conducted over two consecutive weeks during the middle of the academic semester, excluding examination periods, project review weeks, and public holidays. This period was selected to capture relatively routine space-use conditions while avoiding atypical fluctuations associated with major academic events. Three observation periods were selected each day: morning (09:00–11:30), afternoon (13:30–16:30), and evening (18:30–21:00), to capture variations in space use across different time periods.
The observation records included: (1) visitor count, referring to the number of users entering or passing through each node; (2) staying behaviour, referring to users remaining within the space; (3) primary activity types, including studying, discussion, resting, and electronic device use; and (4) spatial distribution of users and activity clusters.
3.3.2. Visibility Graph Analysis Using VGA
VGA was employed to quantify the configurational visual accessibility of ILS. Based on the architectural floor plans, VGA models were constructed in depthmapX (version 0.8.0; depthmapX Development Team, University College London, London, UK), retaining only permanent structural elements that obstruct visibility. Individual floors were analysed separately and connected through vertical circulation to generate an integrated multi-level visibility network.
3.3.3. Questionnaire Survey and POE Assessment
A structured questionnaire was administered to measure students’ perceptions and evaluations of the investigated nodes (Appendix A: The Questionnaire). The questionnaire comprised four components. Demographic information, including gender, age, academic year, primary study floor, and average daily building use, was first collected. PAI was measured using three items developed with reference to previous studies on perceived accessibility, including ease of locating, accessing, and recognising the space [31,34]. Responses were rated on a five-point Likert scale (1 = strongly disagree to 5 = strongly agree), and average scores were used to calculate the PAI. WTS was measured using Item Q12, “I am willing to stay in this space”.
The POE assessment was developed with reference to previous ILS evaluation studies and established learning-space evaluation frameworks, including Wu et al., the higher education building performance framework of Abisuga et al., and the design studio evaluation framework of Ezz et al. [2,37,38]. Four dimensions were included: Spatial Use Support (Q13–Q17), Indoor Environmental Comfort (Q18–Q22), Facility Convenience and Learning Support (Q23–Q26), and Socio-Psychological and Spatial Identity Support (Q27–Q31). Additional open-ended questions were included to collect information on participants’ use of and preferences for the ILS.
The reliability of the multi-item constructs was assessed using Cronbach’s alpha and corrected item-total correlations. As shown in Table 2, all constructs demonstrated acceptable internal consistency, with Cronbach’s alpha values ranging from 0.748 to 0.866 and all corrected item-total correlations exceeding 0.30.
Table 2.
Reliability analysis of questionnaire constructs.
The survey was conducted on site from 23 to 29 April 2026 using intercept sampling. Undergraduate and postgraduate students using the investigated buildings were invited to participate and evaluated the node in which they were surveyed. Based on communication with building managers, the two buildings were estimated to accommodate approximately 1500 student visits per day. Considering the available fieldwork period and the need to cover all 34 investigated nodes, approximately 10% of the estimated daily user population was set as the recruitment target. Responses with substantial missing data, completion time shorter than 1 min, or self-reported unfamiliarity with the investigated building were excluded. Each valid response was linked to the corresponding node code and subsequently aggregated to obtain node-level mean scores.
3.4. Indicator Construction
To identify discrepancies between configurational visual accessibility and students’ subjective evaluations, this study integrated Space Syntax analysis and questionnaire survey data to derive the CVAI, PAI, and WTS indicators. Based on these indicators, the spatial nodes were classified and compared to identify potential mismatch patterns and examine their associated environmental characteristics.
3.4.1. Construction of the CVAI
Configurational visual accessibility was measured using VGA within the Space Syntax framework. Two commonly used VGA measures, Visual Integration and Connectivity, were selected to represent configurational integration and visual connectivity, respectively. Although Visual Mean Depth is also commonly used in VGA studies, it was not included because it captures configurational depth information that largely overlaps with Integration.
Because these indicators differ in scale and magnitude, both variables were standardised using Z-score normalisation:
where denotes the original value of indicator (j) at spatial node (i), and and represent the sample mean and standard deviation of indicator (j), respectively.
The CVAI was then calculated as:
where INT represents Visual Integration and CON represents Connectivity. Higher CVAI values indicate that a spatial node occupies a more integrated and locally connected position within the visual spatial network.
3.4.2. Construction of the PAI and WTS
Subjective perception data were collected through a questionnaire survey using a five-point Likert scale (1 = strongly disagree; 5 = strongly agree).
Three questionnaire items, namely “easy to find,” “easy to reach,” and “easy to recognise,” were used to measure users’ perceived accessibility. The PAI was calculated as the mean score of these three items.
where Q9 = easy to find; Q10 = easy to reach; Q11 = easy to recognize.
Higher PAI values indicate that a space is perceived as easier to locate, access, and identify.
In addition, WTS was retained as an independent indicator reflecting users’ behavioural intention to remain in a space. This variable was measured by Item Q12 and was subsequently used in the CVAI–WTS quadrant analysis.
3.4.3. Quadrant Classification and Identification of Mismatch Spaces
To visually examine the relationships between configurational visual accessibility and user evaluation, a median-split approach was adopted to construct a four-quadrant classification model. The median CVAI value was used as the horizontal threshold, while the median PAI or WTS value was used as the vertical threshold. The quadrant analysis was used to identify relative node-level spatial patterns. A sensitivity analysis using mean-based thresholds was subsequently conducted to assess the stability of the quadrant assignments.
Accordingly, the 34 investigated spatial nodes were classified into four categories (Table 3).
Table 3.
Space classification based on CVAI and PAI/WTS.
Among these categories, Unconverted Potential Spaces and Compensated Spaces were considered the primary mismatch types investigated in this study. Unconverted Potential Spaces refer to nodes with relatively high CVAI but low PAI or WTS, whereas Compensated Spaces refer to nodes with relatively low CVAI but high PAI or WTS.
3.5. Construction of Mismatch Indices and Statistical Analysis Strategy
3.5.1. Construction of Mismatch Indices
Although the quadrant model provides an intuitive classification of spatial patterns, it cannot capture continuous variations in mismatch intensity. Therefore, two mismatch indicators were developed: the Cognitive Mismatch Index () and the WTS Mismatch Index ().
After standardizing CVAI, PAI, and WTS using Z-score normalization, the mismatch indices were calculated as follows:
The cognitive mismatch index represents the discrepancy between PAI and CVAI, whereas the WTS mismatch index represents the discrepancy between WTS and CVAI.
3.5.2. Supplementary VGA Analysis of Mismatch Patterns
Given the limited correspondence between CVAI and user evaluations, two additional isovist-based VGA measures that are less commonly emphasised in conventional accessibility-oriented applications, Isovist Compactness and VCC, were introduced as supplementary descriptors of local visual-field characteristics. Isovist Compactness measures the geometric compactness of an isovist shape, with values approaching 1 for more compact and stable visual fields. VCC measures the proportion of mutually visible cell pairs within an isovist relative to all possible cell-pair connections; lower values indicate weaker internal visual coherence and greater changes in visual information with small movements. Compared with Compactness, VCC provides a more detailed representation of internal visual relationships.
For each spatial node, the mean Compactness and VCC values of all VGA cells within its boundary were calculated. Pearson and Spearman correlation analyses were conducted between the two measures and the cognitive and WTS mismatch indices. Mann–Whitney U tests were additionally used to compare Compactness and VCC between Compensated Spaces and Unconverted Potential Spaces.
3.5.3. OLS Regression Models and Comparison of Mismatch Types
To further investigate the environmental attributes associated with the mismatch patterns, Ordinary Least Squares (OLS) regression models were established using four POE dimensions as explanatory variables. Separate models were estimated for cognitive mismatch and WTS mismatch using the same set of predictors.
The general model specification is expressed as
where represents either or , and:
: Spatial Use Support;
: Indoor Environmental Comfort;
: Facility Convenience and Learning Support;
: Socio-Psychological and Spatial Identity Support.
All explanatory variables were standardized prior to model estimation.
In addition to the regression analysis, differences in POE dimensions were further examined between two representative mismatch categories: Unconverted Potential Spaces (high CVAI–low WTS) and Compensated Spaces (low CVAI–high WTS). This comparison was used to examine environmental differences between the two contrasting mismatch patterns.
Given the limited number of nodes in each group, the Mann–Whitney U test was employed to assess group differences. Hedges’ g was additionally reported as a small-sample-corrected measure of effect size.
4. Results
4.1. Participant Characteristics and Preliminary Behavioural Observation
Preliminary behavioural observations were conducted to describe the general use patterns of the investigated spaces. The observations indicated considerable differences in activity intensity (Figure 2). Studios and project-based learning spaces generally exhibited higher levels of staying activity, whereas circulation-oriented spaces showed greater passing flows but relatively limited staying behaviour. These observations provided contextual information for interpreting subsequent node-level analyses of CVAI, PAI, and WTS.
Figure 2.
Actual stay and visitor counts for the observation nodes.
Of the 128 questionnaires distributed, 107 valid responses were obtained. Respondents were primarily undergraduate students (79.6%), with postgraduate students accounting for 20.4%. The gender distribution was relatively balanced (44.3% male and 55.7% female), and participants mainly came from architecture, industrial design, civil engineering, urban planning, and design-related programmes (Figure 3).
Figure 3.
Participant Characteristics.
Most respondents reported the third and fourth floors as their primary study locations (76.0% combined). Building use was intensive, with 70.1% spending more than two hours per day in the buildings, including 48.5% staying for over four hours. Public shared spaces were also used frequently, with 39.2% reporting almost daily use and 86.6% using them at least once per week.
As shown in Figure 4, coursework was the most common activity in ILS (28.8%), followed by group discussion (14.0%) and resting (13.6%). Overall, the reported activities indicate that these ILS were used for a combination of learning, collaboration, resting, and informal interaction.
Figure 4.
Major Activities Performed by Users in the Investigated ILS.
4.2. Configurational Visual Accessibility and Perceived Accessibility
4.2.1. Descriptive Statistics of CVAI, PAI and WTS
The VGA analysis revealed considerable variation among the 34 investigated nodes in both Visual Integration and Connectivity (Table 4 and Table 5), with the detailed values reported in Appendix B. Highly integrated spaces were mainly located around building entrances, central halls, and major vertical circulation areas, whereas lower integration values were generally observed on upper floors, at the ends of circulation routes, or within relatively enclosed functional spaces. Connectivity also varied substantially across nodes, with higher values generally occurring in open spaces with extensive local visual connections.
Table 4.
Spatial syntax analysis results of the Art Building.
Table 5.
Spatial syntax analysis results of the ACE building.
The five nodes with the highest visual integration values were B4 (Coffee Corner, 3.71), B1 (Entrance Hall, 3.37), B6 (Second-floor Corner A, 3.19), A9 (Party Activity Room, 3.13), and B2 (Central Hall, 3.07). In contrast, nodes with lower integration values were generally located on upper floors, at the ends of circulation routes, or within relatively enclosed functional zones, such as A18 (Industrial Design Studio, 1.64), A15 (Digital Media Studio, 1.85), and A5 (Lecture Hall, 1.88).
Regarding connectivity, A4 (Exhibition Hall, 859.40), A1 (Art Building Central Hall, 854.66), and A6 (Cafeteria, 325.80) exhibited the highest values, indicating strong local visibility and spatial permeability. These spaces are generally characterised by open layouts and extensive visual connections with surrounding areas.
Descriptive statistics for subjective evaluations are presented in Table 6 and Table 7, with the detailed values reported in Appendix C. The mean PAI was 4.13 (SD = 0.59), ranging from 2.55 to 4.96, indicating generally favourable perceived accessibility across the investigated spaces, although substantial node-level variation remained.
Table 6.
Heat Map of perceived accessibility in the Art Building.
Table 7.
Heat map of perceived accessibility in the ACE Building.
WTS showed a lower mean of 3.25 (SD = 1.17), with values ranging from 1.00 to 4.75. The greater variation in WTS indicates that willingness to remain differed more substantially across spatial nodes than perceived accessibility.
4.2.2. Correspondence Between Configurational Visual and Perceived Accessibility
To examine the degree of correspondence between configurational visual accessibility and students’ perceived accessibility, Spearman’s rank correlation and Pearson’s correlation analyses were conducted between CVAI and PAI.
The results showed no significant relationship between the two measures. The Spearman correlation coefficient was −0.108 (p = 0.541), while the Pearson correlation coefficient was −0.047 (p = 0.787). Neither coefficient reached statistical significance.
Overall, CVAI and PAI showed limited correspondence across the 34 spatial nodes, indicating that the relative configurational positions of the nodes were not systematically aligned with their perceived accessibility scores.
To examine how this weak overall correspondence was distributed across individual nodes, quadrant-based classification was subsequently used to identify different patterns of correspondence and discrepancy.
4.3. Identification of Mismatch Spaces Based on Quadrant Plots
4.3.1. CVAI–PAI Quadrant Plot Analysis
To examine patterns of correspondence and discrepancy between configurational visual accessibility and perceived accessibility, a quadrant plot was constructed using CVAI as the horizontal axis and PAI as the vertical axis. As shown in Figure 5, the 34 spatial nodes were relatively evenly distributed among the four categories, including 9 Advantage Spaces (Q1, 26.5%), 7 Unconverted Potential Spaces (Q2, 20.6%), 10 Compensated Spaces (Q3, 29.4%), and 8 Disadvantaged Spaces (Q4, 23.5%).
Figure 5.
Quadrant analysis of CVAI and PAI.
A total of 17 nodes were located in the two mismatch quadrants (Q2 and Q3), accounting for 50.0% of the sample. Advantage Spaces included A1 (Art Building Central Hall), A4 (Exhibition Hall), B4 (Coffee Corner in the ACE Building), and B2 (ACE Building Central Hall), all of which showed relatively high CVAI and PAI values.
Unconverted Potential Spaces included A3 (Entrance Hall of Block A in the Art Building) and B1 (Entrance Hall of Block C in the ACE Building), which combined relatively high CVAI with lower PAI.
Compensated Spaces included A17 (Industrial Design Laboratory), A18 (Industrial Design Studio), A11 (Environmental Design Studio), and B11 (Architecture Studio), which showed relatively low CVAI but higher PAI.
Disadvantaged Spaces, including A15, A16, and B5, showed relatively low values for both CVAI and PAI.
Overall, the CVAI–PAI quadrant plot identified both correspondence and discrepancy patterns across the investigated spatial nodes.
4.3.2. CVAI–WTS Quadrant Plot Analysis
A second quadrant plot was constructed by replacing PAI with WTS to examine the relationship between configurational visual accessibility and willingness to stay (Figure 6).
Figure 6.
Quadrant plot: CVAI vs. WTS.
Compared with the CVAI–PAI classification, more nodes were located in the high-CVAI–low-WTS quadrant. Several nodes classified as Advantage Spaces in the CVAI–PAI plot were classified as Unconverted Potential Spaces in the CVAI–WTS plot, including A3 (Entrance Hall of Block A in the Art Building), A4 (Exhibition Hall), B1 (Entrance Hall of Block C in the ACE Building), and B2 (ACE Building Central Hall).
Meanwhile, several low-CVAI nodes remained within the Compensated Spaces quadrant in the CVAI–WTS plot, including A17 (Industrial Design Laboratory), A18 (Industrial Design Studio), and B11 (Architecture Studio).
Thus, several spatial nodes exhibited different classifications when PAI was replaced by WTS, indicating differences between the two node-level evaluation patterns.
4.3.3. Comparison and Sensitivity Analysis of Quadrant Classifications
The sensitivity analysis using mean-based cut-points (see Appendix F) showed that the quadrant classifications were largely stable. For the CVAI–PAI analysis, 31 of the 34 nodes retained their classifications (91.2%), whereas all 34 nodes remained unchanged in the CVAI–WTS analysis.
Comparison of the two quadrant plots showed that several nodes classified as Advantage Spaces in the CVAI–PAI analysis shifted to Unconverted Potential Spaces in the CVAI–WTS analysis, whereas some low-CVAI nodes remained within the Compensated Spaces quadrant in both classifications. These differences indicate that the spatial distribution of PAI did not fully correspond with that of WTS across the investigated nodes.
4.4. Interpretation of Mismatch Patterns
4.4.1. Associations Between POE Dimensions and Cognitive and WTS Mismatch
To further identify the environmental factors associated with spatial mismatches, OLS regression models were estimated using four POE dimensions as explanatory variables (see Appendix D. Composition of POE Explanatory Variables), with the Cognitive Mismatch Index () and the WTS Mismatch Index () as dependent variables, respectively. The regression results are presented in Table 8. The four POE dimensions included Spatial Use Support (X1), Indoor Environmental Comfort (X2), Facility Convenience and Learning Support (X3), and Socio-Psychological and Spatial Identity Support (X4).
Table 8.
Regression results for mismatch values.
For the cognitive mismatch model, the overall model was statistically significant (p = 3.07 × 10⁻³), with an R2 of 0.435 and an adjusted R2 of 0.357. All four POE dimensions showed statistically significant associations with cognitive mismatch. Spatial Use Support (X1) and Socio-Psychological and Spatial Identity Support (X4) were negatively associated with cognitive mismatch, whereas Indoor Environmental Comfort (X2) and Facility Convenience and Learning Support (X3) showed positive associations.
For the WTS mismatch model, the overall model was also statistically significant (p < 0.001), with an R2 of 0.565 and an adjusted R2 of 0.505. X1 showed a significant negative association with WTS mismatch, whereas X3 showed a significant positive association. X2 and X4 showed positive and negative coefficients, respectively, but neither association reached statistical significance.
The VIF values of the four predictors ranged from 1.57 to 5.13, indicating no severe multicollinearity. Leave-one-out sensitivity analysis further showed that the directions and magnitudes of the regression coefficients remained largely stable when individual spatial nodes were sequentially excluded. Detailed robustness results are provided in Appendix E.
Both models were statistically significant, whereas the WTS mismatch model showed stronger explanatory power but fewer individually significant predictors.
4.4.2. POE Differences Between Representative Mismatch Types
To compare the environmental characteristics of representative mismatch types, Unconverted Potential Spaces (high CVAI–low WTS) and Compensated Spaces (low CVAI–high WTS) were selected for further comparison. Mann–Whitney U tests were conducted to compare the four POE dimensions between the two groups, with Hedges’ g reported as a small-sample-corrected measure of effect size. The results are presented in Table 9.
Table 9.
Differences in POE dimensions between Compensated Spaces and Unconverted Potential Spaces.
Significant differences were observed across all four POE dimensions between Compensated Spaces and Unconverted Potential Spaces (p < 0.05). Compensated Spaces consistently exhibited higher scores across all dimensions.
The largest effect sizes were observed for Facility Convenience and Learning Support (Hedges’ g = 2.075) and Spatial Use Support (Hedges’ g = 1.745), followed by Socio-Psychological and Spatial Identity Support (g = 1.256) and Indoor Environmental Comfort (g = 1.143). Given the limited number of spatial nodes in each comparison group and the relatively small numbers of questionnaire responses contributing to some node-level mean scores, these effect-size estimates should be interpreted cautiously.
4.4.3. Supplementary VGA Analysis of Mismatch Patterns
To examine whether supplementary local visual-field measures could provide additional information on the identified mismatch patterns, the relationships of Isovist Compactness and VCC with the two mismatch indices were first examined. Compactness was positively correlated with cognitive mismatch (r = 0.479, p = 0.004) and WTS mismatch (r = 0.657, p < 0.001), while VCC showed the same pattern (r = 0.364, p = 0.035 and r = 0.545, p = 0.001, respectively). The associations were stronger for WTS mismatch, and Spearman correlations showed consistent results.
The quadrant-based comparison showed a corresponding pattern. Compensated Spaces exhibited significantly higher Compactness and VCC than Unconverted Potential Spaces in both the CVAI–PAI and CVAI–WTS classifications (p < 0.05). These results indicate that more positive mismatch patterns were associated with more compact and internally interconnected local visual fields.
5. Discussion
5.1. Discussion of Main Findings
Regarding RQ1, CVAI and PAI showed only a weak and non-significant association, indicating that configurational advantages identified through VGA do not consistently correspond with users’ evaluations of how easy a space is to find, reach, and recognise [31]. This discrepancy may arise from the different attributes represented by the two indicators: CVAI describes the fundamental configurational relationships of visual space that influence environmental perception, whereas users’ perceptions are also affected by functional characteristics, environmental conditions, and individual preferences.
Regarding RQ2, the quadrant analysis revealed that the correspondence between configurational potential and user evaluation varied across different spatial types and functional roles. Entrance halls, central halls, and transitional spaces often exhibited relatively high CVAI but lower WTS, suggesting that configurational centrality may be more relevant to circulation, orientation, and encounter than to prolonged learning. In contrast, some specialised teaching spaces with clear functions and stable user groups often showed relatively low CVAI but higher PAI or WTS, indicating that functional and environmental support may compensate for configurational disadvantages [39,40].
The supplementary VGA analysis further provides a configurational interpretation of the mismatch patterns. Although Integration and Connectivity are commonly used measures of visual accessibility and represent movement-related spatial potential, the spatial conditions supporting informal learning are more complex due to the diversity of learning activities. Spaces for group learning and interaction require high visibility and accessibility, whereas individual informal learning may benefit from psychologically stable environments that reduce disturbance from passing flows and provide a certain degree of enclosure. By introducing two additional VGA measures, Compactness and VCC, the second-stage analysis showed that these measures helped explain why user evaluations may differ from the results indicated by CVAI. Their stronger relationships with WTS mismatch further suggest that local visual conditions related to enclosure may play an important role in supporting staying behaviour and informal learning activities.
Regarding RQ3, the POE analysis revealed that different environmental dimensions contributed differently to the formation of mismatch patterns. Facility Convenience and Learning Support (X3) showed significant positive relationships with both cognitive and WTS mismatch, whereas Indoor Environmental Comfort (X2) was significant only for cognitive mismatch. In ILS, access to power, internet connectivity, furniture, display facilities, and other learning-support resources are closely related to sustained learning, discussion, and collaborative activities, and may therefore compensate for configurational disadvantages [41,42]. This finding is consistent with Alzamil et al. and Salih et al., who highlighted the roles of facilities, environmental conditions, and physical design attributes in supporting social learning experiences and campus learning activities [43,44].
Spatial Use Support (X1) and Socio-Psychological and Spatial Identity Support (X4) showed negative relationships with the mismatch measures. Meanwhile, comparison showed that both X1 and X4 scored higher in Compensated Spaces than in Unconverted Potential Spaces, suggesting that these environmental factors may primarily reinforce existing spatial performance advantages rather than directly compensate for configurational disadvantages. Specifically, the layout, scale, circulation, and flexibility represented by X1 are closely related to spatial organisation itself. Improvements in these attributes may therefore be simultaneously reflected in configurational performance and user evaluation, making it less likely to generate additional improvement beyond the potential represented by CVAI. In contrast, the belonging, social interaction support, and spatial identity captured by X4 are more closely associated with long-term use and stable group experiences [45,46]. Their role may therefore lie more in maintaining and strengthening established spatial experiences, rather than altering the potential accessibility represented by spatial configuration.
Overall, X3 showed the most direct compensatory relationship with configurational disadvantage. In comparison, X1 and X4 represent more fundamental qualities related to spatial organisation and place experience, whereas X2 showed a more specific association with cognitive mismatch.
5.2. Integrated Evaluation Framework for Informal Learning Spaces
Based on the findings of RQ1-RQ3, this study develops an integrated evaluation framework for ILS (Figure 7). The framework aims to identify the correspondence and discrepancy between configurational potential and users’ actual experiences, and to provide an analytical basis for understanding the formation of different spatial performance states. Overall, the framework establishes a continuous process of “configurational potential identification - user experience evaluation - discrepancy typology”.
Figure 7.
Integrated evaluation framework for ILS in studio-based teaching buildings.
First, CVAI derived from VGA represents the configurational accessibility potential of a space within the overall visual network and serves as the primary indicator of configurational evaluation. Isovist Compactness and VCC provide supplementary local visual-field measures to further interpret the identified mismatch patterns. Meanwhile, POE characterises environmental support conditions across spatial use, indoor environmental conditions, facility and learning support, and socio-psychological and spatial identity support, complementing the user experience factors not directly captured by configurational analysis.
Based on these spatial environmental conditions, PAI and WTS represent users’ perceived accessibility and willingness to stay, respectively, reflecting how spatial conditions are experienced and evaluated by users. By comparing CVAI with PAI and WTS, the framework identifies discrepancies between configurational potential and user experience and uses quadrant classification to typologies these relationships into Advantage Spaces, Unconverted Potential Spaces, Compensated Spaces, and Disadvantaged Spaces. Accordingly, mismatch is treated as diagnostic information for identifying potential directions of spatial optimisation. The framework therefore establishes an analytical pathway connecting configurational evaluation with user experience diagnosis and provides a basis for ILS design optimisation oriented towards user experience.
5.3. Theoretical and Methodological Implications
Previous studies of informal learning spaces have typically examined factors such as spatial configuration, environmental quality, facility provision, or socio-psychological experience in relation to spatial performance [47,48,49]. However, these factors have often been investigated through relatively independent evaluation approaches. Building on this, the present study further treats discrepancies between configurational potential and user evaluation as explicit diagnostic information, thereby establishing an integrated evaluation pathway connecting spatial structure and user experience.
Methodologically, this framework extends the application of Space Syntax from configurational description to discrepancy diagnosis. VGA provides a relatively parsimonious approach for analysing the visual configurational accessibility of different spatial layouts at the design stage. Combined with POE based on actual environmental experience, it enables further analysis of the correspondence between configurational evaluation and users’ actual experiences, as well as the identification of environmental conditions associated with such discrepancies. Therefore, the framework provides a common analytical basis for early-stage design assessment and post-occupancy optimisation.
Furthermore, this study introduces Isovist Compactness and VCC as supplementary visual-field measures to provide additional interpretations of mismatch patterns. Compared with Integration and Connectivity, which are more commonly used to explain movement-related behaviours, these two measures better capture spatial characteristics associated with staying behaviours and provide a complementary perspective for the application of Space Syntax.
6. Conclusions
This study investigated informal learning spaces in the ACE Building and the Art Building at Zhejiang University of Technology using an integrated framework linking CVAI, PAI, and WTS. Space Syntax analysis and questionnaire-based POE were integrated at the node level, while preliminary field investigation provided contextual information on general space-use patterns.
Three main findings were identified. First, CVAI showed only a weak and non-significant correspondence with PAI, indicating that configurational potential does not consistently align with users’ perceived accessibility. Second, the quadrant analysis revealed distinct correspondence and mismatch patterns, including Unconverted Potential Spaces and Compensated Spaces. Supplementary VGA analysis further indicated that local visual-field measures such as Isovist Compactness and VCC can complement commonly used Integration and Connectivity measures in interpreting mismatch patterns, particularly those related to willingness to stay. Third, the POE analysis showed differentiated associations with cognitive and WTS mismatches: Facility Convenience and Learning Support were positively associated with both cognitive and WTS mismatches, whereas Spatial Use Support was negatively associated with both. Indoor Environmental Comfort and Socio-Psychological and Spatial Identity Support were associated specifically with cognitive mismatch, in positive and negative directions, respectively. Together, these findings support the use of CVAI–PAI/WTS discrepancies as diagnostic information in learning-space evaluation. The proposed framework links configurational assessment, user perception, behavioural intention, and environmental interpretation, providing a basis for both early-stage assessment of configurational potential and targeted post-occupancy optimisation of informal learning spaces.
This study has several limitations. First, the analysis was based on a relatively small sample of 34 spatial nodes within two studio-based teaching buildings at a single university, which limits the external generalisability of the empirical findings. Future studies should extend the framework to larger samples, multiple universities, and other types of informal learning settings, and further examine whether the supplementary value of Compactness and VCC observed in this study remains consistent across different spatial contexts. Second, WTS was measured as a self-reported behavioural intention rather than actual staying behaviour, while the preliminary field investigation was used only as contextual evidence. Future research could incorporate systematic behavioural observations or occupancy data into the framework to examine the correspondence between stated willingness and actual space use. Third, the cross-sectional design supports the identification of associations but does not establish causal relationships among configurational visual accessibility, environmental conditions, and user evaluation. Finally, although sensitivity analysis indicated relatively stable quadrant classifications, the median-split approach remains sensitive to threshold selection, particularly for nodes located close to the cut-off values. Future studies could further examine continuous or alternative classification approaches for discrepancy diagnosis.
Author Contributions
Conceptualisation, C.X. and X.D.; methodology, C.X.; software, C.X.; validation, C.X. and X.D.; formal analysis, C.X.; investigation, C.X.; data curation, C.X.; writing—original draft preparation, C.X.; writing—review and editing, C.X. and X.D.; supervision, X.D. All authors have read and agreed to the published version of the manuscript.
Funding
This research was funded by the Postgraduate Teaching Reform Project of Zhejiang University of Technology, grant number 2022312.
Data Availability Statement
Data are contained within this article.
Conflicts of Interest
The authors declare no conflicts of interest.
Abbreviations
The following abbreviations are used in this manuscript:
| POE | Post-Occupancy Evaluation |
| CVAI | Configurational Visual Accessibility Index |
| PAI | Perceived Accessibility Index |
| WTS | Willingness to Stay |
| SBL | studio-based learning |
| ACE Building | Architecture and Civil Engineering Building |
Appendix A. The Questionnaire
Appendix A.1. Basic Information
- Observation node (point of investigation)
- Grade:□ Freshman □ Sophomore □ Junior □ Senior □ Fifth-year □ Postgraduate
- Gender:□ Male □ Female
- Major:□ Architecture □ Urban Planning □ Civil Engineering □ Industrial Design □ Art Design □ Other
- Main floor used for study activities:
- Average daily time spent in the building:□ <0.5 h □ 0.5–1 h □ 1–2 h □ 2–4 h □ >4 h
- Frequency of using informal public spaces (e.g., studios, exhibition spaces, lounges, lobbies) outside class:□ Almost never □ 1–2 times/week □ 3–4 times/week □ Almost daily
- Main purposes of using public/shared spaces (multiple choice):□ Design review □ Homework □ Rest □ Group discussion □ Dining □ Viewing drawings □ Lectures □ Activities □ Others
Appendix A.2. Perceived Accessibility Index (PAI)
(5-point Likert scale: 1 = strongly disagree/very difficult, 5 = strongly agree/very easy)
- The space is easy to locate.
- The space is easy to access.
- The space is easy to identify.
- I am willing to stay in this space.
Appendix A.3. Spatial Satisfaction (POE Dimensions)
(5-point Likert scale: 1 = strongly disagree, 5 = strongly agree)
Spatial Use Support (X1)
- The spatial layout is reasonable and supports use.
- The spatial scale and area are appropriate.
- Circulation is smooth and does not interfere with others.
- Furniture (tables, chairs, sofas, etc.) meets functional needs.
- The space is flexible and can adapt to different uses.
Indoor Environmental Comfort (X2)
- Natural lighting is sufficient.
- Artificial lighting is comfortable.
- Thermal conditions are appropriate (comfortable in both summer and winter).
- Ventilation is good and air quality is fresh.
- Visual comfort is high (no glare, clear sightlines).
Facility Convenience and Learning Support (X3)
- Power outlets are sufficient and conveniently located.
- Internet/Wi-Fi coverage is stable and accessible.
- Storage facilities are convenient (e.g., shelves, lockers).
- Drinking water and sanitation facilities are adequate.
Socio-Psychological and Spatial Identity Support (X4)
- The space is suitable for short rest and relaxation.
- The space offers adequate privacy without excessive disturbance.
- The design is aesthetically pleasing and visually attractive.
- The colour scheme is comfortable and not visually harsh.
- The space is easy to recognize within the building (clear signage and identity).
Appendix A.4. Open-Ended Questions
- Besides this node, which public spaces (including studios) in the Art Building or Civil Engineering Building do you most frequently use?
- What types of activities do you usually engage in within these buildings besides attending classes?
- What is the main reason for choosing to pass through or stay in a specific space in these buildings?
Appendix B. Spatial Syntax Metrics of Each Observation Node
| Node | Integration | Connectivity | CVAI | Compactness | Visual Clustering Coefficient | ||||
| max | min | mean | max | min | mean | ||||
| A1 | 2.87 | 2.58 | 2.86 | 963 | 136 | 854.66 | 1.5303 | 0.0441 | 0.6689 |
| A2 | 3.13 | 2.55 | 2.74 | 521 | 49 | 241.31 | 0.2501 | 0.0817 | 0.6456 |
| A3 | 3.2 | 2.51 | 2.83 | 596 | 30 | 278.35 | 0.4351 | 0.0544 | 0.5587 |
| A4 | 3.17 | 2.55 | 2.7 | 934 | 565 | 859.4 | 1.3485 | 0.0668 | 0.7849 |
| A5 | 2.27 | 1.65 | 1.88 | 296 | 63 | 257.54 | −1.0659 | 0.3376 | 0.9039 |
| A6 | 2.79 | 2.26 | 2.41 | 612 | 252 | 325.8 | −0.0352 | 0.1914 | 0.7861 |
| A7 | 2.46 | 1.9 | 2.15 | 129 | 28 | 74.38 | −0.9077 | 0.1705 | 0.4883 |
| A8 | 2.85 | 2.31 | 2.43 | 436 | 182 | 345.47 | 0.0416 | 0.2363 | 0.8388 |
| A9 | 3.51 | 2.76 | 3.13 | 550 | 192 | 333.44 | 0.9125 | 0.0811 | 0.6572 |
| A10 | 3.23 | 2.75 | 3.05 | 329 | 178 | 254 | 0.6875 | 0.1137 | 0.8889 |
| A11 | 2.73 | 2.29 | 2.34 | 109 | 89 | 99.89 | −0.5461 | 0.2971 | 0.8362 |
| A12 | 2.24 | 2.13 | 2.16 | 148 | 95 | 106.76 | −0.8123 | 0.1902 | 0.7304 |
| A13 | 3.16 | 2.61 | 2.9 | 404 | 201 | 274.38 | 0.5422 | 0.0549 | 0.5221 |
| A14 | 2.84 | 2.64 | 2.73 | 206 | 114 | 149.53 | 0.0943 | 0.1295 | 0.6576 |
| A15 | 2.16 | 1.6 | 1.85 | 118 | 49 | 83.36 | −1.4328 | 0.2044 | 0.7609 |
| A16 | 2.27 | 2.22 | 2.25 | 203 | 108 | 172.82 | −0.5421 | 0.0808 | 0.6765 |
| A17 | 2.21 | 1.9 | 1.95 | 154 | 86 | 97.3 | −1.2118 | 0.386 | 0.8744 |
| A18 | 1.71 | 1.49 | 1.64 | 188 | 144 | 159.4 | −1.7333 | 0.2619 | 0.8841 |
| B1 | 3.98 | 3.24 | 3.37 | 584 | 91 | 224.1 | 1.0052 | 0.1163 | 0.7007 |
| B2 | 3.35 | 2.69 | 3.07 | 403 | 235 | 262.95 | 0.7286 | 0.1075 | 0.771 |
| B3 | 3.84 | 2.72 | 3.06 | 487 | 95 | 199.46 | 0.5862 | 0.1628 | 0.6757 |
| B4 | 3.98 | 3.56 | 3.71 | 390 | 94 | 192.93 | 1.3083 | 0.1175 | 0.6907 |
| B5 | 2.61 | 2.6 | 2.6 | 28 | 26 | 27.88 | −0.2869 | 0.3607 | 0.9144 |
| B6 | 3.76 | 2.91 | 3.19 | 433 | 207 | 262.83 | 0.8641 | 0.073 | 0.6385 |
| B7 | 3.01 | 2.61 | 2.88 | 157 | 117 | 146.35 | 0.2905 | 0.1043 | 0.7901 |
| B8 | 2.98 | 2.98 | 2.98 | 198 | 185 | 194.83 | 0.5043 | 0.0544 | 0.7251 |
| B9 | 2.51 | 2.06 | 2.49 | 154 | 107 | 131.99 | −0.2560 | 0.1081 | 0.7236 |
| B10 | 2.85 | 2.31 | 2.63 | 153 | 109 | 127.57 | −0.0766 | 0.1101 | 0.7147 |
| B11 | 2.41 | 2 | 2.24 | 102 | 98 | 100.13 | −0.6923 | 0.3061 | 0.9381 |
| B12 | 2.33 | 1.95 | 2.23 | 131 | 110 | 115.36 | −0.6817 | 0.2692 | 0.8955 |
| B13 | 3.12 | 2.64 | 2.74 | 508 | 164 | 205.32 | 0.1973 | 0.0679 | 0.7436 |
| B14 | 2.8 | 2.42 | 2.52 | 209 | 151 | 170.56 | −0.1441 | 0.1533 | 0.7756 |
| B15 | 2.51 | 2.07 | 2.41 | 320 | 287 | 296.52 | −0.0756 | 0.3008 | 0.9449 |
| B16 | 2.24 | 2.24 | 2.24 | 27 | 25 | 25.83 | −0.8263 | 0.3074 | 0.9882 |
Appendix C. Perceived Spatial Evaluation and WTS Indicators of Each Observation Node
| Node | Perceived Findability | Perceived Accessibility | Perceived Identifiability | PAI | Willingness to Stay |
| A1 | 4.57 | 4.43 | 4.86 | 4.62 | 4.43 |
| A2 | 4.4 | 4.6 | 4.2 | 4.40 | 3.6 |
| A3 | 4.67 | 4.67 | 3.33 | 4.22 | 1.33 |
| A4 | 4.6 | 4.8 | 4.8 | 4.73 | 2.2 |
| A5 | 5 | 4 | 4 | 4.33 | 1.5 |
| A6 | 5 | 5 | 5 | 5.00 | 4.33 |
| A7 | 4 | 4 | 4 | 4.00 | 3.5 |
| A8 | 4 | 4.5 | 3.5 | 4.00 | 4 |
| A9 | 3.67 | 4 | 4 | 3.89 | 4.67 |
| A10 | 4.25 | 4.5 | 4.25 | 4.33 | 4.25 |
| A11 | 4.5 | 5 | 4 | 4.50 | 4.5 |
| A12 | 4.25 | 4.25 | 4 | 4.17 | 4.25 |
| A13 | 4 | 4.5 | 3.5 | 4.00 | 1 |
| A14 | 2.33 | 3 | 2.33 | 2.55 | 2 |
| A15 | 4.5 | 4 | 3 | 3.83 | 3 |
| A16 | 3.5 | 3.5 | 3.5 | 3.50 | 1.5 |
| A17 | 5 | 5 | 4.67 | 4.89 | 4.67 |
| A18 | 5 | 5 | 4.5 | 4.83 | 4 |
| B1 | 4.25 | 4.75 | 3.75 | 4.25 | 2.5 |
| B2 | 5 | 4.8 | 4.6 | 4.80 | 1.8 |
| B3 | 4.33 | 4.67 | 3 | 4.00 | 1.67 |
| B4 | 4.2 | 4 | 5 | 4.40 | 4.2 |
| B5 | 2.67 | 2.67 | 3 | 2.78 | 3 |
| B6 | 4.5 | 5 | 4.5 | 4.67 | 4 |
| B7 | 4 | 4 | 3.5 | 3.83 | 3 |
| B8 | 2.67 | 3 | 3 | 2.89 | 1.67 |
| B9 | 4 | 4 | 3 | 3.67 | 4 |
| B10 | 4 | 4 | 3 | 3.67 | 3 |
| B11 | 4.75 | 4.5 | 4.75 | 4.67 | 4.75 |
| B12 | 4.5 | 4.5 | 4 | 4.33 | 4.5 |
| B13 | 4.5 | 4.5 | 5 | 4.67 | 3.5 |
| B14 | 3.5 | 4 | 5 | 4.17 | 4 |
| B15 | 4.5 | 4.5 | 4 | 4.33 | 4.5 |
| B16 | 2.5 | 4 | 4 | 3.50 | 4 |
Appendix D. Composition of POE Explanatory Variables
| Variable | Dimension Name | Corresponding Items | Item Description |
| X1_spatial_affordance | Spatial Use Support | Q13–Q17 | Rational layout, appropriate spatial scale, smooth circulation, adequate furniture support, and flexible modes of use |
| X2_indoor_comfort | Indoor Environmental Comfort | Q18–Q22 | Natural lighting, artificial lighting, thermal conditions, ventilation, and visual comfort |
| X3_facility_learning | Facility Convenience and Learning Support | Q23–Q26 | Power outlets, internet access, storage, drinking water and hygiene facilities |
| X4_social_identity_atmosphere | Socio-Psychological and Spatial Identity Support | Q27–Q31 | Group discussion, resting, sense of safety and belonging, privacy, aesthetics, colour, and signage recognition |
Appendix E. Regression Diagnostics and Leave-One-Out Sensitivity Analysis
Table A1.
Variance inflation factor (VIF) values of regression predictors.
Table A2.
Leave-one-out sensitivity analysis of regression coefficient stability.
Appendix F. Sensitivity Analysis of Quadrant Classification
Table A3.
Sensitivity analysis of quadrant classification using alternative cut-points.
Table A4.
Changed nodes in CVAI–PAI analysis.
References
- Keppell, M.; Souter, K.; Riddle, M. (Eds.) Physical and Virtual Learning Spaces in Higher Education: Concepts for the Modern Learning Environment; Information Science Reference: Hershey, PA, USA, 2012. [Google Scholar] [CrossRef] [Scilit]
- Wu, X.; Kou, Z.; Oldfield, P.; Heath, T.; Borsi, K. Informal Learning Spaces in Higher Education: Student Preferences and Activities. Buildings 2021, 11, 252. [Google Scholar] [CrossRef] [Scilit]
- McCrone, L.; Kingsbury, M. An ecological approach to understanding transitions and tensions in complex learning contexts. npj Sci. Learn. 2024, 9, 54. [Google Scholar] [CrossRef] [Scilit]
- Marshalsey, L.; Sclater, M. Together but Apart: Creating and Supporting Online Learning Communities in an Era of Distributed Studio Education. Int. J. Art Des. Educ. 2020, 39, 826–840. [Google Scholar] [CrossRef] [Scilit]
- Matthews, K.E.; Andrews, V.; Adams, P. Social Learning Spaces and Student Engagement. High. Educ. Res. Dev. 2011, 30, 105–120. [Google Scholar] [CrossRef] [Scilit]
- Wang, J. Architecture students’ peer learning in informal situations by lens of the community of practice—One case study. Interact. Learn. Environ. 2025, 33, 4394–4418. [Google Scholar] [CrossRef] [Scilit]
- McClean, D.; Hourigan, N. Critical Dialogue in Architecture Studio: Peer Interaction and Feedback. J. Educ. Built Environ. 2013, 8, 35–57. [Google Scholar] [CrossRef] [Scilit]
- Cleveland, B.; Fisher, K. The Evaluation of Physical Learning Environments: A Critical Review of the Literature. Learn. Environ. Res. 2014, 17, 1–28. [Google Scholar] [CrossRef] [Scilit]
- Sailer, K.; Koutsolampros, P. Space Syntax Theory: Understanding Human Movement, Co-Presence and Encounters in Relation to the Spatial Structure of Workplaces. In A Handbook of Theories on Designing Alignment Between People and the Office Environment; Appel-Meulenbroek, R., Danivska, V., Eds.; Routledge: London, UK, 2021; pp. 248–260. [Google Scholar] [CrossRef] [Scilit]
- Koutsolampros, P.; Sailer, K.; Varoudis, T.; Haslem, R. Dissecting Visibility Graph Analysis: The Metrics and Their Role in Understanding Workplace Human Behaviour. In Proceedings of the 12th International Space Syntax Symposium, Beijing, China, 8–13 July 2019; pp. 191.1–191.24. [Google Scholar]
- Sak-Acur, M.; Sailer, K. The Role of Visibility as a Predictor of Children’s Location Choices in Outdoor School Grounds across Age and Gender. Front. Psychol. 2026, 17, 1832795. [Google Scholar] [CrossRef] [Scilit]
- Wu, X.; Oldfield, P.; Heath, T. Spatial openness and student activities in an atrium: A parametric evaluation of a social informal learning environment. Build. Environ. 2020, 182, 107141. [Google Scholar] [CrossRef] [Scilit]
- Salih, S.; Ismail, S.; Azmi, A.; Bajish, A. Pocket Settings for Promoting On-campus Social Learning: FGD. Int. J. Acad. Res. Bus. Soc. Sci. 2023, 13, 794–805. [Google Scholar] [CrossRef] [Scilit]
- Salih, S.A.; Alzamil, W.; Ajlan, A.; Azmi, A.; Ismail, S. Typology of Informal Learning Spaces (ILS) in Sustainable Academic Education: A Systematic Literature Review in Architecture and Urban Planning. Sustainability 2024, 16, 5623. [Google Scholar] [CrossRef] [Scilit]
- Zhang, J.; Liu, C.; Chen, J. A Systematic Review on Social and Physical Factors Influencing Students’ Performance in Informal Learning Spaces. Buildings 2026, 16, 712. [Google Scholar] [CrossRef] [Scilit]
- Wang, G.; Zhang, Y.; Wang, W. Evaluating the performance of informal learning spaces in higher Education: An integrated methodological framework combining Space Syntax and Post-Occupancy Evaluation. J. Asian Archit. Build. Eng. 2026, 1–20. [Google Scholar] [CrossRef] [Scilit]
- Cardellino, P.; Deed, C. Interactions between Design Innovation and Educational Change in Non-Western Schools. Buildings 2024, 14, 716. [Google Scholar] [CrossRef] [Scilit]
- Dovey, K.; Fisher, K. Designing for adaptation: The school as socio-spatial assemblage. J. Archit. 2014, 19, 43–63. [Google Scholar] [CrossRef] [Scilit]
- Dugdale, S. Planning Strategies for the Informal Learning Landscape. Community Des. 2015, 66, 8–27. [Google Scholar]
- Shaheen, L.; Attia, S.; Salama, B.; Al Naabi, M.; Al Mamari, M. Enhancing Learning Environments in Design Education. Evol. Stud. Imaginative Cult. 2025, 9, 1–18. [Google Scholar] [CrossRef] [Scilit]
- Corazzo, J. Materialising the Studio. A systematic review of the role of the material space of the studio in Art, Design and Architecture Education. Des. J. 2019, 22, 1249–1265. [Google Scholar] [CrossRef] [Scilit]
- Makun, C.; Anikor, E.; Emechebe, C.; Akande, O. Evaluation of Interactive Spaces For Enhanced Learning in Architecture Department Buildings in Niger State, Nigeria. ArtGRID-J. Archit. Eng. Fine Arts 2024, 6, 96–110. [Google Scholar] [CrossRef] [Scilit]
- Harrop, D.; Turpin, B. A Study Exploring Learners’ Informal Learning Space Behaviors, Attitudes, and Preferences. New Rev. Acad. Librariansh. 2013, 19, 58–77. [Google Scholar] [CrossRef] [Scilit]
- Brandt, C.; Cennamo, K.; Douglas, S.; Vernon, M.; McGrath, M.; Reimer, Y. A theoretical framework for the studio as a learning environment. Int. J. Technol. Des. Educ. 2013, 23, 329–348. [Google Scholar] [CrossRef] [Scilit]
- Corazzo, J.; Gharib, L. Everyday Routines and Material Practices in the Design Studio: Why Informal Pedagogy Matters. Des. Technol. Educ. Int. J. 2021, 26, 144–164. [Google Scholar] [CrossRef]
- Akkurt, E.; Akbulut, M.T. Interaction of In-between spaces in University campuses with informal learning and spatial design: A scoping review. J. Asian Archit. Build. Eng. 2025, 1–22. [Google Scholar] [CrossRef] [Scilit]
- Cai, H.; Khan, S. The Common First Year Studio in a Hot-desking Age: An Explorative Study on the Studio Environment and Learning. J. Educ. Built Environ. 2010, 5, 39–64. [Google Scholar] [CrossRef] [Scilit]
- Bayz, A.; Nordin, J.; Mustafa, F. Interpretation of Space Syntax in Higher Education: A Study of Functional Efficiency in Architecture Schools in Erbil. Sustainability 2024, 16, 11237. [Google Scholar] [CrossRef] [Scilit]
- Soares, I.; Yamu, C.; Weitkamp, G. The Relationship between the Spatial Configuration and the Fourth Sustainable Dimension Creativity in University Campuses: The Case Study of Zernike Campus, Groningen, The Netherlands. Sustainability 2020, 12, 9263. [Google Scholar] [CrossRef] [Scilit]
- Yao, L.; Dong, D.; He, Y.; Wang, J. The Subjective and Objective Evaluation of the Efficacy of Public Spaces in University Complexes: A Case Study of the Center for Balance Architecture at Zhejiang University. Buildings 2025, 15, 2377. [Google Scholar] [CrossRef] [Scilit]
- Pot, F.J.; van Wee, B.; Tillema, T. Perceived accessibility: What it is and why it differs from calculated accessibility measures based on spatial data. J. Transp. Geogr. 2021, 94, 103090. [Google Scholar] [CrossRef] [Scilit]
- Ma, X.; Cui, F. Perceived accessibility: Literature review and future prospects. J. Transp. Land Use 2024, 17, 827–847. [Google Scholar] [CrossRef] [Scilit]
- Soza-Parra, J.; Tiznado-Aitken, I. What shapes perceived accessibility? Unpacking the interplay of sociodemographics, latent perceptions, and traditional accessibility metrics. Transp. Res. A Policy Pract. 2025, 199, 104608. [Google Scholar] [CrossRef] [Scilit]
- Zhang, J.; Tan, P.Y. Reviewing the Research Development of Perceived Accessibility to Urban Parks and Its Application Inspirations in the Trend of Human-Oriented Planning. Urban Plan. Int. 2021, 36, 96–103. [Google Scholar] [CrossRef]
- Preiser, W.F.E. The evolution of post-occupancy evaluation: Toward building performance and universal design evaluation. In Learning from Our Buildings: A State-of-the-Practice Summary of Post-Occupancy Evaluation; National Academy Press: Washington, DC, USA, 2001; pp. 9–22. [Google Scholar] [CrossRef] [Scilit]
- Tookaloo, A.; Smith, R. Post Occupancy Evaluation in Higher Education. Procedia Eng. 2015, 118, 515–521. [Google Scholar] [CrossRef] [Scilit]
- Abisuga, A.O.; Wang, C.C.; Sunindijo, R.Y. A Holistic Framework with User-Centred Facilities Performance Attributes for Evaluating Higher Education Buildings. Facilities 2020, 38, 132–160. [Google Scholar] [CrossRef] [Scilit]
- Ezz, M.S.S.; Mahdy, M.A.F.A.; Baharetha, S.M.; Hassanain, M.A.A.; Gomaa, M.M.M. Post Occupancy Evaluation of Architectural Design Studio Facilities. Front. Built Environ. 2025, 11, 1549313. [Google Scholar] [CrossRef] [Scilit]
- Arzate Quintanilla, K.; Selim, G.; Birtill, P. Mapping architectural students’ perception on educational spaces: A guideline toward understanding spatial belonging. Archnet-IJAR Int. J. Archit. Res. 2026, 20, 257–275. [Google Scholar] [CrossRef] [Scilit]
- Wu, X.; Law, S.; Heath, T.; Borsi, K. Spatial Configuration Shapes Student Social and Informal Learning Activities in Educational Complexes. In Proceedings of the 11th International Space Syntax Symposium, Lisbon, Portugal, 3–7 July 2017; pp. 33.1–33.9. [Google Scholar]
- Papaioannou, G.; Volakaki, M.-G.; Kokolakis, S.; Vouyioukas, D. Learning Spaces in Higher Education: A State-of-the-Art Review. Trends High. Educ. 2023, 2, 526–545. [Google Scholar] [CrossRef] [Scilit]
- McDonald, D. Student Wants, Needs, Preferences, and Engagement with Learning in Social Informal Learning Spaces on Higher Education Institution Campuses. Ph.D. Thesis, University of Lancaster, Lancaster, UK, 2024. [Google Scholar] [CrossRef]
- Alzamil, W.; Salih, S.A.; Ismail, S.; Ajlan, A.; Azmi, A. Factors Affecting Social Learning in Nearby Pockets on Tropical Campus Grounds: Towards a Sustainable Campus. Sustainability 2023, 15, 16581. [Google Scholar] [CrossRef] [Scilit]
- Salih, S.A.; Ismail, S.; Ujang, N.; Mustafa, F.A.; Ismail, N.A. Pocket settings for enhancing social learning experience on campus ground: A verbal-visual preference survey. Ain Shams Eng. J. 2023, 14, 102134. [Google Scholar] [CrossRef] [Scilit]
- Li, J.; Koohsari, M.J.; Kaczynski, A.T.; Tanimoto, R.; Watanabe, R.; Nakaya, T.; Luo, Y.; Zhao, J.; Yasunaga, A.; Oka, K.; et al. The built environment and place attachment: Insights from Japanese cities. Prev. Med. Rep. 2025, 50, 102969. [Google Scholar] [CrossRef] [Scilit]
- Meraz, F.; Holguin, B.; Elizondo, J. High School Students’ Perceptions of Flexible Classrooms: An Analysis of Attention, Motivation, Interaction, and Comprehension. Rev. Electrón. Educ. 2026, 30, 1–16. [Google Scholar] [CrossRef] [Scilit]
- Baars, S.; Schellings, G.L.M.; Krishnamurthy, S.; Joore, J.P.; den Brok, P.J.; van Wesemael, P.J.V. A framework for exploration of relationship between the psychosocial and physical learning environment. Learn. Environ. Res. 2021, 24, 43–69. [Google Scholar] [CrossRef] [Scilit]
- Hussein, A.; Mustafa, F. Architecture Students Self-Report Wellbeing Assessment Based On Quality Learning Environment in Design Studio. Cihan Univ.-Erbil Sci. J. 2023, 7, 21–28. [Google Scholar] [CrossRef] [Scilit]
- Bay-Sahin, E.; Shah, N. Optimising Architectural Studio Spaces: Applying a Psychological Needs Framework to Enhance Student Well-Being. SAGE Open 2026, 16, 21582440251407947. [Google Scholar] [CrossRef] [Scilit]
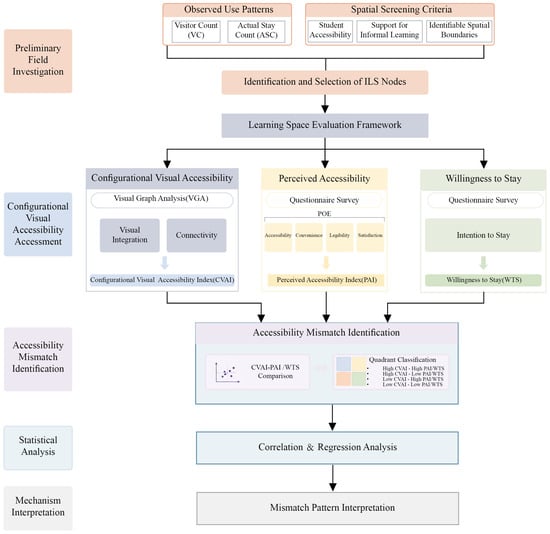
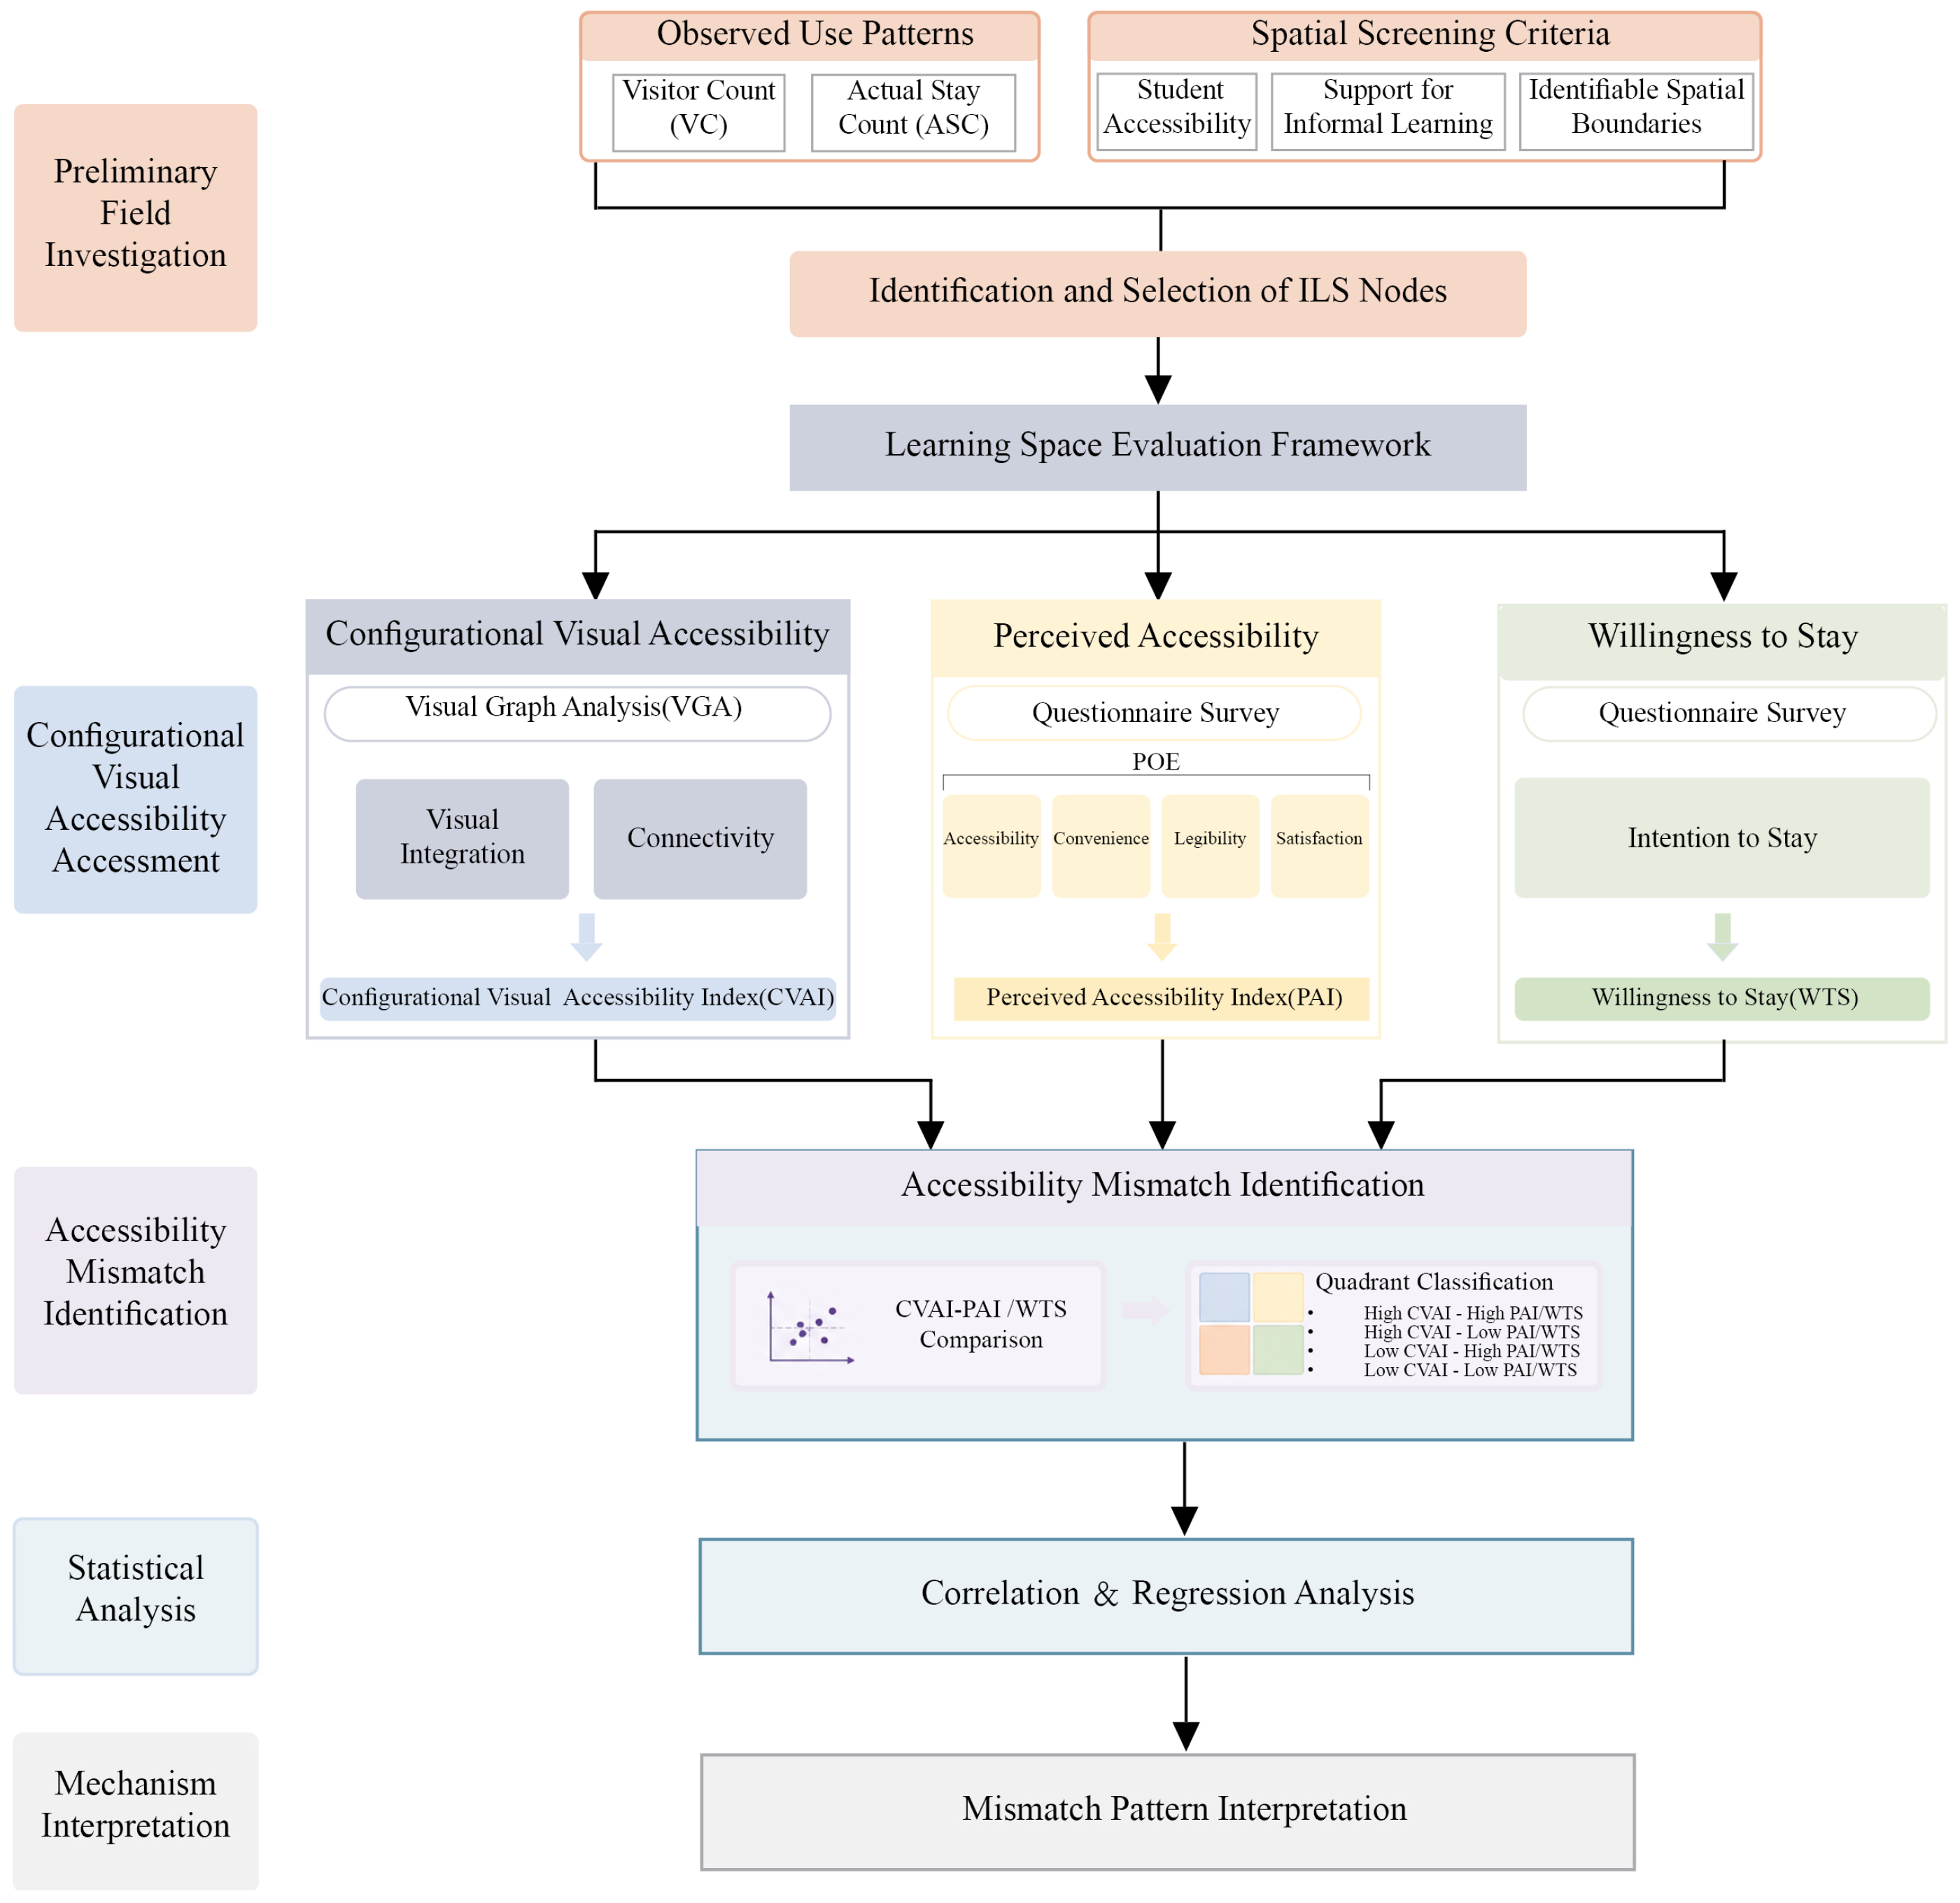
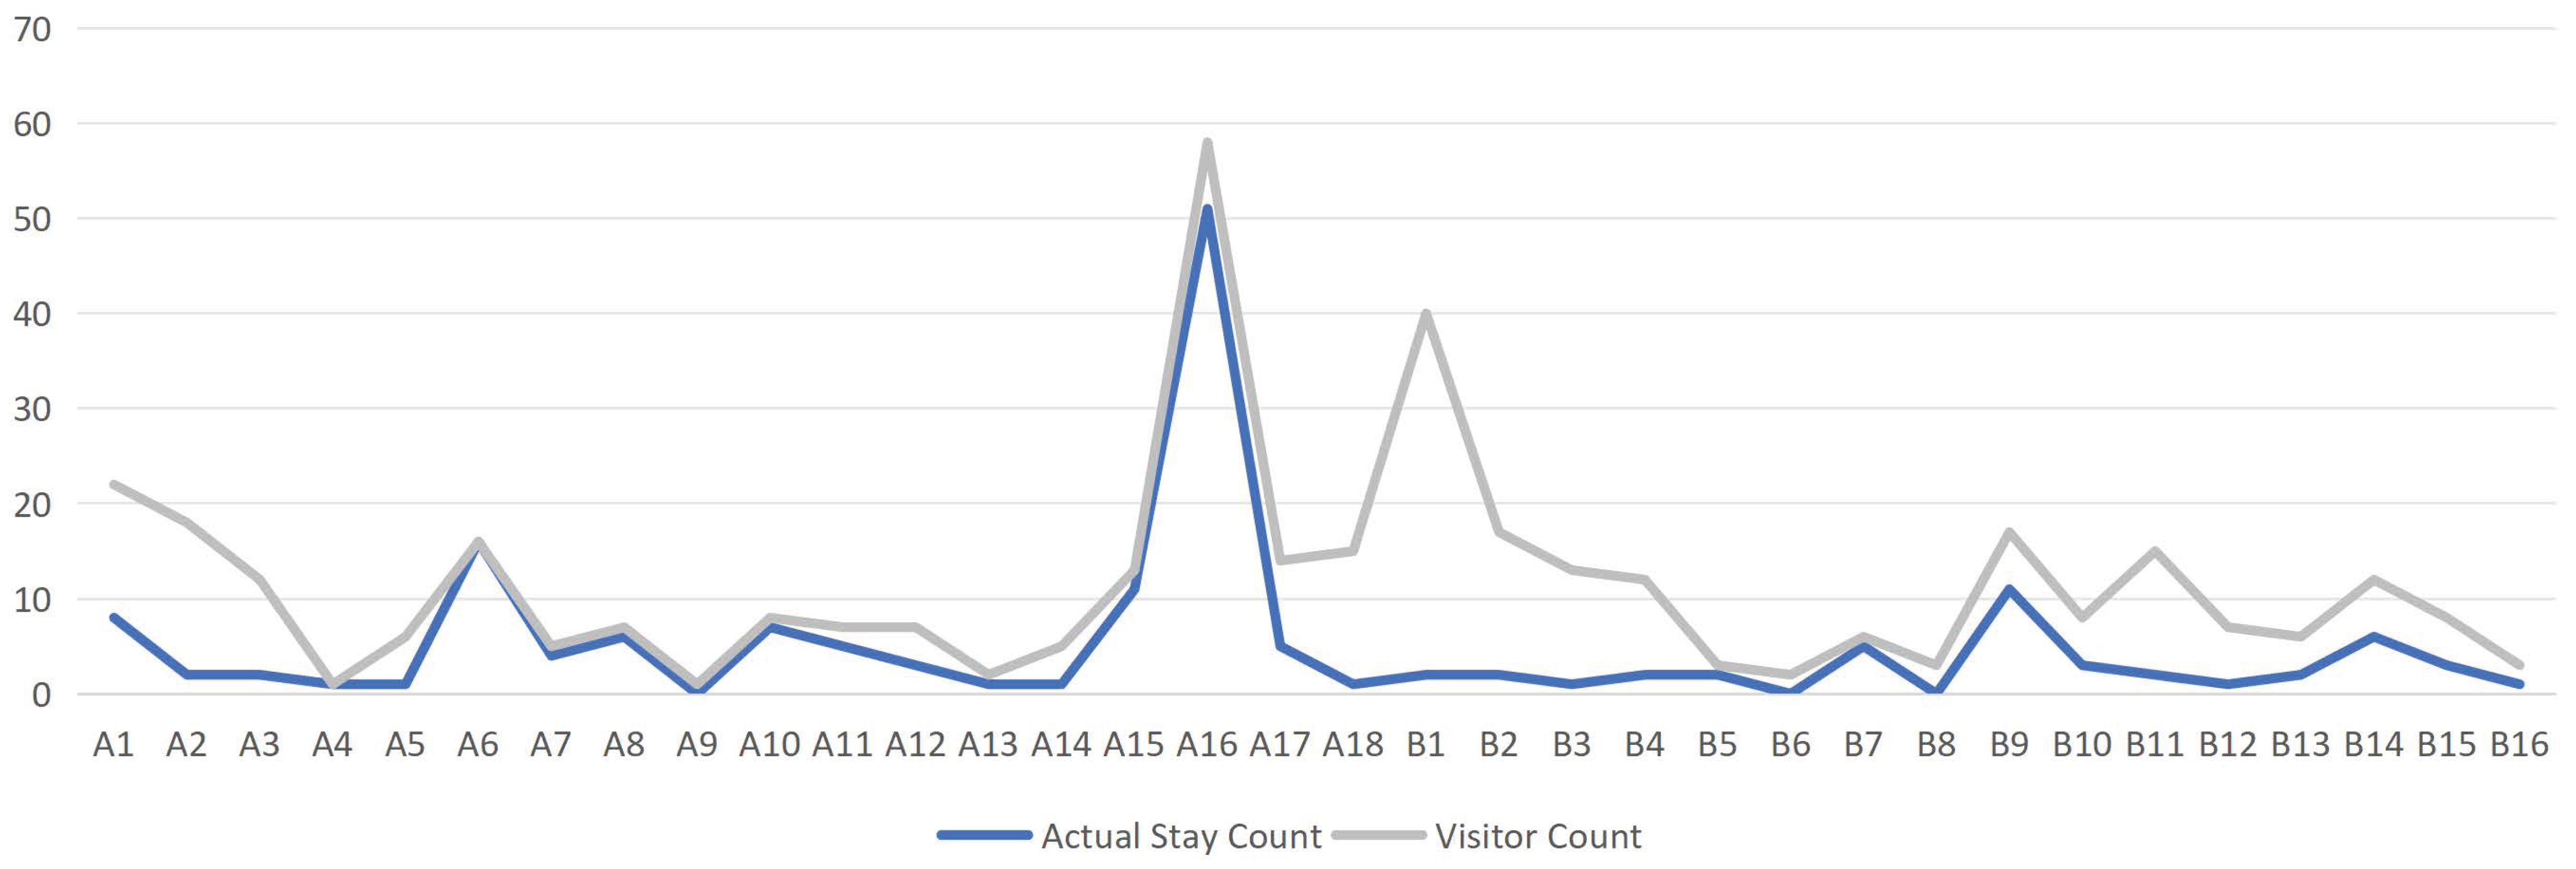
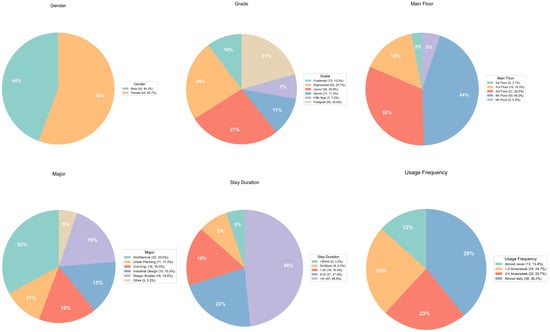
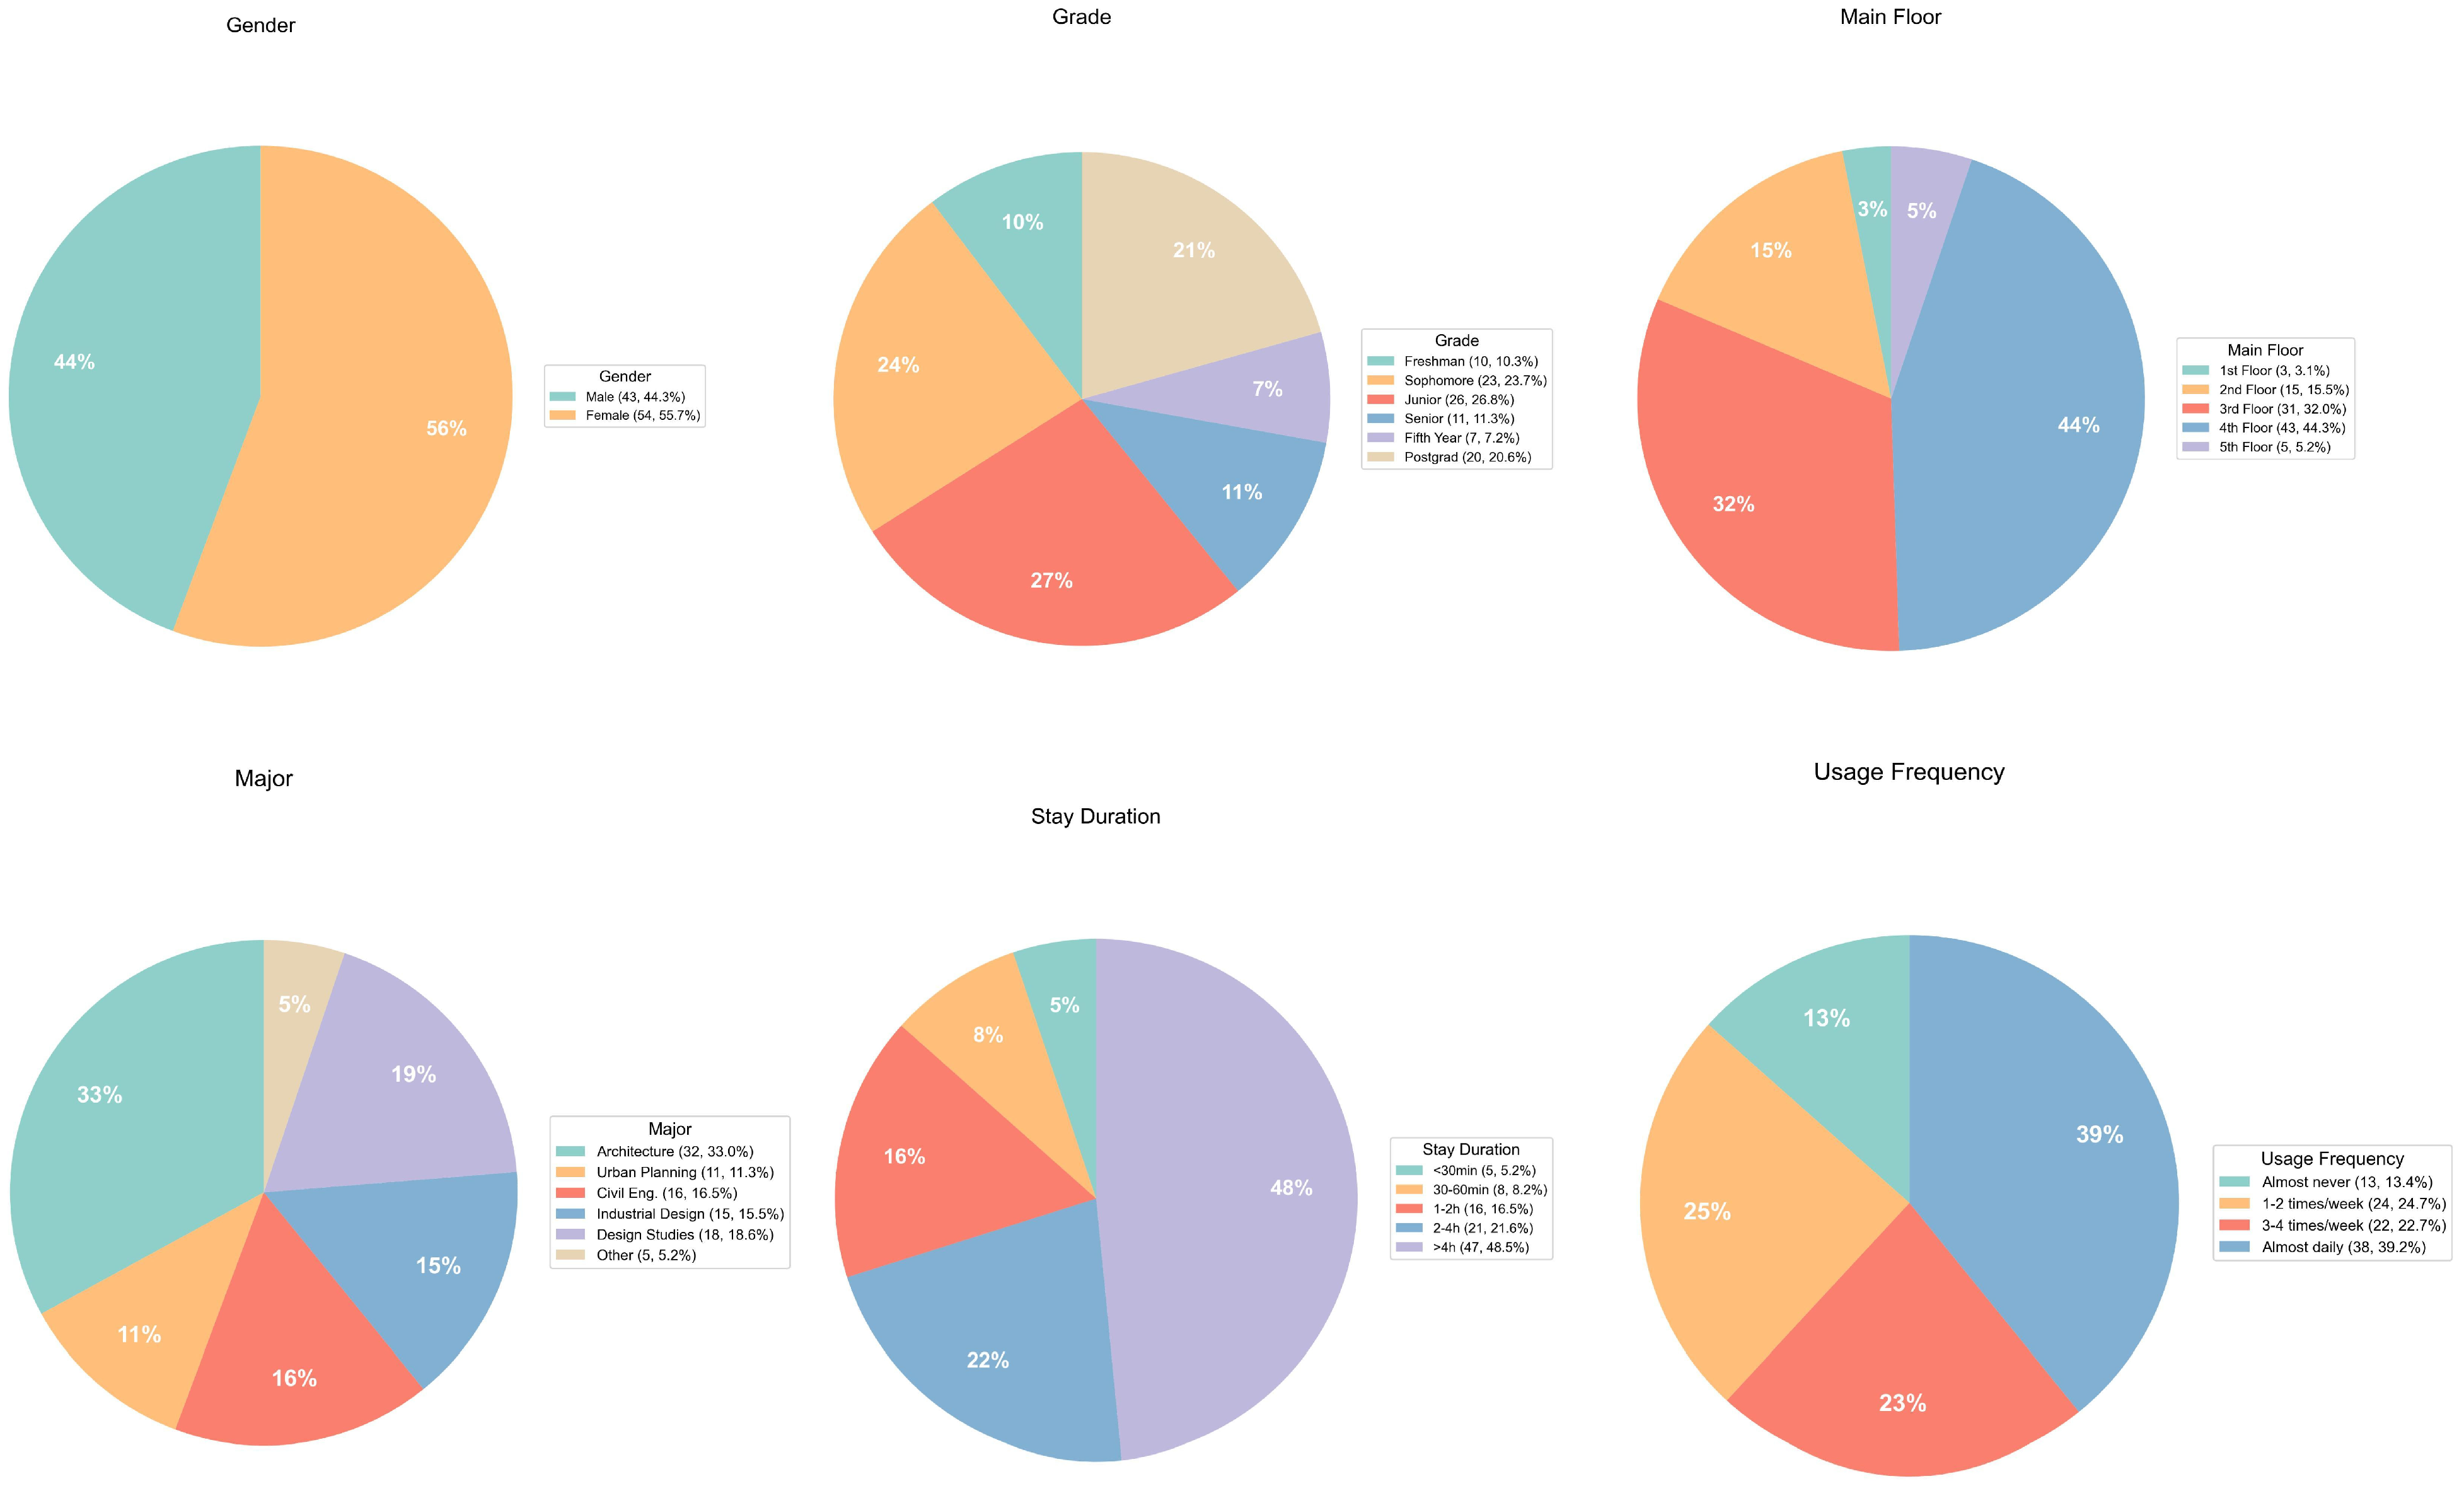
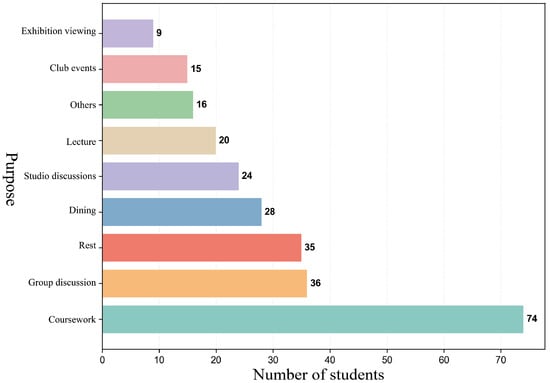
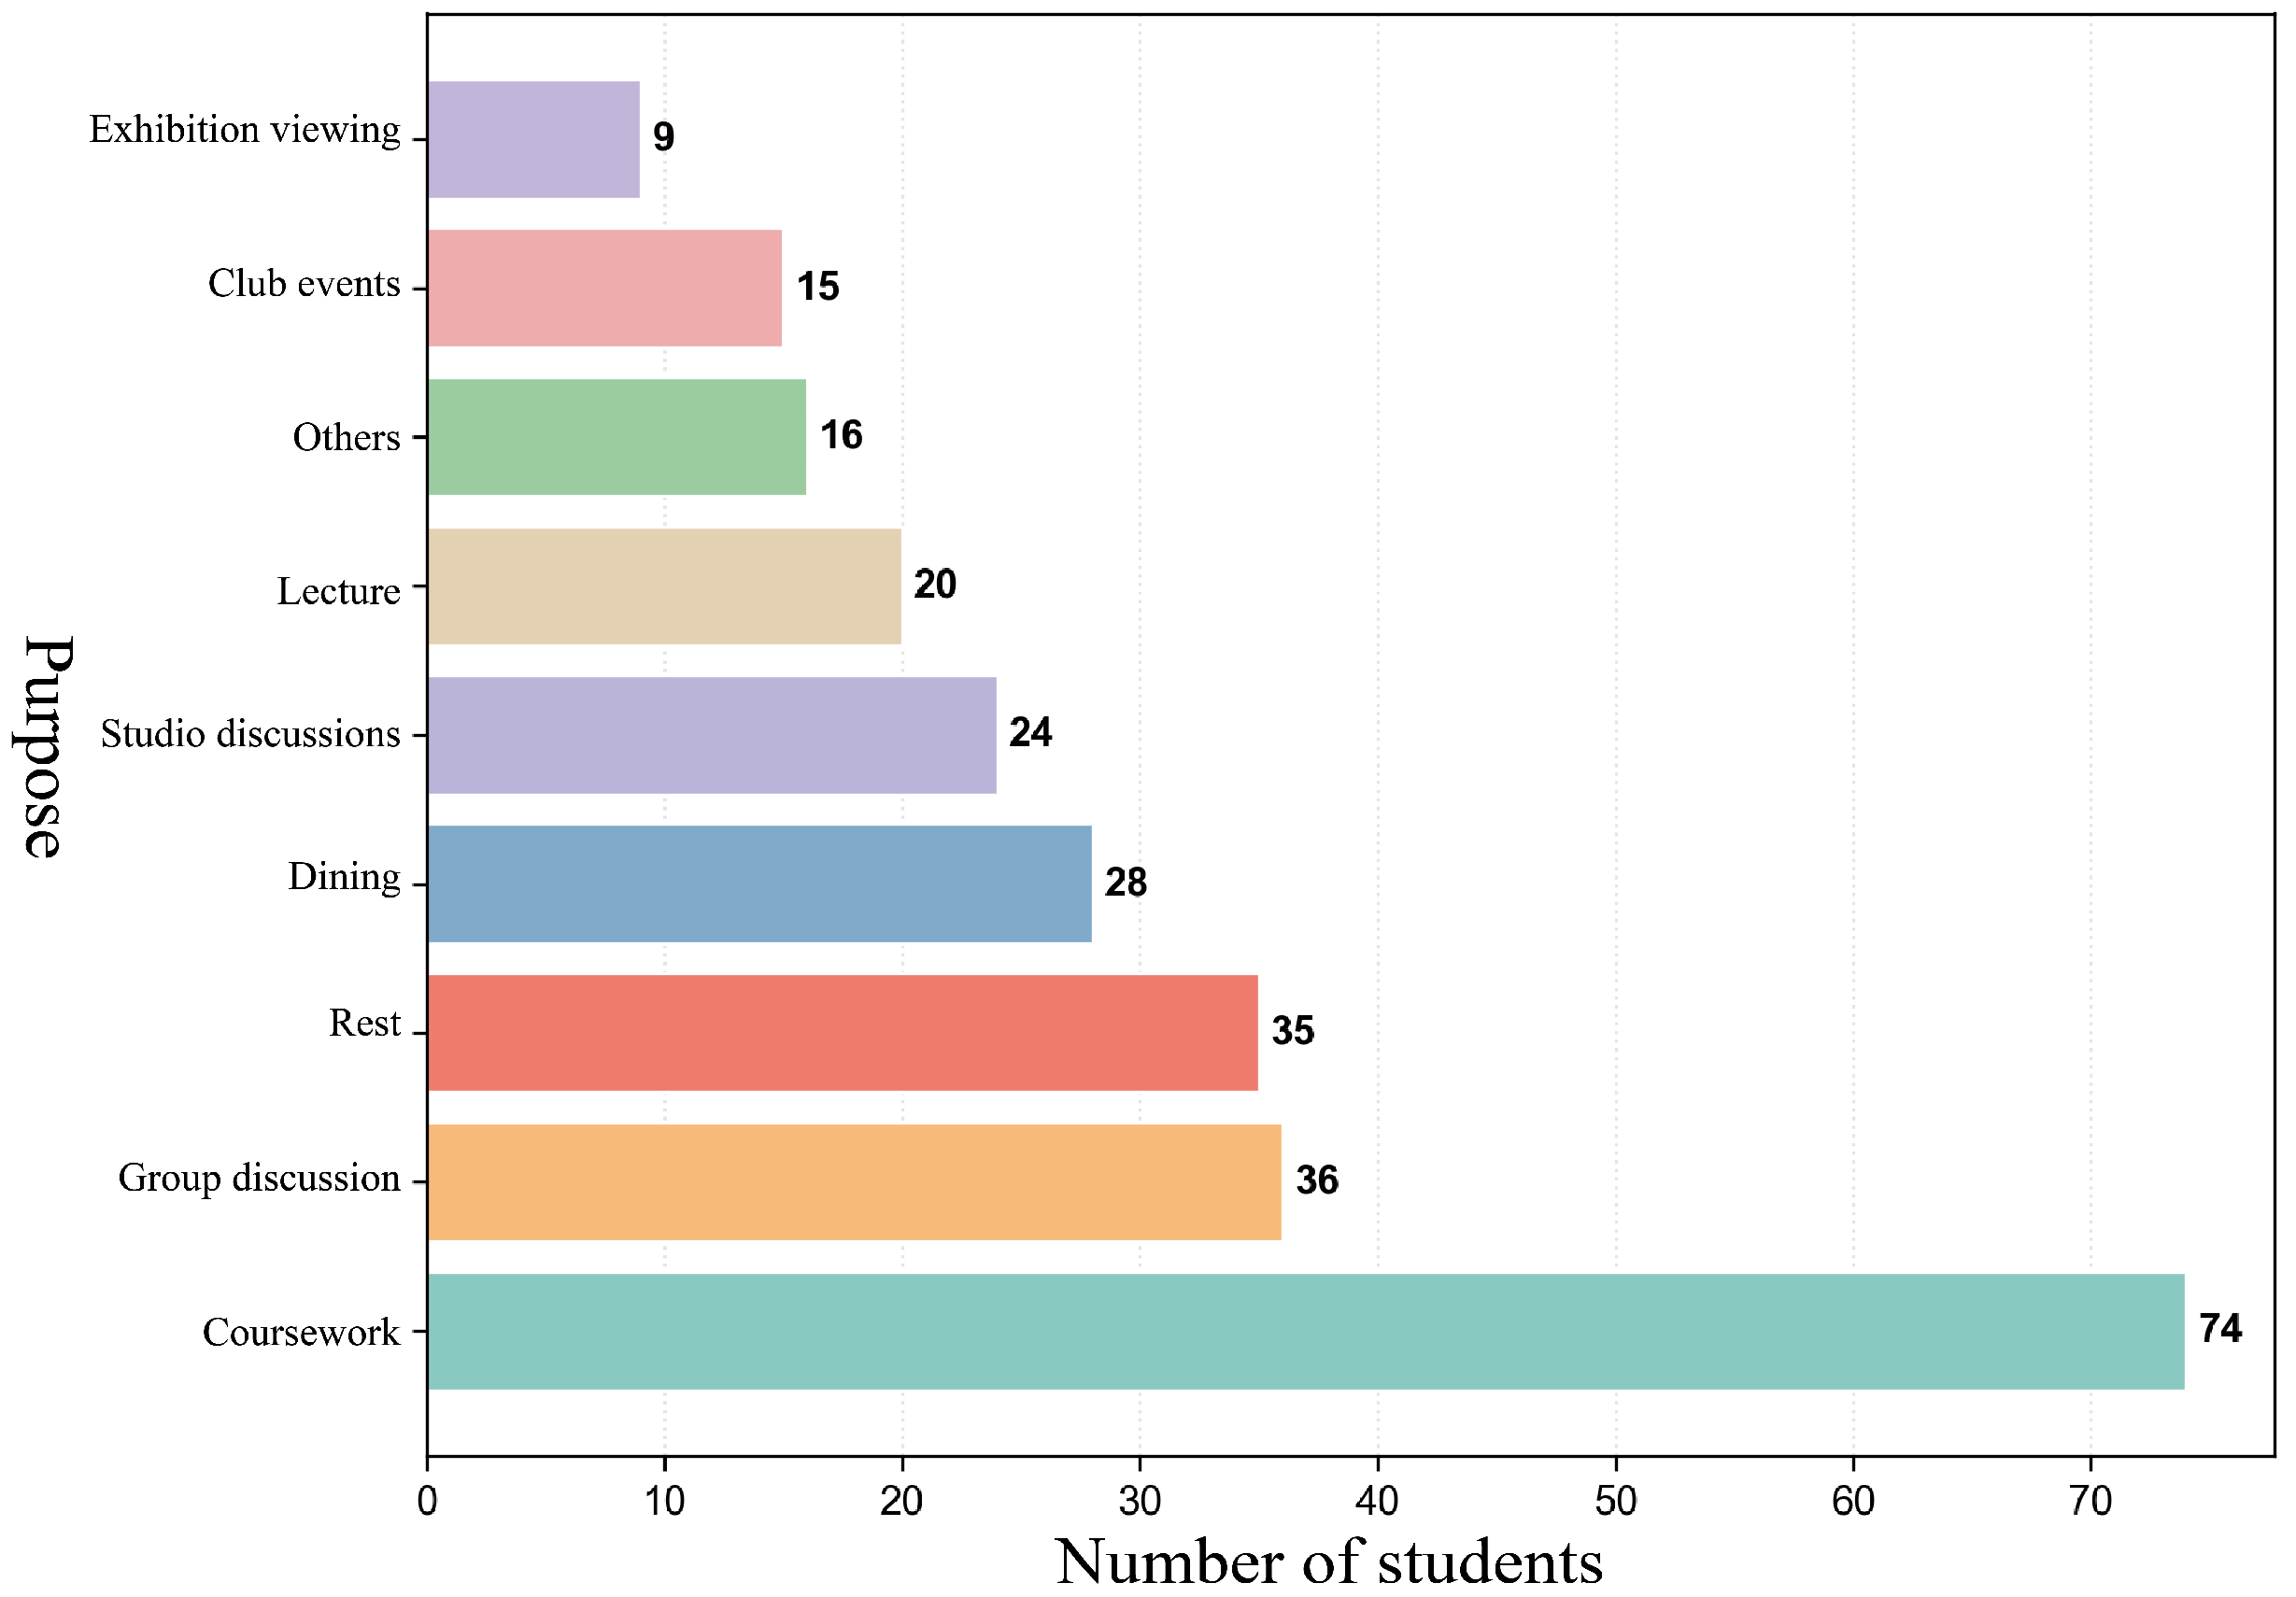
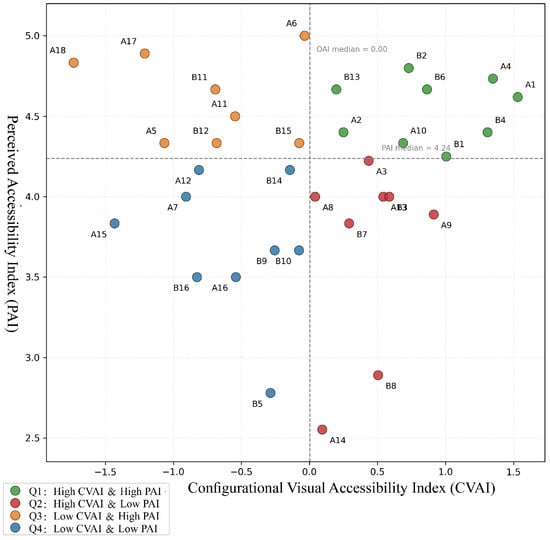
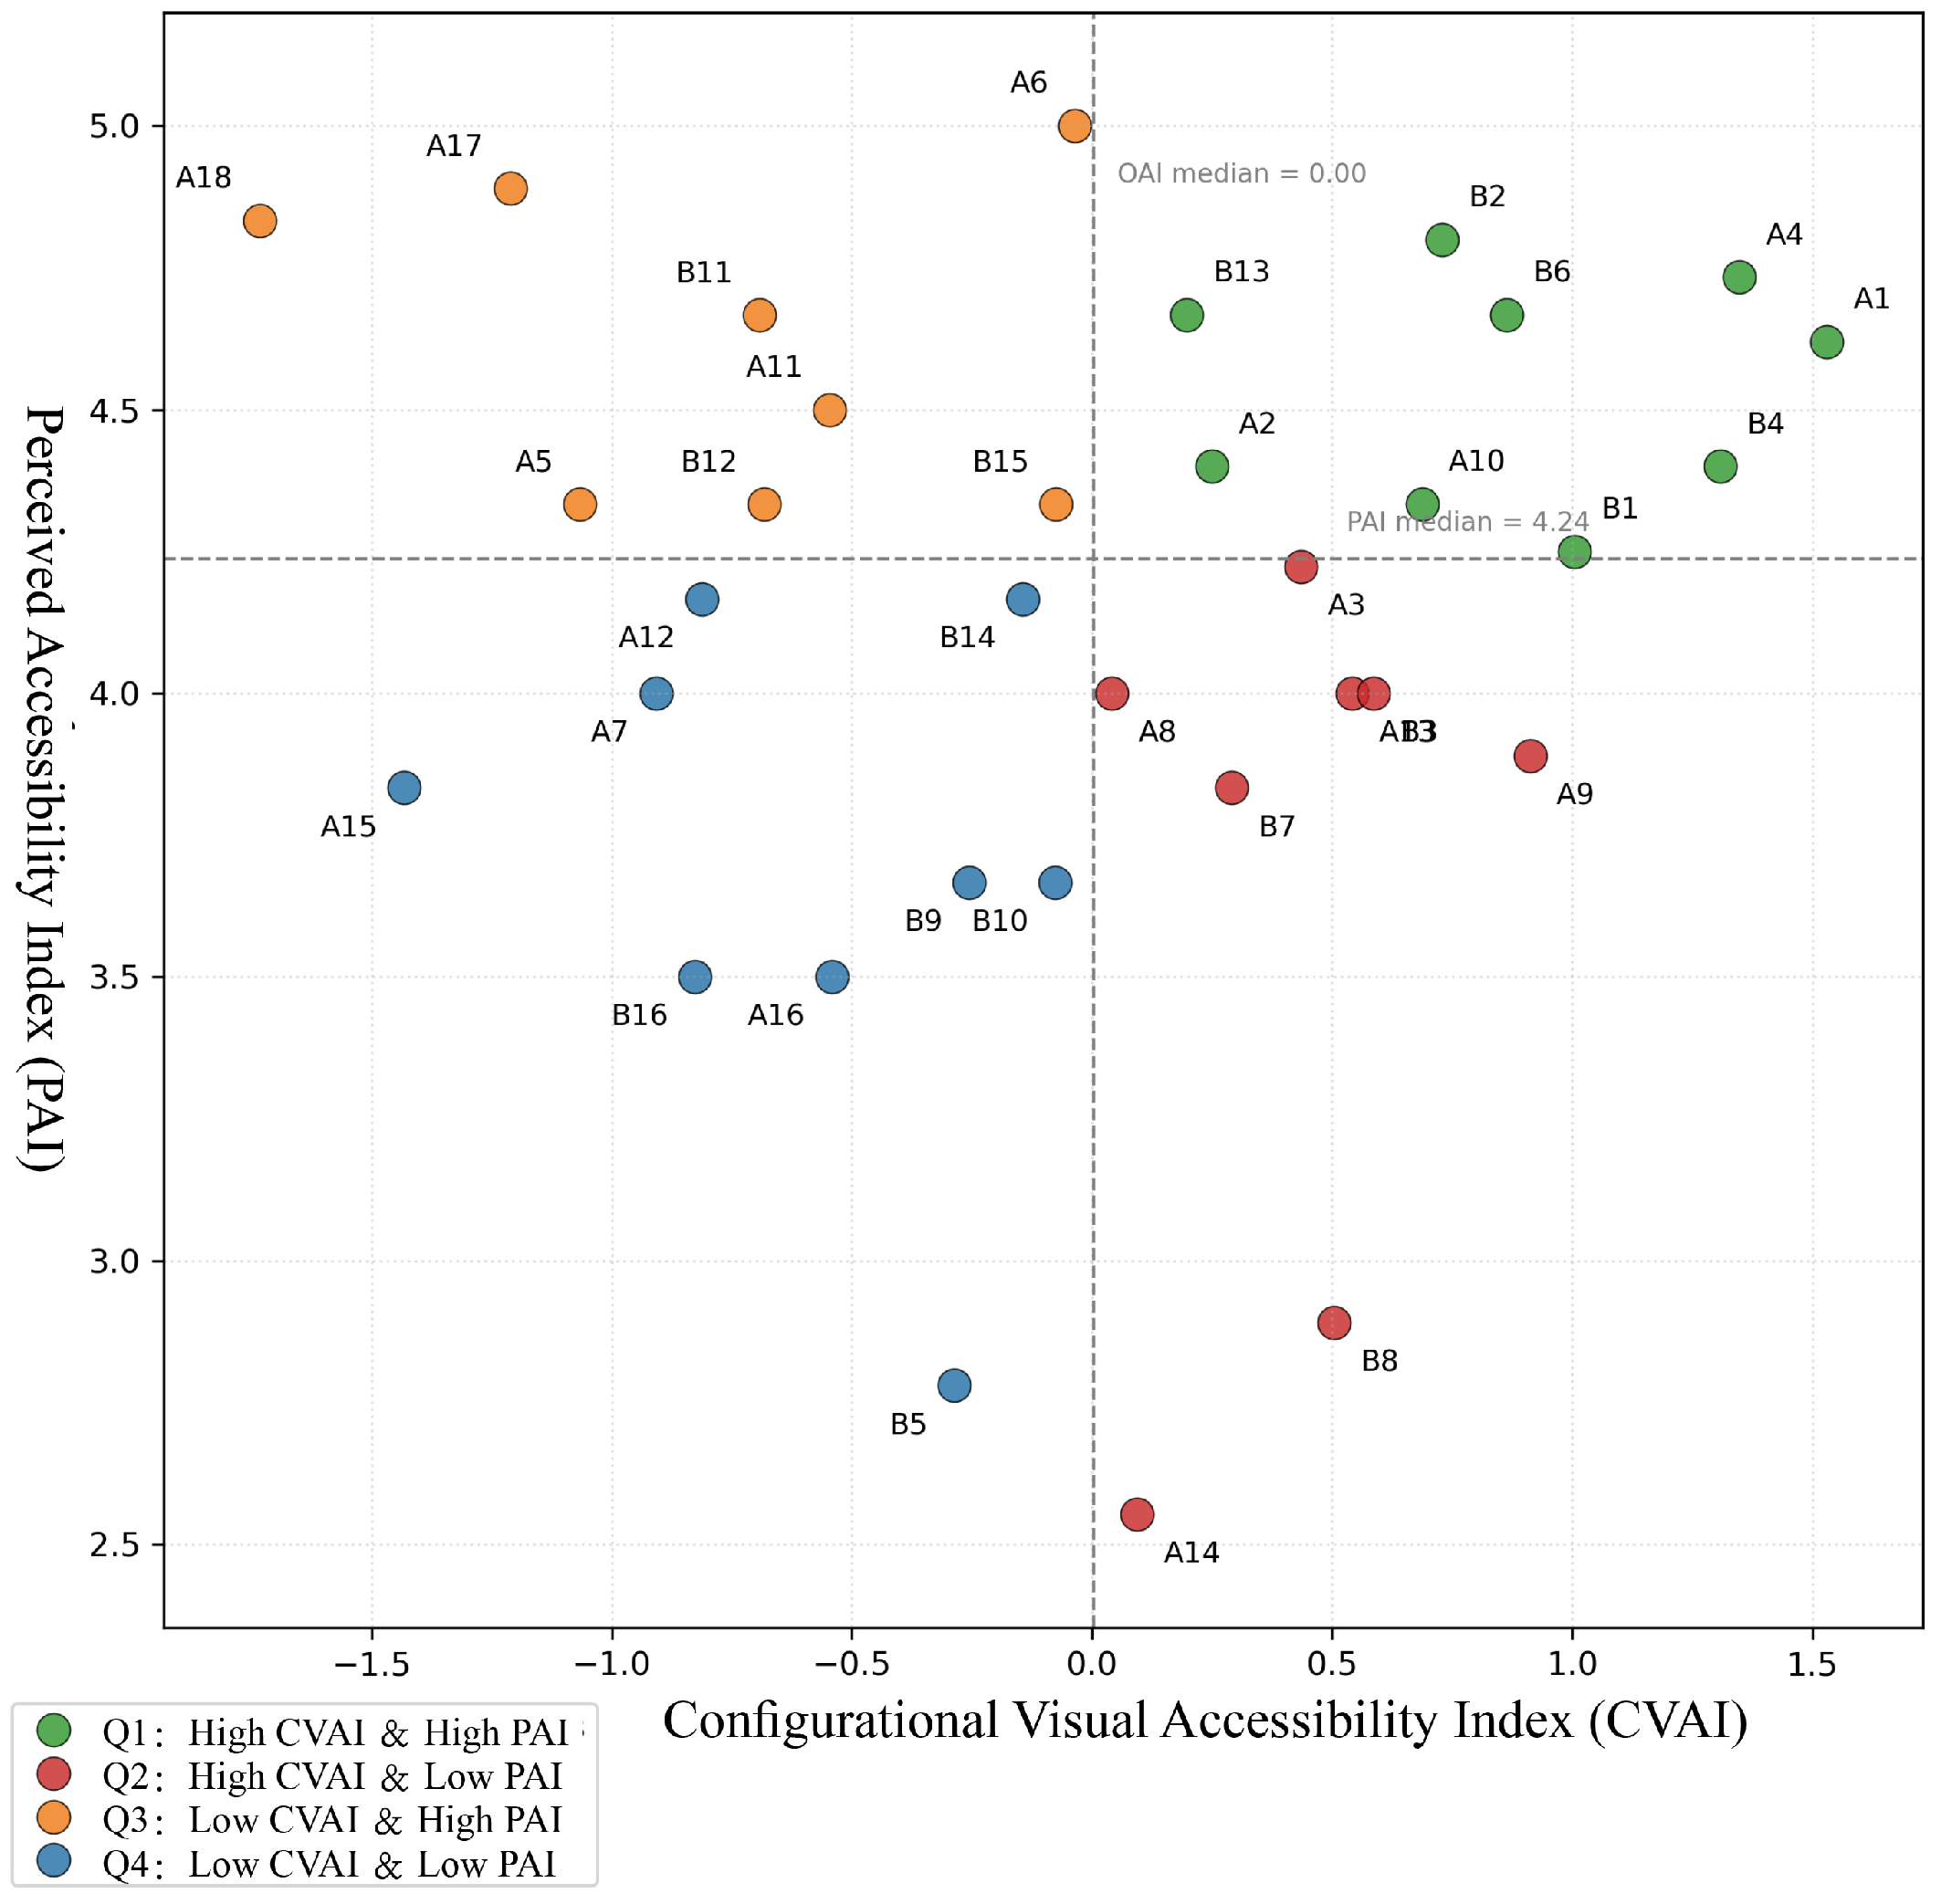
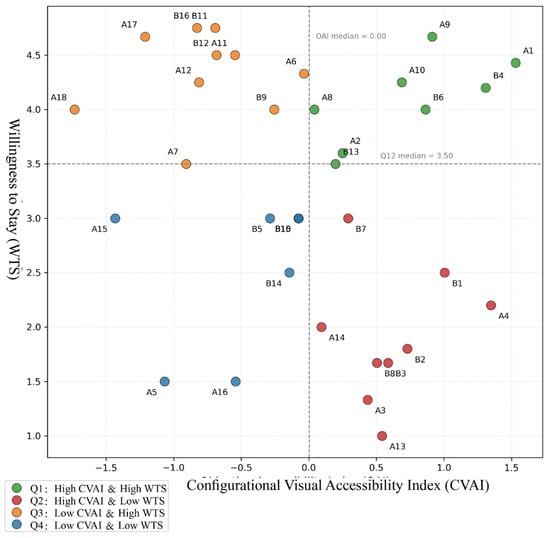
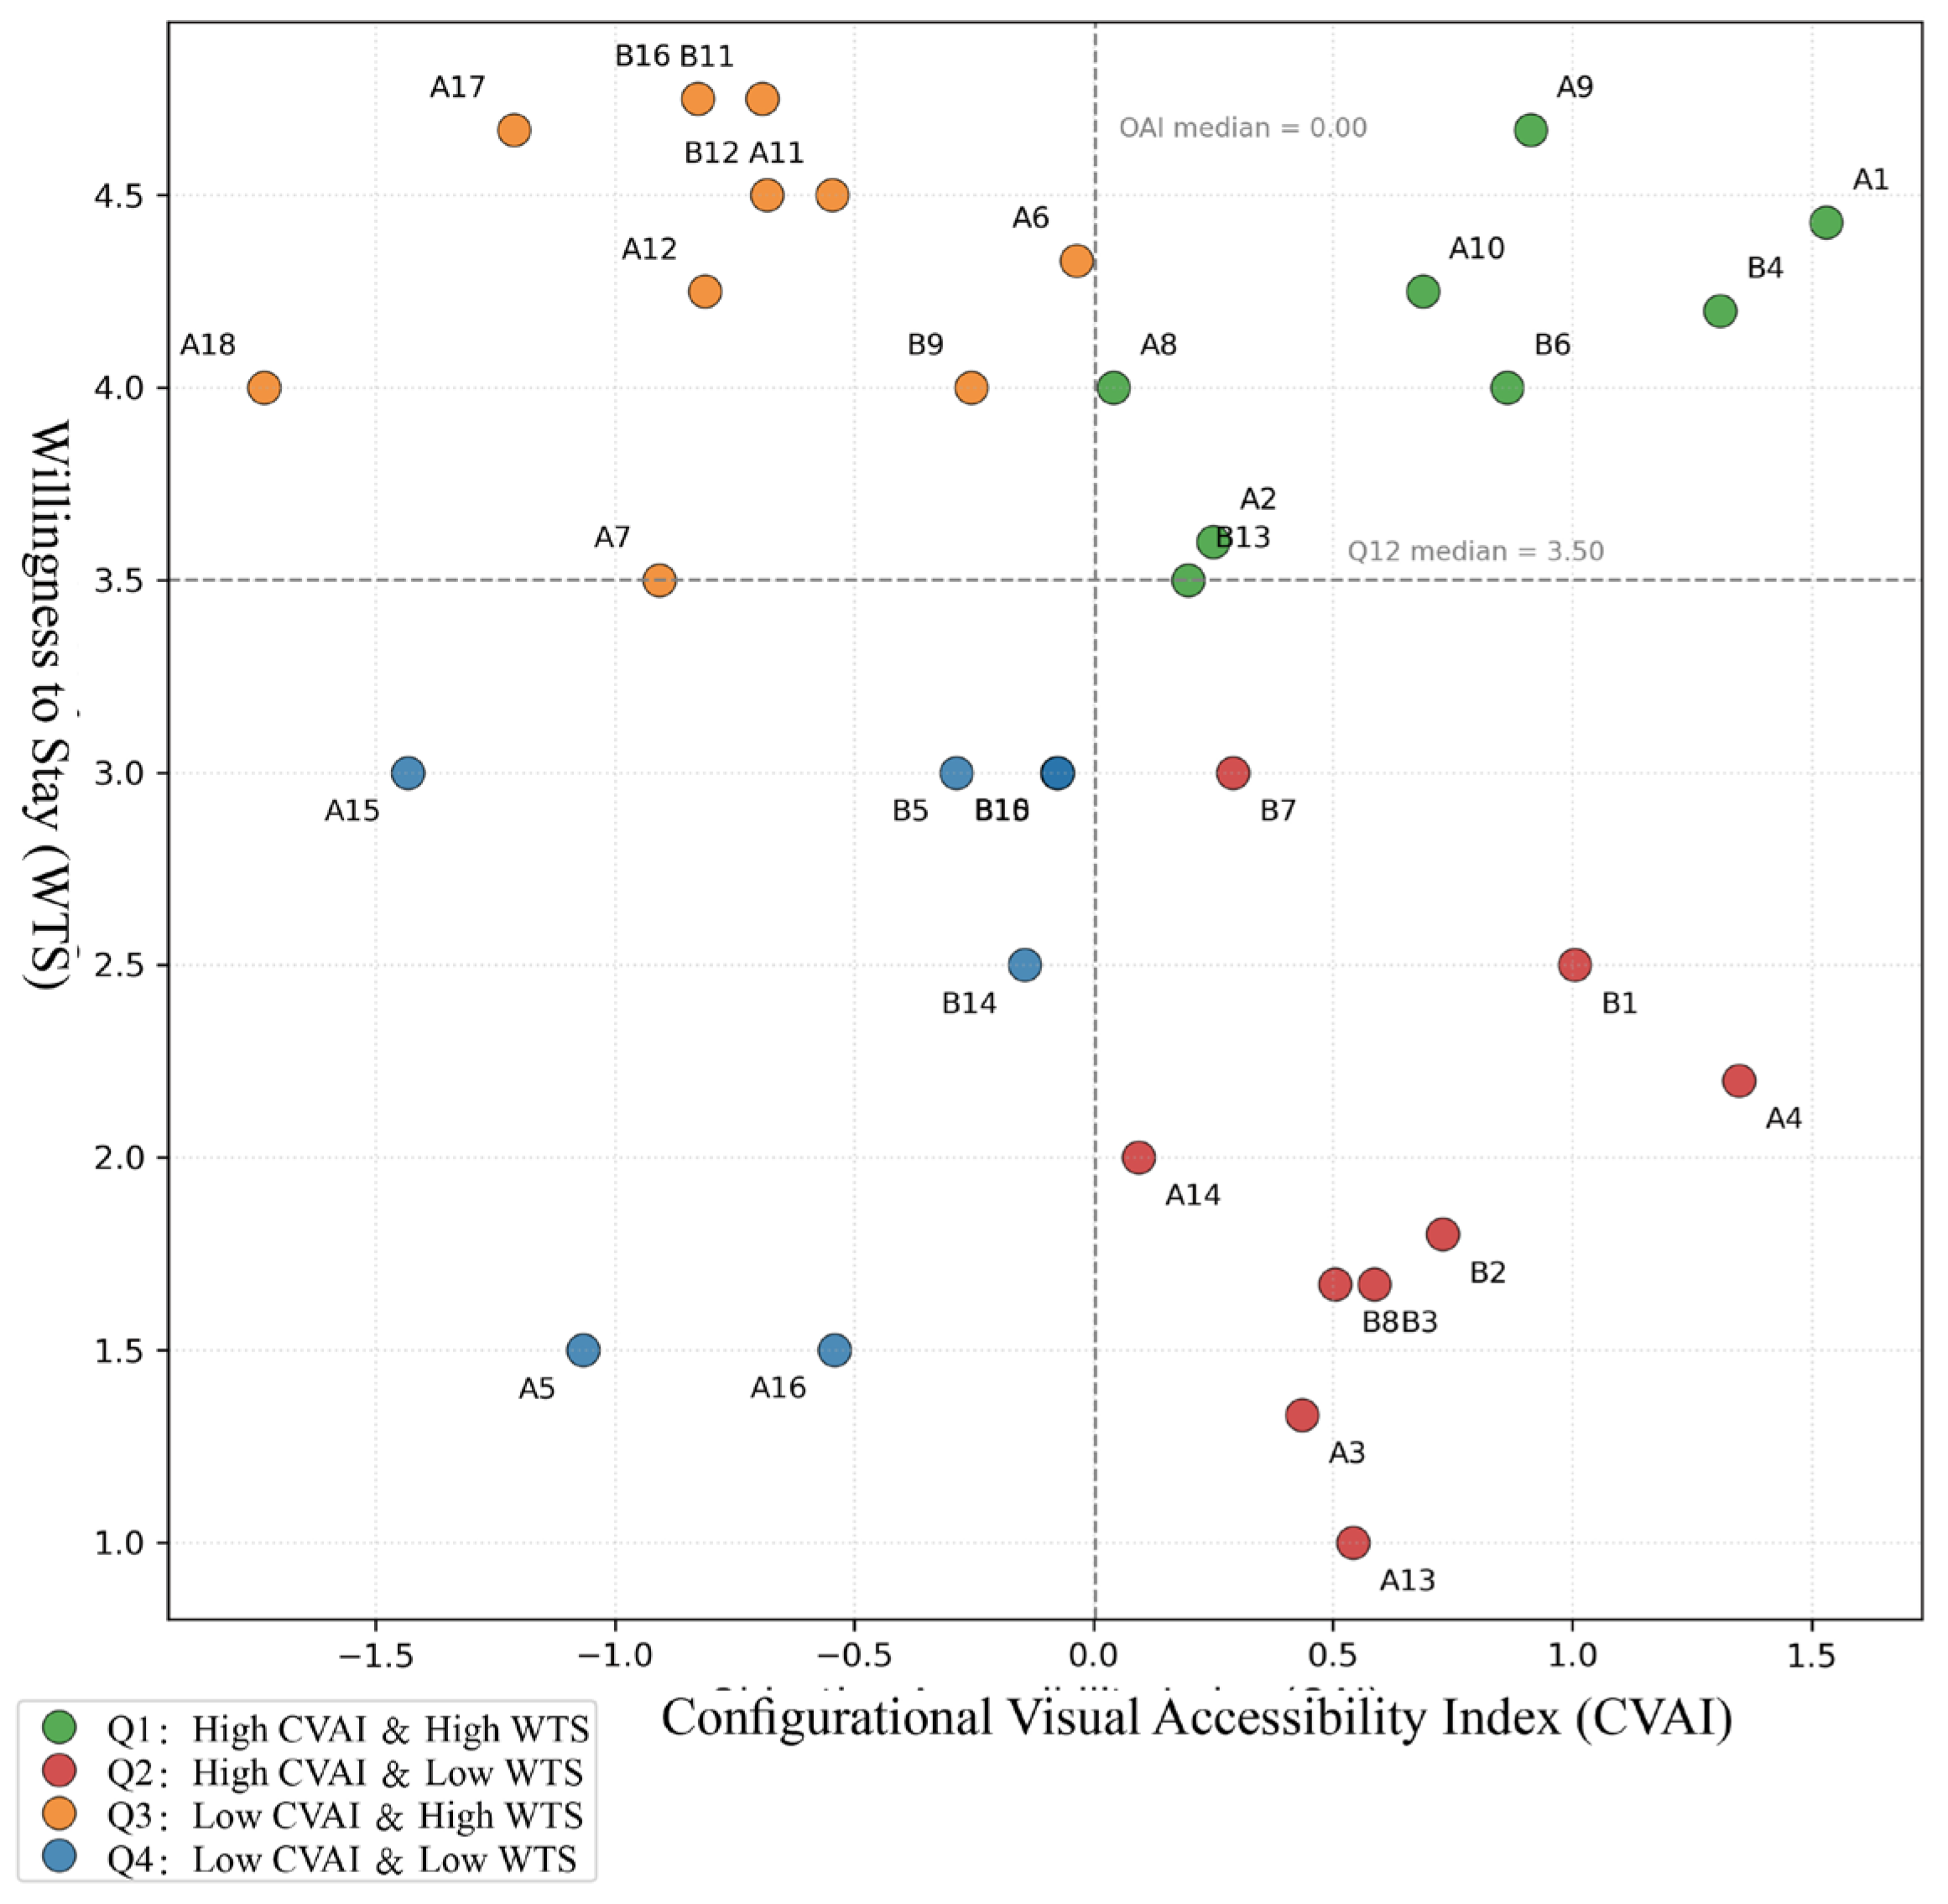
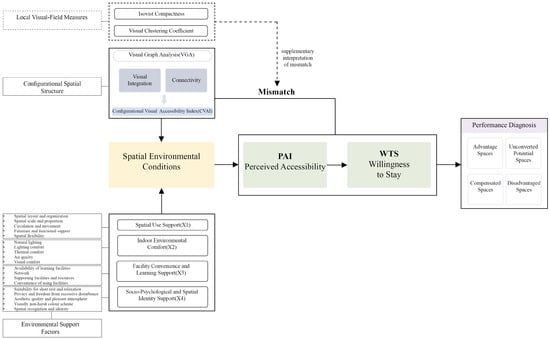
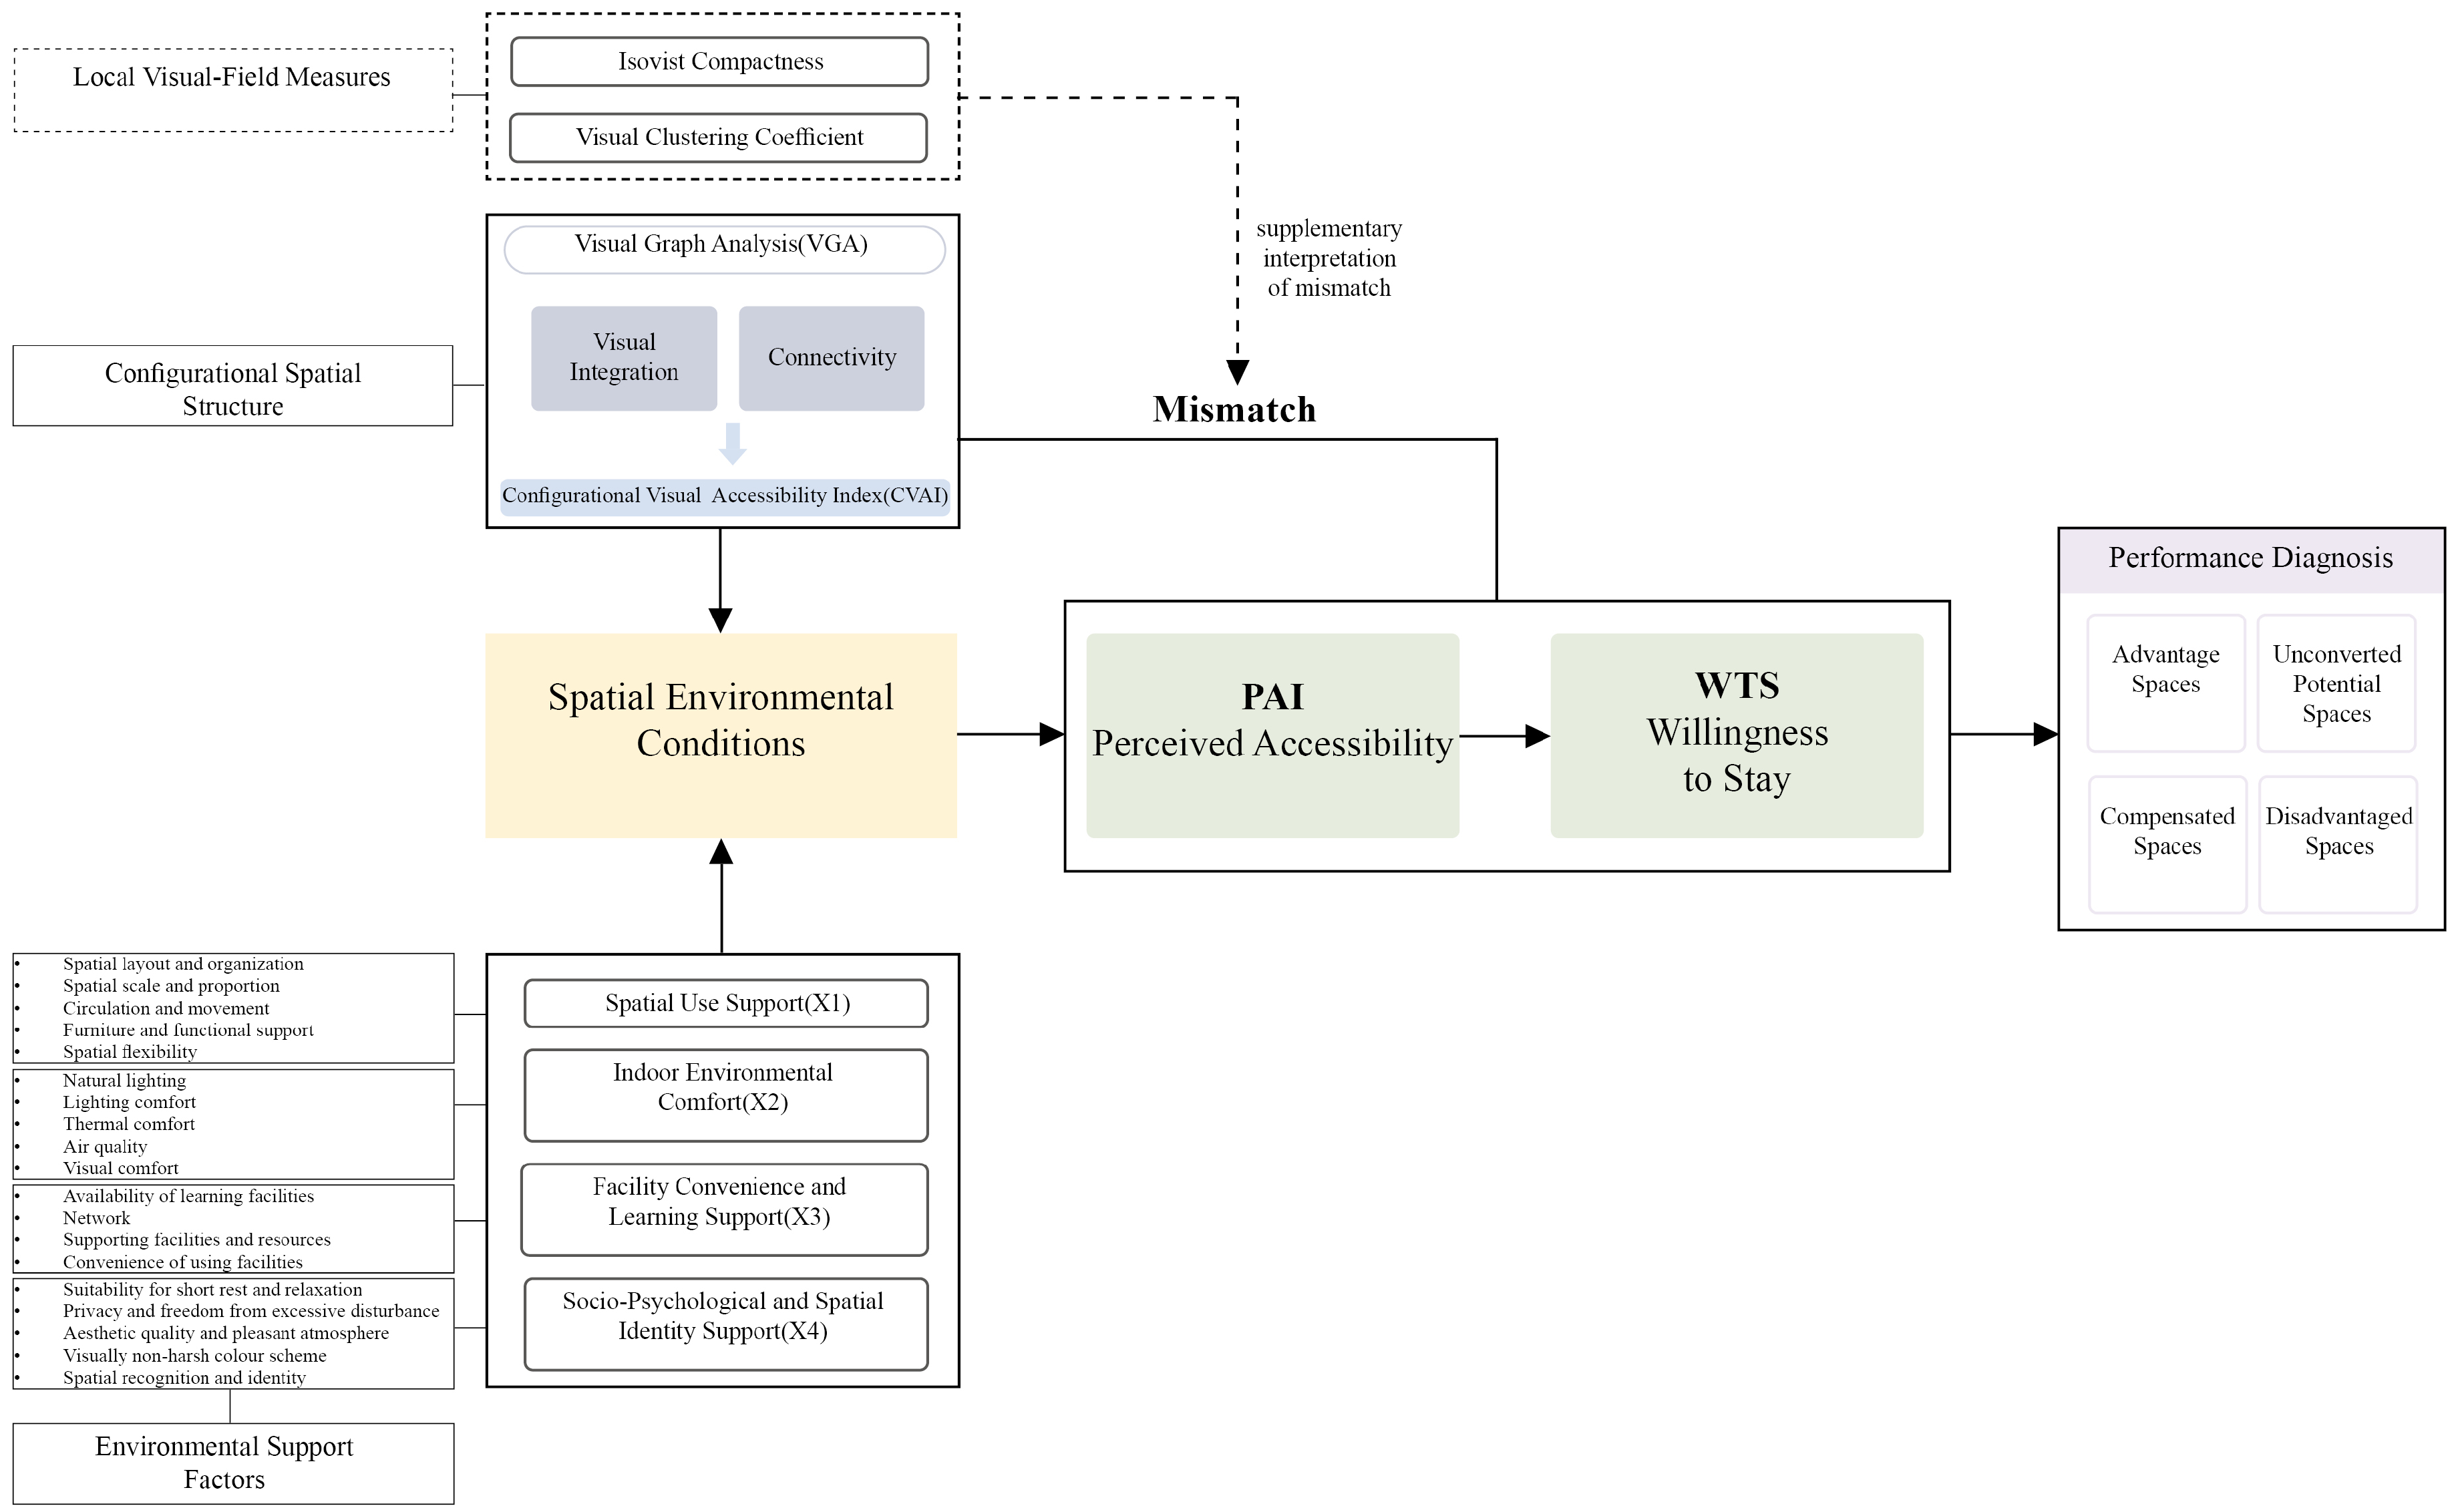

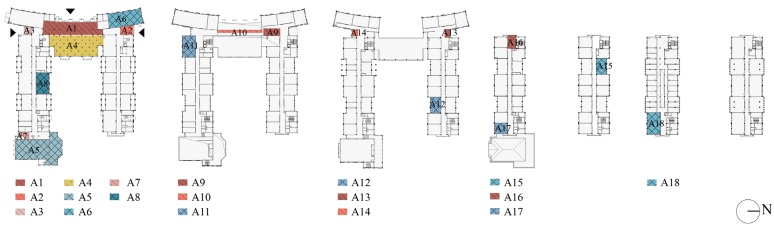
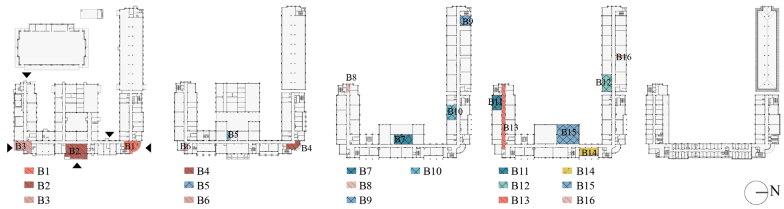
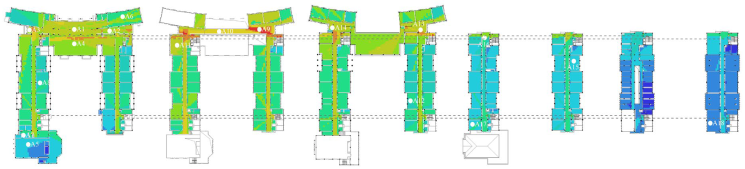
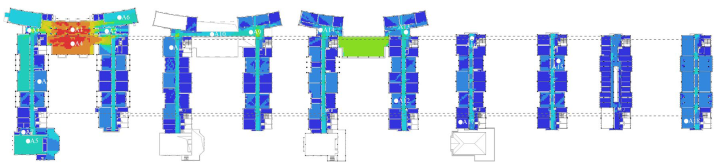
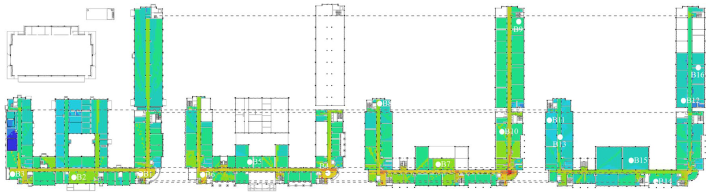
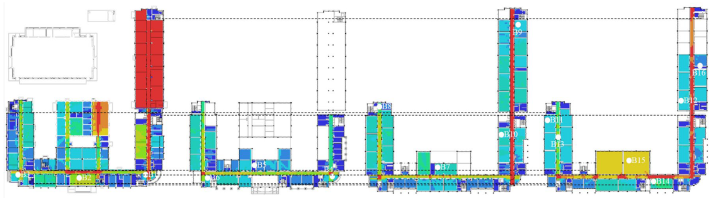
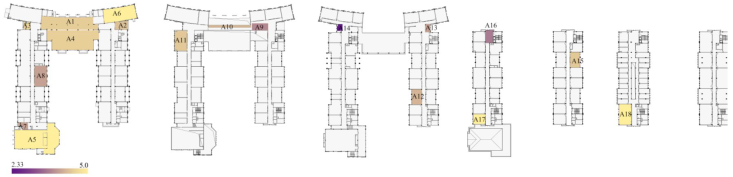
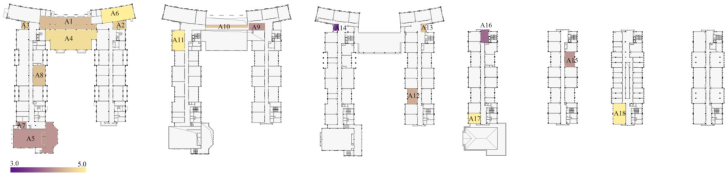
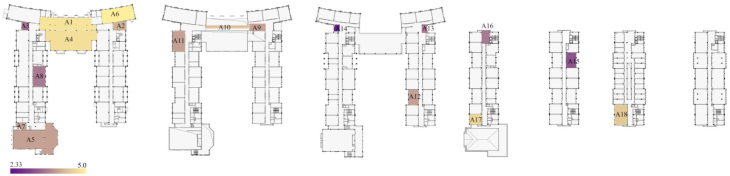
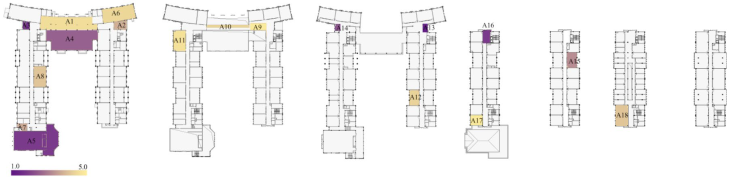
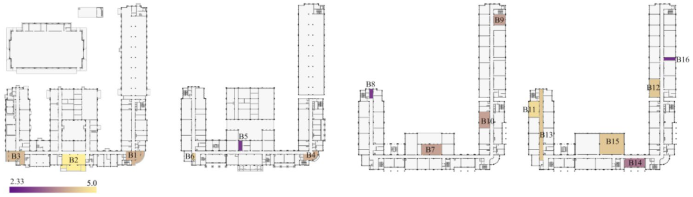
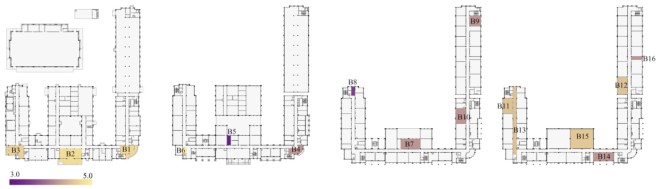
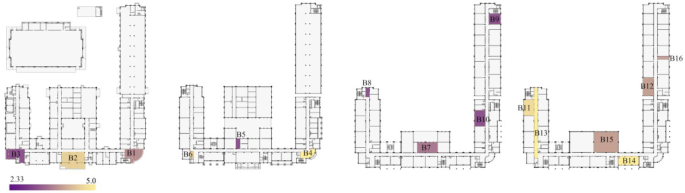
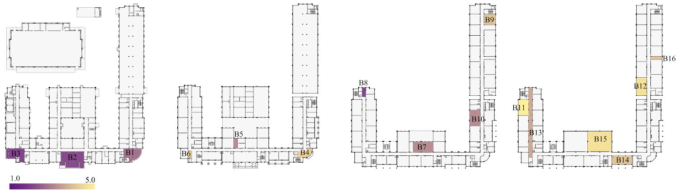
Disclaimer/Publisher’s Note: The statements, opinions and data contained in all publications are solely those of the individual author(s) and contributor(s) and not of MDPI and/or the editor(s). MDPI and/or the editor(s) disclaim responsibility for any injury to people or property resulting from any ideas, methods, instructions or products referred to in the content. |
© 2026 by the authors. Licensee MDPI, Basel, Switzerland. This article is an open access article distributed under the terms and conditions of the Creative Commons Attribution (CC BY) license.