


Abstract
Vertical surface light sources, widely applied in public spaces, easily trigger discomfort glare due to direct visual exposure. As a core lighting parameter, background luminance () strongly regulates glare perception, yet relevant research mainly focuses on single-variable analysis for horizontal lighting. The mechanisms through which influences discomfort glare in the presence of vertical surface light sources remain insufficiently understood. This study takes , and vertical light source luminance ()-induced luminance contrast () as core variables, and combines subjective glare assessment and pupil diameter monitoring to explore their independent and coupled effects on vertical glare perception and visual adaptation. The results indicate that , , and their interaction all exert significant effects on subjective glare perception. The interaction effect suggests that the glare induced by one factor intensifies as the level of the other factor increases. In addition, the luminance of vertical light sources influences visual adaptation levels. Vertical illuminance at the eye () shows a stronger association with subjective glare responses under the present experimental conditions, supporting its potential as a saturation-related indicator for vertical surface light sources. Among the variables examined, exerts the strongest influence on discomfort glare. Furthermore, the pupil diameter change rating (PDCR) shows higher sensitivity to subtle visual stress under low conditions. These findings provide preliminary support for refining discomfort glare evaluation of vertical surface light sources and inform future research on their application and design across diverse lighting environments.
1. Introduction
Architectural lighting design plays a critical role in balancing visual comfort and energy efficiency. Glare, as a common adverse effect of lighting environments, directly affects users’ health, work efficiency, and spatial experience [1,2,3,4,5]. The International Commission on Illumination (CIE) defines discomfort glare as “illumination conditions that reduce visual comfort but do not necessarily impair visual function” [6]. Its quantitative assessment remains a central challenge in efforts to improve the quality of architectural lighting environments [7,8,9]. With the increasing integration of lighting and architecture, the application of vertical light sources has become more widespread [10,11]. However, the glare mechanisms associated with these sources differ from those of traditional horizontal lighting and require systematic investigation.
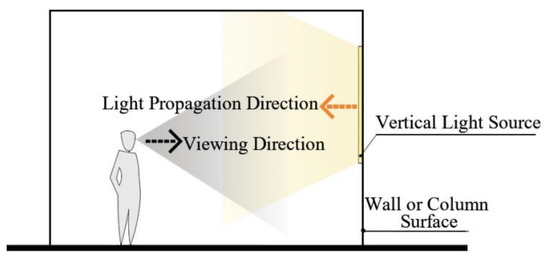
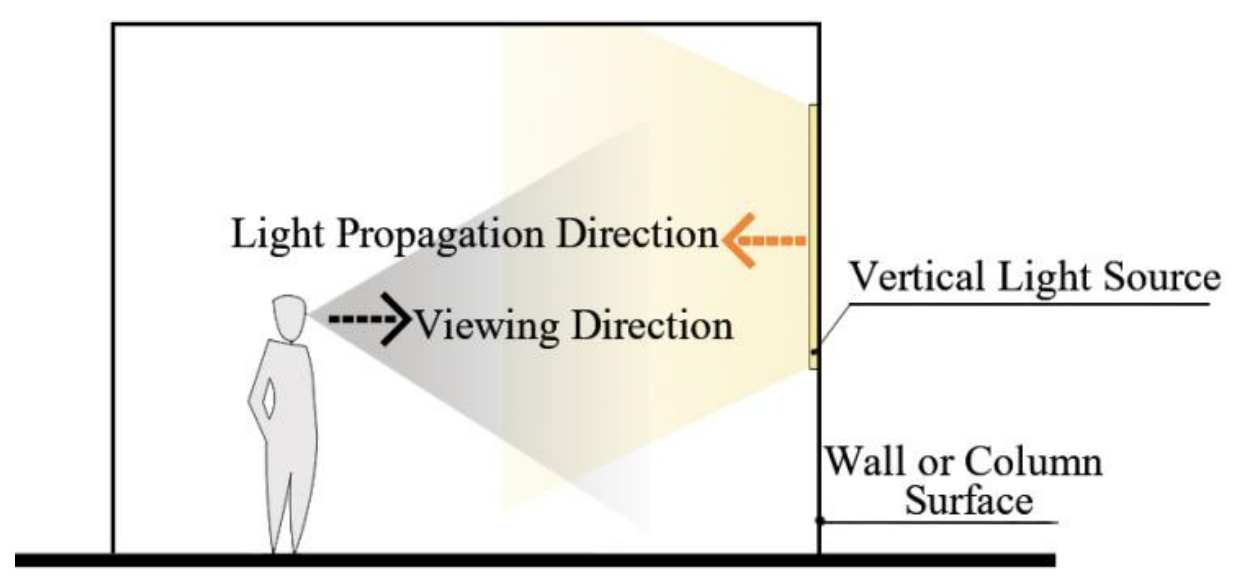
In this study, vertical surface light sources refer specifically to artificial lighting installations, in which luminaires are mounted on vertical building surfaces, with their emitting surfaces oriented perpendicular to the observer’s horizontal line of sight (as shown in Figure 1). Vertical surface light sources are characterized by a luminous surface with defined length and width, distinguishing them from point and line light sources. Unlike conventional horizontal light sources, the design and application of vertical light sources emphasize their impact within the central visual field; when improperly implemented, they may induce direct glare [12]. Currently, research on indoor discomfort glare in artificial lighting environments has predominantly focused on horizontal illumination, particularly scenarios in which the primary illuminated surface is horizontal. Typical examples include studies examining the effects of discomfort glare on indoor activities such as office work [2,13], reading [14], exhibitions [15], and other indoor activities. Unified Glare Rating, or UGR, the most widely used discomfort glare evaluation metric [16], was also developed based on such horizontal lighting conditions. Research on glare from vertical surfaces has primarily concentrated on the quantification and evaluation of daylight glare through building openings such as windows [17,18,19], whereas studies addressing the mechanisms and evaluation of discomfort glare from artificial vertical light sources remain limited. Given that vertical surface light sources function both as architectural elements and as luminaires, they exhibit distinct visual characteristics. To address this gap, a series of exploratory studies have been conducted. Previous work [11,20,21] indicates that vertical light sources, such as luminous walls and integrated luminous surfaces, can produce diverse visual responses due to variations in installation height, viewing angle, and spatial light distribution. These factors may, in turn, lead to discrepancies in the predictive performance of existing glare evaluation models.
Figure 1.
Application of vertical light.
Among these factors, ambient/background luminance (Lb), a key parameter influencing the spatial distribution of brightness within an environment [22], is a critical determinant of discomfort glare perception. It is primarily used to characterize the level of visual adaptation of the human eye to a given lighting condition [23]. Vertical illuminance at the eye (Ev) likewise serves as an important indicator of visual adaptation. When a light source enters the central field of view, the role of visual adaptation becomes more pronounced in the perception of discomfort glare; this constitutes a fundamental distinction between vertical and horizontal lighting scenarios. CIE [24] defines ambient luminance as “the uniform luminance of the whole surroundings which produces the same illuminance on a vertical plane at the observer’s eye as the visual field under consideration, excluding the glare sources.” For conventional lighting systems, the contribution of the glare source to the surrounding environment is generally limited. However, for vertical surface light sources, illumination reflected from surrounding room surfaces may substantially modify the observer’s adaptation field, making the characterization of ambient/background luminance more complex than that assumed in conventional glare evaluation methods. Pierson et al. [18] conducted a comparative analysis of variables representing adaptation levels across different glare evaluation models (see Table 1). Based on the CIE definition, they argued that the primary distinction between such variables lies in whether the luminance of the glare source is included in the calculation. The Large (Great) Source Glare Rating (GGR), a modification of the UGR for large-area light sources [25], characterizes background and source-related effects using indirect and direct illuminance at the observer’s eye, respectively. Overall, for large-area glare sources that occupy a substantial portion of the visual field, the interaction between the light source and its surrounding environment plays a crucial role in shaping the visual adaptation process.
Table 1.
Typical Evaluation Models for Indoor Discomfort Glare. (Source: Compiled from [18,26]).
Under conventional lighting conditions, the angle between the luminaire and the observer’s line of sight typically exceeds 30°, such that the luminance of the luminaire surface exerts only a limited influence on visual adaptation. In contrast, within integrated lighting–architecture contexts, vertical light-emitting surfaces frequently fall within the central visual field (Figure 1). As a result, they become part of the observer’s visual field and substantially influence the spatial distribution of luminance, thereby affecting the eye’s level of adaptation.
Another key mechanism of glare is the presence of excessive luminance variation within the visual field, which is known as the contrast effect. This effect is more pronounced in environments featuring vertical surface light sources. In most existing glare evaluation models, this effect is typically represented as the ratio of to the adaptation level. In studies of window-induced glare, both the contrast between the window and its background [27] and the luminance contrast () between the visual task area and its immediate surroundings [28] are regarded as critical parameters for glare assessment. Compared with daylight glare, human tolerance to glare in artificial lighting environments is generally lower. Moreover, field investigations indicate that current applications of vertical light sources often exhibit strong between the emitting surface and its adjacent background. However, the majority of existing studies examine individual variables, such as , , or , in isolation [23,29,30,31], with limited efforts to investigate their combined effects.
In summary, this study focuses on scenarios involving vertical surface light sources. Through a combination of subjective assessments and objective physiological measurements, this study addresses three specific research questions: (1) how do and influence discomfort glare, and whether their effects interact; (2) whether objective physiological responses can provide complementary information to subjective evaluations of discomfort glare; and (3) whether Ev can serve as a useful indicator of the visual adaptation state and contribute to the evaluation of discomfort glare. By addressing these questions, this study aims to explore the effects of key characteristics of vertical surface light sources on discomfort glare and to provide a basis for its evaluation. The findings are expected to provide a theoretical basis for developing discomfort glare evaluation models for vertical surface light sources, as well as practical guidance for their rational design and application, thereby improving visual comfort and the overall quality of lighting environments.
2. Methods
2.1. Test-Room and Experimental Setup
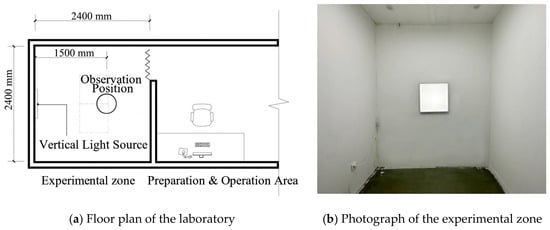
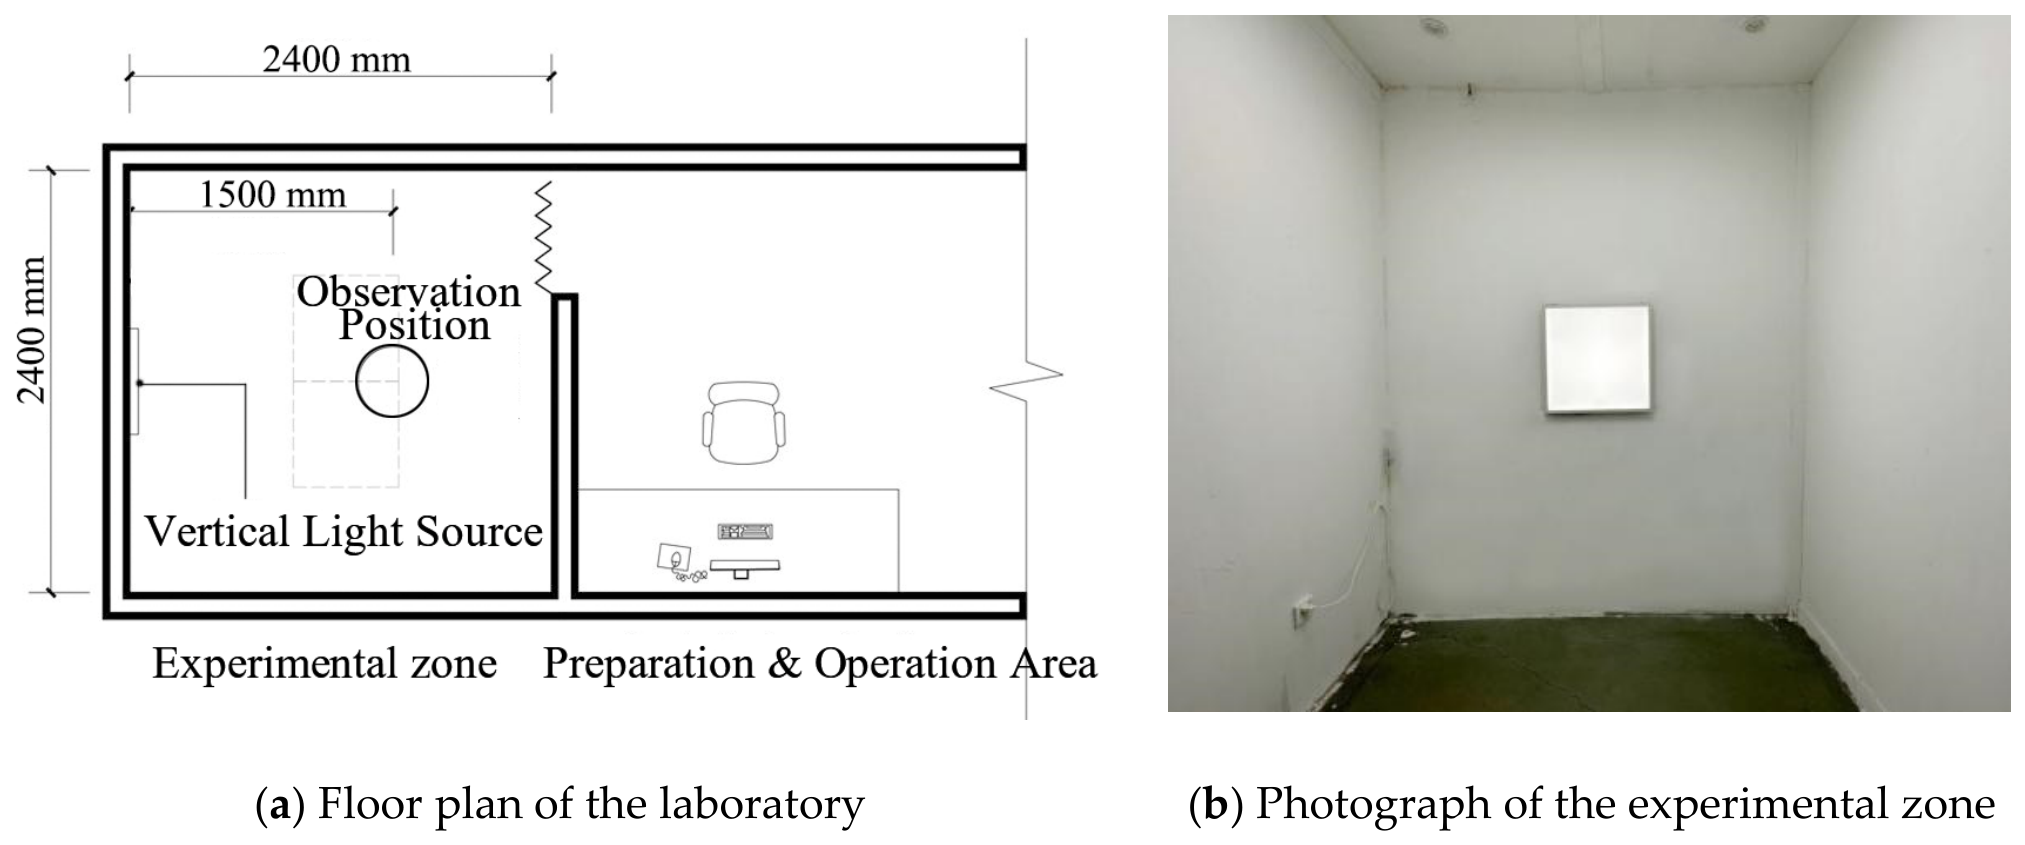
The experimental environment was established within the Variable Integrated Experimental Platform at Tianjin University, as illustrated in Figure 2. The facility comprises an experimental zone and a preparation/operation zone. The experimental zone measures 2.4 m (length) × 2.4 m (width) × 3.0 m (height). The walls and ceiling are finished in white, and the reflectance values of the interior surfaces are listed in Table 2. This controlled environment facilitates precise regulation of lighting conditions and enables accurate measurement and analysis of the interactions between light sources and environmental parameters. Light-blocking curtains were installed at the entrance, and no windows were included in the space. Consequently, all was provided exclusively by the experimental lighting system. The ambient lighting system and the vertical light source were controlled independently throughout the experiment, with the former establishing and the latter providing the glare stimulus. This experimental design enabled independent manipulation of ambient lighting and glare source characteristics. The thermal environment was therefore regulated using a radiant floor system and fan coil units integrated into the platform.
Figure 2.
Experimental Conditions.
Table 2.
Material Parameters for Indoor Surfaces.
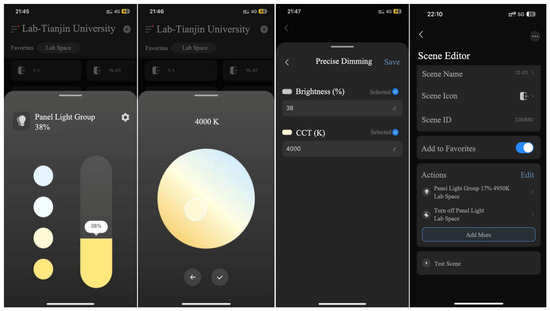
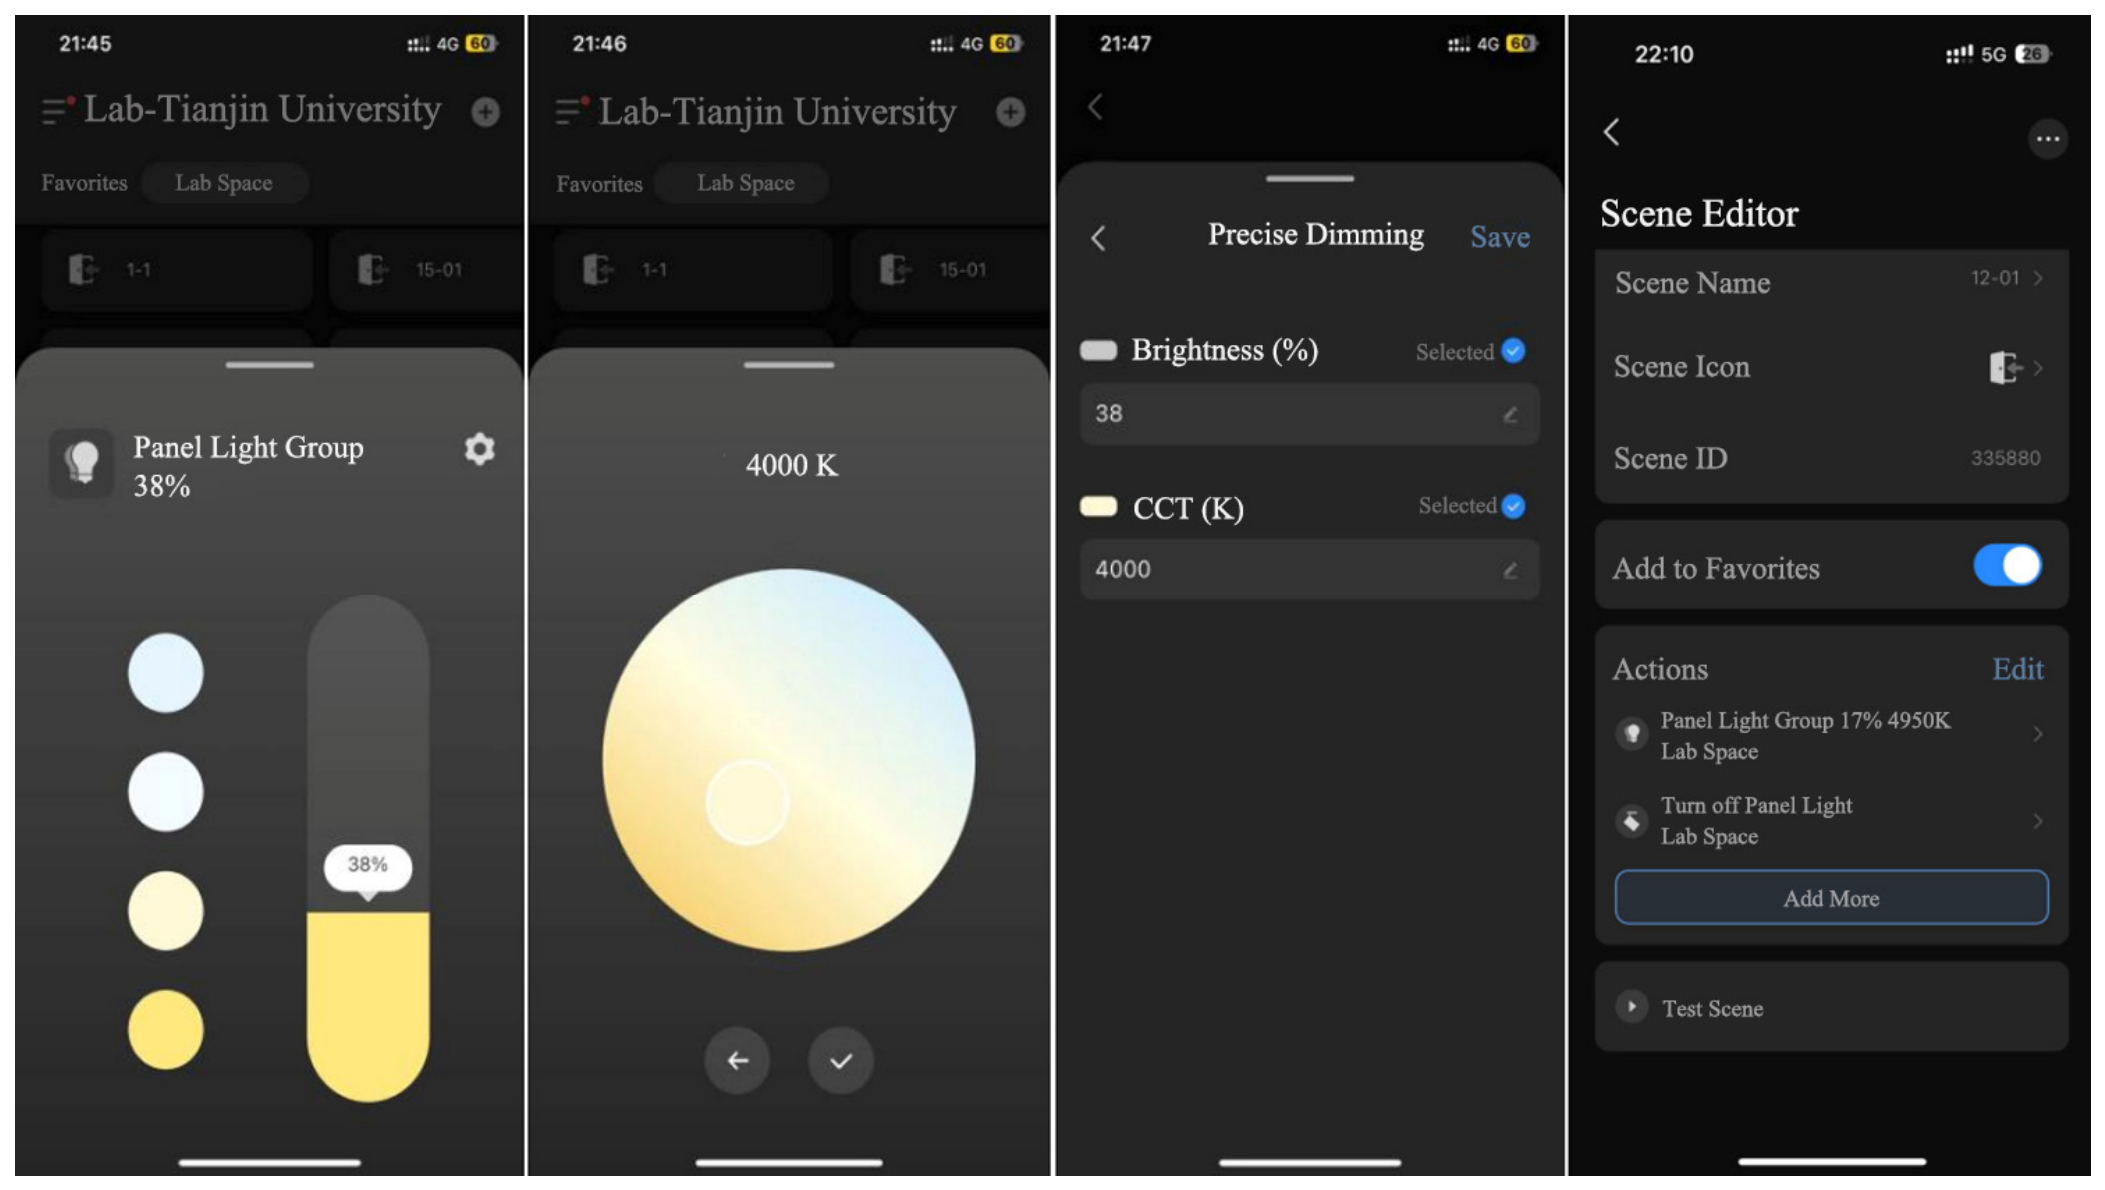
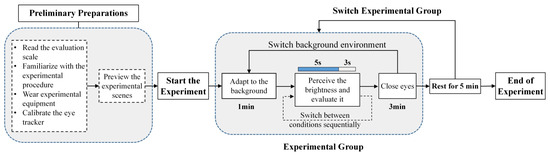
Ambient lighting was provided by smart panel luminaires manufactured by Yeelight. The luminaire specifications are summarized in Table 3. Using the manufacturer’s proprietary mobile application, luminance could be adjusted within a range of 0–4670 cd/m2 (with 1% resolution), and correlated color temperature (CCT) within a range of 2700–6500 K. The control interface is shown in Figure 3. During the experiment, luminance and CCT were initially adjusted using the application’s slider controls according to the target values defined in the experimental design. These parameters were then iteratively refined through real-time measurement and feedback to minimize deviations between target and actual values. The calibrated settings were subsequently configured using the precision dimming interface, and the corresponding lighting conditions were saved as preset scenes.
Table 3.
Luminaire Parameters.
Figure 3.
Yeelight application control interface (from left to right: brightness adjustment, correlated color temperature, precision dimming, and scene management).
To investigate the effects of light source and ambient luminance on discomfort glare, the dimensions and installation position of the light source, as well as the observer’s viewing position, were kept constant throughout the experiment. The vertical light source measured 600 × 600 mm and was installed at the center of the wall. The viewing distance was set at 1.5 m, corresponding to a solid angle of approximately 0.15 sr subtended at the observer’s eye. In order to prevent direct visibility of ceiling-mounted luminaires and to ensure uniform within the experimental space, a lighting simulation was conducted using DIALux evo software (2023) to determine the number and placement of ceiling fixtures, as indicated by the dashed lines in Figure 2a. The luminaires were arranged perpendicular to the observer’s line of sight. Consequently, during the experiment, the only illuminated surface within the participant’s field of view was the vertical light source, as illustrated in Figure 2b. To investigate the individual and combined effects of ambient lighting level and glare source characteristics on discomfort glare, () and the luminance of the vertical light source were independently controlled throughout the experiment. The ambient lighting system established the preset ambient luminance, while the vertical light source served as the glare source.
2.2. Experimental Variables and Operating Conditions
In the present experimental design, and were specified as the primary experimental parameters, while was adjusted accordingly to achieve the prescribed combinations of and .
Prior to the experiment, a field survey of 20 applications involving vertical surface light sources was conducted to characterize representative spatial types, lighting configurations, and photometric conditions in practical architectural environments. and were measured using portable photometric instruments. The field survey results, together with relevant lighting standards and the requirements of experimental controllability, informed the selection of the experimental parameter levels. Accordingly, was set within the range of 10–200 cd/m2.
Based on this range, a logarithmic scale was adopted, yielding five discrete levels: 10, 20, 40, 80, and 160 cd/m2. Each target value was verified through on-site measurements (see Section 2.5 for measurement procedures), as summarized in Table 4. All measurement deviations were within acceptable perceptual thresholds, ensuring the reliability of the experimental conditions.
Table 4.
Design and Measured Values of .
Because is influenced by the reflectance characteristics of interior surfaces (e.g., walls and ceilings), Ev was also measured at each level to enhance experimental reproducibility. Moreover, Ev directly reflects the amount of incident light intensity and the corresponding photopic adaptation state, thereby providing a robust basis for analyzing the interaction between and .
is widely regarded as a key indicator for assessing visual adaptation [23]. Several national standards [32] and prior studies [33,34] have investigated threshold ranges for , typically spanning from 5:1 to 40:1. To capture the range of contrast conditions considered in existing discomfort glare evaluation models, four levels (5:1, 10:1, 20:1, and 40:1) between the vertical light source and the background were adopted. The corresponding experimental luminance values are summarized in Table 5. This range broadly reflects the luminance levels observed in current applications of vertical light sources. The corresponding luminance values of the vertical light source are presented in Table 5, ranging from 100 cd/m2 to 3200 cd/m2. This range broadly reflects the luminance levels observed in current applications of vertical light sources. When the was 10 cd/m2, a contrast ratio of 5:1 corresponded to a of 50 cd/m2, which does not induce perceptible glare to participants [11]. Conversely, when the was 160 cd/m2, a contrast ratio of 40:1 yielded a of 6400 cd/m2. This would produce excessive glare and exceed the maximum output of the experimental luminaire (4670 cd/m2). After excluding these conditions, six levels of were established. The corresponding measured values are reported in Table 6, with all deviations remaining within acceptable perceptual thresholds. For , the luminaire output was adjusted to achieve the target contrast ratio by selecting the control setting closest to the design value. Ev was measured under each condition with the vertical light source activated, with the sensor oriented perpendicular to the line of sight.
Table 5.
Design Values of under Different
Table 6.
Measured Values and Errors for .
This study fixed the CCT of the vertical light source at 4000 K throughout the experiment in order to eliminate the influence of additional photometric variables. The ambient lighting was also provided by luminaires with a CCT of 4000 K. In total, 18 experimental conditions were defined (5 levels × 4 contrast levels, excluding 2 extreme cases). To minimize the effects of visual adaptation carryover and fatigue, the conditions were grouped into five sets according to and tested sequentially.
2.3. Experimental Methods and Procedures
2.3.1. Experimental Methods
The experiment combined subjective evaluations with objective physiological measurements. Subjective discomfort glare ratings were obtained using a standardized evaluation scale. Pupil diameter data were simultaneously recorded using the aSee Glasses wearable eye-tracking system developed by 7invensun Technology Co., Ltd., Beijing, China. Detailed descriptions of the experimental methodology can be found in the previous study [11].
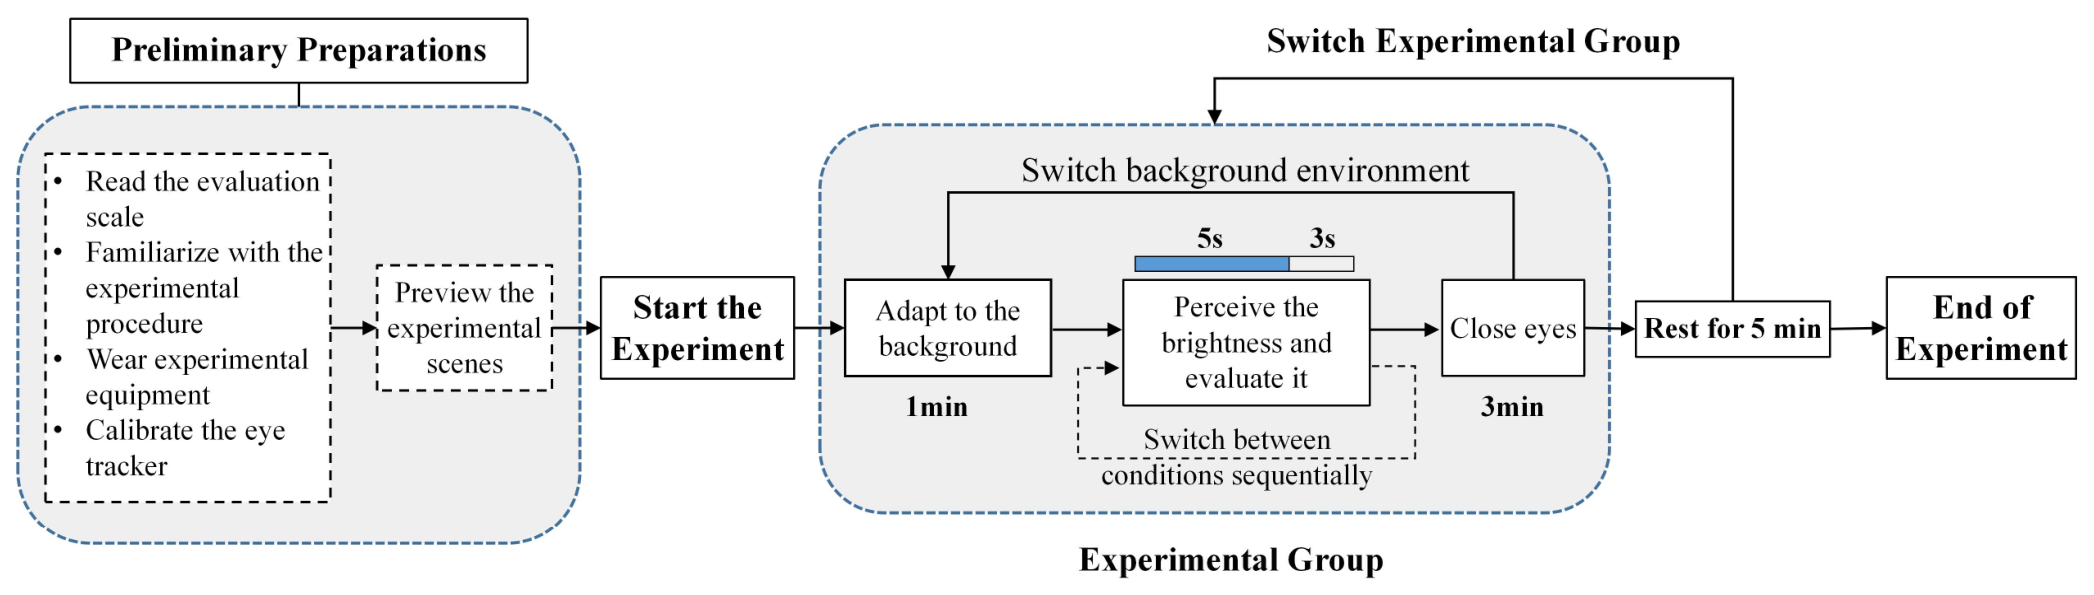
The overall experimental workflow is illustrated in Figure 4 and consists of two stages: pre-experimental preparation and the formal experimental procedure.
Figure 4.
Experimental workflow.
2.3.2. Experimental Procedure
This study was reviewed and approved by the Ethics Committee of Tianjin University. Written informed consent was obtained from all participants prior to the experiment.
Experimental Preparation. In the preparation area, the experimenter first explained the experimental procedure and relevant precautions to the participants, including the grouping arrangement, experimental duration, and the requirement to maintain a forward horizontal gaze throughout the experiment. Participants reviewed the subjective evaluation scale and its corresponding instructions in advance to familiarize themselves with the glare assessment criteria. Once all concerns had been addressed, participants were guided into the experimental area. Each participant was directed to independently adjust the seat height so as to ensure that the fixation point aligned with the center of the vertical light-emitting surface. Participants were then instructed on the proper use of the eye tracker, and pupil calibration was performed using the aSee Studio interface. Before the formal experiment began, several experimental scenes and audio prompts were presented in random order to familiarize participants with the experimental procedure and the voice-guided instructions.
The formal experimental procedure was conducted as follows:
- (1)
- An initial experimental condition was randomly selected.
- (2)
- Participants underwent a 1 min visual adaptation period under the selected background lighting condition. During this period, pupil diameter data were collected as baseline physiological measurements.
- (3)
- The vertical light source was then activated, and glare stimuli were presented in random order. Each stimulus condition was displayed for 5 s. Participants evaluated the perceived discomfort glare using a 7-point subjective rating scale. Subjective ratings were recorded, while eye-tracking data were monitored in real time to ensure data validity. Following previous studies [35], after each stimulus presentation, a light-blocking panel was used to occlude the vertical light source while the next lighting condition was prepared. A minimum recovery period of 1 min was provided before the next stimulus to reduce potential carryover effects from the preceding stimulus. This procedure was repeated until all stimuli under the current condition had been completed.
- (4)
- Participants then closed their eyes and rested for 3 min to allow sufficient recovery between experimental groups.
- (5)
- After completing all stimuli within the current experimental group, the next experimental group was randomly selected from the remaining groups. The corresponding background lighting condition was then changed, followed by a 1 min visual adaptation period.
- (6)
- Steps 3–5 were repeated until all glare stimuli under the current condition had been completed.
- (7)
- Participants rested for 5 min to allow sufficient recovery between experimental groups.
- (8)
- Steps 2–7 were repeated until all five experimental groups had been completed. Subjective evaluation results and eye-tracking parameters were continuously recorded throughout the experiment.
- (9)
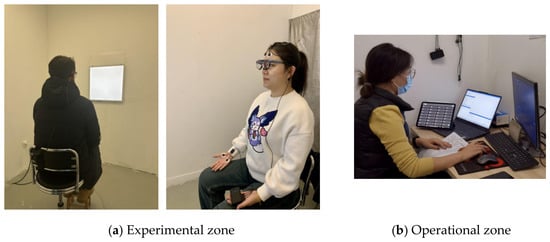
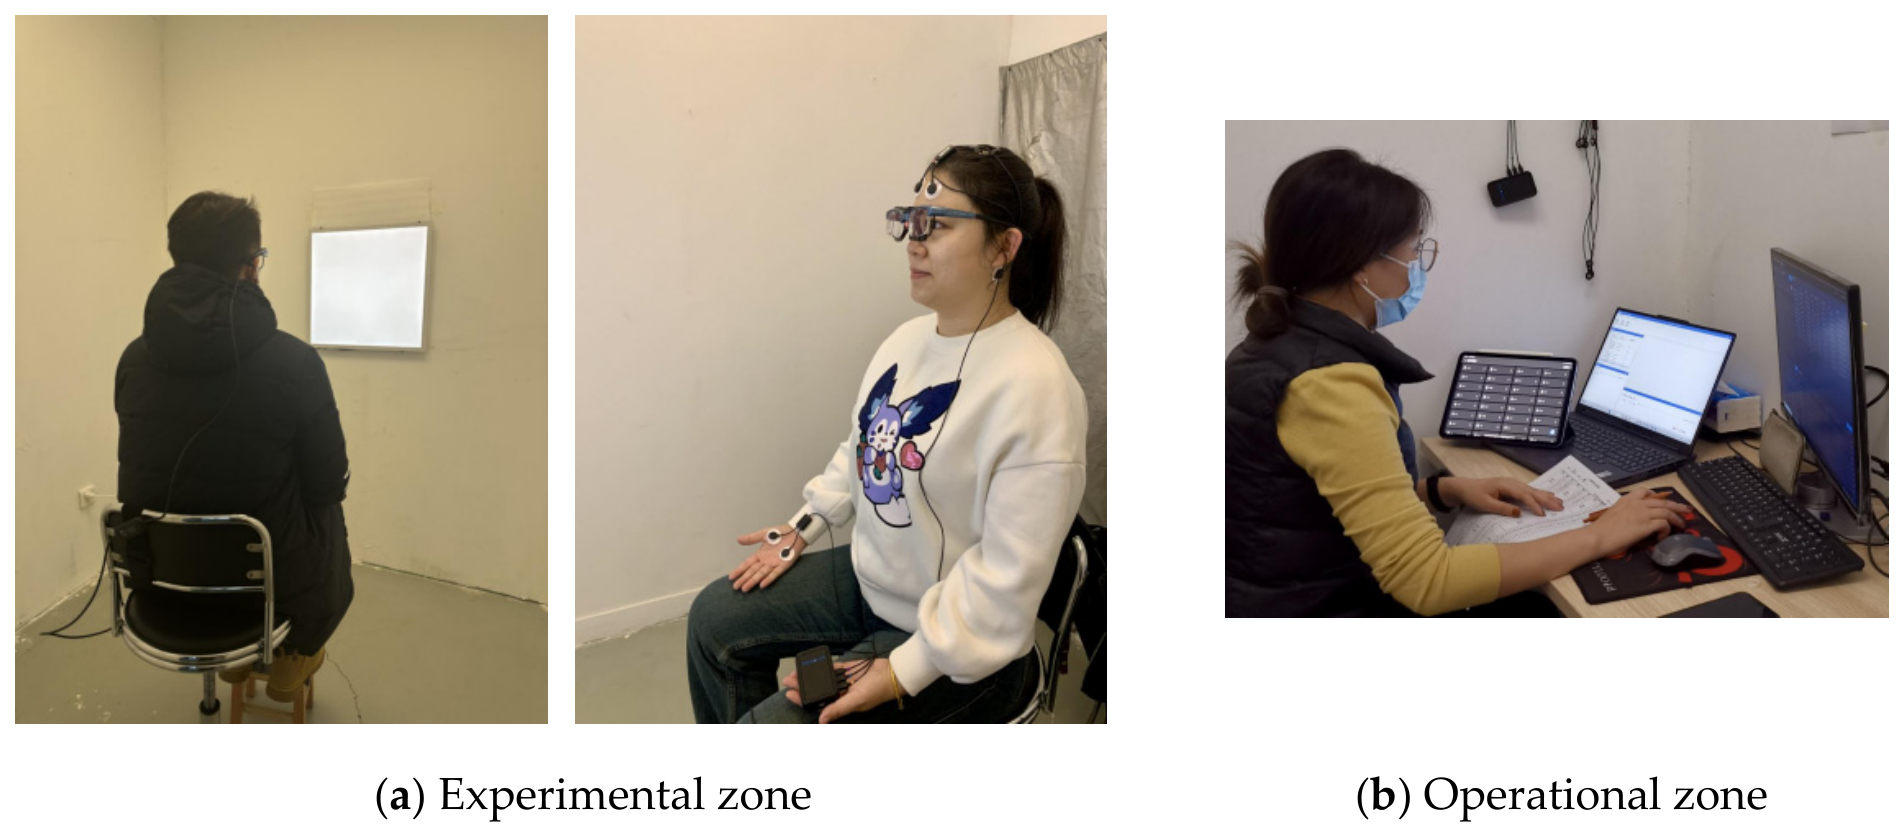
- After all five experimental groups had been completed, the experiment concluded. Figure 5 illustrates the experimental setup and participant posture during testing. Throughout the experiment, real-time monitoring and verbal reminders were used to ensure that participants maintained a horizontal line of sight.Figure 5. Experimental procedures.
2.4. Participants
Participant recruitment criteria were established based on previous research [11]. Participants were required to have either an uncorrected visual acuity of 1.0 or higher, or a corrected visual acuity of at least 1.0.
Recruitment information was distributed through social media platforms and campus announcements. Individuals who met the inclusion criteria contacted the research team to register for participation. A total of 32 participants were recruited for the experiment, all of whom were university students. The sample consisted of 13 males and 19 females, aged 18–30 years (mean = 22.09 years, SD = 4.65).
2.5. Data Collection
- (1)
- Subjective Evaluation
Subjective discomfort glare was assessed using Boyce’s 7-point glare evaluation scale (Table 7). To improve comprehensibility for Chinese participants, the semantic descriptions of the scale were localized in accordance with Chinese language conventions. To better reflect the characteristics of vertical light sources, the original descriptor “overhead” was first removed from the label definitions. To facilitate participants’ understanding of the original rating descriptors, additional explanatory information was provided from three complementary aspects: visual perception, behavioral response, and tolerable exposure duration. For example, for the rating of 5 (“Uncomfortable”), the descriptor was supplemented with information regarding noticeable visual discomfort that interferes with normal visual activities, a tendency to take measures to avoid glare, and difficulty remaining in the environment for more than approximately 15–30 min without mitigation. Similar explanatory information was provided for the other rating levels.
Table 7.
Boyce’s glare evaluation scale.
- (2)
- Collection and Processing of Pupil Diameter Data
Pupil diameter data were collected using the aSee Glasses wearable eye-tracking system. Experimental events were labeled within the aSeeStudio software (Version 0.2.25.2) in conjunction with playback videos to identify the corresponding experimental conditions. Pupil diameter data were then processed using a Java-based program developed in IntelliJ IDEA. The processing procedure consisted of three steps: event identification, removal of invalid data, and data extraction and calculation. Experimental events were identified according to the predefined Event Labels, and the corresponding pupil diameter data were segmented according to each experimental condition. Blink events were automatically identified by the built-in algorithm of aSee Studio, and the corresponding data were excluded from subsequent analysis. Data points showing abrupt discontinuities inconsistent with the surrounding pupil trajectory were identified as abnormal values and removed. For each condition, the baseline pupil diameter was measured with the vertical light source switched off, and its mean value was defined as . The mean pupil diameter during the corresponding luminance-stimulation period was defined as . Pupil diameter change ratings (PDCRs) were then calculated relative to the corresponding baseline value according to Equation (1). To minimize the influence of inter-individual differences in baseline pupil diameter, PDCR was used for subsequent analyses and interpretation.
- (3)
- Measurement of Physical Parameters
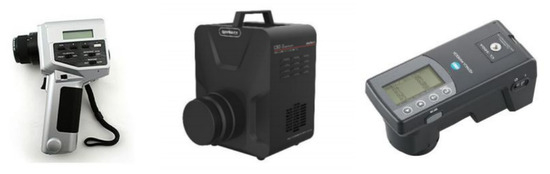
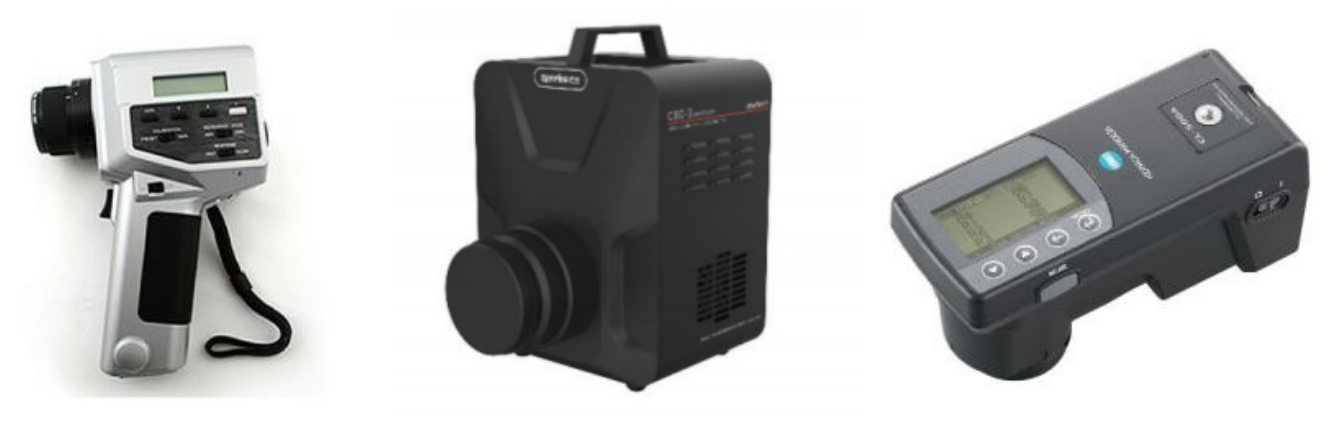
The primary physical parameters measured in this study included the , , and . The measurement instruments used are shown in Figure 6.
Figure 6.
Instruments used for physical parameter measurements (from left to right: CS-100A luminance meter (Konica Minolta, Inc., Tokyo, Japan), CXC-3 imaging luminance meter (Everfine, Hangzhou, China), and CL-500A spectroradiometer (Konica Minolta, Inc., Tokyo, Japan)).
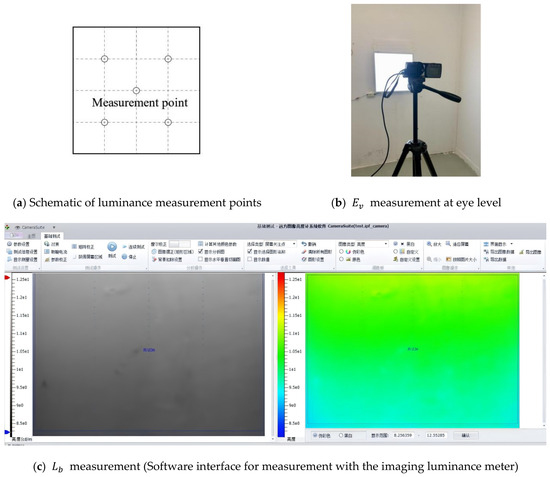
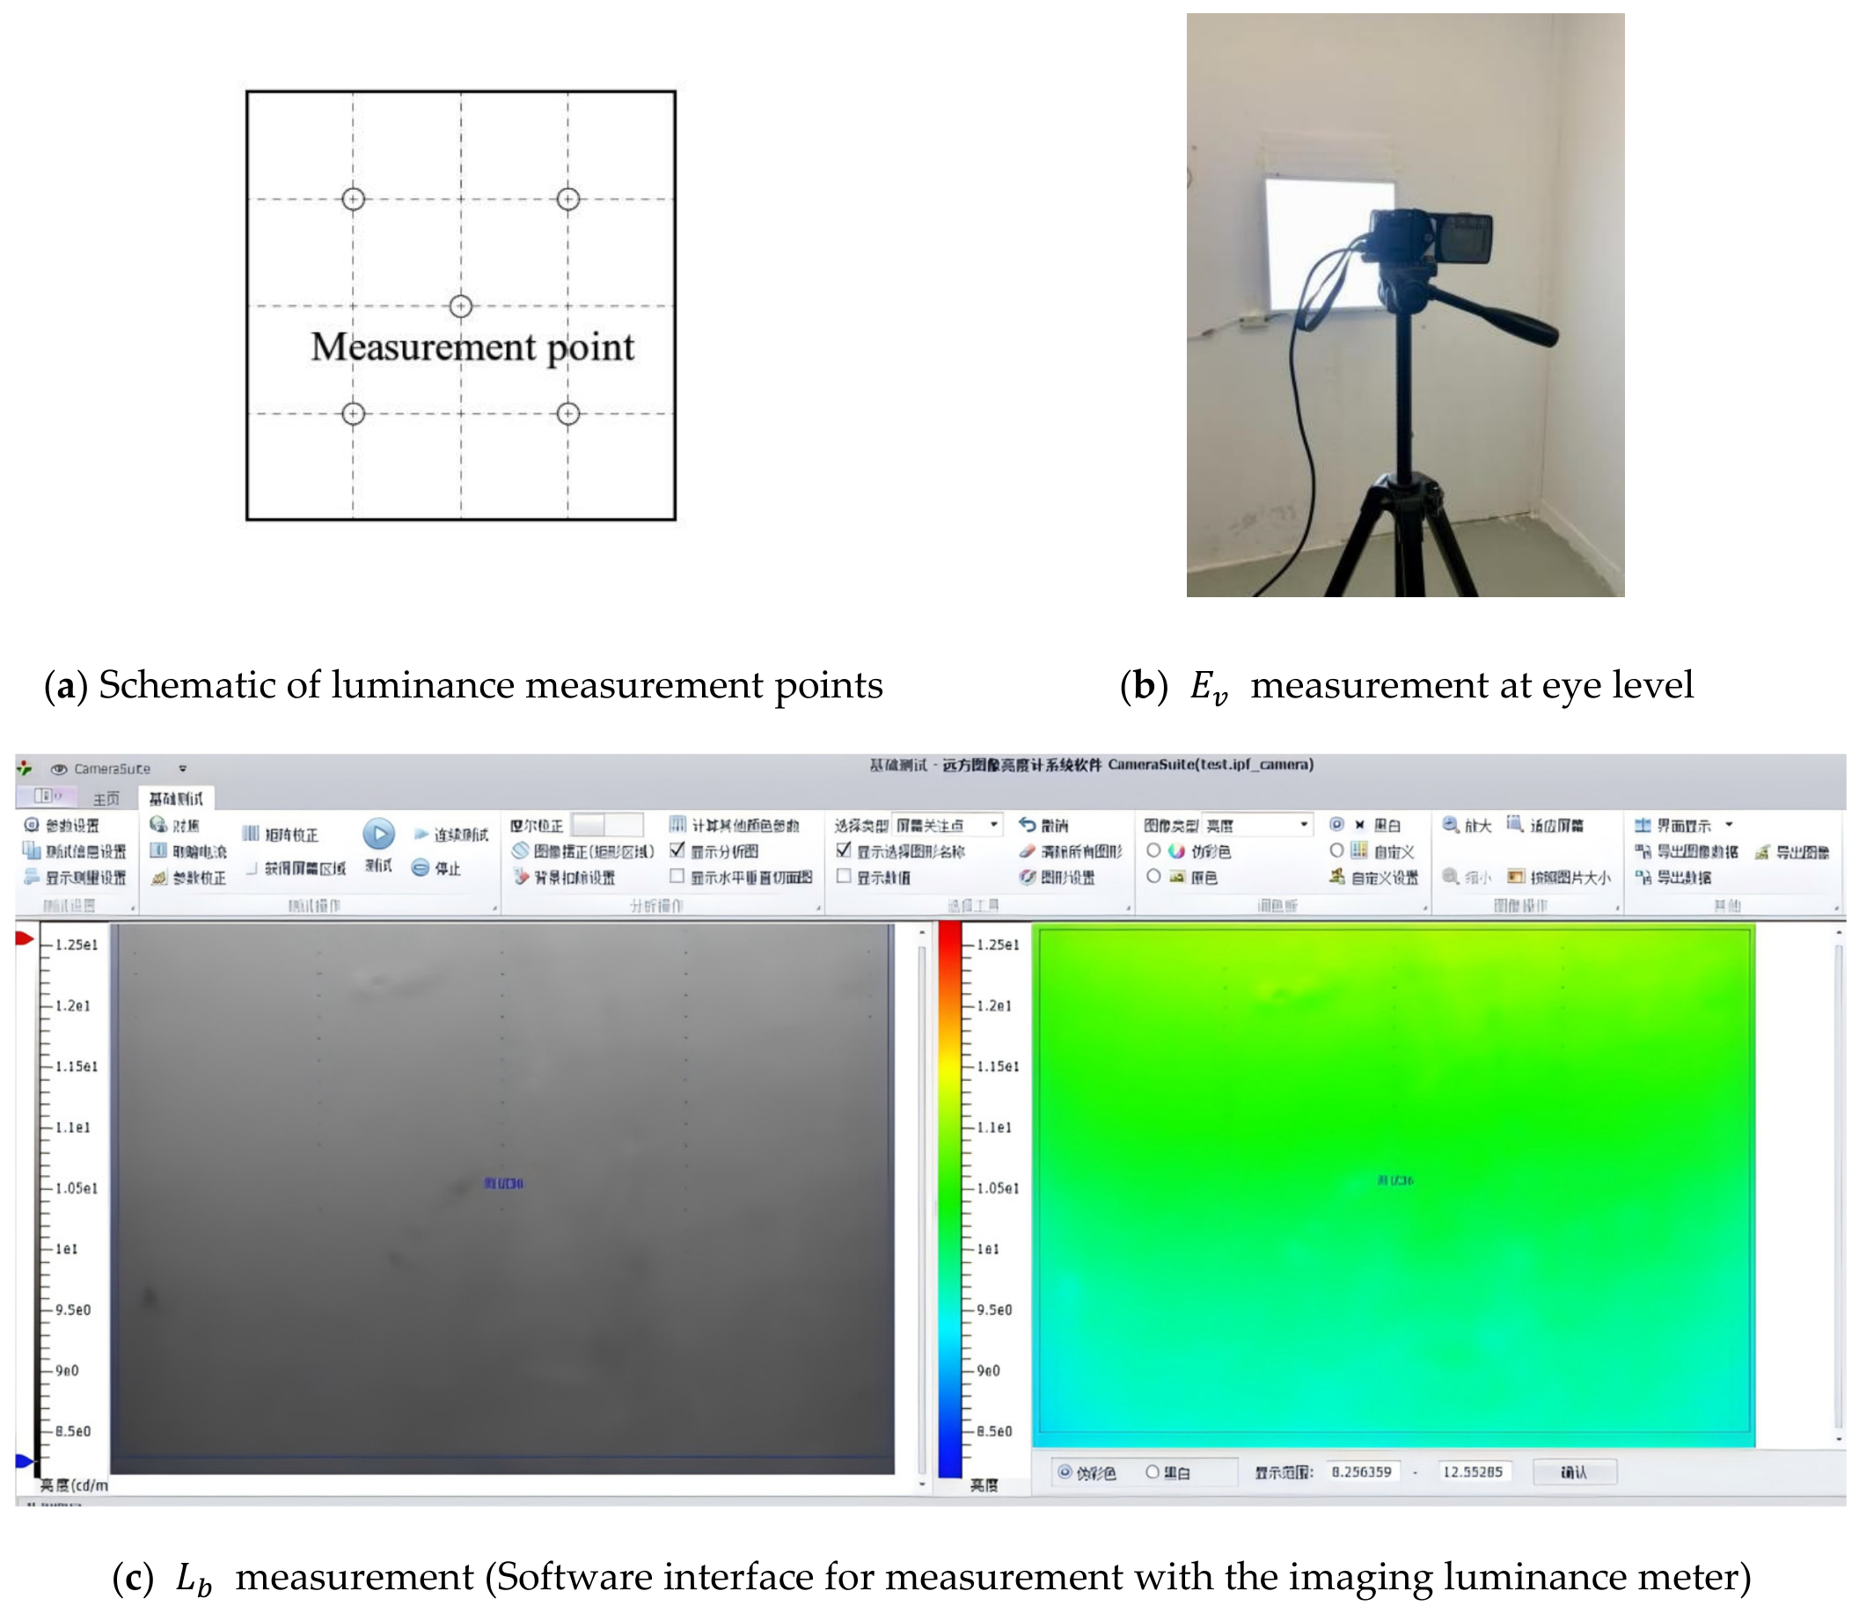
was measured using a Minolta CS-100A luminance meter (Konica Minolta, Inc., Tokyo, Japan). Five measurement points were defined according to a grid-based method (Figure 7a), and the average value was calculated.
Figure 7.
Measurement of physical parameters.
- Ev
Ev was measured using a CL-500A spectroradiometer (Konica Minolta, Inc., Tokyo, Japan) under each experimental condition, both before and after activation of the glare source. The instrument was mounted on a tripod such that the sensor probe was aligned with the participant’s eye position. Three measurements were recorded for each condition, and the average value was used as the representative Ev (Figure 7b).
was measured using a CXC-3 imaging luminance meter (Everfine, Hangzhou, China). During measurement, the vertical light source was switched off to ensure independent control of the ambient lighting condition and glare source. The ceiling-mounted panel luminaires were adjusted until the average matched the target experimental value. Figure 7c presents a representative measurement record for a condition of 10 cd/m2. The measurement position corresponded to the participant observation point used during the experiment.
2.6. Statistical Analysis
Statistical analyses were performed using SPSS 26.0. A post hoc power analysis was conducted using G*Power 3.1.9.7. Based on the smallest observed effect size (partial η2 = 0.057, f = 0.246), the statistical power was 0.902 for 32 participants, while 26 participants were required to achieve 80% power. Independent-samples t-tests and two-way repeated-measures ANOVA were used to examine group differences and the effects of and , respectively. Simple-effects, post hoc multiple-comparison, correlation, and linear regression analyses were further conducted as appropriate. Statistical significance was set at p < 0.05. A linear mixed-effects model (LMM) was additionally conducted to account for inter-individual variability among participants and verify the robustness of the repeated-measures ANOVA results.
3. Experimental Results and Analysis
A total of 32 participants provided subjective evaluations and pupil diameter measurements under each experimental condition, resulting in 576 observations for each measurement type and 1152 observations in total across the 18 experimental conditions. An independent-samples t-test indicated no statistically significant differences in either subjective ratings or PDCRs between male and female participants (p > 0.05), suggesting that gender did not significantly influence the experimental results.
3.1. Subjective Evaluation Results for Discomfort Glare
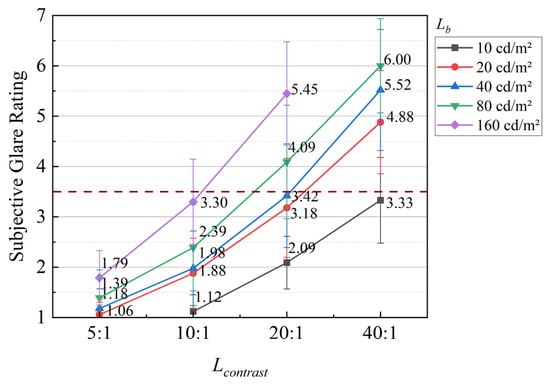
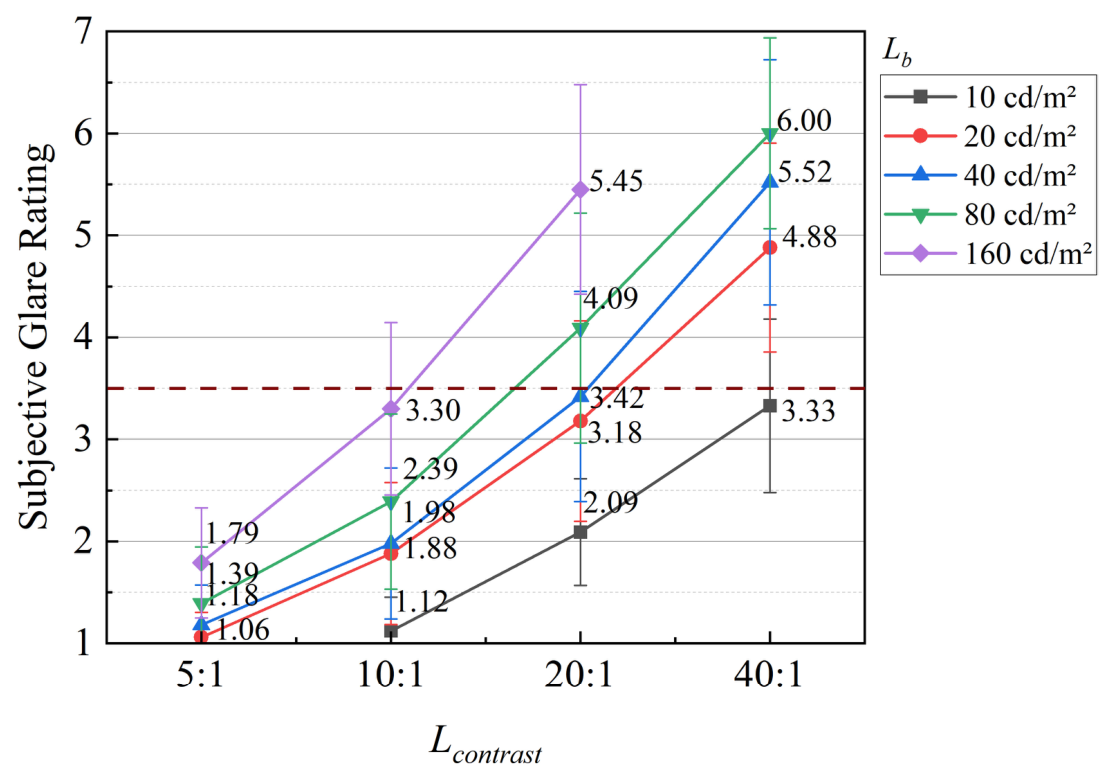
The subjective evaluation results for discomfort glare under different and conditions are presented in Figure 8. Overall, subjective glare ratings increased with increasing and also rose substantially with increasing . Under low-contrast conditions (5:1 and 10:1), subjective ratings remained relatively low across all groups, and differences among levels were limited. However, when the contrast ratio increased to 20:1 and 40:1, subjective ratings increased markedly, particularly under high conditions. In order to further examine these effects, statistical analyses were subsequently performed.
Figure 8.
Subjective evaluation results for discomfort glare. Error bars represent standard deviations (SD) across the 32 participants. The dashed line indicates a reference subjective glare rating of 3.5.
A two-way repeated-measures analysis of variance (ANOVA) was conducted to examine the effects of and on subjective discomfort glare ratings. As shown in Table 8, the main effects of and , as well as their interaction effect, all had statistically significant influences on subjective evaluations of discomfort glare (p < 0.001). Both (partial η2 = 0.689) and (partial η2 = 0.368) exerted significant effects on subjective discomfort glare, with showing the larger effect size. In addition, the interaction effect between and was statistically significant (partial η2 = 0.057), suggesting that the influence of one variable varied depending on the level of the other. As a robustness check, an LMM was additionally conducted to account for inter-individual variability among participants. The LMM results were consistent with those of the repeated-measures ANOVA, with significant effects of , , and their interaction on subjective glare ratings (all p < 0.001), confirming the robustness of the findings after accounting for inter-individual variability.
Table 8.
Results of ANOVA for Subjective Discomfort Glare Ratings.
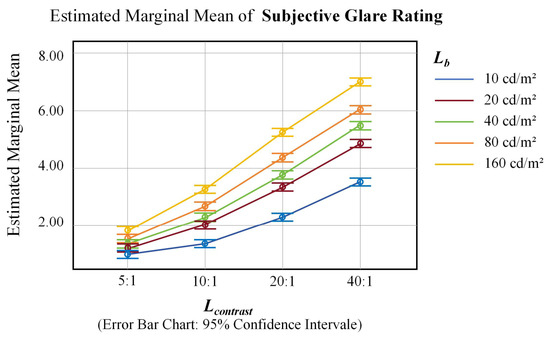
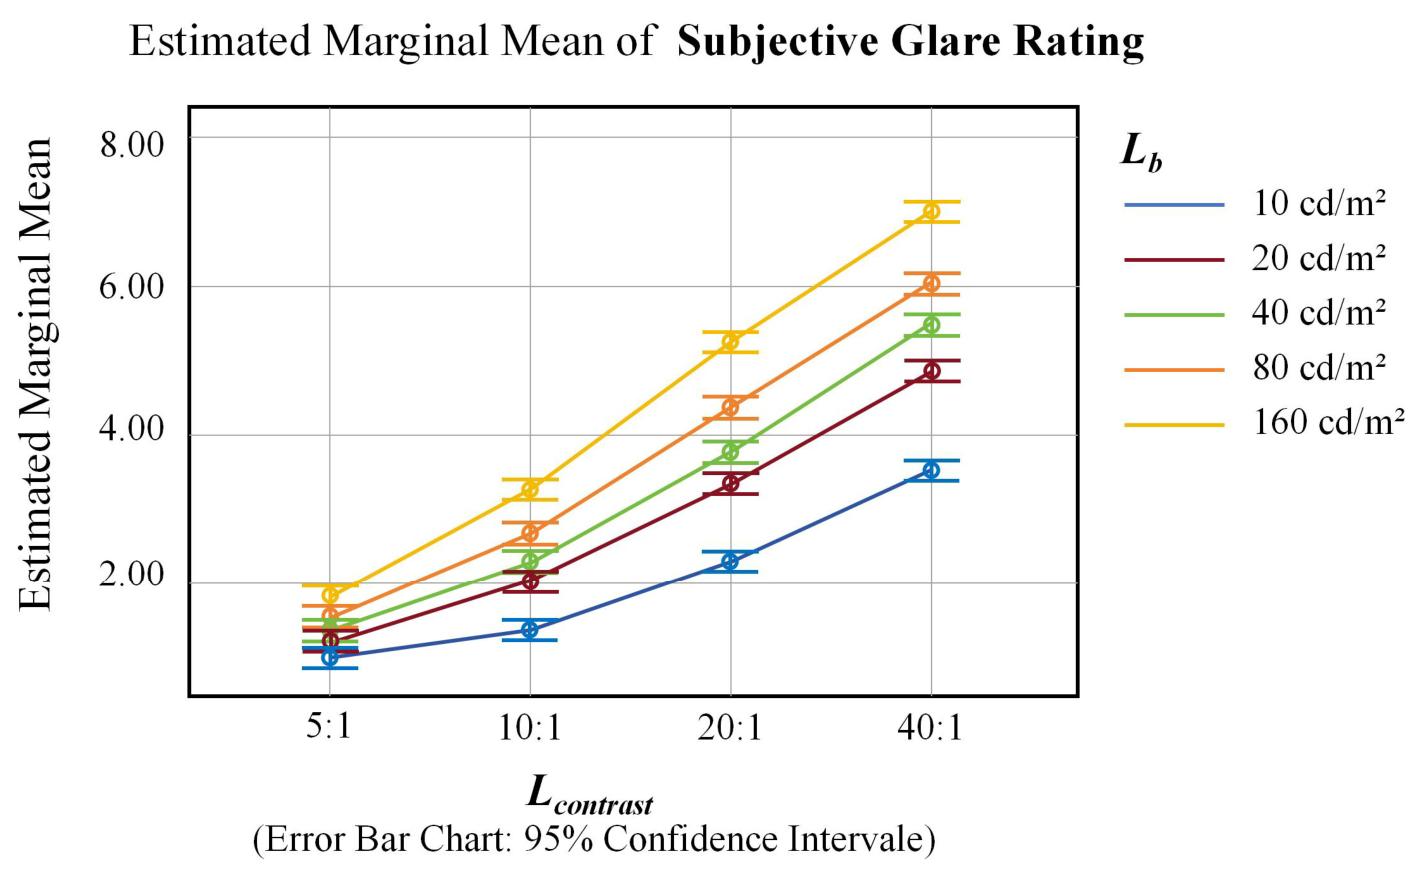
Simple effects analyses were conducted in SPSS 24.0 so as to further examine the interaction between and . Specifically, differences in subjective discomfort glare ratings across levels were compared while holding constant, and vice versa. The results of the univariate analyses indicated that the simple effects of were significant at all levels (5:1, 10:1, 20:1, and 40:1; p < 0.001). The corresponding partial η2 values were 0.023, 0.117, 0.241, and 0.305, respectively, indicating that the explanatory power of on subjective glare ratings increased progressively with increasing . Pairwise comparisons revealed that under the lowest contrast condition (5:1), statistically significant differences were observed only between certain levels (p < 0.05). In contrast, under conditions of 10:1, 20:1, and 40:1, significant differences in subjective ratings were observed across all levels (p < 0.05). These results indicate that the influence of on discomfort glare perception became more pronounced under higher contrast conditions (20:1 and 40:1), as shown in Figure 9.
Figure 9.
Results of the simple effects analysis for .
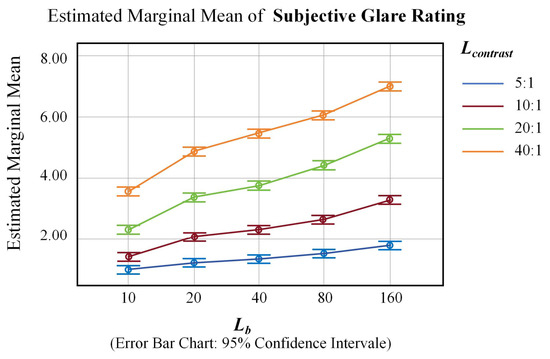
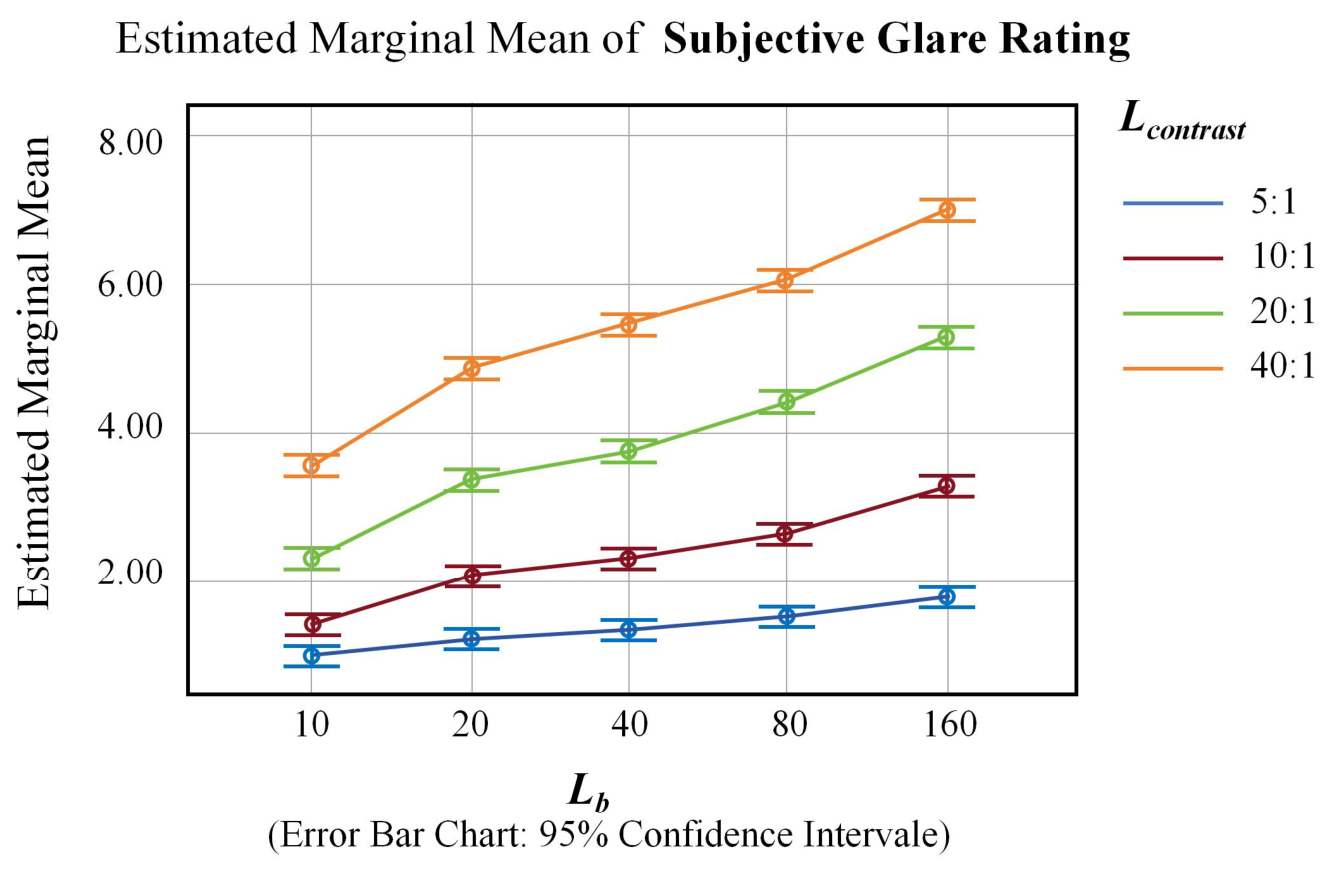
The simple effects of were also significant at all levels (10, 20, 40, 80, and 160 cd/m2; p < 0.001). The corresponding partial η2 values were 0.200, 0.329, 0.391, 0.433, and 0.502, respectively, suggesting that the influence of on subjective glare ratings increased progressively with increasing . Pairwise comparisons further demonstrated that significant differences in subjective ratings existed between all levels under each condition (p < 0.001), as shown in Figure 10.
Figure 10.
Results of the simple effects analysis for .
3.2. Results for PDCR
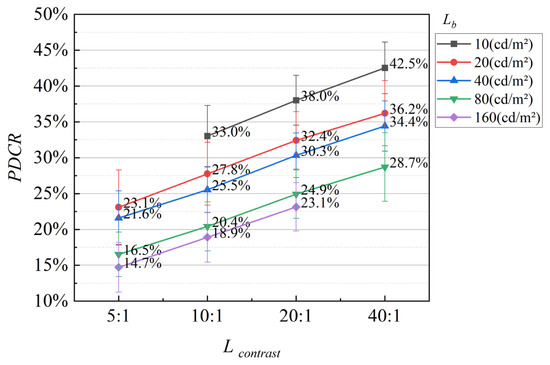
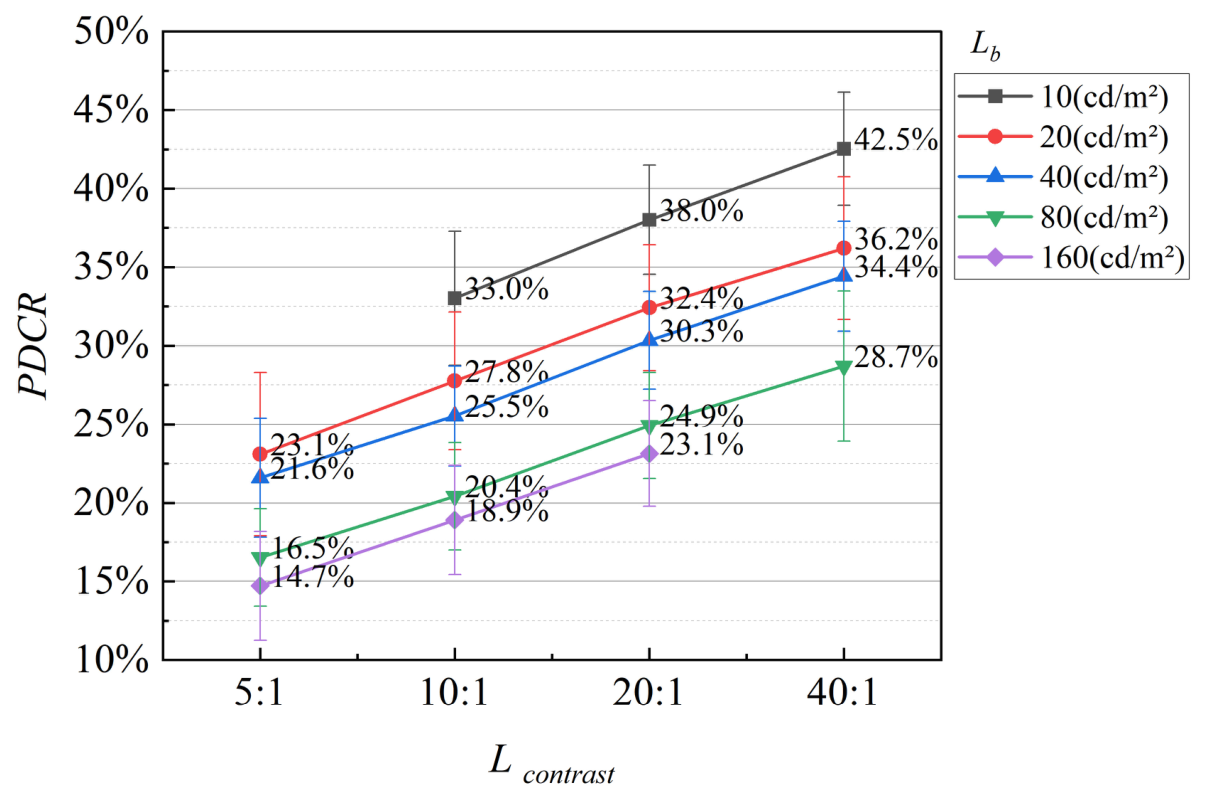
The results for PDCR under different and conditions are presented in Figure 11. The PDCR increased significantly with increasing , whereas it exhibited a clear decreasing trend with increasing . To further examine the effects of the experimental variables, an ANOVA was conducted, and the results are summarized in Table 9. Both and exerted significant main effects on PDCR (p < 0.001), with partial η2 values of 0.343 and 0.312, respectively. However, the interaction effect between and was not statistically significant (p = 0.248 > 0.05).
Figure 11.
Results for the PDCR. Error bars represent standard deviations (SD) across the 31 participants.
Table 9.
Results of ANOVA for PDCR.
Post hoc multiple comparisons were conducted using the least significant difference (LSD) method for , and . The results indicated significant differences in PDCR across all four levels (p < 0.001). The mean values were ranked as follows: 40:1 > 20:1 > 10:1 > 5:1. These findings indicate a positive correlation between and PDCR; specifically, higher resulted in greater pupil diameter changes and correspondingly stronger glare perception. 10 cd/m2 > 20 cd/m2 > 40 cd/m2 > 80 cd/m2 > 160 cd/m2. This trend indicates a negative correlation between and PDCR. As increased, the magnitude of pupil diameter changes decreased, suggesting weaker physiological responses to glare stimuli under brighter adaptation conditions.
3.3. Comparison of Subjective and Objective Results
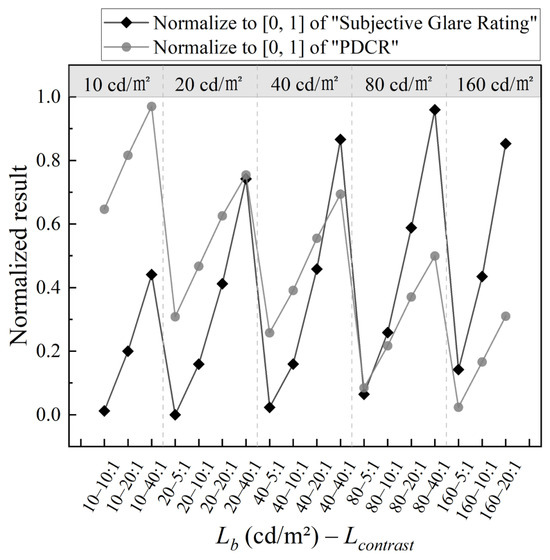
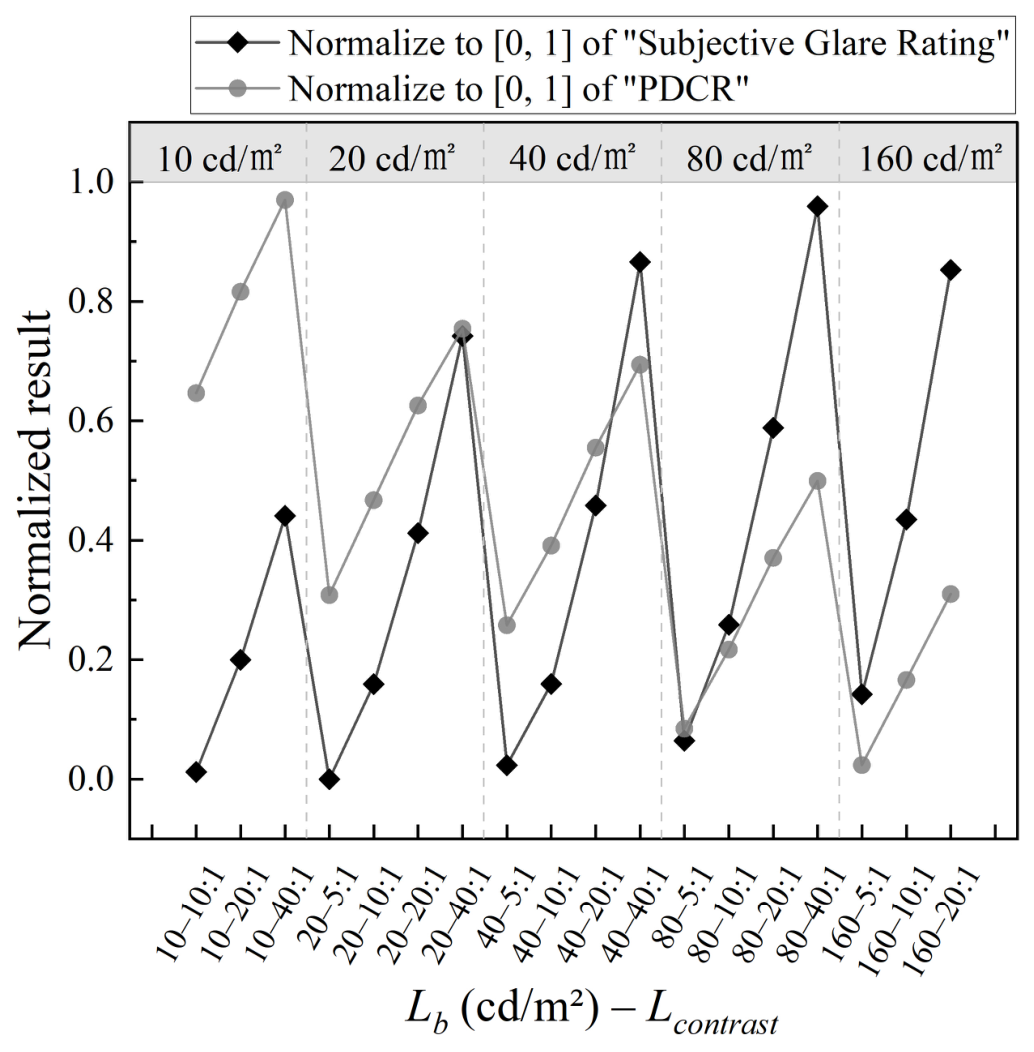
The mean subjective glare rating values and mean PDCRs across the 18 experimental conditions were normalized, and the results are presented in Figure 12. To further quantify the relationship between subjective glare responses and physiological responses, a Spearman correlation analysis was conducted between the mean subjective glare ratings and mean PDCRs. The results showed a significant positive correlation between the two measures (r = 0.401, p < 0.001), confirming a statistically significant association between subjective glare perception and the physiological pupil response.
Figure 12.
Normalized subjective and objective evaluation results.
In the condition of 10 cd/m2, PDCR values were generally the highest observed in the experiment, whereas subjective glare rating values remained relatively low. Under conditions of 20–40 cd/m2, the overall PDCR level decreased compared with the 10 cd/m2 condition and exhibited fluctuation patterns similar to those of SR across different operating conditions. In the 80 cd/m2 condition, PDCR showed a continued downward trend, while subjective glare rating reached its maximum level across the entire experiment. Under the 160 cd/m2 condition, PDCR remained comparatively low overall, whereas subjective glare rating, although slightly lower than that observed at 80 cd/m2, still remained at a relatively high level.
Overall, as increased from 10 cd/m2 to 160 cd/m2, PDCR exhibited a gradual decline accompanied by progressively smaller fluctuations. In contrast, subjective glare rating demonstrated an overall increasing trend, with peak responses becoming more pronounced at higher luminance levels. These findings indicate that the two metrics exhibit distinct luminance-dependent characteristics and asynchronous response patterns across different conditions.
From the perspective of subjective and objective response characteristics, PDCR was more sensitive under low conditions, with generally higher values observed in low-luminance environments. This finding suggests that luminance-contrast stimuli exert a stronger influence on pupillary accommodation activity under dim adaptation conditions. As increased, the overall PDCR level decreased and gradually stabilized, indicating that the magnitude of pupillary accommodation responses approached saturation under brighter adaptation states. In contrast, subjective glare rating increased progressively with increasing and remained at relatively high levels under medium- and high-luminance conditions. This pattern suggests that subjective glare perception is more sensitive to changes in under brighter background environments. The asynchronous response characteristics observed between subjective glare rating and PDCR indicate that subjective discomfort glare evaluations and physiological pupillary responses do not necessarily vary synchronously across different luminance conditions. Therefore, a multidimensional assessment framework integrating both subjective evaluations and physiological indicators may provide a more comprehensive characterization of visual responses to discomfort glare under varying luminance environments.
3.4. Significance of Ev in Visual Adaptation Under Vertical Light Sources
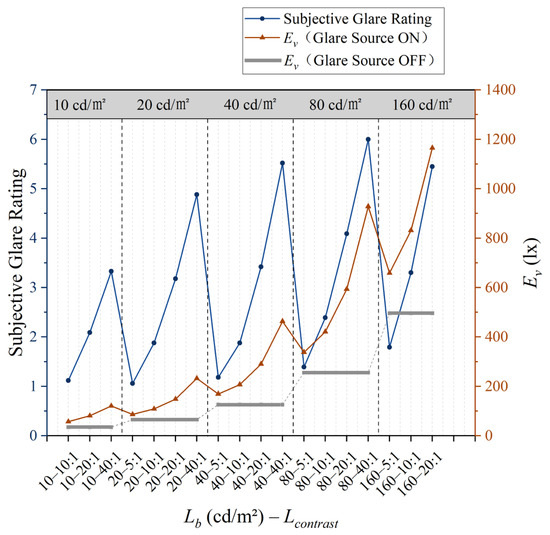
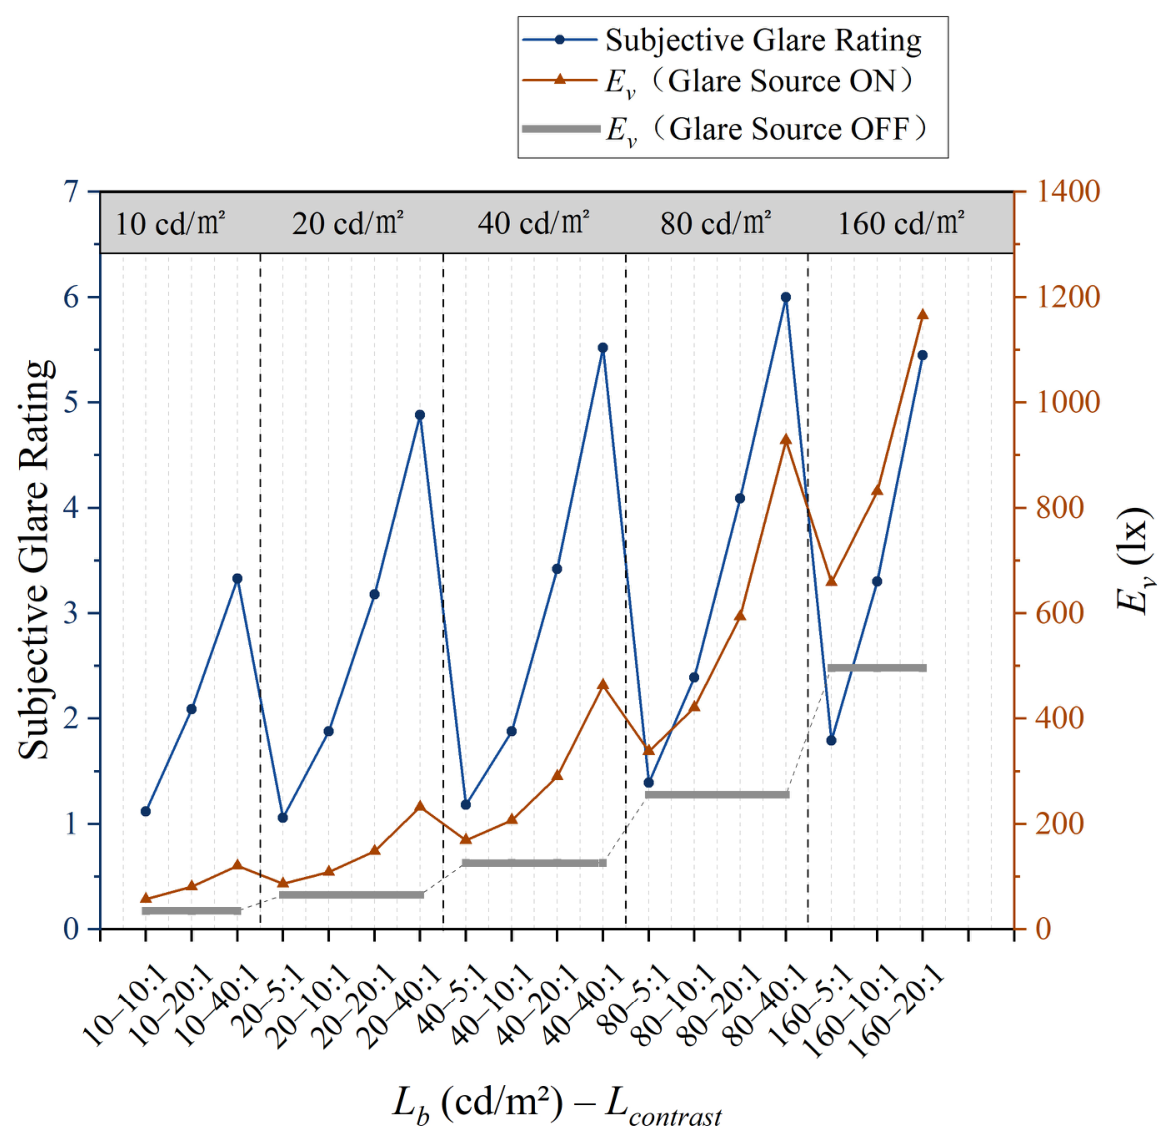
In existing glare evaluation models, the primary physical parameters used to represent visual adaptation are and Ev. As noted by Hopkinson [36], vertical surface light sources themselves influence the average luminance distribution within the observer’s field of view. Similarly, Wienold [17] argued that when a glare source occupies a large visual area, its luminance alone can substantially affect visual adaptation, such that parameters alone are insufficient to characterize the observer’s adaptation state. Accordingly, this study further investigated the role of Ev in the evaluation of discomfort glare caused by vertical surface light sources. When only ambient lighting was present, and Ev exhibited a strong linear relationship (r2 = 0.99). However, after activation of the vertical glare source, Ev demonstrated a trend similar to that of subjective glare ratings, as illustrated in Figure 13. Specifically, Ev increased with increasing and also exhibited systematic variation associated with the luminance characteristics of the light source.
Figure 13.
Relationship between subjective glare ratings and Ev.
In order to compare the explanatory power of Ev and with respect to subjective glare ratings, a multiple linear regression analysis was performed using subjective ratings as the dependent variable. The regression model demonstrated a good fit (R2 = 0.768, adjusted R2 = 0.765, p < 0.001). Based on the standardized regression coefficients, Ev (β = 1.757) exerted a stronger influence on subjective ratings and provided greater explanatory power than (β = −1.338). This may be because Ev incorporates not only the ambient illumination contributing to visual adaptation but also the direct contribution of the activated vertical light source. Therefore, Ev represents a composite measure of the overall light stimulus received by the eye, reflecting both the adaptation condition and the glare-source intensity. Furthermore, because Ev is primarily determined by and , an additional linear regression analysis was conducted with Ev as the dependent variable and and as independent variables. The results are presented in Table 10. No evidence of multicollinearity was observed among the independent variables, and significant relationships were identified between the predictors and the dependent variable. The regression model exhibited excellent goodness of fit, yielding the following equation:
Table 10.
Results of Linear Regression Analysis.
It should be noted that adopted in this study does not include the reflected contribution of the activated vertical light source to surrounding room surfaces. Consequently, the effective adaptation luminance during glare evaluation may be higher than the preset value. Nevertheless, because the same experimental definition and measurement procedure were consistently applied across all test conditions, the comparative effects of and on discomfort glare remain valid. This may also explain why Ev exhibited a stronger association with subjective discomfort glare than in the present study.
4. Discussion
4.1. Interaction Effects of and
The present study demonstrated a significant interaction effect between and on the perception of discomfort glare. Specifically, the effects of these two variables were not independent; rather, they exhibited a mutually reinforcing relationship. An increase in enhanced the influence of on subjective discomfort glare perception, as reflected by the progressively increasing partial η2 values. Similarly, increasing amplified the effect of on glare perception. These findings enrich the theoretical understanding of the mechanisms underlying discomfort glare caused by vertical surface light sources and provide practical implications for the design, application, and glare control of such lighting systems. For example, in environments requiring prolonged visual concentration, such as offices and classrooms, it is required to appropriately control the combined intensity of and , so as to minimize discomfort arising from their interaction. In contrast, in spaces where visual emphasis is desirable, such as exhibition halls and museums, and may be strategically balanced, while remaining within acceptable glare thresholds, to enhance visual focal points without inducing excessive discomfort glare.
Furthermore, the findings are consistent with the physiological and psychological mechanisms underlying discomfort glare perception associated with vertical surface light sources. and jointly influence glare perception through the pathway of “visual adaptation level– perception.” determines the observer’s baseline state of visual adaptation. As increases, the visual system becomes less tolerant of luminance variations, making more perceptually salient and thereby intensifying discomfort glare. Conversely, increasing accentuates luminance nonuniformity within the visual field, which in turn magnifies the influence of on visual comfort.
These findings are consistent with the conclusions reported by Konstantzos et al. [37], who noted that under low-background-luminance conditions, the Ev term in the first component of the Daylight Glare Probability (DGP) model decreases, while Ev simultaneously appears in the denominator of the contrast term in the second component of the equation. Consequently, the enhanced contrast effect under dim conditions results in increased overall glare perception. This interpretation is also consistent with the findings of Quek et al. [38], who reported that under relatively dim lighting conditions, contrast-driven glare metrics (i.e., luminance ratios within the visual field) exhibit stronger predictive performance than saturation-driven metrics such as Ev. In brighter environments, however, Ev demonstrates a stronger correlation with glare perception.
Based on both the subjective and objective ANOVA results, exerted a substantially greater influence on discomfort glare than . Vertical surface light sources occupy a considerable portion of the observer’s visual field. From the perspective of visual perception, variations in directly stimulate the retina, whereas influences glare perception indirectly by modulating the visual adaptation state of the eye. Consequently, the dominant role of in discomfort glare perception becomes more pronounced in environments involving vertical surface light sources. Due to the high unavoidability of vertical surface light sources within the central visual field, their luminance contributes directly to the observer’s adaptation level. Therefore, the use of Ev as an indicator of environmental adaptation is both reasonable and highly applicable in the evaluation of discomfort glare associated with vertical surface light sources. In addition, under conditions of high but low , the subjective ratings obtained in this study did not exhibit statistically significant differences. This finding differs slightly from the results reported by Bian [39], which may be attributable to differences in the experimental setup. In the present study, under the lowest condition (5:1), the maximum was limited to 800 cd/m2. Compared with the 200 cd/m2 and 400 cd/m2 conditions, this luminance level may have been insufficient to produce distinct stepwise differences in perceived glare intensity. Nevertheless, the findings of this study indicate that although is not the sole determinant of visual discomfort, it represents the primary factor contributing to discomfort glare in applications involving vertical surface light sources.
4.2. Characteristics and Physiological Mechanisms of Subjective Perception and Objective Pupillary Responses
The results of the subjective and objective analyses indicate that subjective glare perception and physiological pupillary responses may diverge under different conditions. This finding complements and extends previous studies reporting consistency between subjective and objective indicators, further highlighting the necessity of establishing a multidimensional evaluation framework for discomfort glare.
The experimental results demonstrate that PDCR is more sensitive under low conditions. In low-luminance environments, the human visual system operates in a dark-adapted state, in which the pupil maintains a relatively large aperture. Under such conditions, stimuli induce more pronounced pupillary constriction and accommodative responses, indicating that the visual system exhibits heightened sensitivity to luminance variations in dim environments. This pupillary response serves as a negative-feedback regulatory mechanism that mitigates excessive retinal stimulation caused by high-intensity light.
As increases, PDCR generally decreases and gradually stabilizes, suggesting that physiological pupillary regulation possesses an inherent response threshold and upper limit [40]. Under high-luminance conditions, the visual system enters a light-adapted state, in which the pupil is already maintained at a relatively constricted baseline diameter. Consequently, the range of additional physiological adjustment in response to stimuli becomes substantially limited, resulting in a saturation effect in the pupillary response. This phenomenon is highly consistent with the physiological thresholds and adaptive regulation characteristics of the pupillary light reflex.
Therefore, under low conditions, subjective glare perception may remain relatively weak, while physiological indicators such as PDCR may already exhibit strong responses. This finding suggests that relying solely on subjective glare evaluations may underestimate the potential risk of visual fatigue and discomfort in low-luminance, high-contrast environments. In contrast, subjective glare rating generally increased with increasing and remained elevated under medium- and high-luminance conditions, indicating that subjective discomfort glare perception is more sensitive to under brighter adaptation environments. The findings of this study provide practical implications for indoor lighting design, architectural lighting applications, and lighting systems in specialized environments. Given the high sensitivity of PDCR under low conditions, priority should be given to controlling in low-illuminance environments, such as nighttime indoor spaces and underground facilities, in order to prevent excessive luminance differences that may trigger excessive pupillary accommodation and contribute to visual fatigue and discomfort. Conversely, because subjective glare perception is highly sensitive under medium- and high-luminance conditions, lighting systems in offices and public indoor spaces should strictly control , optimize the spatial arrangement and luminance distribution of vertical surface light sources, and thereby reduce subjective discomfort glare while improving visual comfort and lighting ergonomics.
4.3. Limitations and Future Research Directions
This study has several limitations regarding the experimental design, sample characteristics, and the range of experimental conditions. First, the adopted in this study did not include the reflected contribution of the activated vertical light source to surrounding room surfaces. Consequently, the effective adaptation luminance during glare evaluation may have been higher than the preset value. Nevertheless, the comparative effects of and remain valid because the same experimental procedure was consistently applied across all conditions. Future studies should quantify the reflected contribution of vertical surface light sources to better characterize visual adaptation under practical lighting environments. Second, the sample size was relatively limited, and all participants were young adults with similar educational backgrounds. Future studies should include larger and more diverse participant groups, incorporating individuals of different age ranges and visual health conditions, in order to further validate the observed subjective and physiological response patterns. Research could also extend the range of luminance gradients and contrast levels to more comprehensively examine the mechanisms underlying discomfort glare perception under broader environmental conditions. In addition, the present study did not consider other potentially influential variables, such as spectral characteristics of the light source (e.g., CCT) and exposure duration. Variations in these factors may further modulate the relationship between subjective glare perception and physiological responses, including pupillary responses. Future studies should therefore adopt multivariate experimental designs to investigate the interaction mechanisms among multiple lighting parameters, thereby providing more robust empirical support for the optimization and refinement of discomfort glare evaluation models.
5. Conclusions
This study combined subjective glare evaluations with objective eye-tracking data based on PDCR to investigate the effects of and on discomfort glare perception caused by vertical surface light sources. In addition, the influence of on visual adaptation was explored. Under the experimental conditions and for the vertical surface light sources investigated in this study, the main conclusions are summarized as follows:
- (1)
- (p < 0.05, partial η2 = 0.689), (p < 0.05, partial η2 = 0.368), and their interaction effect (p < 0.05, partial η2 = 0.057) all exerted statistically significant influences on subjective discomfort glare perception.
- (2)
- The interaction between and was characterized by a mutually reinforcing effect: the glare sensation induced by one factor increased as the level of the other factor increased. Specifically, higher resulted in stronger discomfort glare perception, while increasing enhanced the explanatory power of with respect to subjective glare ratings.
- (3)
- The luminance of vertical light sources significantly influenced the observer’s visual adaptation level. Ev exhibited a stronger relationship with subjective glare ratings than . Under the present experimental conditions, Ev showed a stronger association with the observed visual adaptation response and may serve as a composite saturation-related indicator for evaluating discomfort glare associated with vertical surface light sources.
- (4)
- exerted the strongest influence on discomfort glare perception, particularly under low conditions. For lighting environments involving vertical surface light sources, both glare-generation mechanisms, the contrast effect, and the saturation effect, should be considered simultaneously.
- (5)
- PDCR demonstrated higher sensitivity under low conditions and more effectively reflected the early physiological stress responses of the visual system to light stimuli. Therefore, for discomfort glare caused by vertical surface light sources under similar experimental conditions, assessment should not rely solely on either subjective evaluations or objective physiological indicators. Instead, integrating subjective and physiological measures may provide a more comprehensive characterization of discomfort glare perception.
The generalizability of these findings to other populations (e.g., older adults), spatial scales, lighting configurations, and application contexts requires further validation. Nevertheless, the present findings provide a useful reference and basis for future research aimed at extending the evaluation of discomfort glare from vertical surface light sources to a broader range of spatial and lighting conditions.
Author Contributions
Conceptualization, G.K. and L.W.; methodology, G.K. and L.W.; validation, G.K.; formal analysis, G.K.; investigation, G.K., F.M. and L.W.; resources, L.W.; writing—original draft preparation, G.K.; writing—review and editing, G.K. and L.W.; visualization, G.K. and F.M.; supervision, L.W.; project administration, B.Z. All authors have read and agreed to the published version of the manuscript.
Funding
This research was funded by National Natural Science Foundation of China (52278120) and the Research Start-up Fund of North China University of Technology (110051360026XN085-69).
Institutional Review Board Statement
The study was approved by the Ethics Committee of Tianjin University (12 April 2024).
Informed Consent Statement
Informed consent was obtained from all subjects involved in the study.
Data Availability Statement
The data presented in this study are available on request from the corresponding author.
Conflicts of Interest
The authors declare no conflicts of interest.
Abbreviations
The following abbreviations are used in this manuscript:
| Background luminance | |
| Vertical light source luminance | |
| Luminance contrast | |
| PDCR | The pupil diameter change rating |
| Vertical illuminance at the eye | |
| UGR | Unified Glare Rating |
References
- Kent, M.G. Correspondence: What is discomfort from glare and how should we measure it? Light. Res. Technol. 2025, 57, 665–667. [Google Scholar] [CrossRef] [Scilit]
- Hamedani, Z.; Solgi, E.; Skates, H.; Hine, T.; Fernando, R.; Lyons, J.; Dupre, K. Visual discomfort and glare assessment in office environments: A review of light-induced physiological and perceptual responses. Build. Environ. 2019, 153, 267–280. [Google Scholar] [CrossRef] [Scilit]
- Mork, R.; Falkenberg, H.K.; Fostervold, K.I.; Thorud, H.-M.S. Discomfort glare and psychological stress during computer work: Subjective responses and associations between neck pain and trapezius muscle blood flow. Int. Arch. Occup. Environ. Health 2020, 93, 29–42. [Google Scholar] [CrossRef] [Scilit] [PubMed]
- Aghajari, S.; Chen, C.C. Lighting Design for Visual Comfort and Energy Efficiency Considerations: A Patient Room Case Study. Int. J. Eng. Technol. Innov. 2025, 15, 223. [Google Scholar] [CrossRef] [Scilit]
- Smolders, K.C.; de Kort, Y.A. Bright light and mental fatigue: Effects on alertness, vitality, performance and physiological arousal. J. Environ. Psychol. 2014, 39, 77–91. [Google Scholar] [CrossRef] [Scilit]
- CIE S 017/E:2020; International Lighting Vocabulary. CIE Bureau Central: Vienna, Austria, 2020. [CrossRef] [Scilit]
- Olsson, Z.E.; Govén, T.; Selvander, M.; Laike, T.; Sjöberg, K. Perception of discomfort glare in relation to the CIE Unified Glare Rating scale (UGR) and the impact of ambient light on both UGR and Subjective Glare Indexes (SGIs). Indoor Environ. 2026, 3, 100149. [Google Scholar] [CrossRef] [Scilit]
- Vissenberg, M.; Perz, M.; Donners, M.; Sekulovski, D. A generic, visual system-based model for discomfort from glare, Light. Res. Technol. 2023, 55, 400–413. [Google Scholar] [CrossRef] [Scilit]
- CIE, Research Strategy. Available online: https://cie.co.at/research-strategy (accessed on 30 April 2024).
- Zhao, J.; Gao, Y.; Wang, S.; Luo, T. Technological Trends of Luminous Environment Improvement. Build. Sci. 2022, 38, 14–19. (In Chinese) [Google Scholar] [CrossRef]
- Kong, G.; Wang, L.; Chen, P.; Wang, S.; Ma, F. Morphological and Position Factors of Vertical Surface Light Source Affecting Discomfort Glare Perception. Buildings 2024, 14, 1227. [Google Scholar] [CrossRef] [Scilit]
- Bargary, G.; Jia, Y.X.; Barbur, J.L. Mechanisms for discomfort glare in central vision. Investig. Ophthalmol. Vis. Sci. 2015, 56, 464–471. [Google Scholar] [CrossRef] [Scilit] [PubMed]
- Hamedani, Z.; Solgi, E.; Hine, T.; Skates, H.; Isoardi, G.; Fernando, R. Lighting for work: A study of the relationships among discomfort glare, physiological responses, and visual performance. Build. Environ. 2020, 167, 106478. [Google Scholar] [CrossRef] [Scilit]
- Kent, M.G.; Fotios, S.; Altomonte, S. An experimental study on the effect of visual tasks on discomfort due to peripheral glare. Leukos 2019, 15, 17–28. [Google Scholar] [CrossRef] [Scilit]
- Dang, R.; Gao, Z.; Hu, Z.; Cong, Y.; Sun, X. Glare quantification in Chinese museum exhibition halls based on visual field luminance distribution. Dev. Built Environ. 2023, 16, 100237. [Google Scholar] [CrossRef] [Scilit]
- Huang, W.; Yang, Y.; Luo, M. Discomfort glare caused by white LEDs having different spectral power distributions. Light. Res. Technol. 2018, 50, 921–936. [Google Scholar] [CrossRef] [Scilit]
- Wienold, J.; Christoffersen, J. Evaluation methods and development of a new glare prediction model for daylight environments with the use of CCD cameras. Energy Build. 2006, 38, 743–757. [Google Scholar] [CrossRef] [Scilit]
- Pierson, C.; Wienold, J.; Bodart, M. Review of Factors Influencing Discomfort Glare Perception from Daylight. Leukos 2018, 14, 111–148. [Google Scholar] [CrossRef] [Scilit]
- Garretón, J.Y.; Jain, S.; Villalba, A.M.; Christoffersen, J.; Kuhn, T.E.; Pattini, A.; Wienold, J. The influence of daytime on discomfort glare: Results of an inter-laboratory comparative study. Energy Build. 2026, 361, 117470. [Google Scholar] [CrossRef] [Scilit]
- Kong, G.; Chen, P.; Wang, L.; Chen, S.; Yu, J.; Chen, Z. Calibration of brightness of virtual reality light sources based on user perception in the real environment. J. Build. Eng. 2023, 78, 107702. [Google Scholar] [CrossRef] [Scilit]
- Huang, B.; Wang, L.; Chen, T.; Kong, G.; Shuai, R.; Chen, P. The influence of interface proportions on visual guidance perception in node spaces. Build. Environ. 2025, 272, 112661. [Google Scholar] [CrossRef] [Scilit]
- Cai, H. Luminance gradient for evaluating lighting. Light. Res. Technol. 2016, 48, 155–175. [Google Scholar] [CrossRef] [Scilit]
- Suk, J.Y. Luminance and vertical eye illuminance thresholds for occupants’ visual comfort in daylit office environments. Build. Environ. 2019, 148, 107–115. [Google Scholar] [CrossRef] [Scilit]
- CIE. Discomfort Glare in Interior Lighting: No.117:1995; Commission Internationale de l’Éclairage (CIE): Vienna, Austria, 1995. [Google Scholar]
- CIE. Discomfort Caused by Glare from Luminaires with Non-Uniform Source Luminance: CIE 232:2019; Commission Internationale de l’Éclairage (CIE): Vienna, Austria, 2019. [Google Scholar]
- Lin, Y.; Qiu, J.; Liu, Y. Research Status and Development on Discomfort Glare, China. Illum. Eng. J. 2016, 27, 7–13. (In Chinese) [Google Scholar]
- Hirning, M.B.; Isoardi, G.L.; Garcia-Hansen, V.R. Prediction of discomfort glare from windows under tropical skies. Build. Environ. 2017, 113, 107–120. [Google Scholar] [CrossRef] [Scilit]
- Hansen, P.; Sarey Khanie, M.; Kuhn, T.; Christoffersen, J.; Wienold, J.; Andersen, M. Glare caused by contrast between task and immediate surround: An evaluation of luminance distribution in the field of view. In Proceedings of the Lighting Quality & Energy Efficiency Conference 2016; CIE Central Bureau: Vienna, Austria, 2016. [Google Scholar]
- Kim, W.; Koga, Y. Effect of local background luminance on discomfort glare. Build. Environ. 2004, 39, 1435–1442. [Google Scholar] [CrossRef] [Scilit]
- Kent, M.G.; Fotios, S.; Altomonte, S. Discomfort glare evaluation: The influence of anchor bias in luminance adjustments. Light. Res. Technol. 2019, 51, 131–146. [Google Scholar] [CrossRef] [Scilit]
- Brémond, R. Stimulus Range Effect in Discomfort Glare Studies. Light Eng. 2022, 30, 40–46. [Google Scholar] [CrossRef] [Scilit] [PubMed]
- Dilaura, D.L.; Houser, K.W.; Mistrick, R.G.; Steffy, G.R. The IESNA Lighting Handbook: Reference & Application, 10th ed.; Illuminating Engineering Society of North America: New York, NY, USA, 2011. [Google Scholar]
- Suk, J.Y.; Schiler, M.; Kensek, K. Investigation of existing discomfort glare indices using human subject study data. Build. Environ. 2017, 113, 121–130. [Google Scholar] [CrossRef] [Scilit]
- Linney, A.S. Maximum Luminances and Luminance Ratios and Their Impact on Users’ Discomfort, Glare Perception, and Productivity in Daylit Offices. Master’s Thesis, Victoria University of Wellington, Wellington, New Zealand, 2008. [Google Scholar]
- Liu, Y. A Study on the Influence Mechanism of the Glare from LED on the Psychological and Physiological Response. Master’s Thesis, Fudan University, Shanghai, China, 2014. (In Chinese) [Google Scholar]
- Hopkinson, R.G. Glare from daylighting in buildings. Appl. Ergon. 1972, 3, 206–215. [Google Scholar] [CrossRef] [Scilit] [PubMed]
- Konstantzos, I.; Tzempelikos, A.; Chan, Y.C. Experimental and simulation analysis of daylight glare probability in offices with dynamic window shades. Build. Environ. 2015, 87, 244–254. [Google Scholar] [CrossRef] [Scilit]
- Quek, G.; Wienold, J.; Khanie, M.S.; Erell, E.; Kaftan, E.; Tzempelikos, A.; Konstantzos, I.; Christoffersen, J.; Kuhn, T.; Andersen, M. Comparing performance of discomfort glare metrics in high and low adaptation levels. Build. Environ. 2021, 206, 108335. [Google Scholar] [CrossRef] [Scilit]
- Bian, Y.; Luo, T. Investigation of visual comfort metrics from subjective responses in China: A study in offices with daylight. Build. Environ. 2017, 123, 661–671. [Google Scholar] [CrossRef] [Scilit]
- Lin, Y.; Fotios, S.; Wei, M.; Liu, Y.; Guo, W.; Sun, Y. Eye movement and pupil size constriction under discomfort glare. Investig. Ophthalmol. Vis. Sci. 2015, 56, 1649–1656. [Google Scholar] [CrossRef] [Scilit] [PubMed]

Disclaimer/Publisher’s Note: The statements, opinions and data contained in all publications are solely those of the individual author(s) and contributor(s) and not of MDPI and/or the editor(s). MDPI and/or the editor(s) disclaim responsibility for any injury to people or property resulting from any ideas, methods, instructions or products referred to in the content. |
© 2026 by the authors. Licensee MDPI, Basel, Switzerland. This article is an open access article distributed under the terms and conditions of the Creative Commons Attribution (CC BY) license.