


Abstract
Construction equipment monitoring has shifted from manual logbooks and early telematics toward intelligent digital systems, driven by the need to reduce delays in obtaining equipment data and improve decision-making on construction sites. This study examines research on construction equipment monitoring and tracking published between 2000 and 2026 to identify the evolution, major themes, and emerging directions in the field. A scientometric and bibliometric analysis was conducted on 1093 bibliographic records retrieved from Scopus and Web of Science on 20 May 2026. The annual publication trend was evaluated through 2025, the last complete publication year, while records indexed in 2026 were retained for the remaining corpus-level analyses. The datasets were preprocessed and analyzed using Bibliometrix, VOSviewer, and CiteSpace to examine publication trends, keyword networks, collaboration patterns, citation structures, and research clusters. The keyword network was interpreted through six major thematic clusters, which were synthesized into four broader knowledge streams covering operations and sensing, AI-based perception, safety monitoring, and BIM/digital-twin integration. The results show a substantial increase in the representation of AI- and perception-related research across the later publication periods, reflecting a transition from basic sensor-based approaches toward more intelligent and connected site systems. The study identifies leading contributors and comparatively underdeveloped research priorities, particularly real-time idle-state detection, multimodal data fusion, multi-site validation, and the integration of monitoring outputs with BIM and digital-twin decision-support environments.
1. Introduction
Construction is a resource-intensive industry where efficient equipment management plays a critical role in project success. Heavy machinery, complex workflows, and dynamic site conditions create challenges not only for safety but also for productivity, utilization, and idle detection. Monitoring and tracking construction equipment has therefore become a central concern, shaping how projects are planned, executed, and optimized. Traditional monitoring approaches relied on manual inspections and supervisor observations, which were not only labor-intensive but also prone to human error [1,2]. These limitations motivated the exploration of systematic and automated solutions to improve equipment monitoring and tracking.
While efforts to monitor construction equipment can be traced back earlier, the early 2000s marked a turning point. This period aligned with the wider availability of digital records, the maturity of sensing technologies, and the expansion of global databases such as Scopus and Web of Science. As a result, GPS, RFID, ultra-wideband, and telematics began to be applied to equipment location, cycle-time analysis, proximity sensing, and utilization monitoring [3,4,5,6,7]. These approaches improved data acquisition and operational visibility, although many remained focused on tracking and classification rather than predictive or fully integrated decision support and lacked the ability to predict risks or capture complex site behaviors [8].
After 2015, advances in computer vision and deep learning marked a new stage in equipment monitoring. Applications included PPE detection, worker–equipment hazard monitoring, equipment detection and tracking, activity recognition, and productivity analysis [1,9,10,11,12,13,14,15,16,17]. These developments shifted the field from basic sensing toward AI-supported perception, enabling more proactive management of safety and productivity.
More recently, research has begun to connect monitoring outputs with BIM, knowledge graphs, and digital-twin environments for predictive monitoring and decision support [18,19,20]. These developments support the integration of live site information with planning, simulation, and project-control processes.
Existing reviews have examined several areas adjacent to construction equipment monitoring. Xu et al. [21] reviewed applications of artificial neural networks in construction management, Babalola et al. [22] mapped developments in Building Information Modeling research, and Owusu-Boadi et al. [23] examined environmental health and safety research in construction.
To position the present study in relation to the existing review literature, prior reviews were identified through targeted searches of Scopus and Web of Science using combinations of terms relating to construction equipment, heavy equipment, equipment monitoring, equipment tracking, activity recognition, productivity monitoring, utilization, computer vision, bibliometric analysis, scientometric analysis, and review studies. The reference lists of the retrieved reviews were also examined to identify additional relevant syntheses. Peer-reviewed reviews were retained for comparison when they either directly addressed construction-equipment monitoring or examined a closely adjacent monitoring domain needed to establish the broader research context.
The most relevant reviews identified through this procedure address construction-equipment monitoring, worker and equipment activity recognition, earthmoving-equipment productivity monitoring, and computer-vision-based construction monitoring. Nakanishi et al. [24] reviewed publications concerning the use of construction-equipment monitoring for project management, including geospatial technologies, imaging technologies, safety, progress monitoring, and BIM integration. Sherafat et al. [25] examined automated methods for activity recognition and performance monitoring of construction workers and equipment. Chen et al. [26] reviewed automated methods for earthmoving-equipment productivity monitoring. A closely adjacent recent review by Li et al. [27] examined computer-vision-based construction monitoring, including equipment detection, tracking, productivity assessment, datasets, evaluation methods, and field implementation considerations. Table 1 distinguishes these directly comparable reviews from adjacent reviews retained only to establish the broader digital-construction context.
Table 1.
Prior reviews and comparison with the present study.
Table 1 shows that the closest reviews address important individual dimensions of construction-equipment monitoring. Nakanishi et al. provide the broadest directly related narrative review of equipment monitoring for project management, while Sherafat et al. focus on worker and equipment activity recognition and Chen et al. concentrate on earthmoving-equipment productivity monitoring. Li et al. provide a recent synthesis of computer-vision-based construction monitoring, including equipment detection and tracking, but retain a broader construction-monitoring scope. Other reviews provide adjacent context concerning computer vision, visual computing, operator performance, and automatic project monitoring. The present study differs by combining equipment-level operational and technological dimensions with bibliometric and scientometric analyses of publication trends, collaboration, citation, co-citation, thematic structure, and temporal development across a 1093-record corpus.
Compared with the reviews summarized in Table 1, the novelty of the present study is defined by six connected features. First, it adopts an equipment-level focus rather than examining construction-wide digital technologies or project monitoring generally. Second, it integrates operational monitoring objectives with the technologies used to acquire and interpret equipment data. Third, it combines records from both Scopus and Web of Science. Fourth, it examines an extended publication period from 2000 to 20 May 2026. Fifth, it combines bibliometric and scientometric science mapping with a cluster-specific qualitative synthesis of representative publications. Sixth, it considers equipment utilization, idle-state detection, worker–equipment safety, AI-based perception, and BIM/digital-twin integration within one analytical framework. The contribution therefore extends beyond applying bibliometric tools to a different keyword domain by examining how these interconnected equipment-monitoring streams have developed, interacted, and remained unevenly represented.
Accordingly, the study analyzes 1093 bibliographic records indexed in Scopus and Web of Science between 2000 and 20 May 2026. The starting year was selected to capture the period in which digitally indexed research and sensor-based equipment-monitoring technologies became increasingly visible, while the endpoint captures recent developments in artificial intelligence, computer vision, BIM, and digital twins. Because the search was conducted in May, records indexed in 2026 were retained in the bibliographic corpus but excluded from the annual publication-trend analysis.
2. Research Aim and Questions
This study aims to map the development, intellectual structure, collaboration patterns, and emerging research directions of construction equipment monitoring between 2000 and May 2026. Bibliometric and scientometric methods were applied to identify changes in publication activity, influential contributors, thematic relationships, methodological transitions, and underexplored areas within the field.
The study focuses on the transition from early sensor-, GPS-, RFID-, and telematics-based monitoring toward computer vision, machine learning, deep learning, BIM, and digital twin applications. It also examines closely related research streams concerning equipment activity recognition, worker–equipment interaction, equipment-related safety monitoring, utilization, and idle-time detection.
The following research questions guided the analysis:
RQ1: How have the volume and temporal distribution of research on construction equipment monitoring evolved between 2000 and May 2026?
RQ2: What major thematic clusters and methodological transitions characterize the intellectual development of construction equipment monitoring research?
RQ3: Which authors, institutions, countries, journals, and publications have contributed most strongly to the development of the field, and how are their collaboration and citation networks structured?
RQ4: What research gaps and emerging directions are indicated by the bibliometric networks and the qualitative synthesis of representative publications?
These questions provide the structure for the subsequent analyses of publication growth, keyword networks, collaboration patterns, citation structures, thematic evolution, and future research priorities.
3. Methodology
3.1. Study Design
This study adopted a bibliometric and scientometric mapping design to examine the development and knowledge structure of construction equipment monitoring research. Unlike an intervention-focused systematic review, which evaluates the methodological quality and outcomes of individual empirical studies, the present study analyzes bibliographic metadata, publication relationships, citation structures, and thematic networks at the corpus level.
Two complementary analytical levels were used. First, quantitative bibliometric and scientometric analyses were conducted on the complete bibliographic corpus. Second, representative and influential publications associated with the principal thematic clusters were examined in greater detail to support the qualitative interpretation of the resulting networks.
A cluster-specific qualitative synthesis was also conducted to connect the bibliometric clusters with representative publications, analytical methods, principal findings, and recurrent limitations. The detailed synthesis is provided in Table S8 of the Supplementary Materials. Representative publications were selected through a multi-criterion purposive procedure. Publications were considered when they (1) addressed the dominant concepts or applications of the corresponding thematic cluster; (2) represented a distinctive or frequently used monitoring method; (3) occupied a prominent citation or co-citation position within the analyzed corpus, where applicable; or (4) provided recent evidence concerning an emerging topic that could be underrepresented by fixed citation thresholds. Selection was therefore not based solely on citation rank. The final set was reviewed across the six thematic clusters to ensure coverage of established sensing approaches, AI-based methods, operational applications, safety monitoring, and digital integration. The synthesis was intended to explain the methods, applications, findings, and recurring limitations associated with each cluster rather than to provide an exhaustive technical review of every publication.
Three levels of evidence were distinguished during interpretation. First, bibliometric and scientometric findings refer to patterns directly observed in the corpus, including publication counts, keyword frequencies and co-occurrences, citation and co-citation relationships, collaboration structures, and temporal distributions. Second, qualitative-synthesis findings refer to technical methods, reported applications, validation conditions, and recurrent limitations identified through examination of the selected representative publications. Third, broader implications, research priorities, and implementation recommendations represent interpretations proposed by the authors on the basis of the combined quantitative and qualitative evidence. These categories are identified explicitly in the Section 4 Section 5, Section 6 and Section 8.
The reporting process presented in Figure 1 was organized into five stages: database retrieval; data preparation and deduplication; bibliometric and scientometric analysis; visualization; and interpretation of the principal knowledge streams and research gaps.
Figure 1.
Research workflow of the scientometric and bibliometric analysis.
3.2. Data Sources and Retrieval Date
Bibliographic records were retrieved from the Scopus and Web of Science Core Collection databases. These databases were selected because of their broad coverage of peer-reviewed construction, engineering, information-technology, and multidisciplinary publications and their compatibility with commonly used bibliometric-analysis tools.
The searches were conducted on 20 May 2026. The bibliographic corpus included records indexed from January 2000 to the retrieval date. Because 2026 was incomplete, records from that year were retained for corpus-level bibliometric and network analyses but excluded from the annual publication-trend analysis and other comparisons requiring complete publication years.
The year 2000 was selected as the starting point because the period corresponds with the increasing availability of digitally indexed records and the expanding use of GPS, RFID, telematics, wireless sensors, and other digital monitoring technologies in construction.
3.3. Search Strategy
The search strategy combined three concept groups:
- Construction-equipment terms.
- Monitoring, tracking, and performance terms.
- Monitoring technologies and analytical methods.
The first group included general construction-equipment terminology and frequently studied equipment categories, including excavators, bulldozers, dump trucks, loaders, graders, compactors, and cranes. The second group represented monitoring and operational outcomes, such as tracking, detection, recognition, identification, utilization, idle time, productivity, and equipment performance. The third group included both traditional and digital monitoring methods, such as manual observation, time–motion studies, GPS, RFID, accelerometers, computer vision, machine learning, deep learning, and video analysis.
Specialized machine categories such as pavers, drilling rigs, and tunneling equipment were not used as individual seed terms because the search was designed to identify cross-cutting monitoring approaches across broadly recurring construction-equipment categories rather than to map each machine-specific literature separately. Studies concerning specialized equipment remained eligible when they were retrieved through the broader equipment terms and satisfied the monitoring and application criteria.
The three-block structure was intentionally designed as a precision-oriented search strategy. Each publication was required to include terminology relating to construction equipment, monitoring or operational performance, and a monitoring technology or analytical method. This approach reduced the retrieval of studies that mentioned equipment only incidentally and helped maintain the equipment-monitoring focus of the corpus. However, because terminology in this field is not fully standardized, some relevant studies using alternative umbrella expressions, emerging digital-technology terms, or highly specialized machine descriptions may not have been retrieved unless their metadata also contained one of the included search terms. The search strategy should therefore be interpreted as providing focused coverage of the principal equipment-monitoring research streams rather than exhaustive coverage of every possible terminology variant.
To assess the recall of the precision-oriented search strategy, a structured landmark-publication retrieval check was conducted. The benchmark set was compiled independently of the keyword-network results using directly related review studies and backward examination of their references. Publications were selected to represent the principal technological and operational streams identified before validation, including UWB localization, GPS/GNSS tracking, RFID-based proximity safety, fleet telematics, IoT-enabled monitoring, mobile-sensor activity recognition, computer-vision-based equipment detection, deep-learning activity analysis, BIM or digital-twin integration, and autonomous-equipment monitoring. Each benchmark publication was searched in the final corpus using its DOI and normalized title. The complete benchmark list, technology category, retrieval status, and validation procedure are reported in Table S3 of the Supplementary Materials. This test was intended to assess whether the search captured representative landmark research streams; it should not be interpreted as proof of exhaustive retrieval of every relevant publication. All 17 benchmark publications were identified in the retrieved analytical corpus through DOI or normalized-title matching, corresponding to a landmark-publication retrieval rate of 100% (17/17). This result supports the coverage of the principal historical and methodological streams represented by the benchmark set but does not demonstrate exhaustive retrieval of every potentially relevant publication.
Scopus search string:
TITLE-ABS-KEY((“construction equipment” OR “heavy equipment” OR excavator* OR bulldozer* OR “dump truck*” OR “wheel loader*” OR “backhoe loader*” OR “mobile crane*” OR “tower crane*” OR compactor* OR grader*) AND (tracking OR monitoring OR detection OR recognition OR identification OR idle OR utilization OR “resource efficiency” OR productivity OR “operation status” OR “equipment performance”) AND (“manual observation” OR “time-motion study” OR “sensor-based” OR RFID OR GPS OR accelerometer* OR “computer vision” OR “deep learning” OR “machine learning” OR AI OR “video analysis”))
Web of Science (WOS) search string:
TS = ((“construction equipment” OR “heavy equipment” OR excavator* OR bulldozer* OR “dump truck*” OR “wheel loader*” OR “backhoe loader*” OR “mobile crane*” OR “tower crane*” OR compactor* OR grader*) AND (tracking OR monitoring OR detection OR recognition OR identification OR idle OR utilization OR “resource efficiency” OR productivity OR “operation status” OR “equipment performance”) AND (“manual observation” OR “time-motion study” OR “sensor-based” OR RFID OR GPS OR accelerometer* OR “computer vision” OR “deep learning” OR “machine learning” OR AI OR “video analysis”))
3.4. Scope and Eligibility Criteria
The inclusion and exclusion criteria used to define the analytical corpus are summarized in Table 2.
Table 2.
Inclusion and exclusion criteria used to define the bibliometric corpus.
3.5. Retrieval and Deduplication
The initial database searches identified 1529 records from Scopus and 685 records from Web of Science. Language filtering excluded 74 Scopus records and five Web of Science records, leaving 1455 and 680 English-language records, respectively. Metadata-based eligibility screening was subsequently conducted using the publication period, title, abstract, keywords, document type, application context, equipment relevance, and monitoring relevance defined in Table 2. This screening excluded 466 Scopus records and 338 Web of Science records that did not meet the defined scope. Consequently, 989 Scopus records and 342 Web of Science records were retained, producing a combined total of 1331 records before deduplication.
Records identified as retracted were excluded before creation of the final analytical corpus. The 1331 retained database records were subsequently merged, and 238 duplicate entries were identified through DOI matching and normalized-title comparison. Their removal yielded a final analytical corpus of 1093 unique bibliographic records, as shown in Figure 2. This final corpus was used for all descriptive, bibliometric, scientometric, network, and qualitative analyses reported in the study.
Figure 2.
Bibliographic data-retrieval, screening, merging, and deduplication workflow.
The final corpus was subsequently checked for basic metadata completeness, publication year, document type, and retraction status. Additional methodological information, including the reported database search strategies, eligibility criteria, screening counts, data-cleaning procedures, extracted variables, and analytical settings, is provided in the Supplementary Materials to support transparency and facilitate replication.
The final corpus included a range of publication types, with journal articles, conference papers, proceedings papers, and review articles, as shown in Table 3. This dataset serves as the foundation for the present bibliometric and scientometric study.
Table 3.
Document types of the retrieved publications.
3.6. Screening and Relevance Assessment
Because the study was designed primarily as a bibliometric and scientometric mapping review, eligibility for the quantitative corpus was assessed using bibliographic metadata, particularly titles, abstracts, author keywords, index keywords, document types, and publication years. A conventional intervention-review procedure requiring full-text eligibility assessment of every record was not applied because the principal units of analysis were publications and bibliographic relationships rather than intervention outcomes or effect estimates.
Nevertheless, full texts were consulted where the relevance or interpretation of a representative publication could not be established adequately from its bibliographic metadata. Full texts of influential, highly cited, recent, and cluster-representative publications were also examined when interpreting the principal knowledge streams and preparing the cluster-specific qualitative synthesis.
The initial metadata screening was conducted by the first author. A second author subsequently reviewed records whose eligibility was uncertain under the predefined application-context, equipment-relevance, monitoring-relevance, publication-type, or bibliographic criteria. This second-author assessment was used as a targeted adjudication procedure rather than as a fully independent duplicate screening of the complete record set or a predefined random sample. The number and proportion of records reassessed by the second author, and the number of initial disagreements, were not prospectively logged in a form that could be reconstructed reliably. Where differences in interpretation occurred, they were resolved through discussion and consensus using the predefined eligibility criteria. Consequently, no formal inter-reviewer agreement statistic was calculated. Accordingly, the targeted second-author adjudication should not be interpreted as independent validation of the complete metadata-screening process.
3.7. Data Extraction and Cleaning
The principal bibliographic variables extracted from the database records included the following:
- Publication title.
- Authors and author identifiers, where available.
- Publication year.
- Source title.
- Document type.
- Abstract.
- Author keywords.
- Indexed keywords.
- Author affiliations.
- Countries represented in the author affiliations.
- Digital object identifier.
- Cited references.
- Total citation count.
These variables supported the analysis of annual publication output, document types, keyword co-occurrence, thematic development, author collaboration, institutional collaboration, international collaboration, citation networks, source influence, author influence, and document co-citation structures.
The study did not extract intervention-level variables such as sample size, effect size, experimental accuracy, or risk-of-bias scores from every publication because the primary purpose was science mapping rather than comparison of experimental outcomes. Technical findings from representative papers were instead examined during the cluster-specific qualitative synthesis.
Before analysis, the Scopus and Web of Science exports were converted into a common bibliographic structure. Duplicate publications were identified using DOI matching and normalized-title comparison. Titles were normalized by converting text to a consistent letter case and removing obvious differences in punctuation, spacing, and special characters.
Where the same publication was indexed in both databases, DOI matching was used as the primary reconciliation rule, followed by normalized-title matching when DOI information was unavailable or incomplete. The source records were consolidated into one canonical record. Because the final analytical file was structured in a Scopus-compatible format, the Scopus record was used as the primary metadata record where available, while non-empty keyword and affiliation information from Web of Science was retained when it supplied additional information.
Scopus and Web of Science citation counts were stored separately and were neither summed nor averaged. For duplicate records, the Scopus citation count was used as the harmonized corpus citation value; records available from only one database retained the citation value reported by that database. Cited-reference information was retained from the Scopus record where available, with Web of Science metadata used to fill missing fields. Early-access and final-version records sharing the same DOI or normalized title were consolidated, with final-version bibliographic metadata preferred where available. All citation values reflect the database exports retrieved on 20 May 2026.
Author-level indicators were calculated using full counting after author-name harmonization. Each unique corpus publication was attributed once to every listed author, and the complete harmonized citation value of that publication was assigned to each coauthor. For each author, corpus publications represent the number of unique records attributed to that author, total citations represent the sum of the harmonized citation values of those records, and mean citations per publication were calculated by dividing total citations by corpus publications. The h-index, g-index, and m-index were calculated from the same corpus-specific publication and citation data. These indicators describe author visibility within the analyzed corpus and should not be interpreted as complete career-level metrics.
Source-title variants were harmonized before calculating source-level indicators. Capitalization differences and clearly equivalent database-specific journal labels were consolidated under a single recognized source title. Each unique publication was counted once under its corresponding source. Early-access and final-version records sharing the same DOI or normalized title had already been consolidated and were therefore not counted separately. Source-level total citations were calculated by summing the harmonized citation values of the corresponding corpus publications. Mean citations per publication were calculated by dividing the source’s total harmonized citations by its number of corpus publications.
Author-name variants were reviewed using the available full names, initials, author identifiers, publication titles, DOI information, and affiliation context. Variants were merged only when the available metadata provided sufficient evidence that they represented the same individual. Ambiguous labels were retained separately to avoid incorrectly combining different authors. In the manuscript text and tables, incomplete labels such as “S. Chi” and “Zhenhua” were replaced with standardized full names where these could be reliably verified.
Institutional names were standardized to their commonly recognized English forms. Variations caused by abbreviations, department-level labels, spelling differences, or changes in punctuation were consolidated under the corresponding parent institution where the institutional identity was clear. Department, faculty, and laboratory names were not treated as separate organizations when they belonged to the same university or research institution.
Country names were standardized using consistent English labels; for example, variations such as “USA,” “United States,” and “United States of America” were harmonized as “United States.” For publications containing multiple affiliations or countries, all reported affiliations were retained under the full-counting approach. A publication involving more than one country therefore contributed to each represented country and to the corresponding international collaboration links.
Keyword cleaning was conducted using a documented VOSviewer 1.6.20 thesaurus. Singular and plural variants, spelling variants, hyphenated and non-hyphenated forms, capitalization variants, and established abbreviations were harmonized only when they represented the same concept. Generic bibliographic terms without substantive relevance were excluded, while technologically distinct concepts were retained separately. The complete keyword harmonization and exclusion rules are provided in Supplementary Files S1a and S1b.
These procedures reduced fragmentation caused by spelling variants and abbreviated labels. Nevertheless, bibliographic name disambiguation cannot eliminate every ambiguity, particularly where authors share initials or where affiliation data are incomplete. The resulting collaboration networks should therefore be interpreted as descriptive representations of the available database metadata. The principal label-harmonization rules are reported in the Supplementary Materials.
3.8. Analytical Tools and Methods
The analyses were conducted using Bibliometrix 5.1.1 [31], VOSviewer 1.6.20 [32], and CiteSpace 6.3.R1 [33]. Bibliometrix, implemented in the R 4.5.1 within RStudio 2025.09.1 environment, was used for bibliographic data processing and descriptive analysis. VOSviewer was used to construct and visualize keyword co-occurrence, co-authorship, citation, and co-citation networks. CiteSpace 6.3.R1 was used to generate a document co-citation timeline covering the complete publication years from 2000 to 2025. The analysis used cited references as the node type, one-year time slices, g-index selection with k = 5, a link-retaining factor of 2.5, a five-year look-back period, and no pruning. The resulting network contained 266 nodes and 844 links, with a density of 0.0239. The largest connected component contained 164 nodes, representing 61% of the network. The network produced a modularity Q of 0.7941 and a weighted mean silhouette of 0.9385. These indicators were used to support interpretation of the broad temporal co-citation structure and were not treated as measures of publication quality or technical performance.
Citation-burst analysis was used to identify references that experienced marked increases in citation attention during specific periods, while betweenness centrality was used to identify references occupying bridging positions between different parts of the co-citation network. These indicators were interpreted as network-specific structural evidence rather than measures of publication quality, methodological rigor, or technical performance.
Full counting was used for the reported VOSviewer analyses, and the analysis-specific thresholds and resulting network sizes are reported in Table 4 and Table S6 of the Supplementary Materials. The CiteSpace timeline was interpreted as complementary temporal evidence alongside the VOSviewer keyword-overlay analysis and the document-level temporal keyword comparison. Corpus-wide descriptive counts, rankings, and VOSviewer network results were derived from the final harmonized bibliographic corpus.
Table 4.
Network-analysis settings and resulting networks.
To provide quantitative evidence for the temporal development of monitoring technologies, the harmonized author and indexed keywords were examined across four complete-year periods: 2001–2009, 2010–2015, 2016–2020, and 2021–2025. Keywords were grouped into two predefined technology families using exact, case-insensitive matching of the harmonized author and indexed keyword tokens produced through Supplementary File S1a. The location-and-sensing family comprised GPS, RFID, tracking, position tracking, resource tracking, location, sensor, positioning, UWB, GNSS, LiDAR, and telematics. The AI-and-perception family comprised AI, machine learning, deep learning, computer vision, object detection, object recognition, activity recognition, action recognition, convolutional neural network, neural network, deep neural network, recurrent neural network, image processing, image segmentation, pose estimation, machine vision, vision-based, pattern recognition, and perception. Each publication was counted once within a technology family when at least one exact harmonized keyword matched the corresponding dictionary. The two families were non-exclusive because an individual publication could contain terms from both groups. The incomplete 2026 publication year was excluded from this temporal comparison.
To integrate the thematic and intellectual-structure analyses, a structured cross-map correspondence assessment was conducted. The prominent documents, authors, and publication sources identified in the co-citation networks were compared with the six thematic clusters interpreted from the keyword co-occurrence network. Correspondence was established by examining the subject, methods, applications, and dominant concepts of the frequently co-cited publications and authors and matching them with the thematic cluster definitions used in the Results and the representative-publication synthesis in Table S8. Because the keyword and co-citation networks use different units of analysis, thresholds, and link definitions, this procedure was treated as a qualitative cross-map synthesis rather than a statistical correlation between network coordinates. A publication or author could contribute to more than one thematic cluster where its work connected multiple monitoring applications.
3.9. Network Thresholds and Interpretation
For the principal keyword co-occurrence analysis, all keywords were analyzed using full counting and a minimum occurrence threshold of 10. The resulting network contained 156 keywords. The network structure was examined based on the dominant keywords, link patterns, applications, and conceptual relationships, leading to the interpretation of six major thematic clusters and four broader knowledge streams, which are presented in Section 4.2.
A limited threshold-sensitivity analysis was conducted by reconstructing the keyword network using minimum occurrence thresholds of 8 and 15 while retaining the same final dataset, main thesaurus, all-keyword unit of analysis, full-counting method, normalization procedure, and clustering settings. The analysis assessed whether the six major thematic domains and four broader knowledge streams remained identifiable under less and more restrictive threshold settings. The results are reported in Table S7a of the Supplementary Materials. The minimum occurrence threshold of 10 was retained as the principal setting because it provided an intermediate balance between the broader and denser threshold-8 network and the smaller, more consolidated threshold-15 network, while preserving the six major thematic domains and four broader knowledge streams.
A supplementary seed-term robustness analysis was conducted to evaluate whether the thematic structure was driven primarily by terminology included in the database query. Five dominant query-derived terms—construction equipment, deep learning, computer vision, machine learning, and excavator—were excluded, and the keyword network was reconstructed using the same full-counting method, minimum occurrence threshold of 10, and clustering settings as the principal analysis. The resulting network and comparative indicators are provided in Figure S1 and Table S7b of the Supplementary Materials.
Recent developments were examined separately through the keyword-overlay visualization, CiteSpace timeline analysis, and the qualitative discussion of publications from 2024–2026.
The resulting maps were interpreted as descriptive representations of patterns within the analyzed corpus. Network size, node prominence, link strength, and cluster membership are influenced by data-cleaning, counting, threshold, normalization, and clustering choices. These indicators describe publication, co-occurrence, citation, and collaboration structures rather than causal relationships, technical performance, research quality, technological maturity, or industry adoption. Accordingly, the interpretation emphasizes broad recurring patterns rather than small differences in node position or cluster boundaries.
3.10. Dataset Quality Assurance
Formal intervention-oriented risk-of-bias tools were not applied because the study did not combine clinical, experimental, or causal effect estimates. The unit of analysis was bibliographic metadata rather than the methodological outcomes of individual interventions.
Instead, data-quality assurance included the following:
- Use of two major bibliographic databases.
- Documentation of the reported database search strategies.
- DOI- and title-based duplicate identification.
- Verification of publication years and document types.
- Examination of missing and inconsistent metadata.
- Reporting of all network thresholds and analytical settings.
- Verification of retraction status.
- Cross-checking of comparable descriptive outputs across analytical tools, where applicable.
4. Results and Analysis
The scientometric and bibliometric analyses revealed important insights into the evolution of research on construction equipment monitoring. This section presents the findings in terms of publication trends, keyword patterns, co-authorship and country collaboration networks, citation and co-citation structures, and an integrated discussion of implications.
4.1. Publication Trends and Growth
Annual publication output remained very limited in the early stage (2000–2010) as shown in Figure 3, with fewer than 20 papers per year. Research during this period was largely exploratory, focusing on GPS, RFID, wireless localization, and basic equipment-tracking applications [3,4,5,6]. Between 2010 and 2016, output increased modestly, stabilizing at around 20–30 papers per year, reflecting a gradual but steady adoption of digital sensing methods in construction monitoring.
Figure 3.
Annual publication output from 2000 to 2025. Black bars represent the number of publications in each complete year, and the blue line represents the fitted publication trend. Records indexed in 2026 were retained in the complete bibliographic corpus but excluded from the annual trend analysis because 2026 was incomplete at the database retrieval date.
A marked acceleration occurred after 2017, with annual publication output increasing from fewer than 30 publications to approximately 100 publications by 2021. The highest publication levels were recorded in 2024 and 2025, when annual output exceeded 150 publications. This pattern indicates increasing scholarly attention to construction equipment monitoring alongside advances in computer vision, deep learning, Internet of Things technologies, and digitally integrated construction-management systems [1,2,8,9,10,12,13,14,15,34,35,36,37,38,39,40]. To avoid an artificial end-of-series decline, the annual trend shown in Figure 3 ends in 2025, the last complete publication year. Records indexed between January and 20 May 2026 remained part of the corpus used for the non-temporal bibliometric and scientometric analyses.
The acceleration in research activity during the early 2020s coincided with the wider adoption of digital and remote-monitoring technologies in construction and other industries. The COVID-19 pandemic may have accelerated interest in digitalization, remote observation, and data-driven site management, although the publication trend alone cannot isolate its effect from concurrent advances in computing capacity, deep-learning frameworks, sensing technologies, BIM, and digital twins [41,42,43,44].
Overall, the annual publication pattern indicates that construction equipment monitoring has developed from a relatively specialized research topic into a growing interdisciplinary research area. The growth reflects a broader methodological transition from location tracking and basic sensor-based monitoring toward AI-supported perception, automated activity recognition, and integrated digital construction systems.
4.2. Keyword Co-Occurrence Analysis and Thematic Synthesis
A minimum occurrence threshold of 10 was applied, resulting in 156 keywords connected through 4688 links, with a total link strength of 15,401. Based on the dominant concepts, relationships, applications, and representative publications, the network was interpreted through six major thematic clusters, as shown in Figure 4 and detailed in Table 5.
Figure 4.
Keyword co-occurrence network generated using full counting and a minimum threshold of 10 occurrences per keyword; 156 keywords were retained. Node size represents keyword occurrence frequency, link thickness indicates co-occurrence strength, and different colors represent keyword clusters. Complete network settings are reported in Table 4.
Table 5.
Thematic interpretation of the keyword co-occurrence clusters.
After removing the five dominant query-derived terms defined in Section 3.9, the reconstructed network retained 151 keywords connected through 4002 links, with a total link strength of 9206. Although the detailed cluster boundaries differed from those of the principal network, the broader thematic structures concerning equipment operations and productivity, safety monitoring, intelligent machinery and condition monitoring, robotics and sensing, visual perception and activity recognition, and equipment-specific predictive applications remained identifiable. This indicates that the thematic interpretation was not determined solely by the dominant search-seed terms, while detailed cluster boundaries remained sensitive to keyword selection and preprocessing. The complete results are presented in Figure S1 and Table S7b of the Supplementary Materials.
The cluster labels were not assigned on the basis of a single keyword. Instead, each cluster was interpreted by considering its most frequent terms, the relative centrality of those terms, the position of the cluster within the overall network, its connections with adjacent clusters, and representative publications associated with the corresponding topics. Because several technologies and applications overlap across clusters, the resulting categories should be interpreted as interconnected thematic concentrations rather than completely independent research areas.
The first major thematic cluster represents operations and productivity monitoring. Its dominant terms include tracking, productivity, equipment, excavators, cycle time, and utilization. This cluster reflects the operational foundation of construction equipment monitoring, where location, movement, working cycles, and equipment status are analyzed to evaluate fleet performance and resource efficiency. Representative studies have used GPS, mobile sensors, telematics, and vision-based systems to measure equipment cycles, recognize activities, and estimate productivity [4,13,45,46].
From an industrial perspective, this cluster supports equipment allocation, progress control, productivity benchmarking, and the identification of operational delays. However, utilization and idle-time analysis remain less strongly connected to recent computer-vision and deep-learning terminology, indicating comparatively limited bibliometric integration between utilization-oriented research and recent AI-based perception themes within the analyzed corpus.
The second major thematic cluster represents sensing, positioning, and site logistics. Its principal terms include RFID, GPS, telematics, wireless technologies, project management, and data visualization. This cluster captures the physical data-acquisition layer of the field, particularly systems used to identify, locate, and track equipment and other site resources [3,5,6,7].
The practical importance of this cluster lies in improving equipment location awareness, movement coordination, collision avoidance, and logistical planning. These technologies established the foundation for automated monitoring during the early development of the field. Nevertheless, many sensing studies remain platform-specific and are not fully integrated with AI-based interpretation, BIM, or project-control systems.
The third major thematic cluster represents equipment-related safety, worker protection, and personal protective equipment monitoring. Dominant terms include construction safety, hardhat detection, protective clothing, unsafe behavior, hazard recognition, and worker–equipment interaction. Research in this cluster increasingly applies convolutional neural networks, object-detection models, and video analytics to identify missing PPE, unsafe proximity, struck-by risks, and other hazardous conditions [1,9,11,14,15,16].
This cluster demonstrates how equipment monitoring has expanded beyond productivity to support proactive safety management. Its principal industrial contribution is the possibility of providing real-time warnings before an incident occurs. However, the effectiveness of these systems remains affected by occlusion, variable lighting, camera position, privacy concerns, and limited validation across different construction environments.
The fourth major thematic cluster functions as a vision and perception hub. It contains terms such as computer vision, camera, convolutional neural network, object detection, tracking, and activity recognition. Its central position in the network indicates that visual perception links several application areas, including productivity monitoring, equipment recognition, safety analysis, and activity classification [8,10,34,35,47,48,49].
Methodologically, this cluster represents the transition from collecting raw equipment data to interpreting equipment identity, pose, movement, and activity from images and video. For industry, vision-based systems offer the advantage of monitoring several machines and workers without installing a dedicated sensor on every asset. Their main limitations are sensitivity to occlusion, image quality, site congestion, environmental variability, and the need for large annotated datasets.
The fifth major thematic cluster represents learning algorithms and model development. Its main terms include deep learning, machine learning, support vector machine, neural network, prediction, and optimization. Unlike clusters organized around a specific construction application, this cluster represents the methodological engine that supports equipment detection, activity recognition, productivity analysis, and safety monitoring [2,36,37,38,39,40,45,50].
The extensive connections between this cluster and the other thematic groups indicate that algorithmic developments are diffusing across multiple monitoring applications. Nevertheless, many studies continue to focus primarily on model accuracy under specific experimental conditions. Greater attention is required to model transferability, explainability, computational requirements, uncertainty, and performance under real construction-site conditions.
The sixth major thematic cluster represents BIM, digital twins, simulation, and integrated decision support. Although smaller than the other clusters, it includes strategically important terms such as digital twin, BIM, 4D simulation, situation awareness, and real-time monitoring. Its position near the sensing and logistics clusters suggests that this stream is concerned with transferring monitoring outputs into planning, simulation, and decision-support environments [18,19].
This cluster represents a movement from isolated monitoring tools toward connected digital construction systems. Its practical value lies in linking real-time equipment status with project schedules, spatial models, productivity baselines, and predictive simulations. The cluster is comparatively small in the keyword network, while the qualitative synthesis identifies relatively few representative studies demonstrating automated closed-loop updating under live site conditions. Together, these observations support interpreting digital integration as a developing research stream rather than direct evidence of technological maturity or industry adoption.
Across the network, construction equipment and deep learning are among the most prominent and strongly connected keywords, as shown in Table 6, indicating that AI-based perception represents an important cross-cutting theme. The terms idle time and utilization appear more closely associated with established sensing topics than with newer vision-based terms, suggesting an area requiring further investigation. Recent terms, including YOLO, action recognition, and digital twin, are concentrated in later average publication years.
Table 6.
Top 10 keywords by frequency of occurrence.
The threshold-sensitivity analysis indicated that the broader thematic interpretation remained reasonably stable. At a minimum occurrence threshold of 8, the network contained 216 keywords, 6851 links, and a total link strength of 18,871. At the principal threshold of 10, it contained 156 keywords, 4688 links, and a total link strength of 15,401. At the more restrictive threshold of 15, the network contained 91 keywords, 2466 links, and a total link strength of 11,307. Although some closely related topics became more strongly integrated as the threshold increased, the six major thematic domains concerning operations and productivity, sensing and logistics, safety monitoring, visual perception, learning-based model development, and digital integration remained identifiable. The four broader knowledge streams were also preserved across the alternative settings. The complete comparison is provided in Table S7a of the Supplementary Materials.
Taken together, the six clusters can be synthesized into four broader knowledge streams: operations and sensing, AI-based perception, safety monitoring, and BIM/digital-twin integration. This synthesis shows that the field has progressed from collecting location and equipment-status data toward interpreting activities, risks, and operational conditions using machine learning and computer vision. However, the network also shows uneven thematic representation. Safety- and visual-recognition themes received increasing attention, whereas real-time idle detection, utilization optimization, multimodal data fusion, and closed-loop BIM or digital-twin integration were less prominently represented in the bibliometric evidence or emerged as recurring limitations in the qualitative synthesis. The authors therefore interpret these areas as priorities for further research.
The thematic relationships therefore suggest that the next stage of research should not focus solely on improving individual detection models. Greater value is likely to emerge from integrating perception, sensing, planning, and decision-support systems and validating them under realistic construction-site conditions.
The representative-publication evidence supporting the interpretation of the six keyword clusters is summarized in Table S8 of the Supplementary Materials.
4.3. Evolution of Keywords over Time
Keyword evolution analysis highlights how the thematic focus of construction equipment monitoring research has shifted across the study period. VOSviewer visualizes the average publication year of each keyword on a color gradient, with earlier terms shown in cooler colors (blue/green) and more recent terms in warmer shades (yellow/orange). The resulting temporal map is presented in Figure 5.
Figure 5.
Keyword co-occurrence overlay by average publication year, generated using full counting and a minimum threshold of 10 occurrences per keyword; 156 keywords were retained. Node size represents keyword occurrence frequency, link thickness indicates co-occurrence strength, and node color represents the average publication year, with colors ranging from earlier to more recent publication years. Complete network settings are reported in Table 4.
The earliest stage of research is dominated by keywords such as GPS, RFID, telematics, cycle time, and utilization. These legacy terms reflect the first generation of digital monitoring, when telematics and identification technologies were applied primarily for location tracking and productivity assessment. Their clustering in the cooler zone of the map underscores their historical role as the foundation of the field.
Between 2018 and 2022, the vocabulary gradually diversified. Terms such as tracking, monitoring, construction safety, project management, and logistics gained prominence, reflecting a broadening of research objectives beyond raw location data to include site coordination and safety considerations. Although these terms remain present, more recent terms occupy increasingly prominent positions in the overlay visualization.
After 2022, terms such as computer vision, deep learning, convolutional neural networks, YOLO, object detection, real-time monitoring, camera, and digital twin appear in warmer colors. Their more recent average publication years indicate increased attention to AI-based perception and digitally integrated monitoring. The overlay therefore suggests a shift from primarily descriptive sensing toward systems that interpret activities, risks, and operating conditions in real time.
Taken together, the overlay indicates a temporal progression from early tracking and sensing, through broader logistics and safety applications, toward AI-based perception and digital integration.
4.4. Author Co-Authorship Network
Co-authorship analysis offers insights into how researchers collaborate and how knowledge circulates within a field. In this study, the threshold for inclusion was set at a minimum of three publications per author, resulting in 135 authors meeting the criterion. The network contained 158 links and was divided into 12 clusters, as shown in Figure 6. Based on these values, the network is structurally scattered, which means that while many active authors contribute to the field, relatively few of them are directly connected to one another. Instead of a single, dense core of researchers, the field currently consists of several semi-independent groups.
Figure 6.
Author co-authorship network generated using full counting and a minimum threshold of three publications per author; 135 connected authors were retained. Node size represents publication output, link thickness indicates co-authorship strength, and different colors represent author clusters. Complete network settings are reported in Table 4.
The distribution of the authors across 12 clusters indicates that collaboration is concentrated within several relatively small research teams rather than organized around one highly connected international community. Comparison with the keyword network suggests that some author groups are associated primarily with sensing and telematics, whereas others contribute mainly to computer vision, safety monitoring, activity recognition, or digitally integrated construction systems.
The relatively limited number of links between author clusters indicates that repeated co-authorship is concentrated within particular research groups. The author and keyword networks represent different units of analysis and use different thresholds, so their densities were interpreted separately. Similar technologies and research topics may therefore be cited and discussed across the field without necessarily producing sustained co-authorship between the corresponding research groups.
From a methodological perspective, this fragmentation may contribute to differences in datasets, equipment categories, evaluation metrics, and validation procedures across studies. From an industrial perspective, stronger collaboration between construction-management researchers, computer-vision specialists, sensing experts, and equipment practitioners could support larger shared datasets, multi-site validation, and more integrated monitoring systems.
4.5. Organization Co-Authorship Network
The organizational co-authorship network illustrates how institutions collaborate in advancing construction equipment monitoring research. A minimum threshold of three publications per organization was applied. The final network contained 107 organizations connected through 156 co-authorship links, as shown in Figure 7. The network remains relatively sparse, indicating that repeated institutional collaboration is concentrated within selected organizational groups rather than distributed uniformly across the field.
Figure 7.
Organization co-authorship network generated using full counting and a minimum threshold of three publications per organization; 107 organizations and 156 links were retained. Node size represents publication output, link thickness indicates co-authorship strength, and different colors represent organization clusters. Complete network settings are reported in Table 4.
Table 7 presents the ten most productive institutions, together with their corpus-based publication counts, citation totals, and total link strengths.
Table 7.
Leading institutions in the organization co-authorship network.
China University of Mining & Technology recorded the largest publication output, with 20 publications, followed by Huazhong University of Science & Technology with 15 and Zhejiang University with 14. Tongji University recorded the highest citation total among the ten leading institutions, while the China Institute of Water Resources & Hydropower Research and Beijing Jiaotong University displayed the strongest institutional collaboration linkages. These differences show that publication productivity, citation influence, and collaboration strength represent related but distinct dimensions of institutional contribution.
The 14 organizational clusters show that institutional collaboration is concentrated within geographically or thematically connected groups. Some clusters appear to be associated with AI and computer-vision research, while others are more closely related to sensing, telematics, equipment operations, construction safety, or BIM-based monitoring.
The organizational network contains relatively few links between clusters, indicating that repeated inter-institutional co-authorship is concentrated within a limited number of organizational groups. The organization and keyword networks represent different relationships and were therefore interpreted separately.
Greater inter-institutional collaboration could support the development of standardized datasets, common evaluation protocols, and multi-project field validation. Such collaboration is particularly important for monitoring systems that combine telematics, computer vision, BIM, and digital-twin technologies because these systems require expertise and data that may not be available within a single institution. The results therefore highlight collaboration capacity as an important condition for moving from isolated prototypes toward more transferable monitoring solutions.
4.6. Country Co-Authorship Network
The country-level co-authorship map highlights the geographical distribution of research and the structure of international collaboration. A minimum threshold of three publications per country was applied. Following the standardization of country information in the final 1093-record corpus, 43 countries met the threshold and formed 114 international co-authorship links, as shown in Figure 8.
Figure 8.
Country co-authorship network generated using full counting and a minimum threshold of three publications per country; 43 countries and 114 international co-authorship links were retained. Node size represents the number of publications, node color indicates the corresponding collaboration cluster, and the connecting lines represent co-authorship links, with line thickness reflecting the strength of collaboration. Complete network settings are reported in Table 4.
Table 8 presents the ten most productive countries, together with their publication counts, citation totals, and total link strengths.
Table 8.
Leading countries in the country co-authorship network.
China recorded the largest publication output, citation total, and international total link strength, with 469 publications, 8981 citations, and a total link strength of 125. The United States ranked second with 168 publications, 7682 citations, and a total link strength of 71, followed by South Korea with 111 publications. Hong Kong is particularly notable because its total link strength of 57 was substantially higher than those of several countries with comparable or greater publication outputs, indicating a strong level of international co-authorship within the analyzed corpus. The United Kingdom and Australia also displayed comparatively strong collaboration linkages. These indicators describe corpus-based patterns of national participation and international collaboration.
The network shows that international collaboration is present, but its distribution is uneven. A limited number of countries act as major connecting hubs, while many countries participate through smaller or less connected groups. Several leading countries contribute to both established areas, such as sensing and telematics, and more recent areas, such as computer vision, deep learning, BIM, and digital twins.
This geographical concentration has implications for the transferability of monitoring technologies. Systems developed using data from a small number of countries may reflect particular equipment fleets, construction practices, safety regulations, climates, labor conditions, and levels of digital infrastructure. Their reported performance may therefore not transfer directly to regions with different site conditions or technological resources.
Broader international collaboration could improve geographical diversity, support cross-country validation, and increase access to representative construction-site datasets. Nevertheless, the map reflects only affiliations recorded in Scopus and Web of Science and does not capture collaborations that did not produce indexed co-authored publications.
4.7. Document Citation Network
The document citation network highlights the studies that form the intellectual backbone of construction equipment monitoring. A minimum threshold of 20 citations per document was applied. Of the documents meeting this criterion, 117 formed the connected citation network visualized in Figure 9, comprising 500 links across nine clusters. The connected network contains several influential but partly distinct citation communities, meaning that although there are several influential works, they come from different traditions rather than one unified body of research.
Figure 9.
Document citation network generated using a minimum threshold of 20 citations per document; 117 connected documents were retained. Circle size represents citation frequency, colors indicate different citation clusters, and lines represent citation links between documents. Complete network settings are reported in Table 4.
Citation-based indicators are used here to describe scholarly influence within the analyzed corpus. Because citation counts are affected by publication age, database coverage, and disciplinary practices, recent publications may be underrepresented. The document-citation network was therefore interpreted alongside the keyword overlay, thematic synthesis, and CiteSpace timeline.
Two major citation waves can be observed. The early wave (2000–2012) is dominated by sensing and telematics studies. For example, Pradhananga [4] demonstrated how GPS data could be used to analyze construction equipment, while Chae and Yoshida [6] examined the use of RFID in the prevention of collision accidents with heavy equipment. These works are highly cited within the corpus and represent an important part of the early sensing and telematics literature for automated productivity monitoring and resource coordination, and they continue to serve as reference points for subsequent studies.
The recent wave (2015–2026) is characterized by AI- and vision-based research. Among the most cited studies are Fang et al. [9], who applied convolutional neural networks to automated worker and heavy-equipment detection, and Golparvar-Fard et al. [8], who advanced action recognition frameworks for earthmoving equipment monitoring. These works illustrate the methodological shift from descriptive sensing to AI-driven perception, particularly in the context of safety and compliance monitoring. Other highly cited recent contributions also integrate monitoring outputs with BIM and digital twins, signaling the transition toward integrated digital construction systems.
Several documents serve as bridges between these waves. For instance, papers that combine telematics with AI-based recognition [8,12,25,37,38,45,50,51,52,53] or that adapt vision-based methods for both safety and productivity [8,13,20,35,39,48,49,54,55,56,57,58,59,60,61,62] appear at the intersections of clusters. Their network positions suggest that they connect established sensing research with more recent perception-oriented studies. The 20 publications with the highest harmonized citation count in the analyzed corpus are summarized by study, publication year, and primary monitoring focus in Table 9 below.
Table 9.
The 20 most-cited publications in the analyzed corpus, classified by primary focus.
The primary-focus classification shows that the highly cited foundation of the field spans several connected applications, including GPS-, RFID-, and UWB-based localization; vision-based detection and tracking; equipment activity recognition; productivity monitoring; and worker–equipment safety. Earlier highly cited publications are particularly visible in localization, tracking, and collision prevention, whereas more recent highly cited publications increasingly apply computer vision and machine learning to detection, activity recognition, and safety monitoring. This pattern supports the interpreted transition from sensing- and location-based monitoring toward AI-enabled perception. Citation prominence is treated as evidence of intellectual visibility within the analyzed corpus rather than as a measure of technical performance or implementation maturity.
4.8. Source Citation Network
The source citation network identifies the journals that have contributed most strongly to the field’s citation structure. Sources were required to have published at least three documents and received at least seven citations within the analytical corpus. A total of 37 sources met these criteria and formed 122 links distributed across nine clusters, as shown in Figure 10. The network is relatively dense for its size, indicating that a small set of journals consistently cite one another and together form the core sources of publication.
Figure 10.
Source citation network generated using minimum thresholds of three documents and seven citations per source; 37 sources were retained. Node size represents citation frequency, link thickness indicates citation strength, and different colors represent source clusters. Complete network settings are reported in Table 4.
Automation in Construction forms the largest and most strongly connected node in the displayed source-citation network. The journal represents a major publication outlet within the analyzed corpus and is connected with sensing, computer-vision, and digital-integration research. Journal of Computing in Civil Engineering and Advanced Engineering Informatics also hold prominent positions, reinforcing the field’s growing reliance on digital technologies and computational methods.
Additional influential venues include the Journal of Information Technology in Construction, which publishes work on digital construction, productivity, and project integration, and Safety Science, which contributes research on hazard management, worker protection, and safety compliance. Together, these journals connect equipment-monitoring research with adjacent areas of construction informatics and occupational safety. Table 10 presents the ten sources with the highest total harmonized citation counts, together with their corpus publication counts, mean citations per publication, and corpus-based h-indices.
Table 10.
Corpus-based citation indicators for the ten most-cited publication sources.
Automation in Construction recorded the largest publication and citation totals, confirming its central position in the analyzed literature. However, publication volume and average citation influence did not follow the same ranking. Advanced Engineering Informatics recorded a smaller corpus publication count but the highest mean citation value among the large, established sources shown in the table. Underground Space also recorded a comparatively high mean citation value (51.13 citations per publication) across eight corpus publications. Applied Sciences and Sensors contributed comparatively large numbers of publications but had lower mean citation values. These differences demonstrate why total citations should be interpreted together with publication volume rather than treated as a stand-alone measure of source influence.
4.9. Author Citation Network
The author citation network highlights which researchers are most frequently cited and how their contributions define the intellectual structure of construction equipment monitoring. Authors were required to have at least three publications and at least one citation within the analytical corpus. A total of 138 authors met these criteria, producing 2372 links grouped into seven clusters, as shown in Figure 11. The network is very dense, showing that leading scholars are not confined to isolated citation groups but are connected through citation relationships across several research areas.
Figure 11.
Author citation network generated using minimum thresholds of three publications per author; 138 authors were retained. Node size represents citation frequency, link thickness indicates citation strength, and different colors represent author clusters. Complete network settings are reported in Table 4.
Seokho Chi and Zhenhua Zhu occupy prominent positions in the citation network, reflecting the frequent citation of their contributions across equipment tracking, sensing, and vision-based monitoring studies. Changbum R. Ahn and Abbas Rashidi are also strongly represented through research concerning activity recognition, audio-visual analysis, equipment monitoring, and AI-supported construction applications. Heng Li appears within another influential part of the network associated with digital construction, safety monitoring, BIM, and data-driven construction management.
These positions indicate that the authors’ publications are cited across multiple parts of the field rather than being confined to one narrowly defined topic.
The citation links shown in Figure 11 indicate that the publications of these authors are connected across several citation clusters.
Table 11 presents the ten authors with the highest total harmonized citation counts among recurring contributors, together with their corpus publication counts, mean citations per publication, and corpus-based h-index, g-index, and m-index.
Table 11.
Corpus-specific publication and citation indicators for the ten most-cited authors.
The revised indicators demonstrate that total citation prominence reflects both publication volume and the influence of individual publications. Mani Golparvar-Fard recorded the highest total and mean citation values among the authors shown, despite having fewer corpus publications than several other contributors. Jochen Teizer combined a comparatively large publication portfolio with a high citation total. Zu-Yu Chen, Xu Li, Heng Li, and Liu-Jie Jing recorded relatively high m-index values because their influential corpus publications were concentrated within a more recent publication period. These values should nevertheless be interpreted as corpus-specific indicators affected by publication age, database coverage, authorship patterns, and the thematic boundaries of the review rather than as complete career-level rankings.
Earlier sensing-based contributions, including Pradhananga and Teizer’s GPS-based operational analysis [4] and Chae and Yoshida’s RFID-based collision-prevention study [6], remain connected in the citation network with more recent vision- and AI-based work. Studies by Nath et al. [1], Fang et al. [9,17], and Roberts and Golparvar-Fard [10] illustrate the later emphasis on automated safety monitoring, equipment detection, and activity analysis. Their joint presence in the network suggests continuity between the field’s sensing foundations and its more recent perception-oriented applications.
Overall, the author citation network indicates that citation influence is concentrated among a relatively limited group of authors whose publications span sensing, activity recognition, safety monitoring, and digital construction. Links between the clusters show shared citation patterns across these areas.
4.10. Co-Citation Analysis
Co-citation analyses of documents, sources, and authors were used to examine the literature most frequently cited together within the corpus. Figure 12, Figure 13 and Figure 14 present complementary views of this shared citation structure. Co-citation proximity indicates that publications, authors, or sources are frequently cited together; it does not necessarily imply direct collaboration or complete conceptual agreement.
Figure 12.
Document co-citation network generated using a minimum threshold of three citations per cited reference; 135 connected cited references were retained. Node size represents co-citation frequency, link thickness indicates co-citation strength, and different colors represent document clusters. Complete network settings are reported in Table 4.
Figure 13.
Source co-citation network generated using a minimum threshold of three citations per cited source; 72 cited sources were retained. Node size represents co-citation frequency, link thickness indicates co-citation strength, and different colors represent source clusters. Complete network settings are reported in Table 4.
Figure 14.
Author co-citation network generated using a minimum threshold of 50 citations per cited author; 94 connected cited authors were retained. Node size represents co-citation frequency, link thickness indicates co-citation strength, and different colors represent author clusters. Complete network settings are reported in Table 4.
At the source level (Figure 13), the co-citation network provides a detailed picture of the journals and publication venues that form the intellectual backbone of research on construction equipment monitoring. Using a threshold of at least 3 citations, the network yielded 72 sources with 122 links, organized into 14 clusters. The network is relatively sparse but clustered, reflecting the fact that while construction informatics is still a specialized domain, its scholarly foundations are firmly embedded in a small group of frequently co-cited journals. At the center of the network, the Journal of Construction Engineering and Management and Automation in Construction emerge as the prominent nodes, given their role as the major publication outlets for digital construction research. These journals anchor the cluster of AI- and vision-driven studies, ranging from Park’s [7] performance test of wireless technologies in work zones to Nath’s [1] deep learning for site safety. Closely linked to Automation in Construction are Advanced Engineering Informatics and the Journal of Computing in Civil Engineering, both of which support methodological advances in computer vision, machine learning, and sensing techniques that underpin equipment monitoring.
The links between managerial and technical journals indicate shared citation patterns across construction management, informatics, sensing, and safety research, illustrating the interdisciplinary character of the literature.
Peripheral yet important sources include Frontiers in Built Environment and Construction Innovation, which represent emerging publication spaces for specialized studies and thematic syntheses. For instance, Rashid’s [68] motion-data-driven activity identification and Elghaish’s [69] scientometric review both illustrate how these journals provide platforms for detailed technical advances in specific areas, while others provide broader overviews or analyses that help make sense of trends across the field. The clustering also shows some crossover with adjacent fields, such as Computers and Geotechnics, where Yuan’s [70] active learning study signals a transfer of data-centric methods into tunneling and subsurface engineering, which illustrates the presence of adjacent data-centric research within the broader co-citation environment.
The document co-citation map (Figure 12) complements this source-level view by identifying the individual studies that anchor these clusters. For the document co-citation analysis, cited references were required to have received at least three citations within the corpus. The resulting connected network contained 135 cited references. Fang’s Advanced Engineering Informatics paper [9] on CNN-based detection is among the most frequently co-cited, reflecting its prominent co-citation position within the AI-based monitoring literature. Nath’s [1] Automation in Construction paper on PPE detection shows a similar pattern, consolidating AI-driven perception as the prominent cross-cutting theme after 2017. Rashid’s contributions [2,68] further reinforce this stream, introducing novel approaches for equipment activity recognition using time-series data and motion analysis. Earlier works continue to play a central role: Pradhananga’s [4] GPS-based operations analysis and Azar’s [71] visual sensing study are consistently co-cited with later AI works, demonstrating how legacy sensing remains part of the shared citation structure. Roberts’s [10] vision-based detection and Luo’s [40] pose estimation extend this trajectory, showing how equipment detection has shifted from simple tracking to activity-level understanding. Recent additions, such as Ray’s [72] identification of equipment failures and Yuan’s [70] active learning framework, are beginning to diversify the network into data-centric and generative approaches, though their co-citation strength is not yet comparable to the AI perception cluster.
The author co-citation network shown in Figure 14 provides a complementary view of the scholars whose work is cited together across these research streams. With a minimum threshold of 50 citations per cited author, the connected network contained 94 authors. Fang and Nath occupy prominent positions through frequently cited research on computer-vision-based safety and PPE monitoring [1,9,17]. Rashid is associated with time-series and motion-based equipment activity recognition [2,68], while Pradhananga, Teizer, and Azar represent earlier GPS-, proximity-, and visual-sensing research [4,51,73,74,75,76,77,78,79,80,81]. Roberts, Golparvar-Fard, Luo, and related contributors represent the later development of vision-based detection, pose estimation, and activity analysis [8,10,40,82,83,84,85]. These co-citation relationships indicate that recent AI-oriented studies are frequently co-cited with earlier sensing and operations research.
The co-citation and keyword networks provide complementary views of the field. The keyword network identifies the principal research topics addressed by the corpus, whereas the co-citation networks identify the publications, authors, and sources that provide the intellectual foundation of those topics. Cross-referencing the prominent co-cited contributors with the six keyword clusters reveals several consistent correspondences, summarized in Table 12.
Table 12.
Cross-map correspondence between the co-citation structure and keyword thematic clusters.
The correspondences were derived by comparing the principal co-cited publications, authors, and sources with the dominant concepts, applications, and representative studies associated with each keyword cluster. The relationships indicate shared intellectual foundations and thematic contributions; they do not represent a statistical correlation between network positions or demonstrate direct technological transfer.
The clearest correspondence occurs between the earlier co-cited sensing literature and the “Operations and Productivity” and “Sensing and Logistics” keyword clusters. Publications associated with Pradhananga, Teizer, Chae, Park, and Azar established GPS-, RFID-, wireless-, and visual-sensing methods for equipment location, movement, cycle analysis, and proximity monitoring. These intellectual foundations continue to support the operational and sensing terminology visible in the keyword network.
A second correspondence connects the later AI-oriented co-citation base with the Safety and PPE Monitoring, Vision and Perception, and Learning Algorithms and Model Development clusters. Frequently co-cited work by Nath, Fang, Rashid, Roberts, Golparvar-Fard, and Luo contributed deep-learning detection, time-series classification, equipment tracking, activity recognition, and pose-estimation methods. The presence of these contributors across several thematic areas shows that the growth of AI-based perception did not form an isolated research stream; rather, it extended established sensing research into safety, productivity, and activity-level interpretation.
BIM and digital-twin integration was less prominent within the dominant co-citation structure, indicating that it represents a developing integrative frontier rather than an established intellectual core. Overall, the cross-map synthesis indicates that the field developed from an established sensing and operational foundation toward a strongly connected AI-perception core, while BIM- and digital-twin-based integration remains a more recent and comparatively less established research frontier.
4.11. Timeline View of Co-Cited Documents
Figure 15 presents the CiteSpace document co-citation timeline covering 2000–2025. The network contained 266 nodes and 844 links and produced a modularity Q of 0.7941 and a weighted mean silhouette of 0.9385. The Q value indicates clearly differentiated co-citation groupings, while the silhouette value indicates strong internal consistency within the displayed clusters. The timeline is interpreted together with the keyword-overlay visualization and the document-level temporal keyword analysis to examine the broad transition from early sensing and tracking toward machine-learning-, activity-recognition-, and vision-based research.
Figure 15.
CiteSpace timeline of co-cited documents covering 2000–2025. The network contained 266 nodes and 844 links, with a modularity Q of 0.7941 and a weighted mean silhouette of 0.9385. Node size represents co-citation frequency; node and link colors follow the temporal color scale; purple outer rings indicate higher betweenness centrality; red rings indicate citation bursts; curved links indicate co-citation relationships; horizontal position represents time; and dashed horizontal lines separate the displayed clusters.
4.11.1. Foundational Period: Early Sensor and Visual Approaches (2000–2010)
In the initial decade of the period, the research landscape was characterized by foundational yet disconnected efforts, as evidenced by the sparse network and limited number of active clusters. The earliest cluster #5, “using wireless technologies,” contains early work on applying wireless sensor networks (WSNs) and Radio-Frequency Identification (RFID) for basic equipment tracking and location. Simultaneously, the small cluster #9, “automated visual monitoring,” contains early vision-related research, which, though not yet a central theme, established the conceptual groundwork for using visual data. These early studies contributed to the development of the sensing and data-acquisition approaches represented in the later literature.
4.11.2. Transitional Period: The Rise of Machine Learning (2010–2018)
The field experienced significant methodological diversification during this period, serving as a critical bridge between early and modern approaches. Cluster #1, “support vector machines,” is particularly noteworthy, as it signifies the growing use of machine-learning methods. The prominent nodes within this cluster represent influential papers that applied support vector machines (SVMs) and similar classification algorithms to analyze collected data from construction sites. Concurrently, cluster #2, “sensing algorithms,” reflects a shift in sensor-based research from data collection toward algorithmic processing and data fusion. The increased visual connectivity during this period suggests greater thematic interaction among sensor processing, classification, and activity-recognition research.
4.11.3. Recent Development of AI- and Vision-Based Monitoring (2018–2025)
From approximately 2018 onward, cluster #0, labeled “activity recognition,” and cluster #3, labeled “vision-based monitoring,” contain the largest concentration of recent co-cited documents in the displayed timeline. Their temporal positions indicate increasing attention to computer vision, deep learning, and automated recognition of equipment and worker activities. The visual proximity of the two clusters suggests a close thematic relationship between algorithm development and construction-site applications. Overall, the timeline supports a descriptive transition from early sensing and tracking toward more perception-oriented monitoring.
The structural indicators provide additional support for this temporal interpretation. The strongest citation bursts were recorded for Chen et al. [86], with a burst strength of 7.4437 during 2023–2025; Azar et al. [87], with 6.8157 during 2015–2018; Kim et al. [88], with 6.3704 during 2019–2023; Soltani et al. [89], with 6.2435 during 2019–2021; and Seo et al. [90], with 6.1705 during 2019–2020. The highest betweenness-centrality values were recorded for Grau et al. [91], Ahn et al. [92], Kim et al. [93], Cheng et al. [3], and Park et al. [94], indicating that these references occupied bridging positions between different areas of the co-citation network. These indicators complement the period-based interpretation but are not treated as measures of research quality or technical superiority. Complete values and reference labels are provided in Table S6a,b.
4.11.4. Integrated Interpretation of the Technological Transition
To quantitatively examine the technological transition identified in the network and temporal visualizations, the prevalence of location-and-sensing and AI-and-perception keywords was compared across four publication periods, as shown in Table 13.
Table 13.
Temporal distribution of location-and-sensing and AI-and-perception keywords.
The document-level temporal keyword analysis provides quantitative support for the technological transition observed in the network and overlay visualizations. Location-and-sensing terms appeared in 33.3% of publications during 2001–2009 and 34.3% during 2010–2015. Their proportional representation subsequently declined to 13.8% during 2016–2020 and 5.7% during 2021–2025. By contrast, AI-and-perception terms increased from 16.7% and 27.5% in the first two periods to 40.7% during 2016–2020 and 50.4% during 2021–2025. The absolute number of sensing-related publications did not disappear; rather, its relative share declined as AI- and perception-oriented research expanded substantially.
These quantitative patterns, together with the keyword, citation, and temporal networks, support a transition in research emphasis from predominantly location-based sensing and identification toward AI-supported perception and analytical monitoring. This transition was enabled by several interacting developments rather than by a single technological event. These include improvements in camera and sensor availability, increased computing capacity, accessible deep-learning frameworks, growth in digitally captured construction data, and wider interest in BIM, automation, and connected project-control systems. However, the transition remains incomplete. Sensor-based systems frequently remain isolated from analytical and project-management platforms, while vision-based models continue to face occlusion, domain shift, annotation requirements, computational demand, and limited multi-site validation. Digital-twin and autonomous-equipment applications face additional barriers related to interoperability, reliable real-time data exchange, uncertainty management, cybersecurity, implementation cost, and organizational readiness. The combined evidence therefore indicates increasing methodological integration, while large-scale deployment remains uneven.
5. Critical Gaps
The following gaps were identified by combining two forms of evidence. The bibliometric analyses demonstrate the relative representation, temporal development, collaboration structure, and conceptual connections of topics within the analyzed corpus. The cluster-specific qualitative synthesis provides evidence concerning the methods, datasets, validation settings, and recurring limitations reported by representative publications. The characterization of these patterns as research gaps represents the authors’ interpretation of the combined evidence rather than a direct measure of technical maturity or industry adoption.
- First, the qualitative synthesis of representative publications indicates limited validation across multiple construction sites, equipment types, and operating conditions. Many of the examined studies relied on single-project, single-equipment, controlled, or locally collected datasets. The authors therefore interpret multi-site and cross-context validation as an important evidence gap.
- Second, the author and institutional collaboration networks show fragmentation among parts of the research community. The qualitative synthesis additionally identifies variation in datasets, activity labels, evaluation metrics, and validation procedures. Taken together, these findings suggest limited standardization and difficulty in comparing results across studies.
- Third, the country-level publication and collaboration analyses demonstrate that research activity is concentrated in a limited group of countries. The possible transferability challenges associated with differences in equipment fleets, regulations, climates, labor practices, and digital infrastructure are interpretive implications supported by the qualitative literature rather than direct outputs of the collaboration network.
- Fourth, keyword co-occurrence and temporal analyses show that idle-state detection and utilization optimization are less prominently represented and less strongly connected with recent AI-related terminology than safety monitoring and activity recognition. The authors interpret this relative representation as evidence that real-time operational utilization analysis deserves greater research attention; it does not establish the absolute maturity or level of industry adoption of these technologies.
To make the evidentiary basis of these gaps explicit, Table 14 distinguishes patterns directly observed in the bibliometric analyses from observations derived from the cluster-specific qualitative synthesis. It also states the principal interpretation limitation associated with each conclusion. Where a topic was not directly measured by the bibliometric networks, this is stated explicitly rather than inferred from network structure alone.
Table 14.
Evidence basis and interpretation limits for the principal research gaps.
Accordingly, the bibliometric evidence identifies differences in topic prominence, temporal visibility, geographical participation, and collaboration structure; the qualitative synthesis identifies recurring limitations in validation, datasets, and implementation; and the proposed priorities represent the authors’ interpretation of these combined findings.
6. Future Research Directions
The following future research directions are recommendations proposed by the authors rather than findings directly produced by the bibliometric networks. They were derived from the topic distributions and relationships observed in the bibliometric analyses together with the technical limitations and validation needs identified through the qualitative synthesis. The recommendations are organized around multimodal operational monitoring, field validation and standardization, and integration with digital project-control environments.
6.1. Multimodal Monitoring and Real-Time Utilization Analysis
A major research priority is the development of multimodal monitoring systems that combine telematics, GPS, cameras, audio signals, inertial sensors, equipment-control data, and environmental information. The qualitative synthesis indicates that many representative studies examine individual sensing technologies or isolated monitoring tasks, such as equipment detection, activity recognition, or location tracking. Combining multiple data sources could improve robustness under occlusion, poor lighting, site congestion, noise, and changing environmental conditions.
Particular attention should be given to real-time identification of equipment operating states, including productive activity, waiting, travel, and avoidable idling. Although productivity monitoring and activity recognition were prominently represented in the analyzed literature, the qualitative synthesis identified comparatively fewer examples connecting real-time state classification with fuel use, emissions, equipment allocation, and operational decision-making. Future systems should therefore move beyond detecting equipment presence toward continuously interpreting how, when, and why equipment is being used.
Building on these real-time monitoring capabilities, edge AI and autonomous equipment represent related emerging directions. Processing vision and sensor data close to the equipment could reduce communication latency, bandwidth demand, and dependence on continuous cloud connectivity. However, edge deployment introduces constraints involving device capacity, energy use, model compression, hardware durability, updating procedures, and cybersecurity. For autonomous or semi-autonomous equipment, monitoring must also be linked with reliable perception, navigation, control, fail-safe operation, and human supervision. Research should therefore evaluate these technologies under dynamic multi-equipment site conditions rather than only in controlled demonstrations.
6.2. Standardized Datasets and Field Validation
The development of shared datasets and standardized evaluation procedures is essential for comparing monitoring systems. The qualitative synthesis indicates that many representative studies rely on project-specific datasets collected from a limited number of equipment types, locations, or operating conditions. Reported accuracy may therefore reflect the characteristics of a particular site rather than the general performance of the proposed method.
Future studies should include multiple projects, equipment categories, climates, work conditions, and camera or sensor configurations. Performance should be evaluated using consistent metrics for detection accuracy, activity recognition, processing speed, reliability, false alarms, and operational usefulness. Greater transparency regarding data annotation, model training, missing data, and validation procedures would also improve reproducibility.
Collaboration between universities, contractors, equipment manufacturers, and technology providers could support larger and more representative datasets. Such collaboration is particularly important in regions currently underrepresented in the literature, where equipment fleets, labor practices, digital infrastructure, and safety regulations may differ from those in the countries that dominate the existing evidence.
6.3. BIM, Digital-Twin, and Human-Centered Decision Support
A further priority is the integration of monitoring outputs with BIM, digital twins, schedules, cost-control systems, and equipment-management platforms. The qualitative synthesis indicates the potential of these technologies, while identifying comparatively limited evidence of fully automated closed-loop applications under field conditions. In many cases, monitoring, analysis, visualization, and decision-making are still treated as separate processes.
Interoperability remains a major barrier to BIM-based, digital-twin-based, and cyber-physical equipment-management systems. Equipment telematics, computer-vision outputs, schedules, BIM objects, cost systems, and manufacturer platforms frequently use different identifiers, data structures, and update frequencies. Future studies should develop shared information models, application-programming interfaces, equipment-state definitions, and validation rules that allow monitoring outputs to move reliably between operational and project-control platforms.
Future systems should automatically transfer validated equipment information into project-control environments, allowing schedules, productivity forecasts, safety assessments, and resource plans to be updated using current site conditions. Research should also examine how uncertainty, incomplete observations, and conflicting sensor outputs are represented in these systems.
Human-centered design remains important. Monitoring systems should support, rather than replace, the judgment of site managers, operators, and safety personnel. Future studies should therefore evaluate interpretability, alert fatigue, user trust, privacy, cybersecurity, implementation cost, and organizational acceptance. These considerations will influence whether technically successful prototypes can be adopted in routine construction practice.
6.4. Cross-Cutting Considerations
Across the three priorities, greater attention is required to ethical data use, worker privacy, system security, affordability, and geographical diversity. Monitoring solutions developed in highly digitized environments may not be directly transferable to smaller contractors or regions with limited technological infrastructure. Future research should therefore examine scalable and cost-effective implementation models alongside technical performance.
6.5. Practical Implications for Industry
The reviewed literature indicates that location tracking, telematics, RFID-based identification, proximity sensing, and narrowly defined camera-based detection tasks are more frequently represented and have longer publication histories within construction equipment monitoring. Representative studies report that these technologies can support equipment location, cycle analysis, safety alerts, and basic productivity reporting when operating environments, equipment identifiers, and data infrastructures are clearly defined.
More complex applications, including multi-site activity recognition, multimodal utilization analytics, automated digital-twin updating, edge-AI monitoring, and autonomous equipment coordination, appear less frequently in the analyzed literature and have comparatively limited evidence of large-scale or multi-site field validation. Their broader implementation may be constrained by environmental variability, occlusion, communication reliability, interoperability, model transferability, hardware and data-management costs, cybersecurity, and the need for continuous system maintenance.
Construction organizations should therefore adopt monitoring technologies incrementally. Initial implementation should focus on clearly defined operational problems, measurable performance indicators, representative pilot projects, and integration with existing equipment-management procedures. Procurement decisions should consider not only detection accuracy but also installation cost, connectivity, data ownership, system maintenance, software integration, false alarms, and the ability to scale across different sites and equipment fleets.
Workforce preparation is equally important. Site managers, operators, planners, and safety personnel require training to interpret monitoring outputs, evaluate uncertain alerts, and intervene when automated recommendations are inappropriate. Monitoring systems should support human judgment rather than remove operational accountability. Early engagement with workers and clear policies on privacy, data access, and performance monitoring can also improve trust and organizational acceptance.
7. Limitations
This study has several limitations that should be acknowledged. First, the bibliometric and scientometric analysis depends on the selected databases, search strings, keywords, and inclusion criteria used to retrieve the publications. Although Scopus and Web of Science provide broad coverage of indexed scholarly literature, relevant studies indexed in other databases or using different terminology may not have been captured. Eligibility was assessed primarily from bibliographic metadata rather than through full-text screening of every record. Consequently, some peripheral publications may remain in the analytical corpus, while relevant studies using different terminology may have been missed. Although the landmark-publication retrieval check confirmed coverage of the principal historical and methodological streams, it cannot demonstrate exhaustive recall because the benchmark set represents selected publications rather than the complete universe of relevant studies. Full-text examination was focused on ambiguous and cluster-representative publications used in the qualitative interpretation.
Second, the analysis is limited by the time span and indexing status of the dataset. The inclusion of records indexed through 20 May 2026 provides a recent corpus, but 2026 was an incomplete publication year. Records from 2026 were therefore excluded from the annual publication-trend analysis and complete-year temporal comparison, while remaining available for the other corpus-level analyses. In addition, because the precision-oriented query did not include every possible umbrella or alternative term, some relevant studies may have been retrieved only when their metadata also contained one of the broader or machine-specific terms included in the search.
Third, citation-based indicators such as total citations, h-index, g-index, and m-index are influenced by publication age, database coverage, and citation practices across disciplines. Older publications and established authors may have had more time to accumulate citations, while newer but potentially important studies may appear less influential. In addition, citation totals may vary between Scopus and Web of Science because the databases use different coverage and updating procedures. The citation indicators reported in this study should therefore be interpreted as corpus-specific measures rather than universal or database-independent rankings.
Fourth, the findings remain influenced by metadata quality, harmonization decisions, counting methods, analytical thresholds, normalization, and clustering settings. The keyword threshold-sensitivity analysis supported the stability of the six major thematic domains and four broader knowledge streams, but not identical network partitions under every analytical setting. The metadata-screening stage was not conducted as a fully independent duplicate-screening process, and formal inter-reviewer agreement statistics were therefore unavailable; future updates should use independent parallel screening and report agreement measures such as Cohen’s kappa.
Moreover, this study provides macro-level mapping rather than a technical evaluation of the field performance, accuracy, cost, or deployment maturity of individual construction equipment monitoring technologies. These methodological boundaries should be considered alongside the preceding database, search, indexing, and citation limitations.
8. Summary and Conclusions
This study examined 1093 Scopus and Web of Science bibliographic records between 2000 and 20 May 2026 to map the development of construction equipment monitoring research. The findings show a clear transition from early GPS, RFID, and sensor-based tracking toward computer vision, deep learning, activity recognition, safety monitoring, and digitally integrated construction systems.
The bibliometric findings directly demonstrate publication growth, thematic co-occurrence patterns, collaboration structures, citation relationships, and changes in the temporal representation of monitoring technologies within the analyzed corpus. The qualitative synthesis of representative publications additionally indicates recurring methodological concerns involving dataset diversity, field validation, environmental robustness, and integration with operational decision-making. On the basis of these two evidence streams, the authors propose research priorities concerning real-time utilization analysis, multimodal sensing, standardized validation, and BIM/digital-twin integration.
The keyword network was interpreted through six interconnected thematic clusters that were synthesized into four broader knowledge streams: operations and sensing, AI-based perception, safety monitoring, and BIM or digital-twin integration. The bibliometric and temporal analyses indicate increasing attention to AI-supported equipment and safety recognition. By contrast, real-time idle detection, utilization optimization, multimodal data fusion, standardized field validation, and closed-loop digital-twin integration were less prominently represented in the bibliometric evidence or were identified as recurring limitations in the qualitative synthesis. The authors therefore interpret these areas as comparatively underdeveloped research priorities.
The study contributes an integrated overview of the technological, operational, intellectual, and collaborative structure of equipment-monitoring research. The findings should be considered within the database, search, metadata, citation-age, and analytical limitations described in Section 7. The research priorities proposed on the basis of these findings should be understood as evidence-informed recommendations rather than as technical-performance assessments or direct measurements of industry adoption.
Future research should examine how robust multimodal perception can be connected with operational decision-making, shared datasets, multi-site validation, and BIM or digital-twin platforms. It should also address privacy, security, interpretability, affordability, and geographical diversity to support the translation of research prototypes into reliable construction-industry applications.
Supplementary Materials
The following supporting information can be downloaded at: https://www.mdpi.com/article/10.3390/buildings16163336/s1. Table S1: Eligibility and exclusion criteria; Table S2: Retrieval, screening, and deduplication counts; Table S3: Landmark-publication retrieval validation [3,4,5,6,7,8,9,10,16,19,20,45,46,58,76,95,96]; Table S4: Bibliographic variables extracted from the database records; Table S5: Data-cleaning and harmonization procedures; Table S6: Network-analysis settings and resulting networks; Table S6a: CiteSpace timeline settings and structural diagnostics; Table S6b: Selected citation bursts and betweenness-centrality results from the CiteSpace document co-citation network; Table S7a: Threshold sensitivity of the keyword co-occurrence network; Table S7b: Robustness comparison of the keyword network before and after removal of dominant query-derived terms; Figure S1: Keyword co-occurrence network after removal of five dominant query-derived terms. The network was generated using all keywords, full counting, a minimum threshold of 10 occurrences, and the same clustering settings as the principal keyword analysis; Table S8: Cluster-specific qualitative synthesis of representative publications; Table S9: Final analytical dataset; Supplementary File S1a: Main VOSviewer keyword thesaurus; Supplementary File S1b: Seed-removal VOSviewer thesaurus.
Author Contributions
Conceptualization, A.M.E., M.T. and S.O.S.; methodology, A.M.E., M.T. and S.O.S.; software, A.M.E.; validation, M.T. and S.O.S.; formal analysis, A.M.E. and R.A.-S.; investigation, A.M.E., M.T. and S.O.S.; data curation, A.M.E. and R.A.-S.; writing—original draft preparation, A.M.E. and R.A.-S.; writing—review and editing, M.T. and S.O.S.; visualization, A.M.E. and R.A.-S.; supervision, M.T. and S.O.S.; project administration, M.T. and S.O.S. All authors have read and agreed to the published version of the manuscript.
Funding
This research received no external funding.
Data Availability Statement
The reproducibility materials supplied in this study include the cleaned bibliographic dataset, duplicate-mapping information, reported Scopus and Web of Science search strategies, eligibility and screening rules, data-cleaning and record-reconciliation procedures, the principal and seed-removal VOSviewer thesaurus files, software versions, analytical settings, and an R script for selected descriptive analyses. VOSviewer and CiteSpace network visualizations were generated using the documented settings and were not reproduced automatically by the R script.
Conflicts of Interest
The authors declare no conflicts of interest.
References
- Nath, N.D.; Behzadan, A.H.; Paal, S.G. Deep learning for site safety: Real-time detection of personal protective equipment. Autom. Constr. 2020, 112, 103085. [Google Scholar] [CrossRef] [Scilit]
- Rashid, K.M.; Louis, J. Times-series data augmentation and deep learning for construction equipment activity recognition. Adv. Eng. Inform. 2019, 42, 100944. [Google Scholar] [CrossRef] [Scilit]
- Cheng, T.; Venugopal, M.; Teizer, J.; Vela, P.A. Performance evaluation of ultra wideband technology for construction resource location tracking in harsh environments. Autom. Constr. 2011, 20, 1173–1184. [Google Scholar] [CrossRef] [Scilit]
- Pradhananga, N.; Teizer, J. Automatic spatio-temporal analysis of construction site equipment operations using GPS data. Autom. Constr. 2013, 29, 107–122. [Google Scholar] [CrossRef] [Scilit]
- Oloufa, A.A.; Ikeda, M.; Oda, H. Situational awareness of construction equipment using GPS, wireless and web technologies. Autom. Constr. 2003, 12, 737–748. [Google Scholar] [CrossRef] [Scilit]
- Chae, S.; Yoshida, T. Application of RFID technology to prevention of collision accident with heavy equipment. Autom. Constr. 2010, 19, 368–374. [Google Scholar] [CrossRef] [Scilit]
- Park, J.; Marks, E.; Cho, Y.K.; Suryanto, W. Performance Test of Wireless Technologies for Personnel and Equipment Proximity Sensing in Work Zones. J. Constr. Eng. Manag. 2016, 142, 04015049. [Google Scholar] [CrossRef] [Scilit]
- Golparvar-Fard, M.; Heydarian, A.; Niebles, J.C. Vision-based action recognition of earthmoving equipment using spatio-temporal features and support vector machine classifiers. Adv. Eng. Inform. 2013, 27, 652–663. [Google Scholar] [CrossRef] [Scilit]
- Fang, W.; Ding, L.; Zhong, B.; Love, P.E.D.; Luo, H. Automated detection of workers and heavy equipment on construction sites: A convolutional neural network approach. Adv. Eng. Inform. 2018, 37, 139–149. [Google Scholar] [CrossRef] [Scilit]
- Roberts, D.; Golparvar-Fard, M. End-to-end vision-based detection, tracking and activity analysis of earthmoving equipment filmed at ground level. Autom. Constr. 2019, 105, 102811. [Google Scholar] [CrossRef] [Scilit]
- Kim, H.; Kim, K.; Kim, H. Vision-Based Object-Centric Safety Assessment Using Fuzzy Inference: Monitoring Struck-By Accidents with Moving Objects. J. Comput. Civ. Eng. 2016, 30, 04015075. [Google Scholar] [CrossRef] [Scilit]
- Kim, J.; Chi, S. Action recognition of earthmoving excavators based on sequential pattern analysis of visual features and operation cycles. Autom. Constr. 2019, 104, 255–264. [Google Scholar] [CrossRef] [Scilit]
- Kim, J.; Chi, S. Multi-camera vision-based productivity monitoring of earthmoving operations. Autom. Constr. 2020, 112, 103121. [Google Scholar] [CrossRef] [Scilit]
- Mneymneh, B.E.; Abbas, M.; Khoury, H. Vision-Based Framework for Intelligent Monitoring of Hardhat Wearing on Construction Sites. J. Comput. Civ. Eng. 2019, 33, 04018066. [Google Scholar] [CrossRef] [Scilit]
- Wang, Z.; Wu, Y.; Yang, L.; Thirunavukarasu, A.; Evison, C.; Zhao, Y. Fast Personal Protective Equipment Detection for Real Construction Sites Using Deep Learning Approaches. Sensors 2021, 21, 3478. [Google Scholar] [CrossRef] [Scilit] [PubMed]
- Zhou, C.; Ding, L.Y. Safety barrier warning system for underground construction sites using Internet-of-Things technologies. Autom. Constr. 2017, 83, 372–389. [Google Scholar] [CrossRef] [Scilit]
- Fang, W.; Ding, L.; Love, P.E.; Luo, H.; Li, H.; Peña-Mora, F.; Zhong, B.; Zhou, C. Computer vision applications in construction safety assurance. Autom. Constr. 2020, 110, 103013. [Google Scholar] [CrossRef] [Scilit]
- Dalir, A.H.; Pezeshki, Z.; Ravanshadnia, M.; Krinitsky, E.; Sultanguzin, I.A. Automatic Monitoring in Construction Projects: Scientometric Analysis and Visualization of Research Activities. Hum.-Centric Intell. Syst. 2025, 5, 21–43. [Google Scholar] [CrossRef] [Scilit]
- Elghaish, F.; Mohandes, S.R.; Rahimian, F.; Abrishami, S.; Hosseini, M.R. Predictive digital monitoring of construction resources: An integrated digital twin solution. Eng. Constr. Archit. Manag. 2025, 33, 6094–6118. [Google Scholar] [CrossRef] [Scilit]
- Pfitzner, F.; Hu, S.; Braun, A.; Borrmann, A.; Fang, Y. Monitoring Concrete Pouring with Knowledge Graph-Enhanced Computer Vision: A Case Study from Munich, Germany. In Proceedings of the 2024 European Conference on Computing in Construction, Crete, Greece, 15–17 July 2024; Volume 5. [Google Scholar] [CrossRef] [Scilit]
- Xu, H.; Chang, R.; Pan, M.; Li, H.; Liu, S.; Webber, R.J.; Zuo, J.; Dong, N. Application of Artificial Neural Networks in Construction Management: A Scientometric Review. Buildings 2022, 12, 952. [Google Scholar] [CrossRef] [Scilit]
- Babalola, A.; Musa, S.; Akinlolu, M.T.; Haupt, T.C. A bibliometric review of advances in building information modeling (BIM) research. J. Eng. Des. Technol. 2021, 21, 690–710. [Google Scholar] [CrossRef] [Scilit]
- Owusu-Boadi, J.; Kissi, E.; Abu, I.M.; Owusu, C.D.; Baiden, B.; Debrah, C. A bibliometric and scientometric analysis-based review of environmental health and safety research in the construction industry. J. Eng. Des. Technol. 2024, 23, 1156–1188. [Google Scholar] [CrossRef] [Scilit]
- Nakanishi, Y.; Kaneta, T.; Nishino, S. A Review of Monitoring Construction Equipment in Support of Construction Project Management. Front. Built Environ. 2022, 7, 632593. [Google Scholar] [CrossRef] [Scilit]
- Sherafat, B.; Ahn, C.R.; Akhavian, R.; Behzadan, A.H.; Golparvar-Fard, M.; Kim, H.; Lee, Y.-C.; Rashidi, A.; Azar, E.R. Automated Methods for Activity Recognition of Construction Workers and Equipment: State-of-the-Art Review. J. Constr. Eng. Manag. 2020, 146, 03120002. [Google Scholar] [CrossRef] [Scilit]
- Chen, C.; Zhu, Z.; Hammad, A. Critical Review and Road Map of Automated Methods for Earthmoving Equipment Productivity Monitoring. J. Comput. Civ. Eng. 2022, 36, 03122001. [Google Scholar] [CrossRef] [Scilit]
- Li, L.; Huang, Z.; Wang, J.; Du, B.; Dai, L. Automated construction monitoring based on computer vision: A comprehensive review. Dev. Built Environ. 2026, 25, 100832. [Google Scholar] [CrossRef] [Scilit]
- Petroutsatou, K.; Ladopoulos, I.; Tsakelidou, K. Scientometric Analysis and AHP for Hierarchizing Criteria Affecting Construction Equipment Operators’ Performance. Sustainability 2022, 14, 6836. [Google Scholar] [CrossRef] [Scilit]
- Martinez, P.; Al-Hussein, M.; Ahmad, R. A scientometric analysis and critical review of computer vision applications for construction. Autom. Constr. 2019, 107, 102947. [Google Scholar] [CrossRef] [Scilit]
- Wang, H.-W.; Hu, Z.-Z.; Lin, J.-R. Bibliometric review of visual computing in the construction industry. Vis. Comput. Ind. Biomed. Art 2020, 3, 14. [Google Scholar] [CrossRef] [Scilit] [PubMed]
- Aria, M.; Cuccurullo, C. bibliometrix: An R-tool for comprehensive science mapping analysis. J. Informetr. 2017, 11, 959–975. [Google Scholar] [CrossRef] [Scilit]
- van Eck, N.J.; Waltman, L. Software survey: VOSviewer, a computer program for bibliometric mapping. Scientometrics 2009, 84, 523–538. [Google Scholar] [CrossRef] [Scilit] [PubMed]
- Chen, C. CiteSpace II: Detecting and visualizing emerging trends and transient patterns in scientific literature. J. Am. Soc. Inf. Sci. Technol. 2005, 57, 359–377. [Google Scholar] [CrossRef] [Scilit]
- Yang, J.; Park, M.-W.; Vela, P.A.; Golparvar-Fard, M. Construction performance monitoring via still images, time-lapse photos, and video streams: Now, tomorrow, and the future. Adv. Eng. Inform. 2015, 29, 211–224. [Google Scholar] [CrossRef] [Scilit]
- Liu, G.; Wang, Q.; Wang, T.; Li, B.; Xi, X. Vision-based excavator pose estimation for automatic control. Autom. Constr. 2024, 157, 105162. [Google Scholar] [CrossRef] [Scilit]
- Cheng, C.-F.; Rashidi, A.; Davenport, M.A.; Anderson, D.V. Activity analysis of construction equipment using audio signals and support vector machines. Autom. Constr. 2017, 81, 240–253. [Google Scholar] [CrossRef] [Scilit]
- Langroodi, A.K.; Vahdatikhaki, F.; Doree, A. Activity recognition of construction equipment using fractional random forest. Autom. Constr. 2021, 122, 103465. [Google Scholar] [CrossRef] [Scilit]
- Zhang, J.; Zi, L.; Hou, Y.; Wang, M.; Jiang, W.; Deng, D. A Deep Learning-Based Approach to Enable Action Recognition for Construction Equipment. Adv. Civ. Eng. 2020, 2020, 8812928. [Google Scholar] [CrossRef] [Scilit]
- Kim, I.-S.; Latif, K.; Kim, J.; Sharafat, A.; Lee, D.-E.; Seo, J. Vision-Based Activity Classification of Excavators by Bidirectional LSTM. Appl. Sci. 2022, 13, 272. [Google Scholar] [CrossRef] [Scilit]
- Luo, H.; Wang, M.; Wong, P.K.-Y.; Cheng, J.C.P. Full body pose estimation of construction equipment using computer vision and deep learning techniques. Autom. Constr. 2020, 110, 103016. [Google Scholar] [CrossRef] [Scilit]
- McKinsey: The COVID-19 Recovery Will Push Construction Digital Disruption | Geo Week News. Available online: https://www.geoweeknews.com/news/mckinsey-the-covid-19-recovery-will-push-construction-digital-disruption (accessed on 14 May 2026).
- How Construction Can Emerge Stronger After Coronavirus | McKinsey. Available online: https://www.mckinsey.com/capabilities/operations/our-insights/how-construction-can-emerge-stronger-after-coronavirus (accessed on 14 May 2026).
- Adekunle, S.; Aigbavboa, C.; Akinradewo, O.; Adekunle, P.; Otasowie, O. Beyond The Lockdown: Investigating the Impact of COVID On Technology Adoption In The Construction Industry. In Emerging Technologies and Future of Work; AHFE International: New York, NY, USA, 2023; Volume 117. [Google Scholar] [CrossRef] [Scilit]
- Amankwah-Amoah, J.; Khan, Z.; Wood, G.; Knight, G. COVID-19 and digitalization: The great acceleration. J. Bus. Res. 2021, 136, 602–611. [Google Scholar] [CrossRef] [Scilit] [PubMed]
- Akhavian, R.; Behzadan, A.H. Construction equipment activity recognition for simulation input modeling using mobile sensors and machine learning classifiers. Adv. Eng. Inform. 2015, 29, 867–877. [Google Scholar] [CrossRef] [Scilit]
- Lee, S.S.; Park, S.-I.; Seo, J. Utilization analysis methodology for fleet telematics of heavy earthwork equipment. Autom. Constr. 2018, 92, 59–67. [Google Scholar] [CrossRef] [Scilit]
- Memarzadeh, M.; Golparvar-Fard, M.; Niebles, J.C. Automated 2D detection of construction equipment and workers from site video streams using histograms of oriented gradients and colors. Autom. Constr. 2013, 32, 24–37. [Google Scholar] [CrossRef] [Scilit]
- Chen, J.; Lu, W.; Dong, Z. Monocular Vision–Enabled 3D Truck Reconstruction: A Novel Optimization Approach Based on Parametric Modeling and Graphics Rendering. J. Comput. Civ. Eng. 2022, 36, 04022027. [Google Scholar] [CrossRef] [Scilit]
- Lee, J.G.; Hwang, J.; Chi, S.; Seo, J. Synthetic Image Dataset Development for Vision-Based Construction Equipment Detection. J. Comput. Civ. Eng. 2022, 36, 04022020. [Google Scholar] [CrossRef] [Scilit]
- Slaton, T.; Hernandez, C.; Akhavian, R. Construction activity recognition with convolutional recurrent networks. Autom. Constr. 2020, 113, 103138. [Google Scholar] [CrossRef] [Scilit]
- Rezazadeh Azar, E.; McCabe, B. Automated Visual Recognition of Dump Trucks in Construction Videos. J. Comput. Civ. Eng. 2012, 26, 769–781. [Google Scholar] [CrossRef] [Scilit]
- Soltani, M.M.; Zhu, Z.; Hammad, A. Automated annotation for visual recognition of construction resources using synthetic images. Autom. Constr. 2016, 62, 14–23. [Google Scholar] [CrossRef] [Scilit]
- Cho, Y.K.; Gai, M. Projection-Recognition-Projection Method for Automatic Object Recognition and Registration for Dynamic Heavy Equipment Operations. J. Comput. Civ. Eng. 2014, 28, A4014002. [Google Scholar] [CrossRef] [Scilit]
- Jeong, G.; Park, M.; Ahn, C.R. Computer vision-aided audio dataset generation for recognizing construction equipment actions. Autom. Constr. 2025, 171, 106014. [Google Scholar] [CrossRef] [Scilit]
- Li, J.; Liu, Y.; Wang, L.; Sun, Y. A vision-based end pose estimation method for excavator manipulator. Multimed. Tools Appl. 2024, 83, 68723–68741. [Google Scholar] [CrossRef] [Scilit]
- Driouache, Y.; Milpied, J.; Motamedi, A. Vision-based method to identify materials transported by dump trucks. Eng. Appl. Artif. Intell. 2024, 135, 108768. [Google Scholar] [CrossRef] [Scilit]
- Ataka, A.; Aji, M.H.B.; Hakim, A.L.; Arfiantino, D.; Nanda, A.A.; Nugraha, G.K.; Setyadi, A.D.; Aji, A.; Ageng, G.; Candra, R.; et al. Vision-Based Excavator Control for Pick-and-Place Operation. In Proceedings of the 2023 15th International Conference on Information Technology and Electrical Engineering (ICITEE), Chiang Mai, Thailand, 26–27 October 2023; pp. 31–36. [Google Scholar] [CrossRef] [Scilit]
- Saeedi, P.; Lawrence, P.; Lowe, D.; Jacobsen, P.; Kusalovic, D.; Ardron, K.; Sorensen, P. An autonomous excavator with vision-based track-slippage control. IEEE Trans. Control Syst. Technol. 2005, 13, 67–84. [Google Scholar] [CrossRef] [Scilit]
- Sultan, H.; Choi, J. HCFF-Net: A Hybrid Contextual Feature Fusion Network for Robust Heavy Equipment Classification in Complex Construction Environments. Buildings 2026, 16, 1764. [Google Scholar] [CrossRef] [Scilit]
- Chen, Q.; Yin, X.; Gong, Y.; Seo, J. Automated worker action recognition in construction videos via domain-adapted vision-language fusion. Autom. Constr. 2026, 187, 106932. [Google Scholar] [CrossRef] [Scilit]
- Zhang, S.; Zhang, L. Vision-based Excavator Activity Analysis and Safety Monitoring System. In Proceedings of the 38th International Symposium on Automation and Robotics in Construction (ISARC), Dubai, United Arab Emirates, 2–4 November 2021. [Google Scholar] [CrossRef] [Scilit] [PubMed]
- Shooshtari, M.J.; Choi, J. Automated Vision-Based Activity Identification for Demolition Operations. In Proceedings of the Canadian Society for Civil Engineering Annual Conference 2023, Volume 5; Springer: Cham, Switzerland, 2024; pp. 99–111. [Google Scholar] [CrossRef] [Scilit]
- Melenbrink, N.; Werfel, J.; Menges, A. On-site autonomous construction robots: Towards unsupervised building. Autom. Constr. 2020, 119, 103312. [Google Scholar] [CrossRef] [Scilit]
- Kim, H.; Kim, H.; Hong, Y.W.; Byun, H. Detecting Construction Equipment Using a Region-Based Fully Convolutional Network and Transfer Learning. J. Comput. Civ. Eng. 2018, 32, 04017082. [Google Scholar] [CrossRef] [Scilit]
- Brilakis, I.; Park, M.-W.; Jog, G. Automated vision tracking of project related entities. Adv. Eng. Inform. 2011, 25, 713–724. [Google Scholar] [CrossRef] [Scilit]
- Wu, W.; Yang, H.; Chew, D.A.S.; Yang, S.-H.; Gibb, A.G.F.; Li, Q. Towards an autonomous real-time tracking system of near-miss accidents on construction sites. Autom. Constr. 2010, 19, 134–141. [Google Scholar] [CrossRef] [Scilit]
- Li, J.; Li, H.; Umer, W.; Wang, H.; Xing, X.; Zhao, S.; Hou, J. Identification and classification of construction equipment operators’ mental fatigue using wearable eye-tracking technology. Autom. Constr. 2020, 109, 103000. [Google Scholar] [CrossRef] [Scilit]
- Rashid, K.M.; Louis, J. Automated Activity Identification for Construction Equipment Using Motion Data From Articulated Members. Front. Built Environ. 2020, 5, 144. [Google Scholar] [CrossRef] [Scilit]
- Elghaish, F.; Matarneh, S.T.; Alhusban, M. The application of “deep learning” in construction site management: Scientometric, thematic and critical analysis. Constr. Innov. 2021, 22, 580–603. [Google Scholar] [CrossRef] [Scilit]
- Yuan, X.; Wang, S.; Qu, T.; Feng, H.; Liu, P.; Zeng, J.; Chen, X. Learning the hard-to-learn: Active learning for imbalanced datasets in data-centric tunnel engineering. Comput. Geotech. 2024, 174, 106629. [Google Scholar] [CrossRef] [Scilit]
- Azar, E.R.; McCabe, B.Y. A Visual Sensing Approach to Estimate Material Hauling Cycles in Heavy Construction and Surface Mining Jobsites. In Proceedings of the 30th International Symposium on Automation and Robotics in Construction and Mining (ISARC 2013): Building the Future in Automation and Robotics, Montréal, QC, Canada, 11–15 August 2013. [Google Scholar] [CrossRef] [Scilit] [PubMed]
- Ray, U.; Arteaga, C.; Ahn, Y.; Park, J. Enhanced identification of equipment failures from descriptive accident reports using language generative model. Eng. Constr. Archit. Manag. 2024, 33, 2298–2313. [Google Scholar] [CrossRef] [Scilit]
- Pradhananga, N.; Teizer, J. Cell-based construction site simulation model for earthmoving operations using real-time equipment location data. Vis. Eng. 2015, 3, 12. [Google Scholar] [CrossRef] [Scilit]
- Pradhananga, N.; Teizer, J. GPS-based framework towards more realistic and real-time construction equipment operation simulation. In Proceedings of the 2012 Winter Simulation Conference (WSC), Berlin, Germany, 9–12 December 2012; pp. 1–12. [Google Scholar] [CrossRef] [Scilit][Green Version]
- Golovina, O.; Teizer, J.; Pradhananga, N. Heat map generation for predictive safety planning: Preventing struck-by and near miss interactions between workers-on-foot and construction equipment. Autom. Constr. 2016, 71, 99–115. [Google Scholar] [CrossRef] [Scilit]
- Vasenev, A.; Pradhananga, N.; Bijleveld, F.; Ionita, D.; Hartmann, T.; Teizer, J.; Dorée, A. An information fusion approach for filtering GNSS data sets collected during construction operations. Adv. Eng. Inform. 2014, 28, 297–310. [Google Scholar] [CrossRef] [Scilit]
- Rezazadeh Azar, E. Semantic Annotation of Videos from Equipment-Intensive Construction Operations by Shot Recognition and Probabilistic Reasoning. J. Comput. Civ. Eng. 2017, 31, 04017042. [Google Scholar] [CrossRef] [Scilit]
- Azar, E.R. Construction Equipment Identification Using Marker-Based Recognition and an Active Zoom Camera. J. Comput. Civ. Eng. 2016, 30, 04015033. [Google Scholar] [CrossRef] [Scilit]
- Rezazadeh Azar, E.; McCabe, B. Vision-Based Recognition of Dirt Loading Cycles in Construction Sites. In Proceedings of the Construction Research Congress 2012, West Lafayette, IN, USA, 21–23 May 2012; pp. 1042–1051. [Google Scholar] [CrossRef] [Scilit]
- Rezazadeh Azar, E. Active Control of a Pan-Tilt-Zoom Camera for Vision-Based Monitoring of Equipment in Construction and Surface Mining Jobsites. In Proceedings of the 33rd International Symposium on Automation and Robotics in Construction (ISARC), Auburn, AL, USA, 18–21 July 2016. [Google Scholar] [CrossRef] [Scilit] [PubMed][Green Version]
- Teizer, J.; Golovina, O.; Wang, D.; Pradhananga, N. Automated Collection, Identification, Localization, and Analysis of Worker-Related Proximity Hazard Events in Heavy Construction Equipment Operation. In Proceedings of the 32nd International Symposium on Automation and Robotics in Construction and Mining (ISARC 2015), Oulu, Finland, 15–18 June 2015. [Google Scholar] [CrossRef] [Scilit] [PubMed]
- Torres Calderon, W.; Roberts, D.; Golparvar-Fard, M. Synthesizing Pose Sequences from 3D Assets for Vision-Based Activity Analysis. J. Comput. Civ. Eng. 2021, 35, 04020052. [Google Scholar] [CrossRef] [Scilit]
- Roberts, D.; Wang, Y.; Sabet, A.; Golparvar-Fard, M. Annotating 2D Imagery with 3D Kinematically Configurable Assets of Construction Equipment for Training Pose-Informed Activity Analysis and Safety Monitoring Algorithms. In Proceedings of the Computing in Civil Engineering 2019, Atlanta, GA, USA, 17–19 June 2019; pp. 32–38. [Google Scholar] [CrossRef] [Scilit]
- Roberts, D.; Torres Calderon, W.; Tang, S.; Golparvar-Fard, M. Vision-Based Construction Worker Activity Analysis Informed by Body Posture. J. Comput. Civ. Eng. 2020, 34, 04020017. [Google Scholar] [CrossRef] [Scilit]
- Wang, M.; Wong, P.K.-Y.; Luo, H.; Kumar, S.; Delhi, V.-S.K.; Cheng, J.C.-P. Predicting Safety Hazards Among Construction Workers and Equipment Using Computer Vision and Deep Learning Techniques. In Proceedings of the 36th International Symposium on Automation and Robotics in Construction (ISARC), Banff, AB, Canada, 21–24 May 2019. [Google Scholar] [CrossRef] [Scilit] [PubMed]
- Chen, C.; Zhu, Z.; Hammad, A. Automated excavators activity recognition and productivity analysis from construction site surveillance videos. Autom. Constr. 2020, 110, 103045. [Google Scholar] [CrossRef] [Scilit]
- Rezazadeh Azar, E.; Dickinson, S.; McCabe, B. Server-Customer Interaction Tracker: Computer Vision–Based System to Estimate Dirt-Loading Cycles. J. Constr. Eng. Manag. 2013, 139, 785–794. [Google Scholar] [CrossRef] [Scilit]
- Kim, J.; Chi, S.; Seo, J. Interaction analysis for vision-based activity identification of earthmoving excavators and dump trucks. Autom. Constr. 2018, 87, 297–308. [Google Scholar] [CrossRef] [Scilit]
- Soltani, M.M.; Zhu, Z.; Hammad, A. Skeleton estimation of excavator by detecting its parts. Autom. Constr. 2017, 82, 1–15. [Google Scholar] [CrossRef] [Scilit]
- Seo, J.; Han, S.; Lee, S.; Kim, H. Computer vision techniques for construction safety and health monitoring. Adv. Eng. Inform. 2015, 29, 239–251. [Google Scholar] [CrossRef] [Scilit]
- Grau, D.; Caldas, C.H.; Haas, C.T.; Goodrum, P.M.; Gong, J. Assessing the impact of materials tracking technologies on construction craft productivity. Autom. Constr. 2009, 18, 903–911. [Google Scholar] [CrossRef] [Scilit]
- Ahn, C.R.; Lee, S.; Peña-Mora, F. Application of Low-Cost Accelerometers for Measuring the Operational Efficiency of a Construction Equipment Fleet. J. Comput. Civ. Eng. 2015, 29, 04014042. [Google Scholar] [CrossRef] [Scilit]
- Kim, H.; Ahn, C.R.; Engelhaupt, D.; Lee, S. Application of dynamic time warping to the recognition of mixed equipment activities in cycle time measurement. Autom. Constr. 2018, 87, 225–234. [Google Scholar] [CrossRef] [Scilit]
- Park, M.-W.; Koch, C.; Brilakis, I. Three-Dimensional Tracking of Construction Resources Using an On-Site Camera System. J. Comput. Civ. Eng. 2012, 26, 541–549. [Google Scholar] [CrossRef] [Scilit]
- Wu, Y.; Wang, M.; Liu, X.; Wang, Z.; Ma, T.; Lu, Z.; Liu, D.; Xie, Y.; Li, X.; Wang, X. Monitoring the Work Cycles of Earthmoving Excavators in Earthmoving Projects Using UAV Remote Sensing. Remote Sens. 2021, 13, 3853. [Google Scholar] [CrossRef] [Scilit]
- Inagawa, M.; Kawabe, T.; Takei, T.; Nagatani, K. Demonstration of position estimation for multiple construction vehicles of different models by using 3D LiDARs installed in the field. Robomech J. 2023, 10, 15. [Google Scholar] [CrossRef] [Scilit]
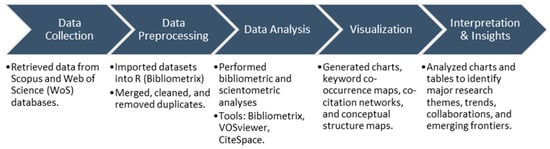
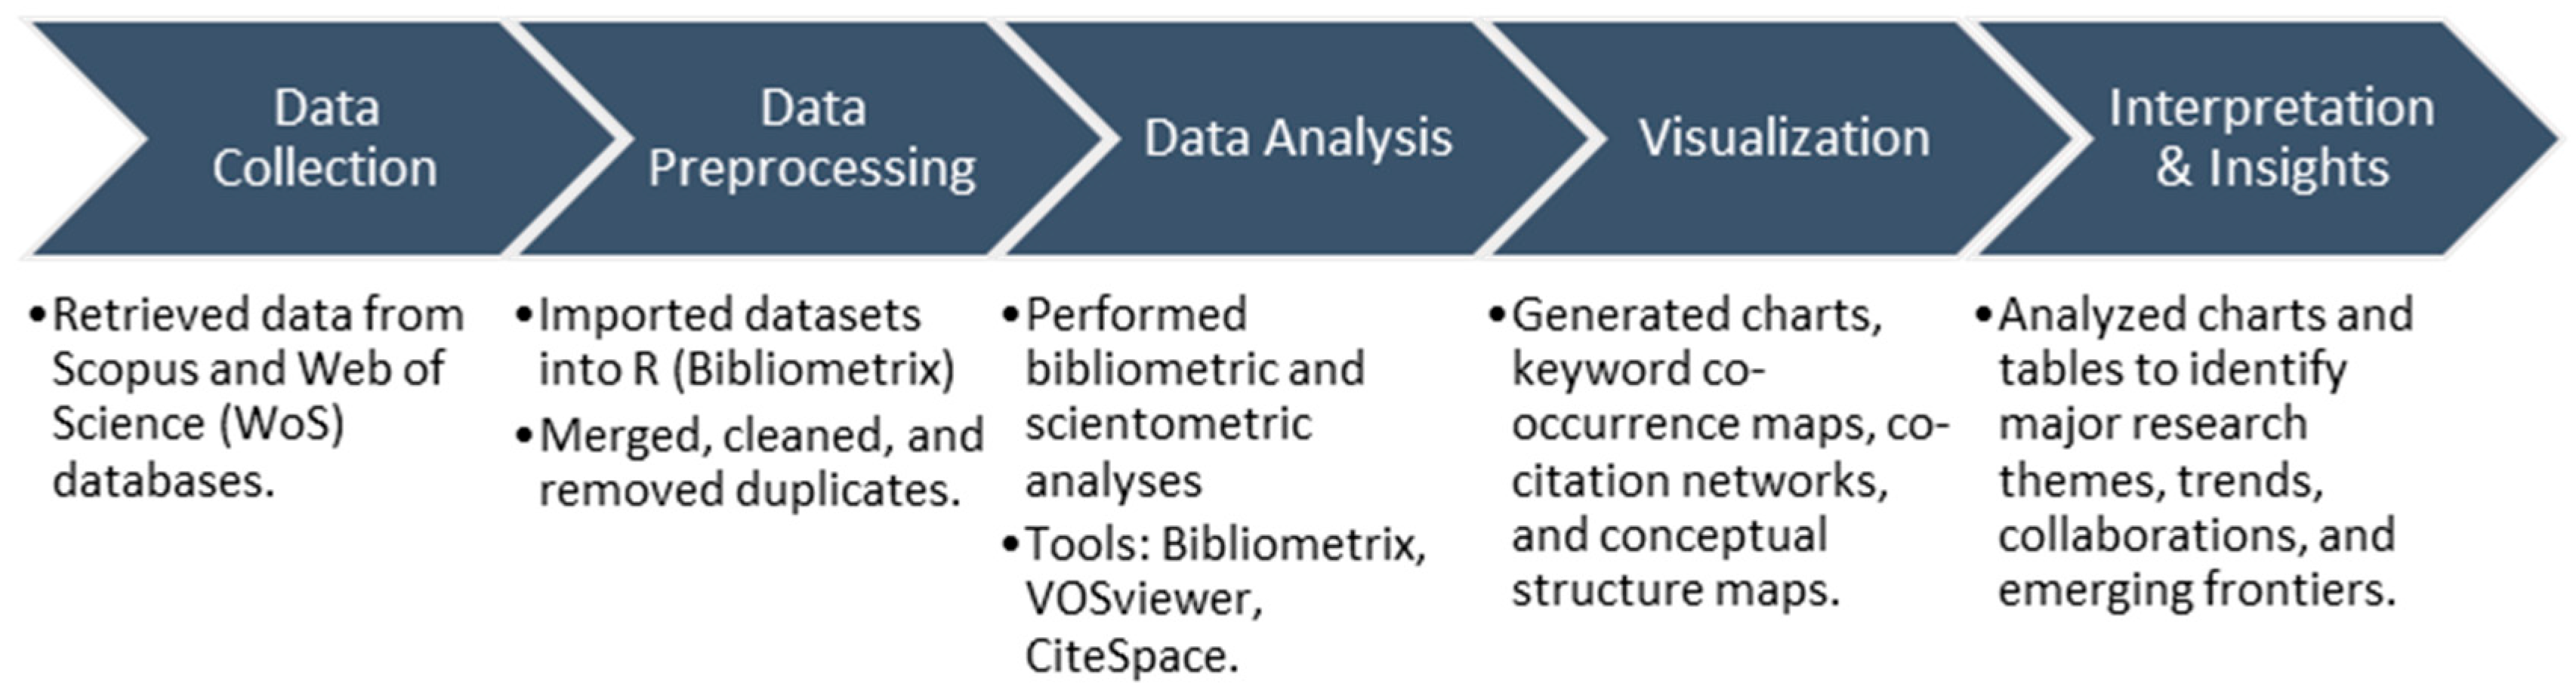
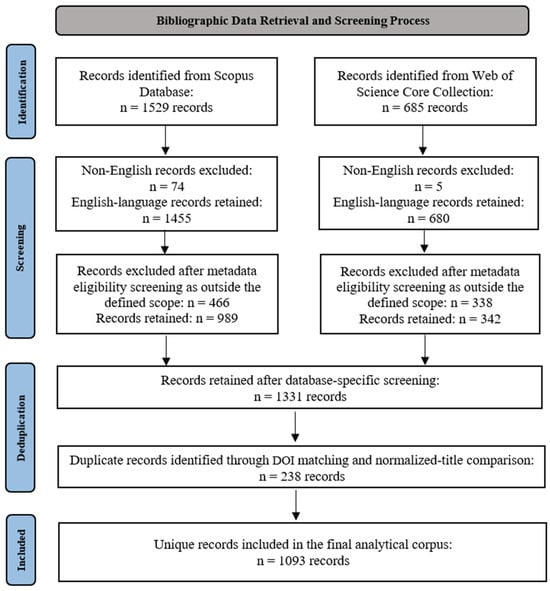
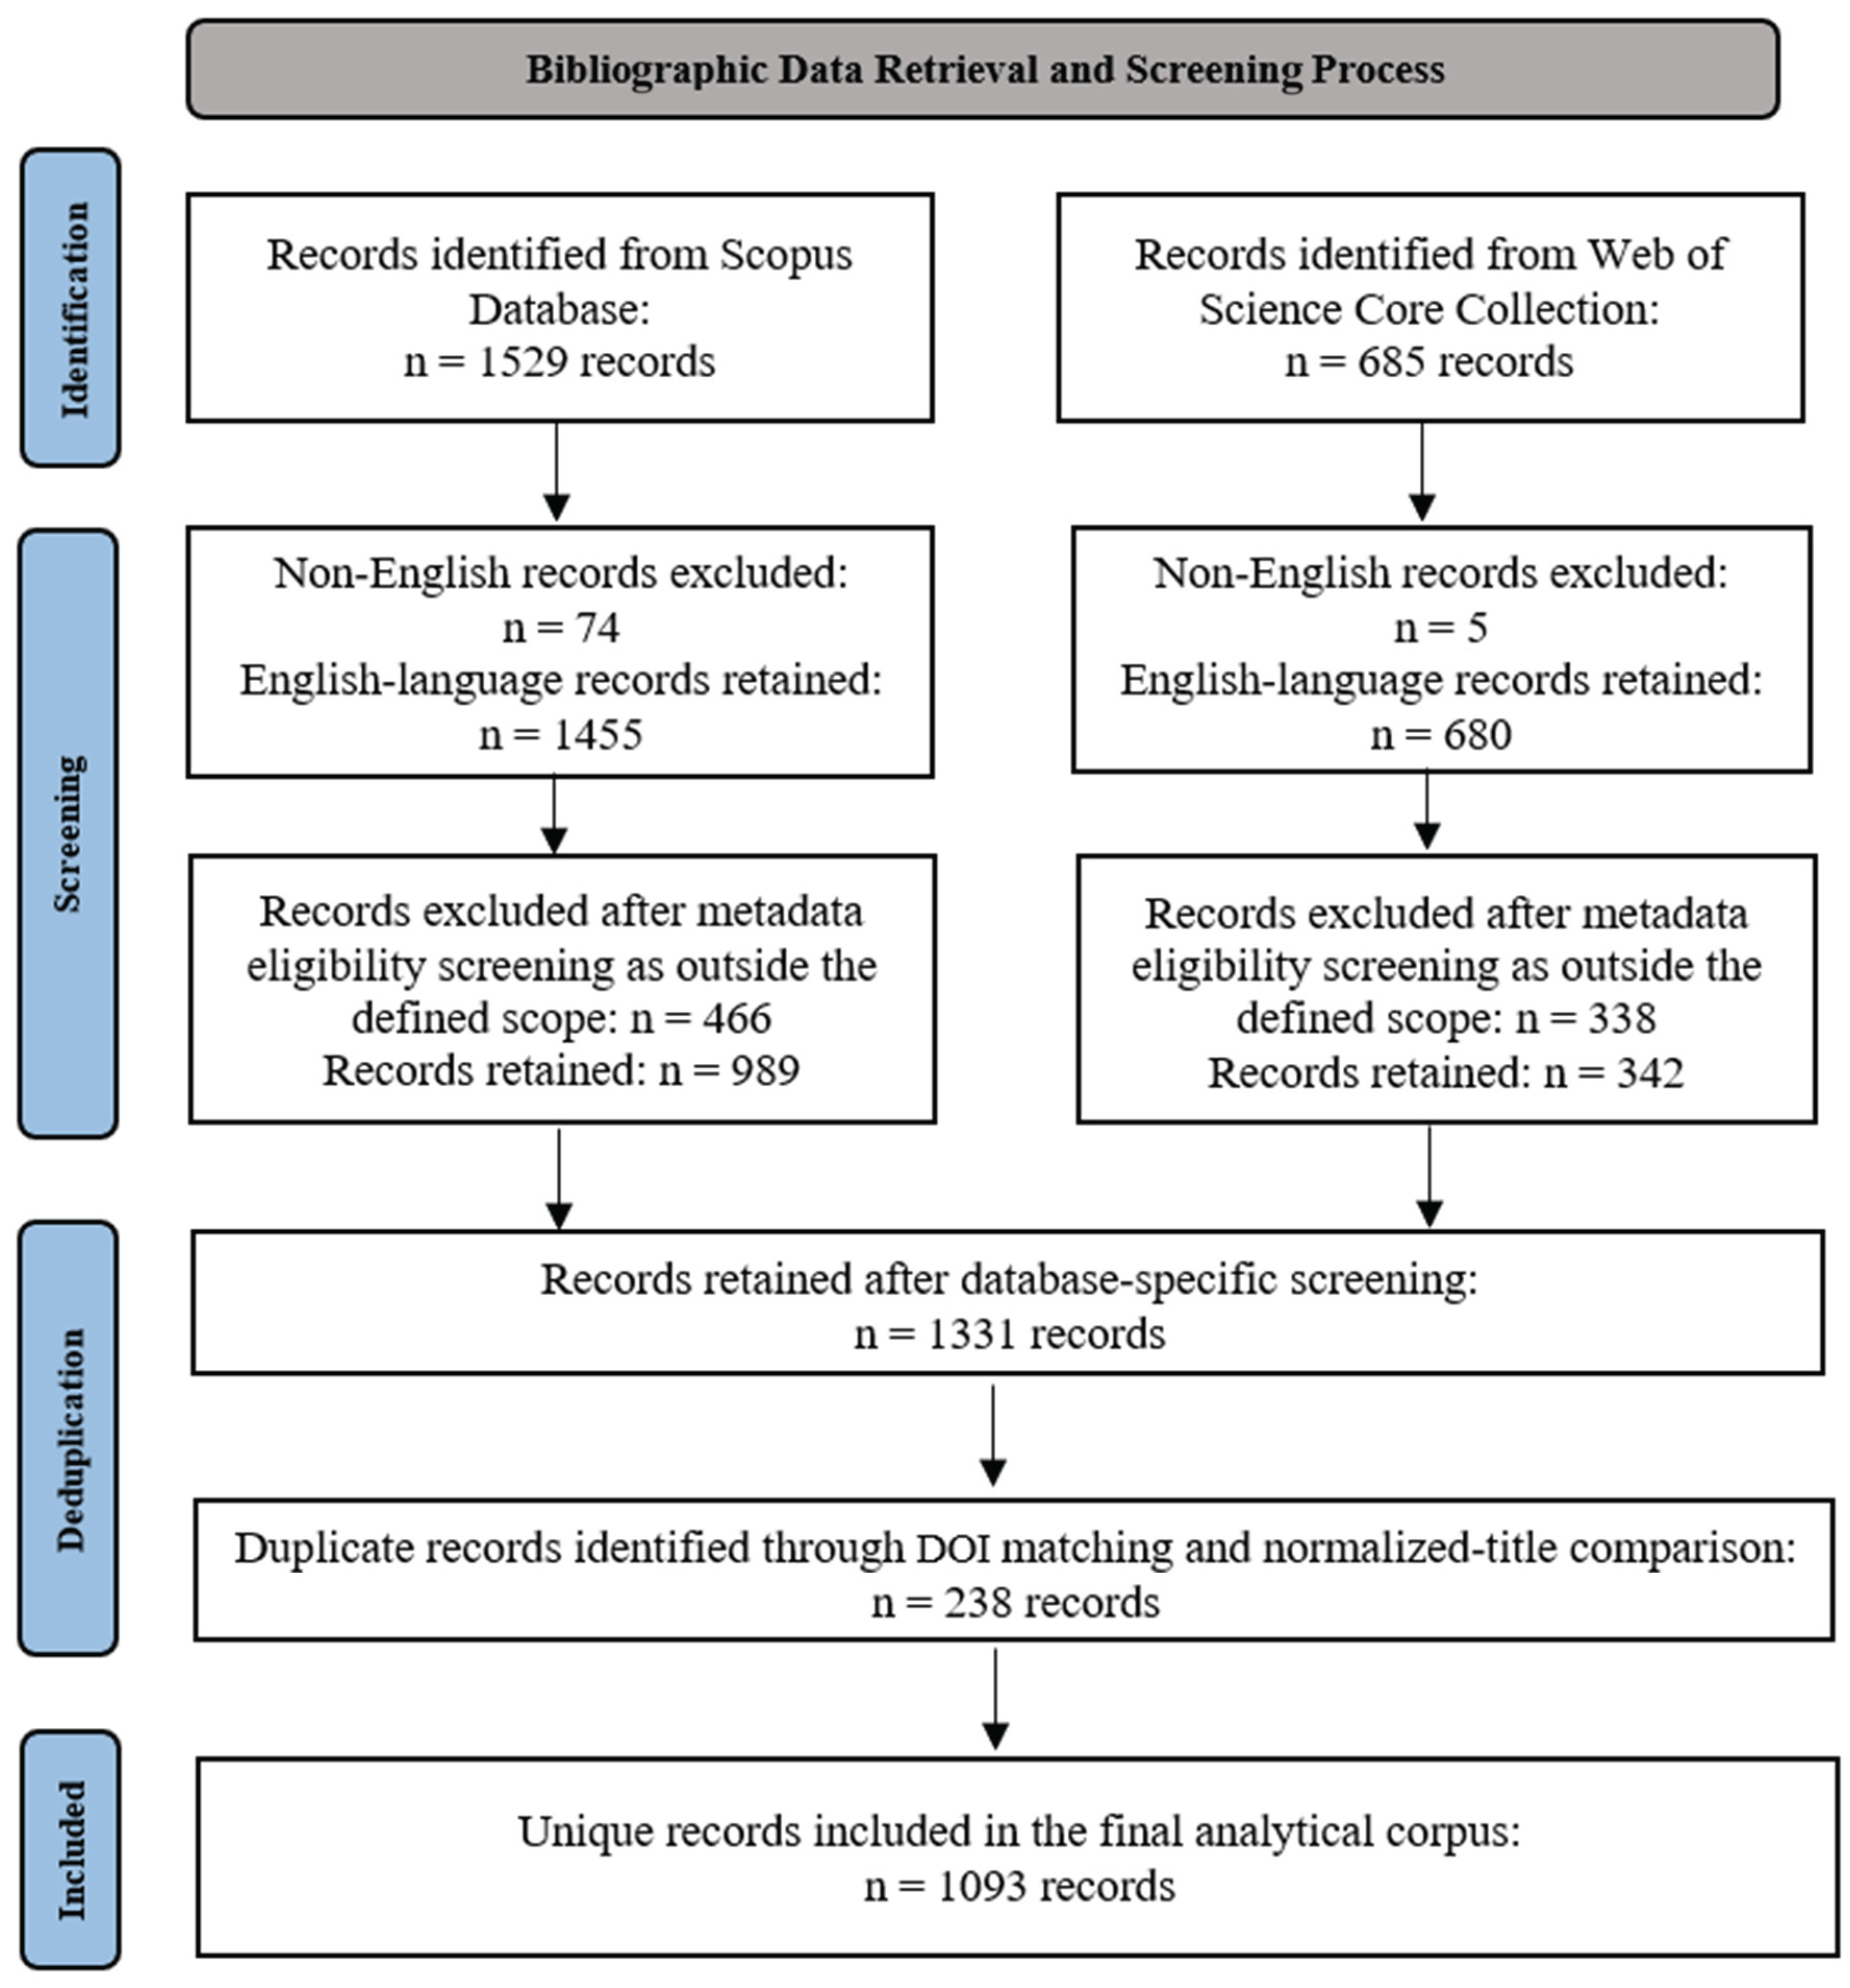
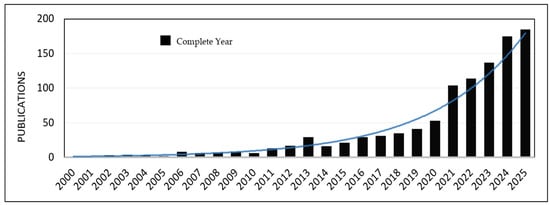
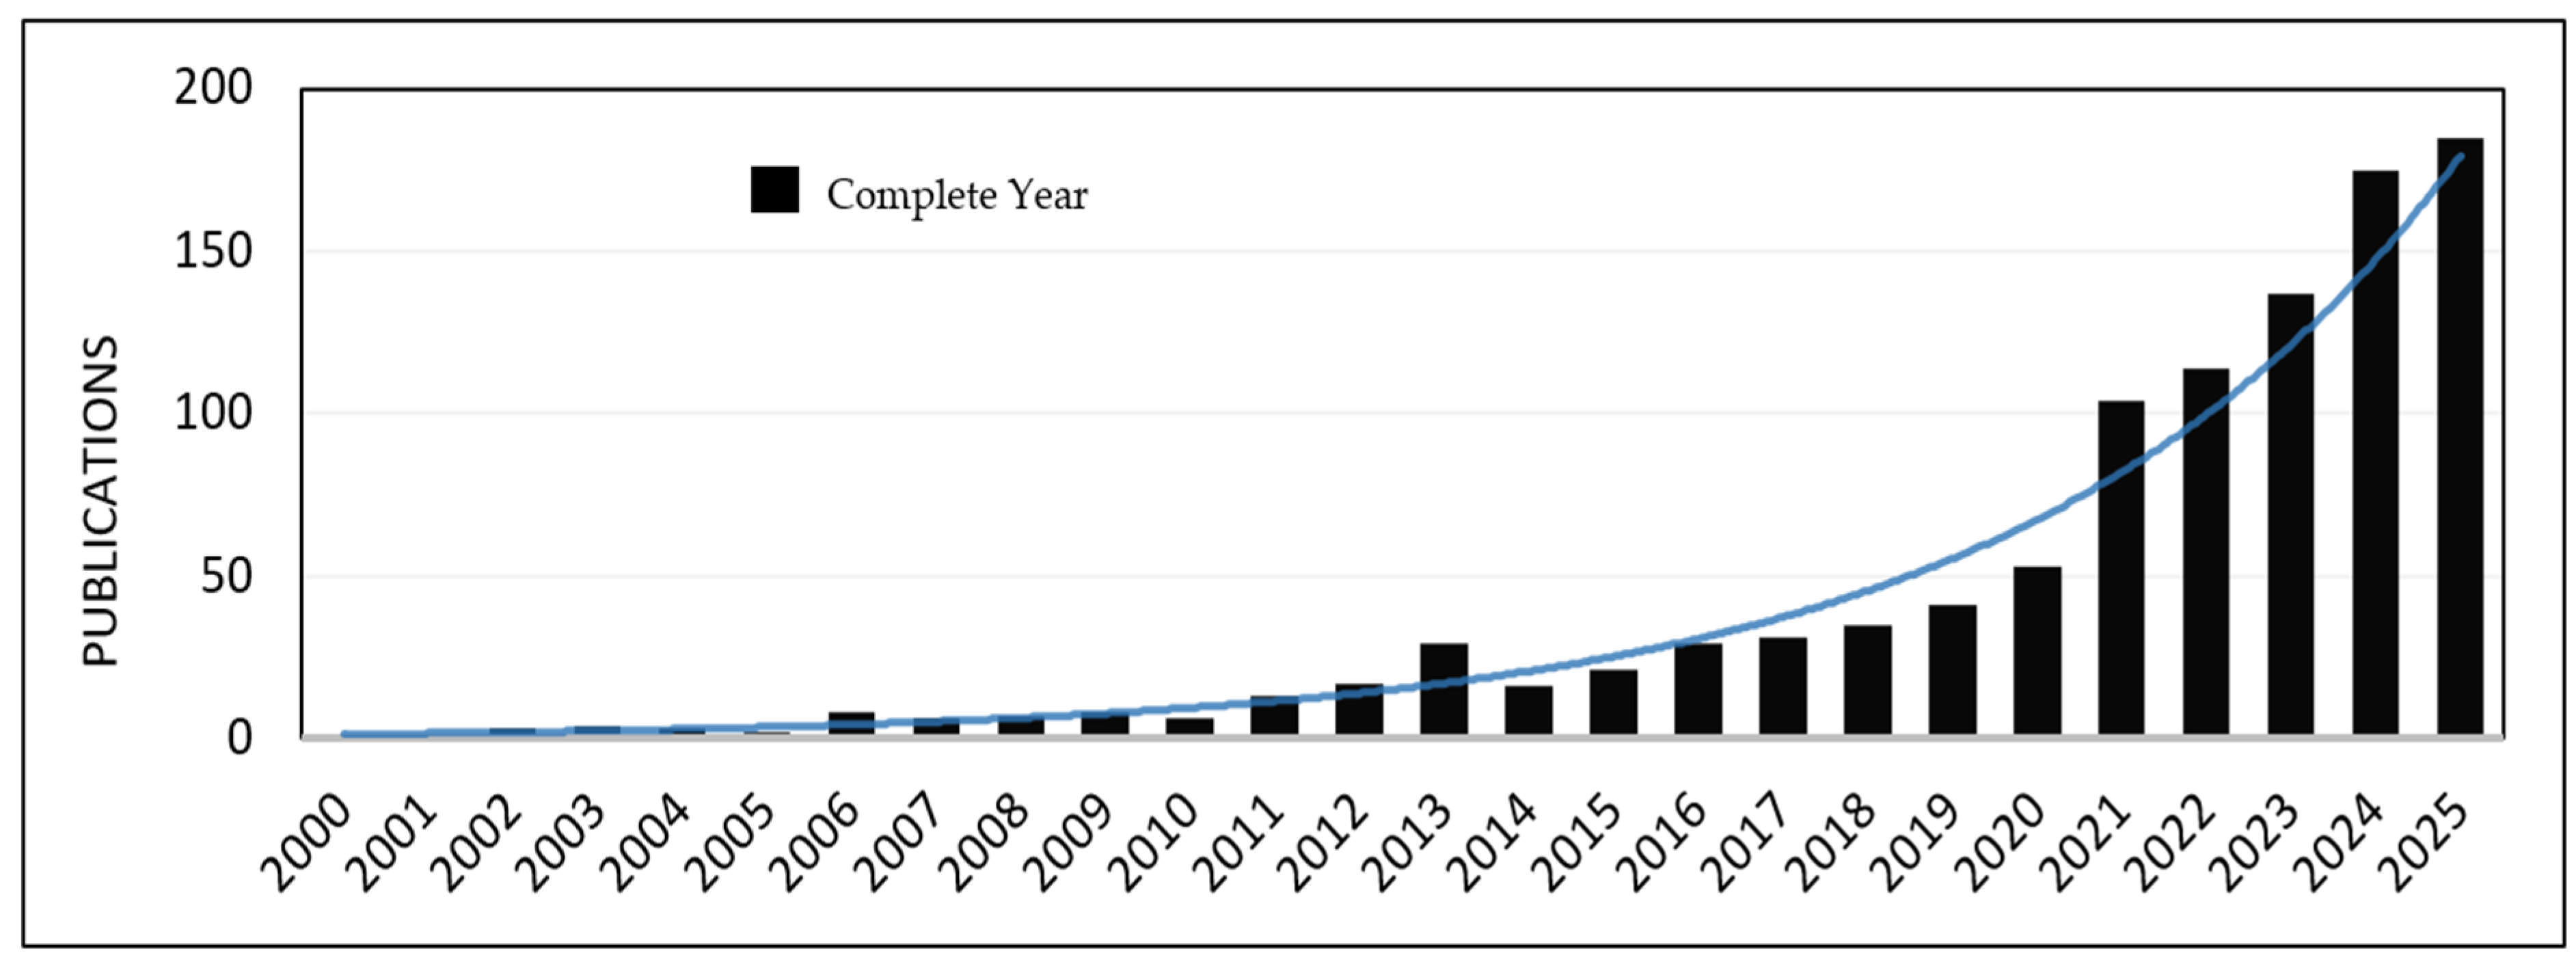
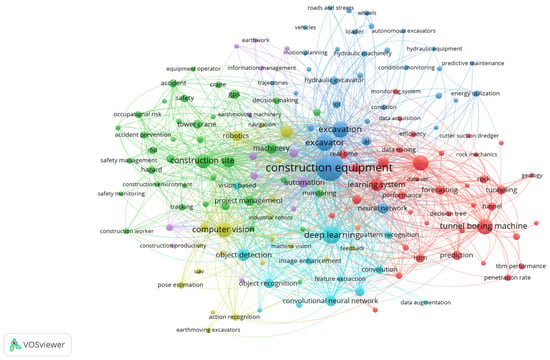
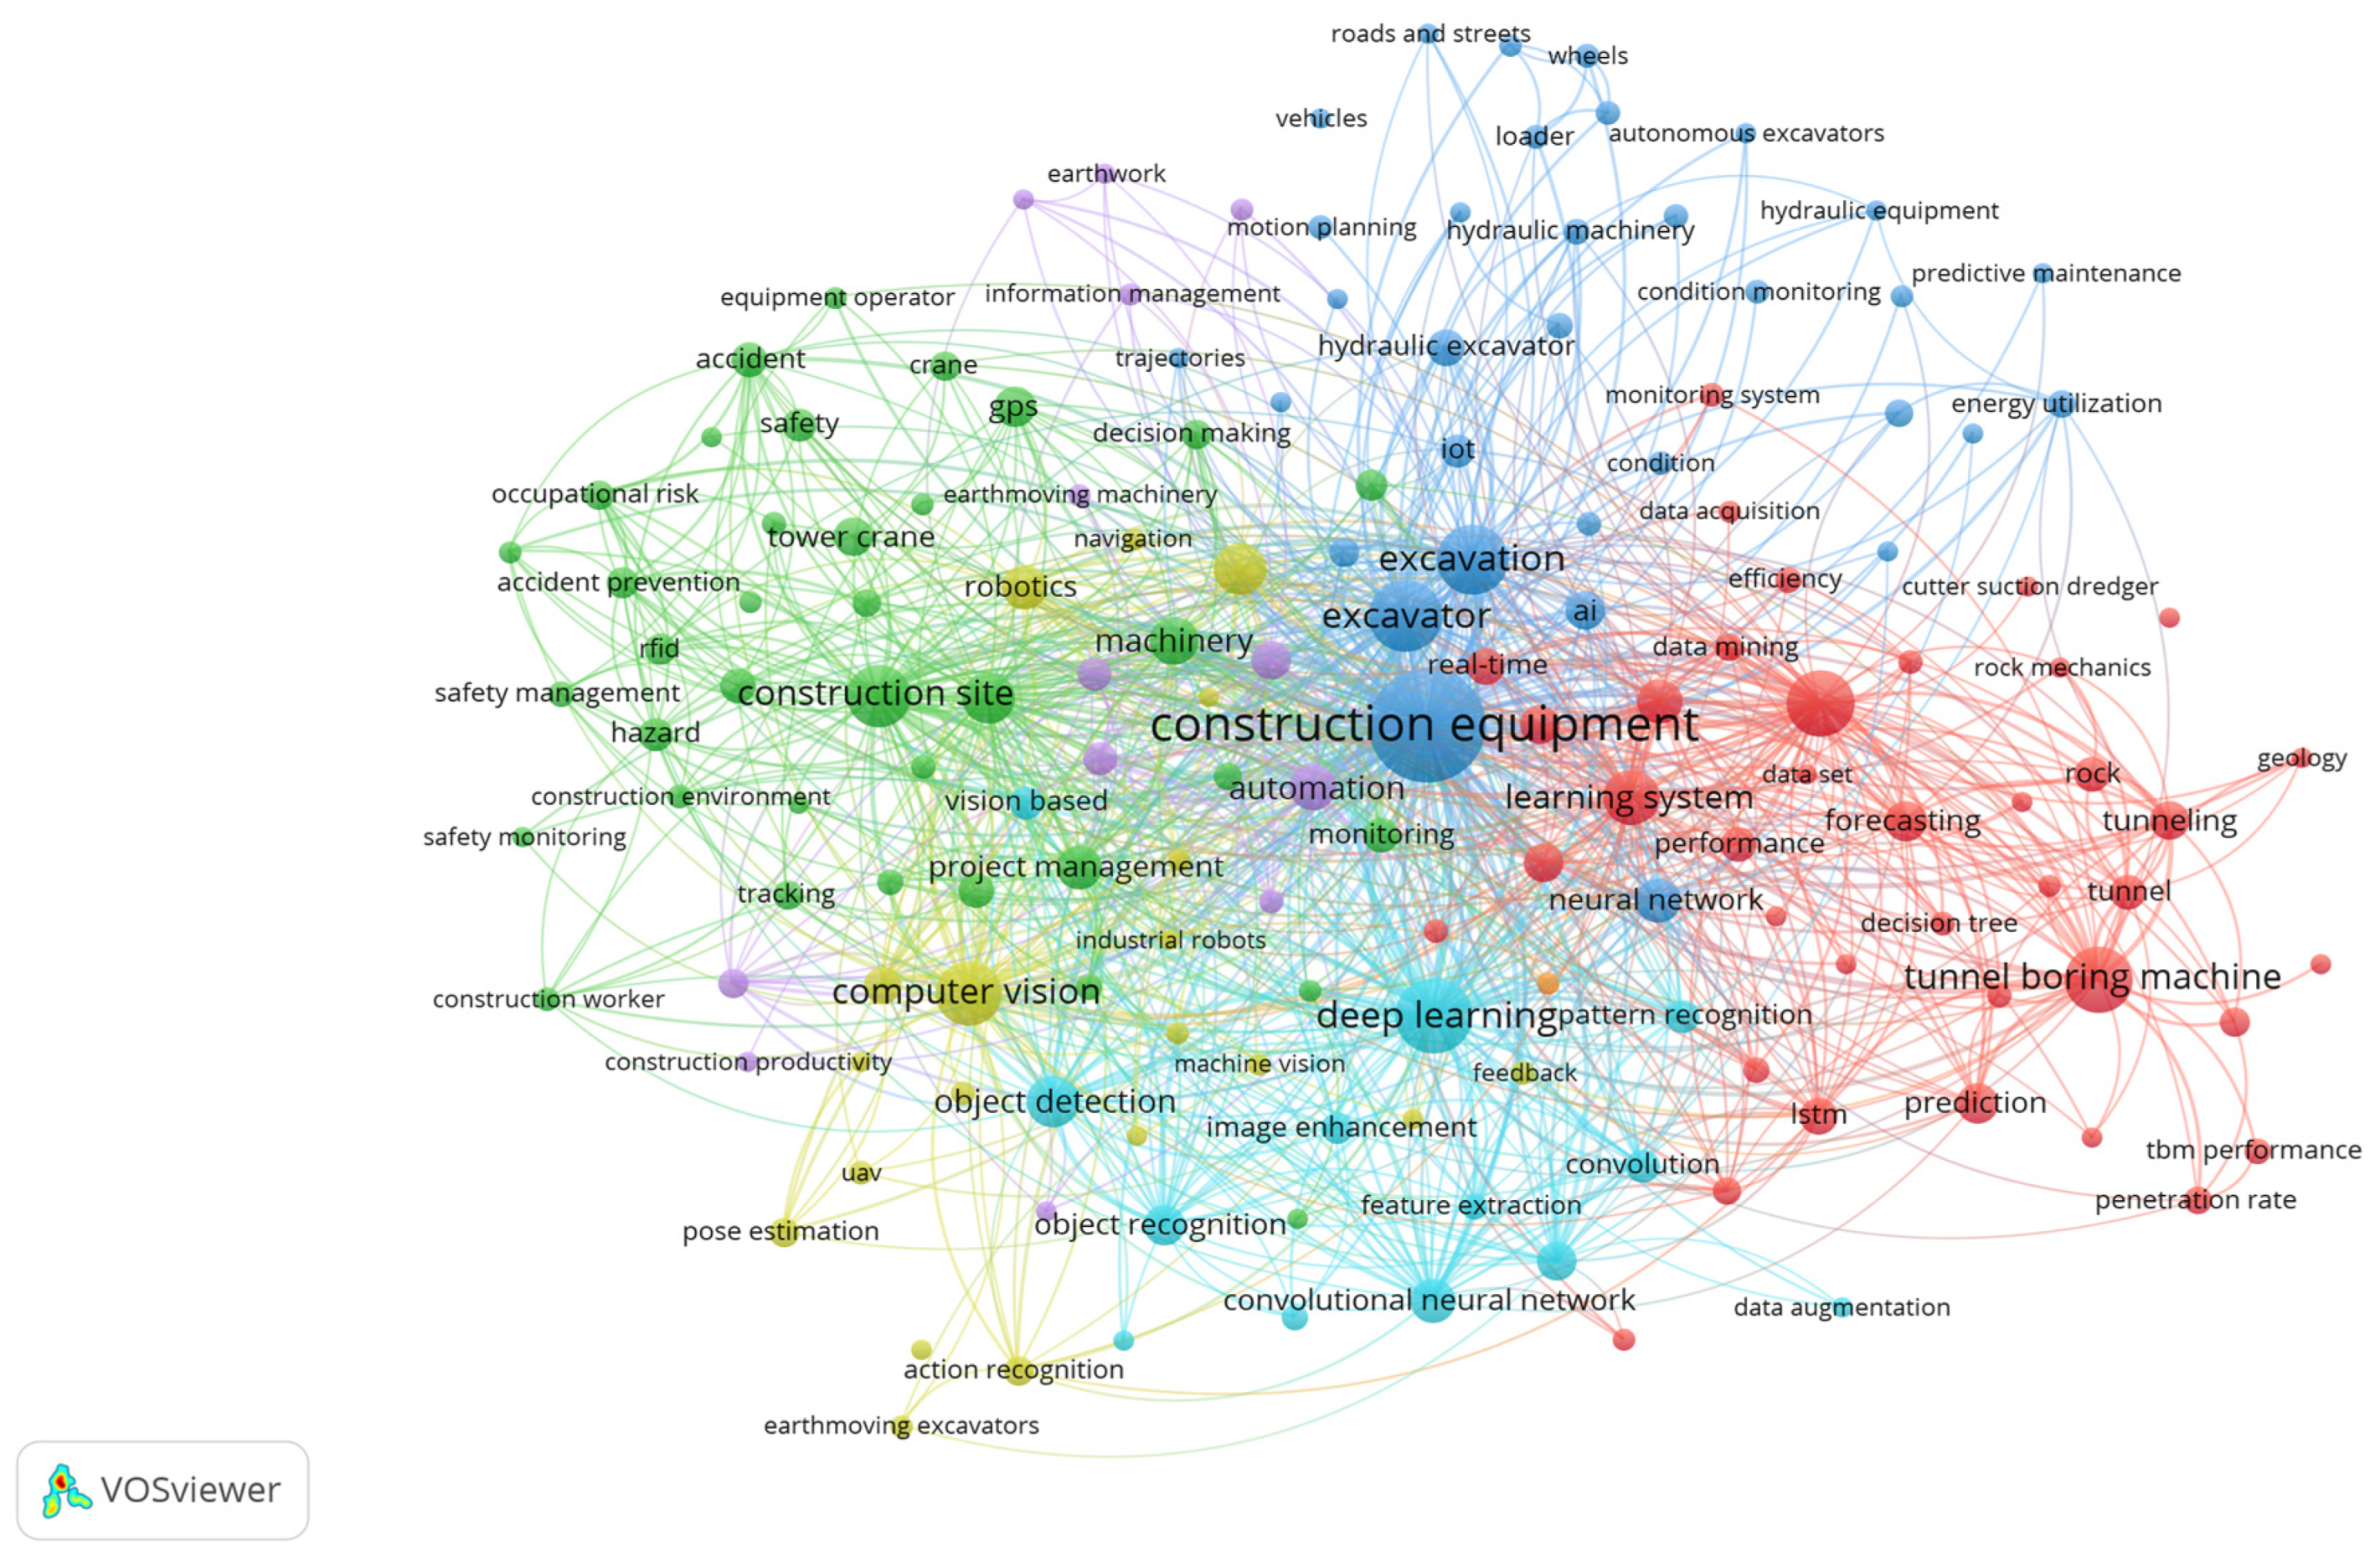
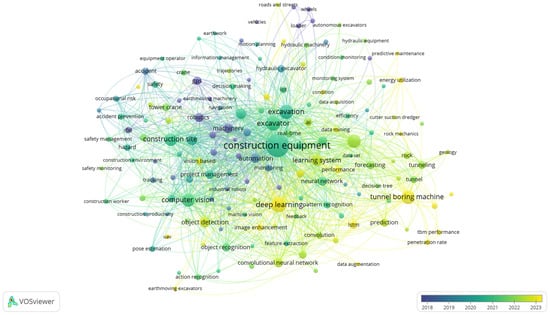
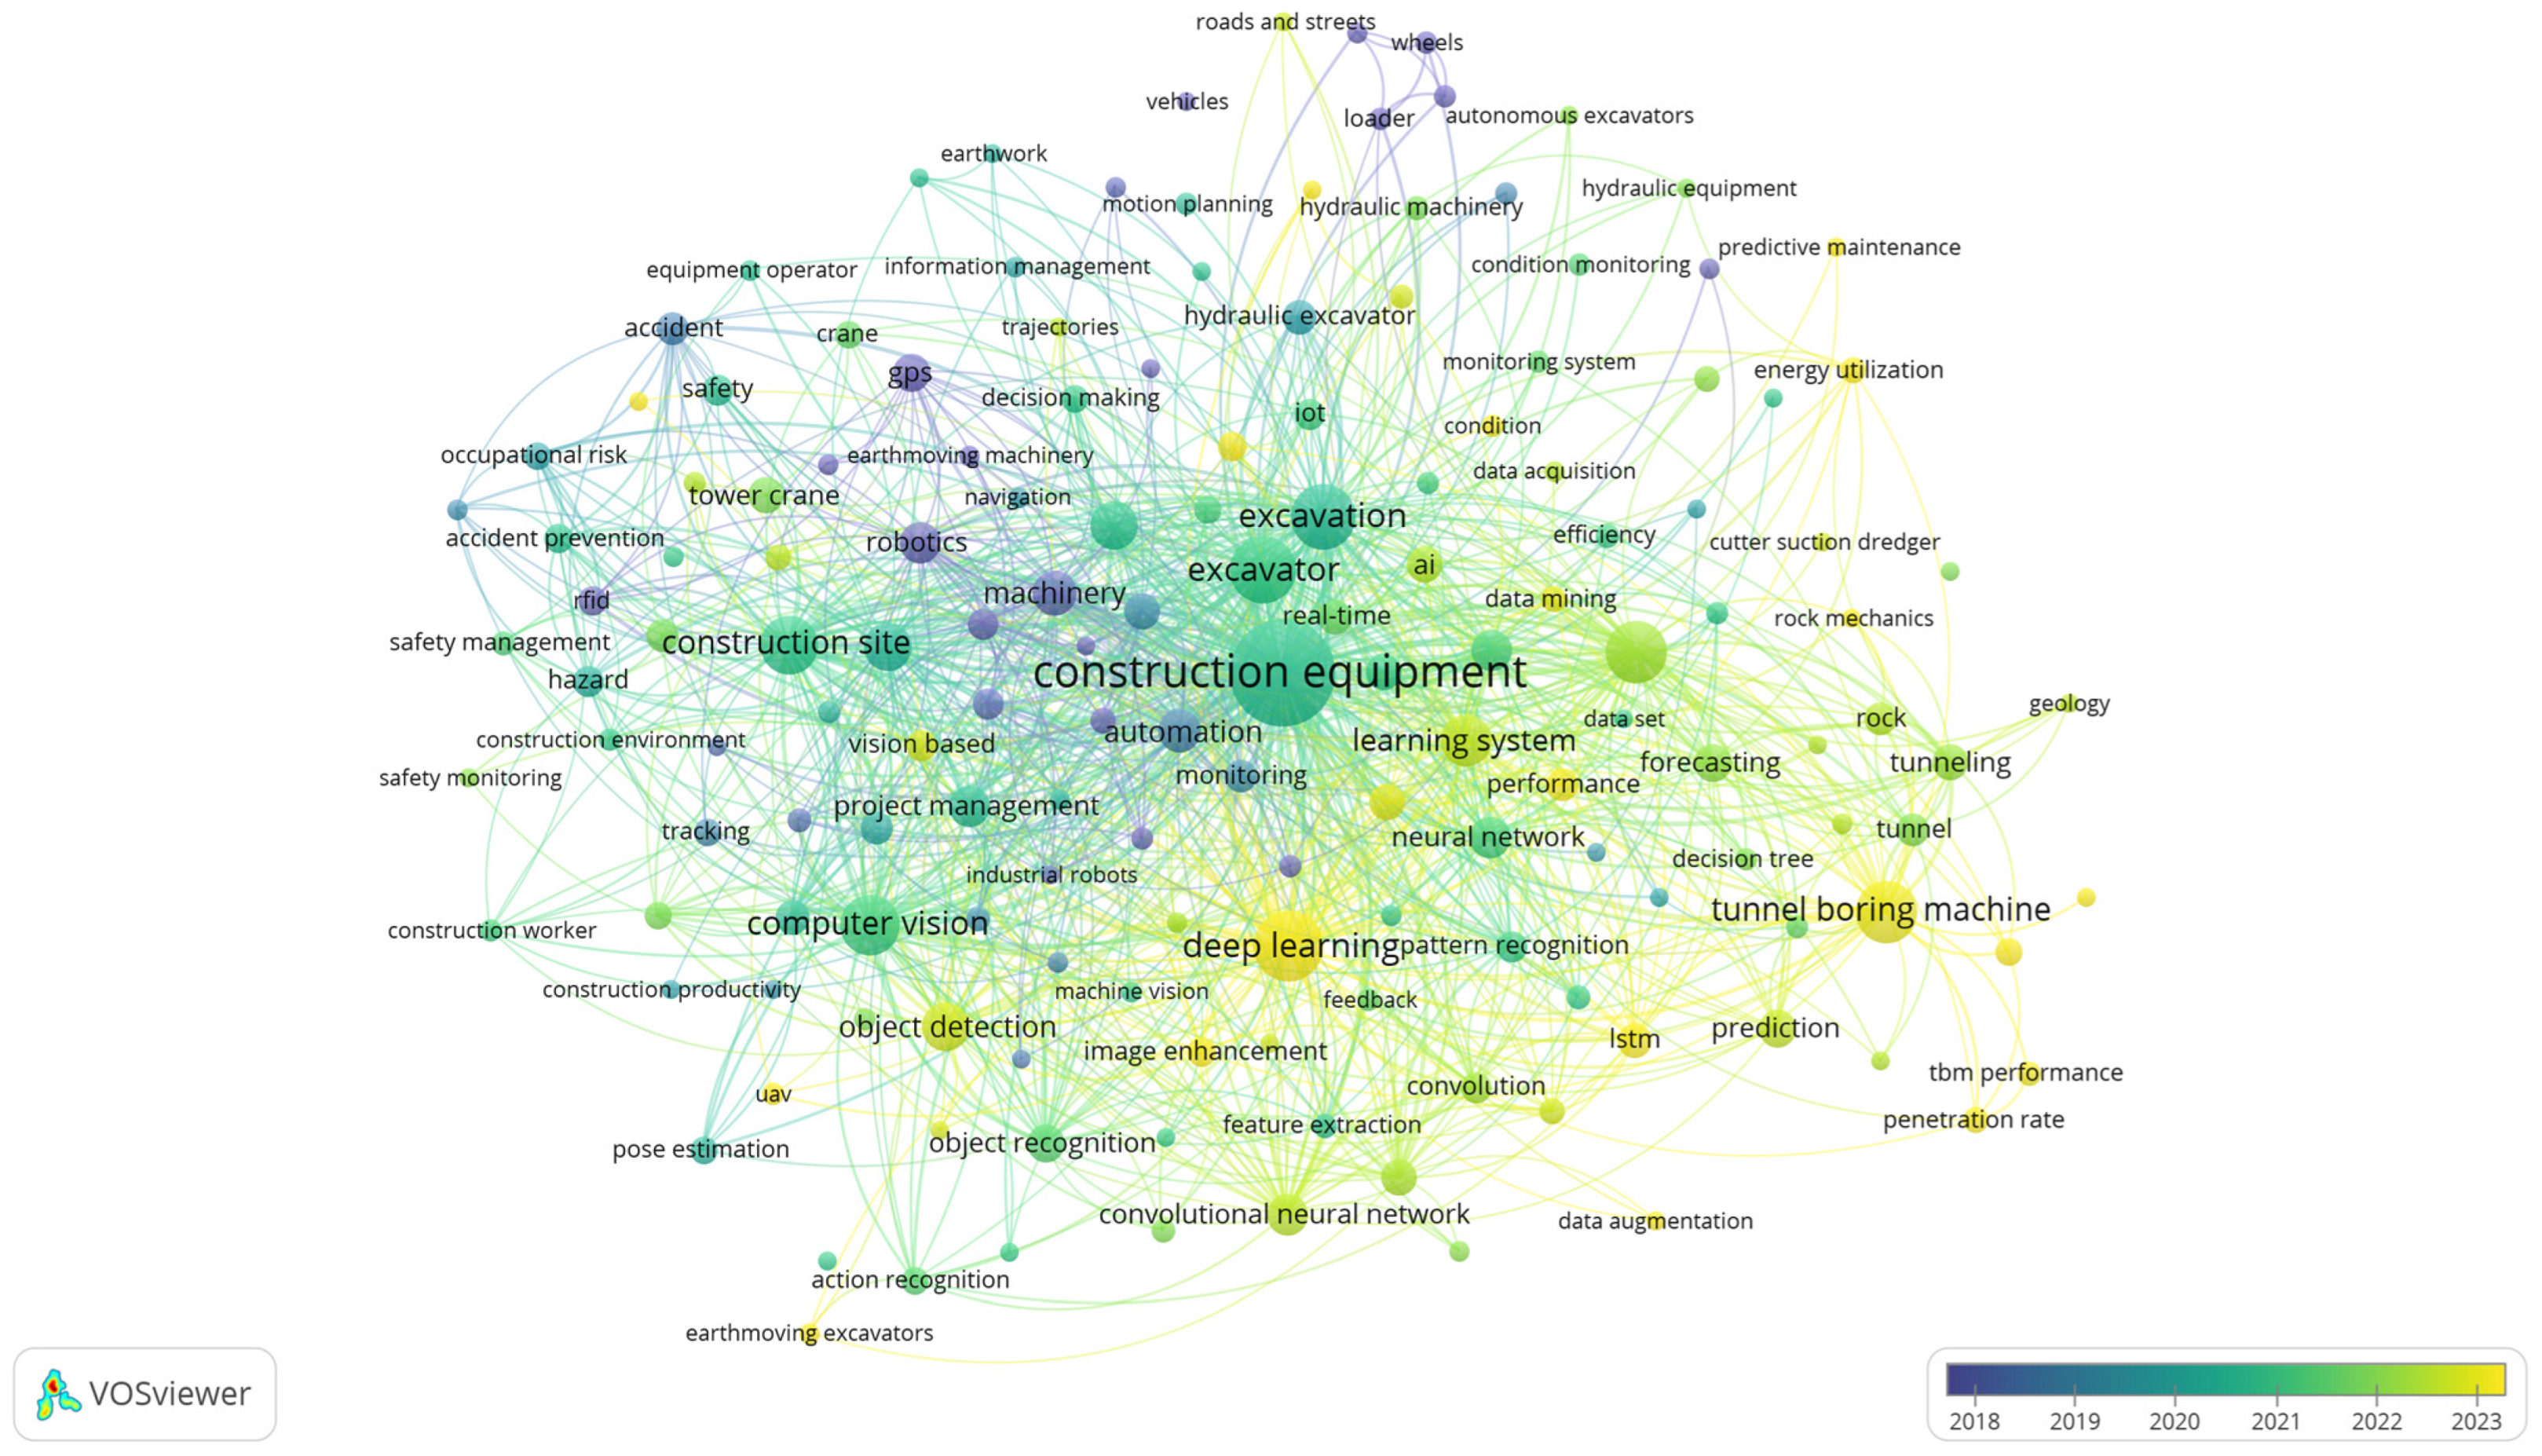
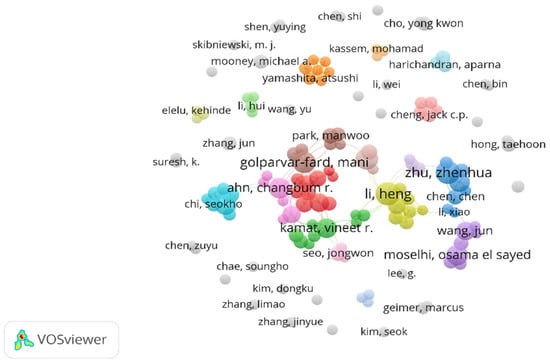
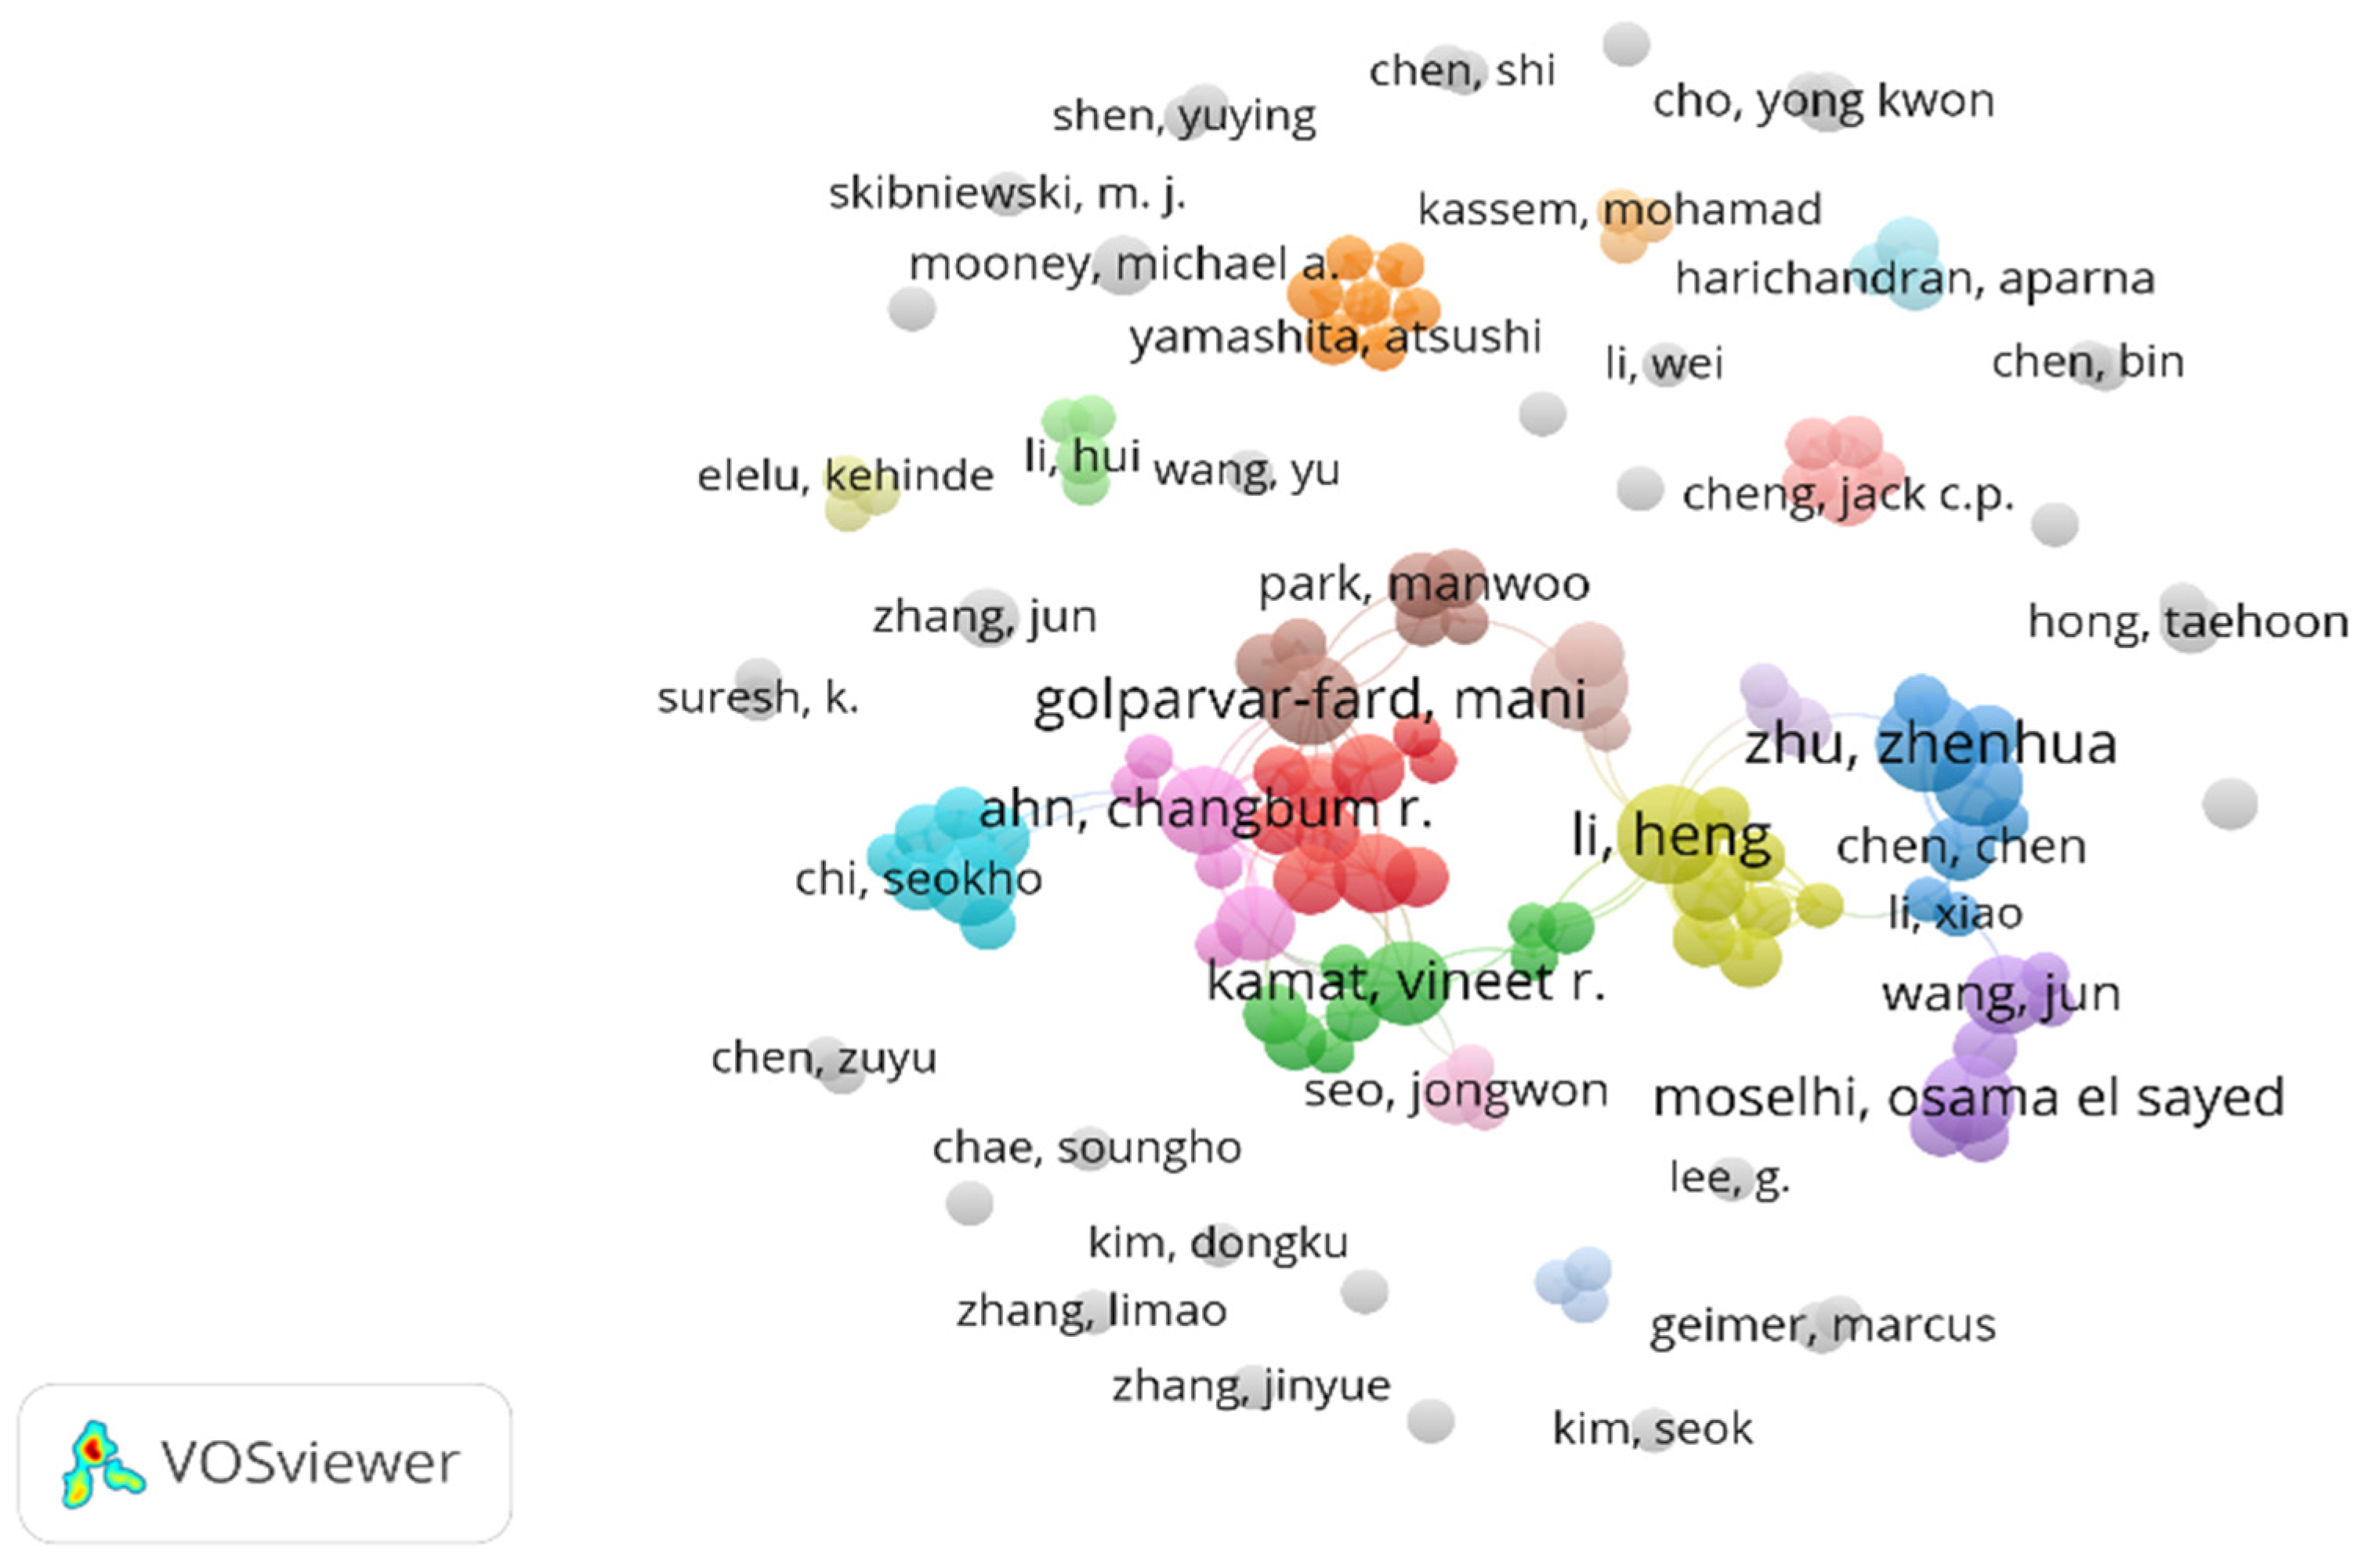
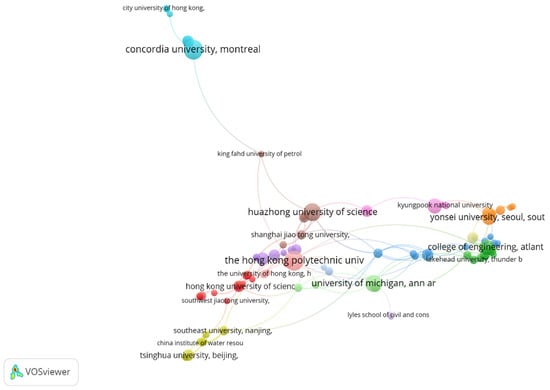
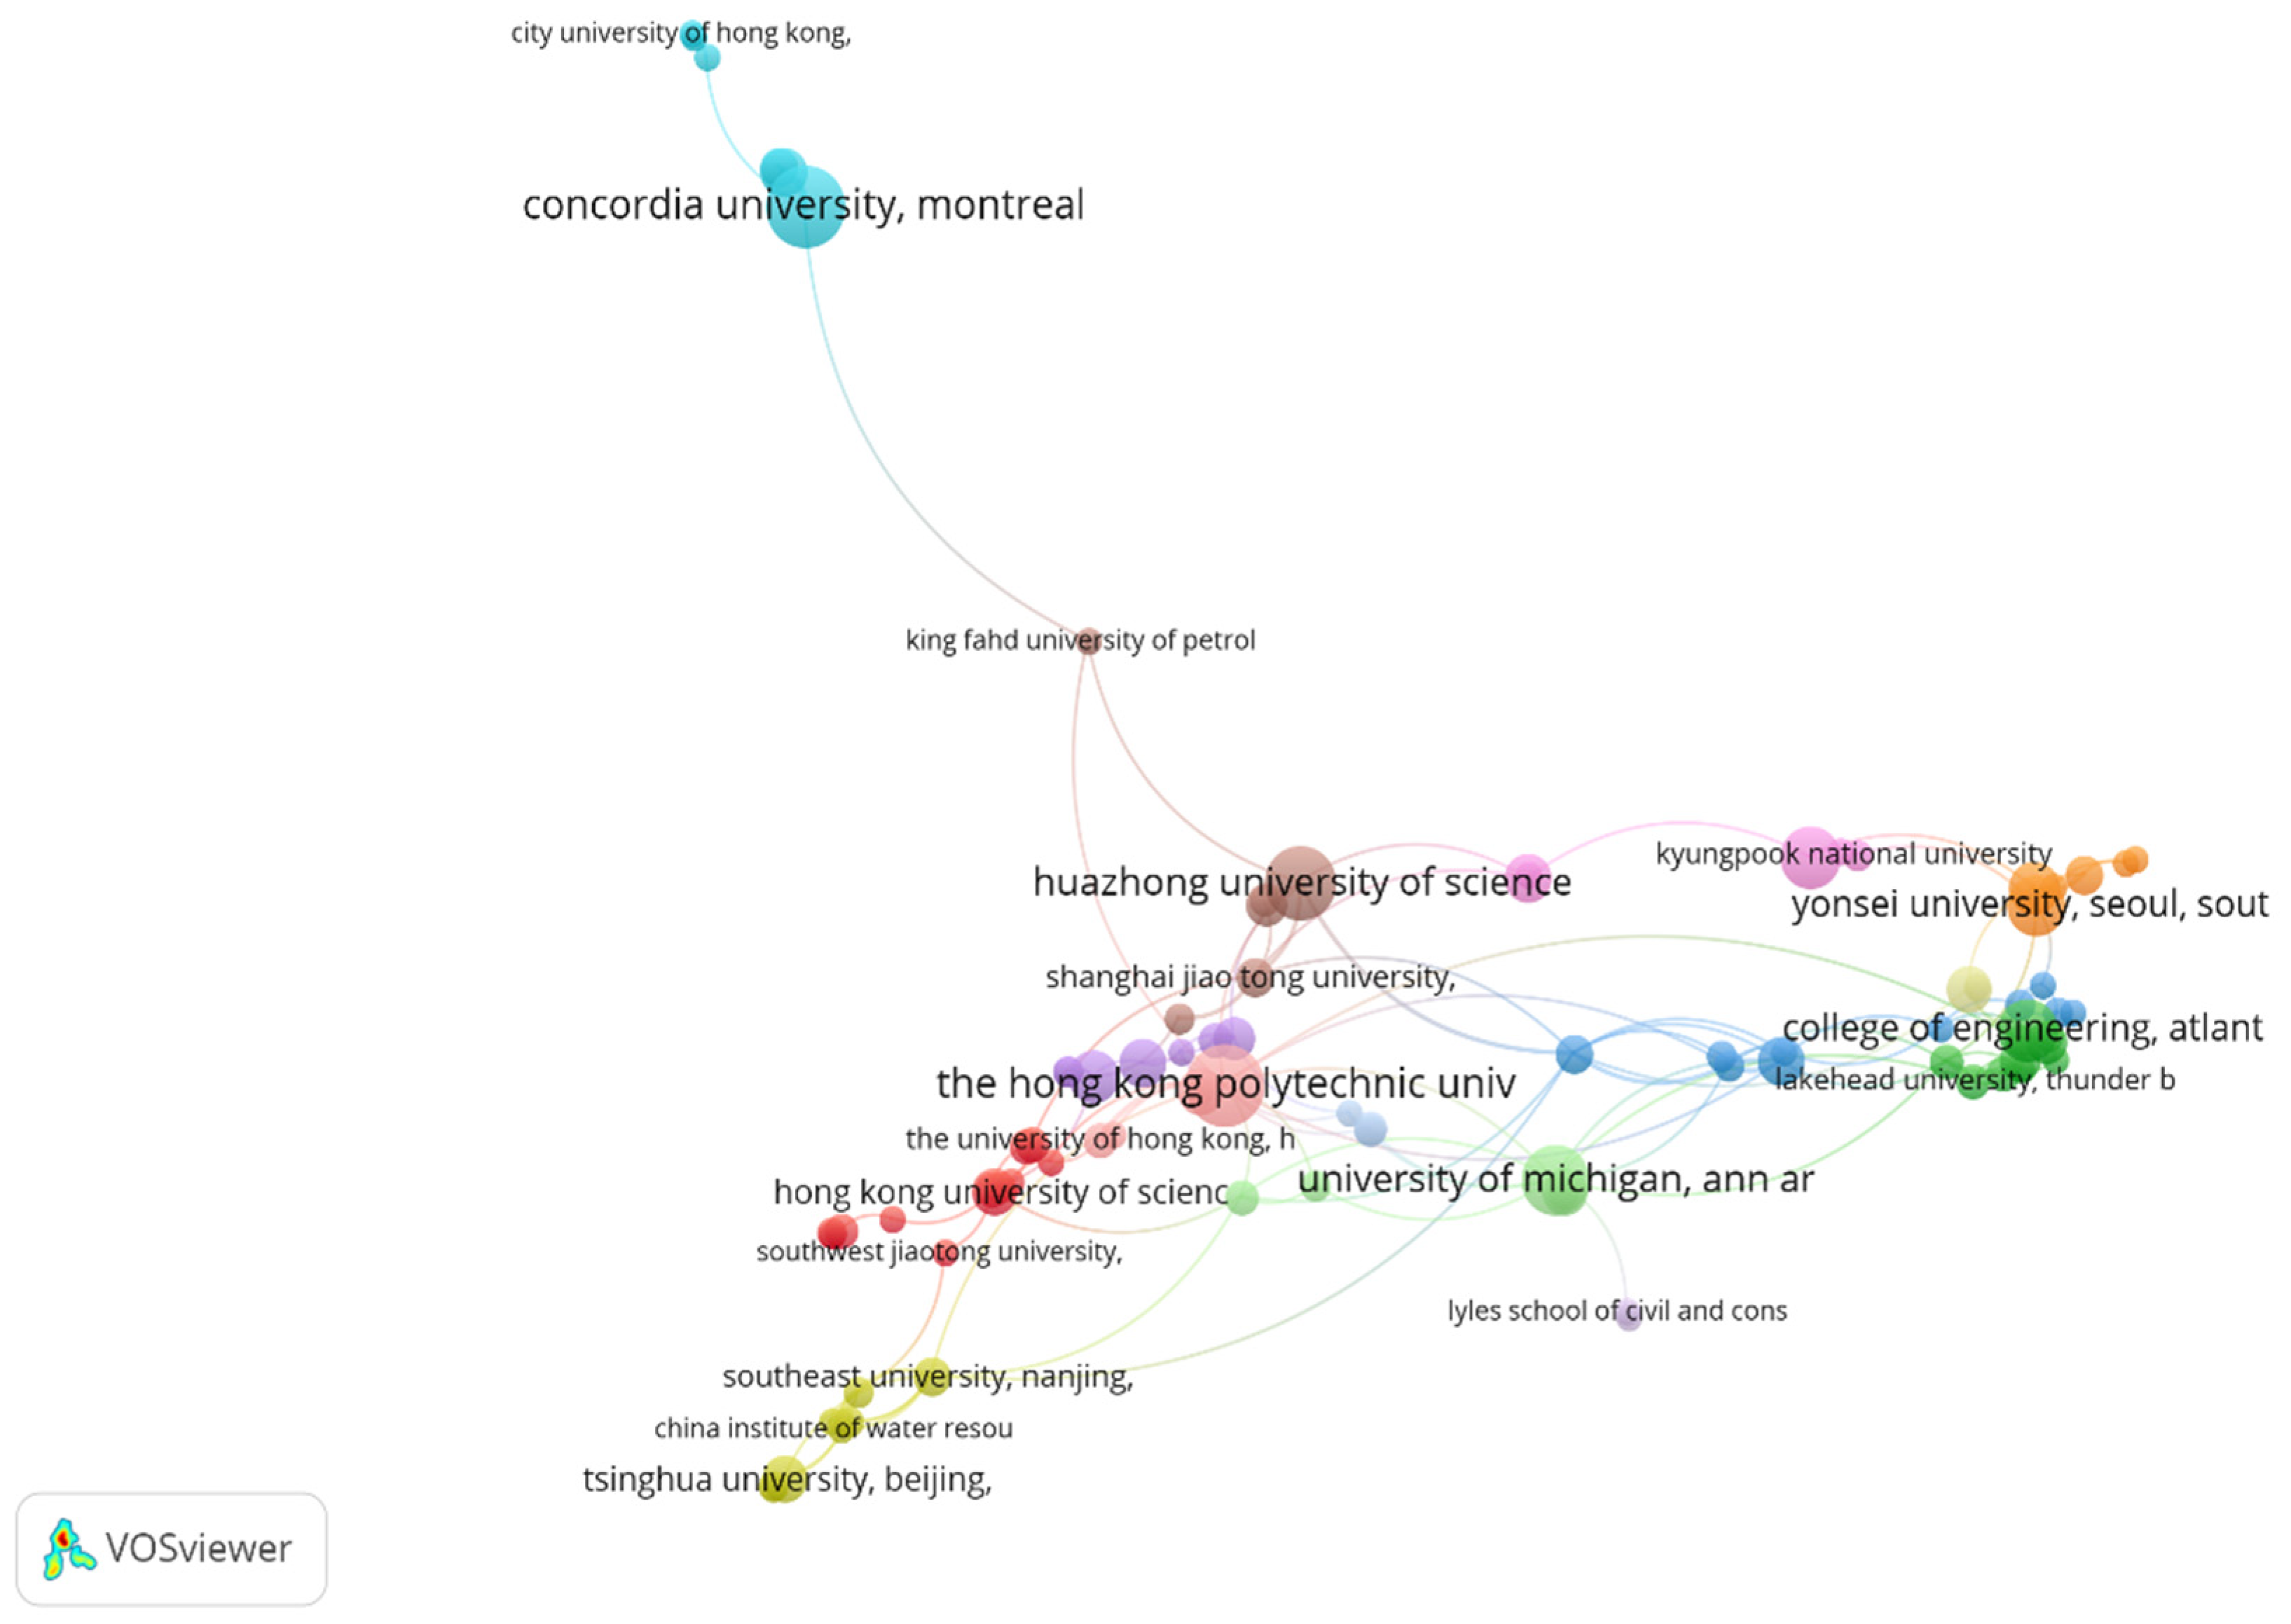
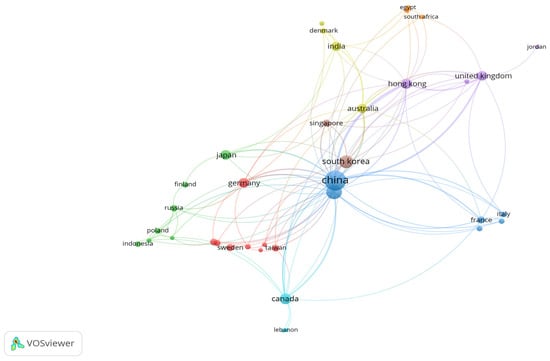
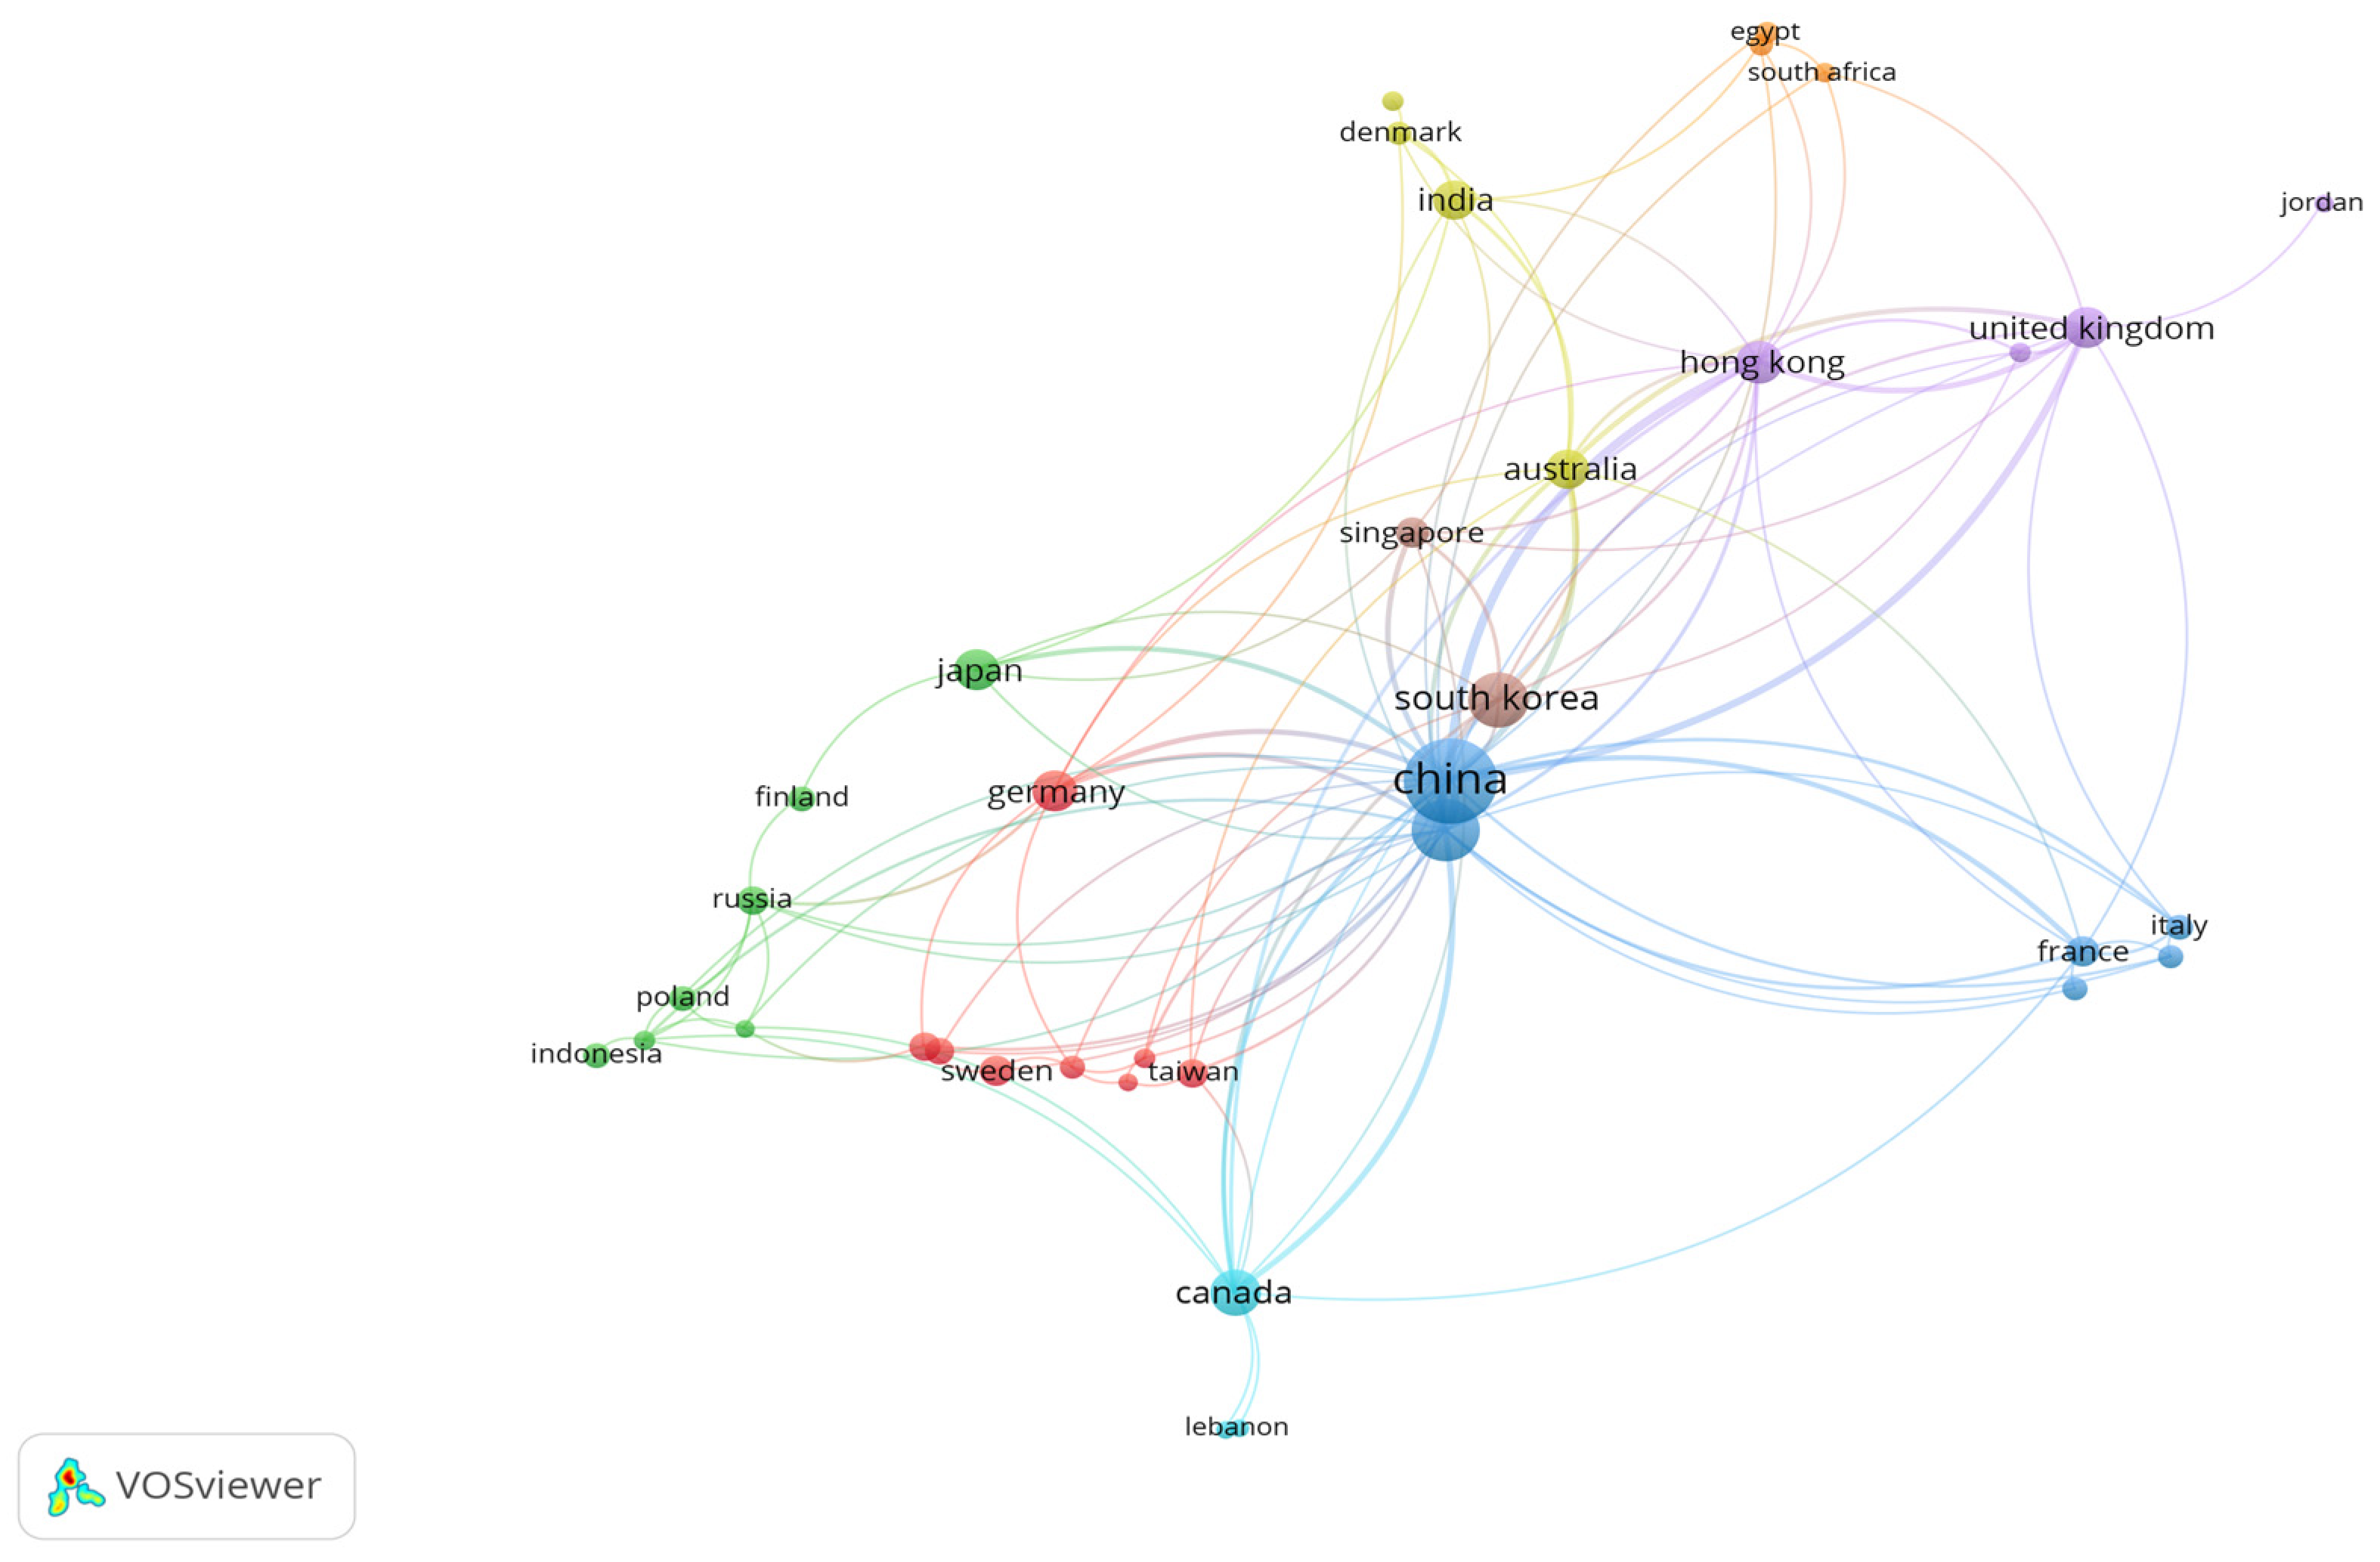
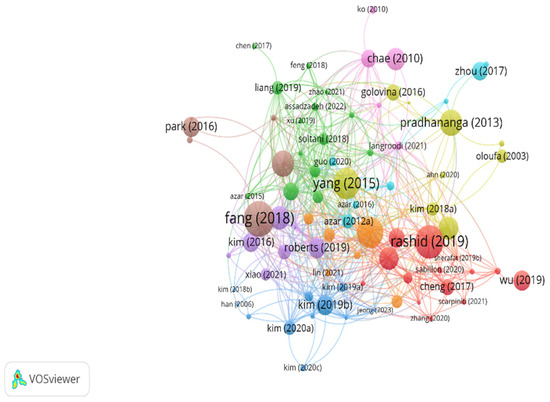
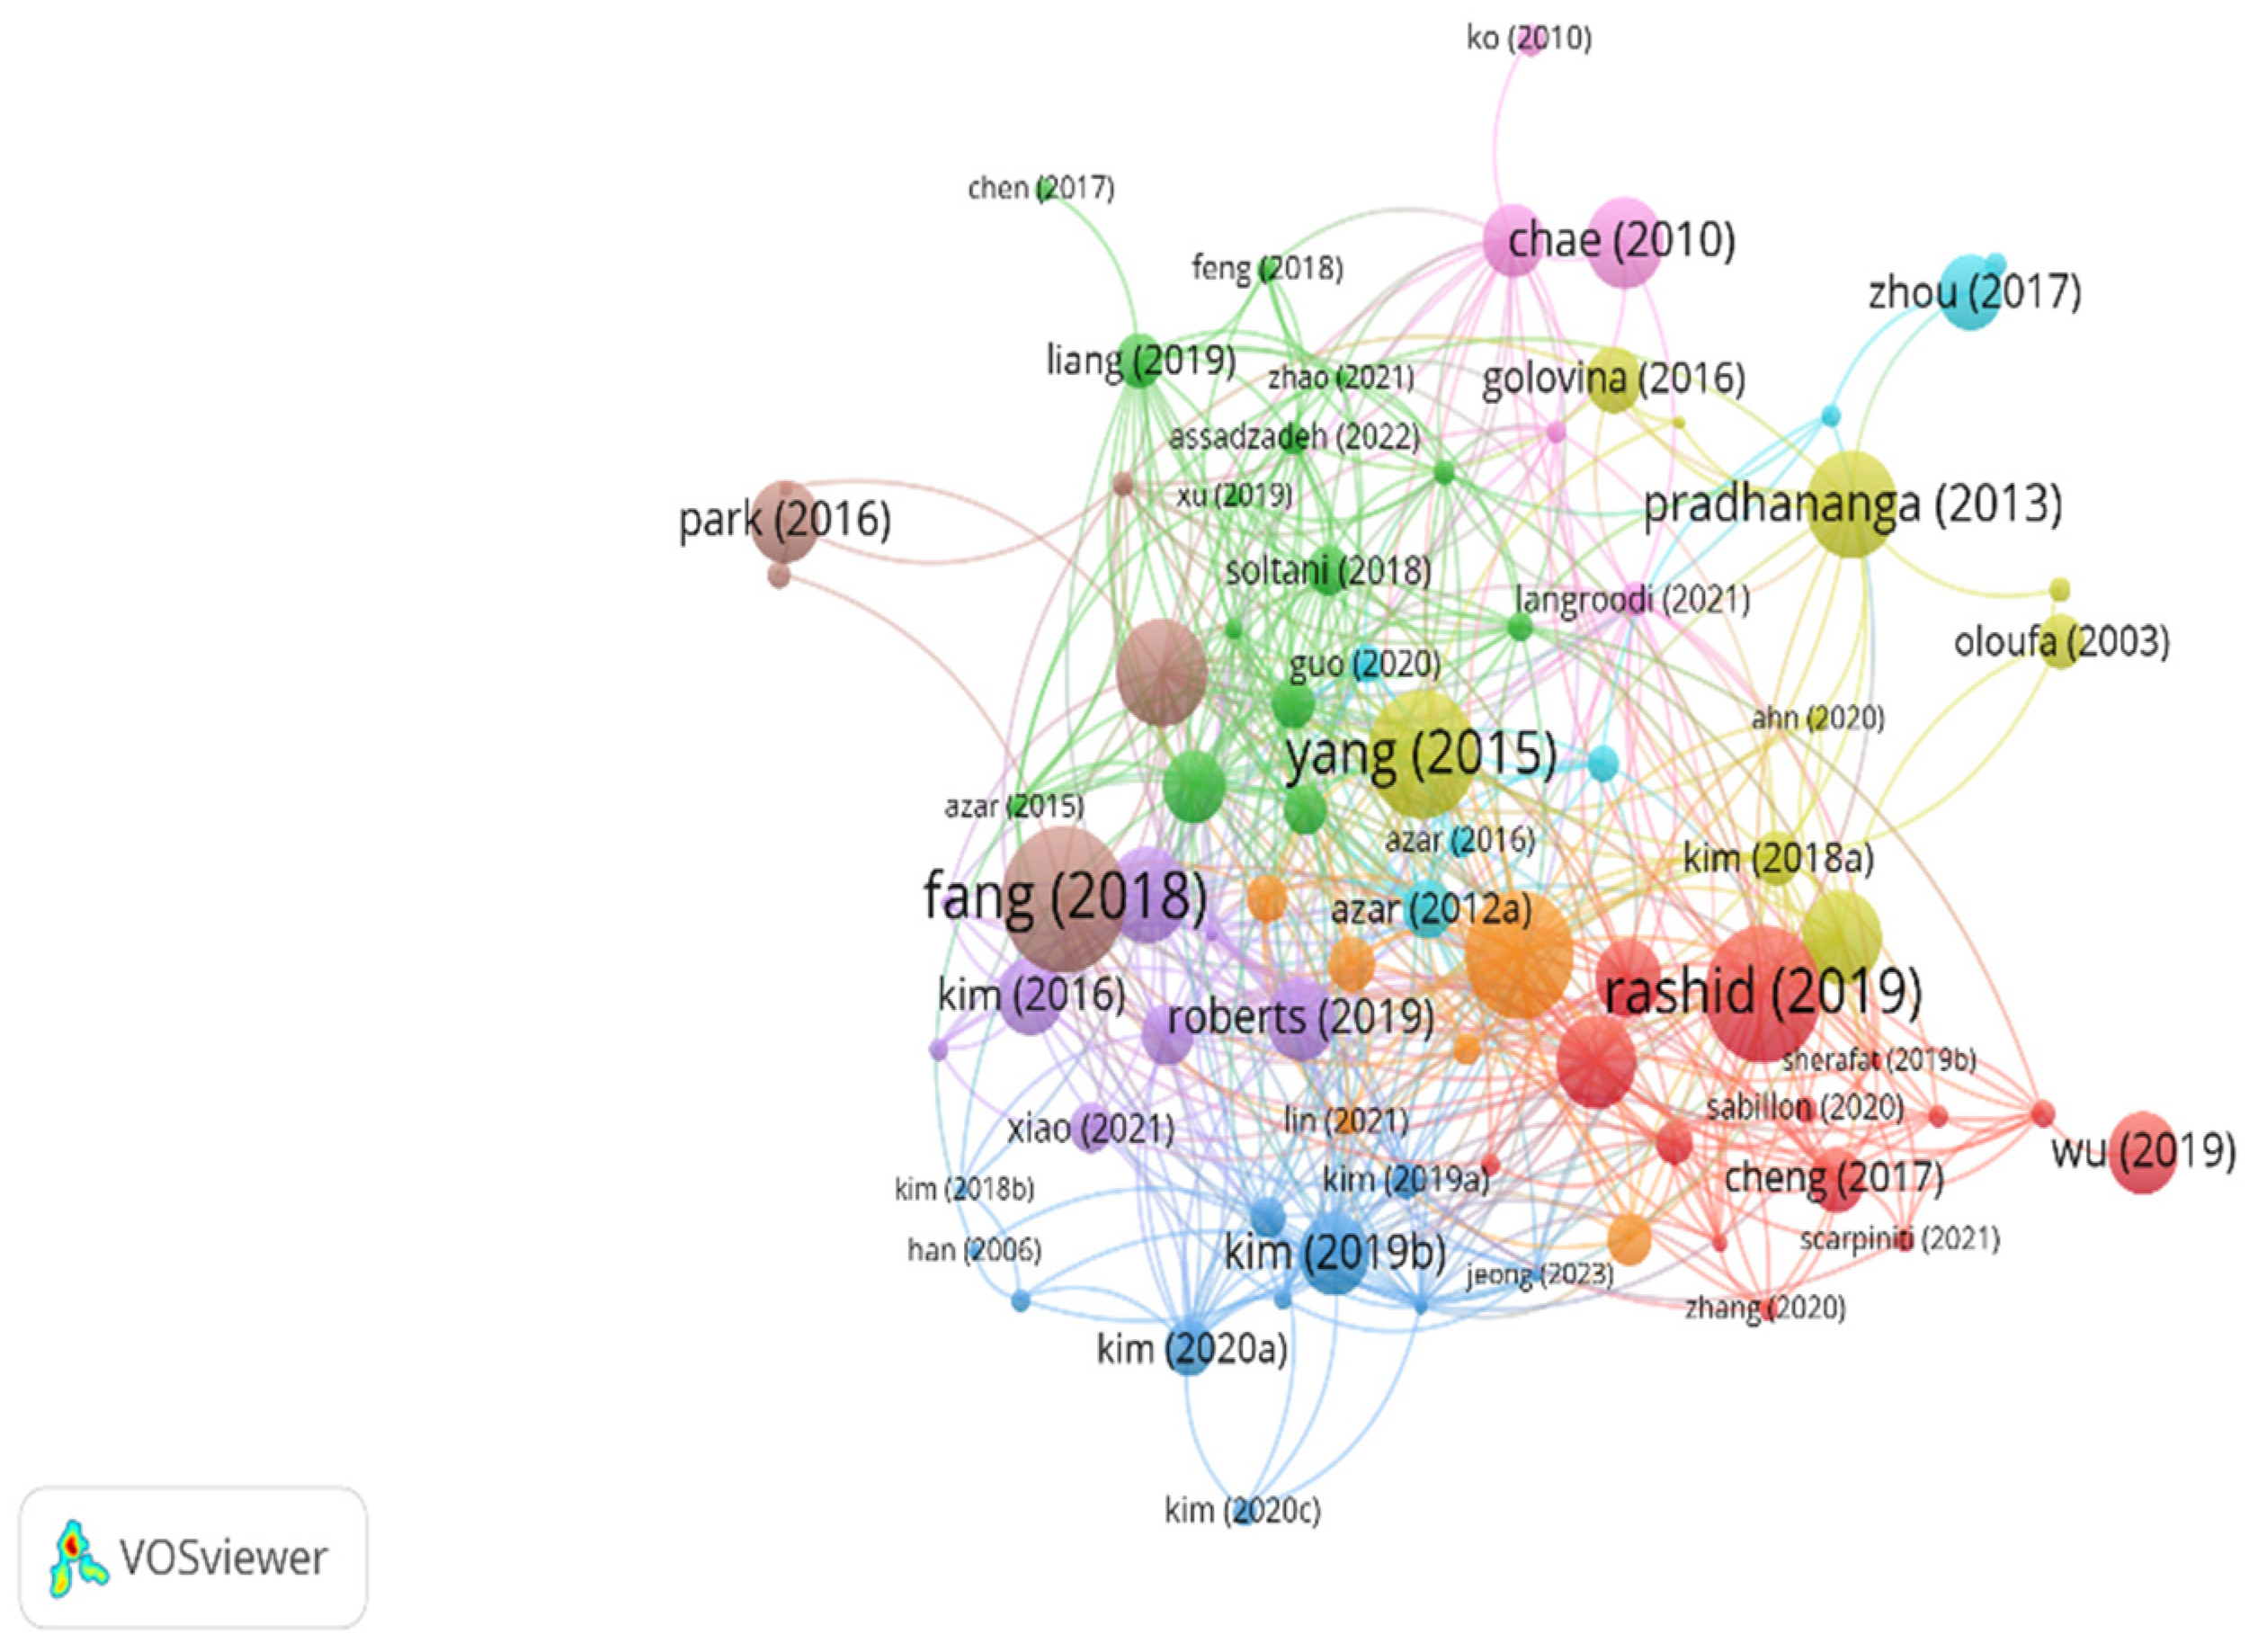
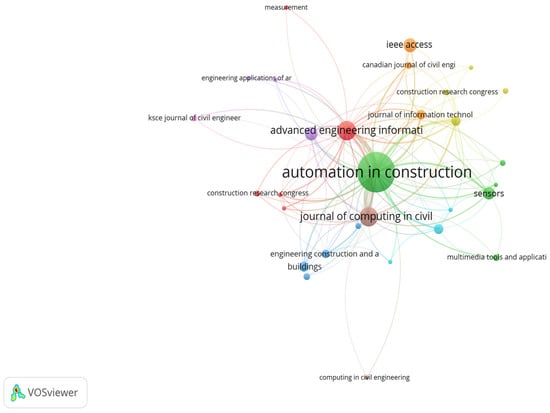
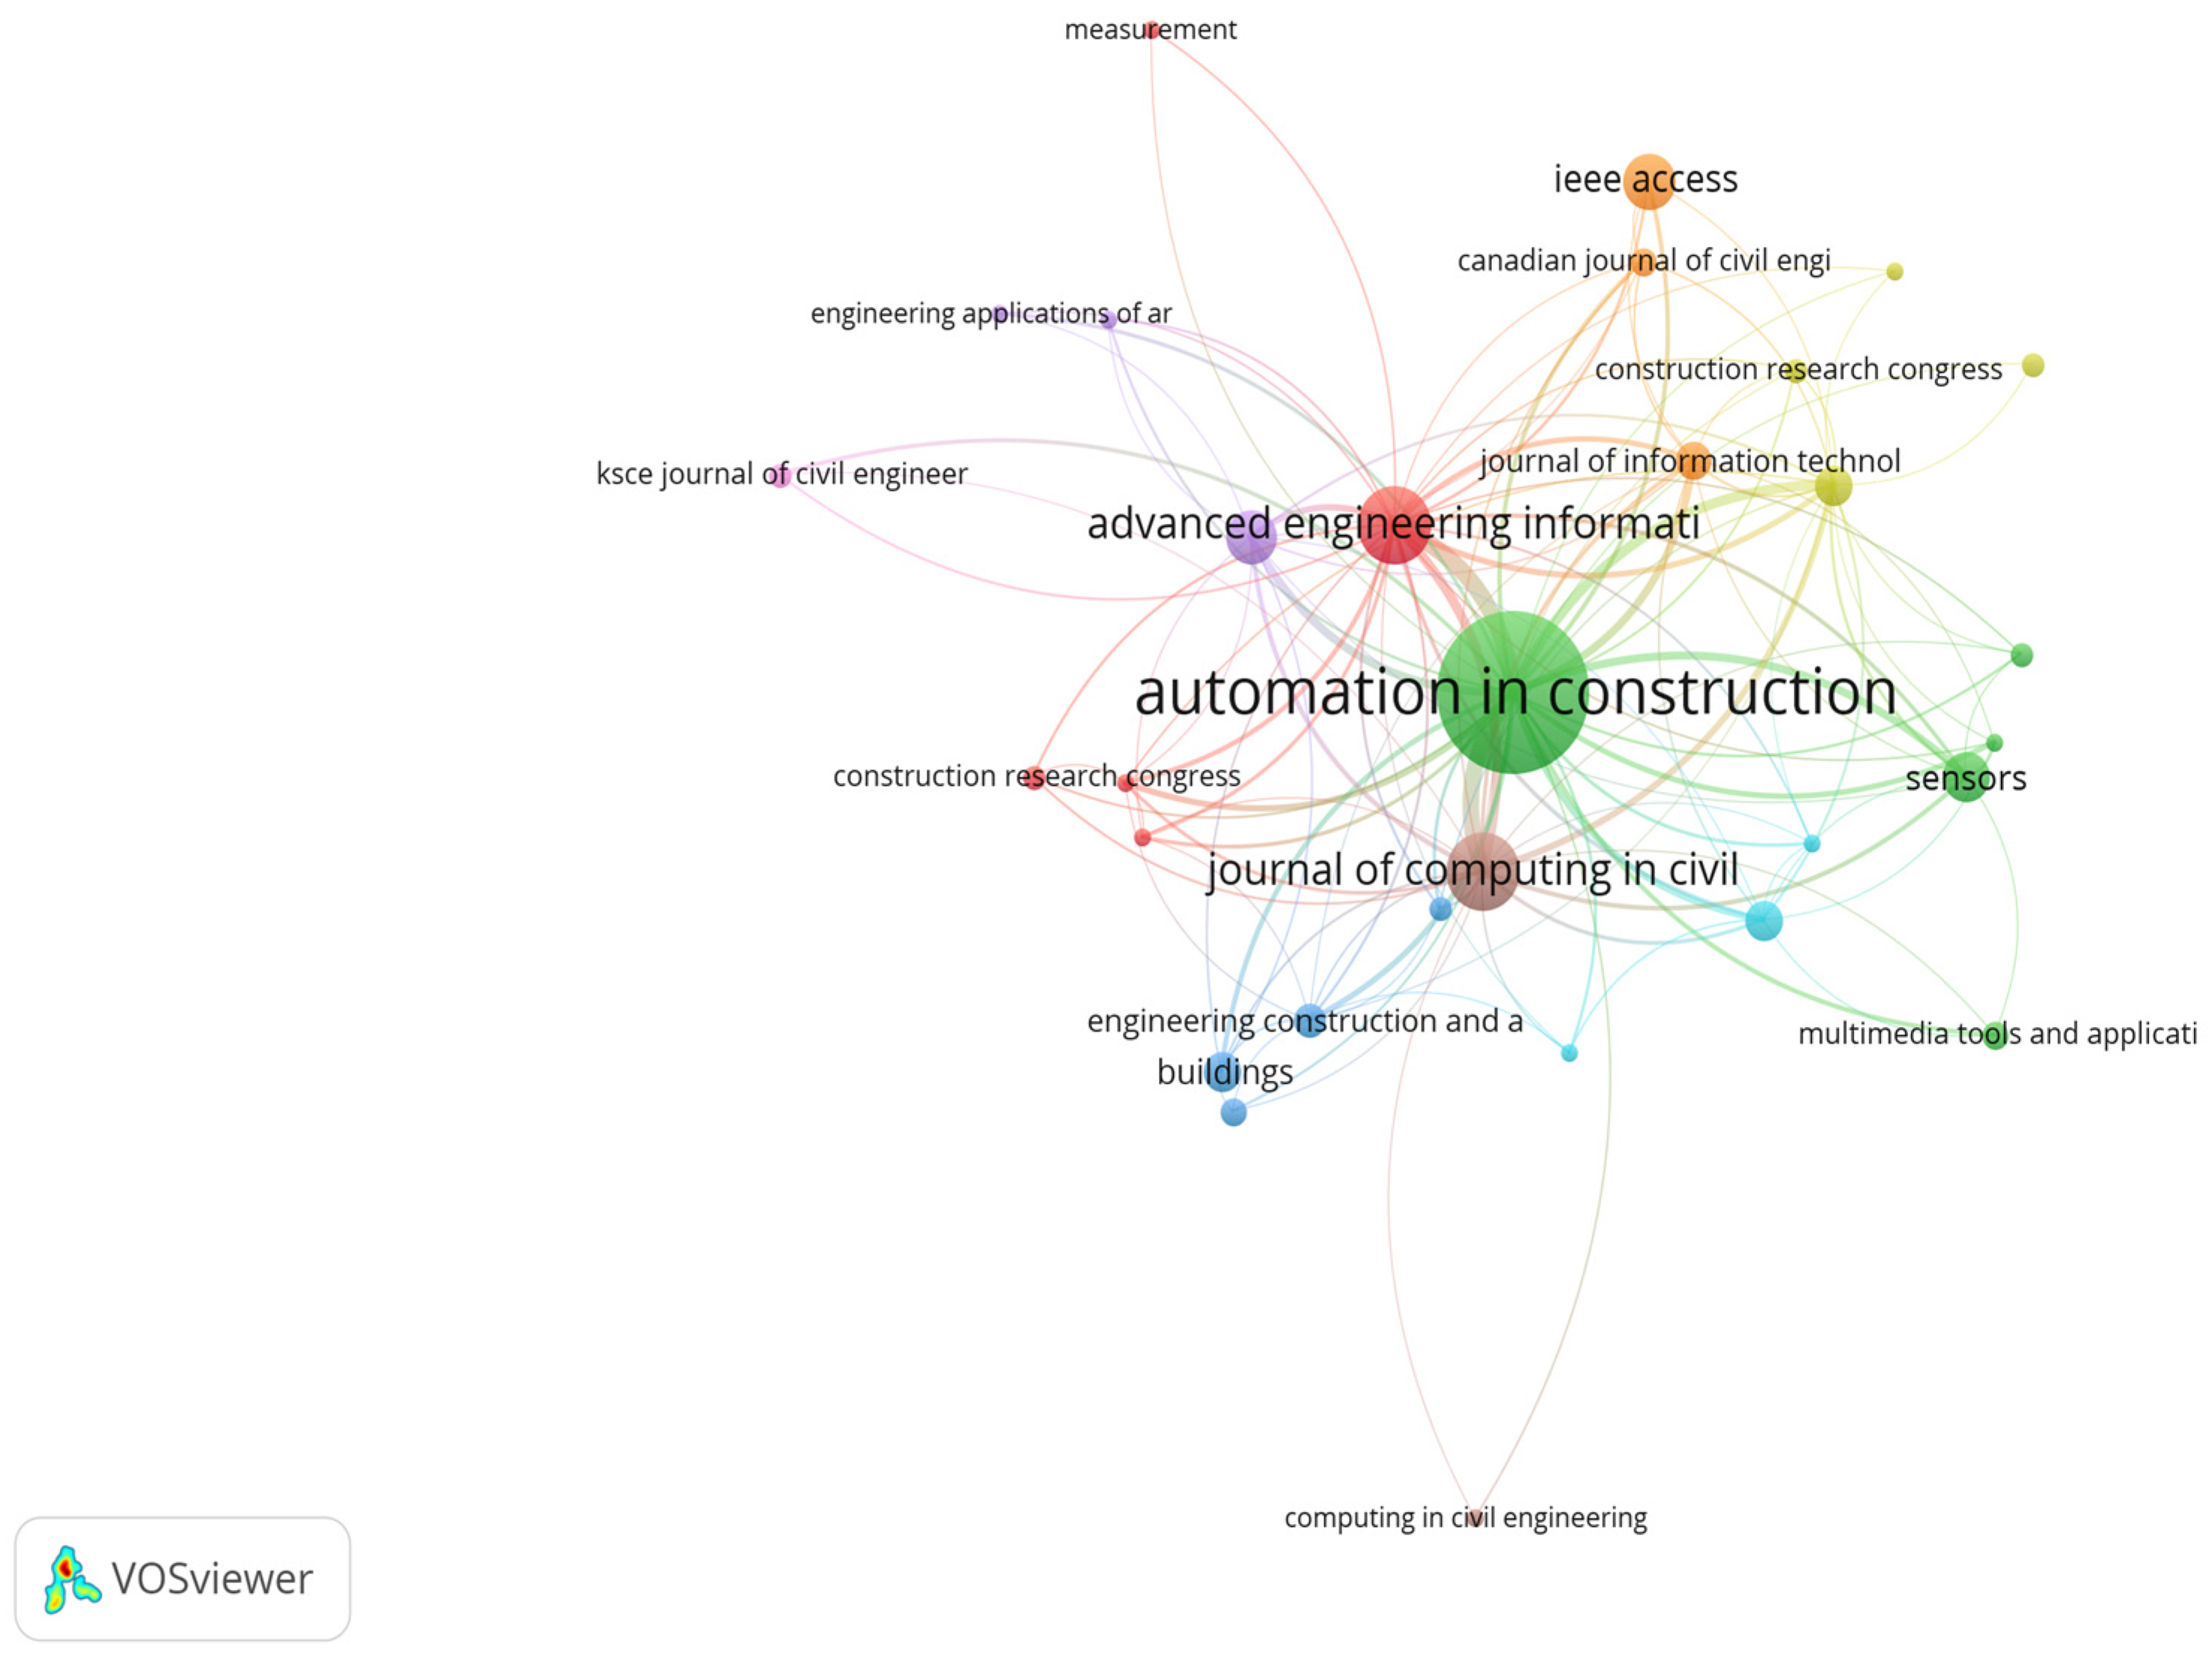
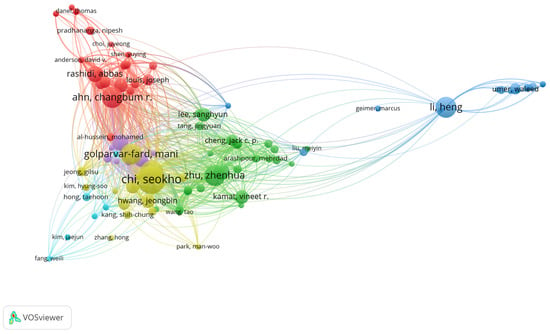
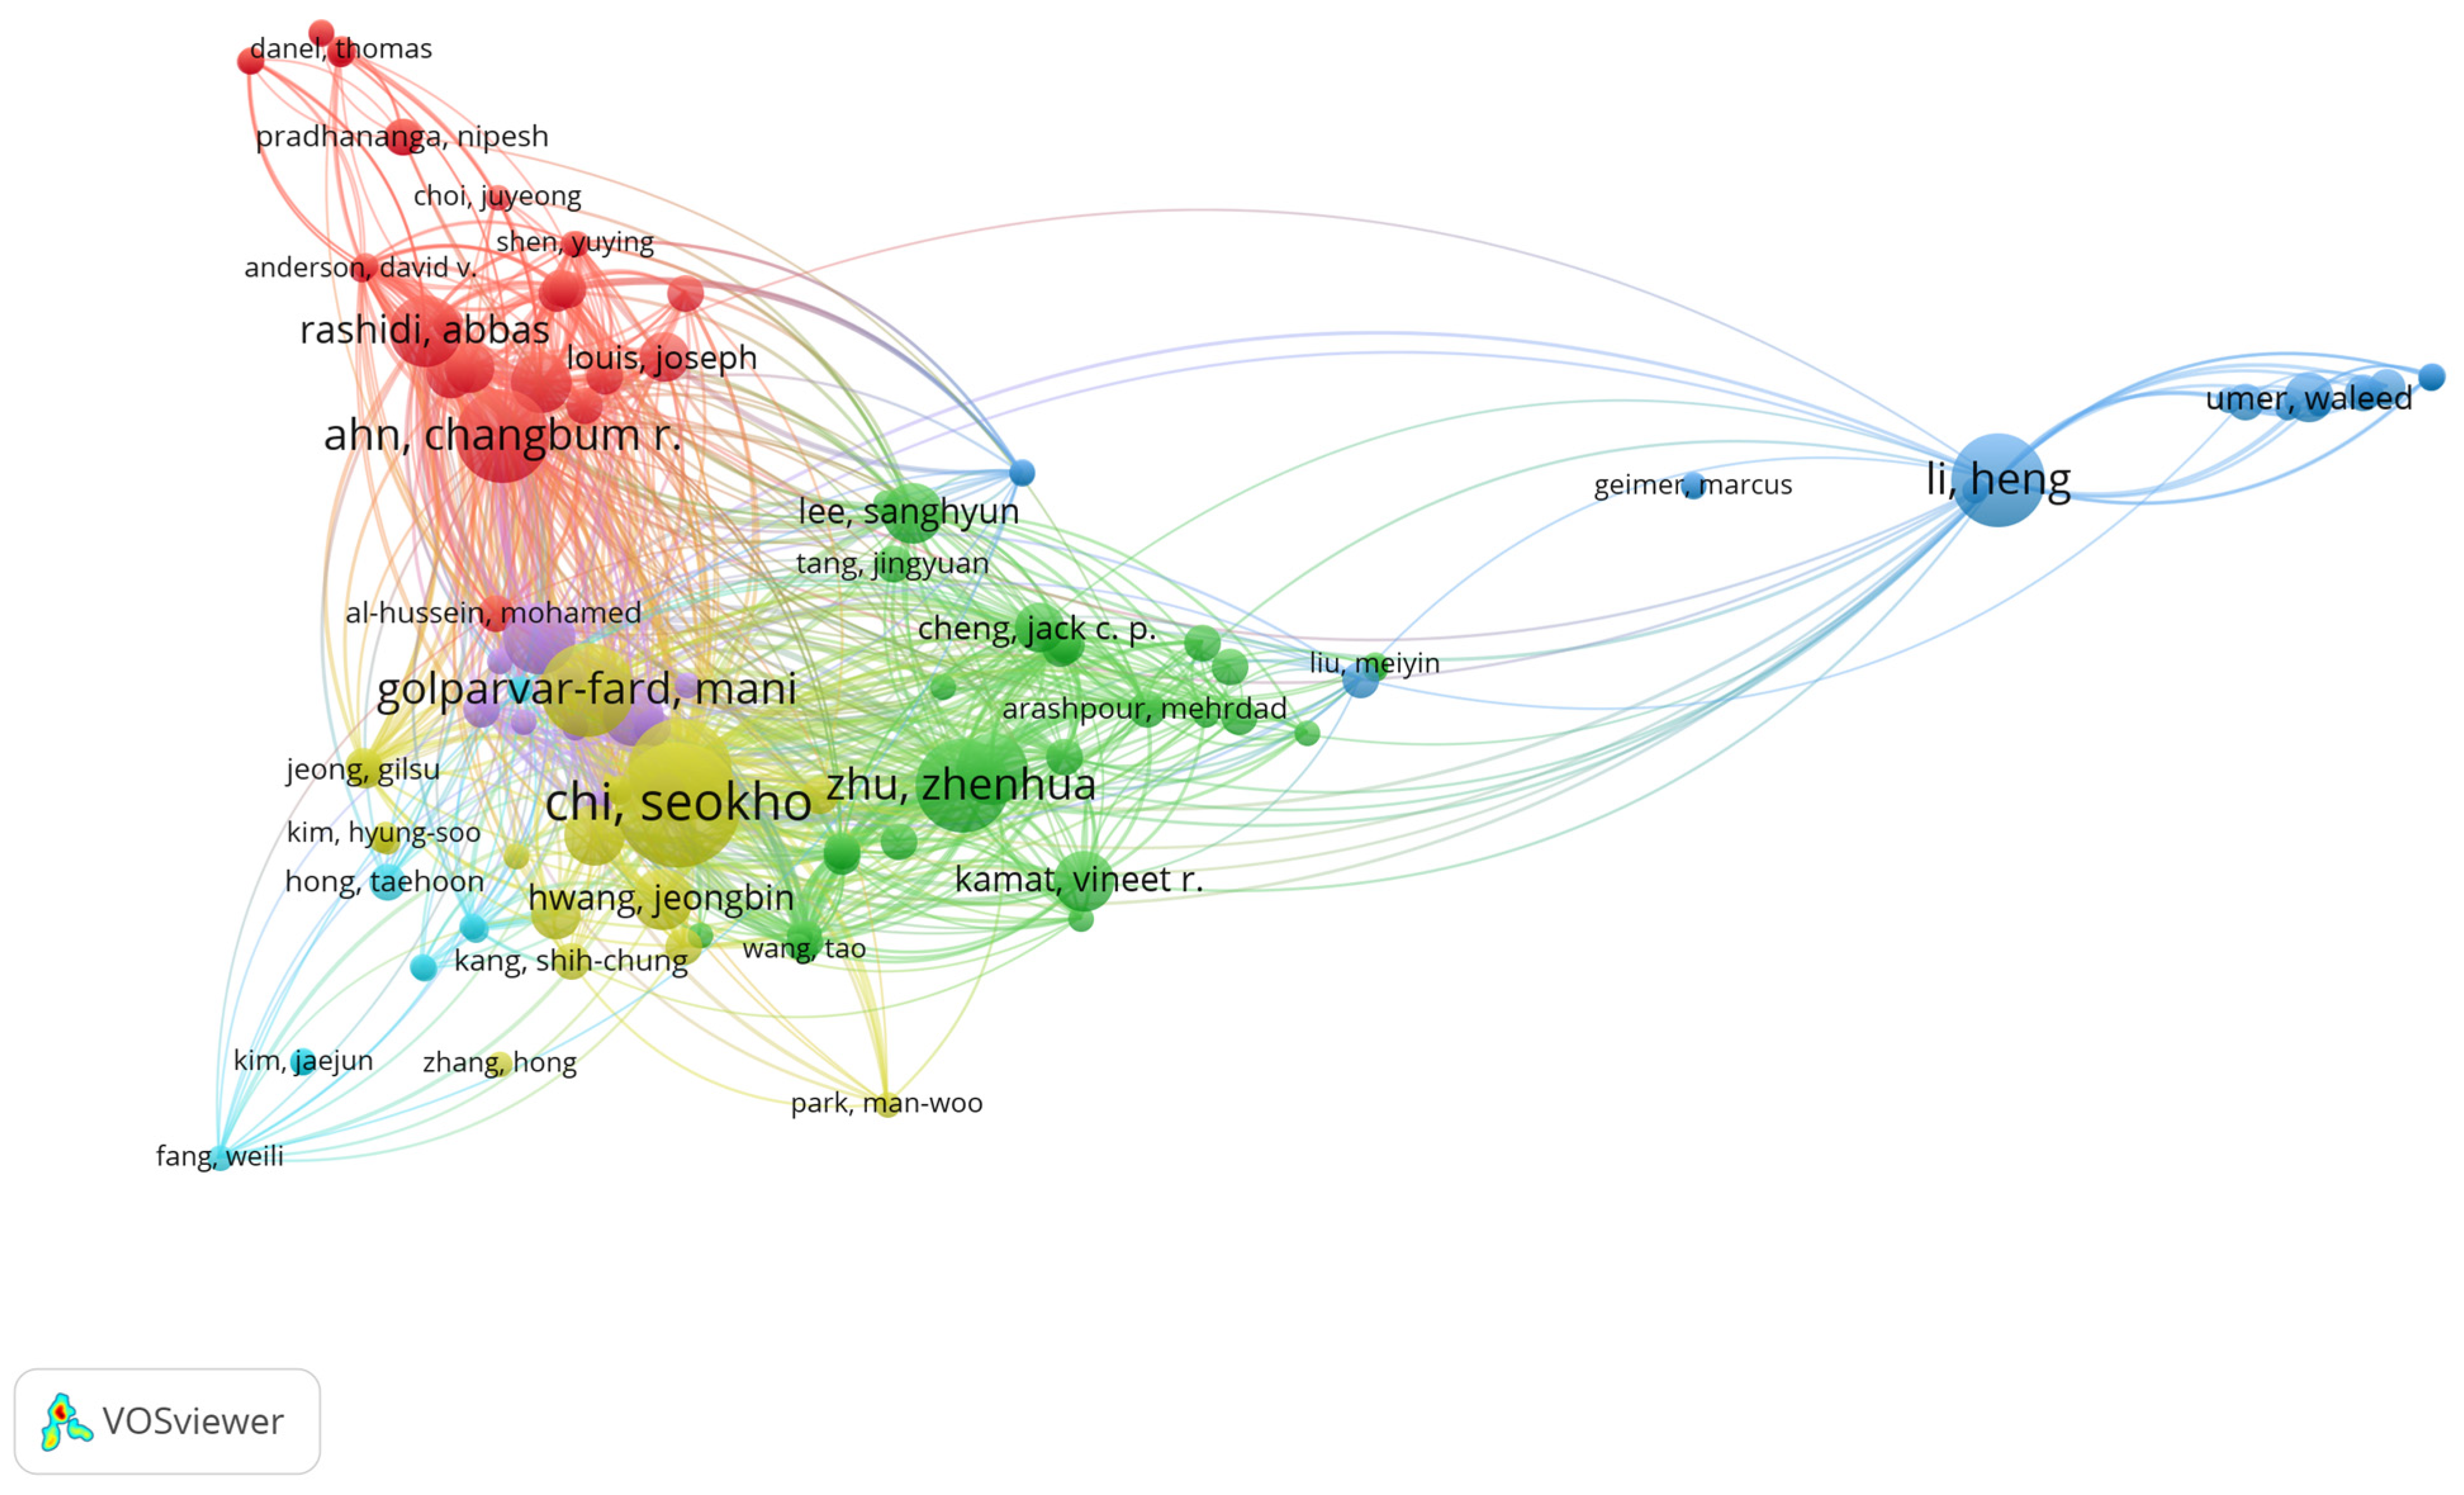
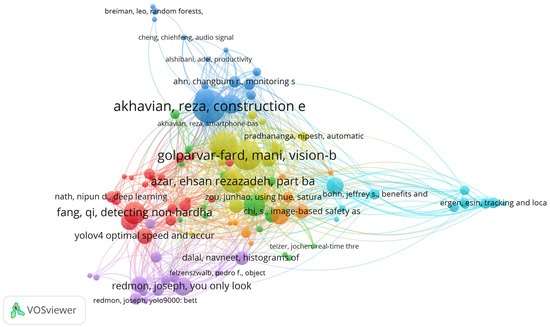
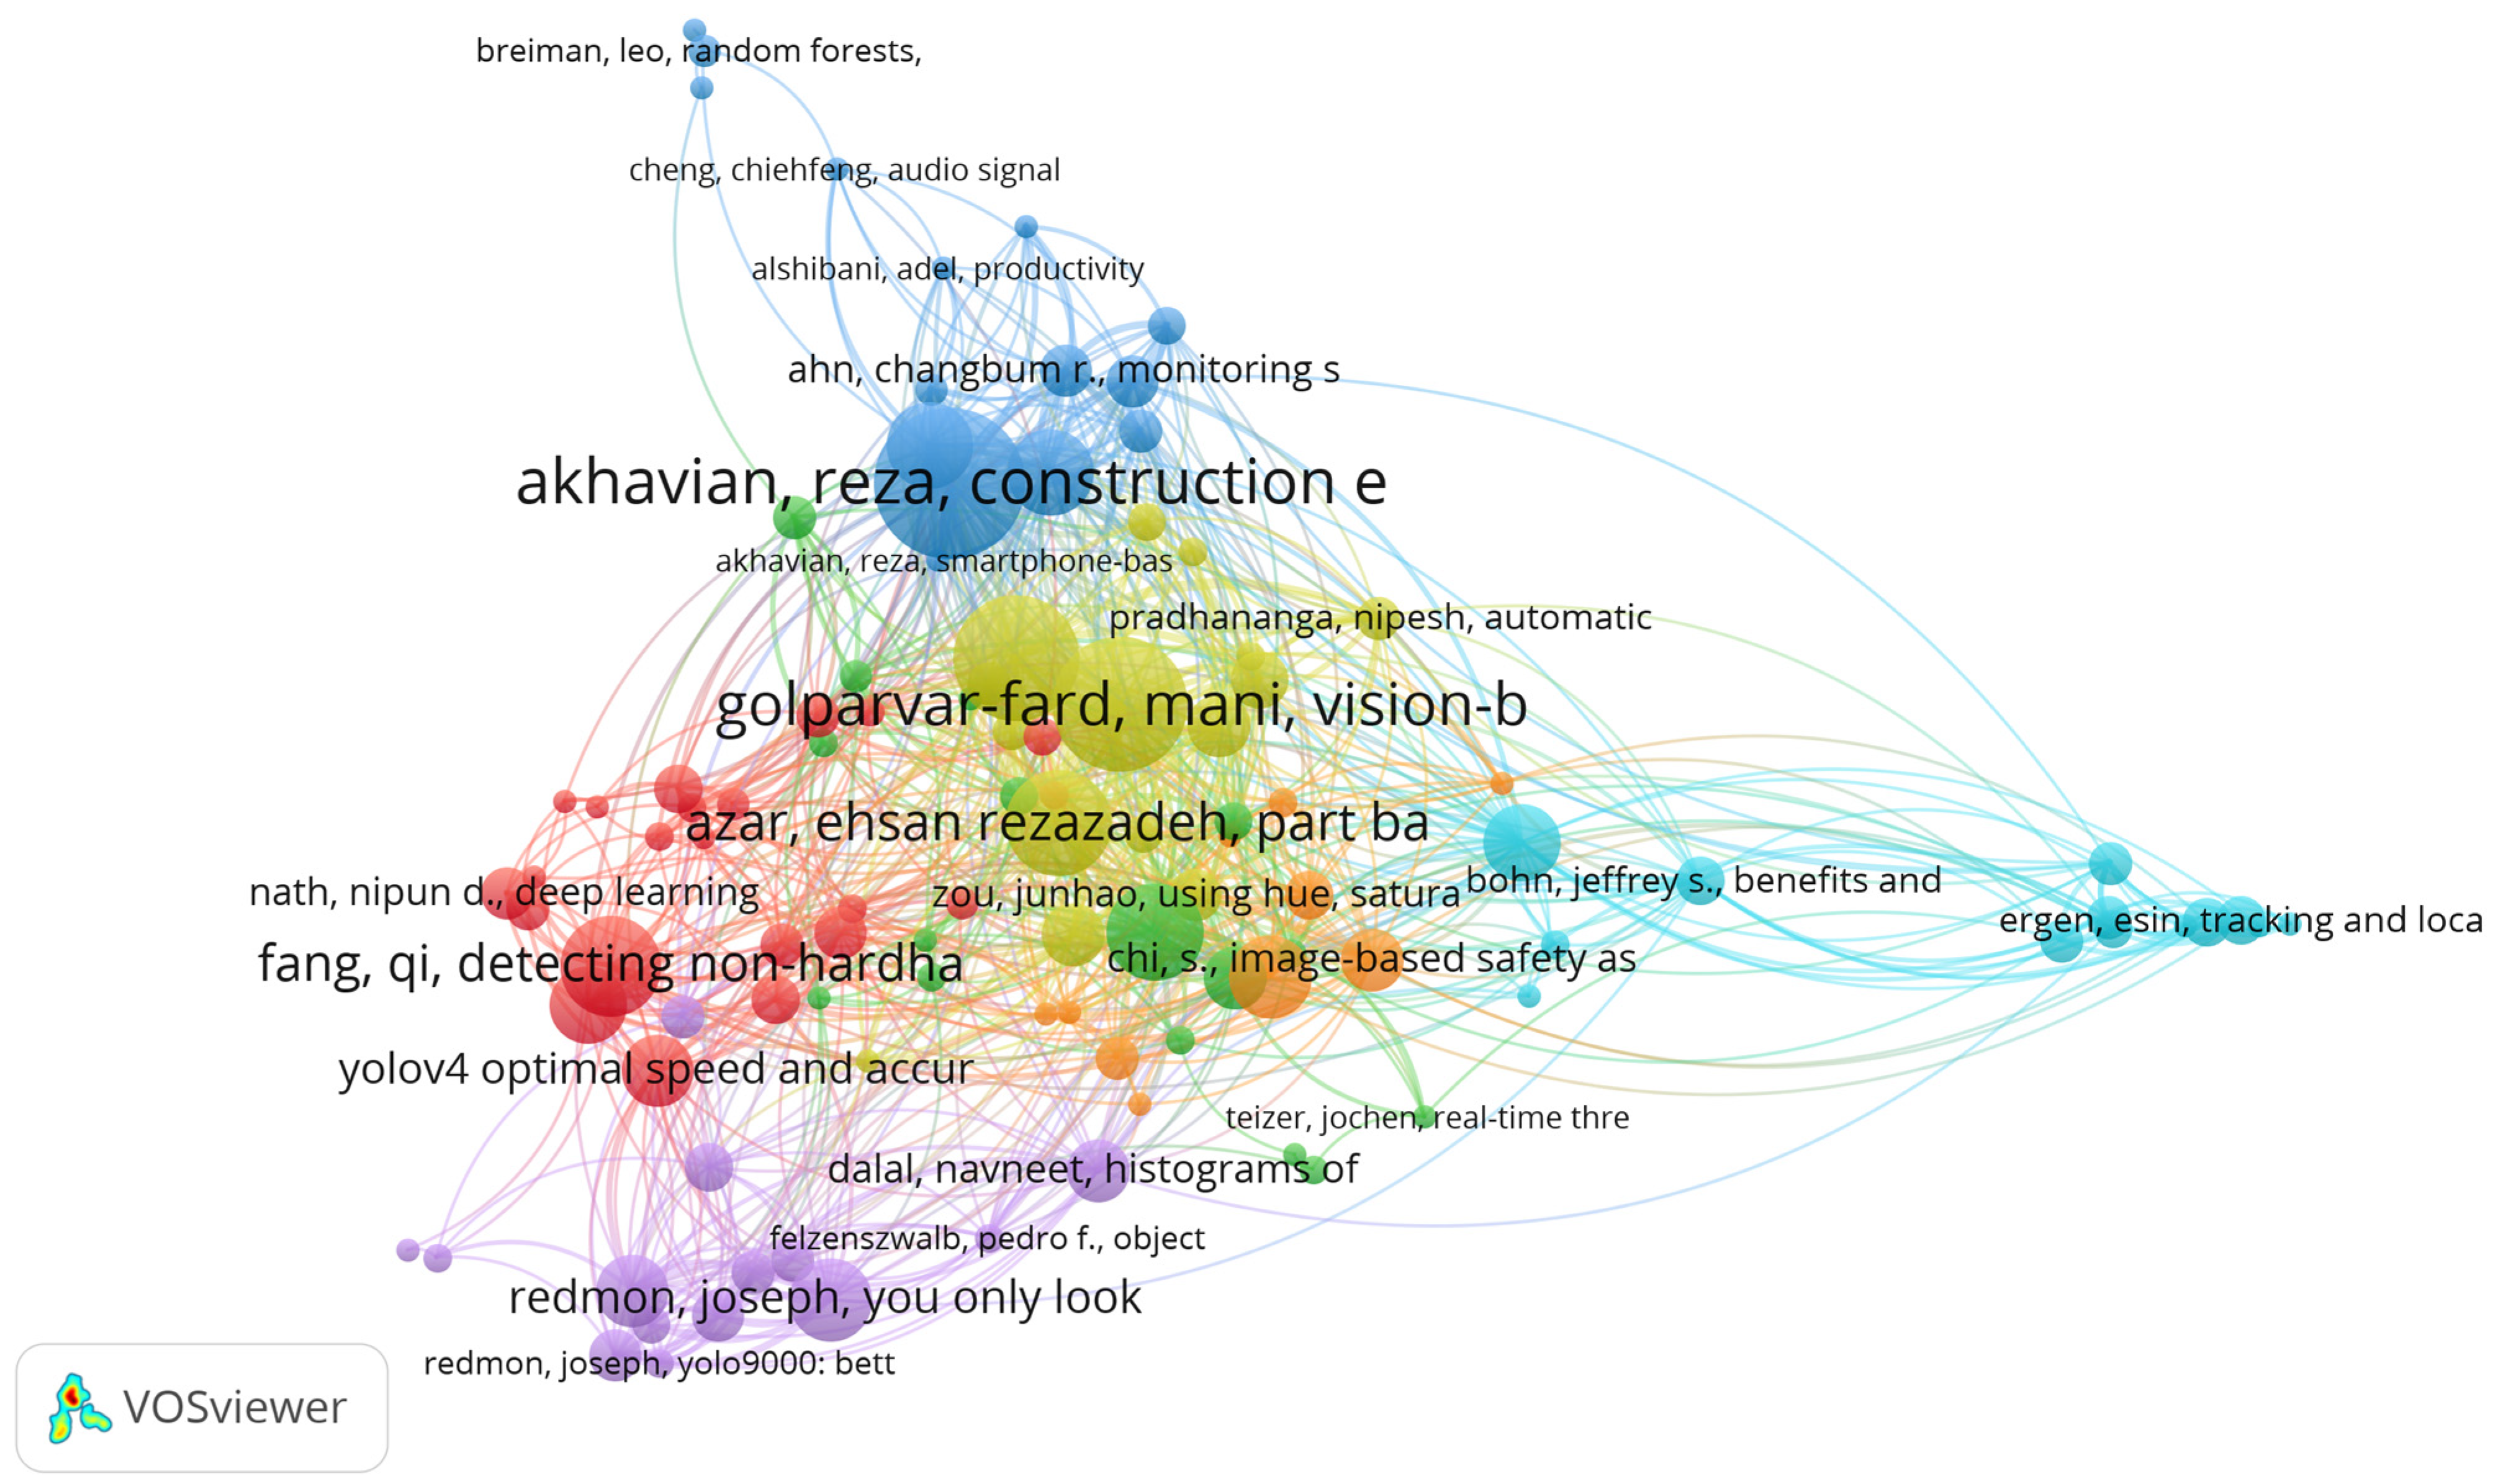
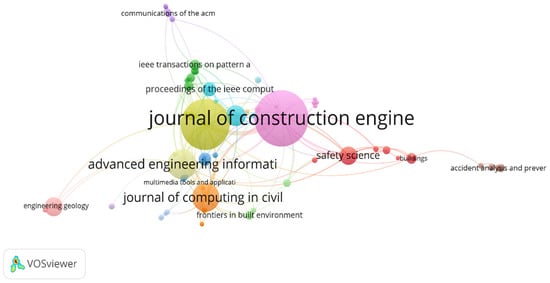
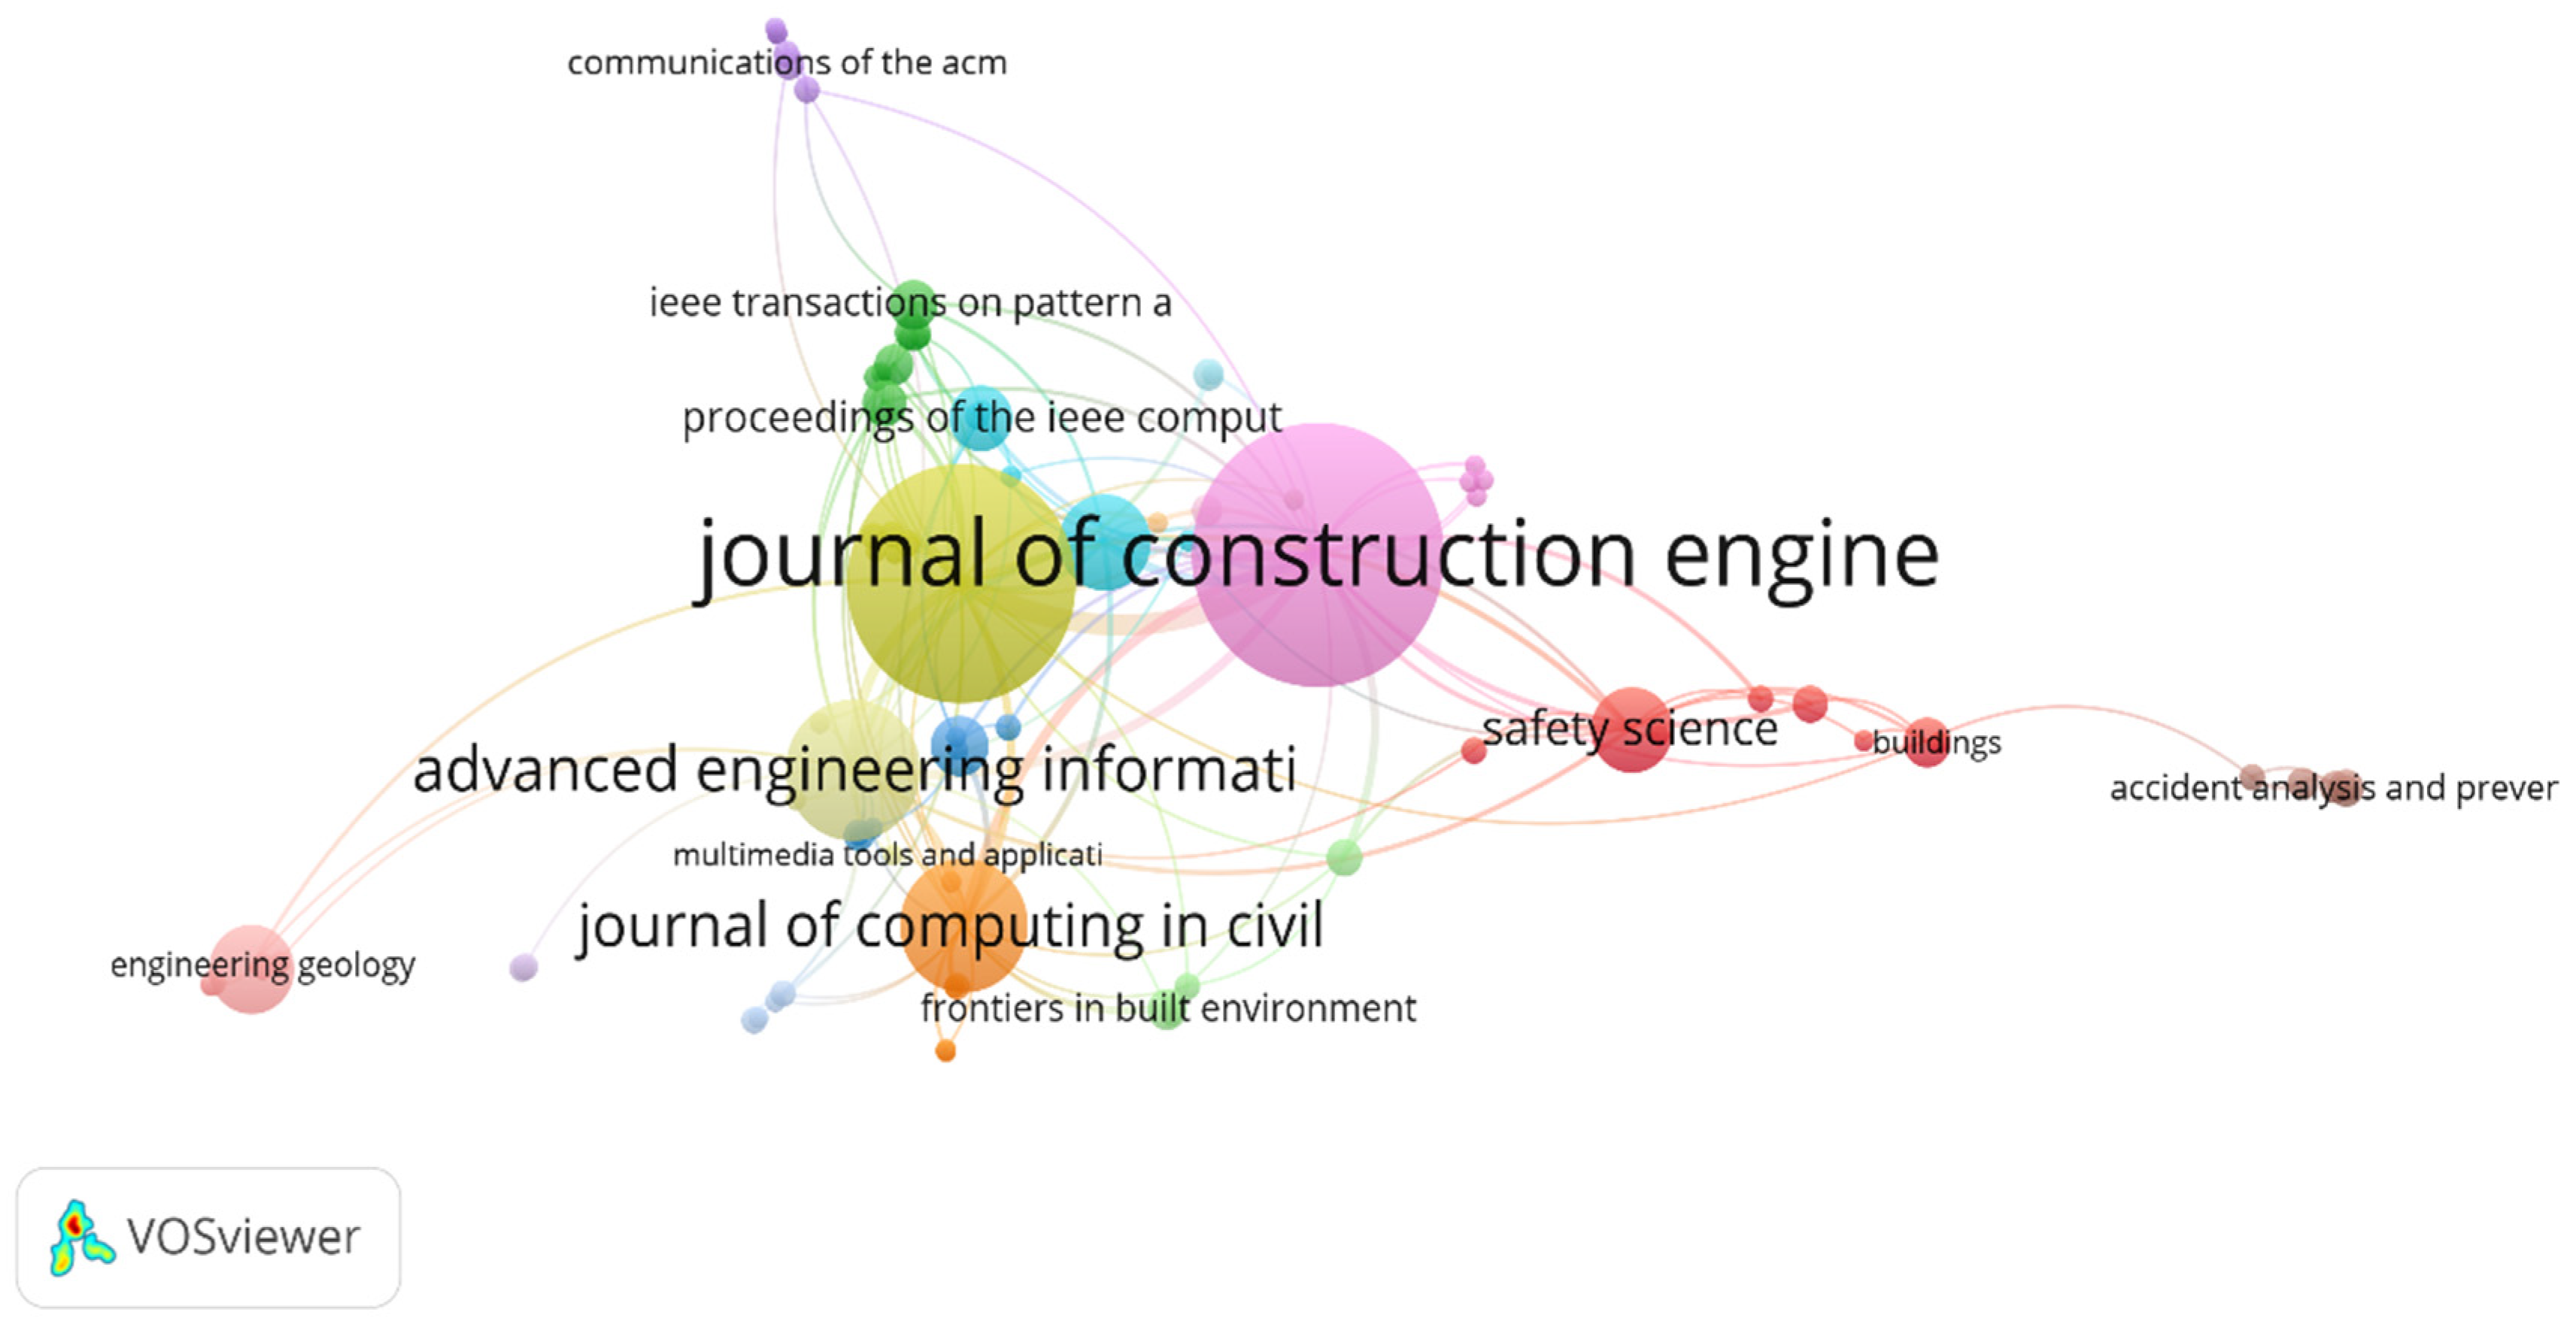
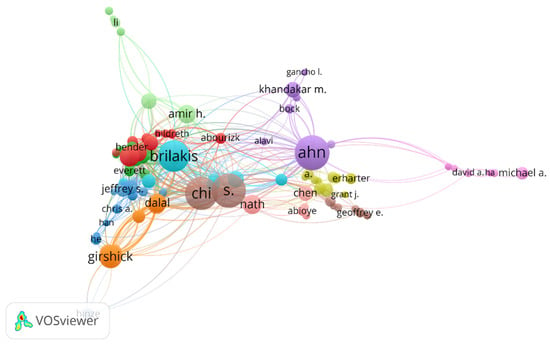
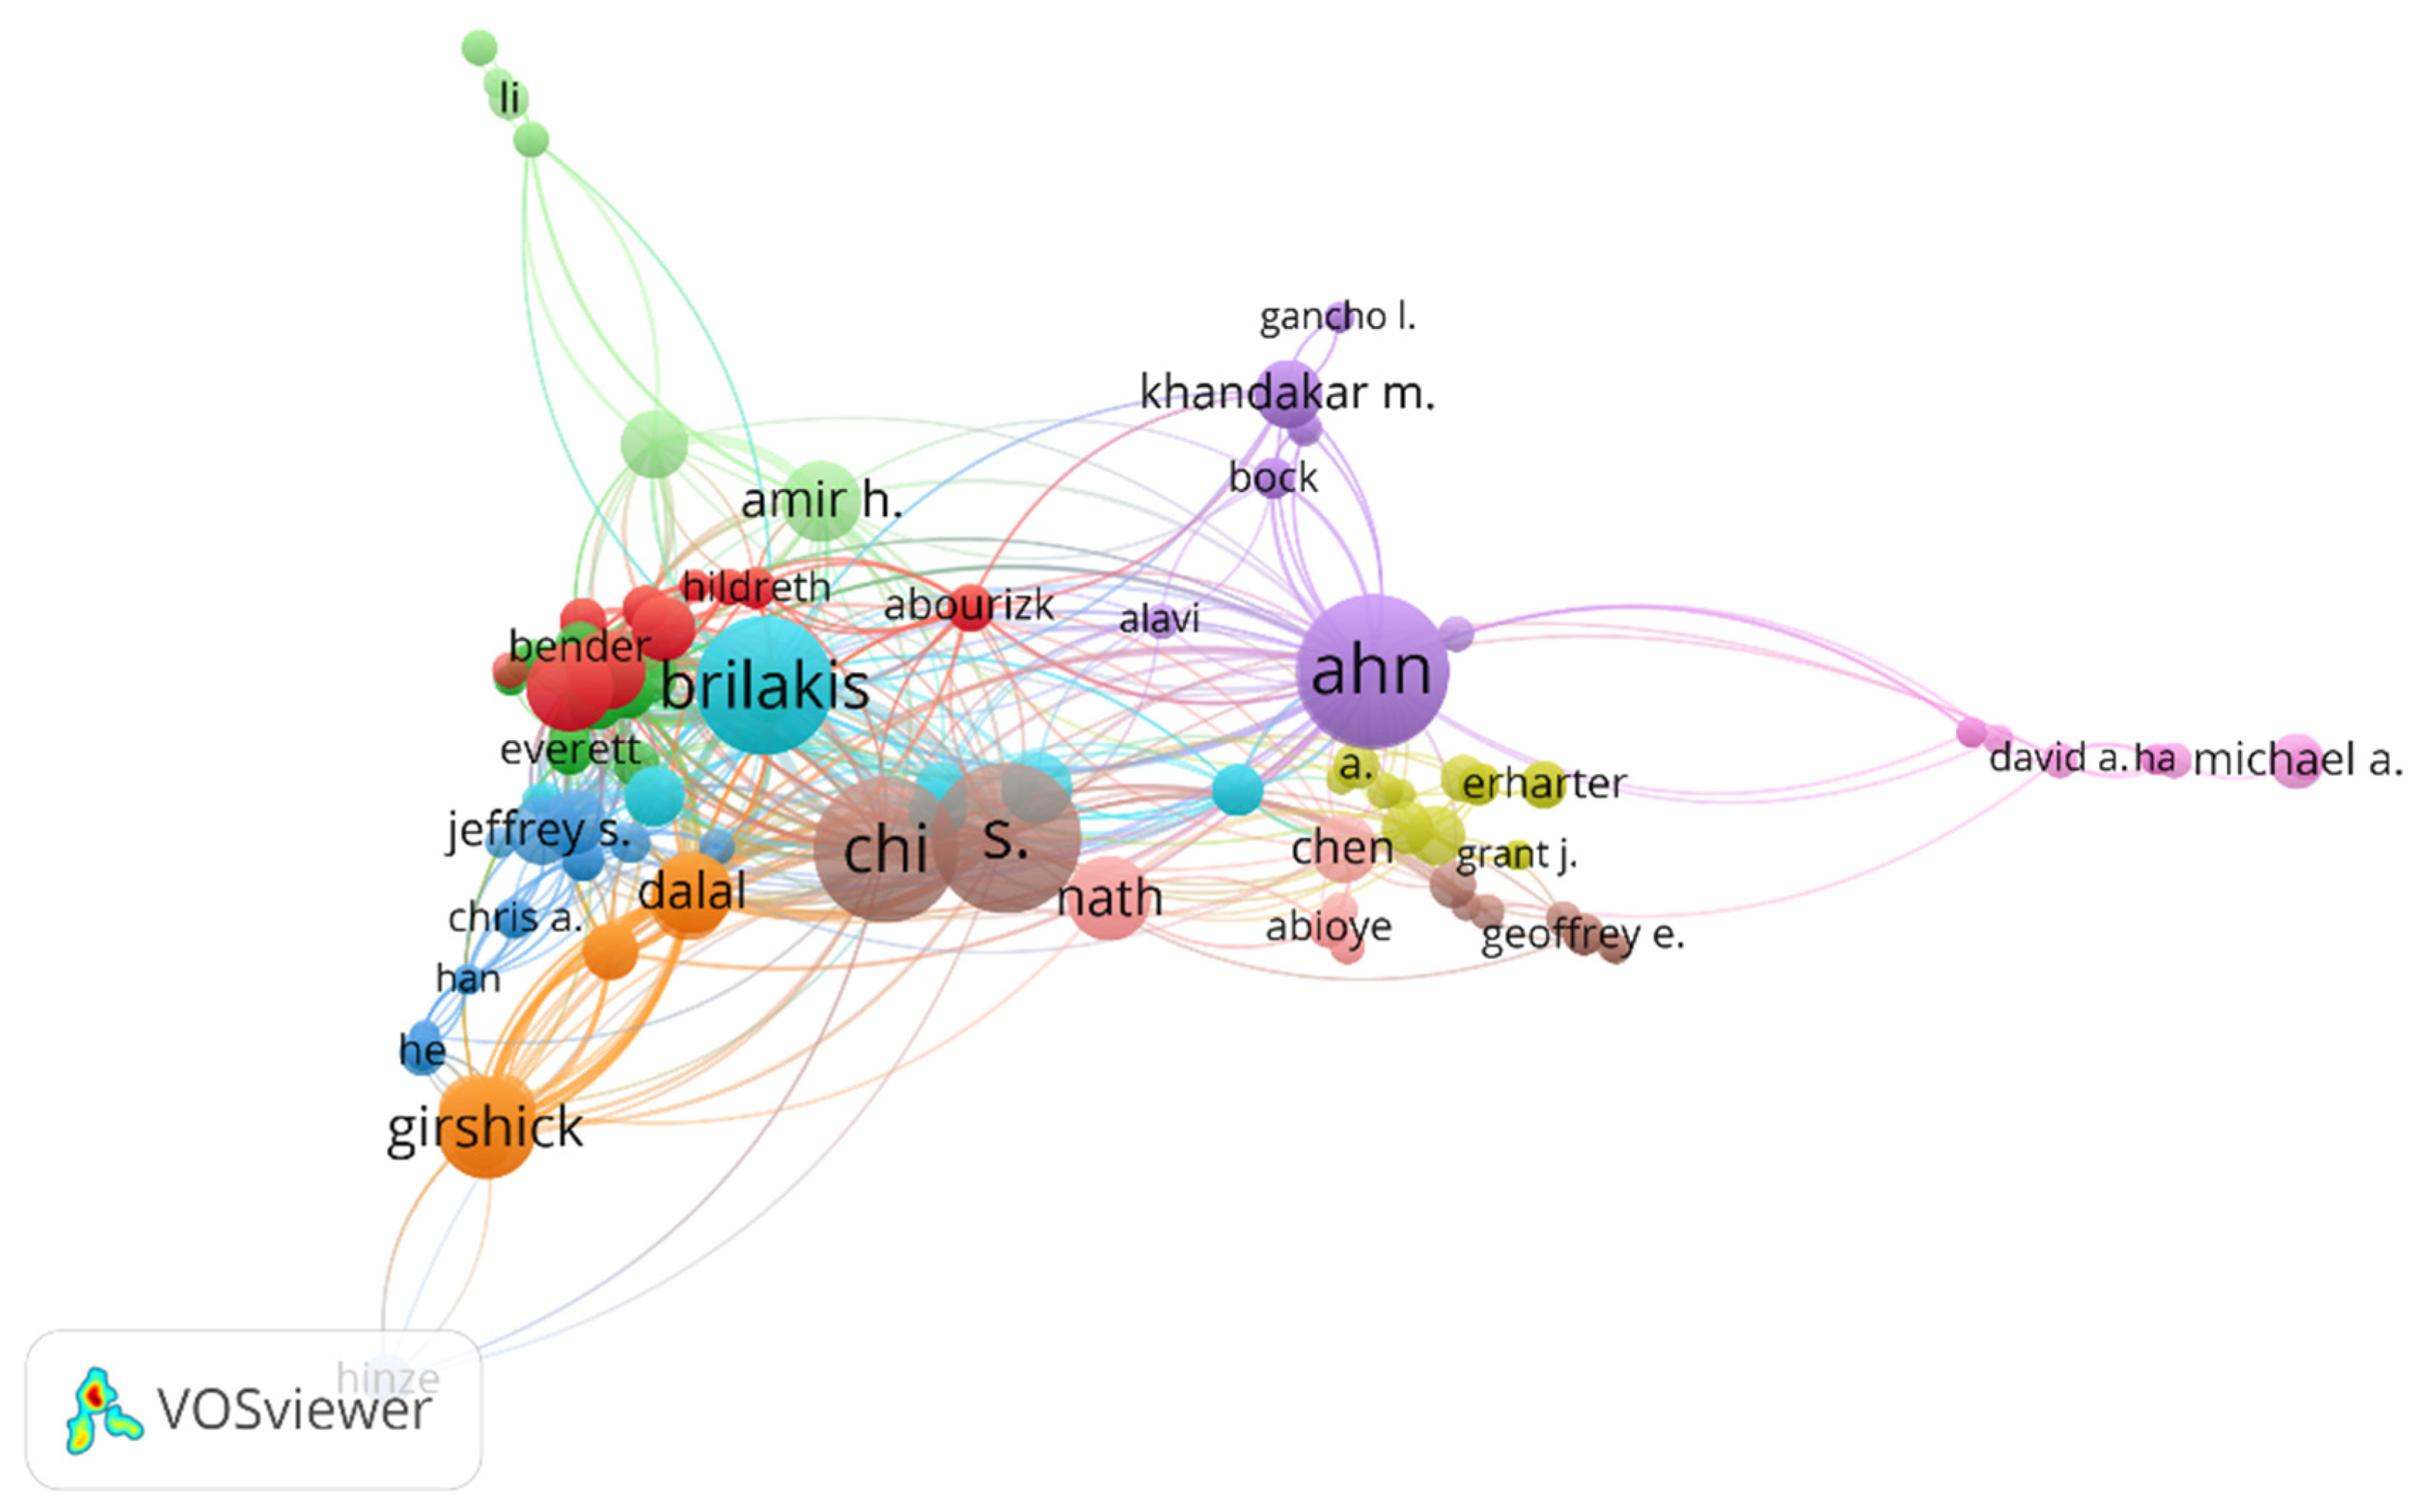
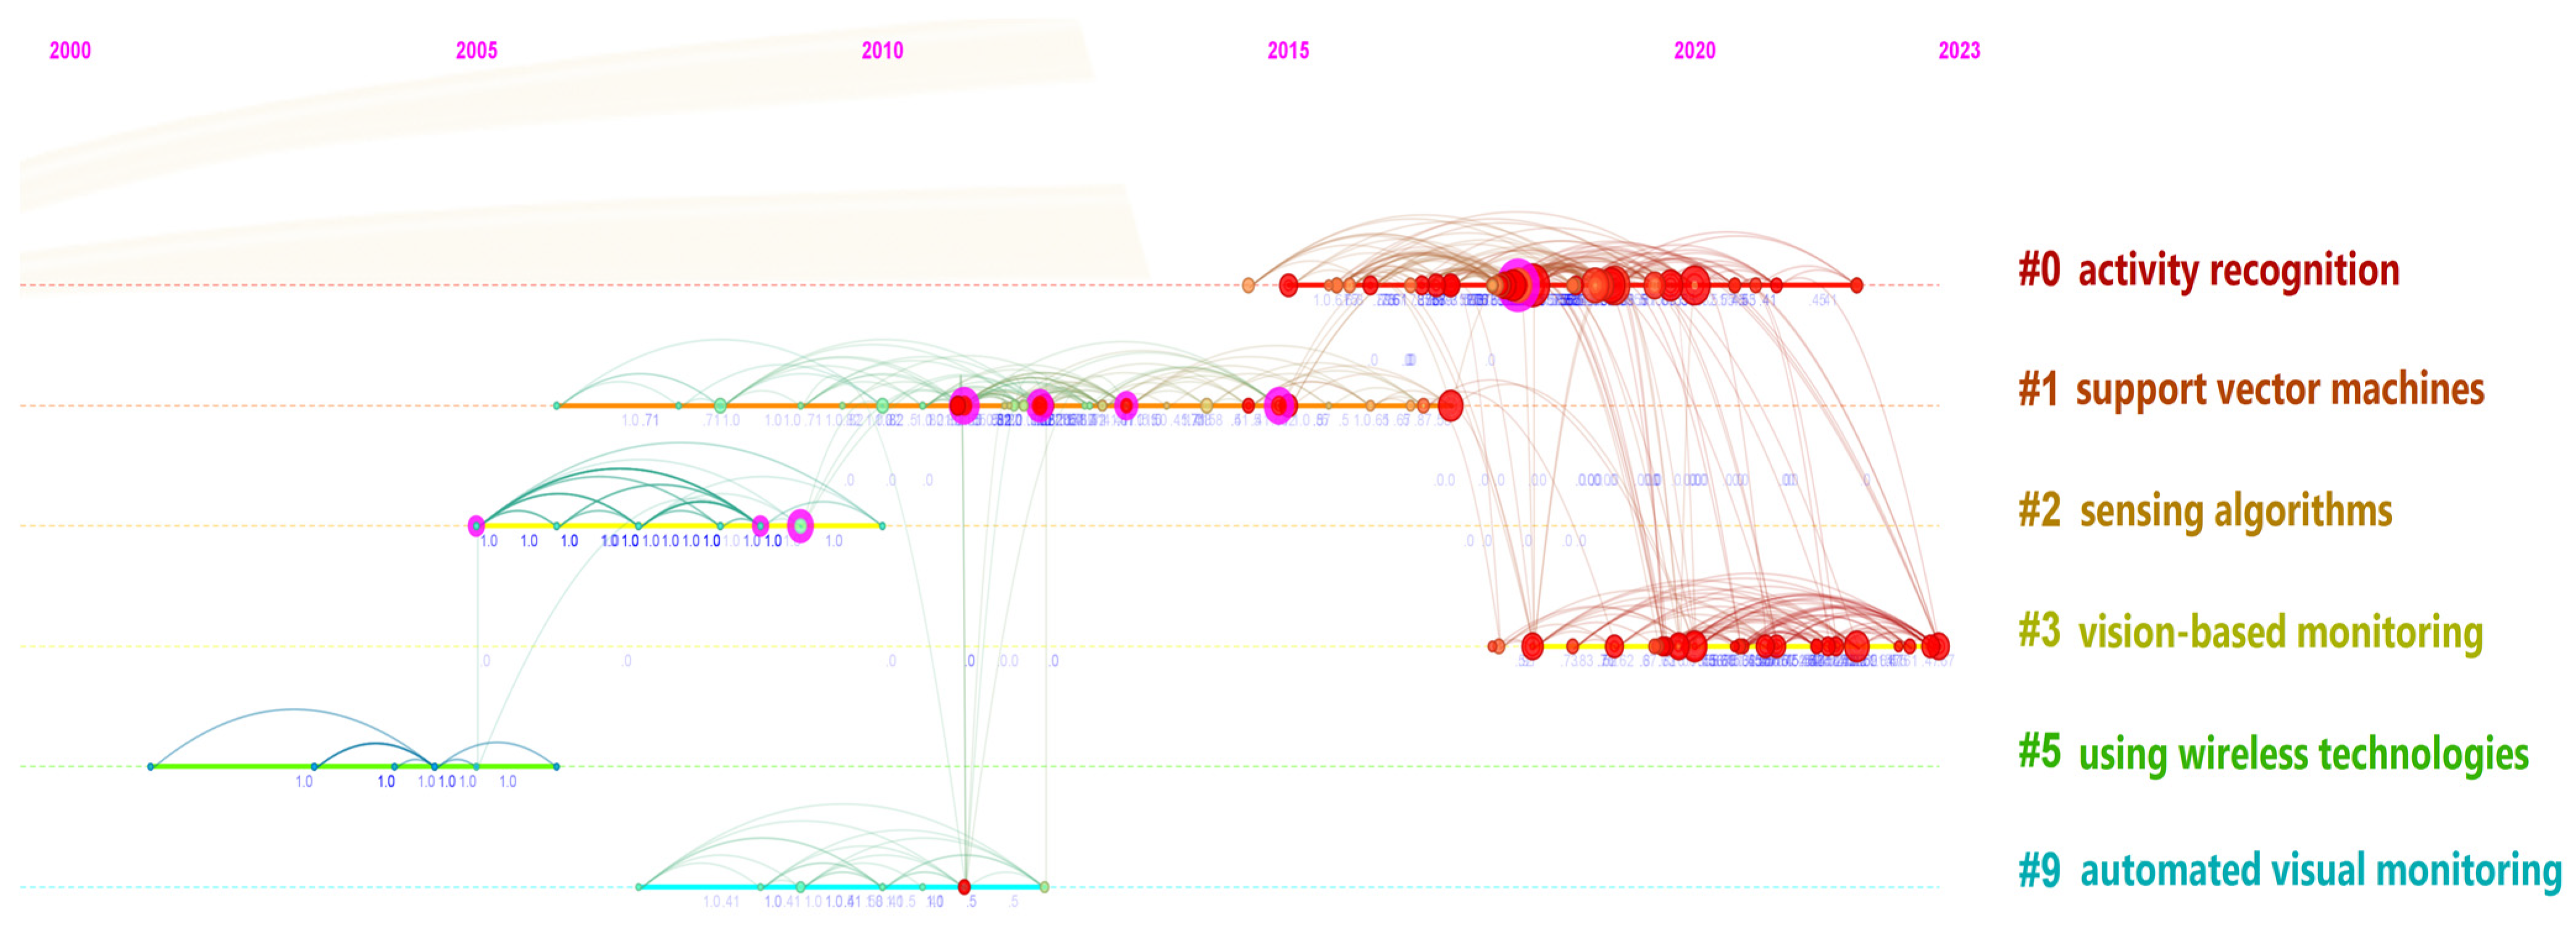

Disclaimer/Publisher’s Note: The statements, opinions and data contained in all publications are solely those of the individual author(s) and contributor(s) and not of MDPI and/or the editor(s). MDPI and/or the editor(s) disclaim responsibility for any injury to people or property resulting from any ideas, methods, instructions or products referred to in the content. |
© 2026 by the authors. Licensee MDPI, Basel, Switzerland. This article is an open access article distributed under the terms and conditions of the Creative Commons Attribution (CC BY) license.