


Abstract
High-density commercial areas in northern monsoon coastal cities face dual microclimate challenges: hot summers and harsh winters. This study aims to optimize year-round outdoor thermal comfort (Physiological Equivalent Temperature, PET) by exploring morphological optimization strategies in Qingdao. Combining field observations with ENVI-met simulations, we evaluated the impact of building density, street aspect ratio (H/W), and orientation. The results reveal a fundamental “seasonal mechanism conflict.” In summer, a 45% density point-tower configuration with a deep canyon profile (H/W ≈ 2.5) maximizes shade and sea-breeze ventilation. Conversely, in winter, a 35% density enclosed topology with an open profile (H/W ≈ 1.6) optimally blocks cold northwesterly monsoons and increases solar gain. To resolve these conflicting seasonal requirements, we propose a dynamic morphological equilibrium. We recommend adjusting the H/W ratio dynamically between 1.6 and 2.5 and adopting a southeast block orientation of 15–30° to synergistically guide summer breezes while blocking winter winds. Ultimately, this study shifts the design paradigm from static parameters to dynamic seasonal trade-offs, offering actionable morphological guidelines for climate-resilient built environments.
1. Introduction
With the rapid development of global urbanization, the intensity of urban construction is also gradually increasing. According to a United Nations report, more than 64% of the world’s population currently lives in cities, and this figure is expected to increase to 68% by 2050 [1]. The rapid development of urbanization will lead to the intensification of the urban heat island effect. Population growth and land consumption will also lead to large-scale urban construction activities. The natural environment is gradually replaced by the urban environment, and urban forms show a trend of more high-density development. At the same time, it will lead to the degradation of the urban microclimate environment, which has an important impact on human activities and has a significant impact on the thermal comfort of the urban outdoor environment [2,3] especially in high-density centers. Santamouris’s research pointed out that the peak power demand of urban buildings may double due to the influence of UHI, while significantly reducing outdoor thermal comfort [4]. In order to deal with this urban environmental problem, Oke TR, Mills G et al. [5] proposed that climate suitability-based urban form optimization is considered to be one of the most cost-effective passive strategies for improving the urban microclimate environment.
Research on urban microclimate began in the early 20th century. Nunez and Oke [6] conducted extensive field surveys on street temperatures in summer nights, using major regional cities in Australia and the United States as their research targets. The results showed that the street sky coefficient was negatively correlated with air temperature, and the smaller the sky coefficient, the higher the air temperature in the city at night. Existing literature has extensively discussed the regulation mechanism of urban geometry on microclimate parameters. Muniz-Gäal LP et al. [7] used ENVI-met software to simulate 36 scenarios between buildings in winter and summer to evaluate whether the geometric parameters of urban street canyons affect their microclimate and pedestrian thermal comfort. The results showed that canyons with a high height-to-width ratio increase wind speed and building shading, thereby improving pedestrian thermal comfort, especially in summer. Zhang J et al. [8] extracted 30 architectural spatial morphology scenarios with different gradients from typical plots in Beijing and selected 6 indicators to characterize architectural spatial morphology. Through a combination of field measurements and software simulation, they explored the interaction mechanism between architectural spatial morphology and urban microclimate and thermal comfort in multiple dimensions. Guo et al. [9] investigated typical cold-region plain cities (Shijiazhuang, Zhengzhou, Xi’an), establishing linear and non-linear correlations between microclimate indices at the 1 km2 scale and quantitative block morphology indicators to guide ventilation and temperature regulation designs. Zhang L et al. [10] took Urumqi, a city with a temperate continental climate, as an example and used ENVI-met simulation software to quantitatively analyze the correlation between microclimate environmental parameters and square spatial geometry. Chatzidimitriou A et al. [11] took a typical high-density mixed commercial and residential street block as the research object, conducted an on-site survey of its outdoor thermal environment under high-temperature conditions in summer, and used ENVI-met software to conduct a comprehensive numerical optimization simulation of street block shading facilities (such as street trees and building shading), water landscape configuration, and green coverage. Studies have shown that comprehensively increasing green coverage, introducing water features that provide evaporative cooling, and designing reasonable shading facilities can produce a significant synergistic cooling effect and greatly improve the outdoor thermal comfort level of the neighborhood in summer. Castrejon-Esparza NM et al. [12] evaluated 94 relevant studies on optimizing climate-responsive and performance-based urban morphology from a multi-objective perspective over the past decade (2015–2024). Through comprehensive analysis, the global trends of key performance indicators, design variables, and optimization objectives for sustainable urban development were studied, and the methods, tools, and algorithms available in the literature were summarized. The results highlighted studies conducted in 22 countries, 64 cities, and 14 climate zones, with the majority of the studies conducted in subtropical humid climates (33%), followed by subtropical semi-humid climates (18%) and Mediterranean climates (12%). The results indicate that applying multi-objective optimization models in the urban design process helps determine urban configurations, thereby improving energy efficiency, reducing greenhouse gas emissions, and mitigating urban overheating and the urban heat island effect. Recently, Tang et al. [13] developed an integrated framework using artificial neural networks and spatial regression to assess morphological impacts on high-density thermal environments in Beijing. By classifying blocks via self-organizing maps (SOM) with 2D and 3D metrics, they identified dense low-rise zones (DLZ, average temperature 50.2 °C) as the primary UHI contributors, noting that building patch density (PD_B) and building number density (BND) are the strongest predictors of land surface temperature (LST). A recent scoping review tracking data from 2000 to 2024 highlights that developing zero-carbon urban buildings (ZCUBs) has emerged as a critical paradigm during the current era of climate change and energy transition [14]. Within this macro framework, integrating resilient cooling technologies into the building stock directly influences final energy consumption and systemic greenhouse gas (GHG) emissions [15]. Furthermore, strategic optimization of microclimate-responsive urban morphology acts as a proactive climate adaptation strategy, balancing building energy demands and outdoor thermal comfort under evolving regional climate pressures [16].
However, although there is a growing body of literature studying the year-round thermal performance of various urban forms [11,17,18], these studies are primarily conducted in Mediterranean, temperate oceanic, or subtropical climates. In coastal cities affected by the northern monsoon, there is still a significant lack of systematic quantification regarding seasonal morphological contradictions, particularly the dual need to capture summer sea breezes while blocking the harsh winter monsoon. To address this theoretical gap, this study takes Qingdao—a typical northern monsoon coastal city—as a case study to explore the climate-responsive mechanisms of high-density commercial block morphologies. By extracting local topology baseline models (point-tower, linear-tower, and enclosed-tower) through field surveys and morphological clustering, this research employs the ENVI-met simulation platform to systematically quantify the bidirectional influence of key built environment parameters (building density, street aspect ratio, and orientation) on Physiological Equivalent Temperature (PET). Ultimately, this study aims to reveal the seasonal trade-offs between wind shading and winter shelter, offering quantitative, actionable morphological guidelines for climate-resilient urban design in similar climatic zones.
To systematically guide this numerical study, we propose three explicit and testable hypotheses:
- In high-density monsoon coastal environments, high-porosity point-tower topologies are more effective than enclosed structures in mitigating summer thermal stress for pedestrians, while low-density enclosed structures optimize winter comfort through microclimate buffering.
- The relationship between street aspect ratio (H/W) and trans-seasonal thermal comfort is non-linear, with deeper canyons maximizing summer comfort through shading, while open profiles enhance winter comfort by trapping solar radiation.
- Street orientation can serve as a harmonizing parameter, promoting ventilation from summer sea breezes while mitigating harsh winter monsoons.
2. Materials and Methods
2.1. Selection of Research Subjects and Typical Neighborhoods
This study selected Qingdao (36°03′ N, 120°19′ E) as the research object. It is a typical northern cold monsoon coastal city in China. Crucially, the aerodynamic environment of Qingdao is not determined solely by the macro monsoon but is composed of a complex three-layer superposition effect. This multi-scale aerodynamics includes: (1) the macro seasonal monsoon background (southeast wind in summer, northwest wind in winter); (2) the mesoscale diurnal sea–land wind circulation driven by the thermal gradient between the ocean and land; and (3) the micro-local aerodynamic circulation caused by the urban heat island effect in the high-density commercial core area [19]. It is this continuous superposition of diurnal sea wind and the prevailing summer monsoon that fundamentally distinguishes the microclimate characteristics of coastal areas from those of inland urban areas.
Although the participating institutions are primarily located in Henan Province, Qingdao was rigorously selected due to its unique coastal multi-scale aerodynamic characteristics. Crucially, the research team possessed a solid local academic foundation; its core members conducted ongoing field monitoring and urban morphology surveys in Qingdao during their postgraduate studies from 2020 to 2023, ensuring a high degree of familiarity with the data and its scientific reliability. In 2019, Tsinghua University conducted a statistical analysis of street data in the central areas of major cities across the country and divided 63 cities into five categories: multi-story high-density, composite high-density, multi-story uniform density, low-rise, and composite uniform density [20]. Qingdao belongs to the high-density category and has the typical characteristics of a coastal city and a high-density city.
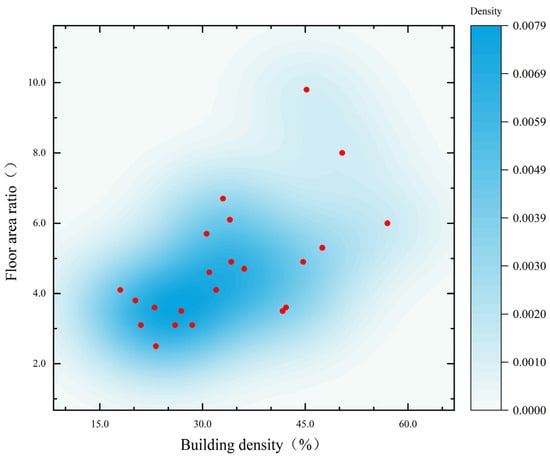
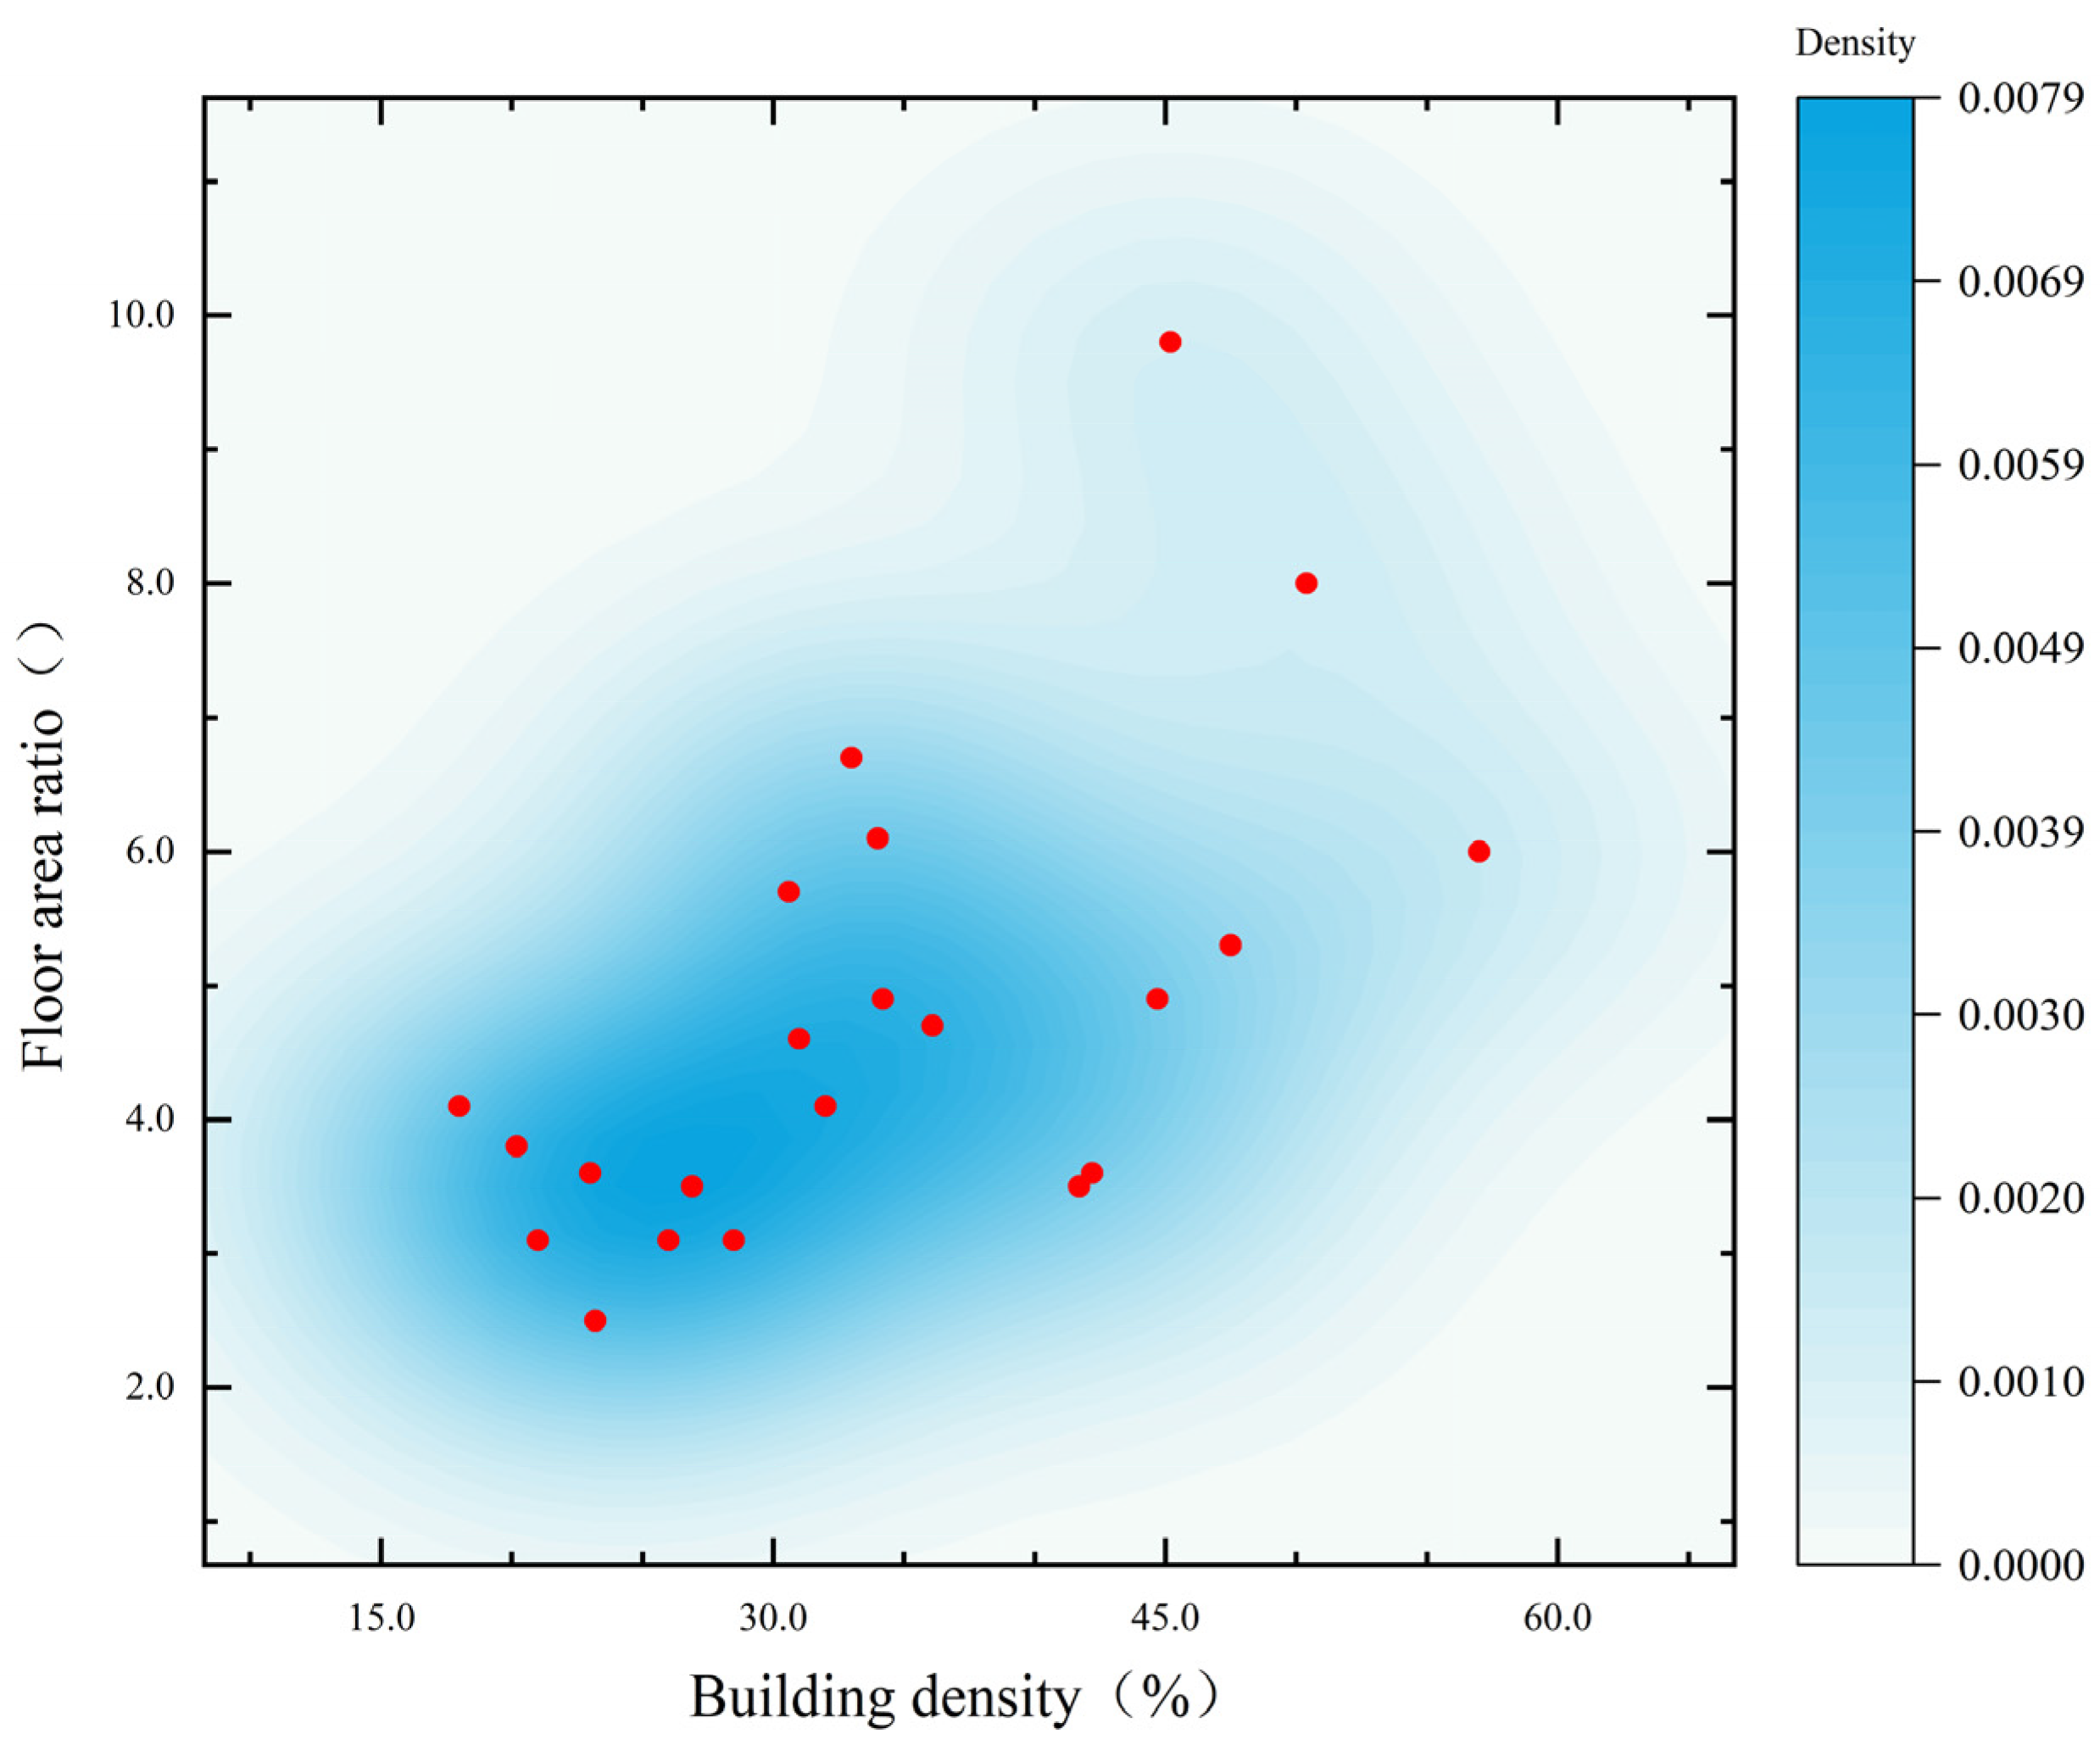
To ensure the scientific rigor and regional representativeness of the numerical simulation model, this study conducted field surveys and spatial parameter statistics on 22 high-density commercial districts in the core area of Qingdao. The survey data, analyzed by clustering (Figure 1), shows that the building density of the surveyed samples mainly ranged from 30% to 50% (accounting for 13 out of the 22 surveyed blocks, or approximately 59%), and the plot ratio was primarily between 3.0 and 7.0, accounting for approximately 81.8% of the total sample. This indicates that the Qingdao coastal business district exhibits significant medium-to-high intensity agglomeration characteristics. The average street height-to-width ratio mostly ranged from 1.6 to 3.0; the average number of building floors mainly varied between 9 and 25, with 10–15 floors being the majority, and >20 floors accounting for 21.4%.
Figure 1.
Distribution of building density and plot ratio for the 22 surveyed commercial blocks (red points represent the surveyed block samples, and building density is indicated in %).
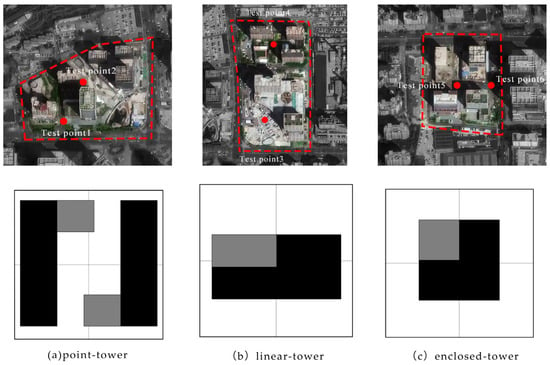
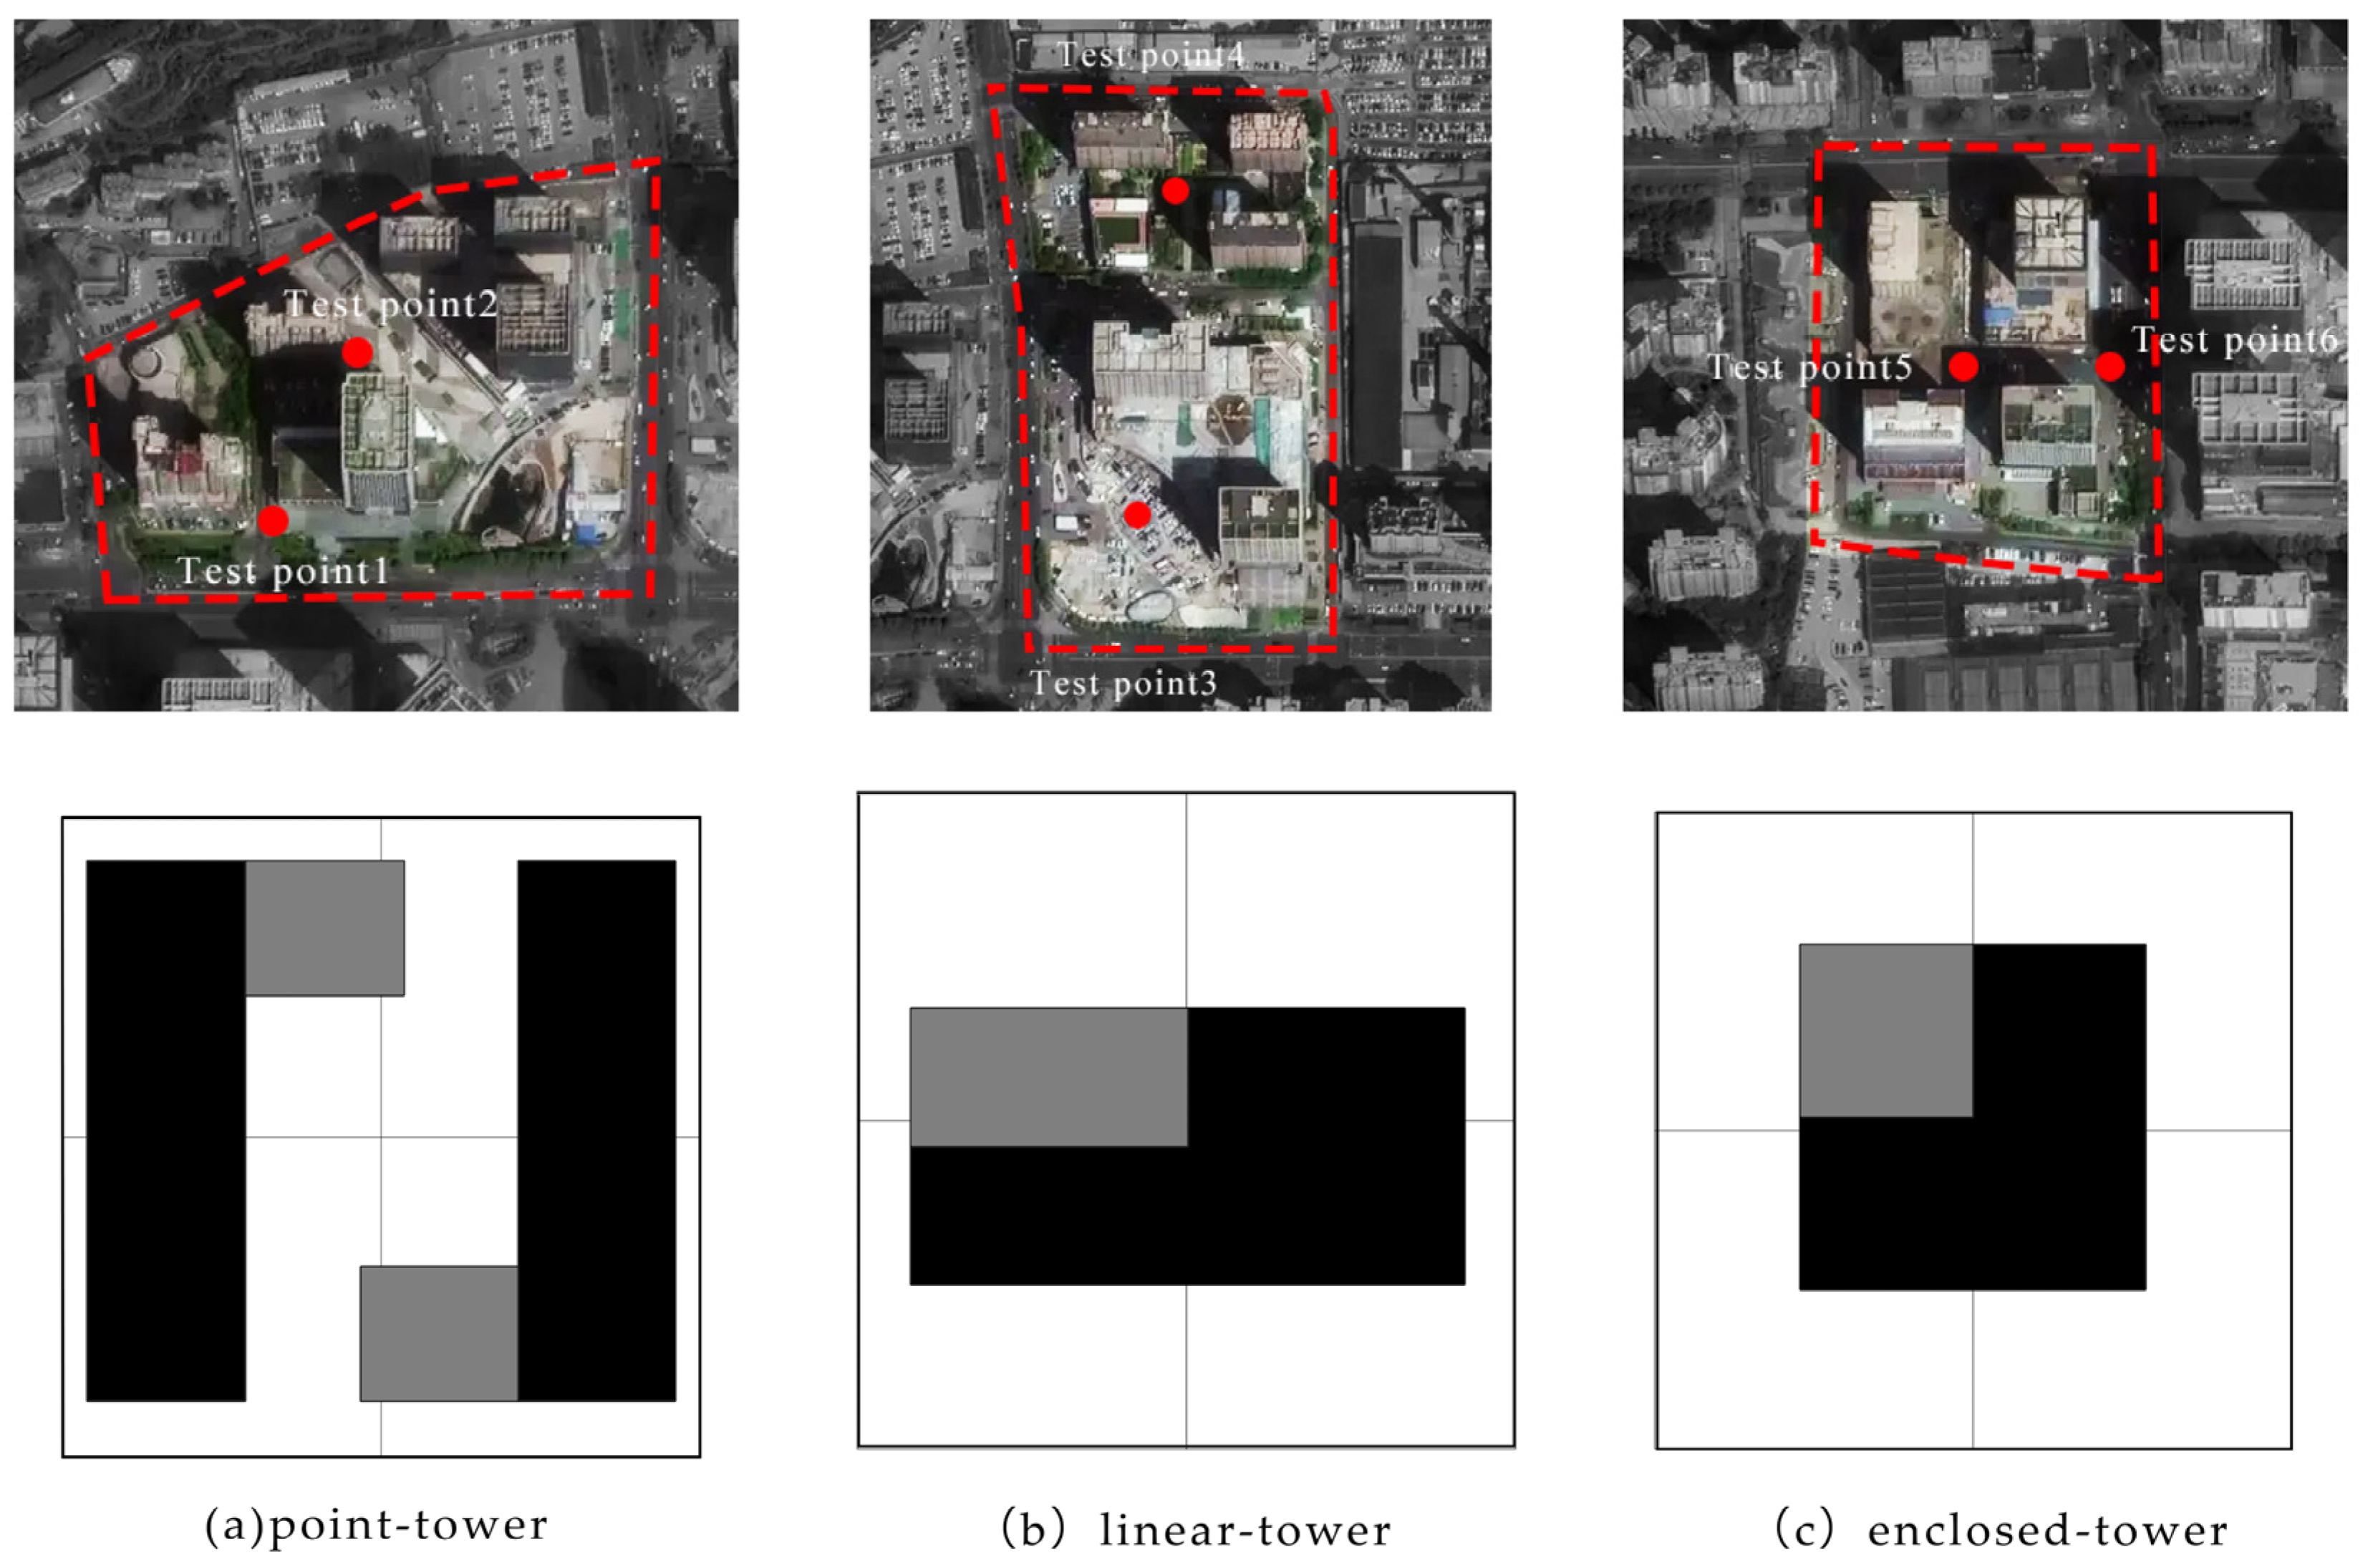
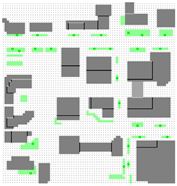
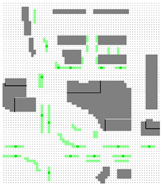
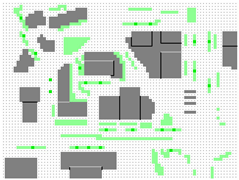
This study uses a widely accepted and mature spatial classification framework in urban morphology to classify the spatial forms of high-density commercial districts along the coast into three typical types: point-tower, linear-tower, and enclosed-tower. Through the aforementioned cluster analysis, this mature framework is systematically correlated with the actual parameter ranges of high-density commercial districts along the Qingdao coast. Based on these locally extracted morphological threshold ranges, representative districts are selected as the main study subjects, and comprehensive data collection is carried out to provide a local morphological baseline for the design of subsequent simulation experiments. The specific distribution of measuring points is as follows (Figure 2).
Figure 2.
Schematic diagram of conceptual baseline models and the spatial distribution of empirical measuring points.
2.2. Field Data Measurement
2.2.1. Measuring Point Layout
The selection of measurement points was systematically predicated on the following three dimensions:
- Variance in street orientation:
Considering that the street orientation directly determines the amount of solar radiation received and the angle with the prevailing wind direction, the measurement points were arranged to cover typical north–south and east–west streets in order to compare and analyze the differences in wind speed and thermal environment under different orientations.
- 2.
- Spatial diversity:
To quantify the impact of urban geometry on microclimate, the selected monitoring points covered a variety of typical spatial types, including highly enclosed street canyons, open building plazas, and road intersections (such as T-junctions). This layout aimed to capture the variation patterns of microclimate parameters under different spatial configurations.
- 3.
- Reduce human interference:
To eliminate interference from non-meteorological factors and ensure data accuracy, the measurement points were strictly located away from traffic congestion hotspots, building air conditioning vents, and areas with high population density. This minimized the impact of anthropogenic heat and vehicle exhaust on the microclimate.
The overview of each measuring point is shown in Table 1:
Table 1.
Overview of each measuring point.
2.2.2. Instrument Introduction and Data Collection
The four microclimate elements of the street, namely air temperature, air humidity, wind speed, and solar radiation, were measured using actual measuring instruments. The main measuring instruments used are shown in Table 2.
Table 2.
Instrument details and parameters.
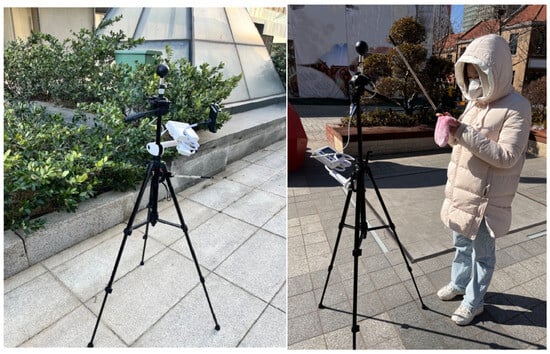
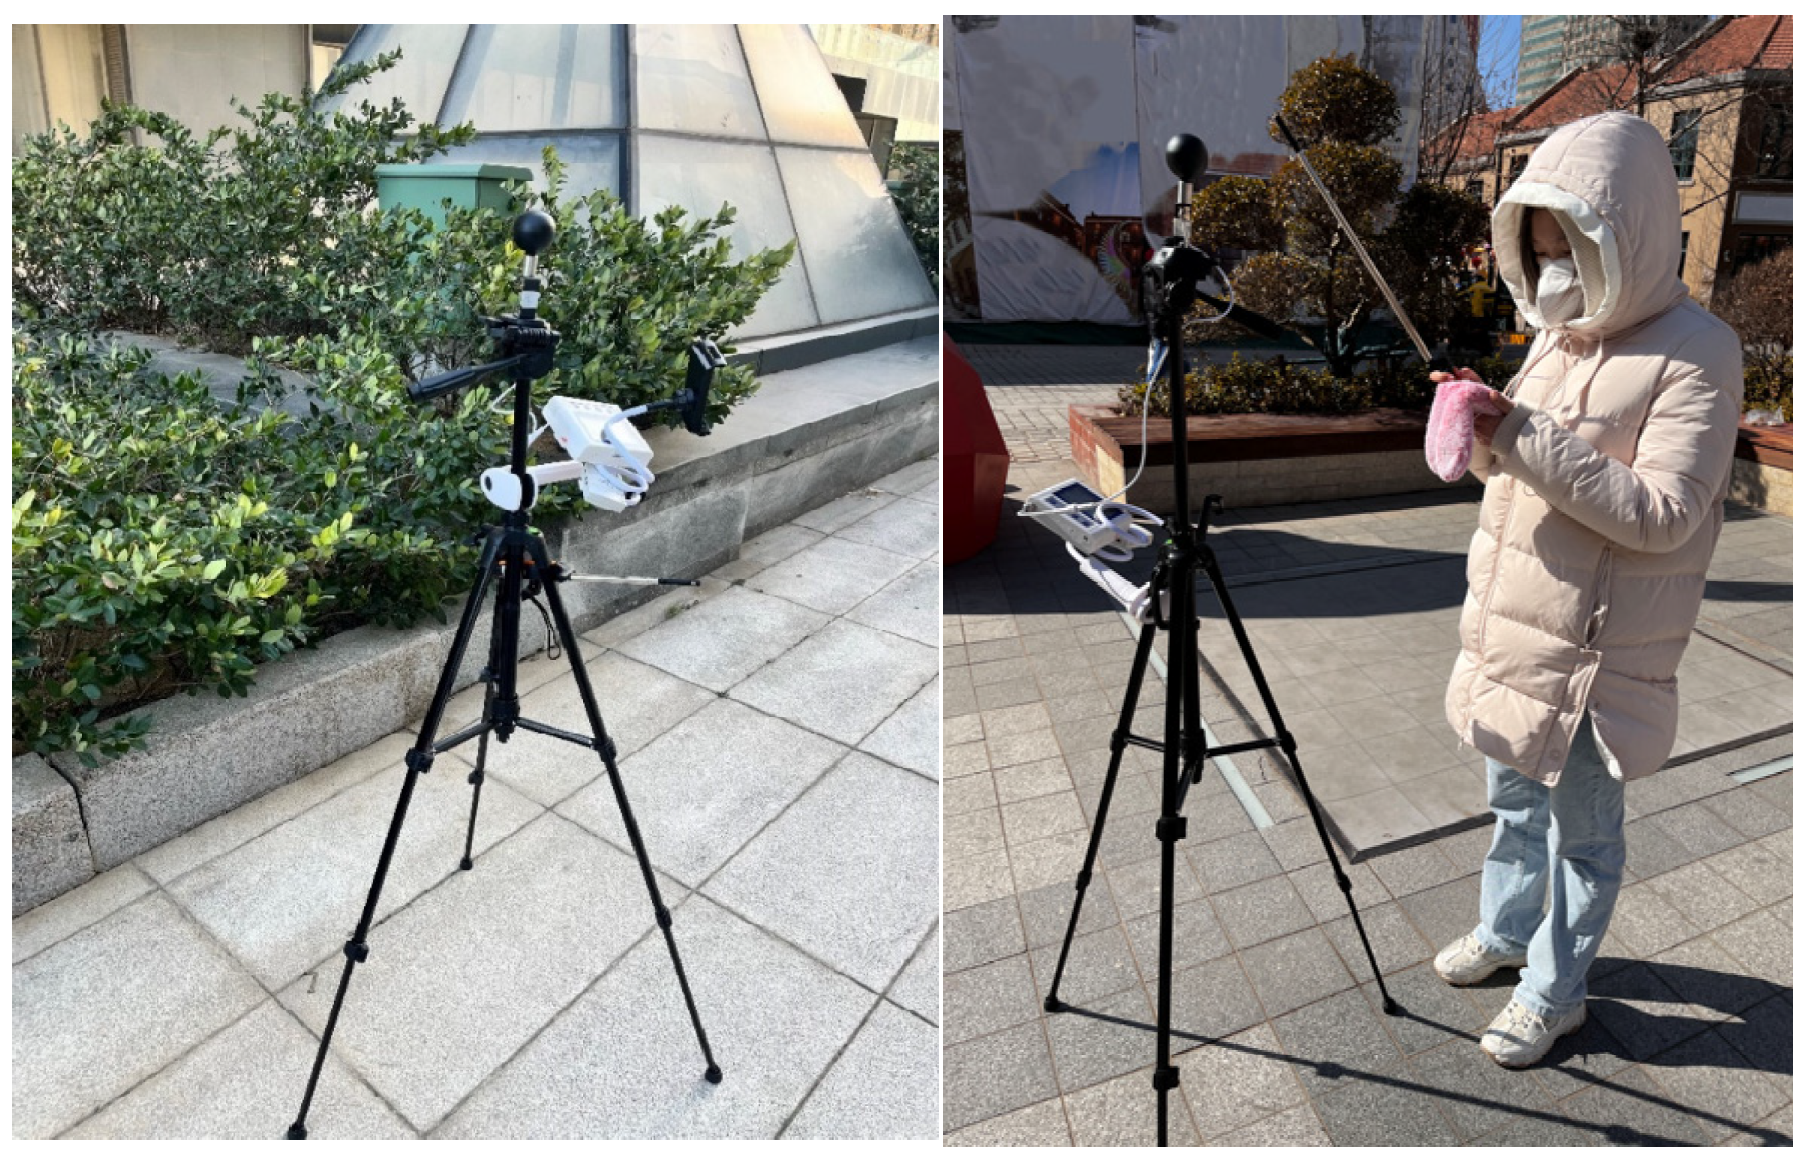
Field microclimate measurements were conducted within the representative blocks on a typical summer day (8 August 2022) and a typical winter day (18 December 2022) (Figure 3). The monitored parameters included air temperature (Ta), relative humidity (RH), wind speed (WS), and Black sphere temperature (Tg), all recorded at a height of 1.5 m above ground level [21].
Figure 3.
Field monitoring photographs at Measuring Points 1 and 2.
These specific dates in 2022 were deliberately chosen to capture ideal, typical clear weather conditions to represent a standard local microclimate baseline, thereby avoiding abnormal weather or localized microscale construction disturbances in the following years (until 2025).
2.2.3. PET Value Calculation
To comprehensively assess the outdoor thermal environment, this study measured the mean radiant temperature (MRT), which represents the total infrared and solar radiant heat load experienced by the human body. The mean radiation temperature (MRT) was calculated using the formula based on the measured data of winter and summer, and then the PET value was calculated using Rayman Pro (Version 3.1 Beta) software. The Rayman model can simulate the radiation flux of shortwave and longwave in a three-dimensional environment, and can estimate the radiation flux density and thermophysiological evaluation indicators using limited meteorological data and other input data [22]. The basic data required to be input into Rayman software include latitude and longitude, altitude, and clothing thermal resistance, etc. The specific parameter settings are shown in Table 3.
Table 3.
Rayman settings parameters.
2.3. Numerical Simulation
For the research content of this paper, ENVI-met version V5.03 was used. It can perform numerical simulations of the interactions between various elements in the urban environment, including the atmosphere, soil, vegetation and buildings, at the microscale. It can simulate the interactions between urban surfaces, vegetation and atmosphere [23,24]. It can simulate major climate variables such as air, wind speed and direction, and radiation flux. It can also calculate human thermal comfort evaluation index PMV and physiological equivalent temperature PET based on various indicators, which has strong applicability.
First, we generated a block model file (.inx) using the Space module of ENVI-met. We set the geographical location of the simulation area and defined the computational boundary based on the actual spatial scale of the representative block. In the modeling process, we strictly adhered to the principle of placing the target block at the center of the simulation area in order to fully consider the microclimate effects due to surrounding buildings and environmental factors. The specific modeling parameters of the block area are detailed in Table 4. The simulation validation parameters detailed in Table 4 correspond directly to the three typical morphological archetypes (point-tower, linear-tower, and enclosed-tower) previously established in Figure 2.
Table 4.
Summary table of study area modeling information.
In the next phase, core simulation parameters were set, including the simulation dates, initialization time, and total duration. The simulation dates strictly matched the field measurement dates of 8 August 2022, and 18 December 2022. To properly account for the necessary software startup time, the total simulation duration was set to 12 h (07:00 to 19:00). To establish stable simulation boundary conditions, we use daily average meteorological data (including temperature, relative humidity, and solar radiation) as baseline inputs. This approach enables the simulation to effectively capture steady-state macro-microclimate trends of typical seasonal days, rather than introducing transient hourly fluctuations that may mask structural correlations. For the summer measurement days, an average wind speed of 2.2 m/s and an average wind direction of 165.75° were entered, while for the winter measurement days, an average wind speed of 3.6 m/s and an average wind direction of 264.92° were set.
2.4. Calibrating ENVI-Met
To calibrate the simulation model, the measured and simulated profiles of temperature and relative humidity across the two seasonal study days (8 August 2022, and 18 December 2022) were comparatively analyzed. A systematic comparison was executed between the on-site empirical datasets and the software-generated numerical outputs. Furthermore, the maximum, minimum, and mean values obtained from all monitoring points under both the field measurement and simulation scenarios are detailed in Table 5.
Table 5.
Comparison between the average, maximum, and minimum values of air temperature and air humidity variables.
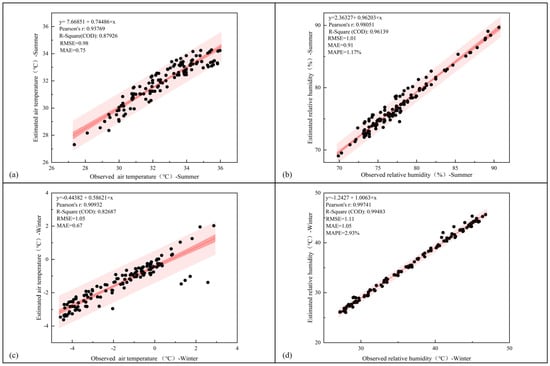
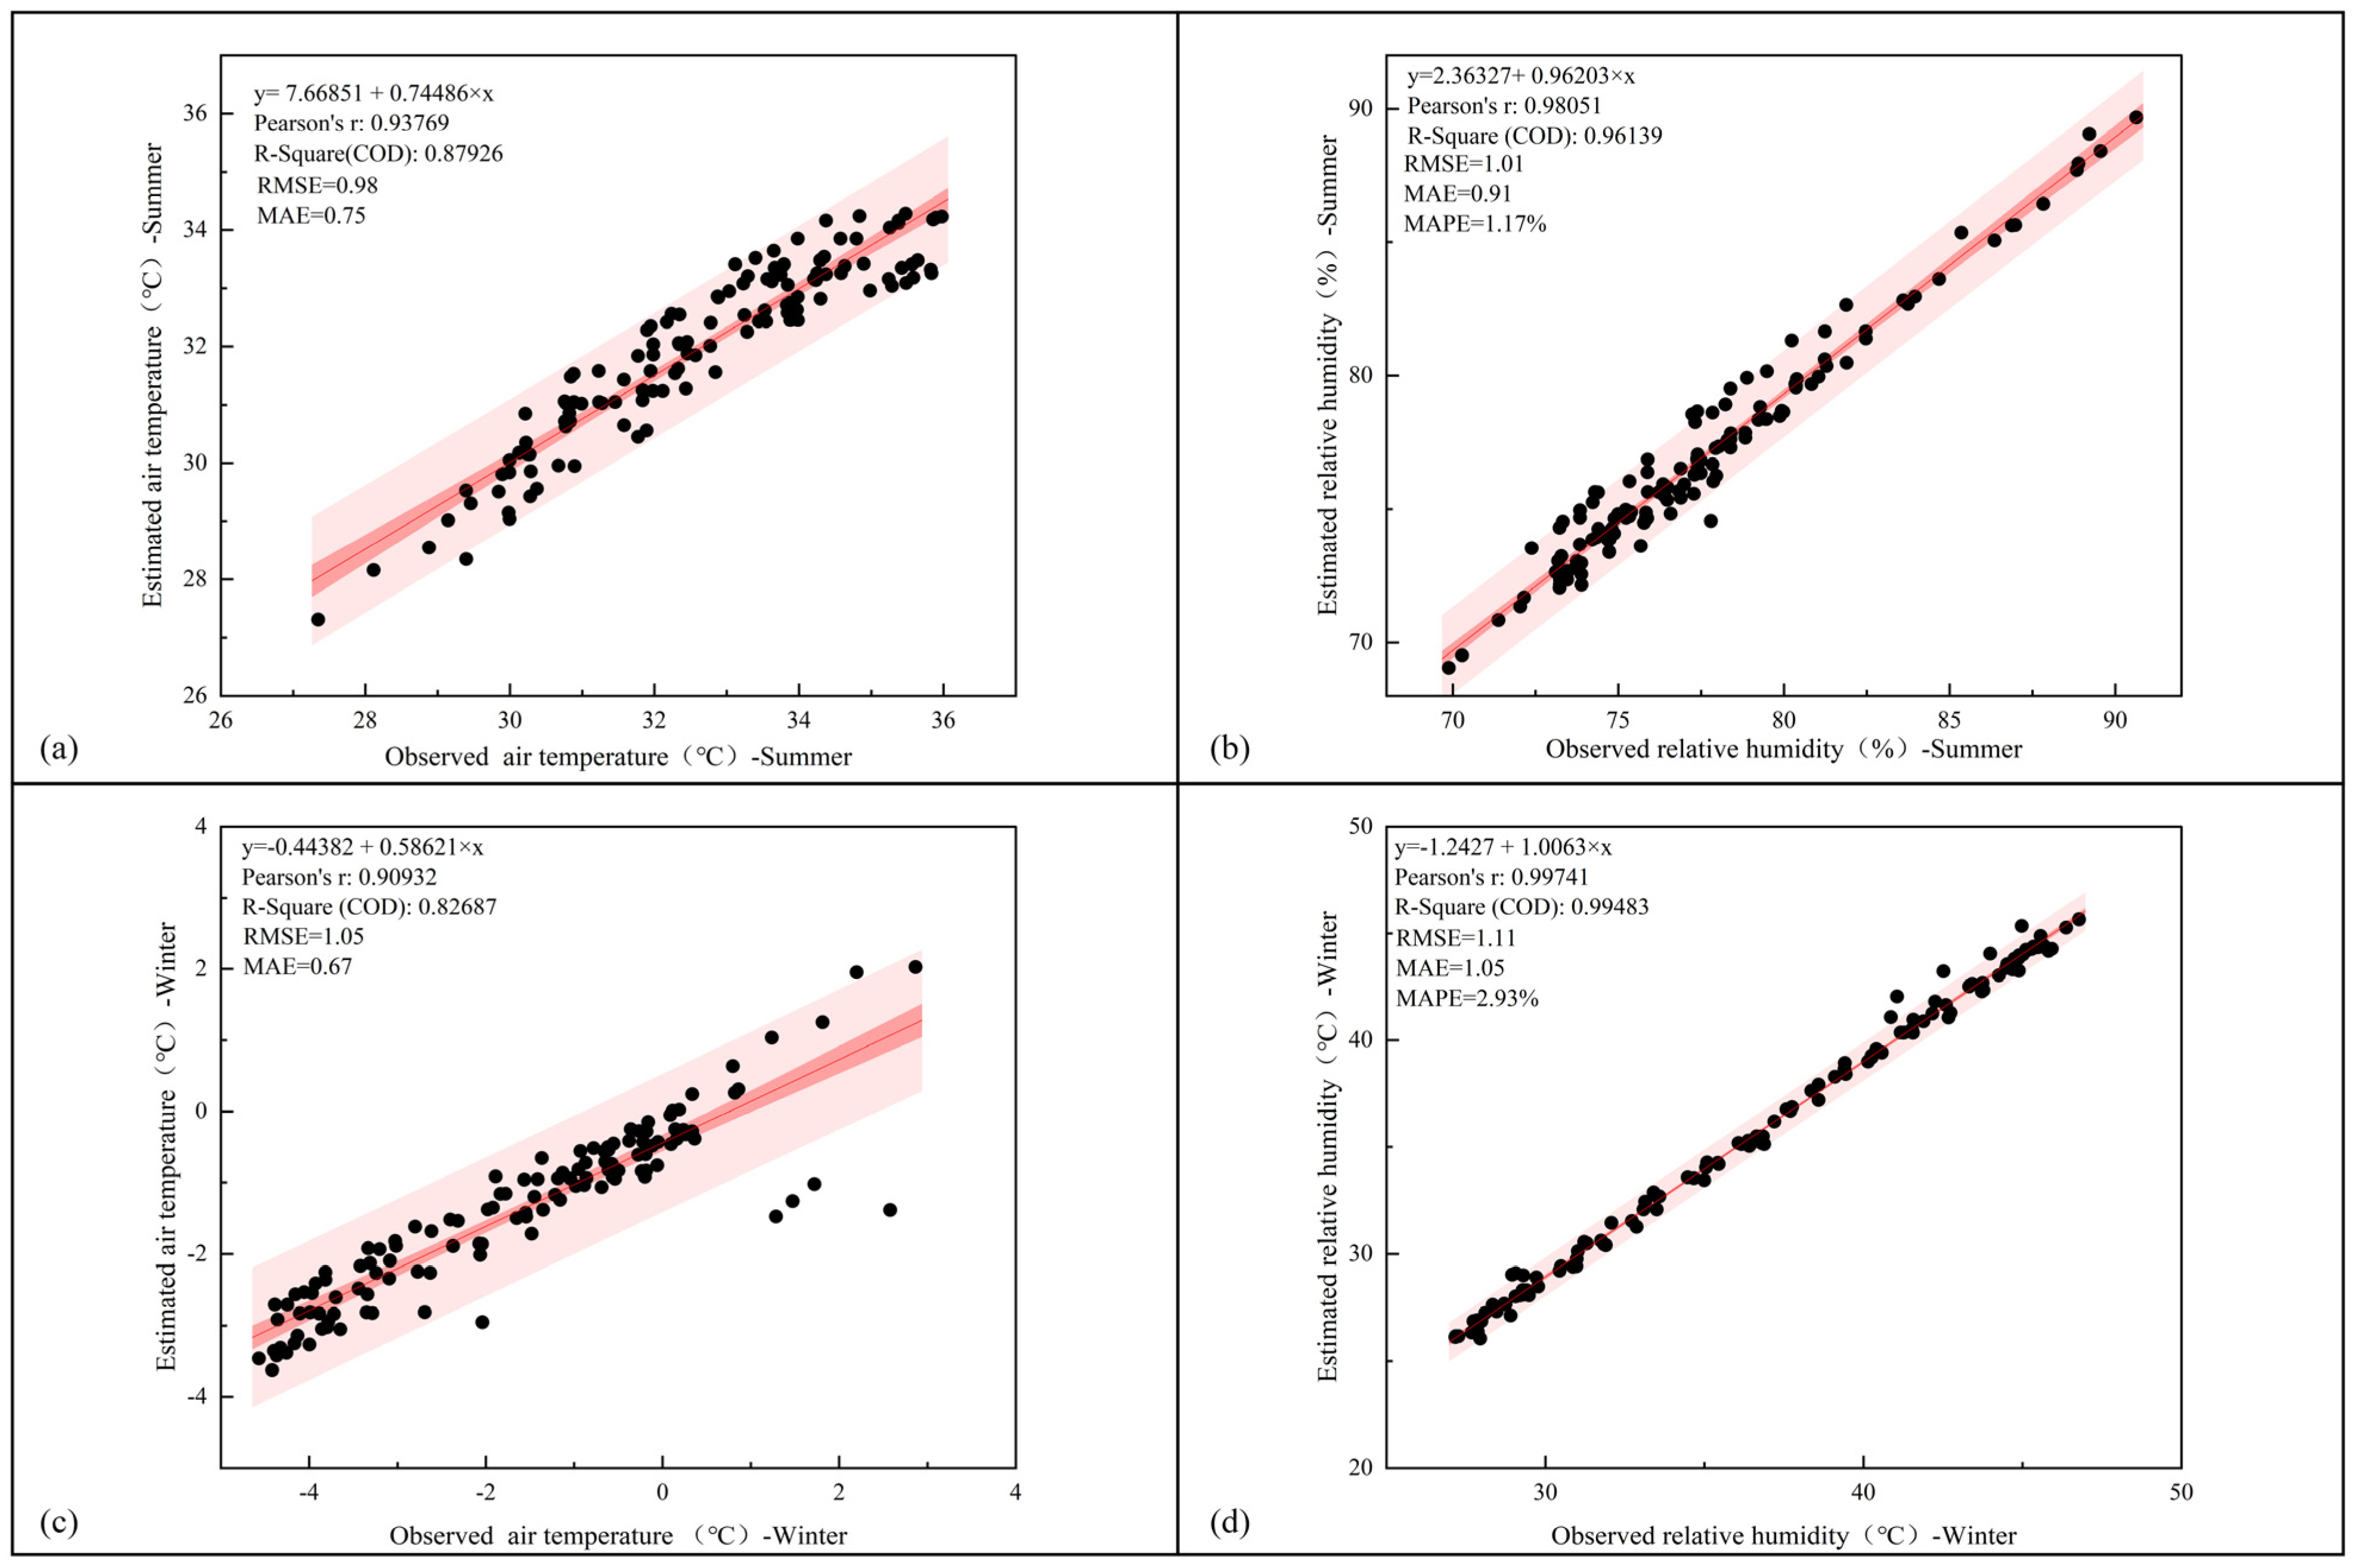
The model calibration in this study primarily focuses on air temperature and relative humidity data, as these are the most stable and descriptive baseline parameters for urban thermodynamic microclimates. However, since the core findings of this study heavily rely on aerodynamic variables and radiative flux, the validation of wind speed and black sphere temperature requires a clear methodological context. Pointwise empirical validation of instantaneous wind speed and mean radiative temperature faces inherent multi-scale challenges; microscale wind fields are highly sensitive to transient local turbulence and micro-topography, while radiative flux fluctuates dynamically due to cloud drift in the real world. Steady-state grid-averaged boundary layer calculations in ENVI-met cannot perfectly reflect these highly stochastic factors. Therefore, validating the absolute values of these variables introduces high empirical uncertainty, a data limitation that has been clearly identified. However, since the robust consistency of Ta and RH demonstrates the accurate initialization of the underlying thermal balance equations of the model, the uncalibrated wind and radiative fields remain highly reliable for relative comparative analyses. The established parameter matrix evaluates the relative performance changes under different ideal geometries, rather than absolute local predictions, thus ensuring the scientific validity of the derived design guidelines. Furthermore, Figure 4 shows the results of linear regression analysis of all measured and simulated temperature and humidity data at six observation sites in winter and summer. The results show that the linear approximation is robust and that there is a high degree of agreement between the measured dataset and the numerical predictions.
Figure 4.
Linear regression of: (a) Summer air temperature, (b) summer relative humidity, (c) winter air temperature and (d) winter relative humidity.
In order to evaluate the accuracy of the model between the measured and simulated values, the root mean square error (RMSE), mean absolute error (MAE), mean percentage error (MAPE), and coefficient of determination (R2) are also used [25]. Specifically, RMSE and MAE are used to intuitively quantify the level of absolute deviation between the simulated and measured values. Among them, RMSE is based on the calculation mechanism of the sum of squares of errors and is more sensitive to local large errors; while MAE objectively reflects the average benchmark of the overall error of all weather. MAPE eliminates the interference of the difference in dimensions between different microclimate variables and presents the error in the form of a relative percentage, which is mainly used for the assessment of air humidity [26]. In addition, R2 (ranging from 0 to 1) is used to characterize the degree to which the simulation output sequence explains the time series variation of the measured data. The closer R2 is to 1, the more accurate the numerical model is [27].The RMSE and MAE for summer temperatures are 0.98 and 0.75, respectively, with an R2 value of 0.88. The corresponding values for summer relative humidity are 1.01, 0.91, and 0.96, with a MAPE of 1.17%. The corresponding values for winter temperatures are 1.06, 0.67, and 0.83, respectively. The corresponding values for winter relative humidity are 1.11, 1.05, and 0.99, with a MAPE of 2.93%. These results are sufficient to validate the accuracy of the model.
2.5. Simulation Experiment Design
2.5.1. Original Model Design
To systematically isolate and quantify the precise impact of urban morphological parameters (particularly building density, street aspect ratio, and orientation) on outdoor thermal comfort (PET), this study shifts from specific, real-world sites to a parametric approach using idealized topological baseline models. Abstracting the complex built environment into standardized prototypes is a crucial methodological requirement in urban physics. By keeping non-morphological variables invariant, this controlled modeling framework eliminates irrelevant noise specific to each site. This ensures that any variations in the simulated thermal environment are strictly attributable to human-controlled spatial configuration. Therefore, this approach transcends the limitations of evaluating only a single local site, enabling the extraction of universally applicable, climate-responsive design guidelines for high-density coastal neighborhoods.
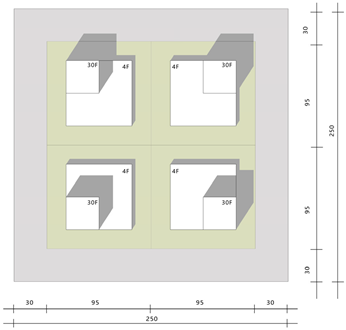
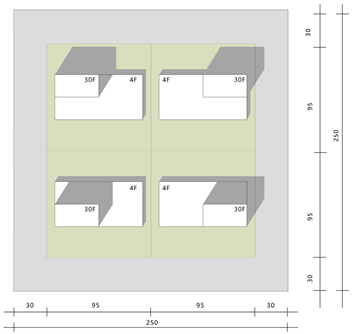
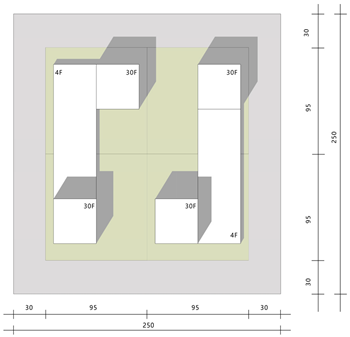
Balancing morphological representativeness with computational efficiency, parameter thresholds for actual urban blocks (area 30,000–80,000 square meters, side length 140–350 m) were referenced, and a standardized benchmark plot size of 190 m × 190 m (area 36,100 square meters) was set. Furthermore, considering the “Provisional Rules on Urban Planning Allocation Indicators” and the regional characteristics of Qingdao’s road network, the width of major roads in the models was set to 30 m. In the different forms, the base structure was uniformly set to 4 stories (height 12.8 m), and the tower section to 30 stories (height 96 m). Table 6 details the specific core spatial parameters corresponding to these three typical baseline models.
Table 6.
Initial model overview.
To quantify the independent and synergistic effects of spatial morphology on the microclimate, we constructed a multi-scenario parameter simulation matrix using the control variable method. Using three previously extracted idealized baseline models and statistically derived threshold ranges for each morphological element, we set gradient changes for three key independent variables: (1) Building density (BD) was set to three gradient levels: 35%, 40%, and 45%. (2) Street aspect ratio (H/W) was set to three levels: 1.6, 2.0, and 2.5 based on empirical thresholds. (3) Street orientation was set to five angles: 15°, 30°, 45°, 60°, and 90°. Orthogonal combinations of these control variables allowed us to perform independent numerical simulations under typical summer and winter scenarios to evaluate the sensitivity of each morphological parameter to latent evapotranspiration (PET).
2.5.2. Parameter Settings
In this study, the horizontal and vertical grid resolution of the simulation’s central region was uniformly set to 5 m × 5 m × 5 m (as listed in Table 4). To eliminate interference from model boundary effects on the flow and radiation fields in the central region, 3 to 5 layers of nested grids were set around the main model. The surface material properties of both the road surface and building facades were assigned values using the standard default database built into ENVI-met V5.03 to represent standard urban infrastructure. Specifically, urban road surfaces were modeled using a baseline albedo of 0.25 and emissivity of 0.90, while building facades used a standard albedo of 0.35 and emissivity of 0.90.
The initial meteorological boundary conditions for the simulation were extracted from observational data from the Qingdao National Standard Climate Observatory, with 8 August 2022 (typical summer) and 18 December 2022 (typical winter) selected as the weather-forced dates. These specific simulated dates were rigorously selected based on the following three criteria as highly representative seasonal dates for Qingdao: (1) Temperature consistency: The daily average temperature on these two dates closely matches the multi-year historical meteorological average for August and December in Qingdao. (2) Maximized radiation: Both dates exhibit stable, cloudless clear skies, maximizing solar radiation intensity and providing the necessary microclimate contrast to separate geometric influences. (3) Monsoon consistency: The prevailing wind direction is completely consistent with the dominant monsoon wind direction in the region. To ensure sufficient thermodynamic spin-up time, the total execution time for each simulation was set to 12 h (7:00 to 19:00).
3. Results
3.1. Analysis of Measured Results
3.1.1. Summer
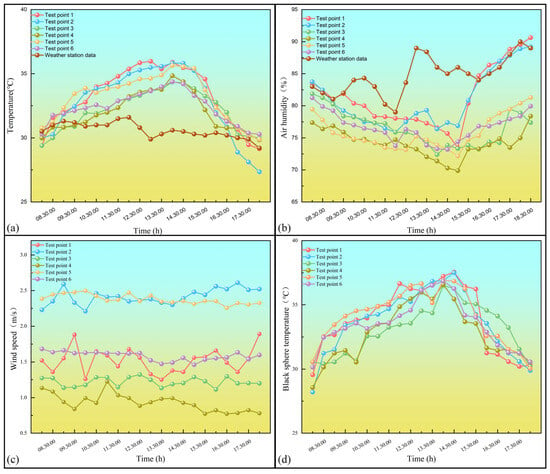
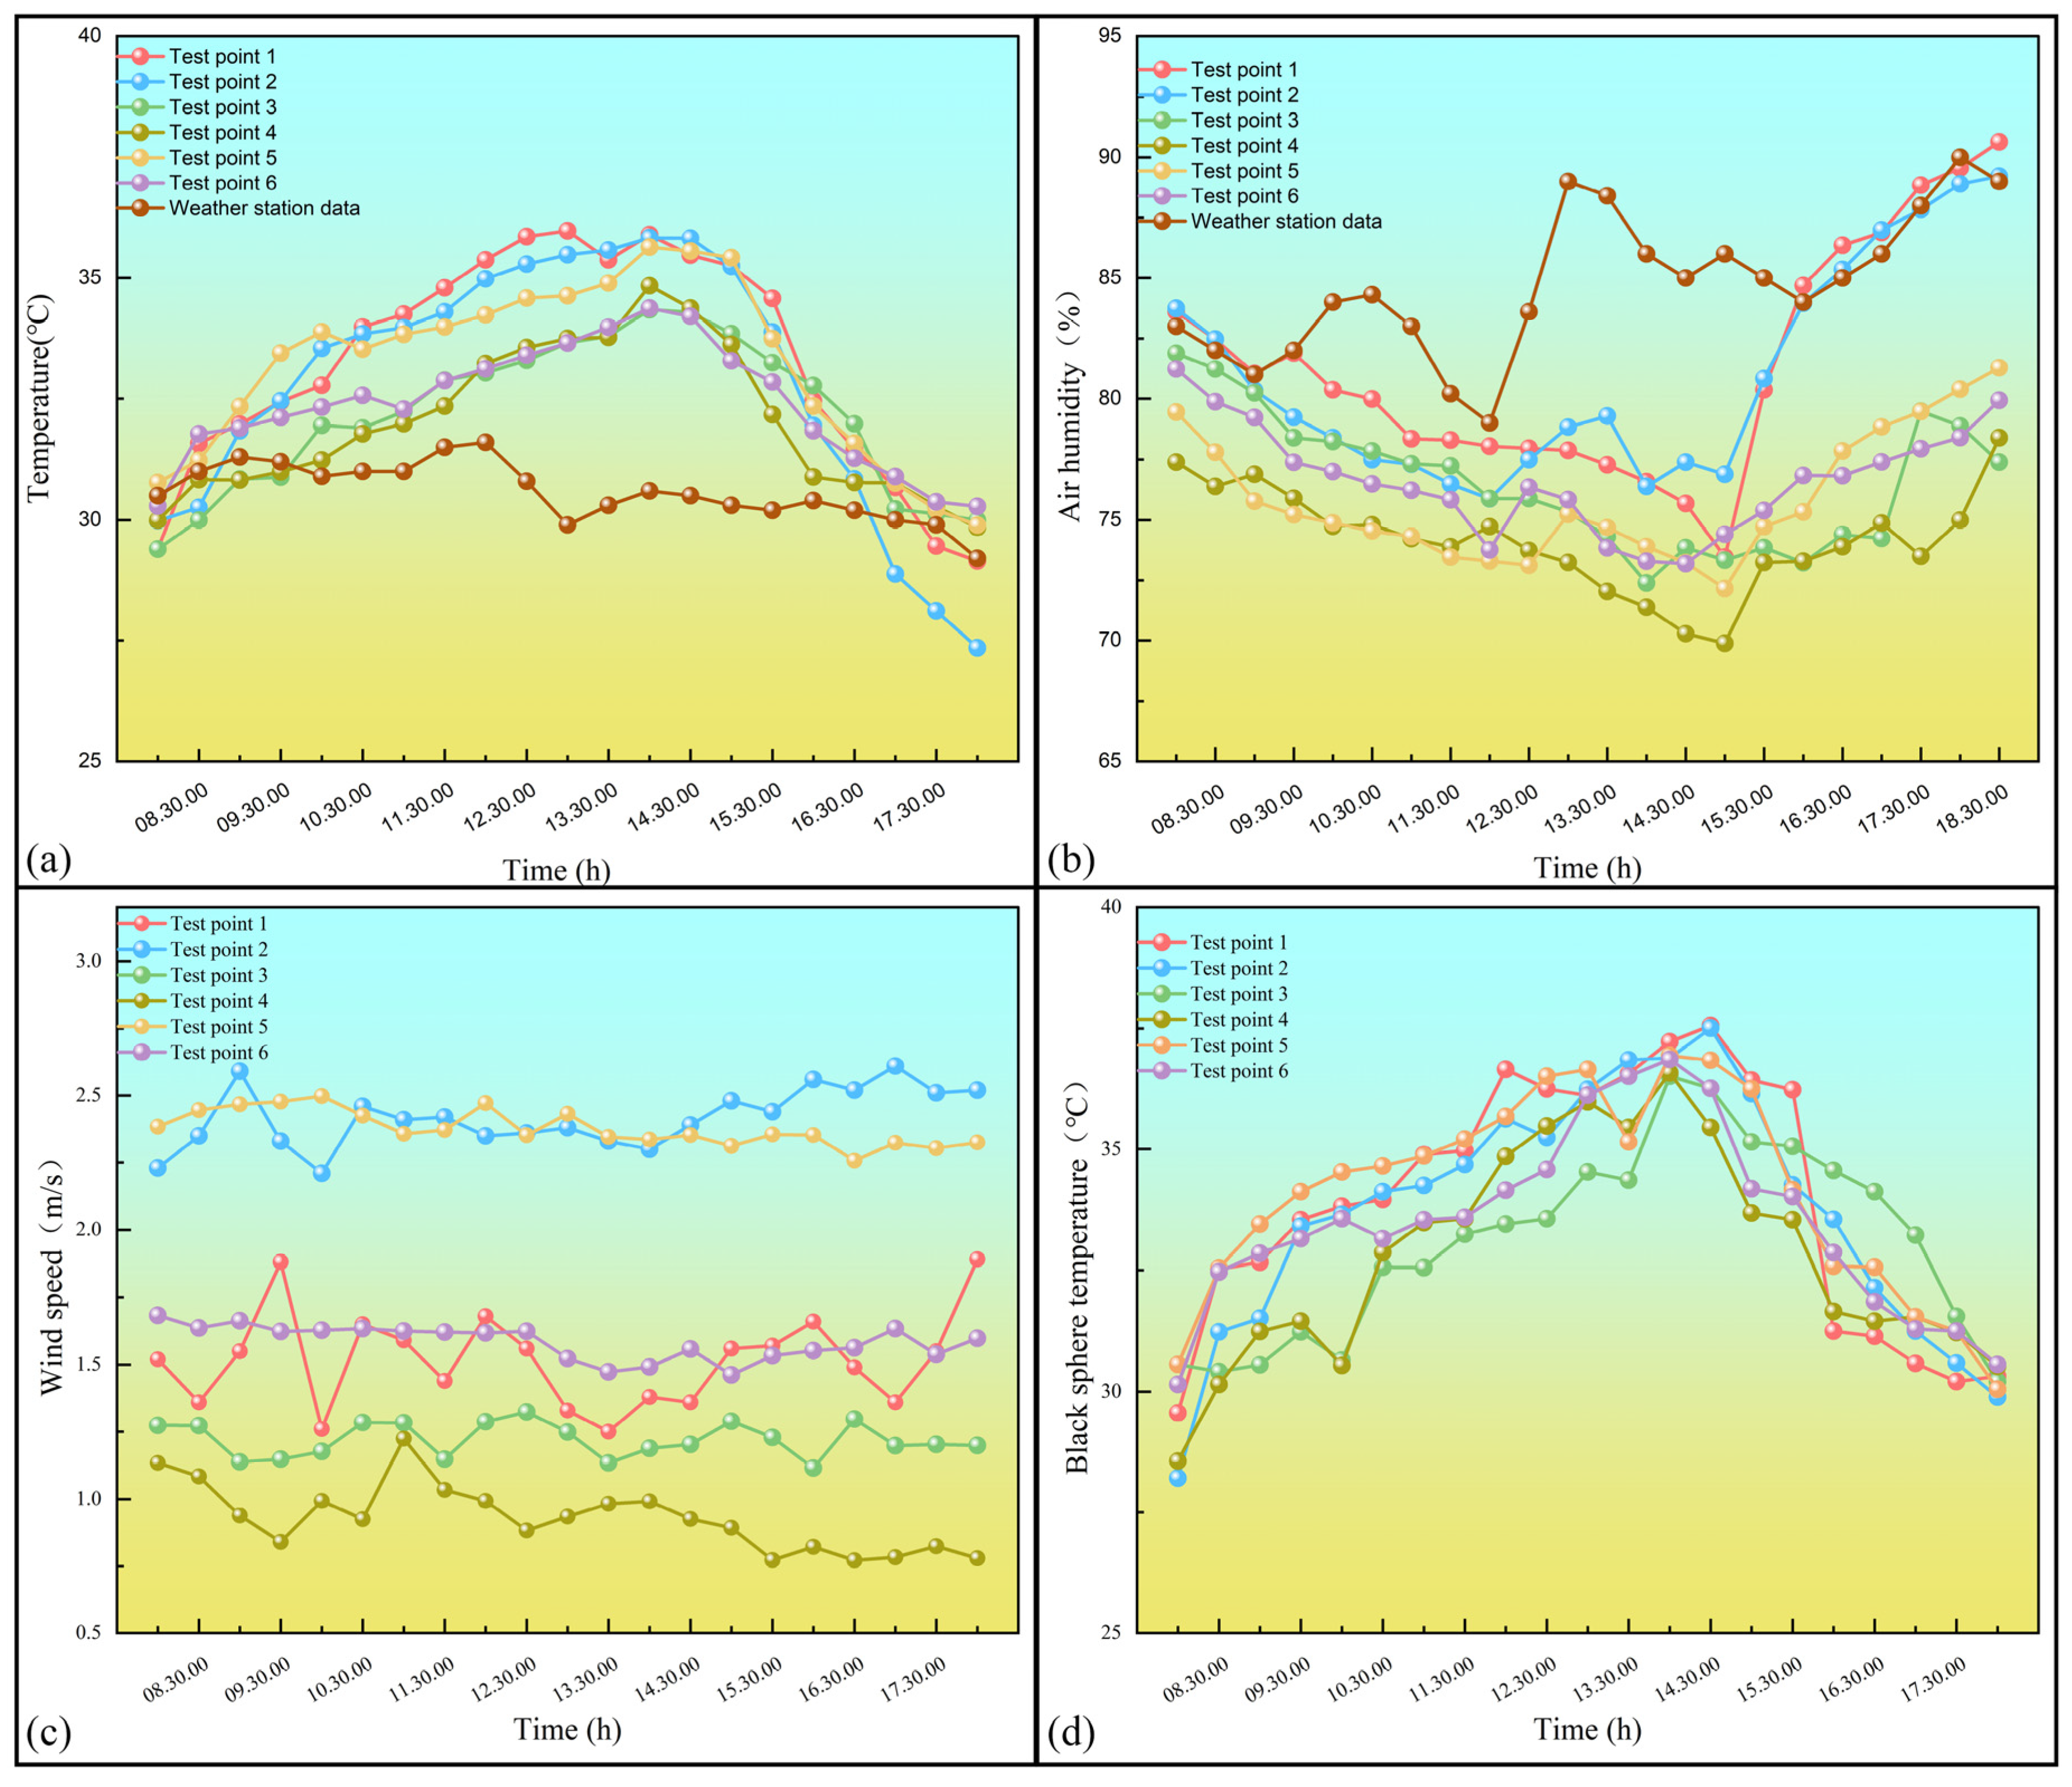
The summer measured data from six typical street locations, including air temperature, air humidity, wind speed, and black sphere temperature, are presented in Figure 5.
Figure 5.
Summer measured data curves: (a) Air temperature (b) Air humidity (c) Wind speed (d) Black sphere temperature.
As shown in the figure, due to differences in microclimate, temperatures vary significantly at different points, with the highest temperature occurring in the plaza space enclosed by tall buildings. In the high-rise area with narrow roads and a large street-to-height ratio (point 3), the temperature is relatively low due to limited direct radiation reception. Although the open plaza at a street corner (point 4) receives more solar radiation, its temperature does not rise significantly thanks to good ventilation. Regarding humidity, the overall trend is that it decreases as temperature increases, but the overall data is lower than the meteorological station data because the Qingdao meteorological station is located at the northern end of Fulong Mountain, where trees are lush in summer, resulting in higher relative humidity than the measured points. For the same reason, the air temperature recorded at the meteorological station is also overall lower than that at the urban measuring points, as illustrated in Figure 5a. Point 2 has the highest wind speed value because it is located in a large enclosed center with greater airflow, while point 4 has the lowest value and is located in an open street plaza with relatively gentle airflow. The black sphere temperature is directly related to solar radiation and is a significant influencing factor. The variation trends of black sphere temperature and air temperature are highly consistent with the daily fluctuation of solar radiation, with all three parameters reaching their peak values during the midday period.
3.1.2. Winter
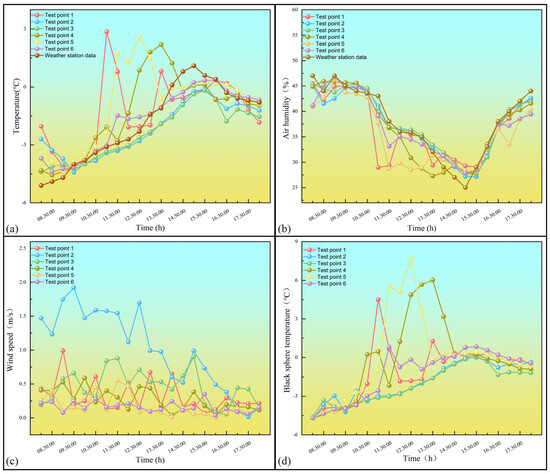
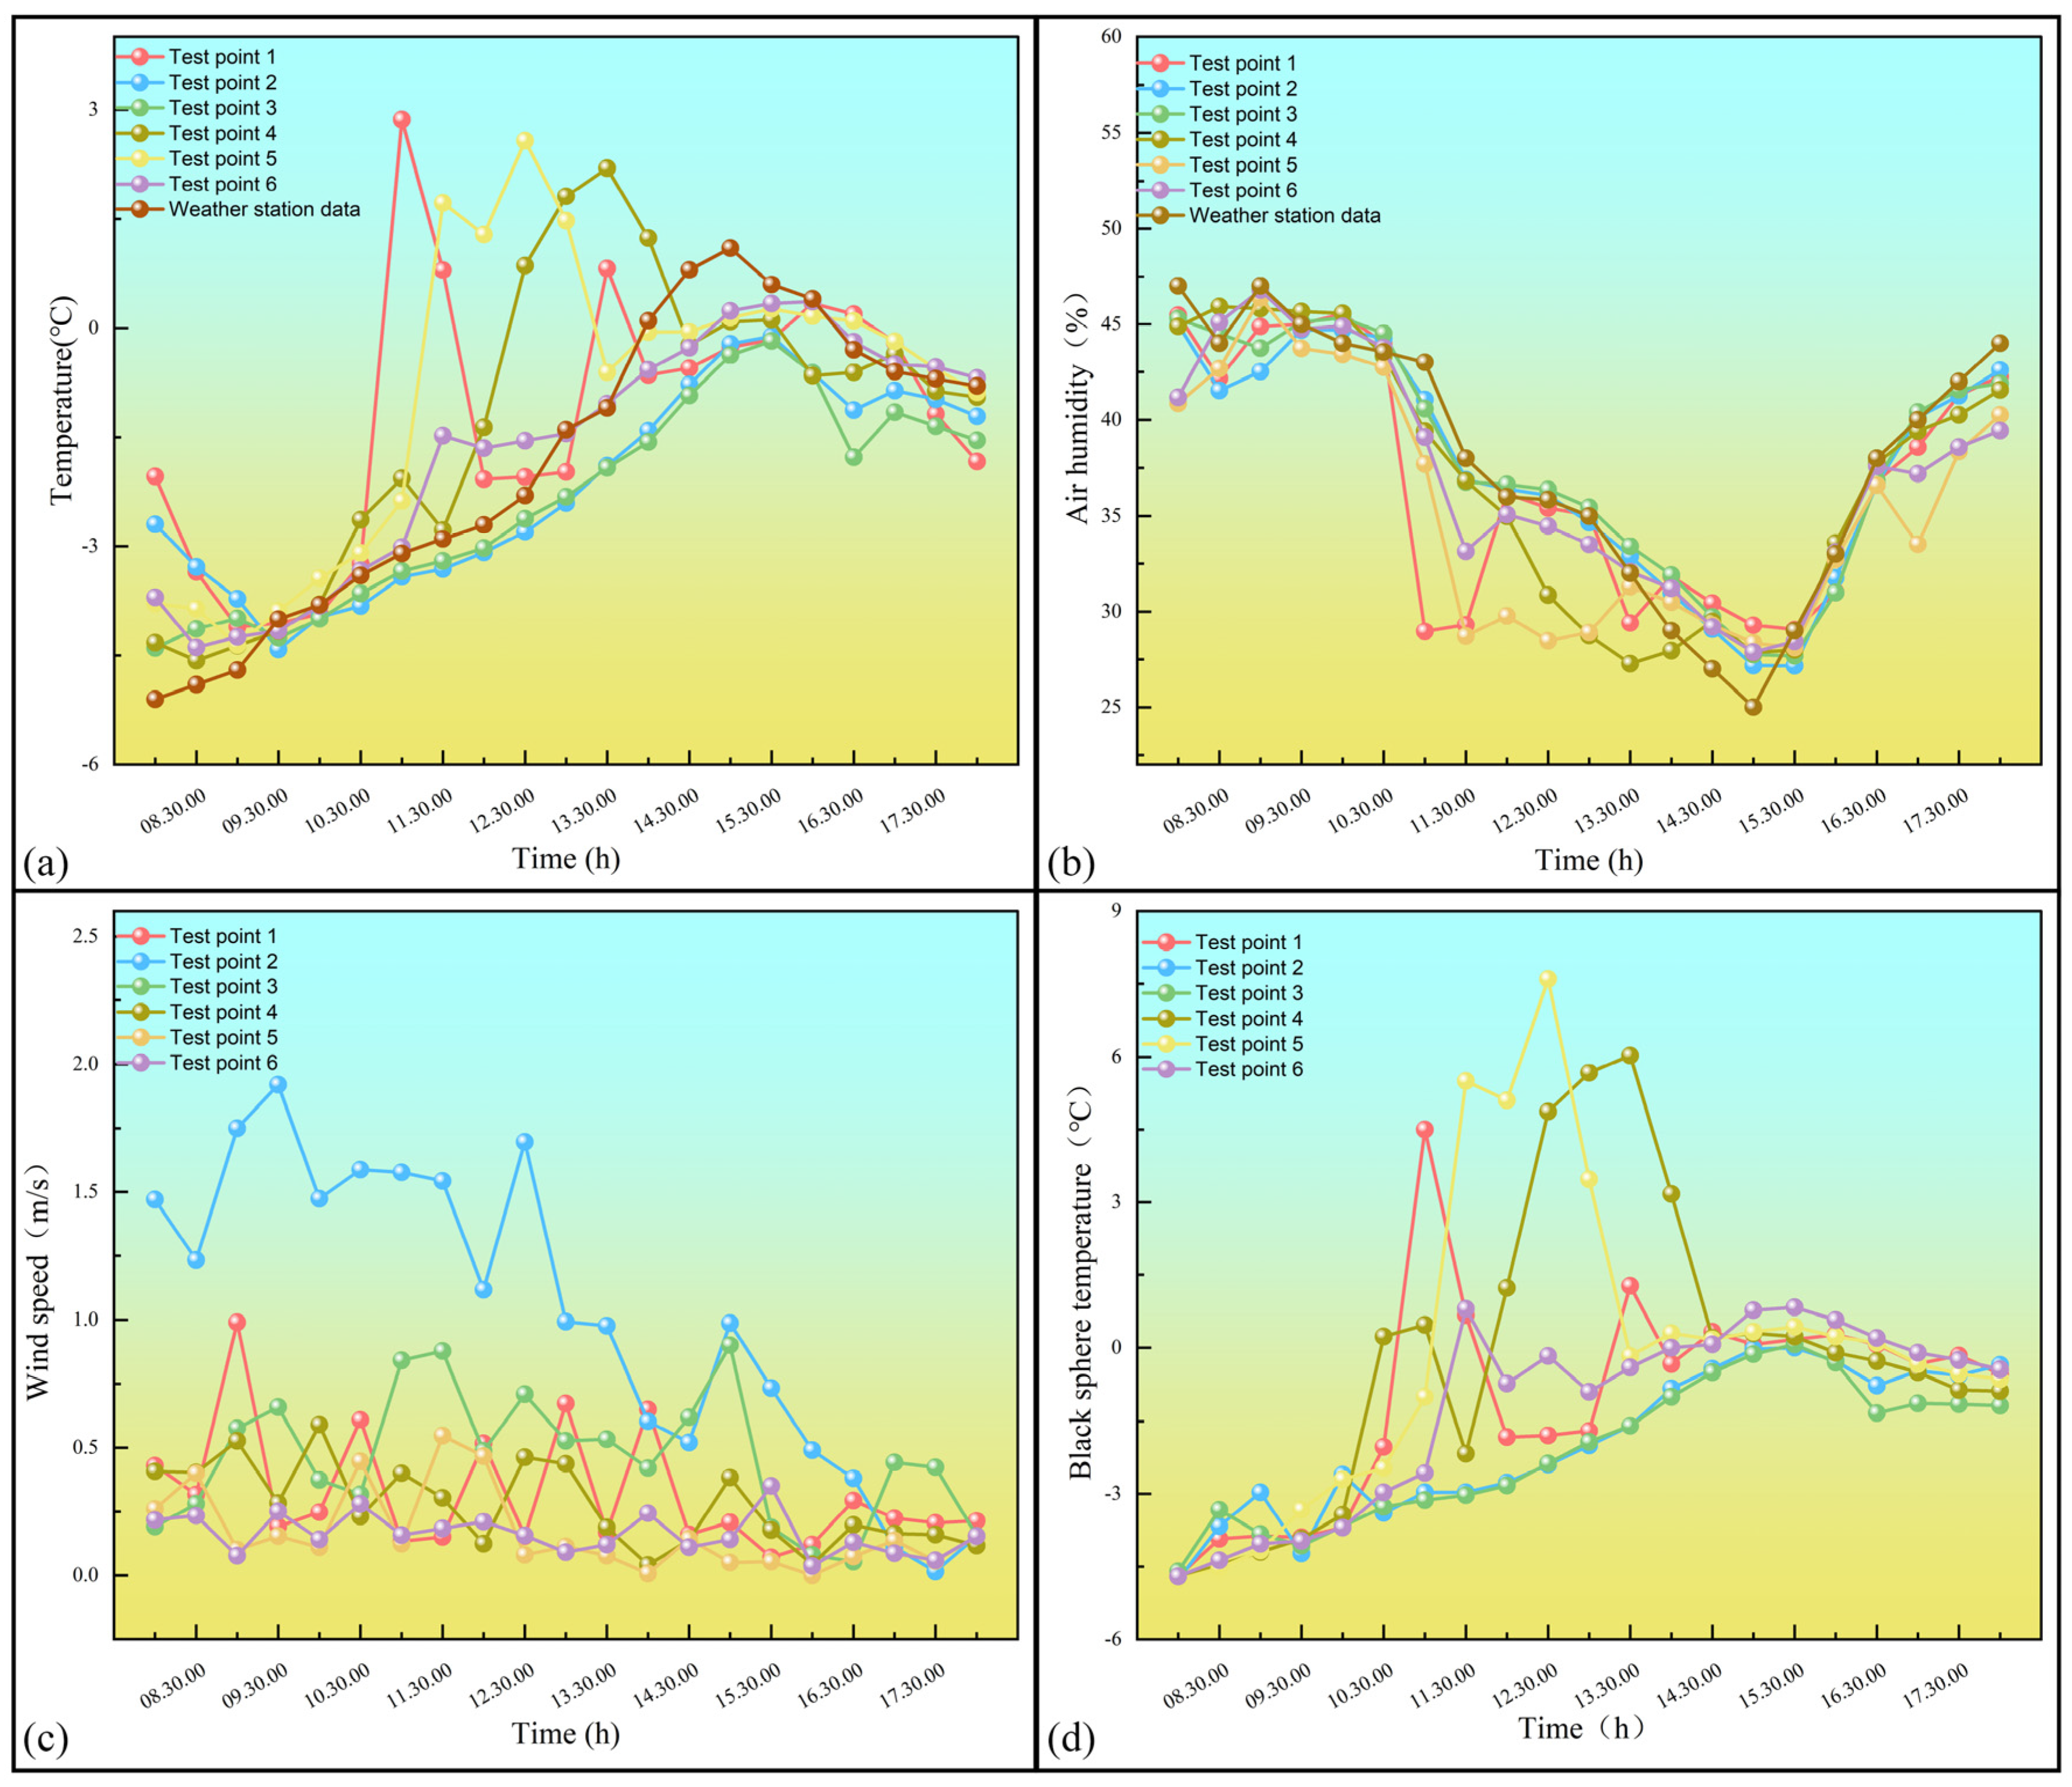
For the winter measurement points, the specific daily variation curves are shown in Figure 6 Measurement point 5 has the highest daily average temperature, while measurement point 3 has the lowest. This is mainly because the significant differences in building heights around these points affect the stability of the local thermal environment. As can be seen from the temperature line graph trend, the continuous change in the sun’s position leads to differences in the intensity of solar radiation received by different measurement points, causing some fluctuations in the data.
Figure 6.
Winter measured data curves: (a) Air temperature (b) Air humidity (c) Wind speed (d) Black sphere temperature.
In the graph, the air humidity trends at all measuring points are generally consistent, indicating low overall humidity and relatively dry air. Regarding wind speed, diurnal variations are more significant during winter. Measuring point 2 is located in a street-level space enclosed by high-rise buildings, resulting in greater airflow. Comparing different spatial layout types, the wind speed in enclosed layouts is generally higher than in point and linear layouts. Under winter conditions, the black sphere temperature at point-layout spatial layouts is generally higher than at measuring points in other spatial layouts. The significant difference between black sphere temperature and air temperature is mainly because black sphere temperature directly reflects the shortwave solar radiation received by the human body and is more affected by solar radiation than air temperature.
3.1.3. PET Value Results Analysis
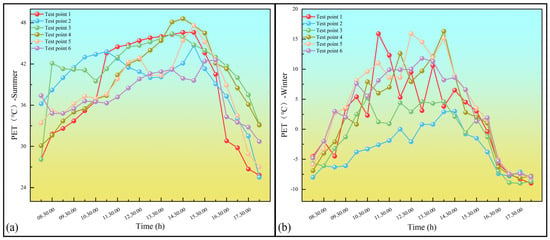
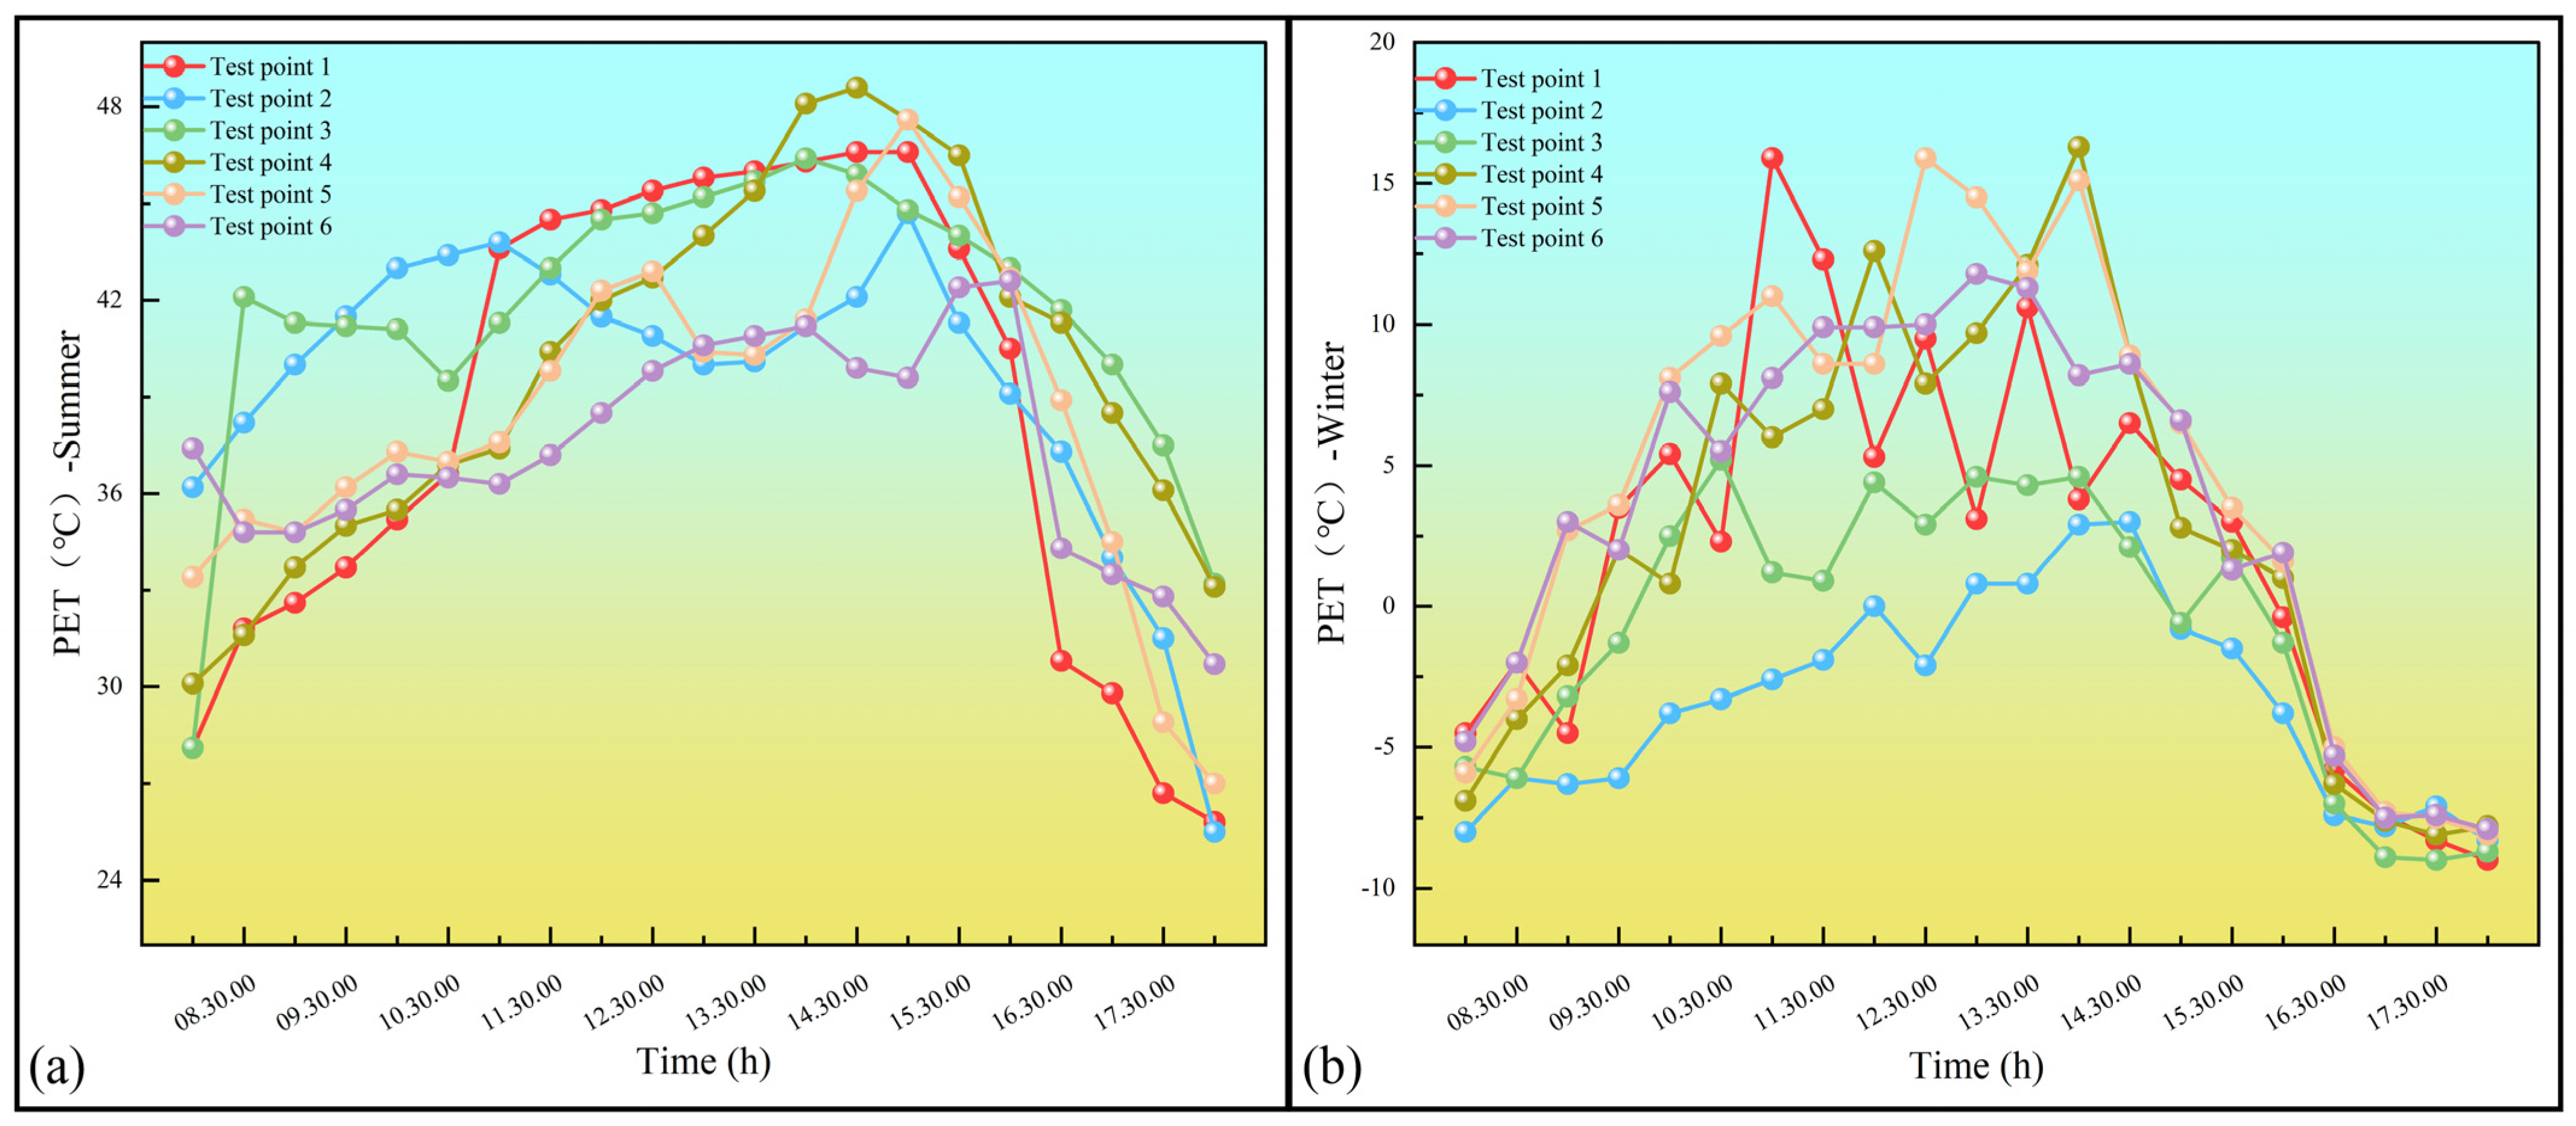
Analysis of the measured results and PET values (Figure 7) reveals differences in microclimate environments caused by different spatial layouts. The specific results can be summarized as follows:
Figure 7.
Actual PET value data curves for summer and winter: (a) Summer (b) Winter.
- In summer, when temperatures are high, there are few comfortable periods for PET values. The comfort level of the three spatial layouts, from highest to lowest, is: enclosed-type > point-type > linear-type.
- In winter, when temperatures are low, the comfort level, from highest to lowest, is: point-type > linear-type > enclosed-type.
- Qingdao experiences significant temperature differences between winter and summer, necessitating a balance between cold protection and heat dissipation.
It must be pointed out that the above-mentioned empirical PET rankings reflect local, instantaneous conditions, limited by a finite sample of measurement points and specific diurnal variation conditions. These field observations are inevitably affected by some uncontrollable realities, such as transient cloud cover, specific daily solar trajectories, and extreme local shading caused by nearby tall buildings (e.g., persistent shadows at point 5). Therefore, the primary use of these field measurements is strictly limited to recording specific microclimate environments and providing basic empirical data for the calibration of the ENVI-met model, rather than establishing universally applicable principles regarding morphological dominance.
To systematically quantify the real-world mechanisms influencing spatial morphology and eliminate interference from the real world, subsequent numerical studies are based on an idealized, standardized benchmark model. Within this controlled simulation framework, this study systematically assesses the varying degrees of impact of key spatial parameters, particularly building density, street aspect ratio, and block orientation. Ultimately, this study focuses on exploring how to synergistically regulate these morphological elements and determine their optimal threshold regions to effectively improve the urban microclimate.
3.2. The Impact of Spatial Morphology on Outdoor Microclimate
This experiment was conducted using a controlled variable approach. For example, when investigating the impact of building density on the outdoor thermal environment, the floor area ratio and street orientation were kept constant. Table 7 presents the simulation conditions for 33 scenarios of the original model under different spatial forms, including building density, street orientation, and street aspect ratio.
Table 7.
Operating condition table.
3.2.1. The Impact of Building Density on High-Density Commercial Districts
Under typical summer and winter meteorological boundary conditions, numerical simulations were systematically conducted for nine different scenarios (labeled A1–A3, B1–B3, and C1–C3, respectively) for three spatial morphologies. Table 8 details the specific average values of relevant microclimate variables for each scenario at pedestrian height (1.5 m above the ground).
Table 8.
Average values of simulation elements for different building densities in winter and summer.
Based on the average parameter analysis results of winter and summer simulations shown in Table 9, the outdoor thermal environment in high-density commercial areas varies significantly with the seasons, and these differences depend on the spatial configuration. In extremely high-temperature scenarios, point tower-type buildings exhibit the best thermal mitigation effect (reducing PET by approximately 10 °C and stabilizing it in the range of 28–31 °C). Particularly at a building density of 45%, this building type achieves the best microclimate improvement effect by maximizing shaded area and maintaining the necessary ventilation ratio (thermal comfort level: point tower type > enclosed type > linear type).
Table 9.
Average values of simulation elements for different working conditions in winter and summer street orientation.
Conversely, under extremely cold winter conditions, the logic of microclimate optimization is completely reversed, with enclosed tower structures becoming the optimal topological form, achieving the highest PET value at a relatively low building density (35%). The core mechanism lies in the significant reduction in shortwave solar radiation shading due to the decrease in building density. Combined with the sunny, covered plazas formed by the enclosed interface, this structure maximizes the acquisition of radiant heat by pedestrians (thermal comfort level: enclosed > point > linear). The comparative analysis above clearly demonstrates that the interplay between spatial form and density is a crucial element in achieving bidirectional seasonal adjustment in coastal urban areas.
3.2.2. The Impact of Street Orientation on High-Density Commercial Districts
According to the analysis results shown in Table 9 changes in building orientation result in significant seasonal differences in outdoor thermal comfort. In summer, enclosed layouts generally exhibit the best thermal comfort (thermal comfort levels: enclosed > point > linear). Influenced by various morphological characteristics, the optimal summer orientation varies considerably depending on the layout. The minimum PET values for point, linear, and enclosed layouts correspond to orientations of 90°, 15°, and 30°, respectively. The PET value at D5 drops to a relatively comfortable 30 °C, which is primarily driven by the superior ventilation performance of this specific configuration. Among the five simulated cases for the point-tower layout, the 90° block orientation yields the highest local wind speed (WS). This enhanced air circulation significantly promotes convective heat dissipation from the human body, thereby effectively mitigating summer thermal stress and resulting in a markedly lower PET value.
However, under winter conditions, microclimate effectiveness reverses significantly, with strip layouts taking precedence due to their ability to maintain higher PET values (comfort ranking: strip > point > enclosed). Simultaneously, the optimal orientation shifts in winter: both point and strip layouts exhibit the best thermal insulation performance at a 30° orientation, while the enclosed layout performs best at a 90° orientation. These results indicate that the optimal orientation for high-density urban blocks is not a single constant but highly dependent on their inherent topological structure and seasonal climatic requirements.
3.2.3. The Impact of Street Block Height-to-Width Ratio on High-Density Commercial Streets
Table 10 shows the results of multifactor simulation analysis for both winter and summer. The synergistic effect of spatial topology and street height-to-width ratio (H/W) has a decisive impact on the changes in the street microclimate. From the perspective of form selection, the point-type + tower-type layout shows the best microclimate adjustment potential throughout the year (the ranking of thermal comfort is consistently point-type > enclosed type > linear type). Its physical properties are as follows: In summer, this form shows the most significant air-cooling effect (overall temperature < 30 °C), and in winter, the temperature difference between different forms converges to a very small range of 0.2 °C. Furthermore, influenced by the induction mechanism of high-rise buildings, street wind speeds in both seasons show a positive acceleration trend with increasing height-to-width ratio.
Table 10.
Average values of simulated elements for different working conditions of street block height-to-width ratio in winter and summer.
Evaluation using the core index (PET) revealed significant seasonal differences in the requirements for microclimate optimization based on aspect ratio. In summer, deep valley-shaped streets (aspect ratio approximately 2.5) provide the greatest shading effect and effectively mitigate thermal stress, while in winter, relatively open streets (aspect ratio approximately 1.6) are needed to balance cold protection with natural lighting. This study supports the idea that exploring dynamic equilibrium thresholds for aspect ratios 1.6–2.5 using point tower structures as the core topology matrix is an important approach for optimizing the year-round thermal environment of high-density coastal commercial districts.
4. Discussion
4.1. Synthesized Mechanisms and Seasonal Conflicts
The results of this study indicate that the microclimate advantages of specific spatial morphologies are not driven by isolated variables, but rather by a combination of dual mechanisms. For example, the optimal summer performance of a point-tower building complex with a density of 45%, a deep canyon profile (height-to-width ratio of approximately 2.5), and an orientation of 15–30° is not simply a matter of “shading and ventilation.” From an aerodynamic perspective, alignment with the prevailing southeasterly winds in summer creates a “wind tunnel effect,” while the spatial porosity of the point-tower buildings allows sea breezes to effectively remove accumulated sensible heat [28,29]. From a thermodynamic perspective, the deep canyon significantly reduces the sky visibility factor (SVF), traps high-angle solar radiation, and substantially reduces the mean radiative temperature (Tmrt) within the pedestrian layer [17,30]. These factors together constitute a synergistic “ventilation infiltration-radiation reduction” cooling mechanism. Conversely, optimal winter performance relies on an “aerodynamic shading-radiation trapping” mechanism. The low-density (35%) enclosed tower structure, combined with a more open streetscape (height-to-width ratio of approximately 1.6), moderately enhances the vertical angle of incidence (SVF), thereby capturing low-angle winter sunlight [31,32]. At the same time, the continuous building facade acts as a huge physical windbreak, increasing aerodynamic surface roughness and buffering the harsh northwest winds, thus creating a sheltered and warm microclimate [18].
This inherent seasonal conflict fundamentally distinguishes it from existing literature. While many previous studies [7] have emphasized that deep street canyons and low vertical visibility (SVF) generally contribute to mitigating summer heat stress, this study shows that the optimal morphology for a single season is not equivalent to the optimal morphology for the entire year [11,33]. We quantitatively highlight a critical goal conflict: the morphological requirements for summer cooling (deep canyons, wind channeling) directly contradict those needed to capture solar radiation and buffer cold monsoons in winter (open spaces, wind shielding) [31]. Therefore, urban design in such climates cannot rely on extreme static thresholds, but must seek a dynamic morphological equilibrium [12].
Crucially, the mechanisms and morphological thresholds identified in this study are strictly bounded by specific geographic and meteorological conditions. These conclusions are explicitly tailored for high-density commercial blocks in northern coastal cities, which are characterized by pronounced monsoon shifts, severe winter cold-wind pressure, and distinct land–sea thermal breezes. Consequently, these morphological strategies should not be directly extrapolated to humid-subtropical coastal cities (e.g., Guangzhou or Shenzhen), where winter cold mitigation is negligible and high humidity dominates thermal perception [34,35], nor are they applicable to inland hot-arid cities that experience intense radiative heating without the moderating influence of summer sea breezes [36,37].
To systematically analyze these dual-mechanism coupling relationships, this study proposes a “seasonal target conflict matrix”. Based on established microclimate thermodynamics, variations in potential evapotranspiration (PET) are primarily driven by wind speed and mean radiant temperature. By cross-referencing simulated PET results with plot geometry (e.g., shading effect and spatial porosity), morphological parameters can be clearly categorized into two types: contradictory and compatible.
As shown in Table 11, geometric variables such as building density and aspect ratio (H/W) are inherently contradictory parameters. For example, maximizing summer shade requires deep valley terrain, which directly conflicts with the need for open spaces in winter to absorb solar radiation. Conversely, street orientation is a rare compatible parameter. An orientation of 15° to 30° cleverly resolves this conflict: it utilizes summer sea breezes for cooling while effectively blocking prevailing winter monsoons. Recognizing this matrix of conflicts, urban design paradigms shift from seeking universally “optimal” static geometries to strategically balancing these inherent seasonal trade-offs.
Table 11.
Seasonal microclimate target conflict matrix and built environment strategies.
Building upon these fundamental mechanisms and boundaries, the subsequent section details the specific microclimatic optimization strategies for these core morphological parameters.
4.2. Microclimate Optimization Strategies for High-Density Coastal Blocks
To address the unique climate of coastal cities heavily influenced by the northern monsoon, this section details a series of spatial morphology optimization strategies. The fundamental objective of these strategies is to harmonize seasonal trade-offs, specifically, to balance the needs of “ventilation and shade” in summer with the needs of “wind protection and insulation” in winter.
- Optimization Strategies for Building Density
Building density directly affects the proportion of open space in streets and the sun-shading effect of buildings, and its impact on the microclimate in summer is far greater than in winter. This study confirmed that a building density of 35% to 45% is optimal for maintaining a comfortable thermal environment throughout the year.
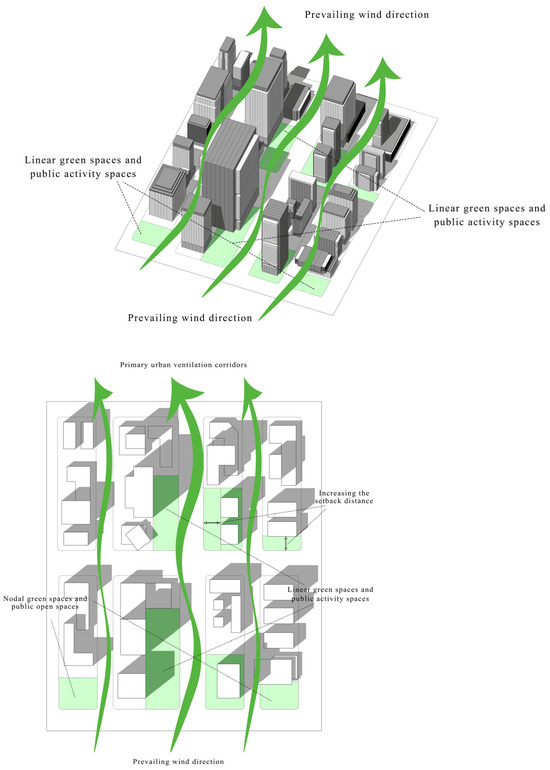
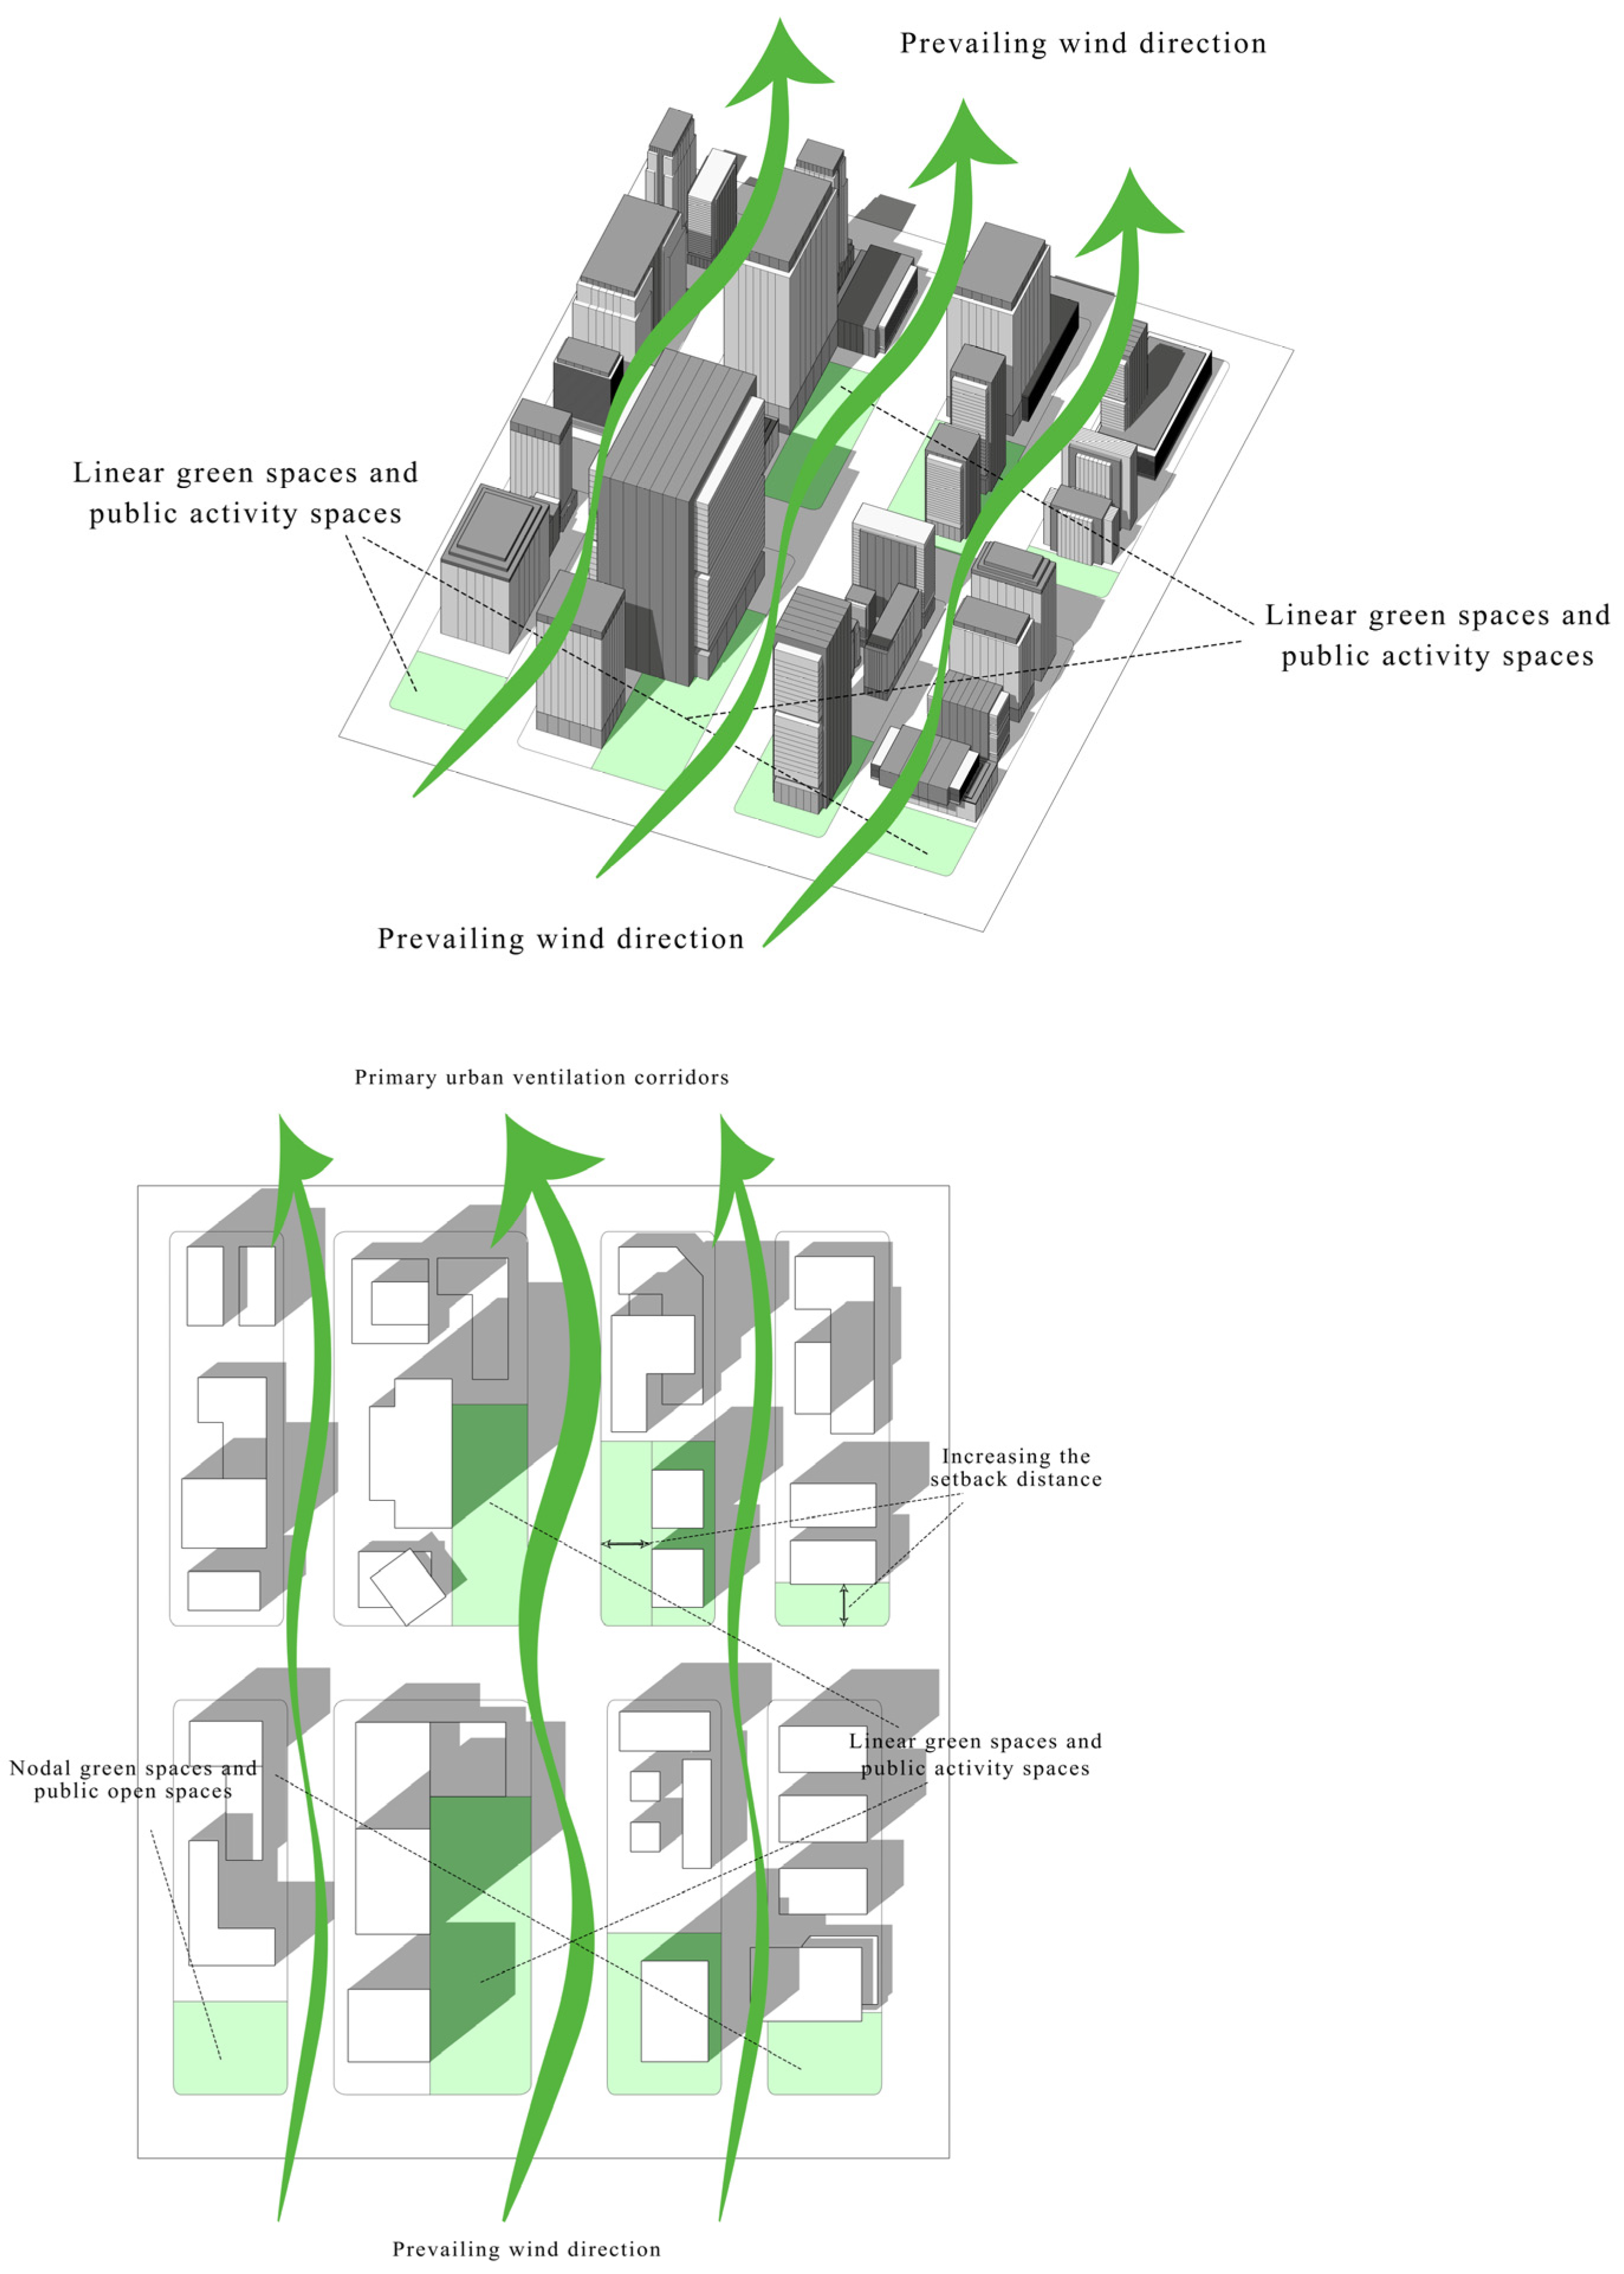
In terms of spatial form optimization, the combination of “bottom-level enclosed podium + high-rise point tower” should be actively promoted (Figure 8). In the pedestrian floor (podium floor), an enclosed layout is adopted, and the continuous building interface forms a wind barrier to effectively block the fierce northwest wind in winter [38]. The upper part adopts a staggered layout of point towers, which retains the necessary ventilation gaps, which is conducive to the sinking and penetration of the southeast sea wind in summer [39].
Figure 8.
Optimization Strategies for Building Density.
In actual urban planning and design, the urban heat island effect at night in high-density environments can be effectively mitigated by increasing the setback distance of buildings, providing auxiliary ventilation passages, and incorporating central green spaces and public leisure areas [40].
- 2.
- Optimization Strategies for Block Orientation
The orientation of a region influences the distribution of sunshine hours and the trajectory of surface air currents, thereby determining the region’s radiation balance and heat dissipation efficiency.
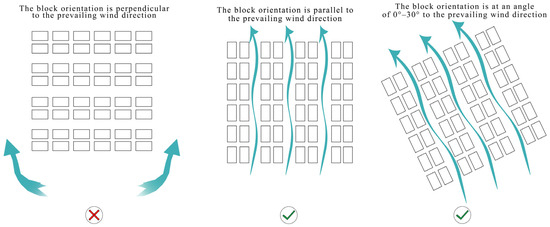
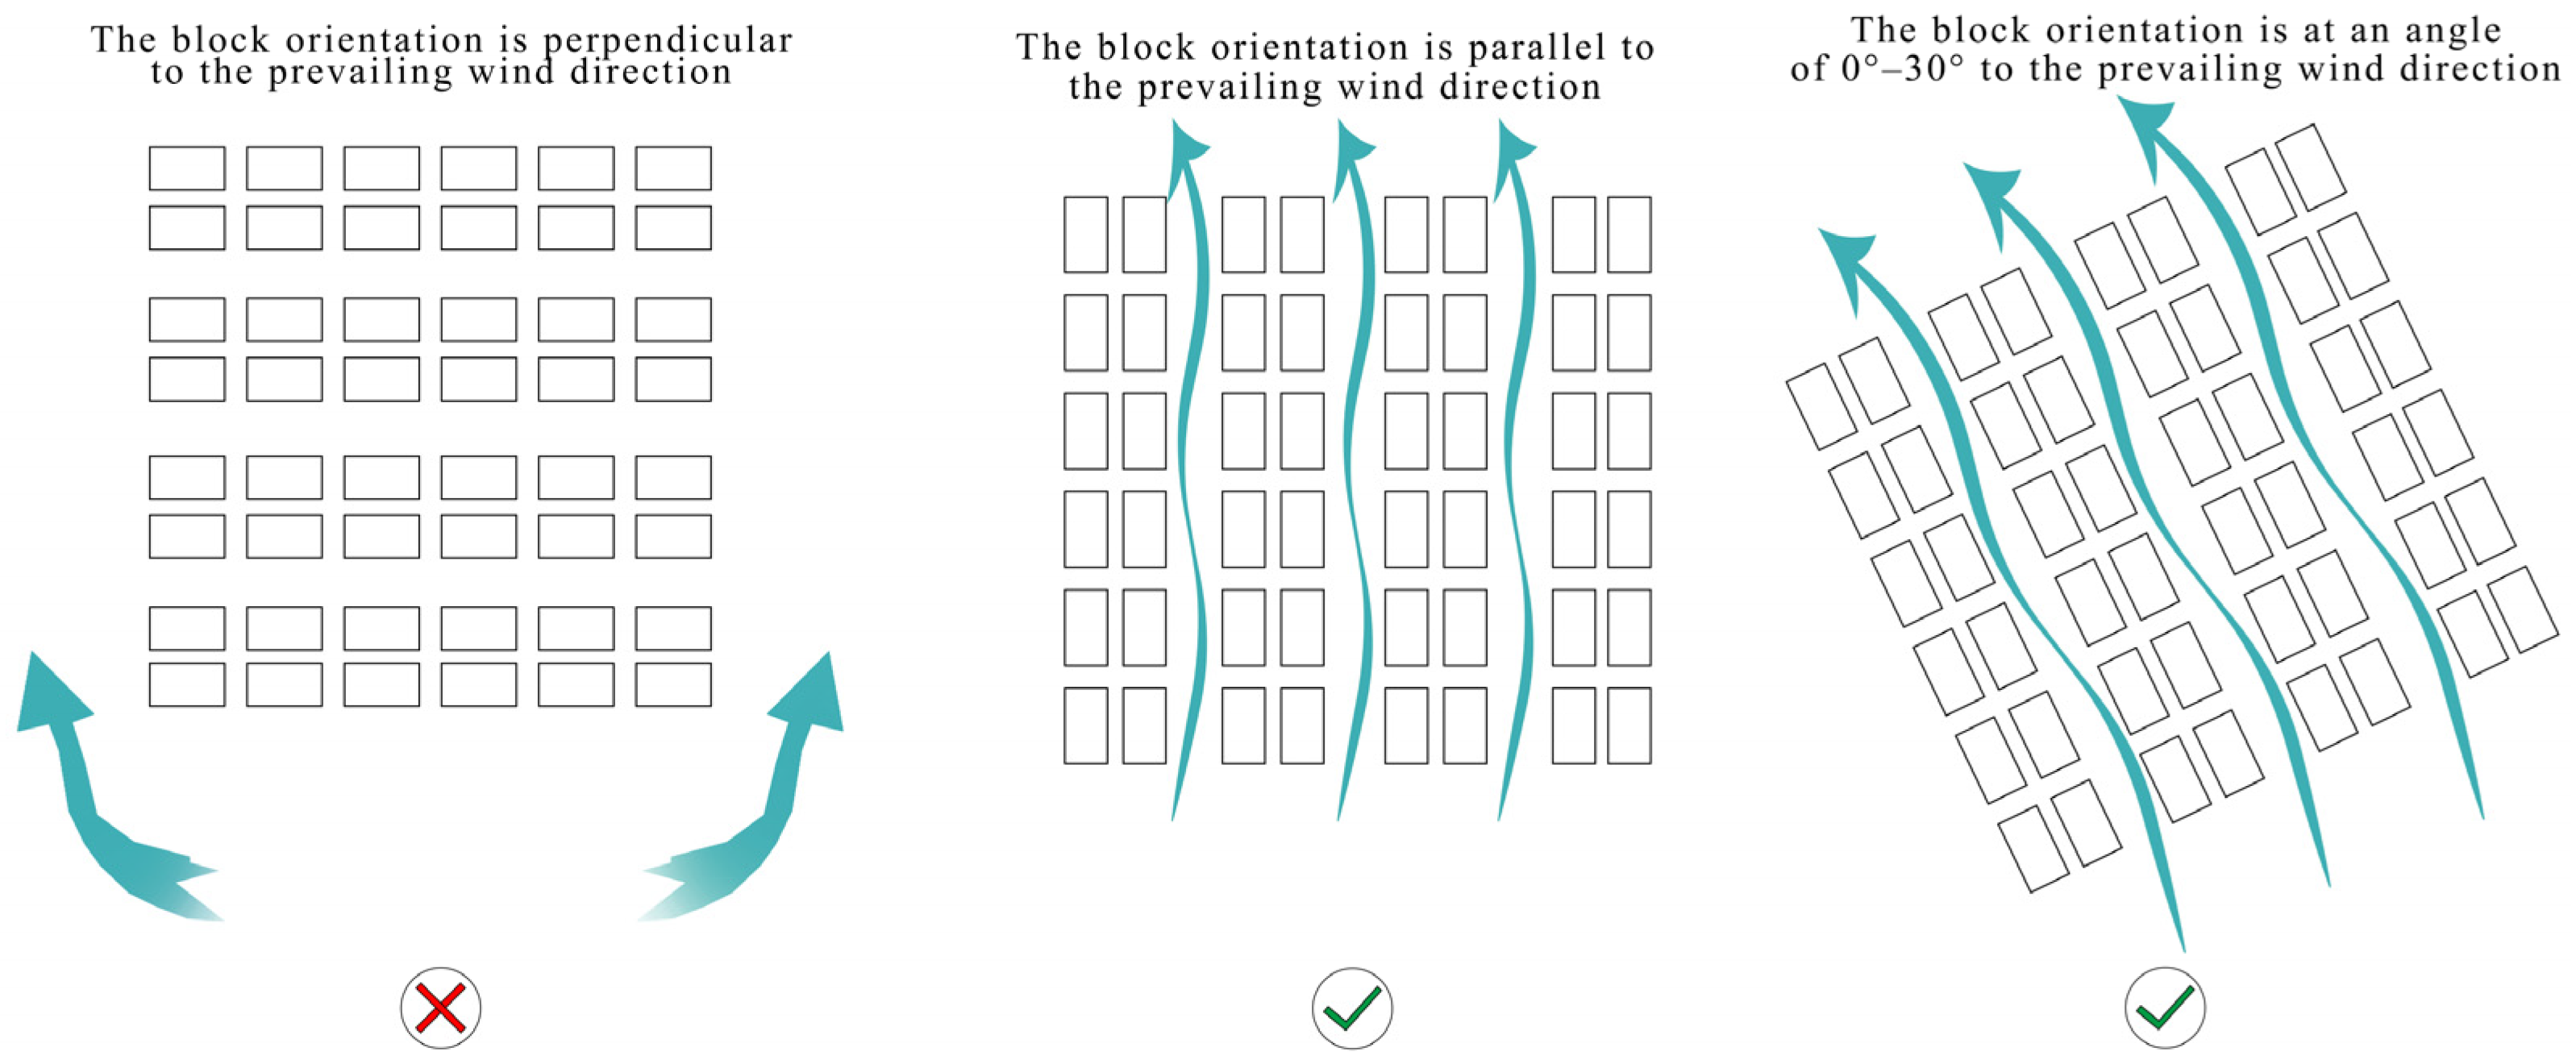
Optimal orientation established: Simulations confirm that 15–30° (southeast) is the key angle for balancing the optimal microclimate requirements of winter and summer (Figure 9). In summer, this orientation forms a small angle with the prevailing southeasterly winds in Qingdao, which can induce a significant “wind channeling effect,” accelerating the dissipation of heat and pollutants; while in winter, it intersects with the northwesterly monsoon at a large angle, forming an effective physical windbreak.
Figure 9.
Optimization Strategies for Block Orientation (the red cross indicates “not recommended” and green checkmarks indicate “recommended”).
Placement Principles: In the planning and design framework, priority should be given to the southwest-northeast (SW-NE) direction, or strictly the north–south (N-S) direction. At the same time, to mitigate the strong effects of low-angle sunlight in summer, east–west (E-W) oriented block designs should be strictly avoided.
- 3.
- Optimization Strategies for Street Aspect Ratio (H/W)
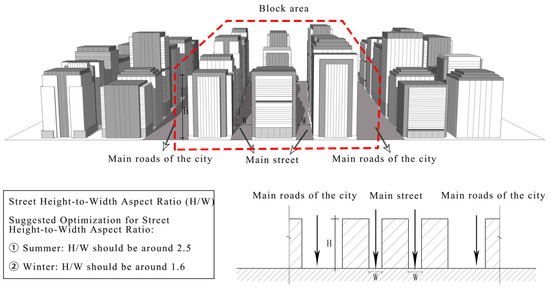
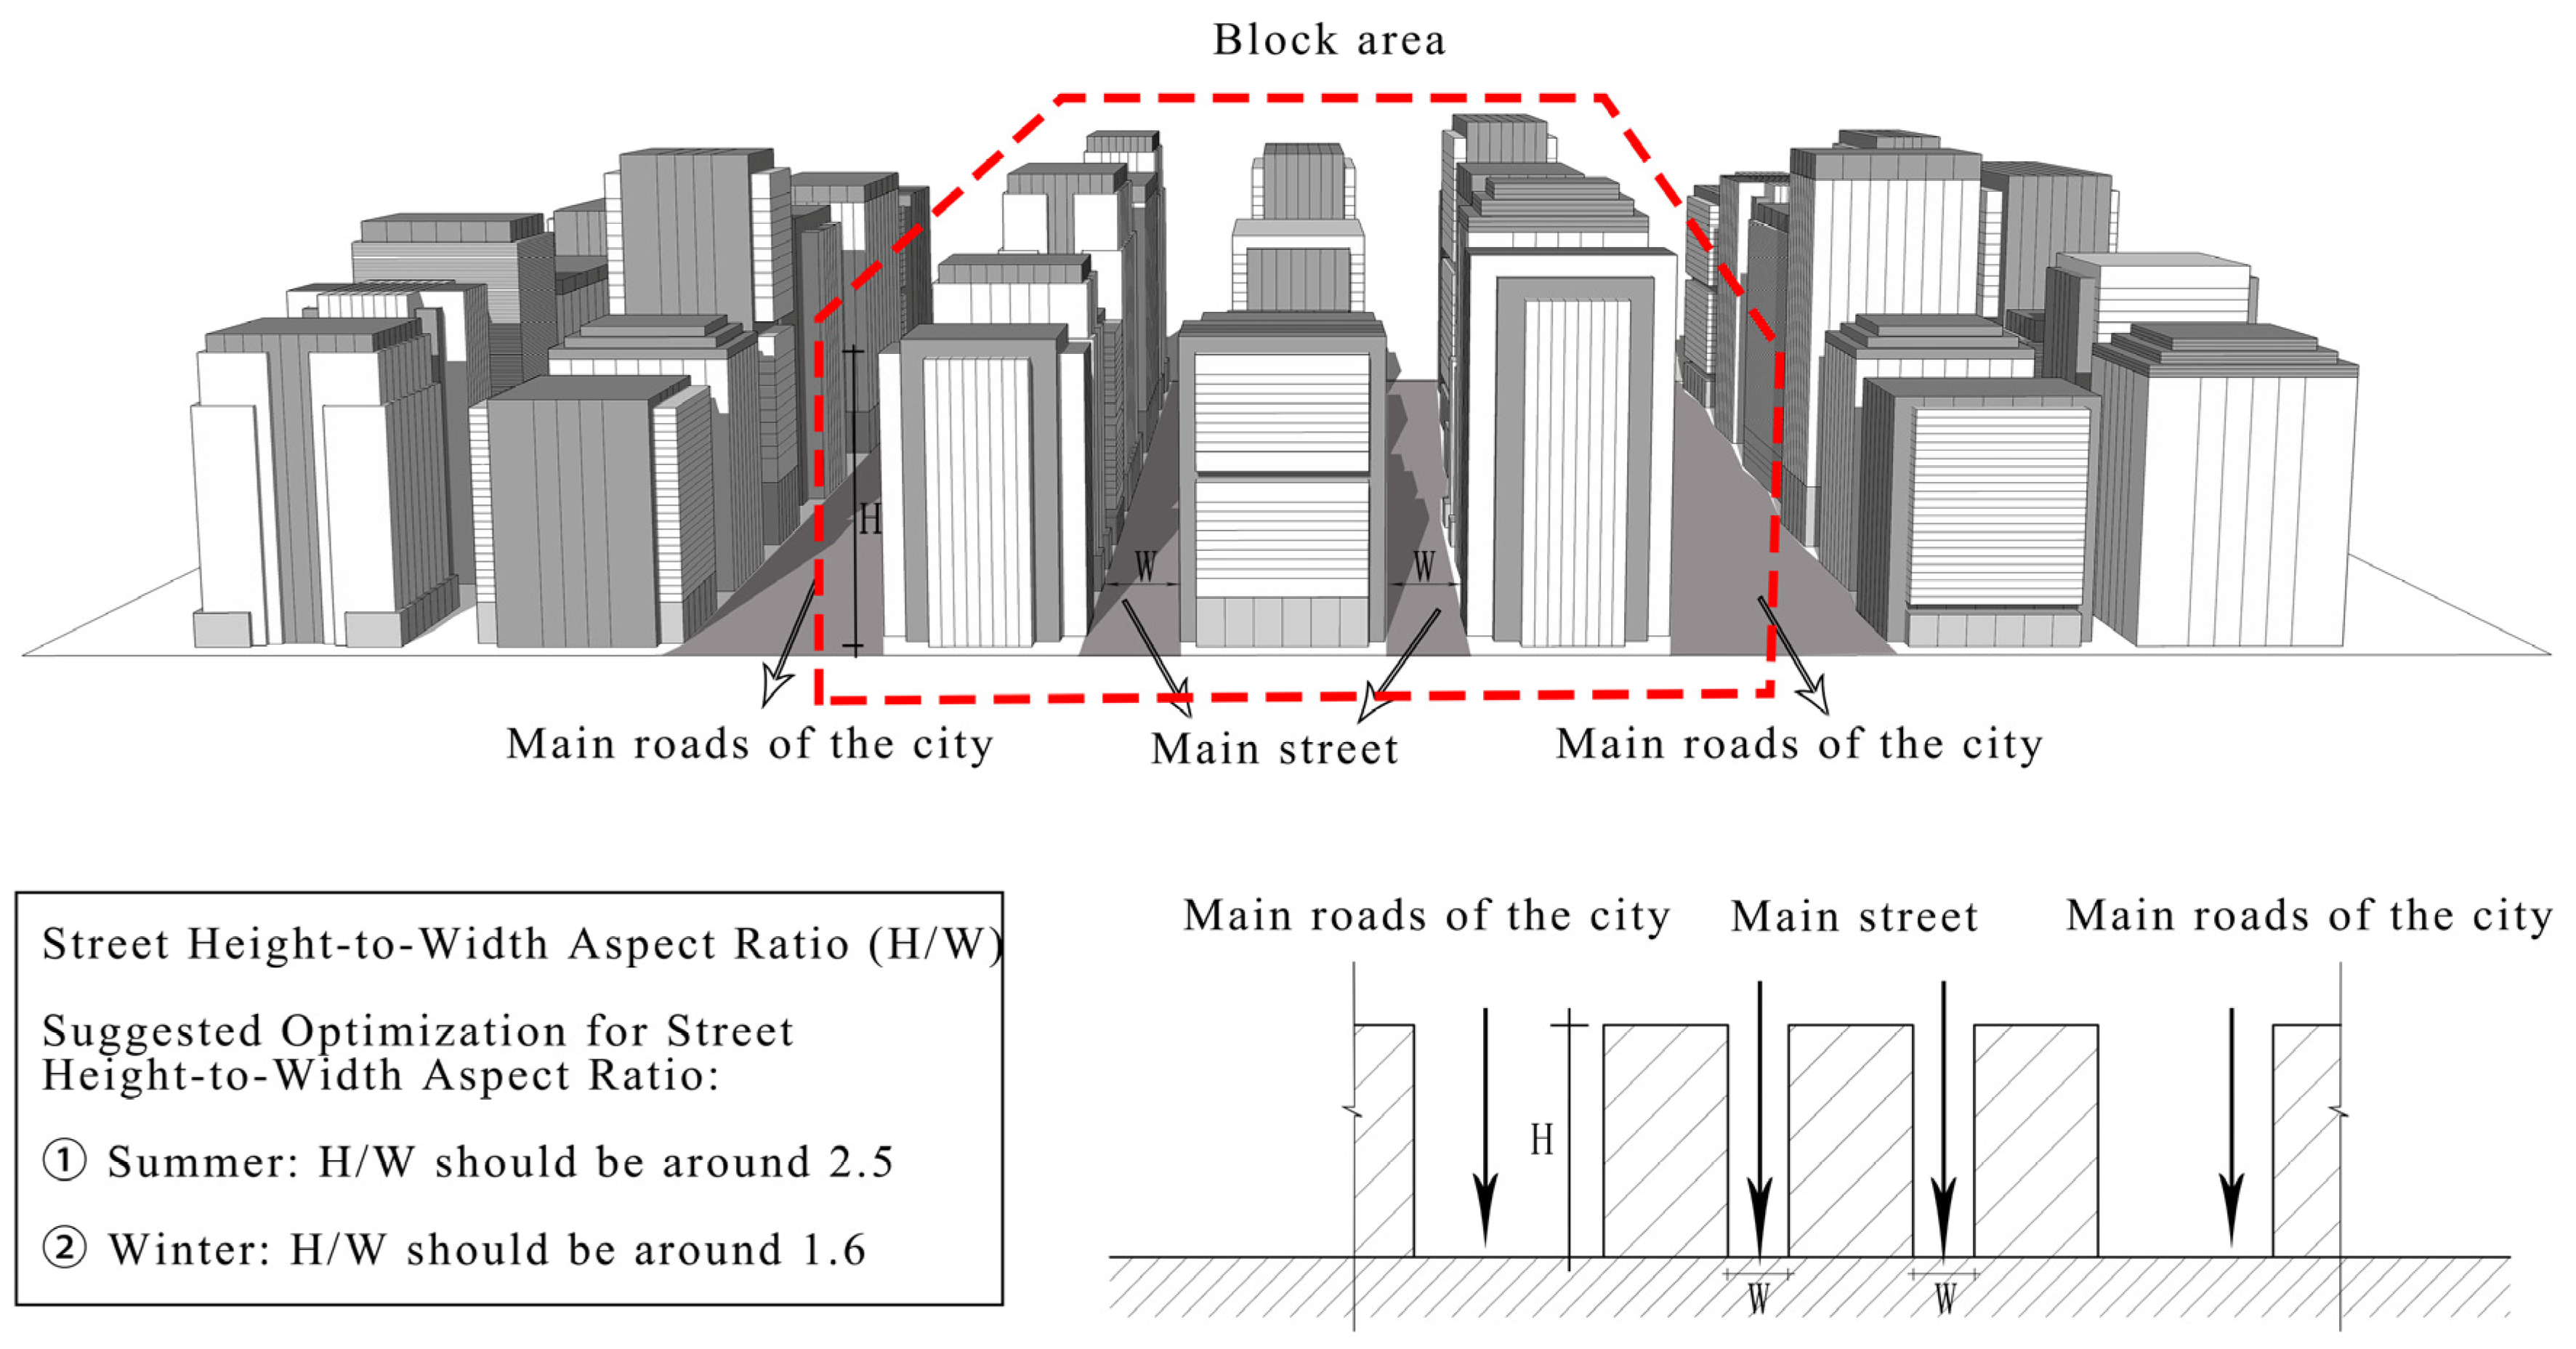
Analysis indicates that the ideal street shape for main streets in summer is a deep-valley shape (height-to-width ratio of approximately 2.5). This shape utilizes the broad shadows created by the deep valleys to intercept shortwave solar radiation, thereby reducing the PET value. Conversely, a relatively open street shape (height-to-width ratio of approximately 1.6) is needed in winter to promote the penetration of low-angle sunlight and effectively enhance heat absorption in the street space. To achieve optimal thermal comfort throughout the year, it is strongly recommended to maintain the height-to-width ratio of core blocks within a dynamic equilibrium range of 1.6 to 2.5.
For major roads, the visibility factor (SVF) can be improved by widening the roads or lowering the height of buildings. Such spatial interventions ensure ventilation capacity in street canyons and effectively mitigate heat buildup (Figure 10). Conversely, for secondary roads and pedestrian canyons, the height-to-width ratio can be appropriately increased. Morphological interventions such as stepped terraces can significantly improve shading and create a very comfortable pedestrian micro-environment [41].
Figure 10.
Optimization Strategies for Street Aspect Ratio (H/W).
5. Conclusions
This study, using Qingdao as an example, assessed the microclimate adaptability of a high-density commercial area in a northern monsoon coastal city. By integrating field measurement data and ENVI-met simulation results, we systematically quantified the mechanism by which spatial morphology regulates outdoor thermal comfort (PET) in different seasons. Crucially, this study advances the theoretical framework by decoupling the coastal aerodynamic environment into a three-layer superimposed model (macro-monsoon, meso-sea–land breeze, and micro-urban heat island circulation). This method effectively bridges the theoretical gap in bidirectional microclimate regulation—reconciling the inherent conflict between “winter insulation and summer ventilation induction”—while establishing a universally reproducible methodological framework (survey → clustering → baseline modeling → bi-seasonal simulation).
Research has confirmed that a single spatial configuration cannot meet the distinctly different microclimatic requirements of Qingdao’s winter and summer. In summer, a “point-and-tower” configuration with a density of 45% is most effective in mitigating heat stress by balancing efficient sun protection with sea breeze penetration. In winter, a “closed-type + tower” configuration with a density of 35% effectively blocks cold northwesterly winds and increases shortwave radiation. To comprehensively address the needs of both seasons, it is recommended that actual development adopt a complex spatial topology layout of “ bottom-level enclosed podium + high-rise point tower”.
Addressing the inherent morphological conflict between the requisite deep-canyon profiles (H/W ≈ 2.5) summer and the relatively open street configurations (H/W ≈ 1.6) for winter, this research reveals that a single, static aspect ratio cannot perfectly satisfy year-round thermal demands. Consequently, it is highly advised that the aspect ratio of coastal high-density commercial blocks be dynamically regulated between 1.6 and 2.5. Planners should adopt differentiated design strategies—such as applying higher ratios to secondary pedestrian canyons to enhance summer shading, while maintaining lower ratios on primary avenues to secure winter solar access—thus avoiding extreme ‘street canyon effects’ while reconciling seasonal microclimatic contradictions.
In Qingdao, a minimum orientation of 15° to 30° (southeast) has been designated as a mandatory reference direction for newly constructed coastal commercial districts. In summer, this creates a “wind tunnel effect” along the path of the southeast monsoon, promoting ventilation within the district. In winter, it intersects with the prevailing cold northwest winds at a large angle, creating an effective physical windbreak.
Crucially, the general applicability of the research findings must be clearly defined. The specific optimization strategies derived in this study—such as the optimal orientation of 15–30° and the dynamic adjustment of the aspect ratio between 1.6 and 2.5—were formulated based on Qingdao’s unique geographical and meteorological conditions. Rather than universal laws, these values should be interpreted as localized engineering references strictly applicable to similar northern monsoon coastal cities (e.g., Dalian, Weihai, and Yantai). However, the primary contribution of this research transcends these specific localized parameters; it lies in the comprehensive methodological framework developed. This systematic evaluation protocol can be readily replicated and applied to extract localized morphological thresholds in other distinct climatic zones.
Although this study proposes a clear morphological threshold, there are still some methodological limitations in the numerical simulation scheme. First, although the thermodynamic variables have been successfully calibrated, the wind speed has not been clearly verified because it is difficult to reconcile the highly localized instantaneous empirical readings with the grid-averaged aerodynamic output of ENVI-met. This introduces some uncertainty into the absolute potential evapotranspiration (PET) value [25], but does not affect the comparison of relative microclimate performance between different morphological types. Second, the current modeling framework mainly focuses on the physical disturbance of the building interface, without fully coupling the dynamic latent heat exchange of high-intensity anthropogenic heat emissions (e.g., air conditioning exhaust and traffic) or complex vegetation communities. Future research will introduce multi-source thermodynamic boundary conditions and integrate the effects of evapotranspiration to further improve this comprehensive microclimate assessment framework.
Author Contributions
Conceptualization, Y.H.; methodology, Y.H.; software, Y.H.; validation, Y.H.; formal analysis, Y.H.; investigation, Y.H.; data curation, Y.H.; writing—original draft preparation, Y.H.; writing—review and editing, Y.Z., Y.D., and H.Z.; visualization, Y.H., Y.D., and H.Z.; supervision, Y.Z. All authors have read and agreed to the published version of the manuscript.
Funding
This research received no external funding.
Data Availability Statement
The data presented in this study are available on request from the authors.
Conflicts of Interest
The authors declare no conflicts of interest.
References
- United Nations. Department of Economic and Social Affairs, Population Division. World Urbanization Prospects 2018. 2019. Available online: https://population.un.org/wup/ (accessed on 12 January 2026).
- Lai, D.; Lian, Z.; Liu, W.; Guo, C.; Liu, W.; Liu, K.; Chen, Q. A comprehensive review of thermal comfort studies in urban open spaces. Sci. Total Environ. 2020, 742, 140092. [Google Scholar] [CrossRef] [PubMed]
- Deng, J.-Y.; Wong, N.H. Impact of urban canyon geometries on outdoor thermal comfort in central business districts. Sustain. Cities Soc. 2020, 53, 101966. [Google Scholar] [CrossRef]
- Santamouris, M. Recent progress on urban overheating and heat island research. Integrated assessment of the energy, environmental, vulnerability and health impact. Synergies with the global climate change. Energy Build. 2020, 207. [Google Scholar] [CrossRef]
- Oke, T.R.; Mills, G.; Christen, A.; Voogt, J.A. Urban Climates; Cambridge University Press: Cambridge, UK, 2017. [Google Scholar]
- Oke, T.R. Street design and urban canopy layer climate. Energy Build. 1988, 11, 1103–1113. [Google Scholar] [CrossRef]
- Muniz-Gäal, L.P.; Pezzuto, C.C.; Carvalho, M.F.H.D.; Mota, L.T.M. Urban geometry and the microclimate of street canyons in tropical climate. Build. Environ. 2020, 169, 106547. [Google Scholar] [CrossRef]
- Zhang, J.; Li, Z.; Wei, Y.; Hu, D. The impact of the building morphology on microclimate and thermal comfort-a case study in Beijing. Build. Environ. 2022, 223, 109469. [Google Scholar] [CrossRef]
- Guo, L.; Guo, X.; Li, B.; Wang, E. The impact of block morphology on urban microclimates: A case study of three cities in cold regions of China. Urban Clim. 2024, 57, 102098. [Google Scholar] [CrossRef]
- Zhang, L.; Yuan, P.; Ding, Y. Analysis of microclimate and spatial geometry correlation of squares in cold urban settlements: A study in Urumqi. Urban Clim. 2024, 58, 102219. [Google Scholar] [CrossRef]
- Chatzidimitriou, A.; Yannas, S. Street canyon design and improvement potential for urban open spaces; the influence of canyon aspect ratio and orientation on microclimate and outdoor comfort. Sustain. Cities Soc. 2017, 33, 85–101. [Google Scholar] [CrossRef]
- Castrejon-Esparza, N.M.; González-Trevizo, M.E.; Martínez-Torres, K.E.; Santamouris, M. Optimizing urban morphology: Evolutionary design and multi-objective optimization of thermal comfort and energy performance-based city forms for microclimate adaptation. Energy Build. 2025, 342, 115750. [Google Scholar] [CrossRef]
- Tang, G.; Du, X.; Wang, S. Impact mechanisms of 2D and 3D spatial morphologies on urban thermal environment in high-density urban blocks: A case study of Beijing’s Core Area. Sustain. Cities Soc. 2025, 123, 106285. [Google Scholar] [CrossRef]
- Idrissi Kaitouni, S.; Romani, Z.; Jamil, A.; Ahachad, M. Zero carbon urban buildings (ZCUBs) in the era of climate change, digital transformation and energy transition: A scoping review from 2000 to 2024. Build. Environ. 2025, 280, 113116. [Google Scholar] [CrossRef]
- Elnagar, E.; Arteconi, A.; Heiselberg, P.; Lemort, V. Integration of resilient cooling technologies in building stock: Impact on thermal comfort, final energy consumption, and GHG emissions. Build. Environ. 2024, 261, 111666. [Google Scholar] [CrossRef]
- Jia, Q.; Li, J.; Zhang, T.; Lu, L.; Li, S. Coupled impacts of climate change and urban morphology on building energy demand and outdoor thermal comfort in Harbin, China. Build. Environ. 2026, 302, 114846. [Google Scholar] [CrossRef]
- Ali-Toudert, F.; Mayer, H. Numerical study on the effects of aspect ratio and orientation of an urban street canyon on outdoor thermal comfort in hot and dry climate. Build. Environ. 2006, 41, 94–108. [Google Scholar] [CrossRef]
- Taleghani, M.; Kleerekoper, L.; Tenpierik, M.; van den Dobbelsteen, A. Outdoor thermal comfort within five different urban forms in the Netherlands. Build. Environ. 2015, 83, 65–78. [Google Scholar] [CrossRef]
- Freitas, E.D.; Rozoff, C.M.; Cotton, W.R.; Dias, P.L.S. Interactions of an urban heat island and sea-breeze circulations during winter over the metropolitan area of São Paulo, Brazil. Bound.-Layer Meteorol. 2007, 122, 43–65. [Google Scholar] [CrossRef]
- Long, Y.; Li, P.; Hou, J. Three-dimensional urban form at the street block level for major cities in China. Shanghai Urban Plan. Rev. 2019, 3, 10–15. (In Chinese) [Google Scholar]
- Oke, T.R. Initial guidance to obtain representative meteorological observations at urban sites. 2004, 81, 22–25. [Google Scholar]
- Matzarakis, A.; Rutz, F.; Mayer, H. Modelling radiation fluxes in simple and complex environments: Basics of the RayMan model. Int. J. Biometeorol. 2010, 54, 131–139. [Google Scholar] [CrossRef] [PubMed]
- Bruse, M.; Fleer, H. Simulating surface–plant–air interactions inside urban environments with a three dimensional numerical model. Environ. Model. Softw. 1998, 13, 373–384. [Google Scholar] [CrossRef]
- Huttner, S. Further Development and Application of the 3D Microclimate Simulation ENVI-met. Ph.D. Thesis, Johannes Gutenberg-Universität Mainz, Mainz, Germany, 2012. [Google Scholar] [CrossRef]
- Tsoka, S.; Tsikaloudaki, A.; Theodosiou, T. Analyzing the ENVI-met microclimate model’s performance and assessing cool materials and urban vegetation applications–A review. Sustain. Cities Soc. 2018, 43, 55–76. [Google Scholar] [CrossRef]
- Xu, X.; Wang, L.; Liu, L.; Wu, S.; Wang, S. Impact study of landscape renewal design on neighborhood microclimate based on a structural analysis framework considering global warming scenarios. J. Asian Archit. Build. Eng. 2025, 25, 2637–2664. [Google Scholar] [CrossRef]
- Wang, Q.; Liu, S.; Qian, J. A simulation approach to assessing vegetation configuration effects on thermal comfort in cold region pocket parks. Sci. Rep. 2025, 15, 28809. [Google Scholar] [CrossRef] [PubMed]
- Yuan, C.; Ng, E. Building porosity for better urban ventilation in high-density cities—A computational parametric study. Build. Environ. 2012, 50, 176–189. [Google Scholar] [CrossRef] [PubMed]
- Allegrini, J.; Dorer, V.; Carmeliet, J. Influence of morphologies on the microclimate in urban neighbourhoods. J. Wind Eng. Ind. Aerodyn. 2015, 144, 108–117. [Google Scholar] [CrossRef]
- Perini, K.; Magliocco, A. Effects of vegetation, urban density, building height, and atmospheric conditions on local temperatures and thermal comfort. Urban For. Urban Green. 2014, 13, 495–506. [Google Scholar] [CrossRef]
- Johansson, E. Influence of urban geometry on outdoor thermal comfort in a hot dry climate: A study in Fez, Morocco. Build. Environ. 2006, 41, 1326–1338. [Google Scholar] [CrossRef]
- Hwang, R.-L.; Lin, T.-P.; Matzarakis, A. Seasonal effects of urban street shading on long-term outdoor thermal comfort. Build. Environ. 2011, 46, 863–870. [Google Scholar] [CrossRef]
- Lin, T.-P.; Matzarakis, A.; Hwang, R.-L. Shading effect on long-term outdoor thermal comfort. Build. Environ. 2010, 45, 213–221. [Google Scholar] [CrossRef]
- Xun, Y.; Huang, X.; Zeng, Q.; Ye, M.; Guo, Y. Study on Outdoor Thermal Comfort of Commercial and Residential Mixed-Use Blocks in Hot and Humid Climates: Taking Guangzhou, China as an Example. Energies 2025, 18, 2015. [Google Scholar] [CrossRef]
- Johansson, E.; Emmanuel, R. The influence of urban design on outdoor thermal comfort in the hot, humid city of Colombo, Sri Lanka. Int. J. Biometeorol. 2006, 51, 119–133. [Google Scholar] [CrossRef] [PubMed]
- Bacha, A.E.; Ahriz, A.; Alshenaifi, M.; Alfraidi, S.; Noaime, E.; Alsolami, B.; Ghosh, A.; Bouzaher, S.; Doulos, L.T.; Mesloub, A. A Comprehensive Study on Outdoor Thermal Comfort in Arid Urban Environments through Microclimatic Analysis of Urban Density. Buildings 2024, 14, 700. [Google Scholar] [CrossRef]
- Pearlmutter, D.; Bitan, A.; Berliner, P. Microclimatic analysis of “compact” urban canyons in an arid zone. Atmos. Environ. 1999, 33, 4143–4150. [Google Scholar] [CrossRef]
- Blocken, B.J.E.; Carmeliet, J.E. Pedestrian wind environment around buildings: Literature review and practical examples. J. Therm. Envel. Build. Sci. 2004, 28, 107–159. [Google Scholar] [CrossRef]
- Ng, E. Policies and technical guidelines for urban planning of high-density cities—Air ventilation assessment (AVA) of Hong Kong. Build. Environ. 2008, 44, 1478–1488. [Google Scholar] [PubMed]
- Ren, C.; Ng, E.Y.-Y.; Katzschner, L. Urban climatic map studies: A review. Int. J. Climatol. 2011, 31, 2213–2233. [Google Scholar] [CrossRef]
- Ali-Toudert, F.; Mayer, H. Effects of asymmetry, galleries, overhanging façades and vegetation on thermal comfort in urban street canyons. Sol. Energy 2007, 81, 742–754. [Google Scholar] [CrossRef]

Disclaimer/Publisher’s Note: The statements, opinions and data contained in all publications are solely those of the individual author(s) and contributor(s) and not of MDPI and/or the editor(s). MDPI and/or the editor(s) disclaim responsibility for any injury to people or property resulting from any ideas, methods, instructions or products referred to in the content. |
© 2026 by the authors. Licensee MDPI, Basel, Switzerland. This article is an open access article distributed under the terms and conditions of the Creative Commons Attribution (CC BY) license.