


Abstract
Construction-stage bridge fires are seldom documented in detail, although they can change the behavior of an incomplete structural system. This paper records a 35 m span of a six-cell RC box girder at the Al-Sadreen intersection in Samawa, Iraq, damaged after the bottom slab and webs had been cast and before the top slab was completed. Burning timber formwork locally removed the temporary soffit support. The open-top section, therefore, shifted from the intended fixed–pin construction-stage response toward a pin–pin-like response, with sagging and vertical web cracks near the intended fixed support. A closed-form check showed that the required negative-restraint moment was about 5.3–5.9 times the cracking moment of the incomplete section. Visual inspection, Schmidt hammer, UPV, cores, and steel tests showed localized damage; 28 MPa was used as a representative residual concrete strength for the affected cast components. CSiBridge was used only for completed rehabilitated-state verification. The strengthened model gave maximum shear D/C ≈ 0.529 and flexural D/C < 1.0. Spreadsheet-guided jacking, top-slab reinforcement upgrading, sensitivity checks, and a 350-ton five-lane load test confirmed satisfactory service behavior and negligible residual response.
1. Introduction
Concrete box-girder bridges are common in medium- and long-span infrastructure because multi-cell sections provide high flexural and torsional stiffness. Their assessment is not limited to final strength and serviceability; during staged construction, temporary support, stability, deformation, and constructability may govern the response [1].
Fire exposure can reduce concrete and steel performance through cracking, spalling, microcracking, and loss of strength or stiffness, depending on heating duration, peak temperature, material properties, and cooling [2,3,4]. At the bridge level, the consequences may include local damage, traffic disruption, closure, repair, or replacement. Recent reviews show that bridge-fire assessment is less codified and less documented than fire assessment of buildings or tunnels [5,6]. Post-incident collapse datasets also confirm that fire and explosion are uncommon but recorded bridge-collapse causes; documented cases, therefore, remain valuable, as discussed in Section 2.1.
Several bridge-fire studies now combine CFD and FEM with field evidence to estimate fire scenarios, temperature fields, and structural consequences. For example, Chen et al. [5] described an assessment sequence that starts with site investigation and component inspection and continues to temperature estimation, fire-scene reconstruction, and structural safety evaluation.
A construction-stage fire is a different problem. The structural system may still be open, may depend on formwork or shoring, and may not yet have the final reinforcement or boundary conditions. In that situation, lifting, temporary support, and staged behavior become part of the structural assessment rather than only construction logistics [1].
Against this background, the present paper examines a fire-damaged multi-cell reinforced concrete box-girder bridge during construction. In the affected span, the bottom slab, webs, and diaphragms had been cast, but the top slab and its negative-moment reinforcement had not yet been completed. The fire burned timber formwork and locally removed temporary soffit support, leading to sagging and vertical web cracks near the intended fixed-support side. The case was investigated using visual inspection, material testing, simplified structural interpretation, spreadsheet-guided jacking calculations, a completed-state CSiBridge model based on residual material properties, and final field load verification.
The specific objectives are to: (i) document the construction-stage fire condition and associated loss of temporary support; (ii) interpret the observed crack pattern and support-transformation mechanism using field evidence and simplified mechanics; (iii) describe the controlled jack-based realignment and strengthening decisions; and (iv) verify the completed rehabilitated span using analytical checks and a full-scale field load test.
Accordingly, the paper is framed as a documented engineering case history and integrated decision-making workflow, not as a universal repair method, a fire-temperature reconstruction, or a new constitutive material model. Its value lies in presenting a traceable chain of project evidence that links the construction-stage event, residual material condition, structural interpretation, jacking records, strengthening decisions, numerical verification, and field load-test results.
After the research gap is defined in Section Research Gap and Scientific Novelty, the paper reviews the relevant literature in Section 2. Section 3, Section 4 and Section 5 describe the bridge, construction stage, inspection, material testing, and structural interpretation. Section 6, Section 7 and Section 8 present the jacking, completed-state CSiBridge verification, and load-test verification. Section 9 gives the conclusions.
Research Gap and Scientific Novelty
Bridge-fire research has grown, but bridge-specific guidance for assessment and rehabilitation remains limited relative to buildings and tunnels. Recent reviews call for field cases that connect inspection, material testing, structural analysis, and post-repair verification, especially for complex multi-cell box girders [6,7].
Most applied cases deal with bridges already in service. Liu et al. [8], for example, combined inspection, concrete and reinforcement testing, finite element analysis, and load-test validation for a concrete box girder. Such work is useful, but it does not cover a fire during construction, when the structure is incomplete and still depends on temporary works and staged casting.
In staged construction, fire may damage materials and also change the load path by removing temporary support, stopping casting operations, or altering boundary conditions before the permanent system exists. AASHTO constructability provisions on deformation, strength, stability, temporary support, lifting, and jacking are therefore relevant when these actions are part of construction or corrective works [1]. Documented cases combining temporary-support loss, jacking, strengthening, and verification remain scarce.
The gap addressed here is the lack of a traceable record for an incomplete multi-cell RC box girder damaged by construction-stage fire, then assessed with field and material evidence, realigned by jacking, strengthened in the completed state, and verified by a load test.
The practical contribution is the continuity of the record: construction condition, temporary-support loss, sagging and cracking, closed-form mechanism check, spreadsheet-guided jacking, top-slab strengthening, finite element verification, and final load-test confirmation. The study does not propose a universal repair model; it shows how established engineering tools were combined for one rare construction-stage case.
2. The Literature Review
2.1. Bridge Fires and Their Importance in Structural Engineering
Bridge fires have received more attention because they can reduce load capacity, interrupt transportation, and create difficult repair decisions. Garlock et al. [9] showed that bridge fires are real incidents requiring explicit assessment, while Hu et al. [10] and Kodur and Naser [11] emphasized the shortage of large-scale bridge-fire data and the need for better risk-assessment methods.
Recent reviews confirm that the field is still constrained by limited experimental data, differences among fire models, and weak links between thermal exposure and actual structural performance [12]. They also note that bridge-fire guidance is less developed than guidance for buildings and tunnels, making well-documented field cases useful.
D’Angelo et al. [13] reported 246 bridge collapses in Italy from 2000 to 2023; fire and explosion caused three cases, about 1.2%, while four collapses occurred during construction. A companion dataset extended the record to 250 events through 2025 [14]. These statistics do not validate the mechanism in the present span, but they show why uncommon fire and construction-stage incidents should be documented when they occur.
2.2. The Effect of Fire on Reinforced Concrete and Bridge Materials
Concrete usually performs better in fire than unprotected steel, yet high temperature may cause cracking, delamination, spalling, internal damage, and reduced strength or stiffness [2,3,4]. The residual condition depends on temperature, duration, aggregate and paste characteristics, loading during the event, and cooling. Code fire-resistance provisions are useful, but post-fire assessment also requires field and laboratory evidence.
Reinforcing and structural steel may lose strength, ductility, or geometric stability when directly heated, especially in restrained or loaded members. For bridges with exposed steel or composite components, residual strength, deformation, buckling, and connection integrity must be evaluated together.
2.3. Assessment of Concrete Bridges After Fire
The recent literature indicates that the post-fire evaluation of concrete bridges should not be based on any one indicator or test. A recent review [6] has highlighted the need for a combined approach involving visual inspection, non-destructive testing, destructive testing, and numerical analysis to classify damage and make repair/replacement decisions on a defensible basis. Although this review addresses concrete structures in general, the same reasoning applies to bridges, where global structural behavior and return-to-service decisions can be more critical.
Post-fire assessment guidance [4] generally moves from initial survey to detailed examination and, when needed, laboratory testing. Surface discoloration, cracking, spalling, and hollow-sounding concrete are useful warning signs, but structural decisions should combine nondestructive and destructive tests.
For concrete bridge elements, Wang [15] is best treated as experimental evidence on fire-affected bridge-deck concrete, not as a complete field case study. It still supports the combined interpretation of discoloration, spalling, cracking, damage depth, estimated temperatures, UPV, cores, and measured concrete properties.
Experimental work on posttensioned concrete bridge beams exposed to hydrocarbon fire provides bridge-specific evidence of the interaction between thermal exposure, applied loading, and residual structural response [16]. Post-fire nondestructive evaluation of prestressed concrete elements has also demonstrated the value of combining complementary inspection and testing methods rather than relying on a single indicator [17].
In a bridge-fire assessment study [5], the authors presented a stepwise evaluation framework that begins with incident investigation and field-data collection, then proceeds to component inspection, damage assessment, temperature estimation, numerical reconstruction of the fire scene, and structural safety evaluation. Its main value in the present study lies in the clear linkage between field evidence and subsequent analytical evaluation.
2.4. Numerical Analysis and Field Verification After Fire
Numerical modeling is useful in post-fire bridge evaluation when tied to observed damage and measured residual properties. A post-fire box-girder study [8] combined inspection, material testing, FEM, and field load testing. Reviews [10,12] also stress the shortage of bridge-fire studies linking thermal exposure, structural analysis, and validation. In this paper, the model is therefore a completed-state structural model, not a fire reconstruction.
2.5. Repair and Strengthening After Fire
Bridge-fire repair has no single standard solution. It depends on bridge type, damage level, residual materials, deformation, and any change in structural behavior. Garlock et al. [9] noted that repair may include local repair, strengthening, or partial replacement. For box-girder bridges, assessment, repair, and final verification must be linked. In construction-stage fires, geometry recovery by lifting or jacking may also be required; in this manuscript, AASHTO [1] is cited only to support consideration of deformation, strength, stability, temporary support, lifting, and jacking during construction or corrective works, not as a post-fire repair procedure.
2.6. Summary of Literature Review and Its Connection to the Current Study
The literature supports four points for this case: bridge fires are important but less codified than building or tunnel fires; fire-affected concrete and reinforcement require testing beyond visual inspection; defensible assessment should combine inspection, NDT, cores, analysis, and, where possible, field verification; and few cases document construction-stage fire with temporary-support loss, jack-based realignment, and load-test confirmation. The present paper records the full sequence for a multi-cell RC box girder.
3. Description of the Studied Bridge Unit, Structural System, and Construction Stages
3.1. Studied Bridge Unit
The studied unit was a three-span unit in the main road (A) of the Al-Sadreen intersection bridge in Samawa. The unit consisted of Spans 15, 16, and 17. Span 15 was directly affected by the fire, whereas Spans 16 and 17 were outside the fire-affected area. The official post-fire field and laboratory assessment report explicitly identified the damaged section as Span 15 and described the superstructure as a box bridge, consistent with the project’s structural drawings.
The nominal length of each span was 35 m. The structural unit under investigation is part of a pin–fixed–fixed–pin-support system, which is fundamental for understanding both the intended construction-stage performance and actual response after a fire. The project drawings show three pot bearings on the left simple-support side of Span 15. The overall bridge system was designed using guided pot bearings, as required by the bearing layout.
3.2. Cross-Sectional Configuration
The superstructure was a six-cell reinforced concrete box girder with an overall depth of 1.90 m. The cross-section consisted of a top slab, a bottom slab, two inclined external webs, and five internal webs, forming six internal cells. According to the section drawings and bridge-section definition used in the CSiBridge model, the representative overall deck width is 19.65 m, including two side cantilever wings of 1.20 m each. Accordingly, the structural top width of the closed box between the outer web lines was approximately 17.25 m, whereas the bottom width was 16.50 m. Along Span 15 only, the cross-section widens progressively from 20.49 m to 22.58 m from right to left, whereas the wing length remains constant, and the widening is mainly reflected in the lower part of the section.
The thicknesses of the top and bottom slabs were 270 and 200 mm, respectively. The two external inclined webs were 550 mm thick at the supports, tapering over a length of 3.5 m, measured from the inner edge of the crossbeam to 350 mm, after which the thickness remained constant over the remaining span length. The external web inclination was 38/148. Similarly, the five internal webs were 400 mm thick at the supports, tapering over 3.5 m to 250 mm, with approximately equal spacing between adjacent internal webs. In addition, the span contained three internal diaphragms, each 300 mm thick, subdividing the internal cells at nearly uniform intervals.
The crossbeam thickness varied according to the support condition, being 850 mm for a simple support and 1800 mm for a fixed support. The crossbeam and diaphragm drawings also show the use of mechanical couplers in selected reinforcement locations, particularly in some diaphragm and crossbeam reinforcement regions. Representative cross-sectional drawings of the studied unit at the selected stations, based on the approved section shop drawings, are presented in Figure A1 (Appendix A).
3.3. Reinforcement Concept of the Box Girder
The reinforcement concept of the box girder is based mainly on longitudinal flexural reinforcement distributed between the top and bottom slabs according to the regions of negative and positive bending moments, respectively. In the final structural configuration, the negative-moment resistance near the fixed-support regions is mainly provided by the longitudinal reinforcement in the top slab, whereas the positive-moment resistance in the span regions is mainly provided by the longitudinal reinforcement in the bottom slab. The internal and external webs primarily carry shear and contribute to the sectional integrity.
This reinforcement concept is important for interpreting post-fire damage mechanisms. At the time of the incident, the cast elements and web shear reinforcement were already present, but the top slab and its longitudinal negative-moment reinforcement had not yet been constructed. Therefore, the partially completed section lacked the principal longitudinal reinforcement layer intended to resist negative bending near the fixed-support region. The principal longitudinal reinforcement used in the rehabilitated Span 15 box girder is listed in Table 1. The longitudinal top-slab reinforcement layout for Spans 15, 16, and 17 adopted after the strengthening adjustment of Span 15, based on the approved reinforcement shop drawings, is shown in Figure A2 (Appendix A).
Table 1.
Summary of the principal longitudinal reinforcement used in the rehabilitated Span 15 box girder.
3.4. Section Properties at the Fire-Stage and Final Configurations
The partially completed section (no top-slab cast) controlled the structural response of Span 15 because the fire occurred after the bottom slab and webs had been cast and before the top slab had been cast. As noted in Section 3.2, the width is not constant along Span 15, so the sectional properties given herein are not intended to represent every location along the span.
For a practical comparison, the section-property calculations were performed for a representative transverse section with an approximate width of 21.6 m, selected near the midspan region. Using this representative section, the AutoCAD 2015 MASSPROP command was used to evaluate both the fire-stage configuration (bottom slab + webs only) and the final completed configuration (full six-cell box girder). Therefore, the reported gross area and flexural inertia should be regarded as representative values for comparative assessment rather than exact values for all longitudinal positions along Span 15.
The results showed that the fire-stage section had noticeably smaller flexural inertia than the completed section. This confirms the marked reduction in stiffness at the time of the fire and supports the explanation of the observed sagging, as well as the inability of the incomplete section to develop the intended negative-moment resistance near the fixed-support region. The corresponding section properties are listed in Table 2.
Table 2.
Representative section properties of Span 15 at the fire stage and final configuration (based on an approximate 21.6 m-wide section near midspan).
3.5. Construction Stages and Temporary-Support System
According to the formwork and temporary-support drawings, each structural unit was constructed in three successive casting stages: (1) bottom slab, (2) webs with longitudinal and transverse diaphragms, and (3) top slab. Project records indicate that in Span 15, the bottom slab was cast on 19 March 2023, and the webs and diaphragms were cast on 16 April 2023, whereas top-slab formwork operations were still underway when the fire occurred.
Representative drawings and a field view of the staged temporary-support system are shown in Figure 1.
Figure 1.
Temporary support system used for the staged construction of the six-cell box girder: (a) representative field view of the timber-and-steel formwork system before the fire; (b) typical scaffold/formwork arrangement and staged casting scheme.
The same drawings indicate that the temporary formwork and shoring system remained in place throughout the three casting stages and was removed only after completion of the top slab and formation of the final closed-box section. Thus, during the first and second casting stages, the structure did not behave as a completed closed-box girder; it was a partially completed open-top section that still depended on temporary formwork and shoring until the final casting stage was completed.
3.6. Fire Location and Immediate Structural Consequence
The fire occurred at approximately 1:10 p.m. on 3 June 2023, after the bottom slab, webs, and diaphragms of Span 15 had been completed, but before the top-slab formwork operations were finished, as detailed in Section 3.5. The incident was initiated by an electrical short circuit in the timber bottom-slab formwork of Span 45, the two-lane branch connected to Span 15 (which also connects to a four-lane branch); the prepared timber formwork of this branch became the main fire source. The resident engineer’s memorandum reported that the fire continued for approximately two hours before being controlled by the civil-defense teams and the relevant authorities.
The chronology of the assessment, repair, jack-based realignment, and verification works, from the bottom-slab casting on 19 March 2023, to the final load-verification test on 23 December 2023, is summarized in Table A1.
Representative views of the fire-affected formwork system are shown in Figure 2, while the surface-damage distribution and repair actions are shown in Figure 3.
Figure 2.
Representative view of the fire affecting the Span 15 construction area, showing the burning of timber formwork and the temporary support/formwork system associated with the connected two-lane branch.
Figure 3.
Representative documentation of fire-related surface damage and repair actions in Span 15: (a) first-quarter region of Span 15 near the pin-support side that was first exposed to the fire, shown before complete site cleaning; (b) thermal debris and surface scaling after the fire; (c) repair of scaled surface zones after removal of weak concrete; and (d) DCP Flo-Grout BP800 cementitious grout used for surface repair.
The direct structural consequence of the temporary-support loss was that the partially completed Span 15 could no longer sustain the intended restrained fixed–pin construction-stage response; the incomplete span shifted toward a more pin–pin-like behavior because the region around the intended fixed support still lacked the top slab and its longitudinal reinforcement, which would provide the main negative-moment resistance in the completed system. Two damage components were therefore distinguished: localized thermal surface scaling near the fire source and pin-support side, and structural vertical web cracking near the intended fixed-support side caused primarily by temporary-support loss and the resulting staged-behavior change.
The thermal surface damage was not uniformly distributed along Span 15. The most pronounced surface scaling and local surface deterioration were observed near the pin-support side, especially within the first quarter of Span 15, adjacent to the burning two-lane branch formwork. The degree of surface scaling decreased markedly toward midspan and was almost absent near the fixed-support side. No reinforcing steel was exposed in the scaled areas, which is consistent with the observed damage being mainly surface scaling because the concrete cover was approximately 3–5 cm.
3.7. Interpretation of the Observed Cracking Pattern
The observed crack pattern supports this interpretation. Cracking was observed in the internal and external webs of Span 15, mainly near the intended fixed-support side. On the accessible inspected face of each web, approximately three to six major cracks were documented. Representative crack spacing ranged from about 5 cm to 40 cm. The cracks were predominantly vertical to near-vertical rather than diagonal, which indicates that shear was not the governing distress mechanism. The measured crack widths near the upper web edge ranged approximately from 0.5 mm to 5 mm, and the crack opening generally decreased toward the bottom slab. Some of the wider cracks penetrated through the web thickness.
Representative web-crack patterns, marked inspection/test locations, crack-spacing measurements, and measured crack-width examples are shown in Figure 4. The crack-survey observations are also summarized in Table A3.
Figure 4.
Representative crack-survey documentation for Span 15 webs before jack-based realignment: (a) overall web face showing representative crack spacing; (b) representative inspected wall surface with marked inspection/test locations; (c) additional web face showing the distribution of vertical cracks and spacing measurements; (d) close-up of a representative crack near the upper web region; and (e) examples of measured crack widths showing different opening magnitudes. The observed cracks were predominantly vertical to near-vertical, and the crack openings generally decreased toward the bottom slab.
This interpretation is consistent with the original reinforcement arrangement of the box girder. Because the principal negative-moment reinforcement was designed to be provided by the top-slab longitudinal bars, and because that slab had not yet been cast at the time of the incident, the remaining longitudinal resistance in the support region was provided mainly by the webs and the already cast bottom slab. The longitudinal reinforcement present within the webs, particularly in the upper web region, was not intended to resist the full negative bending demand generated after loss of the temporary soffit support. Consequently, the rotational restraint in the intended fixed-support region was substantially reduced, and the support behavior progressively transformed toward a pin-like condition.
This mechanism also explains why the dominant structural cracking was concentrated near the fixed-support side rather than the pin-support side, despite the stronger surface scaling being observed near the fire source at the pin-support side. The pin-support side already had the intended pot-bearing support condition, whereas the critical change in staged behavior occurred near the region intended to provide rotational restraint. Field observations after jack-based lifting indicated a marked reduction in crack opening, and the remaining cracks were subsequently repaired using epoxy injection. This sequence supports the interpretation that the wider vertical web cracks were controlled primarily by staged structural response rather than by local thermal surface scaling alone.
4. Inspection and Material Testing Program
4.1. General Assessment Strategy
Following the fire, a post-fire assessment program was undertaken to establish whether the damaged Span 15 could be safely repaired and completed. Because the incident occurred during construction, the evaluation had to consider both potential thermal degradation of concrete and reinforcement and the structural implications of losing temporary support in a partially completed box-girder segment.
The official project correspondence stated that the technical assessment process officially began following a resident engineer’s request dated 7 June 2023. A technical team of the National Center of Construction Laboratories and Research (Baghdad Central Laboratory/Structural Evaluation Division) conducted field and laboratory investigations, and a formal report was issued on 18 July 2023. The program consisted of the following tests:
- Physical examination of the damaged span.
- Schmidt hammer testing.
- Ultrasonic pulse velocity (UPV) testing.
- Concrete-core testing.
- Reinforcing steel testing.
These tests were conducted to compare the fire-affected and sound reference regions and to determine the residual condition of the concrete and reinforcement before selecting a repair and strengthening strategy.
4.2. Visual Inspection and Crack Survey
The first phase of the investigation was a visual inspection of the damaged span, particularly the longitudinal webs, support areas, and girder regions affected by the combustion of plywood sheets and timber formwork bearers. Based on visual examination, two types of damage were distinguished. The first was localized surface scaling and weak surface concrete, mainly near the pin-support side and within the first quarter of Span 15, adjacent to the fire source. The second was vertical to near-vertical web cracking, mainly near the intended fixed-support region.
The crack survey was conducted on the accessible faces of the affected webs before jack-based realignment. The survey confirmed the vertical to near-vertical crack pattern described in Section 3.7 and summarized in Table A3. Although a same-location post-jacking photographic survey was not available, field observations indicated a marked reduction in crack opening after lifting, and the remaining cracks were repaired by epoxy injection.
For the surface scaling zones, no exposed reinforcement was observed. Loose and weak surface concrete was removed, and hammer sounding was used to identify hollow or unsound areas before repair. A bonding agent was applied between the existing concrete and the repair material, and the affected zones were repaired with DCP Flo-Grout BP800 cementitious grout by a specialized repair team. These observations and repair actions are summarized in Table A2 and Table A3 and illustrated in Figure 3 and Figure 4.
4.3. Schmidt Hammer Testing
Schmidt hammer tests were conducted in accordance with ASTM C805 [18], as documented in the official assessment report, to give a preliminary field indication of concrete quality in the fire-affected area—not to determine the final compressive strength, but to identify relative differences between damaged and undamaged portions and to select areas for further investigation.
The Schmidt hammer results showed clear spatial variation in the fire-affected walls. Individual rebound values ranged from the low thirties to the high forties, with affected-wall averages generally within the 42–46 range. One particularly weak wall segment had an average rebound value of about 32, whereas the sound reference wall had an average value of about 51. This spatial variation is consistent with localized fire exposure and non-uniform damage in the affected span.
For fire-damaged concrete, Schmidt hammer values were not considered sufficient for determining the residual structural condition. Therefore, they were not used independently as a criterion for the residual strength of concrete, but were interpreted together with the UPV and concrete-core results.
4.4. Ultrasonic Pulse Velocity Testing
As detailed in the official report, ultrasonic pulse velocity (UPV) testing following ASTM C597 [19] (direct transmission technique) was also carried out to assess the internal condition and relative integrity of the concrete, comparing the selected damaged wall areas with the sound concrete in the unaffected part of the wall.
The pulse velocities measured in the fire-affected areas were lower than those measured in the reference area. The average UPV values in the affected walls were approximately 3.87–4.41 km/s, whereas the sound concrete had an average value of approximately 4.70 km/s. These findings suggest that the affected concrete retained a relatively high level of continuity and integrity, although its quality and homogeneity decreased compared with those of the intact reference concrete.
The point-by-point nondestructive results reported in the official material-assessment document are summarized in Table 3. The nondestructive test locations listed in Table 3 were identified according to the field panel notation shown in Figure A2 (Appendix A). In this notation, labels such as 2R1 correspond to panel R1-2, 3R1 to panel R1-3, and so forth.
Table 3.
Summary of nondestructive concrete test results from the official assessment report.
From an engineering point of view, this finding suggests that the concrete was not completely destroyed as a result of the heat exposure, but it cannot be considered to be the same as undamaged concrete. This interpretation is consistent with the observed cracking pattern and supports the use of measured post-fire properties in subsequent structural evaluations.
Pink discoloration was also observed on the inside concrete surfaces of the box girders at certain locations. This pink coloration is often interpreted to mean the affected concrete was heated to a minimum of around 300 °C, and may have been heated to the 300–600 °C range in post-fire concrete assessment practice. However, the color change should not be regarded as an exact temperature measurement, because it may depend on the type of aggregate, cement chemistry, heating duration and cooling conditions. Thus, the pink coloration in Span 15 was used only as supportive visual evidence, and was considered in conjunction with the UPV results, core test and observed cracking pattern.
No systematic measurements of the depth of pink discoloration were available in the assessment records. It was therefore regarded as qualitative evidence of thermal exposure rather than as a direct means of assigning through-depth temperature or strength-reduction profiles. If the discoloration was shallow, the adopted 28 MPa through-member concrete value would be conservative; however, deeper thermal penetration would require more detailed material mapping.
4.5. Concrete-Core Testing
Field nondestructive tests were used to evaluate the concrete in the affected span, but they were not sufficient on their own to determine the final residual strength; therefore, concrete cores were taken from the affected span and tested in compression in accordance with ASTM C42 [20]. These tests provided the most direct measurement of the residual compressive strength of the concrete in the damaged zone. The post-fire material assessment included field core drilling from the fire-affected concrete and visual inspection of the internal surfaces of the box-girder cell.
Representative documentation of the core-sampling operation and the inspected internal surface condition is shown in Figure 5.
Figure 5.
Representative post-fire material-assessment documentation for Span 15: (a) field core drilling/extraction from the fire-affected concrete for compressive-strength verification; (b) internal surface condition of the box-girder cell after the fire and during the assessment stage, showing the inspected concrete surface and a typical core extraction location.
The official report gave three main compressive-strength values:
- 37.29 MPa.
- 25.10 MPa.
- 24.74 MPa.
These values support the interpretation that the concrete strength in the damaged part of the span was not uniform. One tested location retained relatively high strength, whereas the other two locations showed lower strength. This suggests localized thermal exposure and structural effects rather than uniform damage over the full extent of the span.
The three reported core strengths averaged about 29.04 MPa. When compared with the original specified superstructure strength of 40 MPa, these results do not satisfy the usual core-strength acceptance logic commonly used for evaluating whether the affected concrete may be treated as undamaged, because the average of the three cores was below 0.85 and two individual cores were below 0.75 when = 40 MPa is used as the reference value [21]. Therefore, the damaged bottom slab and webs were not modeled using the original concrete strength of 40 MPa.
For the analytical verification, 28 MPa was adopted as a representative engineering value for the fire-affected cast components. This value is close to the mean core strength, but it should not be interpreted as conservative with respect to every local weak point, because two of the three cores were lower than 28 MPa. The use of a single material value was considered appropriate for the global rehabilitated-span verification because the model was subsequently checked by field load testing, while the spatial variability revealed by the Schmidt hammer and UPV tests was retained as an assessment limitation. The official testing report identified ASTM C42 as the standard used for concrete-core compressive-strength testing, but it did not provide specimen-level details such as core diameter, length-to-diameter ratio, moisture condition, or individual correction factors. Therefore, the reported core strengths were used as documented in the official project record, without introducing additional undocumented corrections. This limitation supports interpreting the adopted 28 MPa value as a representative global verification value for the rehabilitated span rather than as a local minimum strength for every fire-affected zone.
4.6. Reinforcing Steel Testing
Reinforcing steel samples from the fire-affected condition were tested according to ASTM A370-2020 [22] and compared with ASTM A615M-2020 [23] requirements. The test program included nine specimens, three for each nominal diameter (12, 20, and 25 mm). The 12 mm exposed upper longitudinal bars of the internal girders (bar mark 19 in Figure A1, Appendix A) were non-conforming in the yield-strength criterion, while the 20 mm and 25 mm specimens conformed to Grade 420/Class 60 requirements. The non-conforming exposed 12 mm bars were subsequently replaced and were not relied upon in the final rehabilitated reinforcement system.
According to the project’s general structural notes, the specified 28-day concrete strength for the bridge superstructure elements, including the box-girder superstructure, was 40 MPa, whereas the reinforcing steel was specified as deformed high-tensile bars with a minimum yield stress of 420 MPa. On this basis, the representative residual-strength value of 28 MPa adopted for the fire-damaged bottom slab and webs corresponds to approximately 70% of the original specified concrete strength.
The available steel-test sheets reported bar diameters of 12, 20, and 25 mm, and the principal tensile-test results are summarized in Table 4. These results were used as specimen-level conformity checks rather than as a basis for developing zone-specific residual steel stress–strain curves. Both Rp0.2 and ReH are retained in the table as reported in the laboratory sheets for traceability.
Table 4.
Summary of reinforcing steel tensile-test results from the official assessment report.
The steel-test results were interpreted as specimen-level evidence rather than proof of a spatially uniform residual steel property throughout the span. The 12 mm non-conformity was considered a localized direct-exposure effect, whereas the 20 mm and 25 mm results supported the adequacy of the larger tested bars. The global flexural model was therefore not reduced uniformly on the basis of the 12 mm results, and the final adequacy was assessed through the strengthened section and field load verification.
4.7. Engineering Interpretation of the Test Results
Based on the inspection and testing findings, the damaged span did not experience complete material failure. Instead, the evidence indicated localized concrete degradation, conforming to 20 mm and 25 mm reinforcement, non-conforming exposed 12 mm upper longitudinal reinforcement in the internal girders, and cracking concentrated near the intended fixed-support region.
These findings supported treating the span as a structurally distressed but repairable unit, provided that the geometric distortion was corrected, the intended support behavior was restored, and the completed span was strengthened according to the analytical verification.
The residual evidence was also interpreted inversely to characterize the fire exposure without claiming a complete thermal reconstruction. The core-strength ratios relative to the original 40 MPa concrete were approximately 0.93, 0.63, and 0.62; the affected-to-sound UPV ratio ranged from about 0.82 to 0.94; the exposed 12 mm bars retained approximately 96–97% of the specified 420 MPa yield value; and the pink discoloration with limited surface scaling indicated surface heating with limited penetration. Taken together, these observations are consistent with localized, non-uniform thermal exposure, with stronger heating near the fire source and a rapid reduction with distance and depth. They do not provide a temperature–time curve or a unique peak-temperature profile.
Because the material database is limited, the consequence of concrete-strength variability was checked as a lower-bound robustness exercise. The three core strengths have a mean of 29.04 MPa and a sample standard deviation of approximately 7.14 MPa. Because only three core results were available, this statistic was used solely to define an illustrative global lower-bound robustness case and should not be interpreted as a statistically representative characterization of the concrete-strength distribution. If the lowest reported core value, 24.74 MPa, or an approximate mean-minus-one-standard-deviation value, 21.9 MPa, is used as a global lower-bound check, the governing shear D/C ratio would increase only from about 0.529 to approximately 0.559 or 0.594, respectively, when the concrete shear contribution is conservatively scaled with the square root of concrete strength. These checks do not replace spatial material mapping or the completed-state CSiBridge model, but they show that the main shear conclusion is robust to the documented core scatter. The critical exterior-girder flexural D/C was already treated as a limited-reserve verification point and was therefore interpreted together with the field load-verification test, not as a stand-alone acceptance criterion.
4.8. Outcome of the Official Assessment
The official report issued several recommendations that were directly linked to the rehabilitation strategy adopted later. These included:
- Forwarding the findings to the project consultant to determine the required structural treatment.
- Conducting a total-station survey and comparing the measured levels with the pre-fire conditions.
- Executing the necessary repair work for the damaged structure.
- Performing a load-verification test after repair to confirm the adequacy of the affected bridge segment under the relevant loading condition.
- The remaining top-slab casting works in Spans 15 and 16 were resumed only after the sagged areas were lifted to the approved levels, as later confirmed in follow-up project correspondence dated 16 October 2023.
5. Structural Interpretation of Damage and Support Transformation
5.1. Intended Structural Behavior Before the Fire
Under the original staged-construction scheme, Span 15 formed part of a three-span unit with a pin–fixed–fixed–pin-support arrangement. The construction-stage structural response was expected to change gradually as the section was built. In the final design condition, the box girder obtains its global bending resistance mainly from the longitudinal flexural reinforcement distributed between the top and bottom slabs: the top slab provides the principal negative-moment resistance over the fixed-support regions, whereas the bottom slab provides the principal positive-moment resistance in the span regions. The webs mainly transfer shear, maintain sectional integrity, and contribute longitudinal stiffness to the partially completed section.
However, during the first and second casting stages, the structural system had not yet reached the final intended configuration. At the time of the fire, Spans 15, 16, and 17 consisted only of the bottom slab and webs; the top slab had not been cast. As a result, the members were not yet a closed-box girder with complete torsional and flexural continuity, but a partially completed open-top section, whose stability and geometry still depended heavily on the temporary formwork and shoring system.
5.2. Loss of Temporary Support Due to Fire
To avoid repeating the chronology already presented in Section 3, this section focuses on the structural consequence of the incident. The loss of the plywood sheets and longitudinal timber bearers removed the temporary soffit support that had been intended to remain until the final top-slab casting stage, forcing the incomplete open-top section to carry self-weight before the closed-box system and top-slab reinforcement were available.
5.3. Transformation of Support Behavior
Accordingly, the key effect was the effective loss of rotational restraint near the intended fixed-support region, not a mechanical change in the permanent bearing layout. While the top slab was still missing, the fixed-end region could not develop the intended negative flexural resistance, and the response shifted toward a pin–pin-like condition.
5.4. Interpretation of the Crack Pattern
The crack pattern is interpreted here as evidence of the governing distress mechanism rather than as a repeated damage description. The observed cracks near the intended fixed-support region were predominantly vertical or near-vertical, not diagonal, supporting a negative-flexural interpretation rather than a primary shear mechanism. Because the top slab and its longitudinal negative-moment reinforcement had not yet been cast, the webs and bottom slab had to participate in a bending-resistance mechanism for which they were not intended to act alone.
5.5. Simplified Closed-Form Check of the Crack-Initiation Mechanism at the Intended Fixed-Support Side
To further support the interpretation of the crack-initiation mechanism, a simplified closed-form check was performed using only quantities documented in this study. This check is not a staged fire-event simulation and does not replace a transient thermal or nonlinear construction-stage model. Its limited purpose is to test whether the incomplete bottom-slab-plus-webs section could reasonably maintain fixed-end negative restraint after loss of the temporary soffit support.
Using the incomplete-section self-weight w = 155.6 kN/m and the effective span L = 33.66 m adopted in the lifting spreadsheet (Section 6.2), the hogging moment associated with maintaining fixed-end restraint under self-weight is M = (wL2)/8 = 22,037 kN·m. This value is consistent with the moment level reported in Table 5, where Mdead reaches approximately 21,979 kN·m near the examined lifting/control location.
Table 5.
Representative jack-line forces and moment-control values from the lifting spreadsheet.
For the incomplete fire-stage section listed in Table 2, the gross inertia is I = 1.179 m4, the centroid is 0.40 m above the bottom edge, and the overall depth of the incomplete section up to the underside of the missing top slab is about 1.63 m. Therefore, the distance from the centroid to the top fiber is approximately 1.23 m, and the corresponding top-fiber section modulus is St = I/yt = 0.959 m3. Using fr = 0.62 according to ACI 318 [21], with = 40 MPa at the intended fixed-support side where thermal surface scaling was almost absent, gives Mcr = fr St ≈ 3760 kN·m. Using the transformed inertia in Table 2 gives Mcr ≈ 4170 kN·m. Accordingly, the demand-to-cracking ratio M/Mcr is about 5.3–5.9.
This ratio indicates that vertical flexural cracking near the intended fixed-support side was mechanically expected once the temporary soffit support was lost and the incomplete section was forced to develop negative restraint without the top slab and its principal longitudinal reinforcement. This conclusion is also consistent with the reinforcement concept described in Section 3.3: at the fire stage, the top slab and its negative-moment bars were absent, whereas the longitudinal bars present near the upper web region were not detailed to act as the principal negative-moment reinforcement of the completed box girder.
The measured sag provides an independent geometric consistency check. Elastic deflection estimates for the same self-weight and section stiffness give approximately 31–34 mm for a fixed–pin idealization, compared with approximately 74–82 mm for a pin–pin idealization. The measured maximum sag at point Bs was 100 mm before realignment (Section 6.1). Considering cracking, temporary-support loss, local construction effects, and field measurement of the damaged configuration, the measured sag is much closer to the pin–pin estimate than to the fixed–pin estimate. Thus, the simplified closed-form check supports the fixed–pin to pin–pin-like interpretation without claiming to be a full staged-construction fire simulation.
6. Jack-Based Realignment Strategy and Lifting Stages
6.1. Measured Sagging and Need for Controlled Lifting
The largest measured sag was recorded at point Bs, located at midspan on the bridge centerline. The value was obtained from total-station surveying as the difference between the design level at the top surface of the bottom slab (26.505 m) and the pre-lifting surveyed level (26.405 m), giving a maximum sag of 100 mm. Because the post-fire behavior of the span had shifted toward a simply supported response, particularly near the cracked intended fixed-support region, controlled jack-based realignment was adopted.
The surveyed level at point Bs was 26.477 m after jack-based realignment, representing a cumulative lift of 72 mm and an approximately 28 mm residual offset below the design level. This residual offset was intentionally retained as a controlled construction-geometry value rather than treated as an independent serviceability acceptance criterion. The cumulative lift reported in Table 6, therefore, represents the controlled realignment achieved during the lifting operation, not a requirement to cancel the entire measured sag along the length and cross section of Span 15.
Table 6.
Records of the staged jack lift and measured levels at control points A–I.
Full cancellation of the measured sag was not pursued because the required larger jacking forces could approach or exceed the approximately 6-ton capacity limit per scaffold column/jack support, and such over-jacking could have induced an unfavorable local negative moment or reverse-curvature condition in the incomplete section and increased the risk of scaffold-column instability or buckling. The adopted operation therefore recovered most of the measured sag while maintaining a positive-moment reserve and safe temporary-support force levels; the subsequent strengthened top slab, analytical verification of the completed unit, and final load-verification test confirmed that the residual offset did not prevent satisfactory service-stage behavior.
6.2. Analytical Basis of the Lifting Procedure
An Excel spreadsheet based on classical closed-form solutions for deflection and bending moment in simply supported beams under concentrated and uniformly distributed loads was created to guide the lifting operation (see Supplementary Materials), because the post-fire response of Span 15 was closer to a simply supported condition after the loss of temporary soffit support and the reduced effective restraint near the intended fixed-support side. The spreadsheet was a field tool for selecting jack forces and moment redistribution during lifting, not a replacement for the subsequent finite element analysis.
In the spreadsheet, the self-weight of the partially completed girder was modeled as a uniformly distributed load and the selected jack lines as concentrated lifting loads at specified longitudinal locations. Superposition combined the classical simply supported solutions for both. One lifting line across the scaffold width, corresponding to 12 manual jacks across the bridge width, was assumed as the basic control action, and candidate jack lines were examined according to the available scaffold grid positions. In the final corrected arrangement, six active scaffold lines were selected: two in the midspan region separated approximately by the 1.5 m scaffold grid spacing, two toward the fixed-support side, and two toward the simple-support (pin) side, respecting the computed field capacity limit of approximately 6 metric tons per scaffold column/jack support (≤59 kN).
For clarity, Mdead in Table 5 denotes the positive bending-moment magnitude caused by the self-weight of the partially completed section at the examined jack-line location, whereas Mjack denotes the opposing moment magnitude induced by the selected jack line at the same location. The table reports moment magnitudes as positive values for comparison, and the reserve term was therefore calculated as Mdead − Mjack. In simplified form, the spreadsheet used the classical simply supported relationships for a uniformly distributed load and concentrated point loads, including Mdead(x) = wx(L − x)/2 for the dead-load component and superposed point-load influence terms for the jack forces. The adopted control condition was to keep Mdead − Mjack positive at the selected lifting lines.
The representative spreadsheet run used a self-weight of 155.6 kN/m, effective span length of 33.66 m, E = 24,870,000 kN/m2, and I = 1.28284 m4 for the bottom-slab-plus-webs section. The effective analytical length of 33.66 m was measured from the edge of the fixed-support crossbeam, where cracking was observed, to the centerline of the pot bearing at the simple-support (pin) side. Each active lifting line consisted of 12 manual jacks. The selected arrangement activated six candidate scaffold lines (F6, F7, F11, F12, F16, and F17), whereas the inactive candidate lines were assigned zero force. In the updated spreadsheet, a Solver-based VBA macro was added to search for the best non-zero lifting forces at the selected locations while enforcing non-negative jack forces, a non-negative moment reserve (Mdead − Mjack ≥ 0), integer jack-force values, a maximum 25% difference between adjacent active jack forces, and the approximately 6-ton field limit per scaffold column/jack support. Table 5 summarizes the principal analytical control values for this representative lifting configuration.
Accordingly, the lifting operation was performed in stages rather than as a single full correction. The spreadsheet calculations were used together with continuous field monitoring to avoid excessive lifting-induced negative moment and to limit the risk of additional cracking.
6.3. Field Lifting Arrangement
The monitoring positions used during the lifting operation were denoted as As to Is. Points As, Bs, and Cs were located at the midspan at the right, center, and left transverse positions, respectively. Points Ds, Es, and Fs were located near the intended fixed-support side, approximately 0.50 m from the support crossbeam internal edge, at the right, center, and left transverse positions. Points Gs, Hs, and Is were located near the free-end side, approximately 0.50 m from the support crossbeam internal edge at the corresponding right, center, and left transverse positions. These points were used to monitor the realignment process across the girder width and along the span during the staged lifting.
The locations of the monitoring points As to Is used during the staged lifting operation are shown on the annotated bridge layout in Figure A2 (Appendix A), where the points are mapped relative to Span 15, the midspan region, and the support zones.
The updated underside lifting setup, including the paired jack lines at the midspan and near the simple-support side, is illustrated in Figure 6.
Figure 6.
Updated jack-based realignment setup beneath Span 15: (a) paired jack lines in the midspan region; (b) paired jack lines near the simple-support (pin) side. The same lifting strategy also included two active lines toward the fixed-support side, as listed in Table 5.
6.4. Staged Lifting Records
The lifting operation was conducted in phases on October 7, 8, 9, 10, and 12, 2023, and the field records are summarized in Table 6. The cumulative lifts confirm that the largest correction was required in the midspan region (6.3–7.4 cm at points As-Cs), with smaller but still important corrections near the support zones (1.0–2.5 cm at Ds-Fs and 1.0–4.0 cm at Gs-Is).
7. Finite Element Modeling, Strengthening, and Analytical Verification
7.1. Finite Element Model and Post-Fire Material Assumptions
A three-span finite element model of the investigated bridge unit was developed in CSiBridge v23.3.1 using an area-object representation of the six-cell reinforced concrete box girder. The model covered Spans 15, 16, and 17 with a 35 m + 35 m + 35 m span arrangement, and the support scheme was represented consistently with the pin–fixed–fixed–pin structural system described previously. The adopted bridge section followed the geometry described in Section 3.2.
The original design notes indicated that the bridge superstructure concrete had a specified 28-day compressive strength of 40 MPa, with the specified minimum yield stress of the reinforcing steel being 420 MPa. The bottom slab and webs of the rehabilitated analytical model were assigned the 28 MPa residual concrete material, which is close to the mean core value, and the newly cast top slab and any unaffected parts were assigned the 40 MPa concrete material, where applicable. This distinction was chosen because the numerical model was designed to validate the post-fire rehabilitated state of the structure, not to model the transient thermal event.
Although the incident occurred during staged construction, the CSiBridge model used in this study was not a staged-construction analysis model. It represented the completed rehabilitated three-span unit after jack-based realignment, crack and surface repairs, completion of the strengthened top slab, and assignment of post-fire residual material properties. The construction-stage response at the time of the fire was interpreted from field evidence, section-property comparison, crack pattern, loss of temporary support, and jacking records, rather than from a sequential staged-construction simulation.
Accordingly, the CSiBridge model should not be interpreted as proof of the transient thermal exposure, temporary-support failure sequence, restraint transition, crack initiation, or jacking-induced force redistribution before top-slab completion. Those aspects were evaluated as an engineering interpretation based on the available site evidence, section-property comparison, crack pattern, survey data, and lifting records. The numerical model was used only for completed rehabilitated-state verification after the section was repaired, strengthened, and closed by the top slab.
The adopted material parameters were taken from the CSiBridge model report. In the CSiBridge material library, the labels “Concrete 28 MPa” and “Concrete 40 MPa” are rounded narrative designations; their exact input strengths are = 27.58 MPa (4000 psi) and = 41.37 MPa (6000 psi), respectively. The rounded designations are retained in the narrative for readability, whereas the exact software values are reported in the model description and Table 7. In the model report, the Concrete 28 MPa material had an elastic modulus of approximately 24.86 GPa, whereas the Concrete 40 MPa material had an elastic modulus of approximately 29.73 GPa. The A615Gr60 reinforcing steel was treated as having a yield strength of ~413.7 MPa and a strength of ~620.5 MPa. These values provided the material basis for checking the rehabilitated superstructure with the strengthened reinforcement layout and the documented moving-load definition. The modeled yield strength is 413.7 MPa, corresponding to material definition CSiBridge A615Gr60, which is slightly lower than the nominal project value of 420 MPa.
Table 7.
Summary of finite element modeling assumptions, design loads, material parameters, lane definition, and load combinations adopted in the CSiBridge model.
For improved reproducibility, the CSiBridge bridge object was generated as an area-object model rather than as a spine or solid-object model. The top slab, bottom slab, and webs of the six-cell box girder were represented using shell/area objects. The bridge-object discretization used a maximum segment length of 3 m for deck spans, bent cap beams, and bent columns, with a preferred maximum submesh size of 2 m for the area-object model. Each 35 m span was divided into 16 longitudinal segments with variable segment lengths selected to match the locations of diaphragms, crossbeams, and geometric changes. The diaphragms were defined using solid diaphragm properties, including 0.30 m and 0.90 m diaphragm thicknesses, with the girder depth and slab material used in the diaphragm definition. The concrete barriers were represented as superimposed dead loads in the baseline model, while their stiffness contribution was examined separately in the sensitivity study by representing them as shell/area elements.
Two concrete material definitions were used in the model. The fire-affected bottom slab and webs were assigned the residual concrete material, with = 27.58 MPa, unit weight = 23.56 kN/m3, Ec = 24.86 GPa, Poisson’s ratio = 0.20, thermal expansion coefficient = 9.90 × 10⁻⁶/°C, and shear modulus = 10.36 GPa. The newly cast top slab was assigned the 40 MPa concrete material, with = 41.37 MPa, unit weight = 23.56 kN/m3, Ec = 29.73 GPa, Poisson’s ratio = 0.20, thermal expansion coefficient = 9.90 × 10⁻⁶/°C, and shear modulus = 12.39 GPa. Grade 60 reinforcement was assigned with Es = 199.9 GPa, fy = 413.7 MPa, fu = 620.5 MPa, Poisson’s ratio = 0.30, and thermal expansion coefficient = 1.17 × 10⁻⁵/°C.
The bridge support conditions were generated through the CSiBridge bridge-object bearing and bent definitions rather than by manually assigning independent support springs. At the pin/expansion side, the end shell elements of the girder were connected to three bearing points representing the pot-bearing locations through automatically generated linear expansion–joint links. The expansion bearing definition restrained the vertical translation and the translation normal to the layout line, while releasing the longitudinal translation and rotations. At the fixed side, CSiBridge generated fixed links connecting the cross beam/bent line to the shell elements of the box-girder system at the girder support locations. The fixed bearing definition restrained the vertical, transverse, and longitudinal translations. The end bent was defined as “connect to girder bottom only,” whereas the intermediate bent was defined as integral with the continuous superstructure. These definitions were used to reproduce the intended fixed-expansion support arrangement of the bridge in the completed rehabilitated model.
The baseline finite element model was kept linear elastic, and no additional property modifiers were assigned to the shell/area or frame objects. For the shell/area objects, the section type was defined as Shell-Thin, with no material overwrite, no area springs, no additional area mass, and no edge releases. Automatic area meshing was used with the MaxSize option, edge restraints were retained, and automatic edge constraints were enabled to maintain compatibility between connected shell/area objects. Therefore, the stiffness reduction in the baseline model was not introduced through arbitrary stiffness modifiers; instead, it was represented through the residual 28 MPa concrete material assigned to the fire-affected bottom slab and webs. Stiffness modifiers were examined only in the sensitivity study, and their effect on the global verification response was negligible.
The reinforcement layout used in the CSiBridge design/rating model was entered according to the shop drawings attached to the manuscript. Longitudinal and transverse reinforcement were assigned separately for the exterior and interior girders using A615Gr60 reinforcement, with the development-length code set to AASHTO LRFD. These reinforcement data were used in the CSiBridge superstructure flexural design/rating request for the multi-cell concrete box girder. The reinforcement was therefore considered in the strength verification of the rehabilitated section, while the baseline global stiffness of the linear-elastic shell model was governed by the assigned shell/area section properties and concrete material definitions rather than by a nonlinear-reinforced concrete cracking model.
7.2. Design Loads, Lane Definition, Material Parameters, and Load Combinations
A total of five floating design lanes were used in the CSiBridge model. This lane definition was chosen to match the actual field-load arrangement and the transverse width of the tested bridge unit. The defined lanes were LANE1_Right, LANE2, LANE3, LANE4, and LANE5_Left, with lane widths and offsets varying along the bridge layout line as required. The five-lane configuration is significant in terms of the live-load envelope because the moving-load response of a wide multi-cell box girder is directly related to the number, width, and transverse location of the floating lanes.
The moving-load case used for the design response was MV_HL93. The vehicle definitions were taken from the AASHTO vehicle library and included HL-93M, HL-93K, HL-93S, and HL-93F, with an axle factor of 1.33 for the principal HL-93 vehicles and 1.15 for the fatigue vehicle. The model also included permanent load patterns for self-weight, concrete barriers, and wearing surface, in addition to temperature, temperature-gradient, braking, and seismic response-spectrum actions. Table 7 summarizes the main finite element modeling assumptions, material parameters, support definitions, load definitions, design-code option, and load combinations documented in the CSiBridge model.
Because the bridge was represented as a three-dimensional area-object model, the superstructure design/rating request used the “Use Directly Girder Forces from Analysis” option for live-load distribution to girders. This option was adopted so that the reported flexural and shear demand-to-capacity (D/C) ratios would be based on the finite element force envelopes generated from the actual lane placement and structural geometry, rather than on empirical girder distribution factors developed for simplified girder-line idealizations. Therefore, the reported D/C ratios should be interpreted within the assumptions of the adopted CSiBridge area-object model, AASHTO LRFD 2017 design/rating settings, and the reinforcement layout entered from the shop drawings. Other live-load-distribution options, such as user-specified factors or design-code distribution factors, were not used as the primary verification basis in this study.
The CSiBridge design/rating module used in this study reported the superstructure flexure and shear checks using AASHTO LRFD 2017, which was the latest AASHTO LRFD design-code option available in the employed CSiBridge v23.3.1 installation. Therefore, all tabulated design/rating outputs and D/C ratios extracted from CSiBridge are identified as AASHTO LRFD 2017 results. References to AASHTO LRFD 2020 in the broader discussion are limited to general constructability and staged-behavior considerations and are not used as the software design/rating output standard.
The AASHTO framework was adopted because the governing Iraqi project requirements and the approved design/checking documents for this bridge were based on AASHTO provisions. Accordingly, the CSiBridge verification model was kept within the AASHTO LRFD framework available in the software, while the reported design/rating outputs remain explicitly identified as AASHTO LRFD 2017 results.
7.3. Strengthening Strategy Adopted in the Analytical Model
According to the structural interpretation of the fire damage, the strengthening strategy was governed by the loss of effective negative flexural resistance near the intended fixed-support region during the construction stage. Therefore, strengthening was introduced mainly by increasing the longitudinal reinforcement of the top slab, because this slab provides the principal negative-moment resistance in the completed box-girder configuration.
The upper and lower reinforcement layers in the top slab of the rehabilitated fixed-support region were upgraded to Ø32 @ 100 mm. The top-slab layers in the span and near-support regions were detailed as Ø25 @ 100 mm spacing. In addition, the top-slab reinforcement was strengthened and extended beyond the original detailing length, increasing the reinforced length from slightly more than one-fifth of the span to about one-third of the span. The bottom-slab reinforcement was maintained as per the original design, and the final strengthened section was verified by the CSiBridge model adopted.
This modeling approach was consistent with the observed damage mechanism. The fire-damaged bottom slab and webs were simulated with the reduced residual concrete properties, while the newly cast and strengthened top slab provided the negative-moment capacity for the completed rehabilitated section. The analytical verifications were therefore made for the residual material condition as well as for the restored structural system after the strengthening works.
7.4. Main Analytical Verification Results
The finite element results indicated that the rehabilitated configuration satisfied the required response and strength checks under the reduced post-fire concrete strength in the bottom slab and webs, the increased top-slab reinforcement, and the adopted load combinations. The dead-load vertical displacement envelope showed a maximum downward displacement of 23.5 mm, and under moving load (MV_HL93), the envelope varied between about +2.864 mm and −10.3 mm.
The bending-moment response remained consistent with a continuous three-span structural system. The dead-load M3 envelope for the entire bridge section reached approximately +36,561 kN·m and −51,270 kN·m. The corresponding MV_HL93 moving-load M3 envelope reached approximately +17,420 kN·m and −17,482 kN·m. The shear design/check plot showed that the demand-to-maximum concrete shear-capacity ratio remained below unity, with a maximum value of approximately 0.5288, indicating that shear did not govern the rehabilitated configuration.
The CSiBridge design/rating plots were checked for flexure for the left exterior girder, right exterior girder, and five interior girders. In these plots, the moment-demand envelope was directly compared with the positive and negative resistance envelopes. All checked girders had flexural D/C < 1.0 throughout the girder set, indicating that all plotted demands were within the available resistance. The highest M3 demand plotted was approximately +12,368 kN·m at Interior Girder 2, and the lowest M3 demand plotted was approximately −15,274 kN·m at Interior Girder 3. The results of the principal analytical verifications are given in Table 8, and the flexural verification results by girder are given in Table 9.
Table 8.
Summary of the principal analytical verification outputs for the rehabilitated model.
Table 9.
Flexural demand/capacity check by girder.
It should also be noted that the governing positive-flexure utilization of the left exterior girder (D/C = 0.998) occurs in the completed rehabilitated configuration, where the compression zone is mainly within the newly cast 40 MPa top slab and the tensile resistance is governed primarily by the conforming bottom-slab reinforcement. Therefore, this critical utilization point was considered less sensitive to the residual-strength scatter of the fire-affected concrete than the shear checks, and it was interpreted together with the field load-verification test.
The D/C check was not used as a stand-alone acceptance basis. The same rehabilitated model was also reviewed under the permanent-load, moving-load, service, braking, temperature, temperature-gradient, and response-spectrum cases summarized in Table 7, while the shear check remained below unity as shown in Table 8. The field load-verification test then provided independent service-stage confirmation of the rehabilitated-span response. Thus, the critical exterior-girder D/C value identifies a limited reserve in the selected flexural design/rating output, but the rehabilitation decision was based on the combined analytical and field-verification evidence. Figure 7 presents the adopted finite element model, the five-lane moving-load definition, and the principal analytical verification outputs used to check the strengthened configuration.
Figure 7.
Analytical model and key CSiBridge outputs: (a) finite element model, (b) five-lane layout, (c) M3 envelope of the entire bridge section under moving HL-93 loadcase (MV_HL93, envelope Max/Min), (d) flexural response by girder, (e) shear D/C check for all girders (AASHTO LRFD 2017 shear check), and (f) vertical displacement envelope of the entire bridge section under MV_HL93. Panels (c,e,f) are cropped from the CSiBridge response display of the area-object model, retaining the full plot area with its embedded title and extreme-value lines; the plotted extremes are +17,420.2/−17,482.1 kN·m in (c), demand-to-capacity ratios of 0.5288/0.0592 in (e), and vertical displacements of +2.864 × 10⁻³ to −1.03 × 10⁻² m in (f), where the software E-notation denotes scientific notation (e.g., 2.864E−03 m = 2.864 × 10⁻³ m).
7.5. Interpretation of the Analytical Verification
The five-lane moving-load definition represents a realistic transverse loading arrangement for the wide six-cell box girder and is consistent with the later field-load verification philosophy. The resulting displacement and moment envelopes remained within the adopted service and strength limits, the maximum shear demand ratio remained substantially below unity, and the flexural demands of all examined girders remained within the positive and negative resistance envelopes.
These results support the adequacy of the adopted strengthening scheme: the model indicates that the repair strategy restored the completed-section mechanism by combining reduced post-fire concrete properties for the affected components with increased top-slab reinforcement in the negative-moment region, and the rehabilitated span was therefore analytically suitable for final field verification by load testing.
8. Load-Test Verification
The load-verification test was not intended to reproduce the factored design envelope, but to confirm that the rehabilitated span exhibited satisfactory service-stage behavior under a documented heavy field-loading arrangement after repair. In the terminology of the AASHTO Manual for Bridge Evaluation, the test is best interpreted as a diagnostic load-verification test rather than a formal proof-load rating test [24]. The L/800 = 43.75 mm value was therefore used as a serviceability reference indicator based on the nominal 35 m span length, not as a formal code-based acceptance criterion for rating the 350-ton test load. The adopted truck-loading arrangement and field load test on the rehabilitated span are shown in Figure 8.
Figure 8.
Load-test verification of the rehabilitated Span 15: (a) updated load-verification truck arrangement showing all five loaded lanes, each carrying one 30-ton central truck flanked by two 20-ton trucks, together with the transverse locations of monitoring points A–F; (b) field test vehicles positioned on the bridge deck during the final verification stage. In panel (a), A–F are the monitoring points; CAD colors distinguish bridge/lane geometry (blue), vehicle outlines (gray), truck weights and dimension/setting-out lines (red), and numerical dimensions (green).
8.1. Field Instrumentation and Measurement Arrangement
The field load-verification test was monitored at six points denoted A, B, C, D, E, and F, where point A was located at the right exterior girder, point F at the left exterior girder, and the remaining points were approximately equally spaced between them across the bridge’s width. The transverse positions are shown in Figure 8a. Vertical deflection was measured by suspending a slender steel rod from each selected point beneath the bridge soffit to a dial gauge fixed to an independent ground-supported pole. The dial gauges were installed approximately 2 m above the ground to permit direct reading, whereas the bridge underside was approximately 15 m above the ground.
The hanging rods passed through guide rings that allowed vertical movement while limiting sideways pendulum motion, transferring the downward movement of the bridge directly to the dial gauges. Figure 9 shows representative views of the field instrumentation system.
Figure 9.
Field instrumentation used for load-verification testing of Span 15: (a) general layout of the ground-supported measuring posts beneath the bridge, (b) close-up view of the dial gauge, (c) dial gauge mounted on an independent post with a hanging transfer rod, and (d) hanging steel rods extending from the bridge soffit to the measurement system.
8.2. Analytical Simulation of the Field Load-Verification Test
To further validate the rehabilitated bridge model, the field load-verification test was simulated analytically in CSiBridge using the same five-lane loading arrangement applied during the field test: two loaded lanes in one traffic direction (lanes 1 and 2) and three in the opposite direction (lanes 3, 4, and 5), each carrying three tipper trucks arranged as one 30-ton truck between two 20-ton trucks, giving 70 tons per lane and 350 tons for the full five-lane condition. These truck weights corresponded to the weighed field vehicles used in the actual test.
In the analytical model, each truck was represented by six wheel-group loads corresponding to the left and right wheel groups of the front and two rear axles, arranged to match the field-loading layout and the actual staged sequence. The loading stages L1–L5, followed by unloading stages U4–U0, were simulated to allow direct comparison with the field readings; the final full-load model and the corresponding exterior-girder vertical displacement outputs are shown in Figure 10.
Figure 10.
CSiBridge simulation of the five-lane field load-verification test: (a) full L5 five-lane truck-loading case represented by discrete wheel-group loads, where each arrow denotes an applied wheel-group load with its magnitude in tonnes; (b) vertical displacement response of the left exterior girder under the full-load verification case; and (c) vertical displacement response of the right exterior girder under the full-load verification case. The E-notation appearing inside the software plots is generated automatically by CSiBridge and denotes scientific notation (e.g., 8.000E−03 m = 8.000 × 10⁻³ m); the governing displacement values are reported in Section 8.3.
8.3. Comparison Between Measured and Theoretical Deflections
The comparison between measured and theoretical deflections showed that the numerical model reproduced the overall structural response of the rehabilitated span in a consistent manner. At all six monitoring points, the analytical model captured the progressive increase in deflection during loading, the peak response at the full-load stage (L5), and the subsequent recovery during unloading. At L5, the measured deflections at points A-F were 5.69, 5.66, 4.14, 5.82, 5.62, and 5.85 mm, respectively, whereas the baseline analytical values were 8.24, 8.03, 7.88, 7.73, 7.73, and 7.83 mm, respectively.
Thus, the baseline analytical model consistently predicted larger deflections than those measured in the field, while preserving the correct stage-by-stage trend and the overall transverse distribution of the response. At the full-load stage, the measured-to-theoretical ratio for the baseline model ranged approximately from 0.53 to 0.75, with an average of about 0.69. For comparison, Figure 11 also includes the RS + BR sensitivity model, which preserved the same response trend while showing closer agreement with the measured field deflections at all monitoring points.
Figure 11.
Measured, baseline analytical, and RS + BR sensitivity-model deflections during the staged loading (L0–L5) and unloading (U4–U0) sequence: (a) point A; (b) point B; (c) point C; (d) point D; (e) point E; (f) point F. In all panels, solid lines with circles denote the measured deflections, dashed lines with squares denote the baseline analytical model, and dotted lines with triangles denote the RS + BR sensitivity model.
8.4. Discussion of Correlation and Model Conservatism
The analytical model can be regarded as conservative because it overpredicted the measured deflections while preserving the correct response pattern. This is acceptable in rehabilitation assessment, where the model should provide a safe estimate of field performance rather than be numerically fitted only to the measured field readings.
Several factors may explain the remaining differences between the measured and theoretical values. First, the adopted wheel-group idealization and the discrete truck representation cannot reproduce every small variation in the actual axle positions and field contact conditions. Second, the actual field distribution of truck axle loads and transverse positions may not have coincided perfectly with the idealized analytical model. Third, the real bridge may have benefited from additional stiffness contributions from non-primary components and restraint effects that were not fully represented analytically. In addition, according to the CSiBridge modeler guidance, conventional mild reinforcement assigned through the bridge-object rebar definition is used for design checks but does not directly contribute to analytical stiffness unless it is explicitly modeled in another manner. This limitation likely contributed to the higher baseline deflections predicted by the load-test simulation.
The response at Point C remained the lowest measured-to-baseline ratio, which is reasonable because the central monitoring line is more sensitive to transverse load distribution, local diaphragm participation, and stiffness contributions from non-primary components that were idealized in the load-verification model.
Another practical source of variation was the field instrumentation. Because the dial gauges were mounted on independent posts near the ground, and bridge movement was transmitted through long hanging steel transfer rods extending from the bridge soffit to the ground-supported measurement system, slight thermal shortening of the rods during the cooler conditions at the end of the test may have caused the small negative residual readings observed after full unloading (U0). The exact rod lengths were not documented in the available field records. Thus, the slight upward residual values should be interpreted with caution and do not contradict the overall satisfactory elastic recovery observed during testing.
8.5. Targeted Sensitivity Study
A targeted sensitivity study was performed to distinguish the conservative baseline response from plausible stiffness-related and boundary-condition modeling effects. The baseline model was retained as the governing verification model, whereas the sensitivity cases were used only to interpret the difference between the analytical and field deflections. The cases examined the influence of explicit mild-reinforcement stiffness representation, concrete barrier stiffness, their combined effect, residual concrete strength, transverse load-position tolerance, support-restraint idealization, and a 10% upper-bound increase in selected flexural stiffness modifiers. The sensitivity study results at the full-load stage are summarized in Table 10.
Table 10.
Summary of targeted sensitivity study results at the full-load stage (L5).
The sensitivity variables were selected to bracket the main physically plausible sources of discrepancy between the analytical model and the field test. These included the stiffness contribution of mild reinforcement not included in the baseline analytical stiffness, possible barrier stiffness participation, residual concrete-strength uncertainty, transverse truck-position tolerance, support-restraint idealization, and a small upper-bound perturbation of flexural stiffness. The sensitivity study was therefore limited to explainable modeling uncertainties and was not used to redefine the governing baseline verification model.
In Table 10, the maximum deflection column reports the peak analytical deflection within each sensitivity case at L5, whereas the mean difference and change relative to BL are based on the mean absolute difference between the analytical and measured deflections at the six monitoring points. Therefore, the percentage change should be interpreted as a reduction in the model-field discrepancy, not as a direct percentage reduction in the maximum deflection.
The sensitivity results indicate that the discrepancy between the baseline analytical response and the measured field deflections was governed mainly by stiffness representation and, to a lesser extent, support-restraint idealization. Explicitly representing the principal mild reinforcement as zero-force tendon elements reduced the mean absolute difference from 2.44 to 1.21 mm. Adding concrete barrier stiffness alone reduced the difference to 1.99 mm, whereas the combined RS + BR case produced the best stiffness-based agreement, reducing the mean difference to 0.91 mm, which corresponds to a 62.6% reduction relative to the baseline discrepancy. The support-restraint sensitivity case also reduced the difference markedly to 1.28 mm; however, this case was retained as a boundary-condition sensitivity rather than as the preferred explanatory model because the support-restraint should be governed by the documented bearing behavior rather than by numerical fitting alone. In contrast, changing the fire-affected concrete strength to 30 MPa, modifying the load position within the examined tolerance, or increasing selected flexural stiffness modifiers by 10% produced only limited changes.
The field load-verification test, analytical comparison, and targeted sensitivity study showed that the rehabilitated span exhibited stable overall behavior. The baseline numerical model was a conservative representation of the actual response, and the RS + BR sensitivity case was able to account for part of the discrepancy in the model by adding stiffness contributions not considered in the governing baseline model.
8.6. Scope and Limitations of the Evidence
The purpose of this additional scope statement is to prevent over-interpretation of the available project evidence and the completed-state finite element model. The study is a documented engineering case history supported by field observations, official testing records, simplified lifting calculations, a simplified closed-form crack-mechanism check, completed-state verification, and field load testing. It is not a full forensic reconstruction of the transient fire exposure or construction-stage structural failure process. The scope of the available evidence and the principal limitations of the study are summarized in Table 11.
Table 11.
Scope of available evidence and principal limitations of the study.
The additional inverse thermal interpretation and lower-bound material checks should be read in the same limited sense. Their role is to test the internal consistency of the residual evidence and the robustness of the completed-state verification conclusions within the documented material scatter; they do not convert the study into a full forensic fire reconstruction or a calibrated transient thermal–structural analysis.
Thus, the evidence chain is considered sufficient for documenting and verifying the completed rehabilitated state of this specific bridge unit, but not for deriving a generalized fire-damage model or a universally applicable rehabilitation procedure.
9. Conclusions
Within the limits of the available project records, construction-stage support loss, rather than complete material failure, was interpreted as the principal controlling factor in the fire-related structural response of Span 15. The burning of the plywood sheets and longitudinal timber bearers removed the temporary soffit support prior to casting of the top slab, reducing the stiffness of the bottom-slab-and-webs section and leaving it with inadequate negative-moment resistance. The resulting vertical web cracking near the intended fixed-support region and the measured sagging were therefore interpreted as a negative-flexural restraint problem, related to a change from a fixed–pin construction-stage response toward a pin–pin-like condition. This interpretation is supported by the field evidence and simplified calculations, but it should not be read as a full transient fire-stage numerical validation. A simplified closed-form check further supports this interpretation: the negative-restraint demand required to maintain the intended fixed-end response exceeded the cracking moment of the incomplete bottom-slab-plus-webs section by approximately 5.3–5.9 times, and the measured sag was closer to the pin–pin estimate than to the fixed–pin estimate.
The inspection and testing program indicated localized, non-uniform concrete degradation and direct-exposure effects in small-diameter reinforcement, while supporting the project decision that the damaged span was repairable. The material evidence was limited to the official project testing records and should be interpreted as project-level engineering evidence rather than as a complete residual-material characterization. Section-property calculations, controlled jack-based realignment, and CSiBridge verification helped to develop a rehabilitation strategy that involved restoring geometry, completing the box section, and augmenting and extending the top-slab reinforcement in the negative-moment region. The updated completed-state model passed the main flexural and shear requirements for the adopted five-lane analytical model. The added inverse residual-evidence interpretation supports a localized, non-uniform thermal exposure envelope rather than a uniform through-depth fire exposure, and the lower-bound material checks indicate that the governing shear verification remains well below unity even when the lowest core value or an approximate mean-minus-one-standard-deviation strength is used as a global check.
The final 350-ton load-verification test was satisfactory, showing deflections well below the L/800 reference value for service-stage behavior and negligible residual response after unloading. The targeted sensitivity study showed that the differences between the measured and baseline analytical deflections were primarily associated with stiffness representation and secondary restraint effects. The documented work is therefore best viewed as a project-specific engineering case history and completed-state verification record for a rare construction-stage fire incident in an incomplete reinforced concrete box girder. It can inform similar assessments only when comparable project-specific inspection, material testing, structural interpretation, conservative modeling, controlled realignment, and field verification are available.
Supplementary Materials
The following supporting information can be downloaded at: https://www.mdpi.com/article/10.3390/buildings16142841/s1. The supporting information is available online as a single compressed archive containing the approved shop/reinforcement drawings, temporary formwork and shoring drawings, official post-fire material-testing and field load-test reports, truck-position layout, CSiBridge analysis/design report, and Excel files for jack-force calculations, sensitivity-study data, and field load-test deflection records. Some official project reports included in the Supplementary Materials are provided in their original Arabic form; the relevant technical data extracted from these reports are translated and summarized in English in the manuscript.
Author Contributions
Conceptualization, O.M.A.; methodology, O.M.A.; software, O.M.A.; validation, M.S.F.; formal analysis, O.M.A.; investigation, O.M.A. and M.S.F.; resources, M.S.F.; data curation, O.M.A. and M.S.F.; writing—original draft preparation, O.M.A.; writing—review and editing, O.M.A. and M.S.F.; visualization, O.M.A.; supervision, O.M.A.; project administration, O.M.A. All authors have read and agreed to the published version of the manuscript.
Funding
This research received no external funding.
Data Availability Statement
The original contributions presented in this study are included in the article and Supplementary Material. Further inquiries can be directed to the corresponding author. The data are not publicly available due to confidentiality restrictions associated with the project records.
Acknowledgments
The authors gratefully acknowledge the Resident Engineer Department of the Al-Sadreen Overpass Project, the executing construction company, and the Consulting Bureau of the University of Kufa/Faculty of Engineering for providing the necessary technical information, field data, and photographs used in this study.
Conflicts of Interest
The authors declare no conflicts of interest.
Abbreviations
The following abbreviations are used in this manuscript:
| A | Gross cross-sectional area |
| AASHTO | American Association of State Highway and Transportation Officials |
| ACI | American Concrete Institute |
| ASTM | American Society for Testing and Materials |
| BL | Baseline analytical model |
| BR | Barrier-stiffness sensitivity case |
| CFD | Computational fluid dynamics |
| D/C | Demand-to-capacity ratio |
| E | Modulus of elasticity |
| Es/Ec | Modular ratio used for transformed-section comparison |
| FEM | Finite element method |
| fy, fu | Yield and ultimate tensile strengths of reinforcing steel |
| HL-93 | AASHTO highway live-load model |
| I, Ix | Second moment of area/flexural inertia |
| L | Span length |
| LLD | Live-load distribution |
| MBE | Manual for Bridge Evaluation |
| Mdead | Dead-load bending moment |
| Mjack | Lifting-induced bending moment |
| NDT | Non-destructive testing |
| RC | Reinforced concrete |
| RS | Reinforcement-stiffness sensitivity case |
| RS + BR | Combined reinforcement- and barrier-stiffness sensitivity case |
| UPV | Ultrasonic pulse velocity |
| VBA | Visual Basic for Applications |
Appendix A
This appendix presents supplementary documentation supporting the main text, including the incident chronology, crack-survey summary, surface-scaling and repair summary, and full-page shop-drawing figures.
Table A1.
Chronology of assessment, repair, realignment, and verification works for the fire-affected Span 15.
Table A2.
Summary of fire source, surface scaling, and repair actions in Span 15.
Table A3.
Summary of observed web cracking in fire-affected Span 15.
Figure A1.
Representative cross-sections of the six-cell box girder at selected stations of the studied unit, based on the approved section shop drawings.
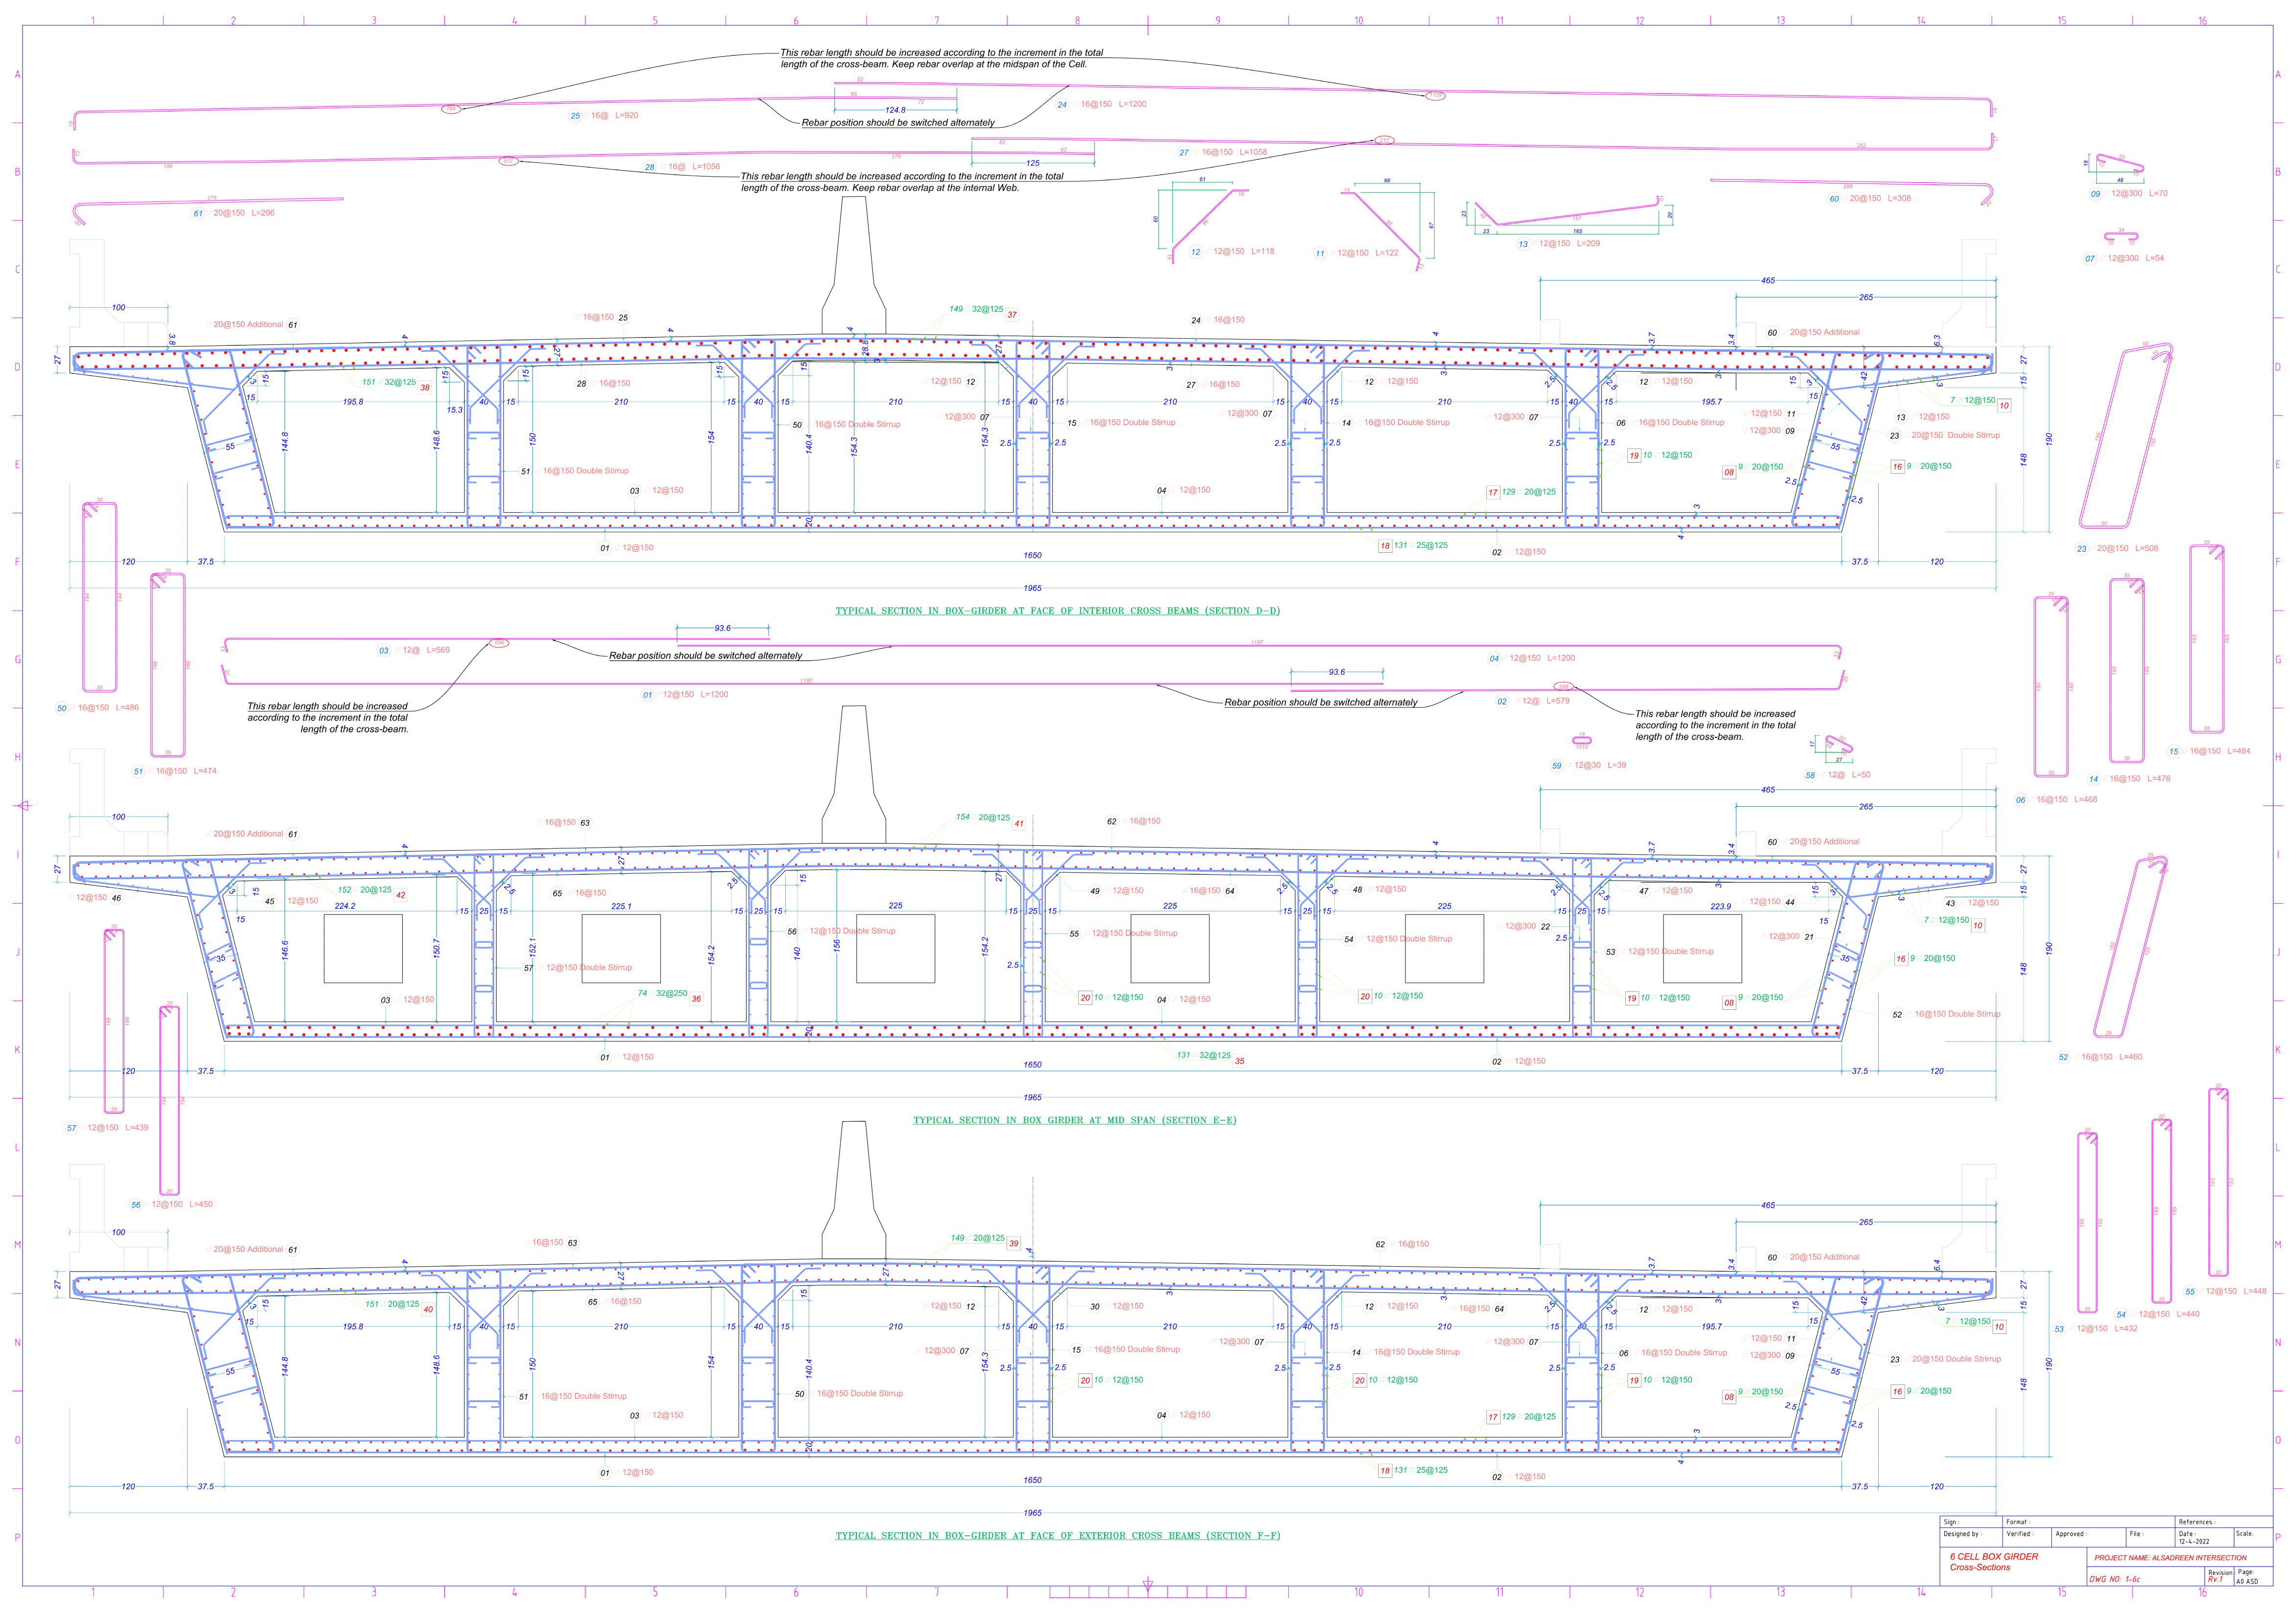
Figure A2.
Annotated longitudinal top-slab reinforcement layout for Spans 15–17 based on the approved reinforcement shop drawings; labels show inspection panels and jack-monitoring points.
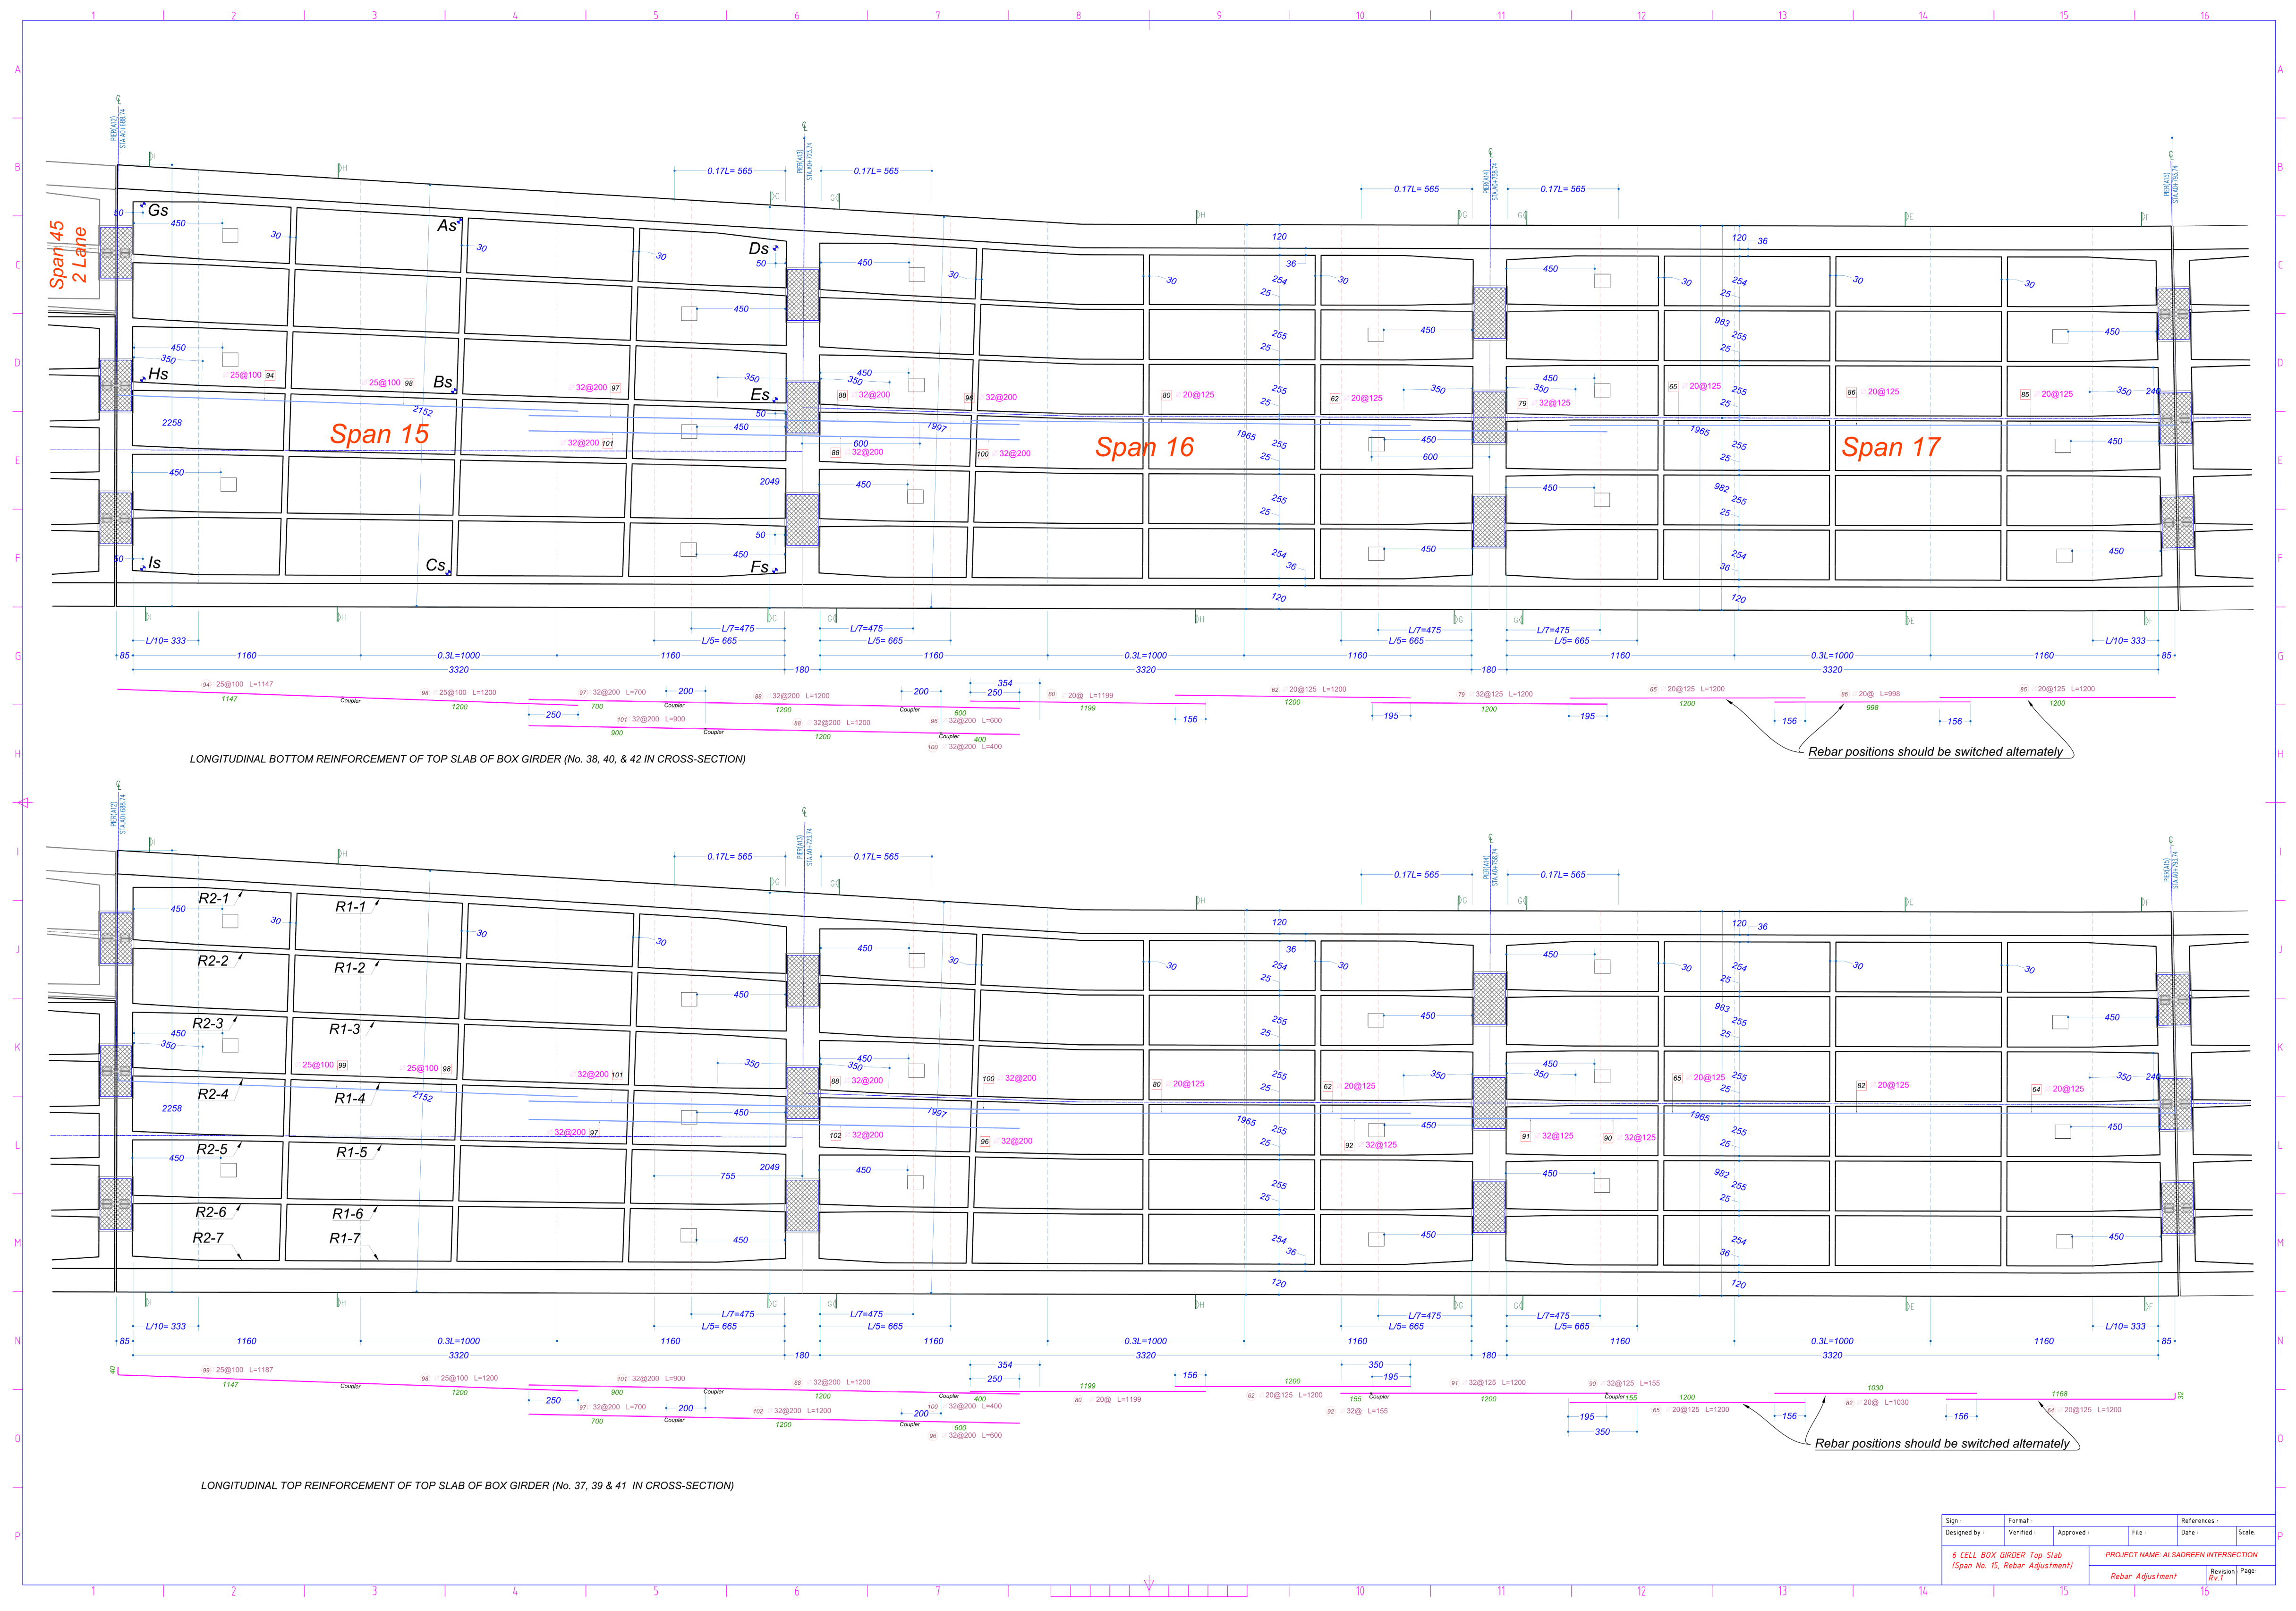
References
- AASHTO. AASHTO LRFD Bridge Design Specifications, 9th ed.; American Association of State Highway and Transportation Officials: Washington, DC, USA, 2020. [Google Scholar]
- ACI/TMS Committee 216. ACI 216.1-07/TMS-0216-07; Code Requirements for Determining Fire Resistance of Concrete and Masonry Construction Assemblies. American Concrete Institute: Farmington Hills, MI, USA, 2007.
- Babalola, O.E.; Awoyera, P.O.; Le, D.-H.; Bendezú Romero, L.M. A review of residual strength properties of normal and high strength concrete exposed to elevated temperatures: Impact of materials modification on behaviour of concrete composite. Constr. Build. Mater. 2021, 296, 123448. [Google Scholar] [CrossRef] [Scilit]
- Gosain, N. Effects of Fire on Concrete. Concr. Int. 2006, 28, 67–71. [Google Scholar]
- Chen, Y.; Xu, Z.; Huang, Y.; Xu, Q.; Rao, R. Damage analysis and assessment of concrete T-girder bridge based on fire scene numerical reconstruction. Adv. Bridge Eng. 2024, 5, 28. [Google Scholar] [CrossRef] [Scilit]
- Ibrahim, E.A.; Goff, D.; Keyvanfar, A.; Jonaidi, M. Assessing Post-Fire Damage in Concrete Structures: A Comprehensive Review. Buildings 2025, 15, 485. [Google Scholar] [CrossRef] [Scilit]
- Pagan-Martínez, J.J.; Paya-Zaforteza, I.; Hospitaler-Pérez, A. Post-fire assessment of composite steel-concrete box-girder bridges: Lessons from a recent incident. J. Constr. Steel Res. 2024, 214, 108425. [Google Scholar] [CrossRef] [Scilit]
- Liu, X.; Yu, C.; Quan, W.; Chen, L. Inspection, materials testing and field testing of a prestressed concrete box bridge after fire exposure. Fire Saf. J. 2019, 108, 102852. [Google Scholar] [CrossRef] [Scilit]
- Garlock, M.; Paya-Zaforteza, I.; Kodur, V.; Gu, L. Fire hazard in bridges: Review, assessment and repair strategies. Eng. Struct. 2012, 35, 89–98. [Google Scholar] [CrossRef] [Scilit]
- Hu, J.; Carvel, R.; Usmani, A. Bridge fires in the 21st century: A literature review. Fire Saf. J. 2021, 126, 103487. [Google Scholar] [CrossRef] [Scilit]
- Kodur, V.; Naser, M.Z. Fire hazard in transportation infrastructure: Review, assessment, and mitigation strategies. Front. Struct. Civ. Eng. 2021, 15, 46–60. [Google Scholar] [CrossRef] [Scilit]
- Liu, Z.W.; Li, G.-Q.; Paya-Zaforteza, I.; Cai, C.S.; Huang, Q.P. Fire Hazards in Bridges: State of the Art, Recent Progress, and Current Research Gaps. J. Bridge Eng. 2023, 28, 03123003. [Google Scholar] [CrossRef] [Scilit]
- D’Angelo, M.; Civera, M.; Giordano, P.F.; Borlenghi, P.; Ballio, F.; Limongelli, M.P.; Chiaia, B. Bridge Collapses in Italy across the 21st Century: Survey and Statistical Analysis. Struct. Infrastruct. Eng. 2025, 1–23. [Google Scholar] [CrossRef] [Scilit]
- Paolini, C.; Civera, M.; D’Angelo, M.; Giordano, P.F.; Borlenghi, P.; Ballio, F.; Chiaia, B.; Limongelli, M.P. Dataset of Bridge Collapses in Italy Spanning more than 25 Years (2000–2025). Data Brief 2026, 64, 112375. [Google Scholar] [CrossRef] [Scilit] [PubMed]
- Wang, S. Post-Fire Assessment of Concrete in Bridge Decks. Master’s Thesis, Purdue University, West Lafayette, IN, USA, 2019. [Google Scholar] [CrossRef]
- Wu, X.; Huang, T.; Au, F.T.K.; Li, J. Posttensioned Concrete Bridge Beams Exposed to Hydrocarbon Fire. J. Struct. Eng. 2020, 146, 04020210. [Google Scholar] [CrossRef] [Scilit]
- Whelan, M.; Tempest, B.Q.; Scott, D.B. Post-Fire Nondestructive Evaluation of a Prestressed Concrete Double-Tee Joist Roof. J. Perform. Constr. Facil. 2015, 29, 04014055. [Google Scholar] [CrossRef] [Scilit]
- ASTM C805/C805M-18; Standard Test Method for Rebound Number of Hardened Concrete. ASTM International: West Conshohocken, PA, USA, 2018.
- ASTM C597-22; Standard Test Method for Ultrasonic Pulse Velocity Through Concrete. ASTM International: West Conshohocken, PA, USA, 2022.
- ASTM C42/C42M-20; Standard Test Method for Obtaining and Testing Drilled Cores and Sawed Beams of Concrete. ASTM International: West Conshohocken, PA, USA, 2020.
- ACI Committee 318. Building Code Requirements for Structural Concrete (ACI 318-19) and Commentary; American Concrete Institute: Farmington Hills, MI, USA, 2019. [Google Scholar]
- ASTM A370-20; Standard Test Methods and Definitions for Mechanical Testing of Steel Products. ASTM International: West Conshohocken, PA, USA, 2020.
- ASTM A615/A615M-20; Standard Specification for Deformed and Plain Carbon-Steel Bars for Concrete Reinforcement. ASTM International: West Conshohocken, PA, USA, 2020.
- AASHTO. The Manual for Bridge Evaluation, 3rd ed.; American Association of State Highway and Transportation Officials: Washington, DC, USA, 2018; with 2020 and 2022 Interim Revisions. [Google Scholar]
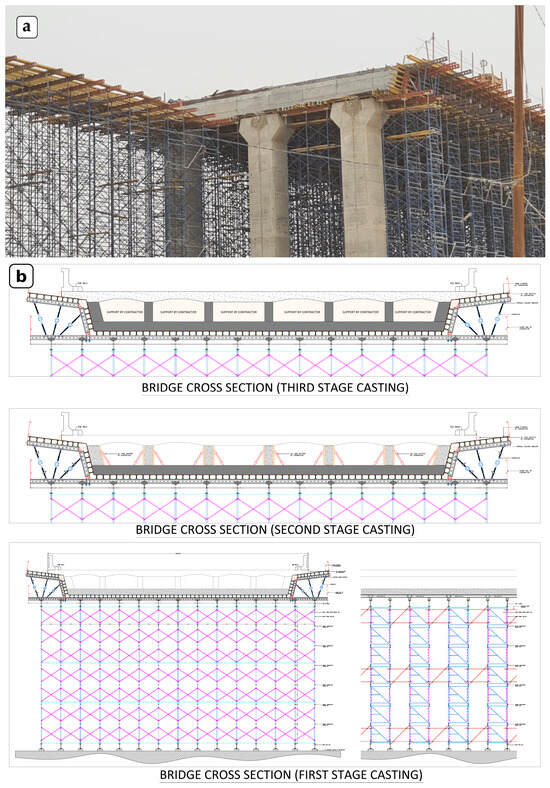
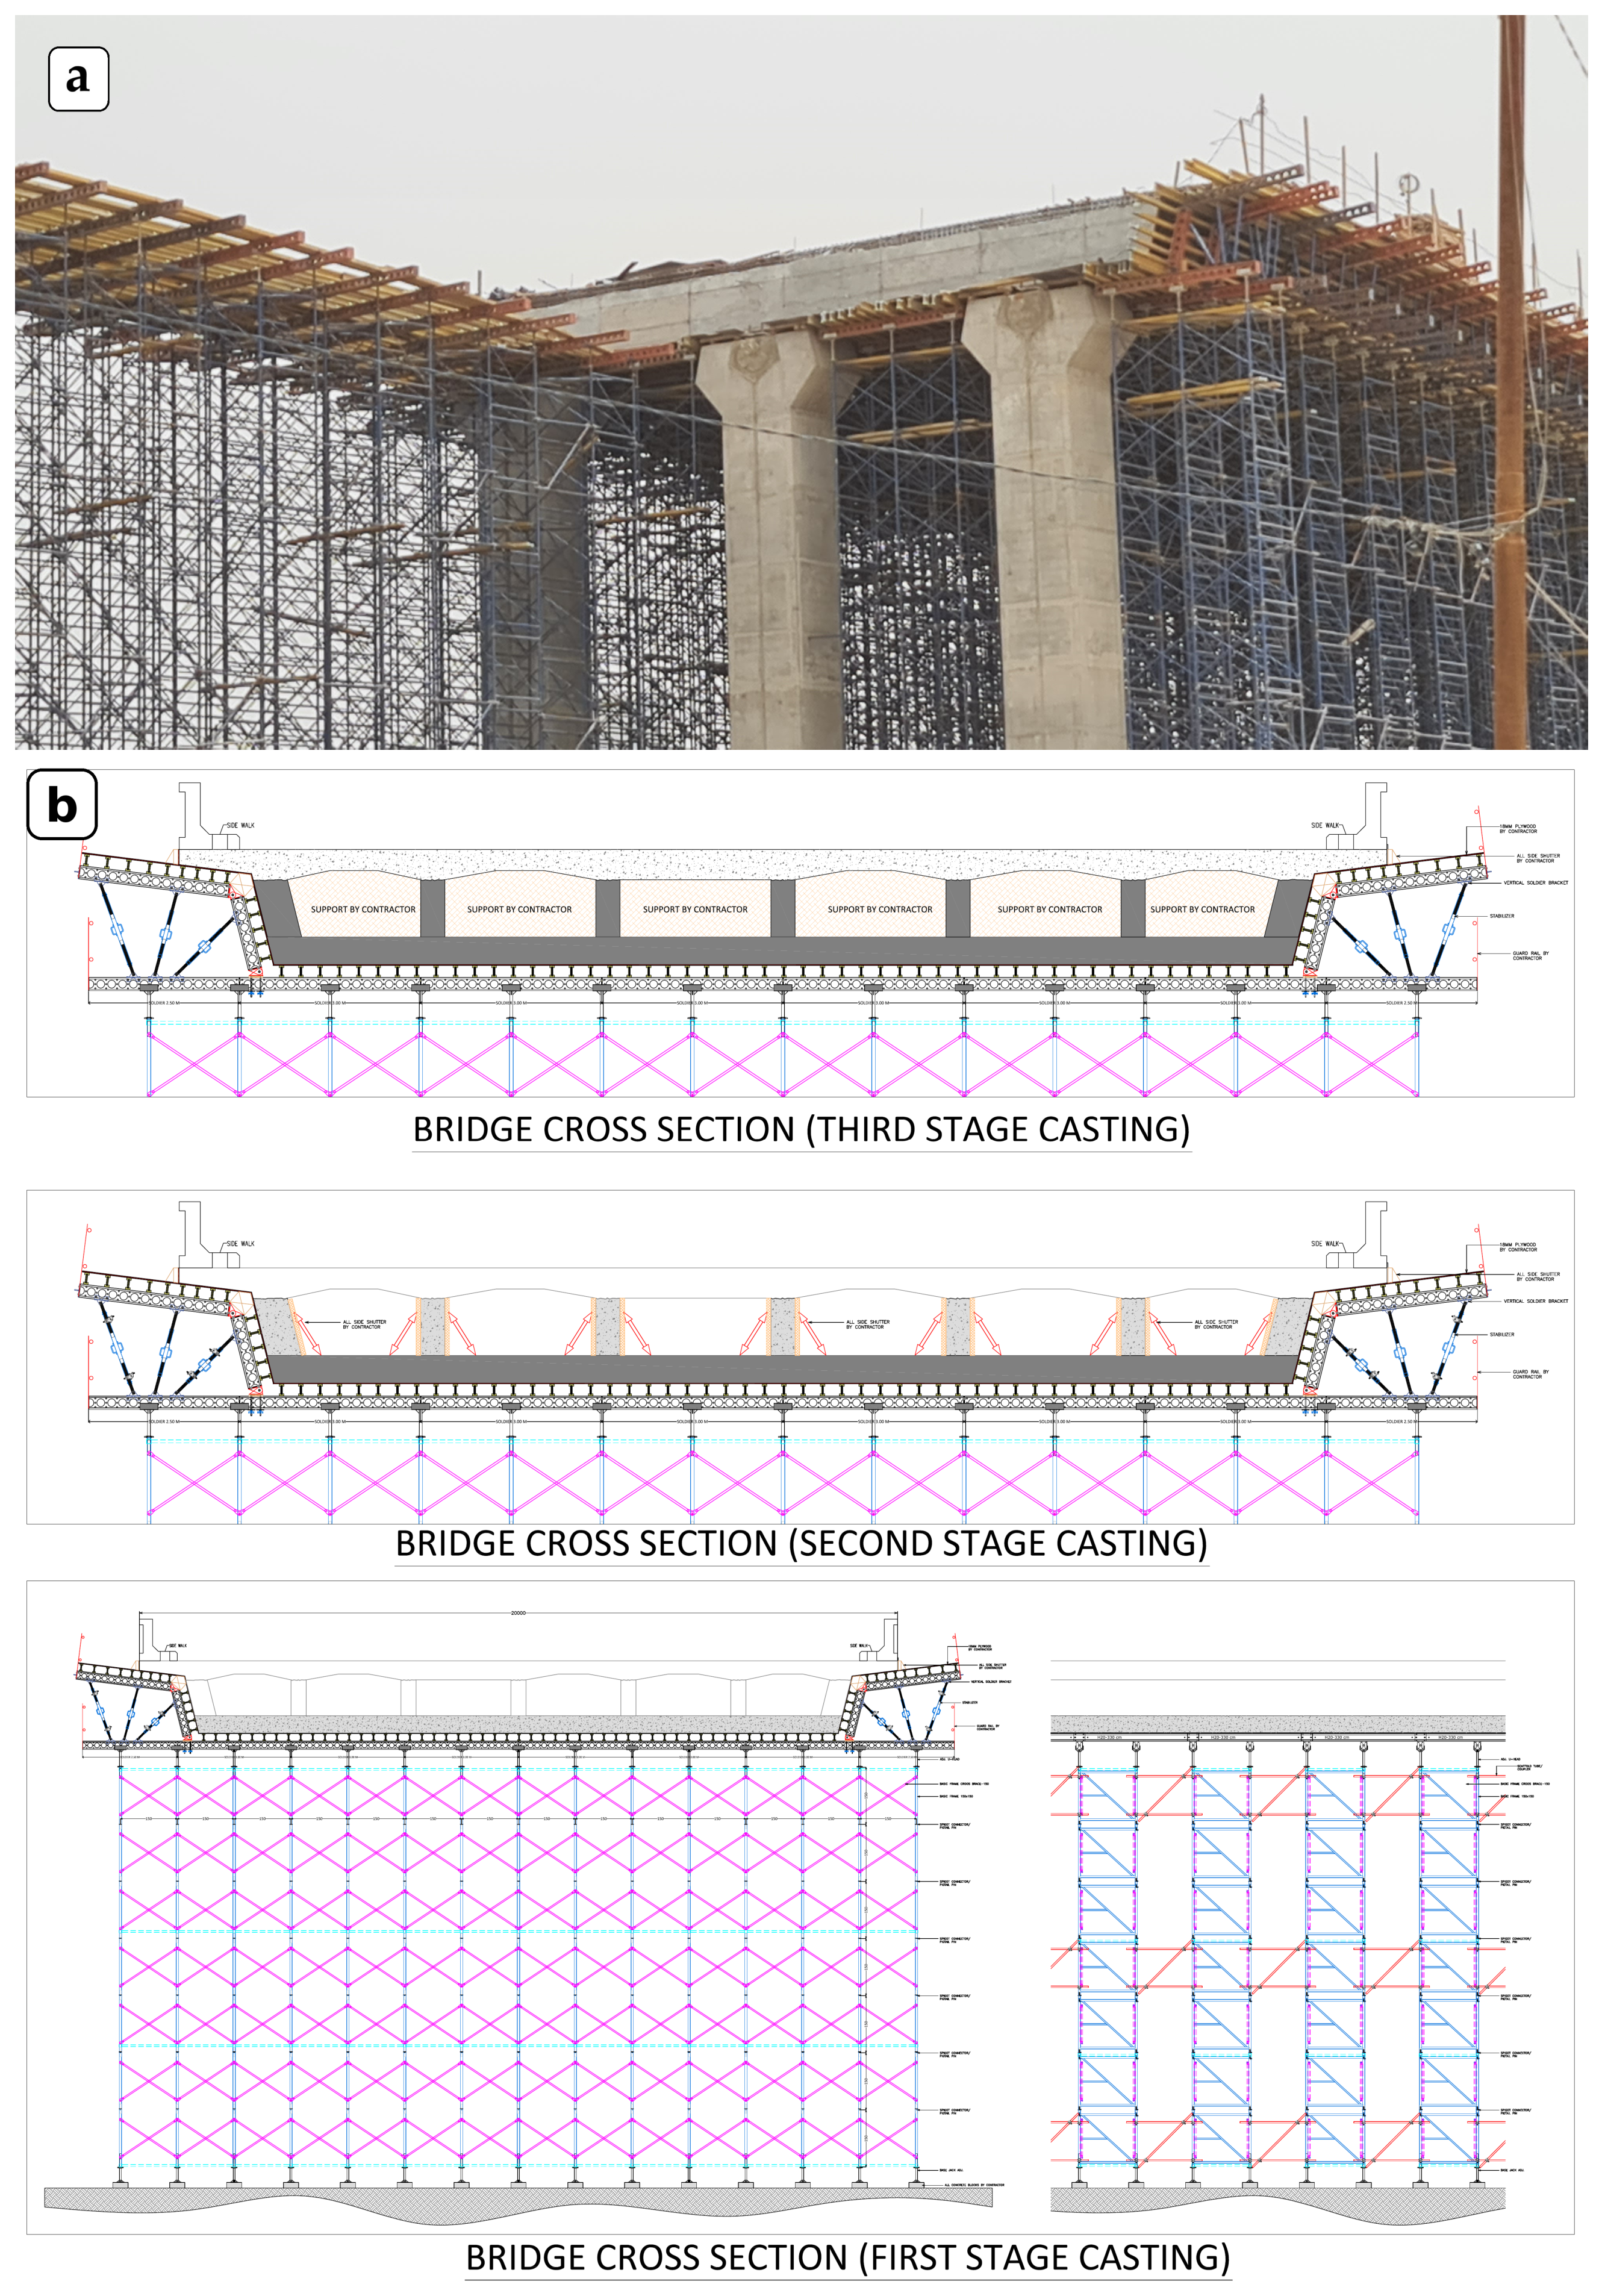
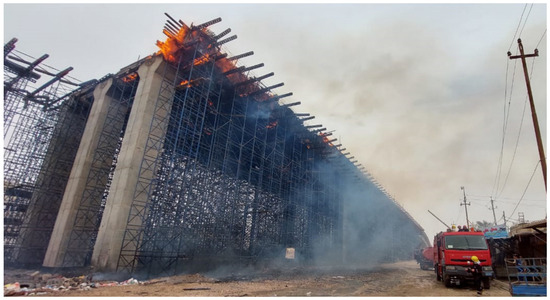
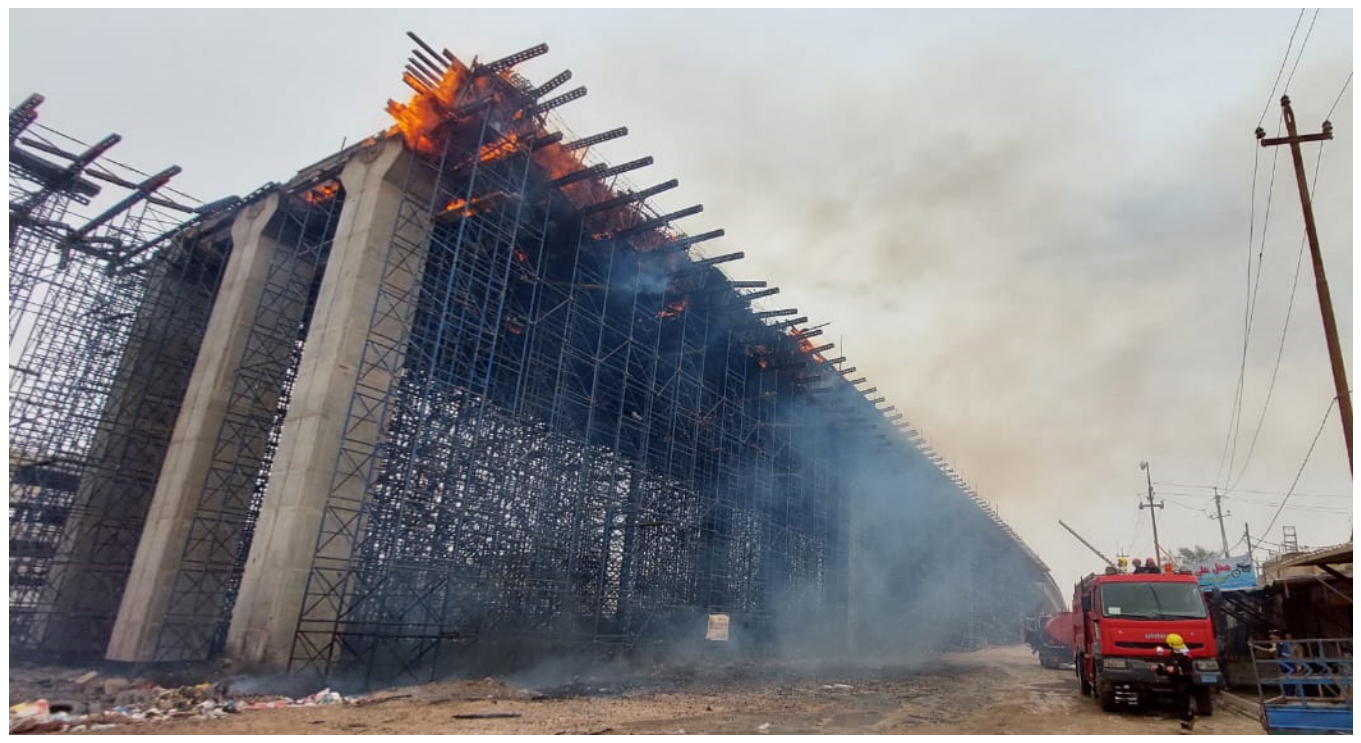
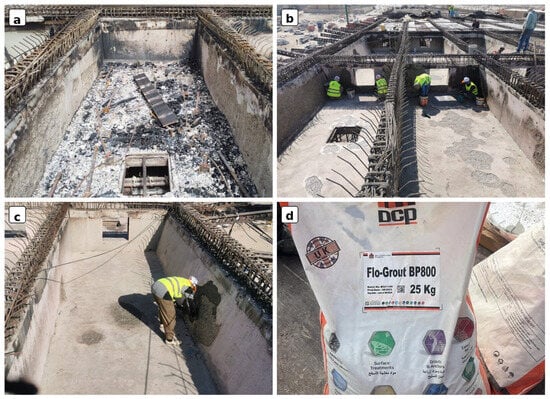
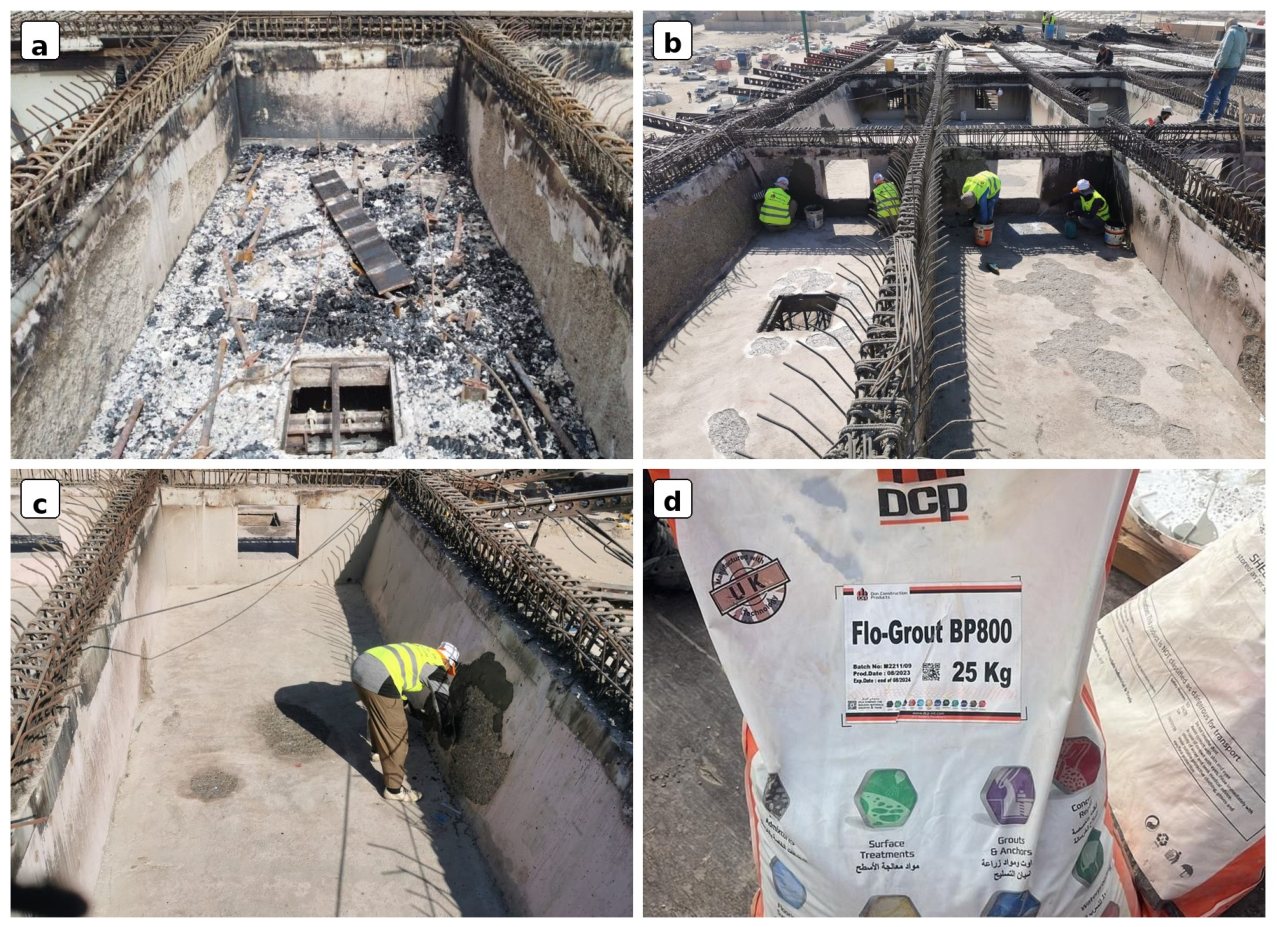
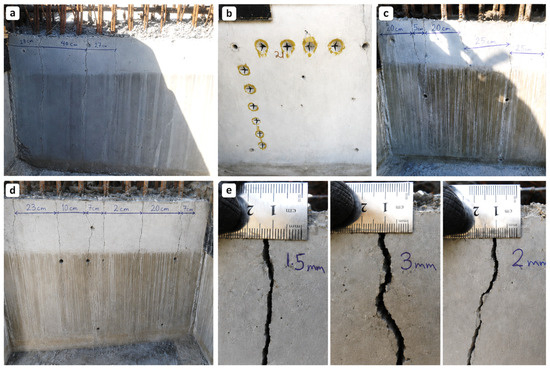
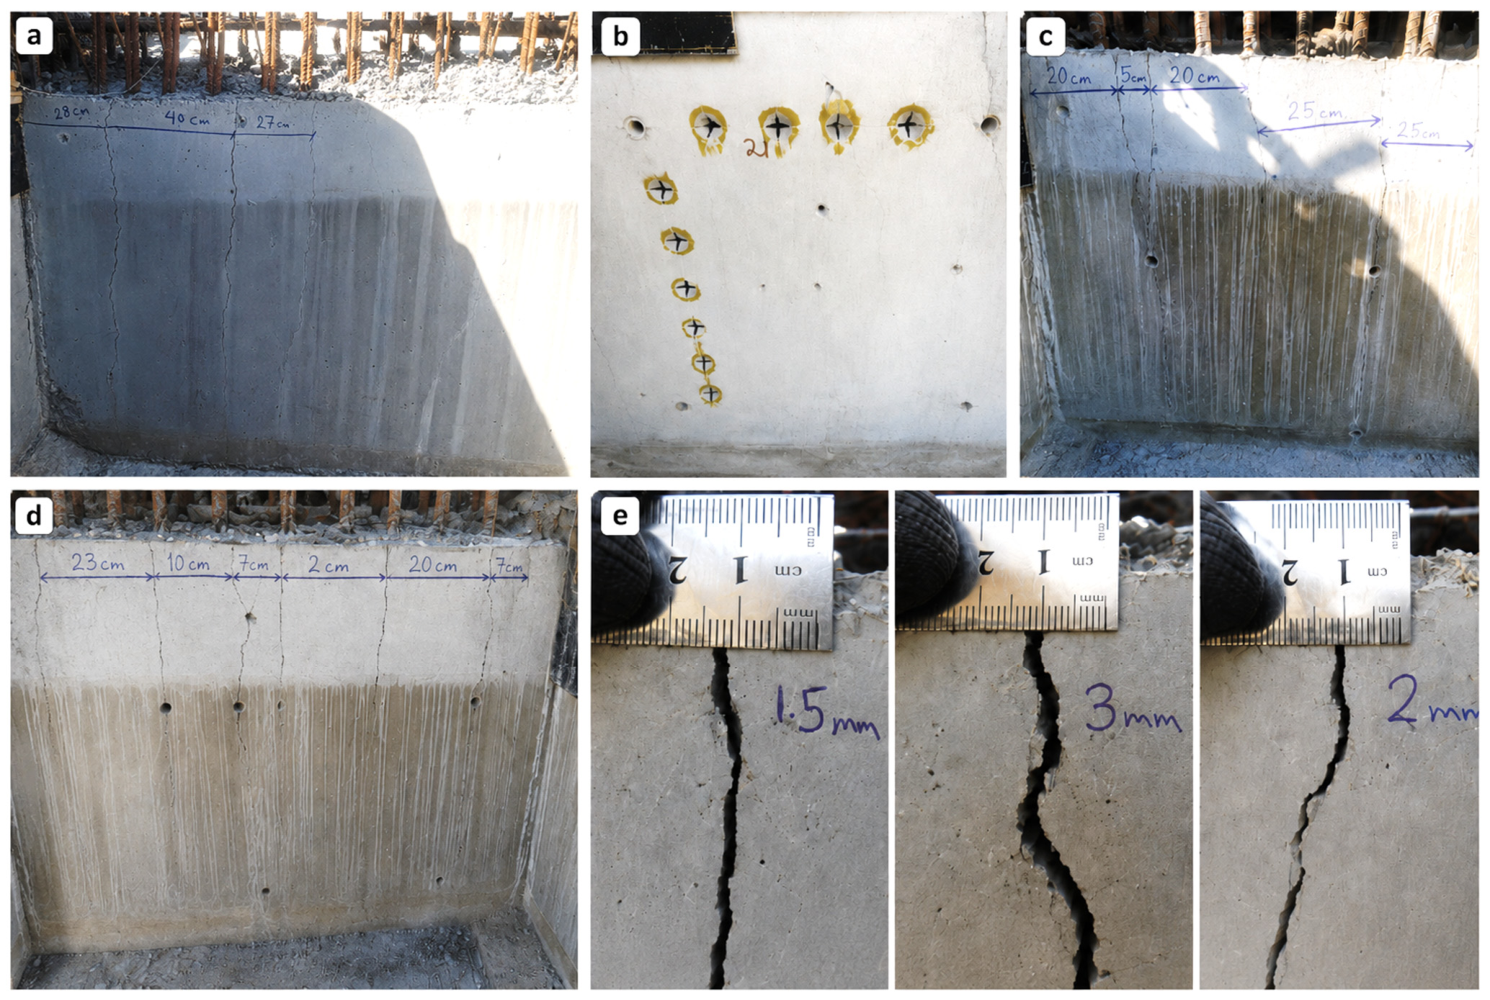
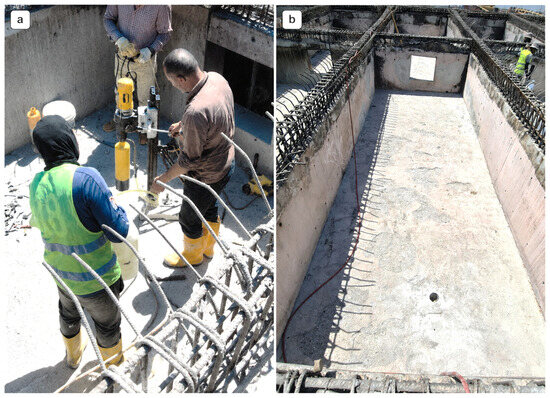
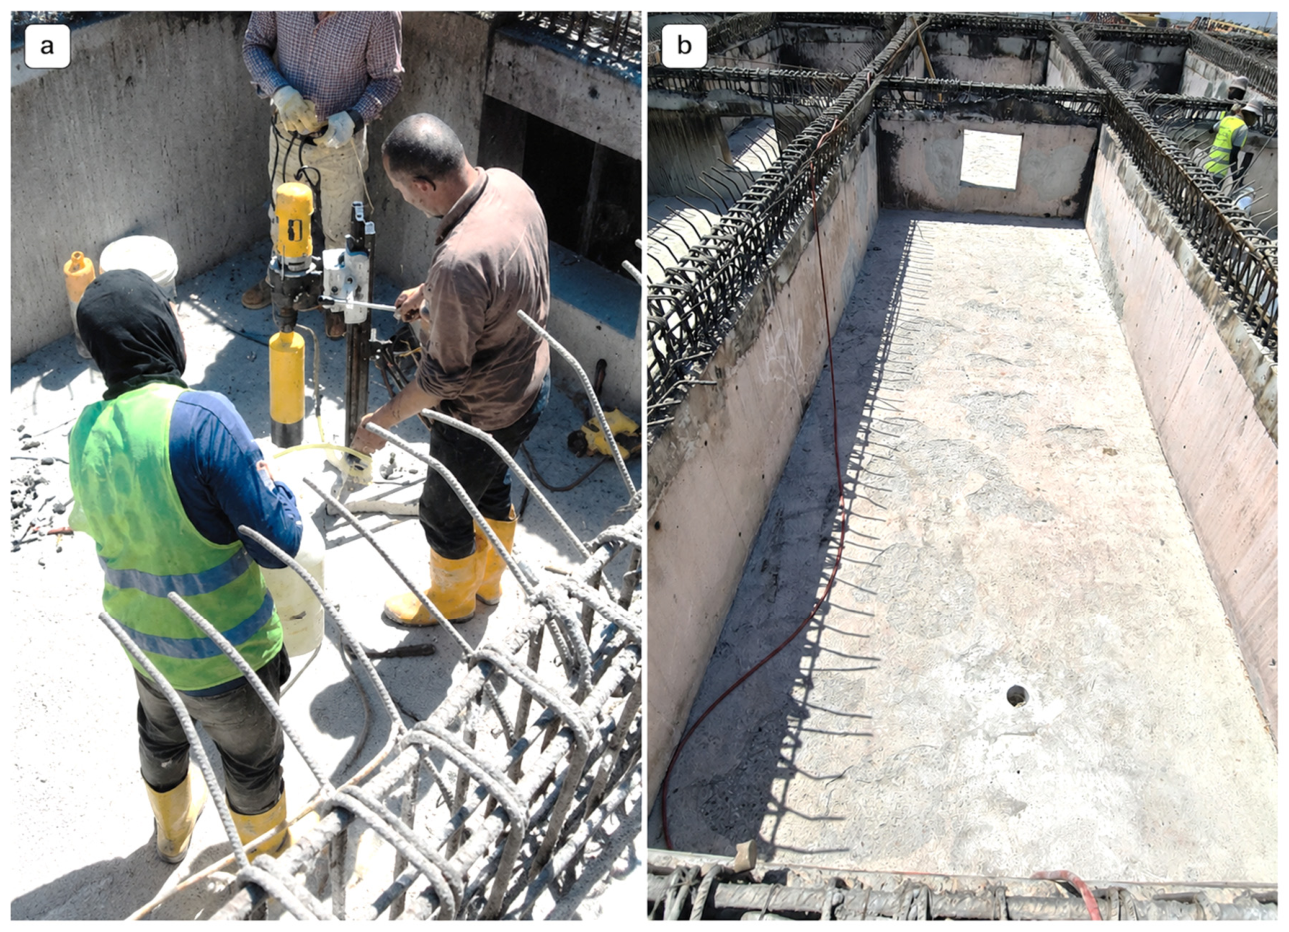
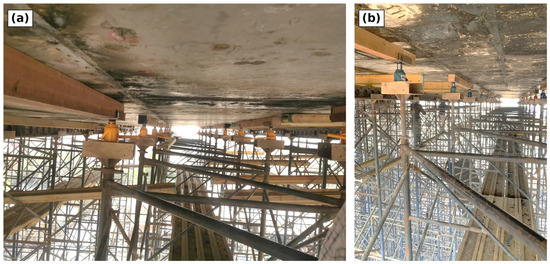
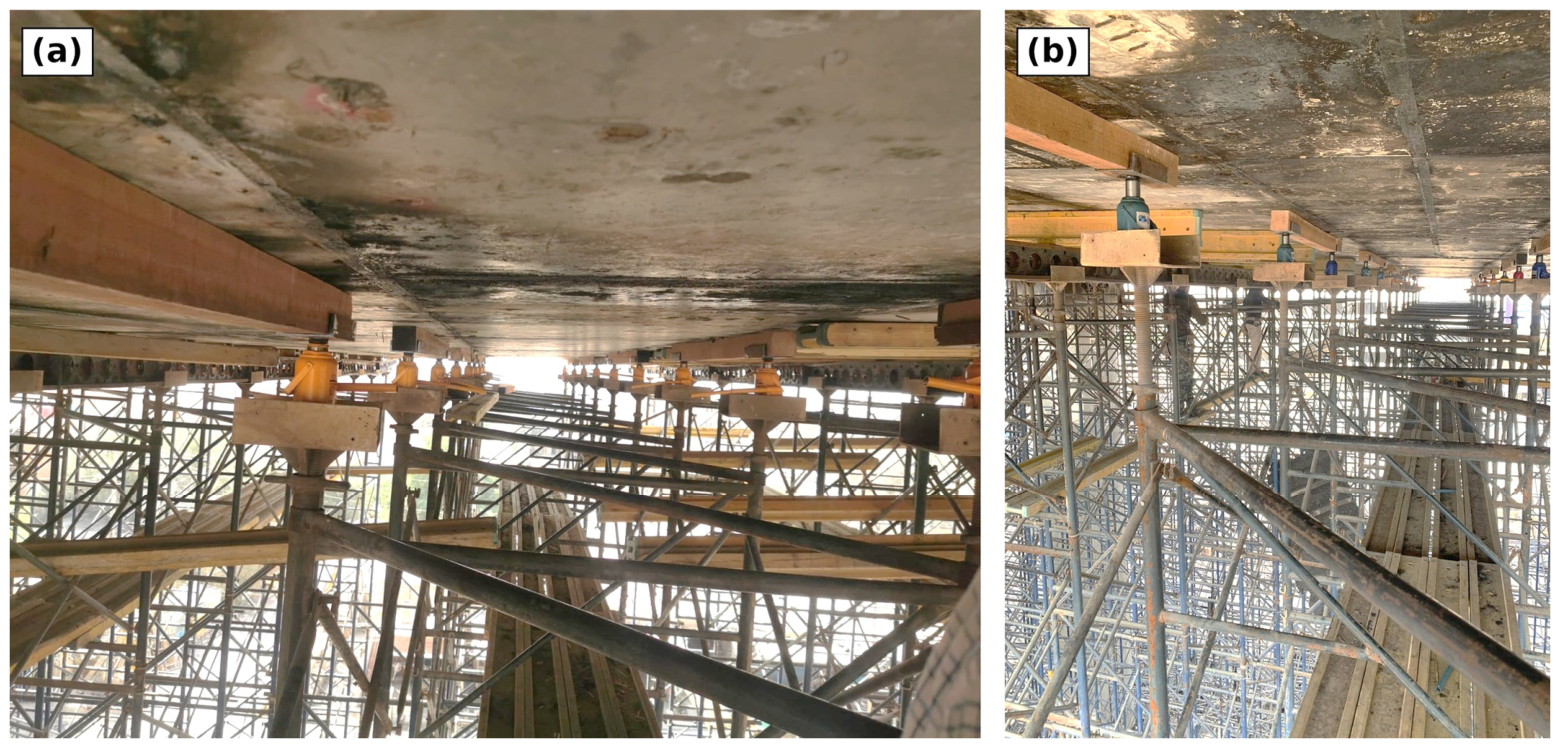
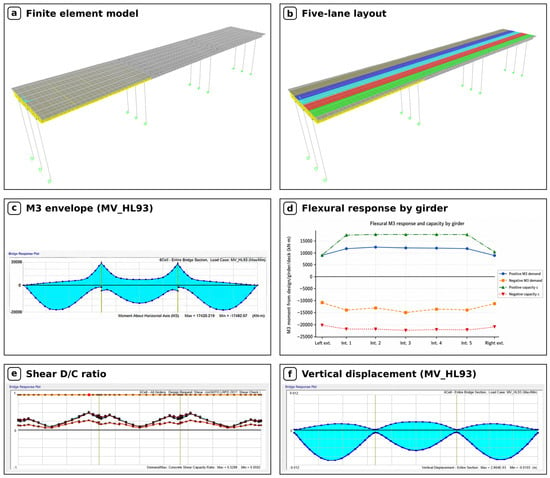
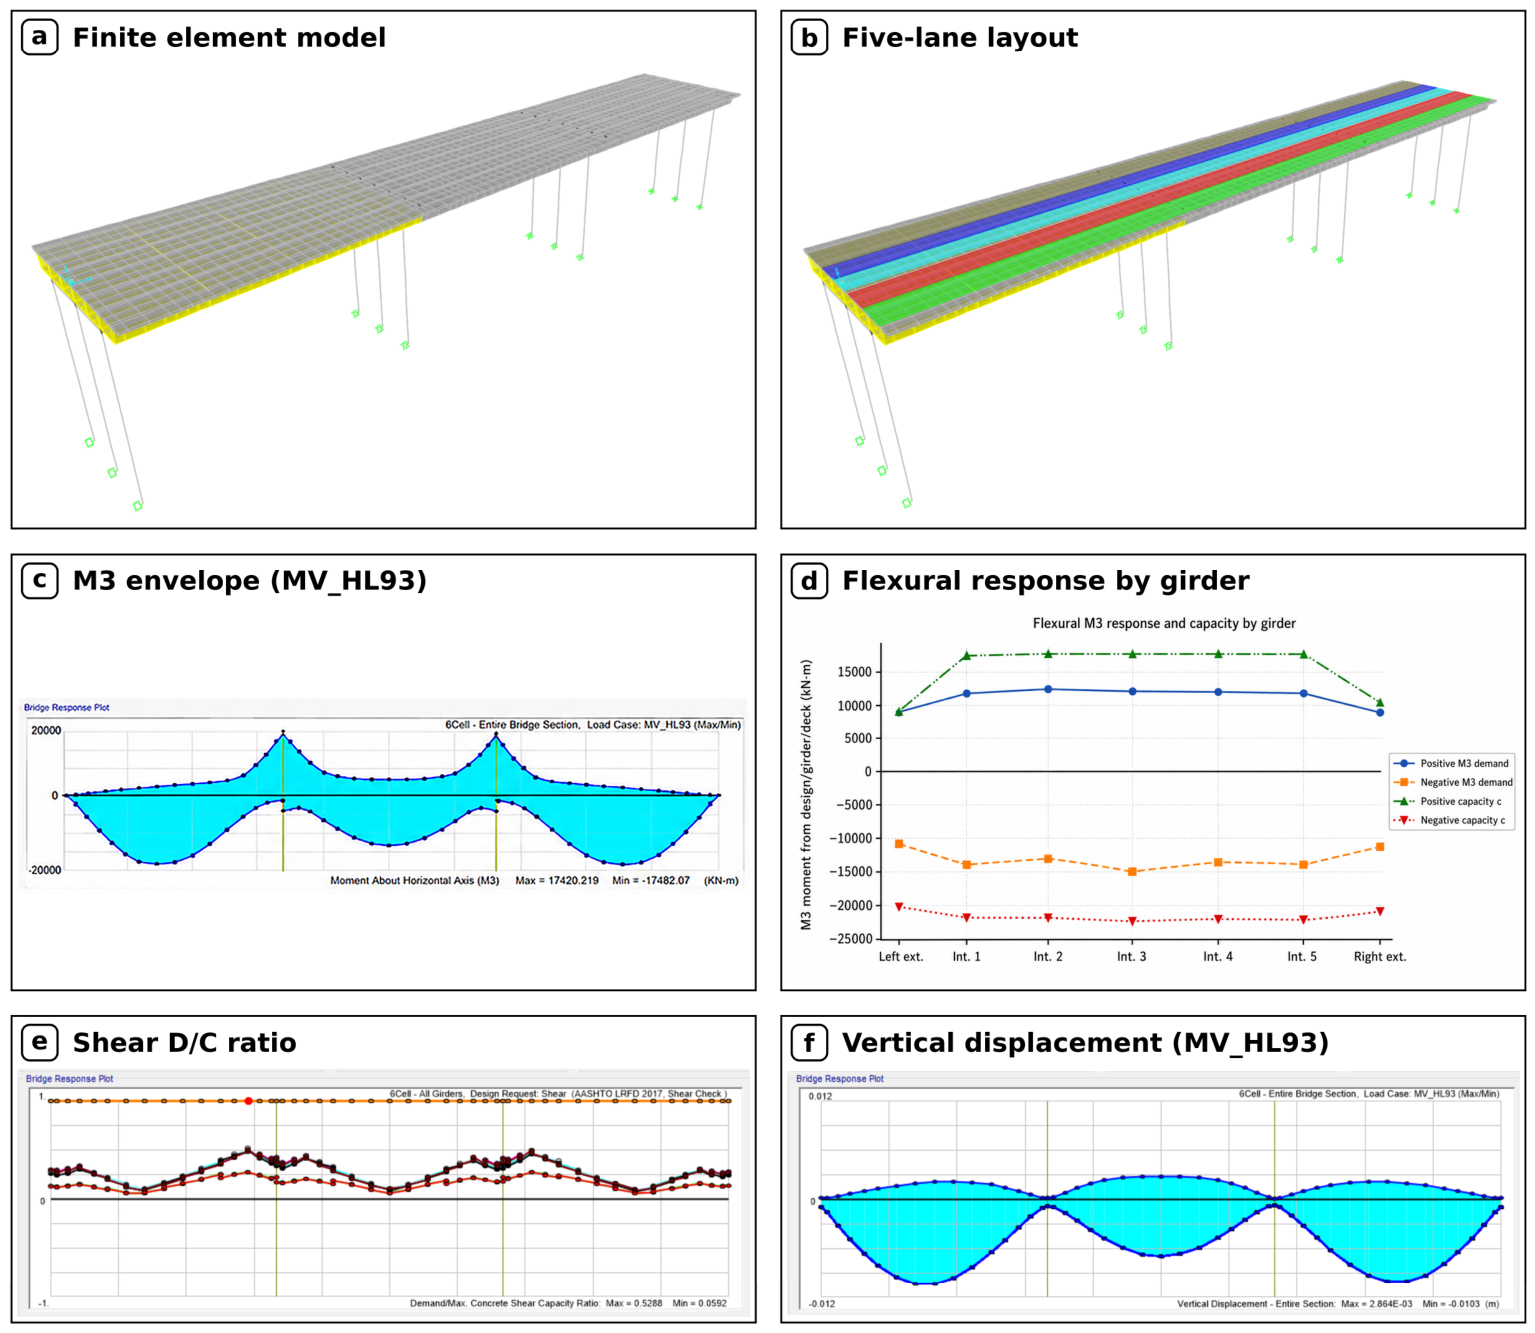
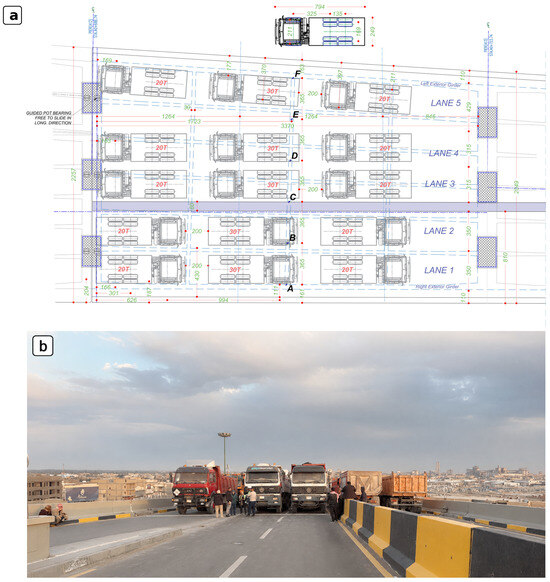
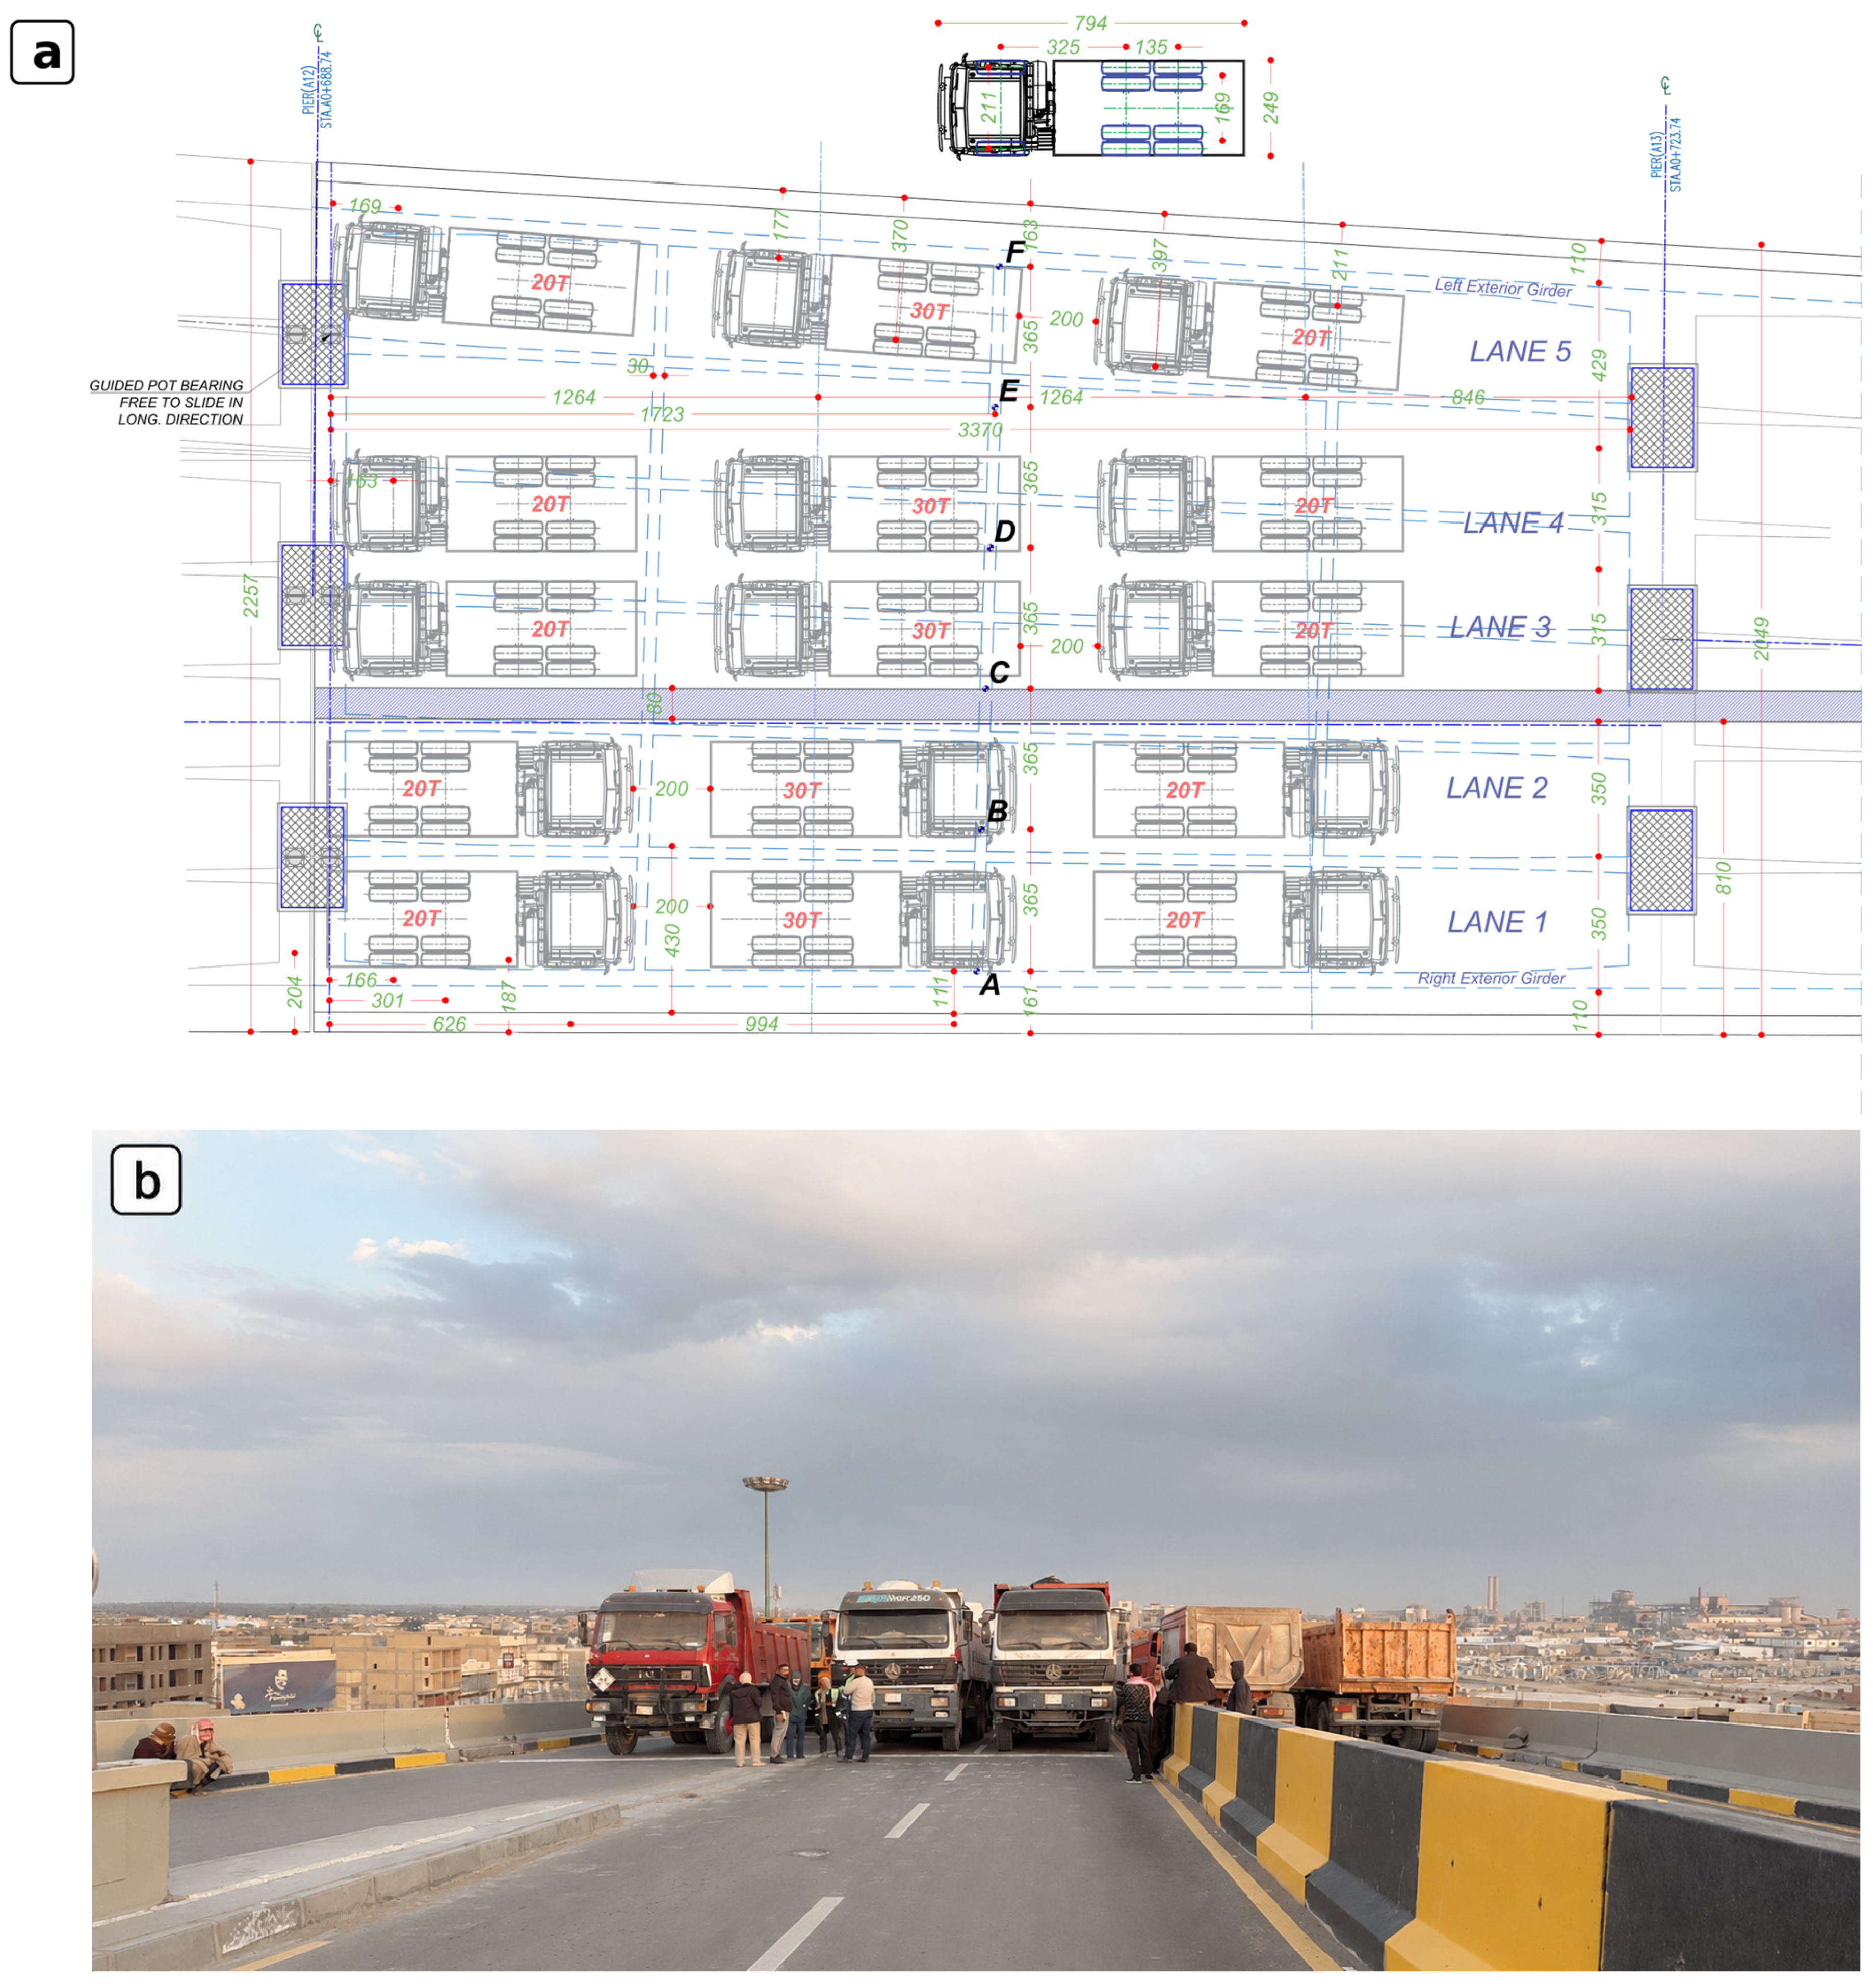
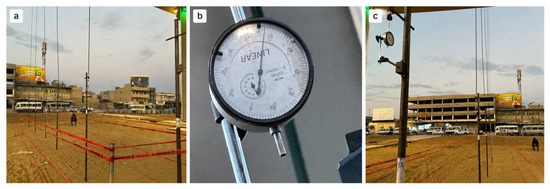
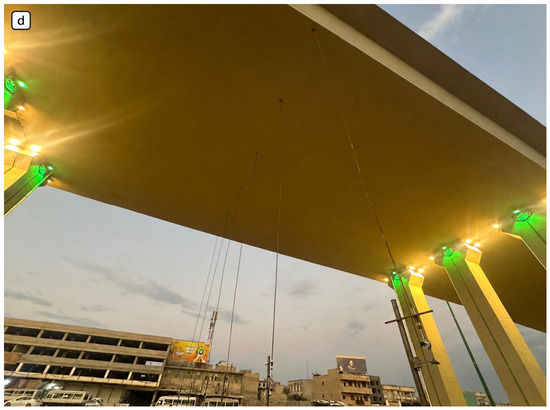
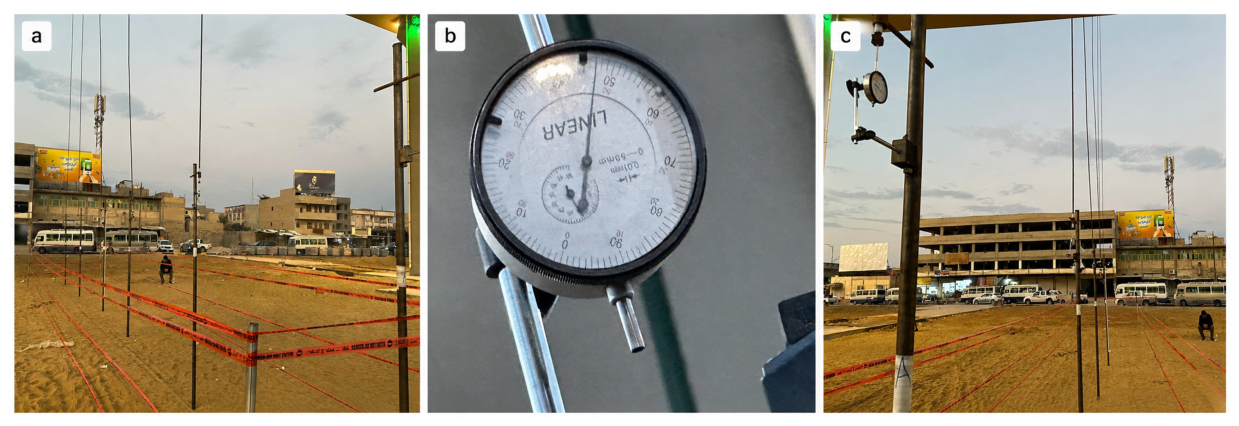
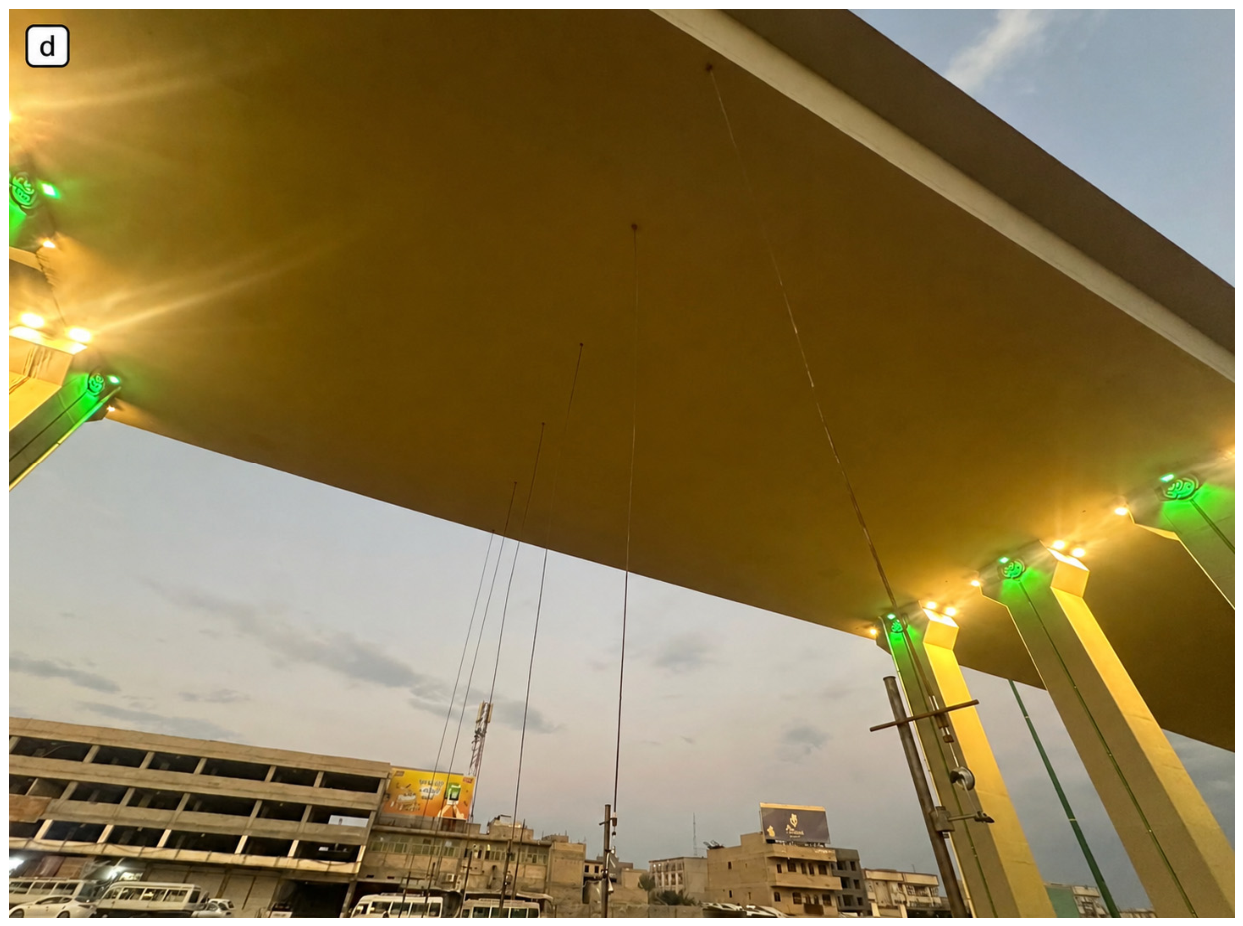
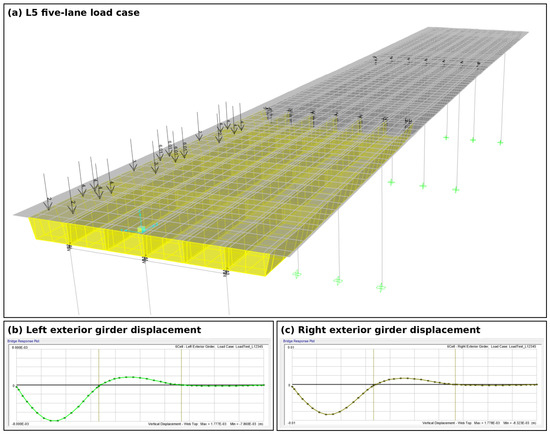
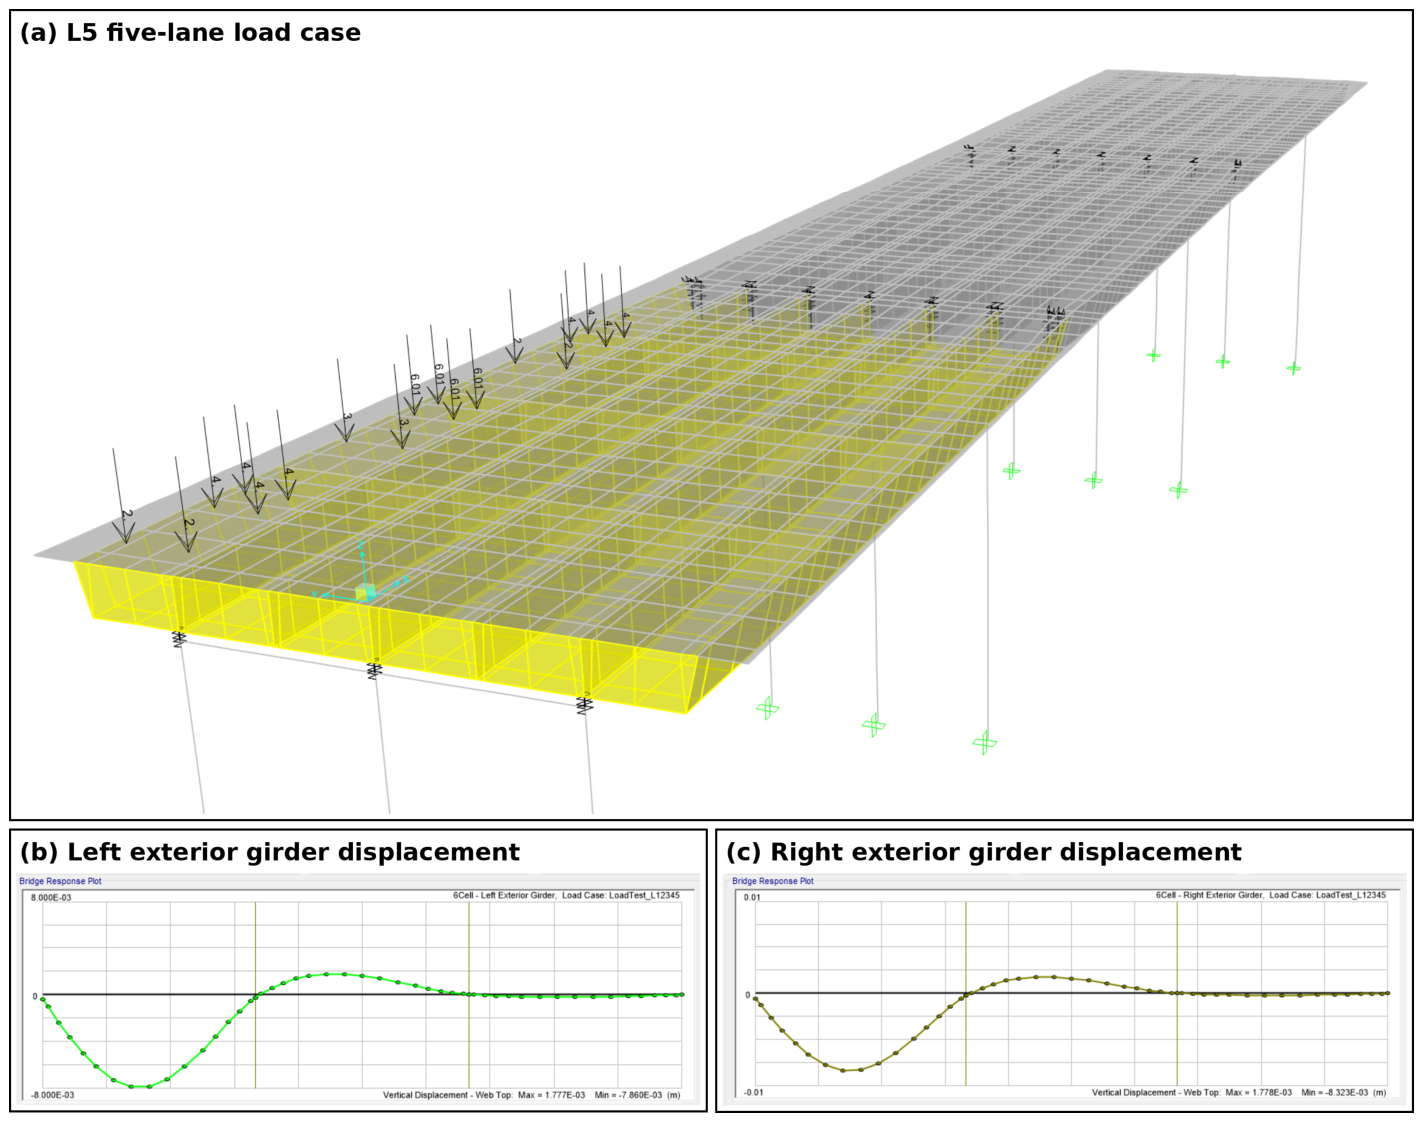
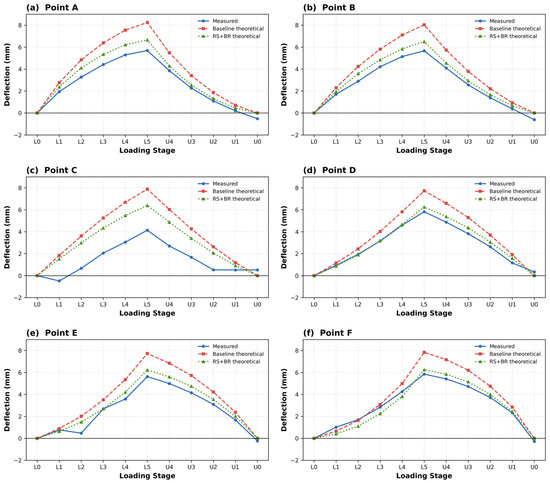
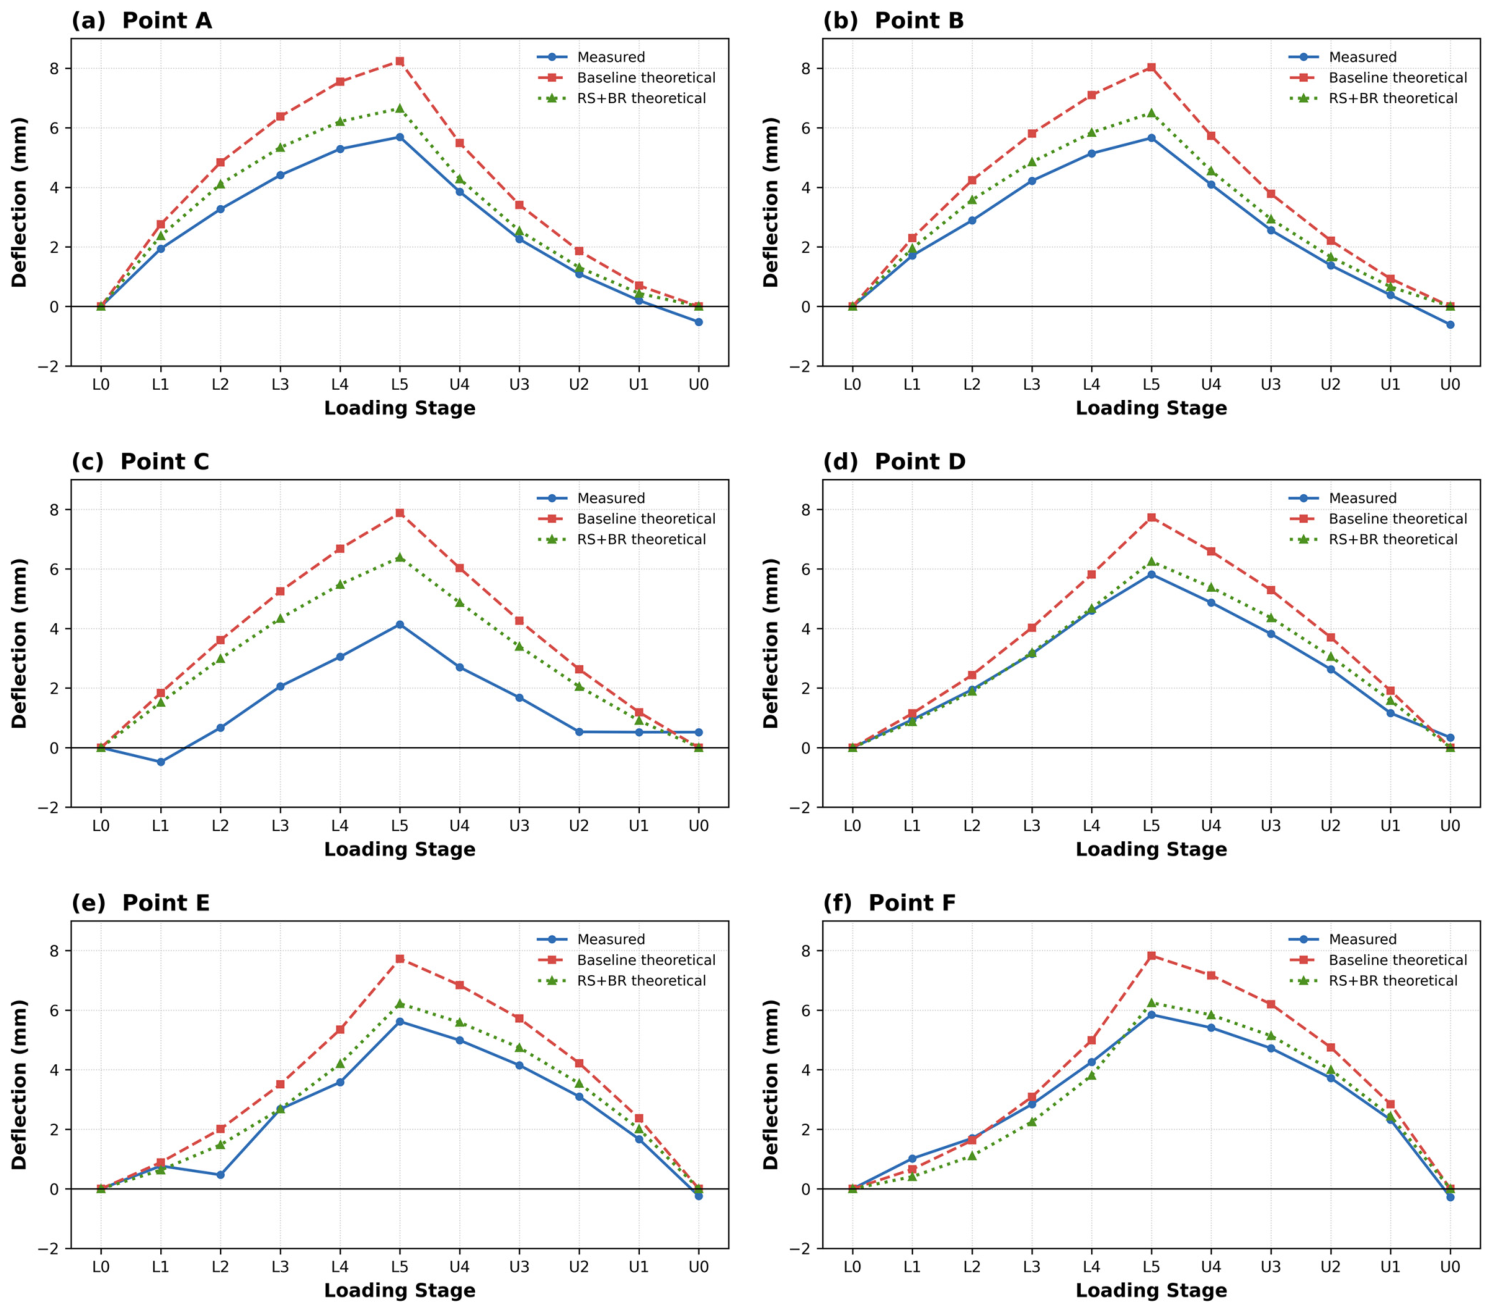

Disclaimer/Publisher’s Note: The statements, opinions and data contained in all publications are solely those of the individual author(s) and contributor(s) and not of MDPI and/or the editor(s). MDPI and/or the editor(s) disclaim responsibility for any injury to people or property resulting from any ideas, methods, instructions or products referred to in the content. |
© 2026 by the authors. Licensee MDPI, Basel, Switzerland. This article is an open access article distributed under the terms and conditions of the Creative Commons Attribution (CC BY) license.