


Abstract
Stadium stands combine high occupant density, steep seating geometry, and constrained egress routes, yet design-stage egress calculations usually represent spectators through aggregate flow rates and do not explicitly account for health-related stair-use tolerance. This study proposes a reproducible queue-based workflow for estimating health-risk-induced egress delay in independent stadium-stand units and for supporting early-stage design screening. A deterministic capacity–flow baseline is first computed for each stand and translated into an auditable GraphML queue network. A Nursing-Based Health Score (NBHS), derived from riser height, tread depth, and stair pitch, is used as a geometry-based tolerance proxy rather than a clinical diagnostic score. NBHS risk is then propagated through vulnerable-profile headway multipliers at constrained gangway-to-vomitory bottleneck edges, and stand-level delay is estimated using grouped Monte Carlo queue processing. The queue baseline remained close to the deterministic reference (mean / = 0.980), supporting interpretation of subsequent delays as controlled perturbations. Delay increased monotonically with headway sensitivity, and stand-level variation was explained by GraphML-derived bottleneck service-rate properties. These findings provide a practical design-stage reference for identifying stand configurations where stair geometry and egress bottleneck capacity jointly amplify delay for vulnerable spectators.
1. Introduction
Modern stadiums are not only large-scale engineering structures, but also complex spatial systems shaped by crowd movement, visual proximity, and capacity optimization. Stadium bowls are commonly designed with steep inclines and compressed seating arrangements to improve sightlines, C-value performance, and proximity to the playing field. However, from a public-health and inclusive-design perspective, this geometric intensification may increase physiological discomfort, descent-stability demands, and stair-safety risk, particularly for elderly spectators, obese individuals, and spectators with cardiovascular, respiratory, or musculoskeletal limitations [1,2,3,4,5,6,7].
Stair use in stadium stands represents a vertical displacement task against gravity and therefore imposes a higher physiological and biomechanical cost than level walking [6,8]. For healthy adults, this load may result in only a moderate and clinically tolerable increase in cardiovascular demand. For spectators with hypertension, obesity, reduced muscle strength, respiratory disease, cardiovascular disease, impaired balance, or age-related functional decline, the same stair-climbing or stair-descending task may exceed functional capacity and increase the risk of dyspnea, excessive fatigue, dizziness, loss of balance, or falls [1,2,3,7,8,9]. The current literature therefore suggests that stadium stair geometry should not be treated only as an architectural or sightline-related parameter, but also as a determinant of spectator health, stair-use tolerance, and safe egress.
Step geometry is a critical determinant of both comfort and cardiovascular or musculoskeletal loading. Riser height is particularly important: risers of approximately 14 cm have been associated with comfort and satisfaction, whereas riser heights around 18 cm have been reported to increase heart rate, blood pressure, and rate pressure product, an indirect indicator of myocardial oxygen consumption [1]. This increase is not only cardiovascular; higher risers may also increase knee extensor demand in a non-linear manner, which is clinically relevant for spectators with limited muscle strength, joint problems, obesity, or age-related functional decline [1].
Tread depth is similarly important for descent stability and fall prevention. Step depths around 280 mm are described as ideal or comfortable values, whereas smaller treads increase the likelihood of foot overhang, reduce plantar contact stability, and increase fall risk during stair descent, particularly in older adults [2]. The relationship between riser height and tread depth determines stair pitch, which is also a critical ergonomic variable. Stair pitches of approximately 30–35° are generally considered safer and more comfortable, whereas steeper stairs, especially those exceeding approximately 37°, are associated with increased fall-risk sensitivity and reduced descent stability [2,3].
The relevance of these geometric parameters is amplified by the heterogeneous physiological profile of stadium spectators. Stadium audiences are not composed only of young and healthy adults; they may include elderly individuals, obese spectators, and people with hypertension, cardiac disease, chronic obstructive pulmonary disease (COPD), or musculoskeletal limitations. Assuming a uniformly healthy target population may therefore underestimate the health and mobility constraints encountered during stadium ingress and egress [1,3,4,5,6,7].
Physiological evidence further supports the need for a health-sensitive treatment of stair geometry. The ACSM stair-stepping equation conceptualizes stair climbing as a combination of horizontal movement cost, vertical work, and resting metabolism, with riser height directly affecting the vertical work component [6,8]. However, these equations were primarily validated in healthy populations and should be interpreted cautiously for elderly spectators, individuals with cardiovascular disease, or people with limited functional capacity [8]. Healthy individuals may expend approximately 8.6–9.6 METs during stair climbing, while the average capacity of a healthy 70-year-old woman has been reported at approximately 5.6–7.0 METs; therefore, the effort required to reach or leave a stadium seat can exceed the functional capacity of some older spectators [4]. During stair descent, elderly individuals may also need to reduce walking speed to approximately 0.52 m/s or less to maintain balance, representing an approximate 30% slowdown compared with younger adults [9].
Evacuation-model reviews distinguish between transparent engineering calculations and computer-based evacuation models with different behavioral and validation assumptions [10]. Microscopic formulations, such as social-force models, can represent individual-level interactions in greater detail [11], but they usually require richer behavioral calibration than is available at early design stages.
Despite these health-related concerns, stadium egress modeling is often dominated by deterministic capacity–flow calculations or microscopic crowd simulations. Deterministic calculations are transparent and reproducible, but they generally do not account for health-related heterogeneity in stair-use tolerance. Full microscopic simulations can represent individual movement in greater detail, but they are data-intensive and difficult to validate without site-specific behavioral calibration. This creates a methodological gap for design-stage assessment: there is a need for a reproducible approach that remains consistent with deterministic egress baselines while incorporating a transparent health-risk perturbation associated with stair geometry.
Recent stadium-evacuation studies have used simulation-based approaches to examine evacuation efficiency, merging points, stair usage, and uneven utilization of escape routes in sports facilities. These studies demonstrate the importance of bottlenecks, route allocation, and stadium-specific crowd movement patterns, but they generally do not translate stair-geometry-related physiological vulnerability into a deterministic-consistent health-risk perturbation [12,13,14,15]. The present study is positioned in this gap: it preserves the transparency of capacity–flow egress calculation while adding a minimal NBHS-based headway mechanism at auditable bottleneck edges.
Taken together, these studies identify three related but insufficiently connected bodies of evidence. Sports-ground guidance and deterministic egress calculations provide transparent capacity and flow-rate references, but they do not explicitly encode health-sensitive stair-use tolerance [16,17]. Stadium evacuation simulations clarify route use, merging behavior, bottleneck formation, and uneven utilization of escape routes, but they generally do not convert stair-geometry-related physiological vulnerability into a deterministic-consistent delay term [10,11,12,13,14,15]. Stair-health, metabolic, biomechanical, and movement studies show that riser height, tread depth, pitch, age, obesity, respiratory limitation, and lower-limb functional capacity are relevant to cardiovascular response, exertional demand, descent stability, movement speed, and fall-risk-related parameters [1,2,3,4,5,6,7,8,9]. The methodological gap addressed here is therefore not the absence of evacuation models, but the absence of a reproducible design-stage mechanism that links geometry-derived health tolerance to auditable stand-level egress delay while remaining comparable with deterministic capacity–flow calculation.
The conceptual position of the proposed workflow relative to sports-ground egress guidance, stadium evacuation simulation, stair-movement research, evacuation-model verification, and the stair-health literature is summarized in Table A1. This positioning clarifies that the contribution is not a fully microscopic evacuation model, nor a purely clinical risk score, but a deterministic-consistent design-stage screening workflow that links stair-health sensitivity to auditable bottleneck delay.
To address this gap, this paper introduces a reproducible stadium-stand egress modeling workflow that couples a deterministic capacity–flow baseline with a deterministic-consistent queue simulation defined over an auditable stand egress network. A Nursing-Based Health Score (NBHS) is computed from stair geometry and used as a design-stage tolerance proxy rather than a clinical diagnostic score. NBHS is then translated into a vulnerable-group headway multiplier at capacity-constrained bottlenecks, allowing the model to estimate NBHS-induced evacuation delay while preserving comparability with the deterministic control time. The contribution of the study is therefore threefold: to formalize a geometry-based NBHS representation for stadium stair tolerance, to integrate this score into a deterministic-consistent queue model through a minimal headway perturbation, and to provide a reproducible workflow with auditable configuration files, network artifacts, and simulation outputs.
The remainder of the paper is organized as follows. Section 2 describes the deterministic baseline, NBHS computation, GraphML network construction, queue-baseline consistency check, and Monte Carlo headway implementation. Section 3 reports baseline consistency, scenario-based delay responses, stand-level bottleneck drivers, and NBHS geometry sensitivity. Section 4 discusses the interpretation of NBHS-induced delay, practical design implications, model scope, and future extensions. Section 5 summarizes the main conclusions.
2. Materials and Methods
2.1. Scope and Computational Contribution
This study develops a reproducible, deterministic-consistent computational workflow to quantify health-risk-induced evacuation delays in stadium stands. The workflow couples a deterministic capacity–flow baseline for stand egress performance with a minimal health-risk extension based on a Nursing-Based Health Score (NBHS), introduced through headway multipliers for a vulnerable subpopulation within a queue model defined over a stand egress network.
Deterministic egress calculations remain a widely used engineering baseline for assembly buildings, including stadia, because they provide transparent throughput-based control times with minimal modeling assumptions. The queue baseline is checked against the deterministic control time and is interpreted through a baseline-consistency ratio rather than assumed to be identical. This provides an explicit validity/consistency check, strengthening interpretability and reviewer confidence that subsequent differences are attributable to NBHS perturbations rather than artifactual modeling choices.
A full microscopic, behavior-rich crowd simulation can be data-intensive and difficult to validate without empirical calibration data. Instead, this study adopts a minimal and auditable mechanism: NBHS affects egress only by increasing effective headway (reducing service rate) for vulnerable spectators at capacity-constrained bottlenecks, yielding a controlled and interpretable estimate of NBHS-induced delay while preserving reproducibility.
The computational sequence is organized into five algorithmic steps: deterministic stand control-time estimation (Algorithm 1), NBHS computation from stair geometry (Algorithm 2), stand egress network construction (Algorithm 3), deterministic-consistent queue baseline evaluation (Algorithm 4), and Monte Carlo NBHS headway integration (Algorithm 5).
The complete methodological sequence is summarized in Figure 1. The workflow is structured to keep the deterministic reference model, NBHS computation, GraphML network construction, queue-baseline evaluation, and Monte Carlo headway perturbation as separate but connected stages. This separation is central to the reproducibility claim of the study: the model does not replace the deterministic capacity–flow baseline with an opaque crowd simulation but extends it through a controlled and auditable health-risk perturbation.
| Algorithm 1. Deterministic stand control-time estimation |
| Input: Stand identifier obs_id; stand population N; total effective gangway width Wgw; total effective vomitory width Wvom; stair/gangway discharge coefficient ks; flat-passage/opening discharge coefficient PASS. |
| Output: Gangway-limited discharge time Tgw; vomitory-limited discharge time Tvom; deterministic stand control time Tdet; stored deterministic reference tstand_control_s. |
|
|
|
|
|
|
| Return Tgw, Tvom, and Tdet. |
Figure 1.
Computational workflow of the deterministic-consistent NBHS egress model.
| Algorithm 2. NBHS computation from stair geometry |
| Input: Stand identifier obs_id; riser height r in cm; tread depth t in mm; pitch angle theta in degrees; fixed NBHS component definitions for MCS, BSS, and HRS. |
| Output: Metabolic Comfort Score MCS; Biomechanical Safety Score BSS; Hemodynamic Response Score HRS; Nursing-Based Health Score NBHS; tolerance value tol; risk value risk. |
|
|
|
|
|
|
|
|
|
| Return MCS, BSS, HRS, NBHS, tol, and risk. |
| Algorithm 3. Stand egress network construction and service-rate assignment |
| Input: Stand identifier obs_id; tier definitions; gangway count ngw; gangway width wgw; vomitory count nvom; vomitory width wvom; stair/gangway discharge coefficient ks; flat-passage/opening discharge coefficient PASS. |
| Output: Directed stand egress network G; GraphML artifact with node, edge, and service-rate attributes. |
|
|
|
|
|
|
|
|
|
|
|
|
|
| Return G and the corresponding GraphML file. |
| Algorithm 4. Deterministic-consistent queue baseline evaluation |
| Input: . |
| Output: Edge-level ; baseline-consistency comparison against Tdet. |
|
|
|
|
|
|
|
|
| Return. |
| Algorithm 5. Monte Carlo NBHS headway integration and delay estimation |
| Input: Edge-level ; risk value risk; NBHS threshold NBHS0; mobility-impaired stair-user . |
| Output: Run-level ; NBHS-enabled ; 95th percentile stand time p95; NBHS-induced delay ΔT. |
|
|
|
|
| 4.1. Initialize run-level edge processing times for all constrained bottleneck edges. |
| 4.2. For each constrained bottleneck edge e: |
| 4.2.1. using Equation (11). |
| 4.2.2. = 0. |
| 4.2.3. : |
| 4.2.3.1. Sample a spectator profile from scenario probabilities pN, pE, and pM. |
| 4.2.3.2. If the sampled profile is elderly or mobility-limited, set . |
| 4.2.3.3. If the sampled profile is non-vulnerable, set = 1. |
| 4.2.3.4. using Equation (12a). |
| 4.3. Compute run-level stand time using Equation (12b). |
|
|
|
| Return ΔT, and the run-level distribution . |
2.2. Unit of Analysis and Reproducibility Artifacts
This section clarifies what is being modeled, at what spatial scale, and which artifacts enable reproducibility and auditability. Establishing these definitions up front prevents ambiguity in later equations and ensures that reported delays can be attributed to modeled mechanisms rather than inconsistent units of analysis.
2.2.1. Independent Stand as the Analysis Unit
All computations are performed per independent stand, indexed by a unique identifier (obs_id). Each obs_id represents one stand instance (e.g., long-side or short-side), comprising lower and upper tiers where applicable. This stand-based unit avoids conflating heterogeneous geometries and capacities that can exist across different stands, and it aligns with the engineering practice of identifying the controlling (slowest) egress component when aggregating to stadium scale.
A schematic definition of the stadium-stand terminology used in the analysis is provided in Figure A1. The figure clarifies that LS and SS denote long-side and short-side stand sectors, respectively, and that each obs_id represents an independent stand-level seating/egress unit rather than the whole stadium bowl. It also links the architectural terms gangway and vomitory to the GW → VOM constrained bottleneck edge used in the queue model.
2.2.2. Locked Configuration
All constants, scenario grids, and stand-specific derived quantities are stored in a locked configuration file (params_locked.yaml). This includes the following:
- Deterministic flow constants (ks, PASS),
- Scenario definitions (vulnerable-group proportions),
- Derived stand quantities (capacities, gangway/vomitory counts and widths, deterministic control times).
Locking these quantities is a reproducibility choice. It makes the workflow auditable and ensures that differences in results are driven by specified scenario variables (e.g., α) rather than hidden parameter drift. Separation between locked inputs, graph artifacts, and simulation outputs enables independent reruns of the deterministic, network-construction, and queue-evaluation stages.
2.2.3. Auditable Outputs
The workflow produces the following:
- Deterministic outputs (results_phase0_keyfields.csv),
- Stand egress network artifacts as GraphML (outputs/graphs/*.graphml) with per-edge service rates,
- Queue simulation outputs (results_phase3_keyfields.csv),
- Publication-ready figures/tables with an explicit manifest (outputs/package5/manifest_outputs.csv).
All computations and post-processing were implemented in Python 3.14.6. Data handling and numerical processing used NumPy 2.4.6, pandas 3.0.3, and SciPy 1.17.1. Stand egress networks and GraphML artifacts were generated and inspected with NetworkX 3.6.1, while locked YAML configuration files were parsed with PyYAML 6.0.3. Publication figures and tables were produced with Matplotlib 3.11.0 and pandas, with progress monitoring supported by tqdm 4.68.2. Interactive development and verification were conducted in JupyterLab 4.5.8/Jupyter Notebook 7.5.7.
Table 1 summarizes the operational configuration used to generate the reported outputs. The table clarifies which quantities are fixed constants, which variables define the scenario grid, and which artifacts support auditability. This is particularly important because the reported delay estimates depend not only on the NBHS headway mechanism, but also on the deterministic discharge coefficients, grouped Monte Carlo settings, vulnerable-profile probabilities, and GraphML-derived service-rate structure.
Table 1.
Model configuration and scenario grid.
The vulnerable-profile probabilities are scenario inputs rather than measured stand-specific demographics. They are used to test the sensitivity of the deterministic-consistent queue model to plausible vulnerable-group compositions and should not be interpreted as empirical spectator-population estimates.
The group size g is a demand-discretization parameter used to propagate profile-level headway multipliers through constrained bottleneck edges; it should not be interpreted as an observed social-group size.
In the reported inputs, lower- and upper-tier stair-geometry values are identical; therefore, the same stand-level NBHS value is used in the queue simulations. In tier-differentiated applications, the aggregation rule should be selected according to the intended design question, for example, by using the most restrictive tier when a conservative risk-screening interpretation is required.
2.3. Deterministic Baseline Model: Stand Control Time
This section defines a deterministic capacity–flow baseline used as a reference control time. The role of this baseline is not only predictive but also methodological. It provides a transparent anchor against which the queue baseline is checked for consistency.
2.3.1. Flow Coefficients
Two throughput coefficients are treated as constants:
- ks: discharge coefficient for stairs/gangways (persons∙s−1∙m−1),
- PASS: discharge coefficient for flat-floor openings (persons∙s−1∙m−1).
Here, PASS denotes the flat-passage/opening flow coefficient used for vomitory-mouth discharge, and the notation is retained from the computational configuration for reproducibility.
The selected discharge coefficients are derived from sports-ground egress guidance. The SGSA egress flow-rate guidance states maximum egress flow rates of 66 persons per meter width per minute on stepped surfaces and 82 persons per meter width per minute on level surfaces [16]. These values are consistent with the Green Guide flow-rate basis used for sports-ground egress assessment [17]. The flow-rate values correspond to = 1.10 persons·s−1·m−1 and PASS = 1.367 persons·s−1·m−1, respectively, after conversion from minutes to seconds. The same guidance also notes that audience profile, including elderly or disabled spectators, route condition, lighting, signage, handrails, and underfoot conditions can affect flow rate; this supports the need to treat the deterministic coefficients as a baseline rather than as a complete representation of vulnerable-user performance [16].
2.3.2. Baseline Equations (Grouped)
Let N be the stand population (persons). Let Wgw be the total effective gangway width (m) and Wvom be the total effective vomitory mouth width (m). The deterministic discharge times are
As stated in Equation (1c), the deterministic control time is governed by the slower of gangway- and vomitory-limited discharge. The deterministic control-time calculation is summarized step-by-step in Algorithm 1, which formalizes the sequence from stand population and effective widths to the final control time. In the implementation, Tdet is stored as t_stand_control_s and later used as a consistency target for the queue baseline (see Section 2.6 and Algorithm 4).
2.4. NBHS Computation from Stair Geometry
This section formalizes how stair geometry is converted into a health-oriented score. The goal is not to claim clinical diagnosis; rather, NBHS is used as a design-evaluable tolerance proxy grounded in documented sensitivity of vulnerable groups to riser/tread/pitch.
Although the clinical literature discusses detailed physiological measures such as oxygen consumption, MET capacity, rate pressure product, balance tests, and disease-specific functional limitations, the present workflow does not attempt to estimate individual clinical status. Instead, these findings are used to justify a minimal geometry-based scoring structure. Accordingly, NBHS is operationalized as a stand-level design proxy derived from riser height, tread depth, and pitch angle, which are available from the stadium-stand geometry and can be propagated reproducibly into the queue model.
2.4.1. Geometric Inputs
NBHS is computed from tier-specific stair geometry:
- Riser height r (cm),
- Tread depth t (mm),
- Pitch angle θ (degrees).
A baseline geometry per obs_id is stored in outputs/nbhs_inputs.csv. A sensitivity case-grid (pitch × tread) is stored in outputs/nbhs_geom_cases.csv. For stands with lower and upper tiers, NBHS is first computed separately for each tier and then aggregated to a stand-level value. In the current implementation, the stand-level NBHS tolerance is defined as the maximum of the lower- and upper-tier NBHS values.
2.4.2. Composite Score (Fixed Weights)
NBHS is defined as
The weights (0.4, 0.4, 0.2) follow the project’s NBHS definition and are kept fixed to preserve comparability across scenarios and stands and avoid introducing an additional tuning layer that would require empirical calibration data. Conceptually, the chosen structure balances metabolic burden and biomechanical stability (each weighted 0.4) while retaining a distinct hemodynamic component (0.2) as a safety-relevant penalty channel. The workflow therefore treats weights as part of the score definition rather than a fitted parameter set. The complete NBHS computation from stair geometry, including the evaluation of MCS, BSS, HRS, and the final tolerance–risk transformation, is summarized in Algorithm 2.
A supplementary component-weight sensitivity check (Table A2) was conducted on the existing NBHS geometry-case grid to verify whether the relative risk ordering is preserved under equal, conservative, and alternative component-weight sets. The check used the existing pitch–tread geometry-case grid only and did not rerun the queue simulations. The high correlations indicate that changing the component weights modifies absolute NBHS risk values but largely preserves the relative geometry-risk ordering.
2.4.3. Biomechanical Safety Score (BSS): Incline and Depth Penalties
BSS combines an incline penalty IP(θ) and a tread-depth penalty DP(t) (Equation (3a)):
The BSS thresholds are defined as design-stage scoring bands rather than clinical cut-off values. The 280 mm tread reference follows sports-ground guidance for stairways and radial gangways, where 280 mm is given as the minimum going for stairways and seated radial gangways. The pitch penalty is anchored to the Green Guide’s seated-accommodation limit [17]: radial gangway geometry should not exceed the slope achieved by stairway step dimensions, identified as 34°. Accordingly, the 32° threshold is used as a near-limit early-penalty band, while 37° is retained only as a high-exposure stress-test band in the geometry-sensitivity grid, not as a recommended or compliant design condition. The 10 mm tread interval and the penalty coefficients in Equation (3b,c) are therefore transparent scoring choices used to widen the design-observation space and test whether NBHS risk responds monotonically to pitch–tread variation.
2.4.4. Hemodynamic Response Score (HRS): Riser-Height Bands
HRS is defined as a banded mapping of riser height r (cm):
The HRS bands combine sports-ground dimensional guidance with stair-health evidence. In the Green Guide, stairway risers are preferably 150 mm, with new-construction maxima of 170 mm, or 180 mm for secondary escape stairways, while existing stairways may reach 190 mm. For seated radial gangways, risers should not exceed 190 mm and should preferably be between 150 and 170 mm for ambulant disabled spectators [17]. Consistent with stair-health evidence that risers of approximately 14 cm are associated with greater comfort, whereas risers around 18 cm can increase heart rate, blood pressure, and rate pressure product, the NBHS mapping treats risers up to 14 cm as the lowest-exposure band, 14–17 cm as the preferred or normally tolerable design range, 17–18 cm as a higher-exposure band approaching upper guidance values, and values above 18 cm as a high-penalty band [1]. These bands are used to encode geometry-related hemodynamic tolerance in a design-stage score; they do not represent individual cardiovascular diagnosis or measured physiological response.
2.4.5. Metabolic Comfort Score (MCS): Geometry-Driven Proxy
MCS penalizes risers above 15 cm using a scaled linear penalty (clamped to [0, 100]):
This is a deliberate simplification. It converts a known qualitative relationship (“higher risers increase exertion and perceived difficulty”) into an auditable numeric proxy that can be propagated into egress delay without requiring individual-level VO2/MET calibration.
The MCS component reflects the general relationship between riser height and perceived or metabolic difficulty. Stair climbing is a vigorous activity in which riser height contributes to the vertical work component of movement [6,8]. However, the present implementation does not compute individual VO2, MET capacity, BMI-corrected MET values, or obesity-specific correction factors. Instead, MCS provides an auditable geometric proxy for increased exertional demand, allowing metabolic difficulty to influence egress only through the NBHS-based headway perturbation.
2.4.6. Tolerance–Risk Reparameterization
To support a monotone headway mapping, the implementation uses
As used later in the headway mapping (Section 2.7), higher risk indicates lower stair-use tolerance.
2.5. Stand Egress Network Model (GraphML)
This section introduces the stand egress network representation used for queue evaluation. The network is exported as GraphML to make the computational model auditable and to support reviewer inspection of the exact bottlenecks used to generate reported times.
2.5.1. Graph Representation
A directed network G is constructed for each stand and exported as GraphML. It contains the following:
- Tier sources (SRC_LOW, SRC_UP),
- Gangway nodes (GW_*),
- Vomitory nodes (VOM_*),
- A terminal sink node (EXIT).
Edges represent the following:
- Supply and seat-to-gangway links (unconstrained within the minimal scope). These links are treated as unconstrained because the present workflow focuses on bottleneck-controlled discharge at gangway–vomitory interfaces rather than microscopic seat-row walking dynamics.
- Bottleneck edges (GW → VOM) carrying capacity constraints via service rates (persons/s).
- Optional VOM → EXIT edges carrying opening capacity attributes.
In the reported queue implementation, demand is allocated to the constrained GW → VOM bottleneck edges. VOM → EXIT edges are retained as auditable opening-capacity attributes but are not used as an additional independent demand-carrying bottleneck in the current minimal workflow. The construction of the directed stand egress network and the assignment of edge-level service-rate attributes are summarized in Algorithm 3.
The focus on GW → VOM bottleneck links is also consistent with stadium-specific evacuation studies that identify gangway intersections, vomitory access points, and stairway connections beneath stands as critical merging locations affecting evacuation performance [13]. In the present workflow, these elements are not simulated as fully microscopic interaction zones; instead, they are encoded as auditable constrained edges with explicit service-rate attributes.
2.5.2. Bottleneck Service Rates and Capacity Conservation
A central requirement is that the network must conserve deterministic throughput terms; otherwise, bottleneck capacity may be unintentionally inflated, and the queue baseline will not be comparable to the deterministic baseline.
Let a tier have gangway count ngw, gangway width wgw, vomitory count nvom, and vomitory width wvom. Define the following:
As shown in Equation (7b), distributing gangway throughput over vomitory links prevents double counting when the number of vomitory links differs from gangway count. Each GW → VOM edge is assigned the service rate μ from Equation (7d), and the resulting directed network is exported in GraphML for auditability, as detailed in Algorithm 3.
Representative GraphML networks are shown in Figure A2. These supplementary schematics are included to make the network abstraction inspectable: the constrained (GW → VOM) links are visible as the operational bottleneck edges, whereas (VOM → EXIT) links remain audit attributes in the current minimal workflow. This reinforces the interpretation that queue delays are driven by explicit edge-level service rates rather than by hidden model parameters.
2.6. Deterministic-Consistent Queue Simulation (Baseline and NBHS-Perturbed)
This section defines the queue evaluation used to produce stand egress times. The baseline queue time is designed to be consistent with the deterministic control time in Equation (1c), so that NBHS-induced differences can be interpreted as controlled perturbations rather than artifacts of inconsistent baseline modeling.
The use of a baseline-consistency check is aligned with the evacuation-model verification and validation literature, which emphasizes that evacuation models should be evaluated with respect to their core behavioral and flow components, including pre-evacuation time, movement/navigation, exit usage, route availability, and flow constraints [18]. In this study, the validation claim is intentionally narrow: the queue baseline is checked against the deterministic control time, while the NBHS component is presented as a controlled perturbation requiring future empirical calibration.
2.6.1. Queue Baseline Time from Constrained Bottlenecks
For each constrained bottleneck edge e, let allocated demand be De (persons) and service rate be μe (persons/s). Then,
Equation (8b) mirrors the control-time idea in Equation (1c). The stand time is governed by the slowest effective bottleneck.
2.6.2. Capacity-Proportional Demand Allocation
A key practical issue in symmetric stand networks is that path-based assignment can collapse demand onto few bottlenecks, inflating queue times for non-physiological reasons. To avoid this artifact, demand is split proportional to edge capacities within each tier.
For tier supply S and constrained edge set E with service rates μ,
Equation (9) ensures that parallel bottlenecks are used in proportion to their throughput, producing a stable baseline that remains comparable to Equation (1c). This allocation is implemented as described in Algorithm 4.
In the implemented results, this continuous queue baseline is used as the formulation reference, whereas the reported is generated under the same grouped Monte Carlo processing with α = 0.
2.7. NBHS Integration via Headway Multipliers (Monte Carlo Implementation)
This section maps NBHS risk into a vulnerable-group headway effect at bottlenecks. Importantly, the reported NBHS-perturbed times are computed using repeated Monte Carlo runs rather than a closed-form mixture expectation; this avoids over-claiming and reflects the code implementation.
2.7.1. Scenario-Based Vulnerable-Group Composition
Population composition is represented through scenario probabilities:
- pN: non-vulnerable,
- pE: elderly proxy,
- pM: mobility-limited proxy,
- pV = pE + pM: vulnerable mass.
Scenario probabilities are not estimated separately for each stand; rather, they are generated from the locked population-proxy set and scenario multipliers defined in params_locked.yaml. Let denote the baseline elderly proxy, qM denote the mobility-impaired stair-user proxy selected from the sensitivity grid, and λE and λM denote the scenario multipliers for the elderly and mobility-limited profiles, respectively. Specifically, the bounded elderly probability is first computed as , and the mobility-limited probability is computed as . To ensure that the profile probabilities form a valid categorical distribution, the elderly probability is then bounded by the remaining non-mobility mass, . The non-vulnerable probability is defined as the residual term, , and the total vulnerable probability is . This construction ensures that each Monte Carlo group is sampled from a valid categorical distribution while allowing scenario-level sensitivity in vulnerable-group composition.
The profile labels used in the Monte Carlo sampling should therefore be interpreted as scenario-level vulnerability proxies rather than clinical classifications. The elderly and mobility-limited categories are included because previous studies indicate reduced functional capacity, slower stair descent, increased fall risk, and elevated physiological sensitivity among older or mobility-constrained users [2,3,4,9,19]. These profiles do not receive separate walking-speed distributions in the present implementation; their effect enters only through the NBHS-based headway multiplier applied at constrained bottlenecks.
Within this scenario structure, the elderly and mobility-limited profiles are not assumed to have identical physiological or biomechanical limitations. The elderly proxy primarily represents age-related reductions in aerobic capacity, cardiovascular reserve, balance control, and stair-descent speed, whereas the mobility-limited proxy represents restrictions associated with lower-limb strength, joint function, possible assistive-device use, impaired balance, or other movement limitations. In the present C-minimal implementation, these mechanisms are not decomposed into separate walking-speed distributions, fatigue states, or disease-specific behavioral rules. Instead, both profiles are represented through the same vulnerable-user headway multiplier at constrained bottleneck edges. This is a deliberately conservative and auditable proxy: it allows reduced stair-use tolerance to affect bottleneck service time without introducing profile-specific parameters that would require empirical calibration beyond the available design-stage data.
2.7.2. Headway Mapping from NBHS Risk
Using risk defined in Equation (6), define the following:
As stated in Equation (10b), mh increases monotonically with risk and α, enabling scenario-based sensitivity analysis while retaining interpretability.
2.7.3. Monte Carlo Bottleneck Processing (Run-Level Definition)
For each stand and scenario, evacuation time is estimated via repeated Monte Carlo runs. In each run,
- Demand on each constrained bottleneck edge is discretized into groups of size g = people_per_agent.
- For each group, a profile is sampled from scenario probabilities (N/E/M).
- If the sampled profile is vulnerable (E or M), headway multiplier is applied; otherwise, multiplier is 1.
- Edge processing times are accumulated, and stand time is the maximum across bottleneck edges.
Equation (8a) defines the continuous queue-time baseline, whereas the Monte Carlo implementation uses grouped demand units of size g. Therefore, reported simulation times are based on grouped processing, and baseline consistency is evaluated empirically against Tdet.
Let De be the demand allocated to edge e. The number of groups is
In run r, define group multipliers . Then the run-level edge time and stand time are
Reported stand metrics are computed as the mean and 95th percentile (p95) of across Monte Carlo runs. With NBHS enabled, the stand time is denoted TqueueNBHS. In the baseline condition, α = 0, which sets the headway multiplier to unity and yields Tqueue0 as defined in Equation (8b).
2.7.4. Delay Definition
The baseline queue time is obtained from the same network and grouped-processing structure under α = 0, where the NBHS headway perturbation is removed. The NBHS-induced delay is then computed as
Equation (13) is the primary effect metric reported across stands, scenarios, and α values (see Algorithms 4 and 5 for the computational steps).
Reported outputs emphasize baseline consistency Tqueue0 vs. Tdet (Equation (8b) vs. Equation (1c)); sensitivity of ΔT (Equation (13)) to α and scenario; and interpretability via stand-level heterogeneity and bottleneck-rate drivers (from GraphML-derived summaries).
In the analytical formulation, denotes the baseline queue time from constrained bottlenecks. In the implemented Monte Carlo workflow, the reported corresponds to the same network and demand-allocation structure evaluated with α = 0, i.e., with the NBHS headway perturbation removed.
3. Results
3.1. Baseline Consistency of the Queue Model
The first result concerns the consistency between the deterministic control time and the queue baseline. Because the queue model was designed as a deterministic-consistent extension rather than an independent microscopic crowd simulation, was compared against for each stand. Figure 2 and Table 2 report this check. This comparison is central to the study design because the later NBHS-enabled outputs can only be interpreted as controlled health-risk perturbations if the queue baseline itself remains close to the deterministic capacity–flow reference.
Figure 2.
Baseline consistency diagnostics: (a) vs. where the blue dots represent individual stand units and the dashed line indicates identity; (b) validation ratio distribution, with unity shown by the dashed line; (c) residual distribution, with the dashed line indicating zero residual; (d) stand-level ratios, with unity shown by the dashed line.
Table 2.
Global baseline-consistency summary.
The baseline-consistency results support this requirement. The mean validation ratio is close to unity ( = 0.980), and the average residual is modest relative to the stand-level evacuation-time scale (−8.55 s). The residual is not treated as a failure of the model; rather, it reflects the fact that the queue implementation uses edge-level demand allocation and grouped processing instead of forcing exact equality with the closed-form deterministic equation. This is important methodologically because it preserves the interpretability of deterministic egress calculation while creating a controlled computational layer in which NBHS-related headway effects can be isolated.
The slight negative residual should therefore be interpreted as a consequence of the implemented queue abstraction rather than as a separate behavioral effect. The deterministic equation computes a closed-form control time from aggregate stand capacity and total effective discharge width, whereas the queue implementation allocates demand proportionally across constrained GW → VOM service-rate edges and then processes demand in grouped Monte Carlo units. Because the queue baseline is not forced to equal the deterministic equation exactly, a small systematic underestimation can occur when the capacity-proportional allocation distributes demand slightly more efficiently across parallel bottlenecks than the aggregate deterministic control expression. This does not affect the interpretation of ΔT comparisons because both and are generated with the same network, demand-allocation rule, group size, and Monte Carlo processing structure; ΔT is therefore evaluated as a matched perturbation around the queue baseline rather than as an absolute replacement for .
The stand-level records in Table A4 and the time-component visualization in Figure A3 further show that the baseline relation is not driven by a single stand. Both long-side and short-side cases remain close to the deterministic reference, with validation ratios ranging from 0.966 to 0.997. Figure A3 also illustrates why ΔT is treated as a separate effect metric: the NBHS-induced component is small compared with the absolute egress-time scale, but it is systematic and scenario-sensitive.
3.2. NBHS-Induced Delay Under Vulnerable-Group Scenarios
Figure 3 and Table 3 show how vulnerable-group composition and the sensitivity coefficient α affect stand-level evacuation delay. The purpose of this analysis is not to estimate clinical outcomes, but to test whether a geometry-derived risk proxy can produce a monotone and interpretable delay response when inserted into the queue model.
Figure 3.
NBHS-induced delay by scenario and α: (a) mean ΔT; (b) p95 ΔT; (c) relative delay; (d) reference scenario comparison.
Table 3.
Scenario—α delay summary.
The scenario—α response confirms the expected monotonicity. In the general-population scenario, mean ΔT increases from 0 s at α = 0 to approximately 32 s at α = 0.5, while the older-audience scenario reaches approximately 52 s at the same sensitivity level. This separation indicates that vulnerable-profile composition can amplify the same NBHS-based headway mechanism without changing the deterministic baseline or the stand network. The effect is therefore not an artifact of capacity recalculation; it is produced by the intended profile-sensitive headway perturbation.
The reference condition at α = 0.3 is particularly useful for interpretation. At this level, the older-audience scenario produces a mean delay of approximately 31 s, compared with approximately 19 s for the general-population condition. This difference is large enough to show scenario sensitivity but remains within a range that is interpretable as a design-stage delay increment rather than a catastrophic evacuation failure. By contrast, the mobility-proxy scenario remains close to the general-population scenario across the tested α grid. This near-overlap is an expected consequence of the current implementation: S2 varies the mobility-proxy probability within a narrow range, but it does not assign a separate walking-speed distribution, profile-specific route-choice rule, or mobility-specific service-rate model. Therefore, S2 should be interpreted as a bounded mobility-proxy sensitivity case, not as evidence that mobility limitation has negligible effects in real stadium egress.
Table A5 provides the -level breakdown at α = 0.3. The gradual increase in mean ΔT across the mobility-proxy grid shows that the grid behaves in the expected direction, but the magnitude of change remains smaller than the scenario-level separation produced by the older-audience condition. This reinforces the interpretation that the current results are driven mainly by the older-audience multiplier and the bottleneck structure, while mobility sensitivity is represented as a controlled proxy grid.
3.3. Stand-Level Heterogeneity and Bottleneck Drivers
Stand-level differences in ΔT are expected because the NBHS perturbation is applied within networks that differ in demand, service-rate distribution, and bottleneck structure. Stands with lower bottleneck service rates or less favorable demand-to-capacity balance are more sensitive to headway increases, whereas stands with greater effective bottleneck capacity absorb the same NBHS perturbation with smaller delay changes.
These differences should be read together with the stair-geometry basis of NBHS. In the current queue-simulation results, the same baseline NBHS value is used across evaluated stands; therefore, stand-level differences in ΔT primarily reflect differences in demand, capacity, and bottleneck service-rate structure.. Accordingly, the reported heterogeneity is not solely a property of stair health risk or egress capacity in isolation but of their interaction within each stand-specific egress network.
Figure 4 and Table 4 investigate why the same NBHS-based perturbation produces different delay magnitudes across stands. Because the reported queue simulations use the same baseline NBHS value across evaluated stands, stand-level heterogeneity cannot be attributed to different NBHSs in the main queue outputs. Instead, it reflects how each stand-specific network absorbs or amplifies the same headway perturbation through demand level, constrained-edge service rates, and bottleneck distribution. The geometry sensitivity of NBHS is retained in the geometry-case grid and is evaluated separately in Figure 5.
Figure 4.
Stand heterogeneity and bottleneck drivers: (a) Distribution of ΔT with mean and median lines; (b) versus , with dots representing individual stands and the dashed line indicating y = x; (c) Stand-level ΔT, with salmon and dark-blue bars indicating LS and SS stands, respectively; (d) ΔT versus minimum GW → VOM service rate, with dots representing stands and the dashed line indicating the fitted trend. p < 0.05.
Table 4.
Stand-level reference summary with GraphML-derived bottleneck drivers (reference condition: general-population scenario, α = 0.3, = 0.00).
Figure 5.
NBHS geometry sensitivity: pitch–tread risk heatmap (riser height is derived from pitch and tread depth; therefore, the heatmap reflects their combined effect).
The stand-level results support the interaction hypothesis of the paper: health-risk sensitivity and egress infrastructure should be interpreted jointly. For example, the largest reference delay occurs in a long-side stand with one of the lowest minimum (GW → VOM) service rates, whereas the smallest reference delay appears in a short-side stand with the highest minimum service rate in Table 4. The relationship is also visible in Figure 4d, where ΔT decreases as the minimum GW → VOM service rate increases. Because this comparison is based on 10 stand units, the correlation is interpreted as descriptive evidence rather than confirmatory inference. Under the reference condition, the association between minimum GW → VOM service rate and ΔT was negative and consistent across Pearson and rank-based measures (Pearson r = −0.812, p = 0.004; Spearman ρ = −0.790, p = 0.006; n = 10). This is consistent with the queue mechanism: the same vulnerable-profile headway increment has a stronger effect when applied at a more restrictive bottleneck.
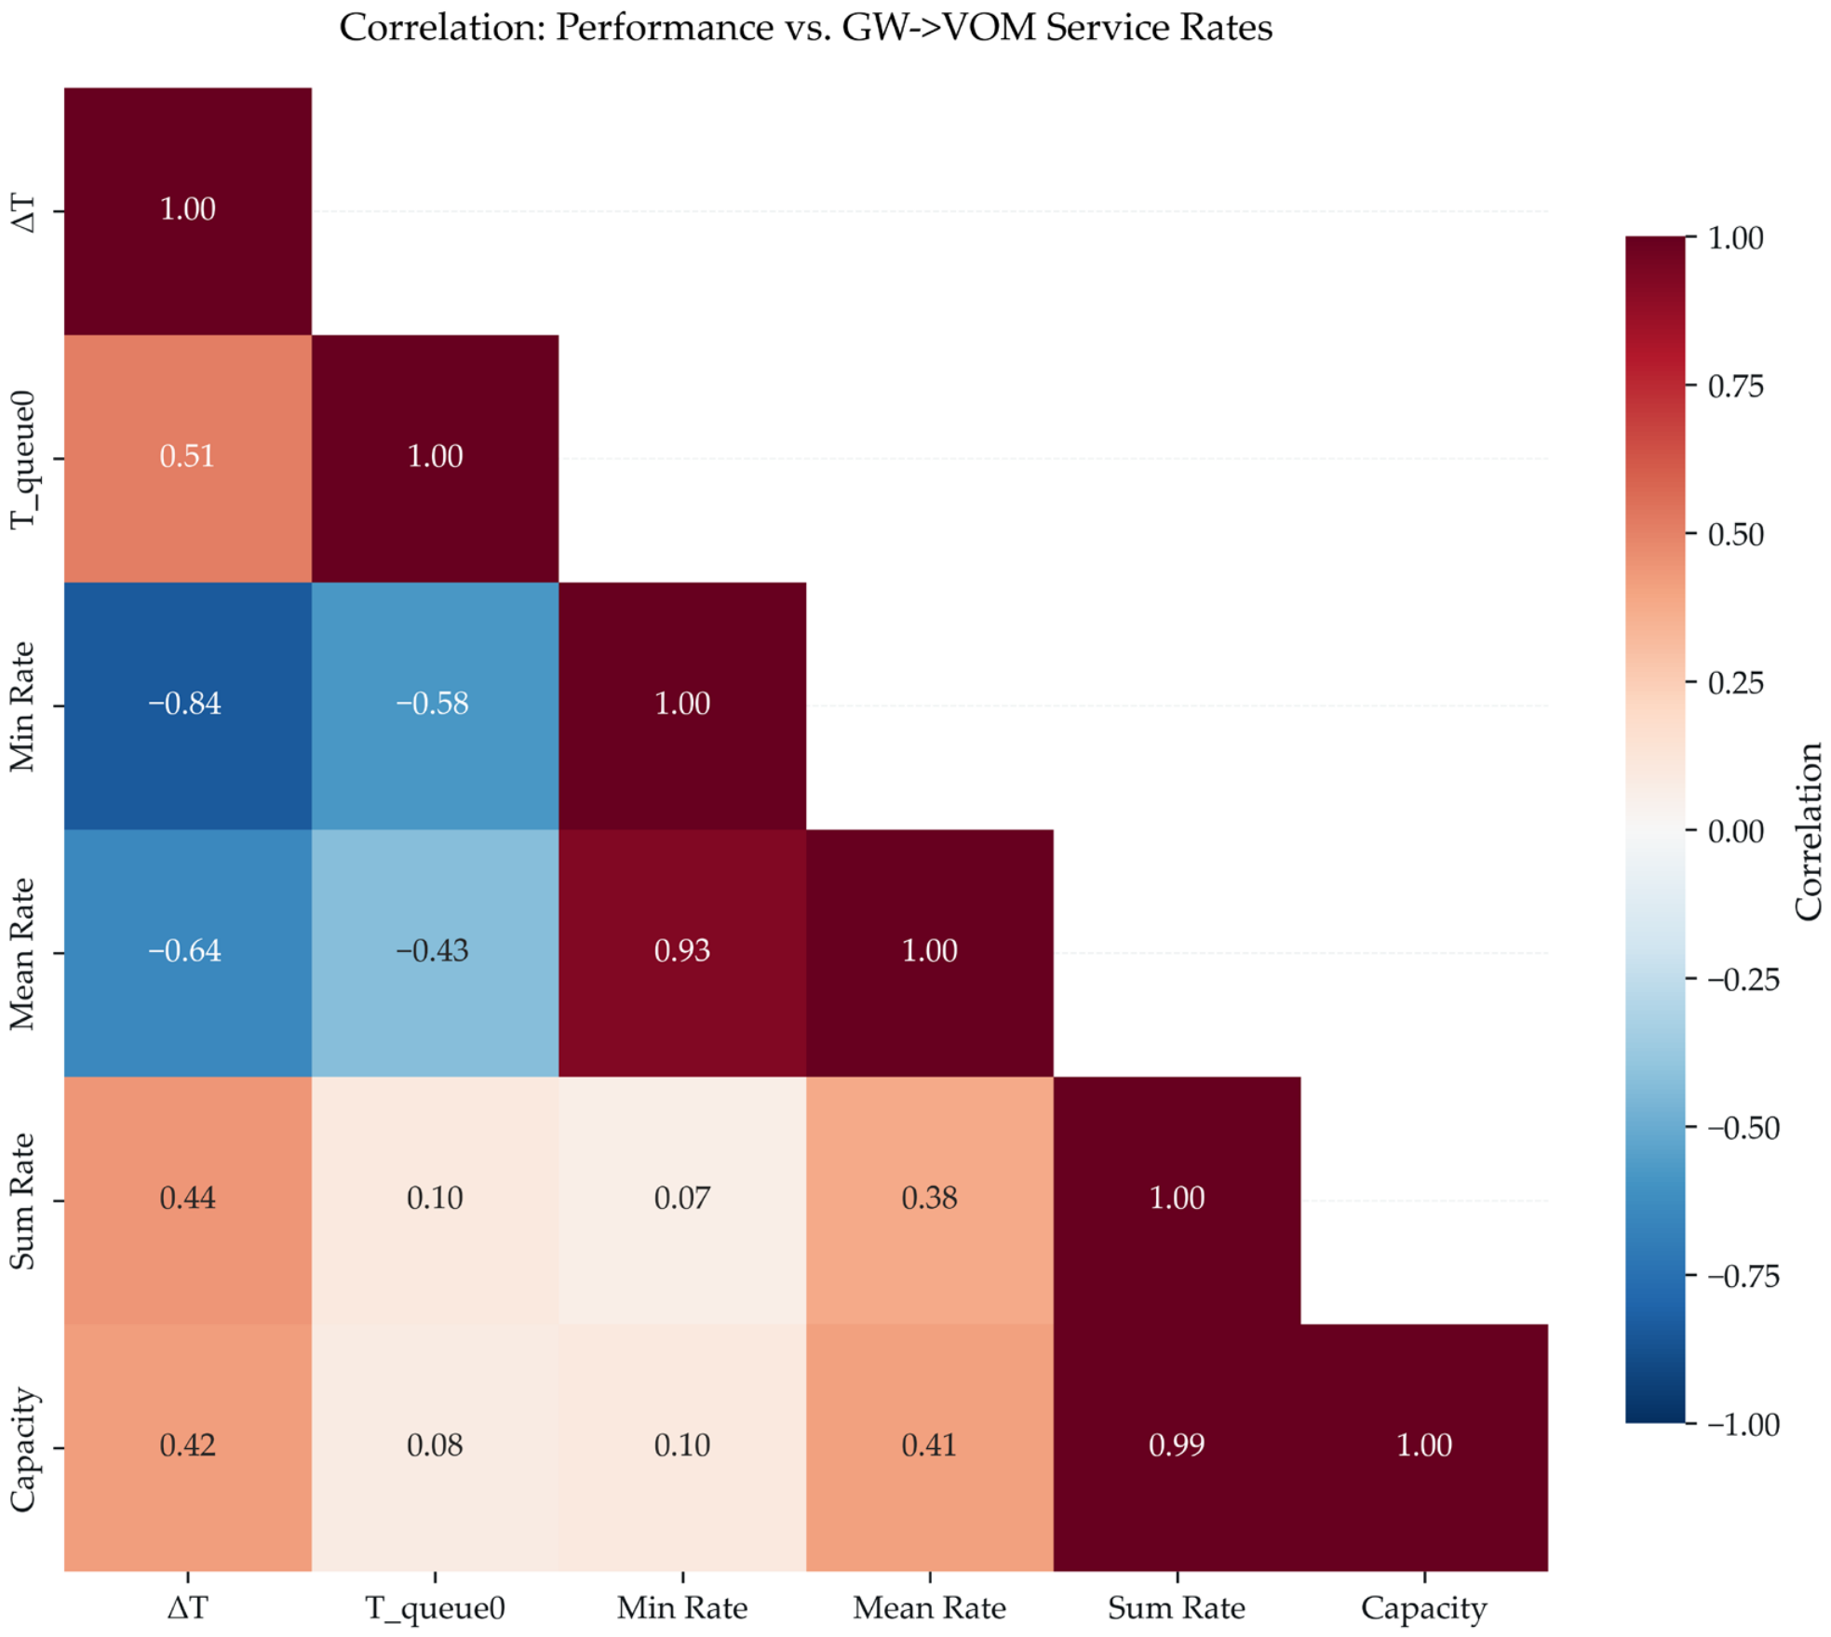
This result strengthens the methodological contribution of the study. The stand-level delay pattern is not presented as a black-box simulation outcome; it is traceable to GraphML-derived bottleneck properties. The additional correlation evidence in Figure A4 supports the same interpretation by showing a negative association between delay and service-rate variables, especially the minimum constrained-edge service rate. Therefore, the model links NBHS-induced delay to auditable network structure rather than to unobserved behavioral assumptions.
3.4. NBHS Geometry Sensitivity
The preceding queue results evaluate how a common NBHS perturbation is propagated through stand-specific bottleneck structures. To complement this network-level interpretation, Figure 5 reports the geometry-case grid and shows how NBHS risk changes across pitch–tread combinations before the score is inserted into the queue model.
The heatmap confirms that NBHS is sensitive to stair geometry in a way that is consistent with the score definition. The higher-risk region emerges as pitch approaches the steeper range, whereas the lower-risk region remains associated with the milder pitch–tread combinations. This analysis separates two mechanisms that are coupled in the full workflow: stair geometry defines the health-risk proxy, while the stand egress network determines how strongly that proxy is expressed as evacuation delay. This distinction prevents over-interpreting the main queue results as geometry-only effects and supports the broader claim that the framework evaluates the interaction between stair tolerance and bottleneck capacity.
Riser height in Figure 5 is derived from the pitch–tread combination; therefore, the heatmap should be interpreted as a combined geometry-response surface rather than as an isolated tread-depth or pitch-only experiment. This is consistent with the NBHS formulation, where riser, tread, and pitch jointly affect the score through MCS, BSS, and HRS components.
4. Discussion
4.1. Interpretation of the NBHS–Delay Relationship
The results demonstrate that a geometry-based health-risk proxy can be coupled with a deterministic-consistent egress model without abandoning the transparency of capacity–flow calculations. This is important because stadium stair geometry is not only a matter of circulation capacity or visual performance; it also affects the physiological and biomechanical tolerance of spectators. Previous studies indicate that riser height, tread depth, and stair pitch influence cardiovascular load, metabolic demand, descent stability, and fall risk [1,2,3]. The proposed NBHS-to-headway mechanism provides one way to express these relationships in egress-time terms while keeping the underlying model auditable.
The interpretation of ΔT should therefore be specific: it represents the additional delay associated with NBHS-based headway perturbation under the selected vulnerable-group scenario and sensitivity level. It does not represent a direct prediction of medical events, individual oxygen consumption, or clinical deterioration. This distinction is essential because the physiological literature provides strong motivation for vulnerability-aware modeling, but the present computational implementation intentionally remains minimal and reproducible.
The results support the central modeling premise that NBHS should be interpreted as a perturbation layer rather than as a replacement for deterministic egress calculation. The baseline check shows that the queue model remains close to the deterministic reference, while the scenario analysis shows that ΔT responds monotonically to the headway sensitivity coefficient. Together, these two findings establish the internal logic of the framework: deterministic consistency provides the reference condition, and NBHS controls the incremental delay around that reference.
4.2. Relevance of Riser Height, Tread Depth, and Pitch
The geometry variables used in NBHS are supported by multiple strands of stair-safety and physiological evidence. Riser height is relevant because risers around 18 cm have been associated with increased heart rate, blood pressure, and rate pressure product, whereas risers around 14 cm are reported as more comfortable for stair users [1]. This supports the inclusion of a hemodynamic risk channel in the NBHS structure. Tread depth is also critical because values below approximately 280 mm increase foot overhang and reduce stability during descent, particularly among older users [2]. Pitch provides a combined expression of riser and tread geometry; inclines around 30–35° are generally considered safer and more comfortable, whereas inclines exceeding approximately 37° increase fall-risk sensitivity [2,3].
In the present model, these findings are not used to simulate detailed gait mechanics. Instead, they are converted into component scores and penalty functions that allow stadium stand geometry to influence evacuation delay through a single interpretable health-risk score. This simplification is appropriate for design-stage screening because it avoids individual-level clinical assumptions while still preserving the directionality of the underlying evidence.
The geometry-sensitivity result further clarifies the role of stair geometry in the proposed workflow. Geometry is not treated as a direct evacuation-time variable; rather, it defines the NBHS tolerance/risk state that is subsequently propagated through the queue model. This distinction is important because a geometry with higher NBHS risk does not automatically produce the same delay in every stand. The resulting delay also depends on the service-rate structure of the stand egress network. For this reason, riser height, tread depth, and pitch are included not as secondary architectural descriptors, but as the design variables through which health-related stair-use tolerance can be translated into an egress-delay mechanism for vulnerable spectators.
4.3. Vulnerable Spectators and Headway Interpretation
The use of vulnerable-profile probabilities is justified by evidence that stadium audiences may include elderly individuals, obese spectators, and users with cardiovascular, respiratory, or musculoskeletal limitations. These groups may experience increased difficulty during stair use because of reduced aerobic capacity, higher mechanical demand, balance limitations, or disease-related functional constraints [1,3,4,5,6,7]. Elderly spectators are particularly relevant for egress modeling because stair descent may require slower movement to maintain balance; a descent speed of approximately 0.52 m/s or less has been reported for older adults, representing an approximate 30% slowdown compared with younger adults [9].
Stair-evacuation studies involving mobility-impaired occupants provide empirical support for treating mobility limitation as an important egress variable [19]. However, because the present study does not assign profile-specific walking-speed distributions, the mobility-limited category is retained as a scenario-level proxy rather than an empirically calibrated behavioral class.
In this study, such vulnerability is expressed through headway multipliers rather than explicit speed distributions. This modeling choice is conservative and auditable: it does not attempt to represent detailed individual movement trajectories, but it does allow vulnerable-group composition to affect bottleneck processing time. Consequently, the model remains compatible with deterministic capacity–flow logic while introducing a controlled health-risk sensitivity.
The scenario results also indicate why vulnerable-group composition is better represented as a sensitivity structure than as a fixed demographic claim. The older-audience scenario produces a stronger delay response, whereas the mobility-proxy scenario remains close to the general-population condition under the present grid. This should be read as a scope limitation of the current minimal implementation rather than as a behavioral conclusion: the mobility-proxy profile changes scenario composition, but it does not yet introduce profile-specific speeds, fatigue accumulation, route-choice constraints, or assistance-related delay mechanisms. This pattern supports the use of scenario-based modeling, as it allows the designer or operator to explore plausible vulnerability profiles without claiming that the actual spectator population has been clinically measured.
4.4. Physiological Detail and Model Scope
The physiological literature includes detailed formulations for stair-climbing energy expenditure, cardiovascular response, and obesity-related metabolic correction. For example, ACSM stair-stepping equations separate horizontal movement cost, vertical work, and resting metabolism, with riser height directly affecting the vertical component of energy expenditure [6,8]. However, these equations were primarily validated in healthy populations and should be interpreted cautiously for elderly individuals, people with cardiovascular disease, or users with limited functional capacity [8]. Similarly, obesity-related correction approaches indicate that standard MET assumptions can underestimate relative exertion in individuals with high BMI because the conventional 1 MET value of 3.5 mL/kg/min may not represent their true resting oxygen consumption [5,20].
These physiological models are important for interpreting why stair geometry matters, but they are not directly implemented in the present egress simulation. The model does not estimate individual VO2, corrected METs, BMI-specific exertion, rate pressure product, COPD desaturation, or clinical fall probability. Instead, the literature is used to justify the direction and components of a geometry-based NBHS proxy. This distinction prevents over-claiming while allowing the computational workflow to remain reproducible, auditable, and applicable at the design stage.
This modeling boundary is reinforced by the output structure. The model does not estimate individual physiological states, but it produces interpretable changes in queue-processing time under controlled vulnerability assumptions. In this sense, physiological evidence informs the direction and plausibility of the NBHS perturbation, while the computational model remains intentionally limited to reproducible stand-level egress outcomes.
4.5. Design Implications for Inclusive Stadium Stands
The findings have practical implications for inclusive stadium design. If specific stand sectors combine high NBHS risk with low bottleneck service capacity, they may generate larger vulnerable-group delays under the same population scenario. Such sectors could be prioritized for design review, operational management, or spectator guidance. The literature on stair safety suggests that lower riser heights, adequate tread depths, safer pitch ranges, visible step edges, sufficient lighting, and usable handrails are important for reducing cardiovascular strain and fall risk among vulnerable users [1,2,3,7]. The main benefit of the proposed workflow is that it converts this qualitative design concern into a traceable computational screening process: each stand can be evaluated through its deterministic control time, GraphML-derived bottleneck structure, NBHS risk state, and resulting vulnerable-scenario delay.
The model also supports the idea of health-informed seating and access strategies. Seating areas requiring greater stair effort may be labeled or managed differently, and more accessible seating zones may be prioritized for elderly spectators, obese individuals, or spectators with cardiorespiratory limitations. In long or steep stair routes, intermediate rest opportunities and clearer wayfinding may reduce physiological stress and improve safety [21]. These recommendations should be interpreted as design and operational implications derived from the model and literature, not as clinical prescriptions.
The stand-level bottleneck results imply that inclusive stadium design should not be based only on stair geometry or only on aggregate capacity. A stand with the same NBHS risk can produce different delay increments depending on its constrained (GW → VOM) service rates. Therefore, the most relevant design target is the combination of health-risk sensitivity and bottleneck capacity. Stands that combine higher NBHS-derived risk with lower service-rate bottlenecks should be prioritized for detailed review, targeted wayfinding, accessibility improvements, or operational management.
The practical interpretation of the results should also consider absolute stand times, not only ΔT. In the reference condition reported in Table 4, the mean values remain within a narrow range of approximately 434–449 s, with p95 values of approximately 436–453 s. In Table A5, the older-audience sensitivity case at α = 0.3 produces mean values of approximately 456–459 s across the mobility-proxy grid, with mean p95 stand times of approximately 461–464 s. These values should not be interpreted as a code-compliance certification, because allowable egress or emergency evacuation times depend on local regulations, fire strategy, protected-route assumptions, management procedures, and venue-specific risk assessment [17]. However, they provide an engineering-scale reference for design screening: the NBHS-induced delay is modest relative to the total stand egress time, but it can move vulnerable-scenario estimates closer to the egress-time ranges used in sports-ground safety guidance [17]. Therefore, ΔT is most useful when read together with , bottleneck service-rate properties, and the intended design or operational threshold for the specific stadium.
4.6. Limitations and Implications for Future Work
The proposed workflow should be interpreted as a reproducible design-stage screening framework rather than a clinical or behavior-rich evacuation model. NBHS is used as a geometry-derived tolerance proxy; it does not diagnose individual health status or predict medical events. Similarly, the vulnerable profiles used in the Monte Carlo sampling represent scenario-level population assumptions rather than stand-specific demographic measurements. This modeling choice keeps the workflow auditable and applicable at early design stages, where detailed spectator health data are typically unavailable.
The current implementation intentionally introduces vulnerability through NBHS-based headway multipliers at constrained bottlenecks. It does not assign profile-specific walking speeds, fatigue trajectories, route-choice preferences, or microscopic interactions among spectators. Likewise, physiological concepts discussed in the supporting literature such as VO2, MET capacity, corrected METs, rate pressure product, oxygen desaturation, and clinical fall probability are used to motivate the score structure, but they are not simulated as individual state variables. This focused scope is consistent with this study’s aim: to extend deterministic capacity–flow logic with a transparent and health-sensitive perturbation while preserving reproducibility.
A related limitation is that vulnerable-user effects are applied only at constrained bottleneck processing points. The current queue implementation does not model local speed differences or congestion formation along seating rows, intermediate gangways, concourses, or other non-bottleneck route segments. It therefore cannot represent situations in which slower stair negotiation by vulnerable spectators changes local density, overtaking behavior, lane formation, or route choice before reaching the GW → VOM bottleneck. A natural extension would be to replace the present point-based headway perturbation with a path-distributed speed-attenuation or fatigue function, allowing health-related tolerance to vary along the full egress path while retaining the auditable GraphML network structure.
The NBHS implementation currently focuses on riser height, tread depth, and pitch angle. Other safety-relevant architectural and environmental factors, including lighting, handrail availability, contrast marking, step-edge visibility, surface friction, landing frequency, rest opportunities, and crowd-density effects, remain outside the computational scope. These factors are nevertheless important for elderly and mobility-limited users, particularly during stair descent [2,7]. Their inclusion would be a natural extension of the framework, especially for applications that aim to evaluate retrofit alternatives or accessibility improvements.
The present results also indicate where future validation would be most valuable. Baseline consistency can be tested against observed stand-discharge times, while the NBHS headway multiplier can be calibrated using stair-use observations, controlled experiments, or wearable physiological measurements. The GraphML-derived bottleneck summaries provide a practical starting point for this validation because they identify the specific constrained links where health-sensitive headway changes have the greatest effect on stand-level delay.
Future work should therefore focus on empirical calibration and enrichment rather than replacing the deterministic-consistent structure. Observed evacuation drills, controlled stair-use experiments, wearable physiological measurements, or high-fidelity simulation benchmarks could be used to refine NBHS-based headway multipliers and validate the baseline-consistency assumptions. Stand-specific demographic data, ticketing-zone information, or observational crowd profiles could also improve the scenario probabilities used for vulnerable groups. With these extensions, the workflow could support health-sensitive stadium design decisions such as inclusive seating allocation, accessible-route planning, targeted wayfinding improvements, handrail or contrast-marking interventions, and retrofit prioritization for stands where stair geometry and bottleneck capacity jointly amplify delay.
From a fire-safety perspective, the present workflow also does not simulate fire development, smoke spread, reduced visibility, toxic combustion products, alarm response, panic-like behavior, or incident-driven route redistribution. These factors are outside the current deterministic-consistent, design-stage scope, but they are important for emergency evacuation analysis. Future work could therefore couple the present GraphML queue network with environmental hazard layers, such as CFD-derived smoke, visibility, or tenability fields, and with behavior-sensitive evacuation assumptions for incident conditions. In such an extension, NBHS would remain a health-tolerance layer, while smoke, visibility, fire dynamics, and psychological response would form separate environmental and behavioral perturbation layers. This separation would preserve auditability and avoid conflating stair-geometry-related vulnerability with fire-development or crowd-behavior mechanisms.
5. Conclusions
This study presented a reproducible stadium-stand egress modeling workflow that links deterministic capacity–flow calculations, auditable stand egress networks, and a geometry-based NBHS headway perturbation. The main conclusions are as follows:
- The proposed workflow preserves the transparency of deterministic egress calculation while adding a controlled health-risk perturbation layer. The queue baseline remained close to the deterministic reference, supporting the interpretation of NBHS-enabled results as matched perturbations around a consistent baseline rather than as outputs from an unrelated evacuation model.
- Riser height, tread depth, and stair pitch provide a practical geometry basis for representing stair-use tolerance in vulnerable spectator scenarios. These variables are design-accessible and are supported by the stair-health, metabolic, biomechanical, and movement literature; therefore, they allow health-related stair sensitivity to be considered at the design stage without requiring individual medical data.
- NBHS-induced delay increased monotonically with the headway sensitivity coefficient, and the older-audience scenario produced larger delay increments than the general-population and mobility-proxy cases under the tested grid. This confirms that vulnerable-profile assumptions can affect egress-delay estimates even when deterministic capacity and network structure remain fixed.
- Stand-level variation in delay was traceable to GraphML-derived bottleneck service-rate properties, especially the minimum GW → VOM service rate. The main practical benefit of the workflow is therefore its ability to identify stand configurations where stair geometry and constrained egress capacity jointly amplify delay for vulnerable spectators.
- The workflow should be interpreted as a design-stage screening and prioritization tool, not as a clinical diagnostic model, a prediction of individual medical outcomes, a code-compliance certification, or a behavior-rich fire-evacuation simulation. Future work should extend the framework through empirical evacuation observations, demographic data, profile-specific walking behavior, distributed speed-attenuation functions, and environmental hazard layers such as lighting, smoke, visibility, and fire-development effects.
Supplementary Materials
The following supporting information can be downloaded at: https://www.mdpi.com/article/10.3390/buildings16142839/s1. File S1: Curated reproducibility package for the deterministic-consistent NBHS stadium-egress workflow. Table S1: Full scenario grid used in the queue simulations. Table S2: Stand-level baseline-consistency records. Table S3: Full queue-simulation results across scenarios, headway-sensitivity coefficients, mobility-proxy values, and stand units. Data S1: Processed stand-level inputs, NBHS baseline and geometry-case data, deterministic and queue-model outputs, graph summaries, and sensitivity-analysis results. Network Data S1: Ten GraphML stand-egress network artifacts containing node, edge, and constrained GW → VOM service-rate attributes. Code S1: Cleaned Python scripts for NBHS computation, input generation, GraphML network construction, queue simulation, batch processing, figure and table generation, sensitivity analysis, and repository reproduction. Figure Files S1: Source files for manuscript Figure 1, Figure 2, Figure 3, Figure 4 and Figure 5 and Appendix A Figure A2, Figure A3 and Figure A4. Metadata S1: README, data dictionary, repository file tree, curation and privacy notes, file manifest, software requirements, and rerun audit report.
Author Contributions
Conceptualization, D.K.; methodology, M.A. and D.K.; software, M.A.; formal analysis, M.A.; resources, F.B. and D.K.; writing—original draft preparation, M.A.; writing—review and editing, M.A. and F.B.; visualization, M.A.; supervision, F.B. All authors have read and agreed to the published version of the manuscript.
Funding
This research received no external funding.
Data Availability Statement
The processed stand-level input tables, GraphML network artifacts, aggregated output tables, publication figure outputs, and cleaned reproducibility scripts supporting the findings of this study are available as Supplementary Materials. Full extended project files are available from the corresponding author upon reasonable request, subject to ongoing research and intellectual-property considerations.
Acknowledgments
During the preparation of this manuscript, the authors used generative AI tools (OpenAI ChatGPT-5.5 Thinking and Anthropic Claude Opus 4.8) for language polishing and improving clarity and concision of the writing. The authors reviewed and edited the output and take full responsibility for the content of this publication. The authors gratefully acknowledge the institutional support provided by the University of Liverpool and the Republic of Türkiye.
Conflicts of Interest
The authors declare no conflicts of interest.
Appendix A
Appendix A.1. Tables
Table A1.
Conceptual positioning of the proposed NBHS workflow.
Table A2.
NBHS component-weight sensitivity on the existing geometry-case grid.
Table A3.
Compact scenario-grid definition.
Table A4.
Stand-level baseline-consistency records.
Table A5.
Queue-simulation summary at reference sensitivity (α = 0.3).
Appendix A.2. Figures
Figure A1.
Stadium-stand terminology and analysis unit.
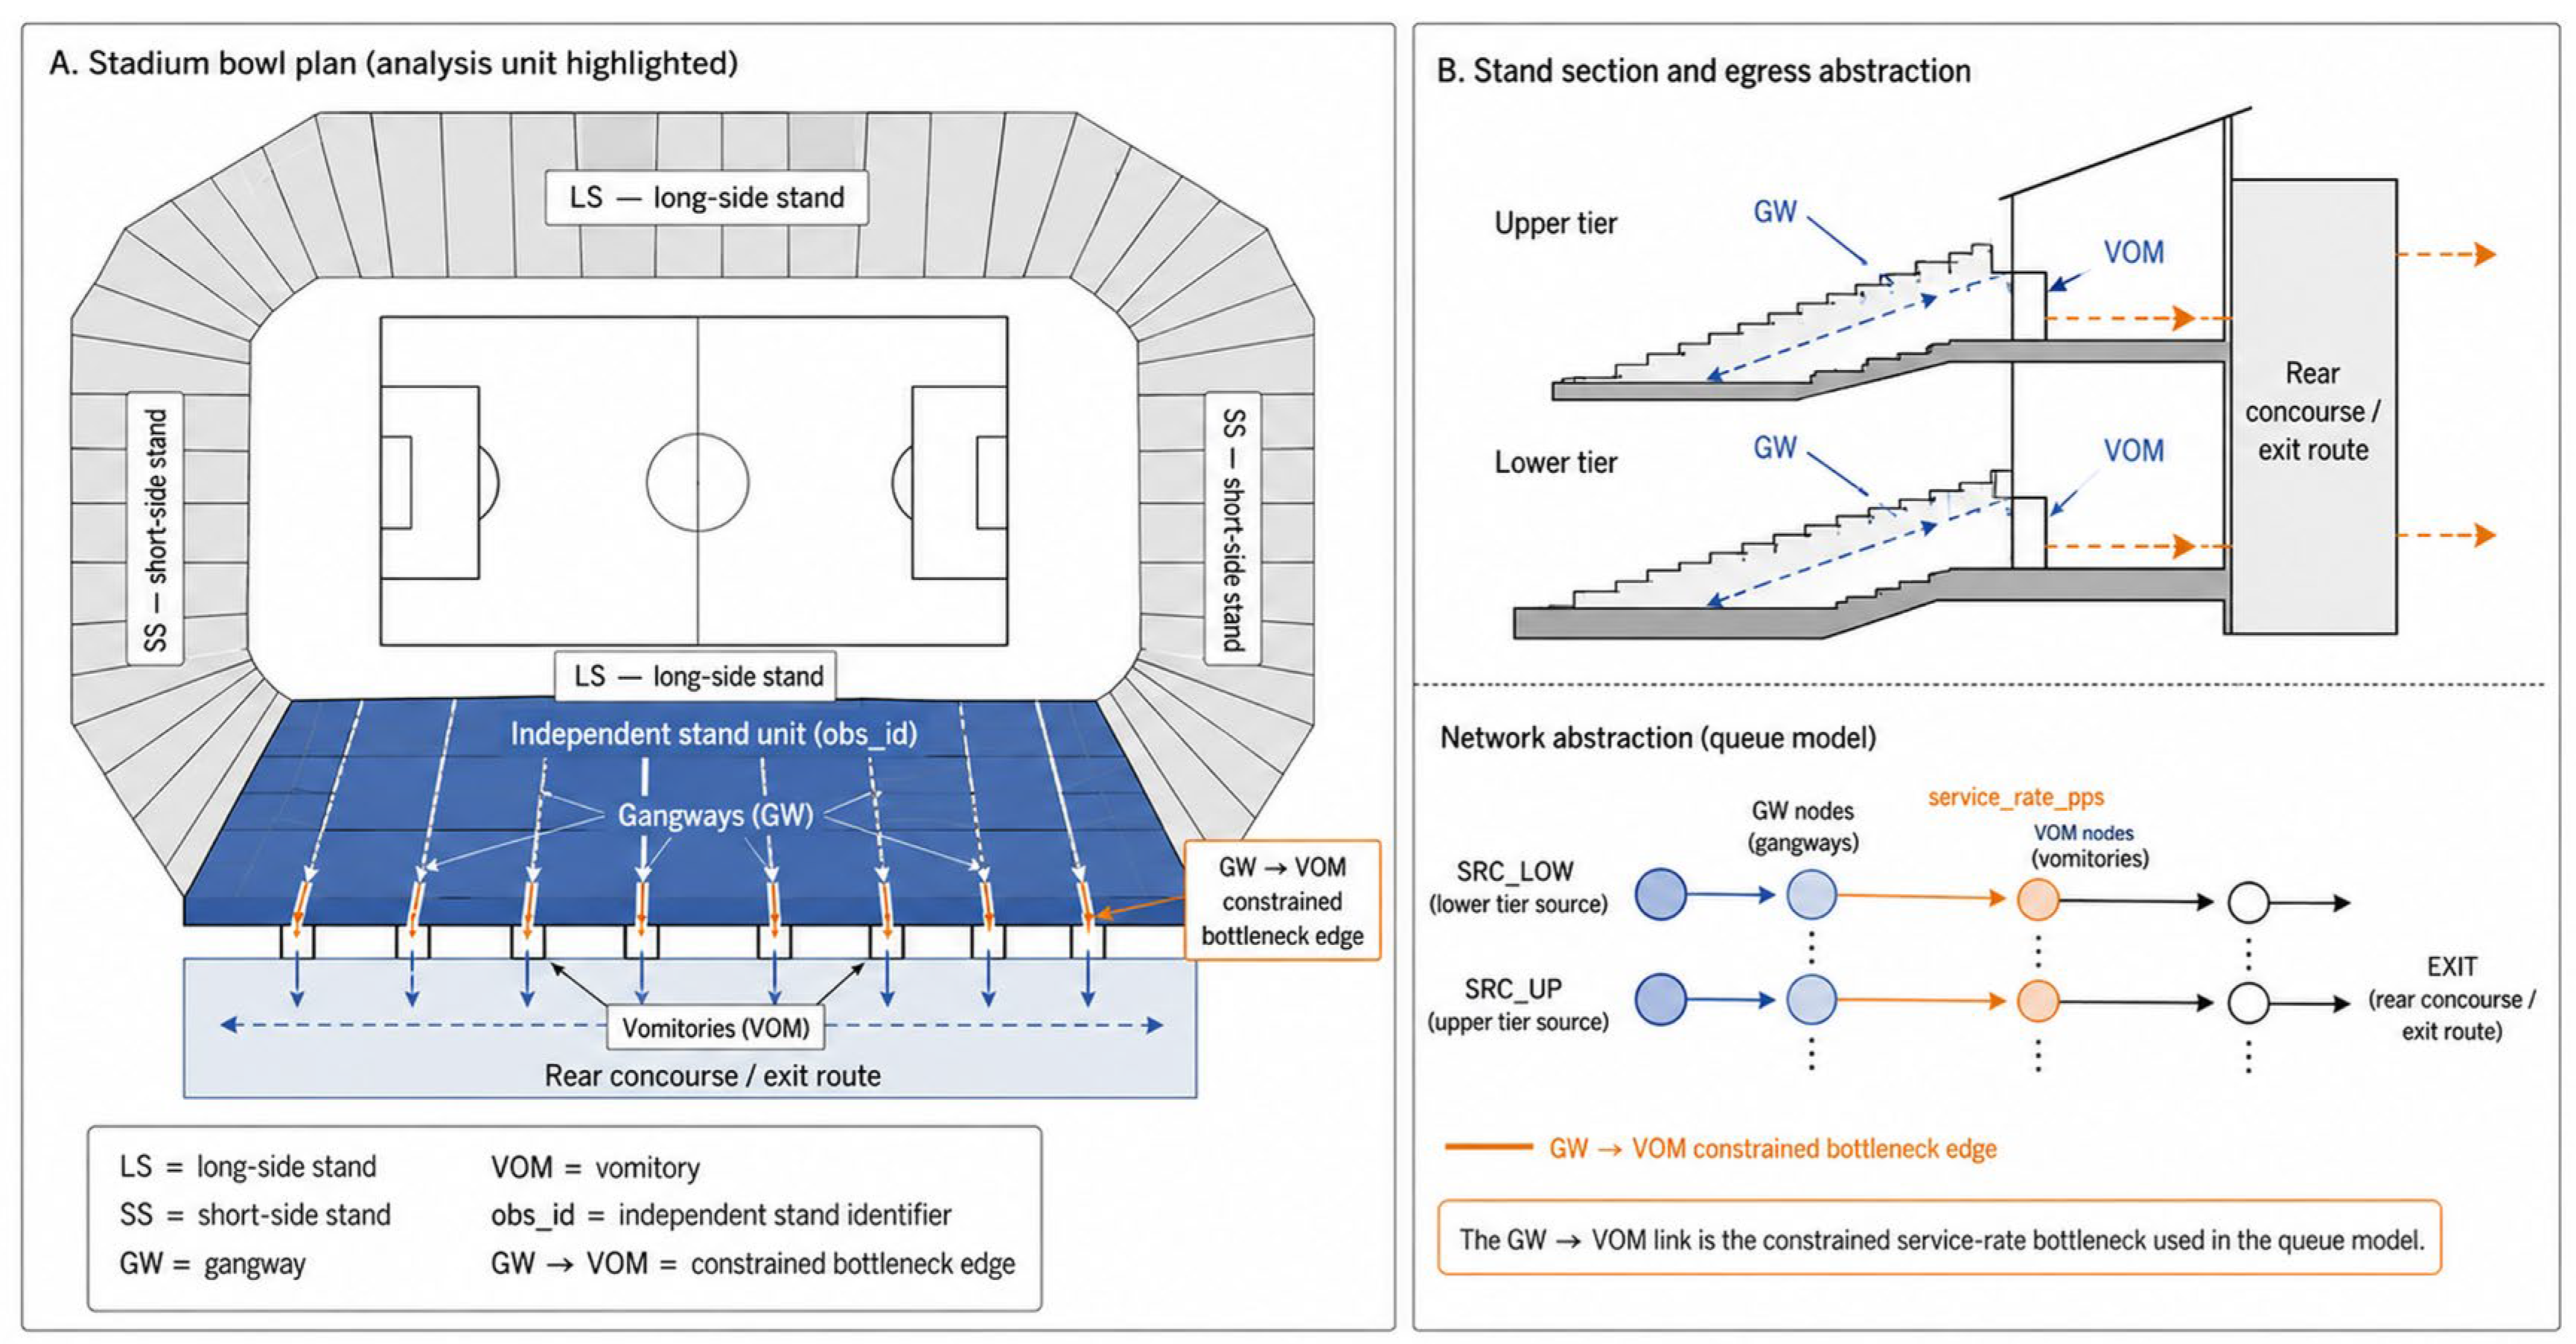
Figure A2.
Example GraphML networks: (a) low service-rate case; (b) high service-rate case. Numbers within the gangway, block, and vomitory nodes denote sequential local node identifiers within each tier; they do not represent capacities or service rates.
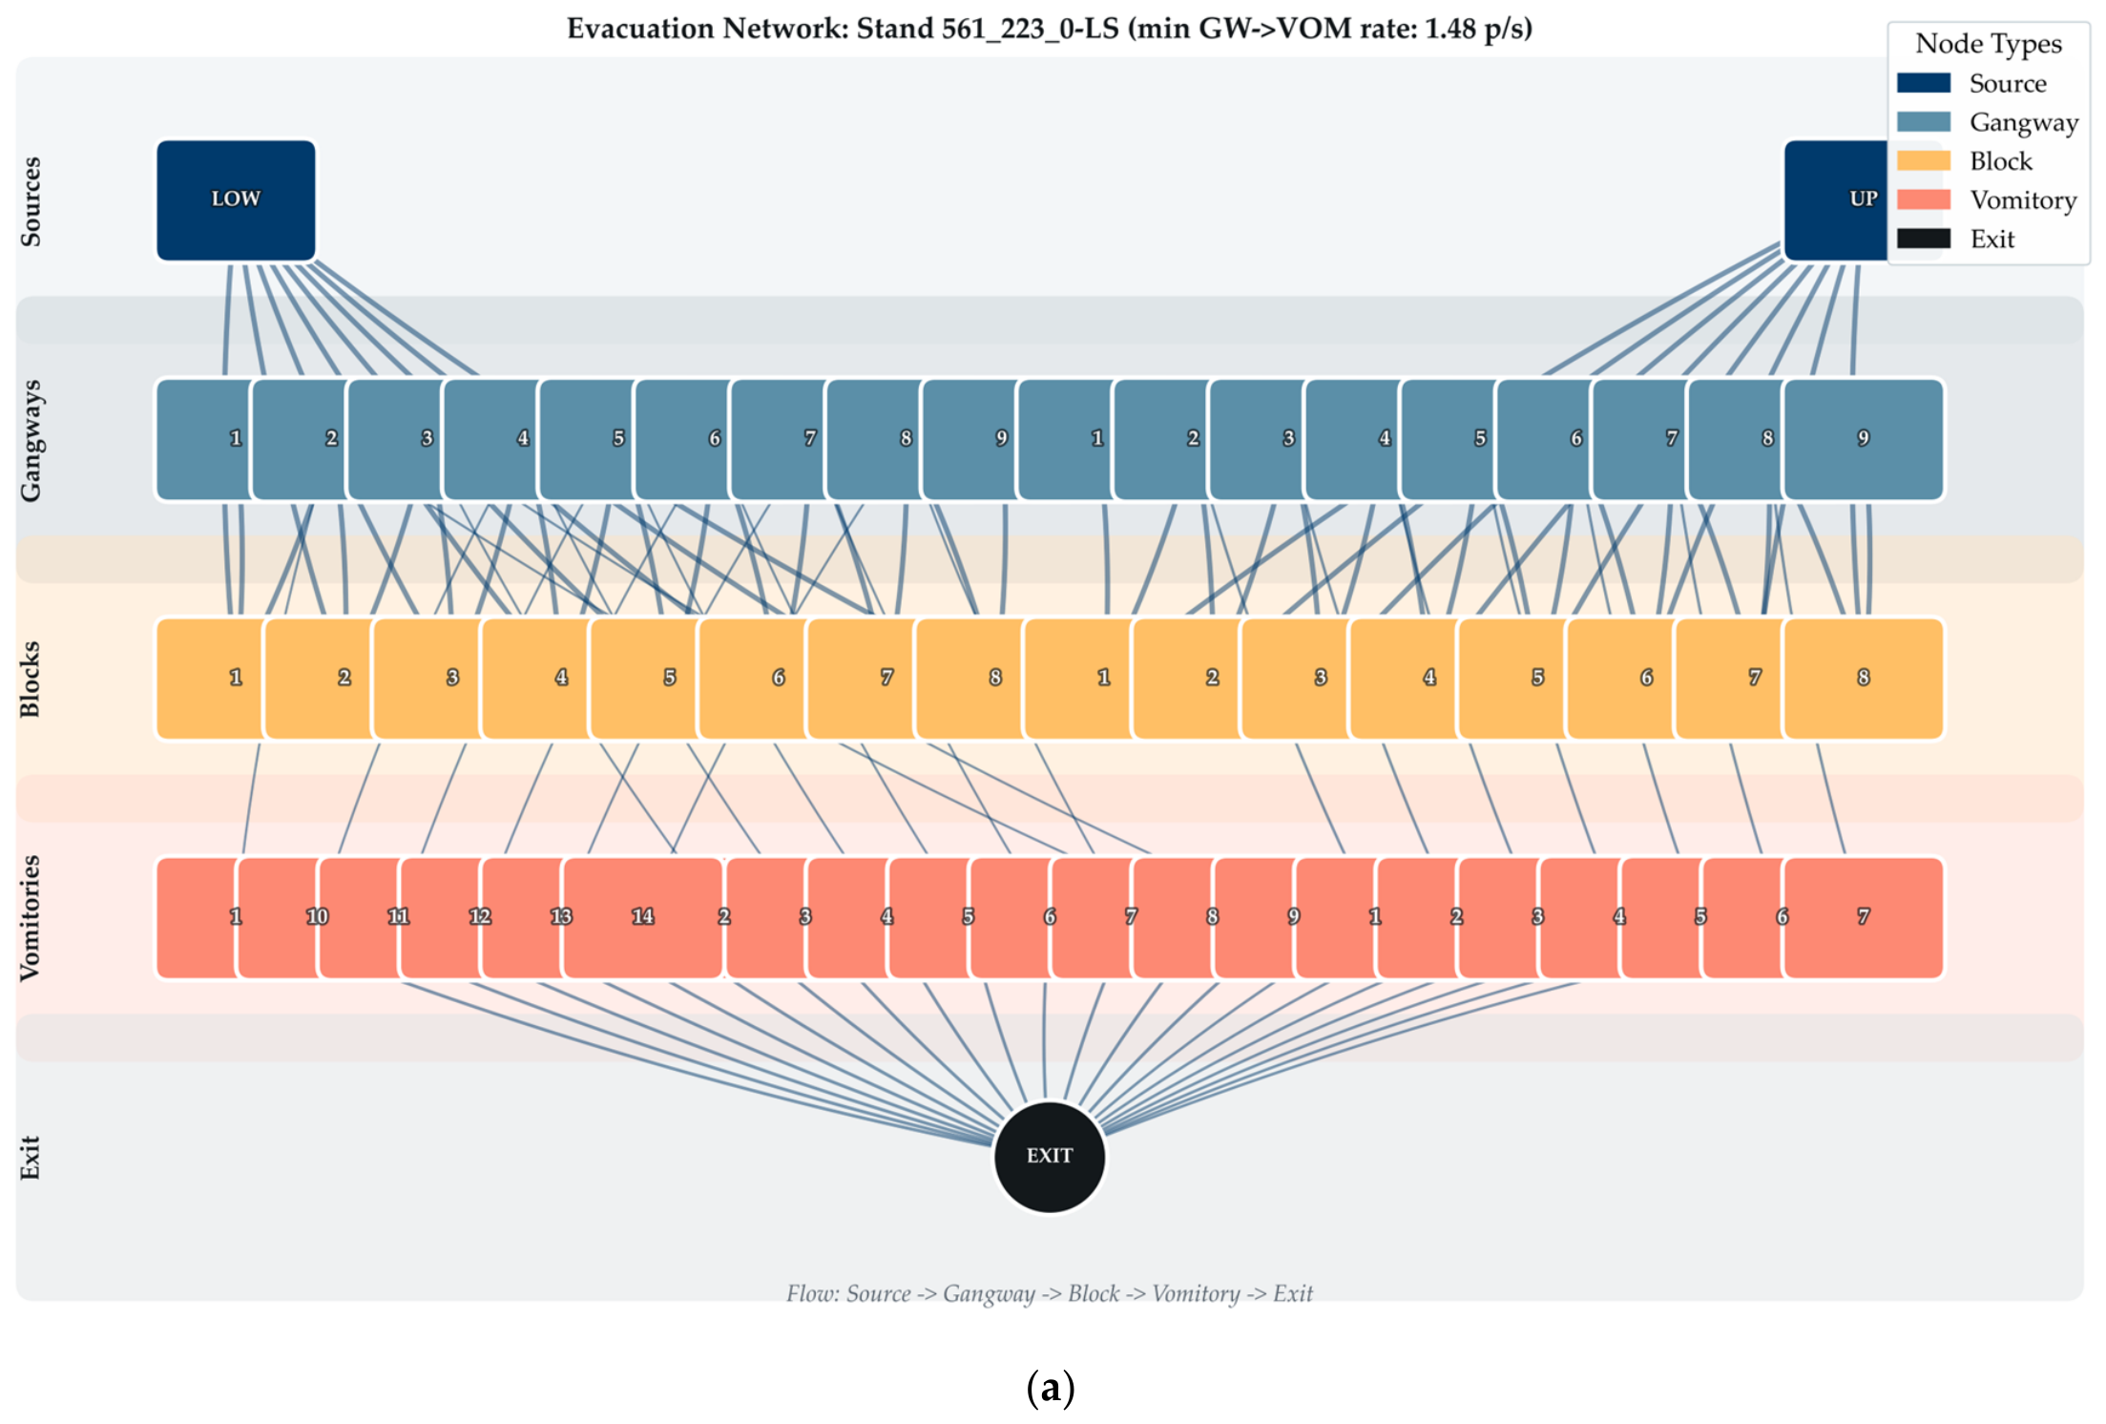
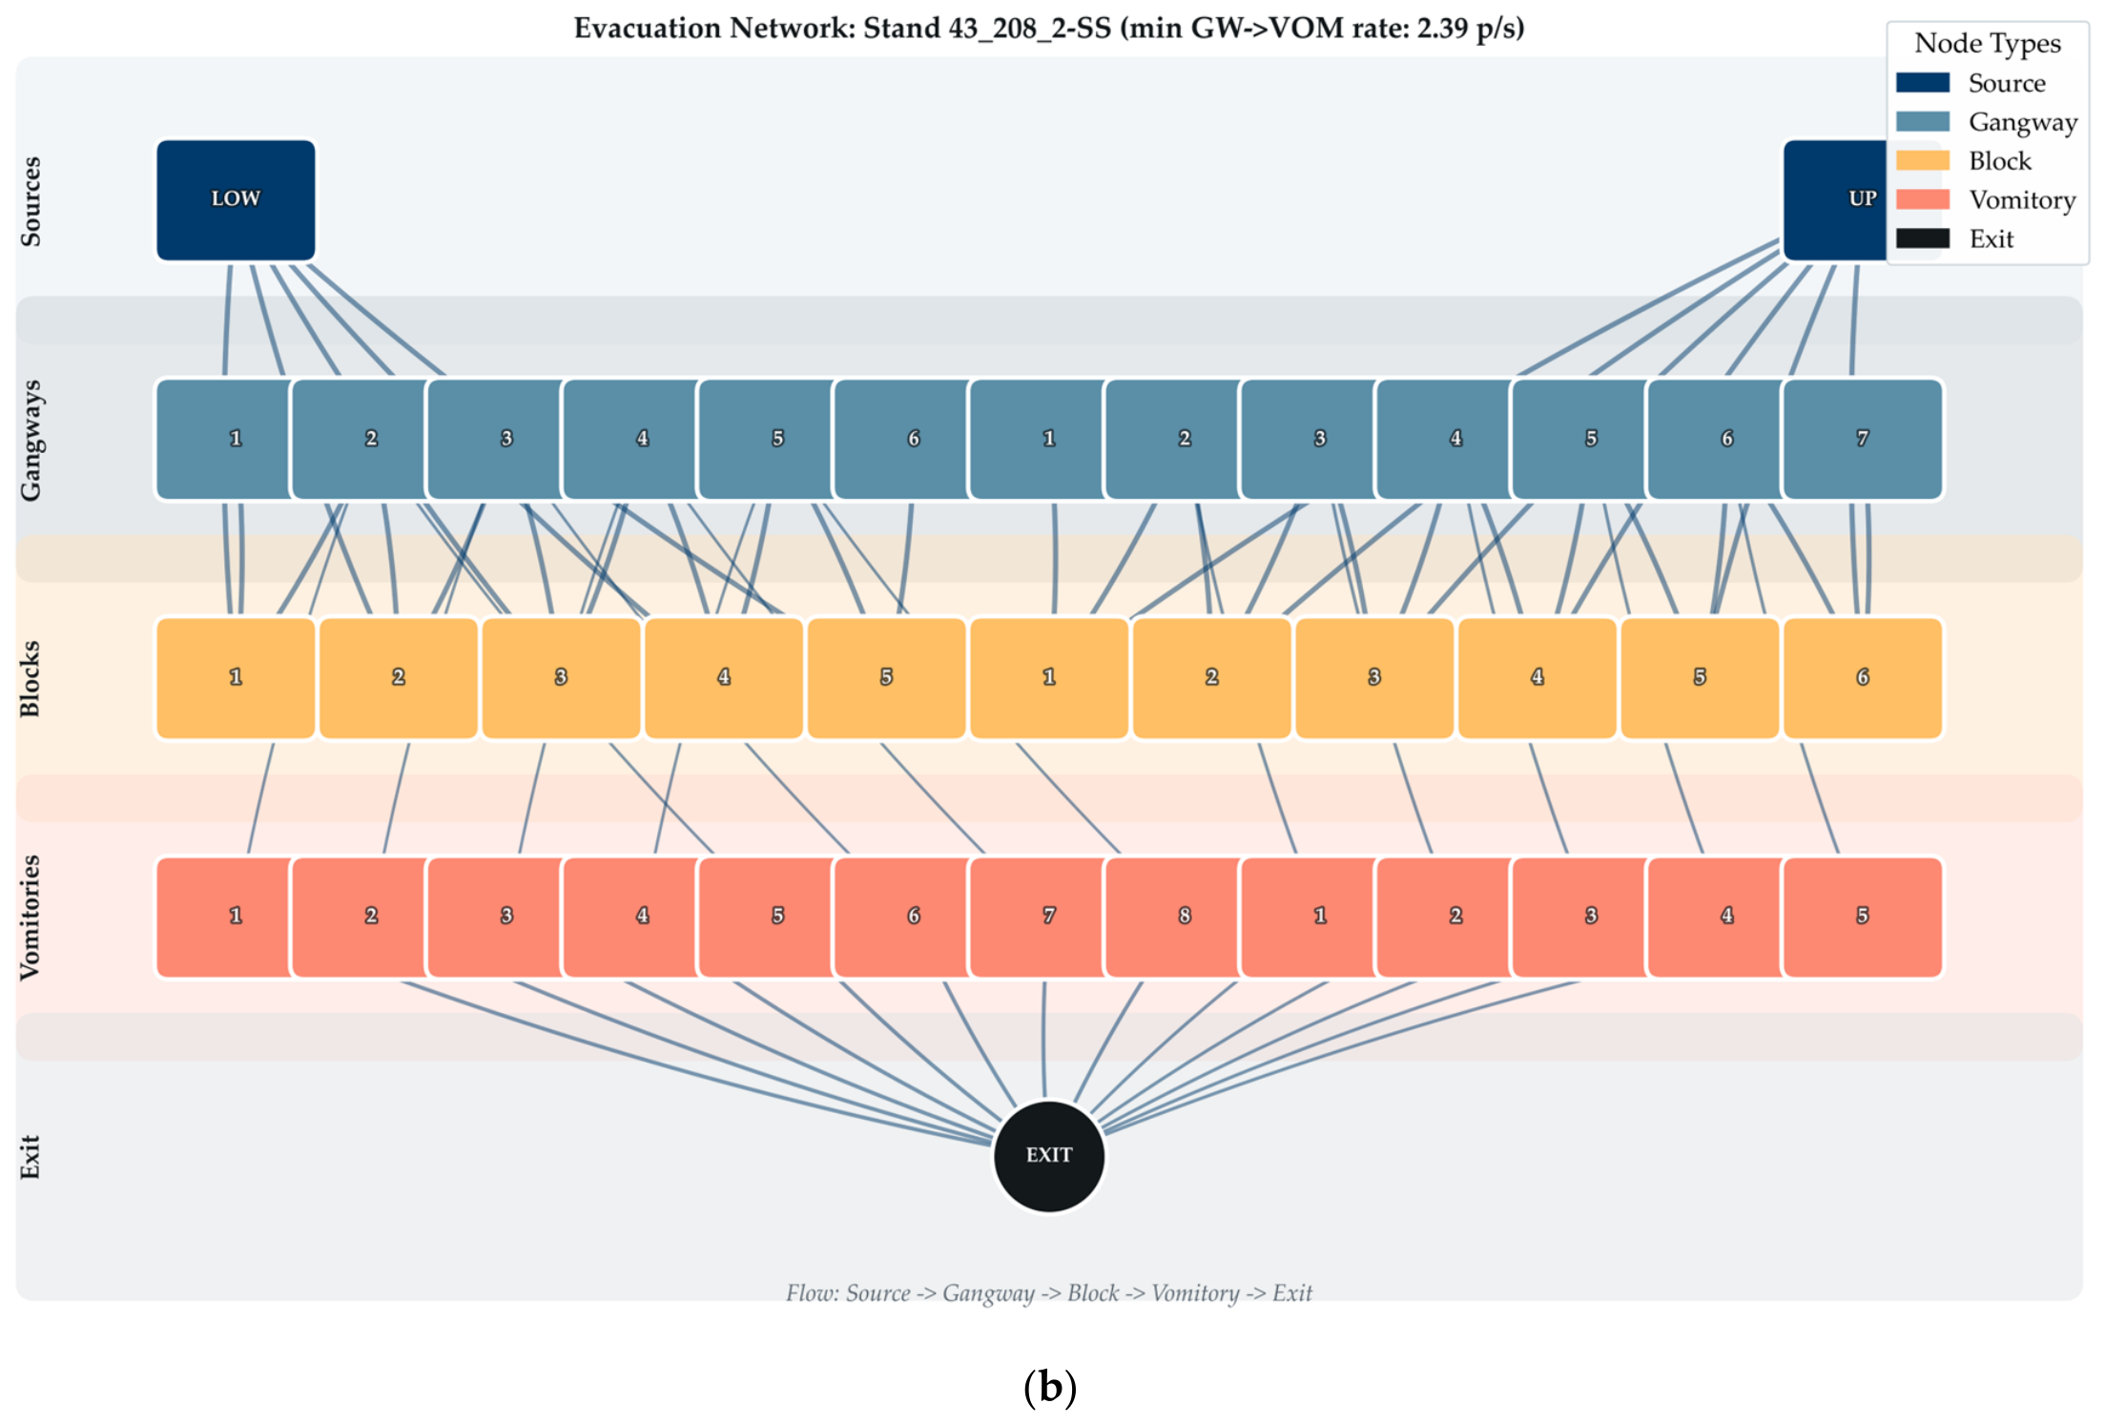
Figure A3.
Stand-level time components: (a) , , ; (b) ΔT. In panel (b), salmon bars indicate long-side (LS) stands and blue bars indicate short-side (SS) stands.
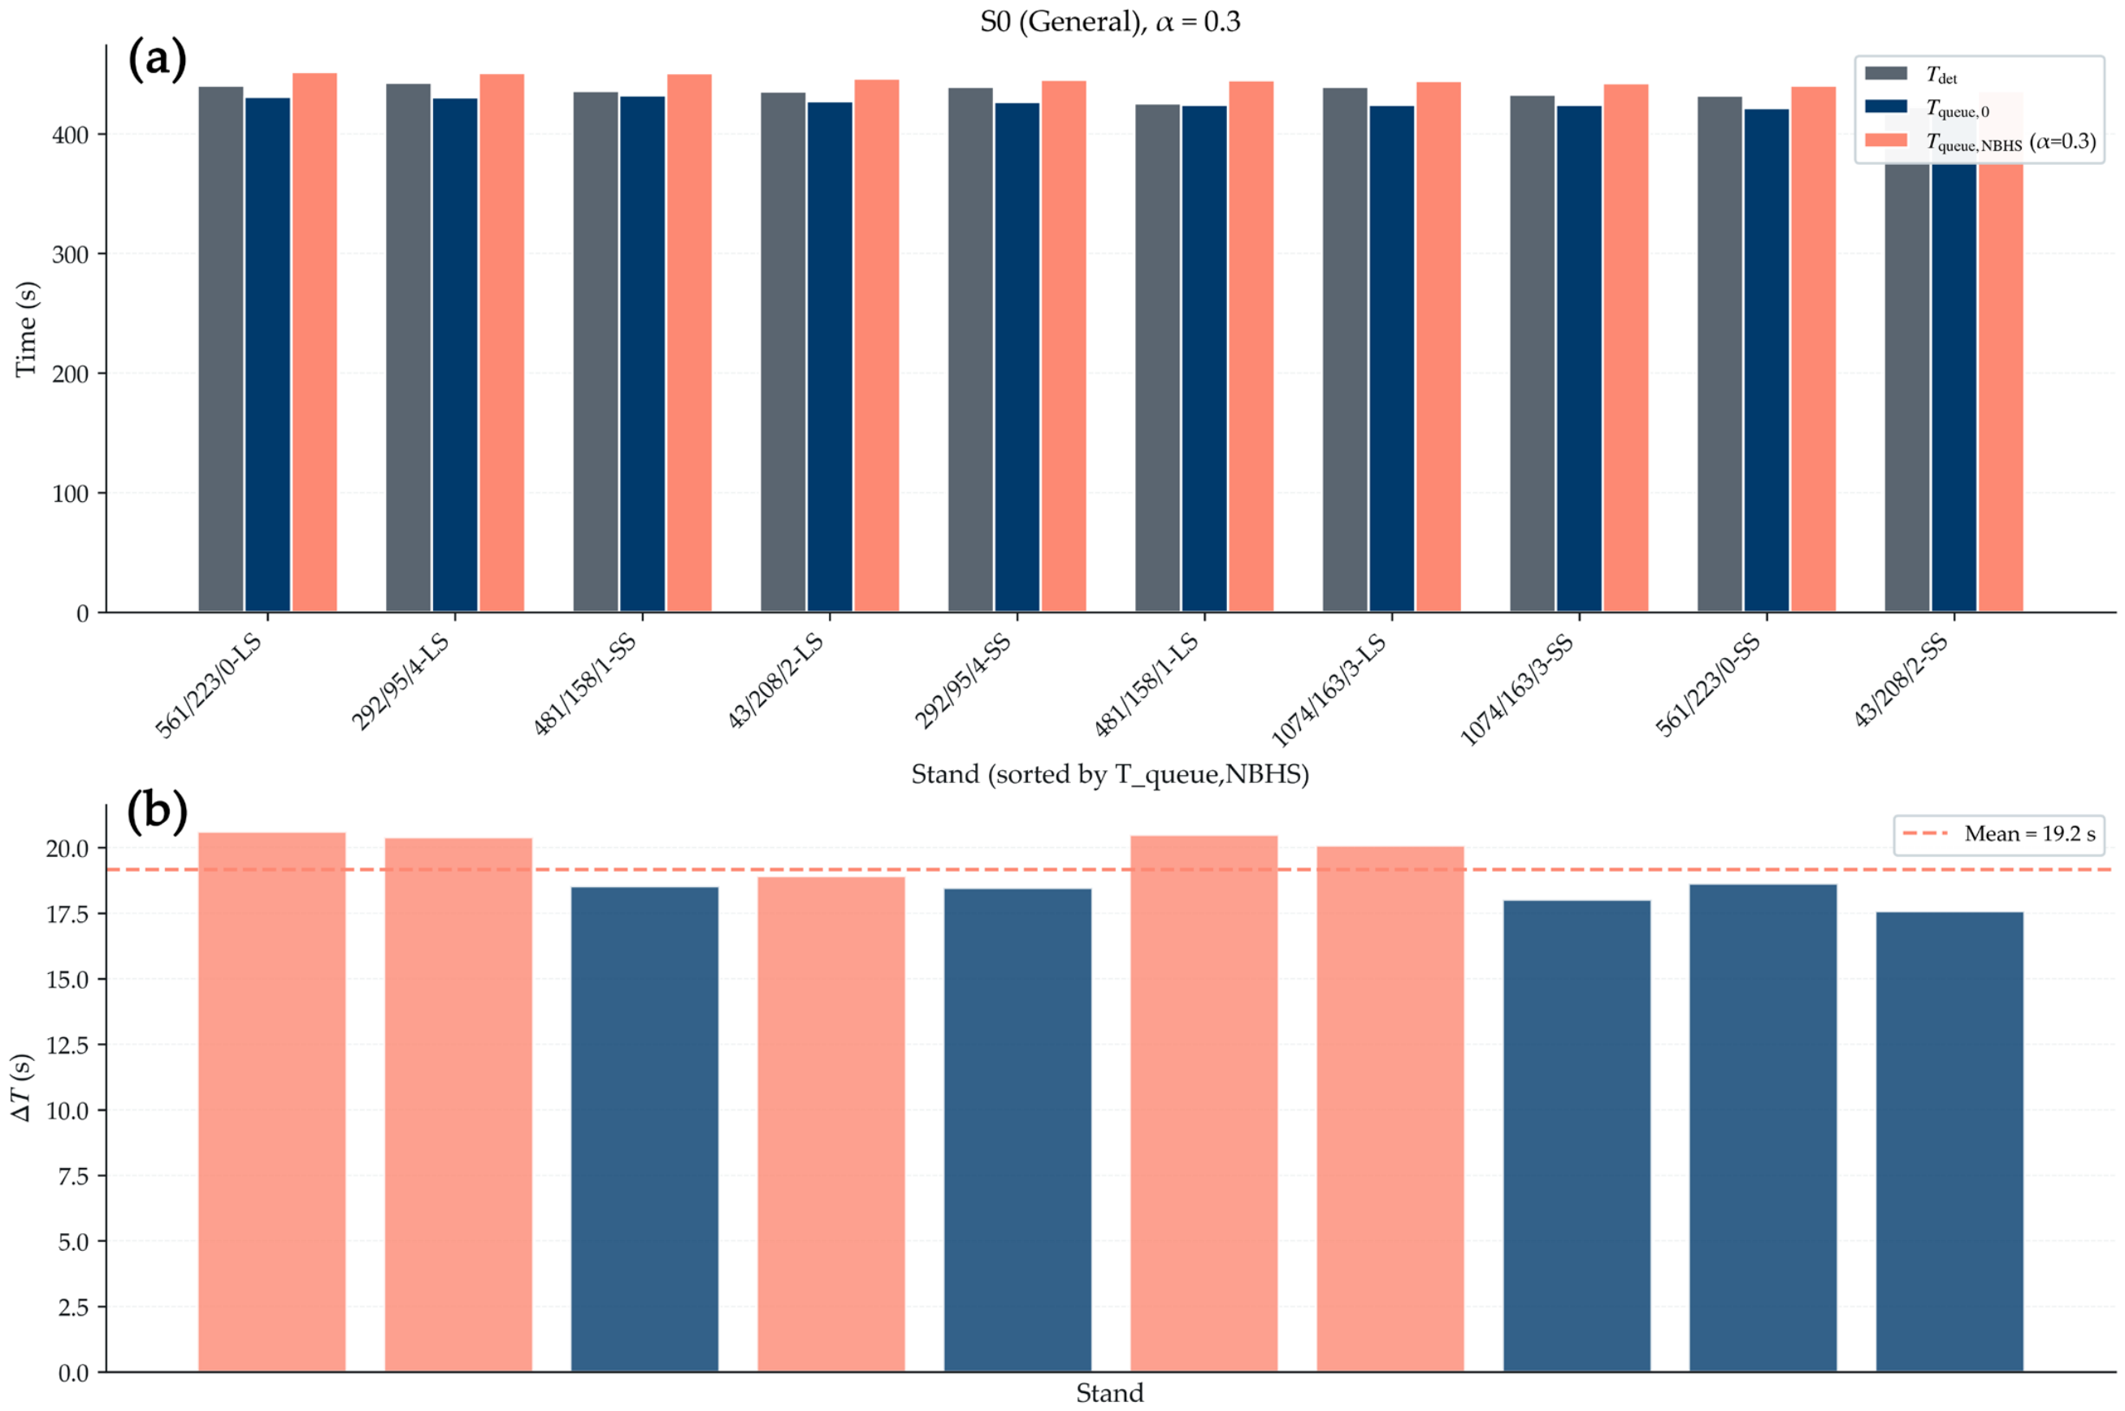
Figure A4.
Correlation matrix with GraphML-derived rates.
References
- Alhammad, S.A.; Al Abdulwahab, S.; Alzamil, A.; Alqahtani, A.S.; Algabbani, M.F. Appropriate Stair-Step Height for Comfort, Satisfaction, and Cardiovascular Response: Implications for Design and Active Living. Int. J. Physiother. 2024, 11, 52–59. [Google Scholar] [CrossRef] [Scilit]
- Di Giulio, I.; Reeves, N.D.; Roys, M.; Buckley, J.G.; Jones, D.A.; Gavin, J.P.; Baltzopoulos, V.; Maganaris, C.N. Stair Gait in Older Adults Worsens With Smaller Step Treads and When Transitioning Between Level and Stair Walking. Front. Sports Act. Living 2020, 2, 63. [Google Scholar] [CrossRef] [Scilit] [PubMed]
- Ram, M.; Baltzopoulos, V.; Shaw, A.; Maganaris, C.N.; Cullen, J.; O’Brien, T. Stair-Fall Risk Parameters in a Controlled Gait Laboratory Environment and Real Domestic Houses: A Prospective Study in Faller and Non-Faller Groups. Sensors 2024, 24, 526. [Google Scholar] [CrossRef] [Scilit] [PubMed]
- Samuel, D.; Rowe, P.; Hood, V.; Nicol, A. The Biomechanical Functional Demand Placed on Knee and Hip Muscles of Older Adults during Stair Ascent and Descent. Gait Posture 2011, 34, 239–244. [Google Scholar] [CrossRef] [Scilit] [PubMed]
- Tompuri, T.T. Metabolic Equivalents of Task Are Confounded by Adiposity, Which Disturbs Objective Measurement of Physical Activity. Front. Physiol. 2015, 6, 226. [Google Scholar] [CrossRef] [Scilit] [PubMed]
- Lewthwaite, H.; Koch, E.M.; Ekström, M.; Hamilton, A.; Bourbeau, J.; Maltais, F.; Borel, B.; Jensen, D. Predicting the Rate of Oxygen Consumption during the 3-Minute Constant-Rate Stair Stepping and Shuttle Tests in People with Chronic Obstructive Pulmonary Disease. J. Thorac. Dis. 2020, 12, 2489–2498. [Google Scholar] [CrossRef] [Scilit] [PubMed]
- Ahmed, A.; Ménard, A.; Novak, A.C.; Edwards, N.; Fraser, S. Exploring Older Adults’ Perceptions of Stair Hazards and an m-Health Fall Prevention App: A Focus Group Study. OBM Geriatr. 2024, 8, 286. [Google Scholar] [CrossRef] [Scilit]
- Latin, R.W.; Berg, K.; Kissinger, K.; Sinnett, A.; Parks, L. The Accuracy of the ACSM Stair-Stepping Equation. Med. Sci. Sports Exerc. 2001, 33, 1785–1788. [Google Scholar] [CrossRef] [Scilit] [PubMed]
- Gales, J.; Ferri, J.; Harun, G.; Jeanneret, C.; Young, T.; Kinsey, M.; Wong, W.; Stock, J.; Chen, L.; Thompson, P.; et al. Anthropomorphic Data and Movement Speeds; SFPE Scientific and Educational Foundation: Gaithersburg, MD, USA, 2020. [Google Scholar]
- Kuligowski, E.D.; Peacock, R.D.; Hoskins, B.L. A Review of Building Evacuation Models, 2nd ed.; NIST Technical Note 1680; National Institute of Standards and Technology: Gaithersburg, MD, USA, 2010. [Google Scholar] [CrossRef] [Scilit]
- Helbing, D.; Molnár, P. Social Force Model for Pedestrian Dynamics. Phys. Rev. E 1995, 51, 4282–4286. [Google Scholar] [CrossRef] [Scilit] [PubMed]
- Young, T.; Gales, J.; Kinsey, M.; Wong, W.C.-K. Variability in Stadia Evacuation under Normal, High-Motivation, and Emergency Egress. J. Build. Eng. 2021, 40, 102361. [Google Scholar] [CrossRef] [Scilit]
- Liu, Y.; Liu, D.; Badler, N.; Malkawi, A. Analysis of Evacuation Performance of Merging Points in Stadiums Based on Crowd Simulation. In Proceedings of the Building Simulation 2011: 12th Conference of International Building Performance Simulation Association, Sydney, Australia, 14–16 November 2011; pp. 2651–2658. Available online: https://publications.ibpsa.org/proceedings/bs/2011/papers/bs2011_1826.pdf (accessed on 14 June 2026).
- Yang, C.-H.; Lin, C.-Y.; Kuo, T.-W. Simulation-Based Assessment of Evacuation Efficiency in Sports Stadiums: Insights from Case Studies. Fire 2025, 8, 210. [Google Scholar] [CrossRef] [Scilit]
- Melrose, A.; Hampton, P.; Manu, P. Safety at Sports Stadia. Procedia Eng. 2011, 14, 2205–2211. [Google Scholar] [CrossRef] [Scilit]
- Sports Grounds Safety Authority. Egress; Sports Grounds Safety Authority: London, UK, 2018; Available online: https://sgsa.org.uk/physical-factors/circulation/egress/ (accessed on 14 June 2026).
- Sports Grounds Safety Authority. Guide to Safety at Sports Grounds, 6th ed.; Sports Grounds Safety Authority: London, UK, 2018; Available online: https://sgsa.org.uk/document/greenguide/ (accessed on 14 June 2026).
- Ronchi, E.; Kuligowski, E.D.; Reneke, P.A.; Peacock, R.D.; Nilsson, D. The Process of Verification and Validation of Building Fire Evacuation Models; NIST Technical Note 1822; National Institute of Standards and Technology: Gaithersburg, MD, USA, 2013. [Google Scholar] [CrossRef] [Scilit]
- Kuligowski, E.D.; Peacock, R.D.; Wiess, E.; Hoskins, B.L. Stair Evacuation of People with Mobility Impairments. Fire Mater. 2015, 39, 371–384. [Google Scholar] [CrossRef] [Scilit]
- Wilms, B.; Ernst, B.; Thurnheer, M.; Weisser, B.; Schultes, B. Correction Factors for the Calculation of Metabolic Equivalents (MET) in Overweight to Extremely Obese Subjects. Int. J. Obes. 2014, 38, 1383–1387. [Google Scholar] [CrossRef] [Scilit] [PubMed]
- Sports Grounds Safety Authority. Accessible Stadia; Sports Grounds Safety Authority: London, UK, 2003; Available online: https://sgsa.org.uk/document/accessible-stadia/ (accessed on 14 June 2026).
- EN 13200-7:2014; Spectator Facilities—Part 7: Entry and Exit Elements and Routes. European Committee for Standardization (CEN): Brussels, Belgium, 2014.
- Kuligowski, E.D.; Peacock, R.D.; Reneke, P.A.; Wiess, E.; Hagwood, C.R.; Overholt, K.J.; Elkin, R.P.; Averill, J.D.; Ronchi, E.; Hoskins, B.L.; et al. Movement on Stairs During Building Evacuations; NIST Technical Note 1839; National Institute of Standards and Technology: Gaithersburg, MD, USA, 2015. [Google Scholar] [CrossRef] [Scilit]
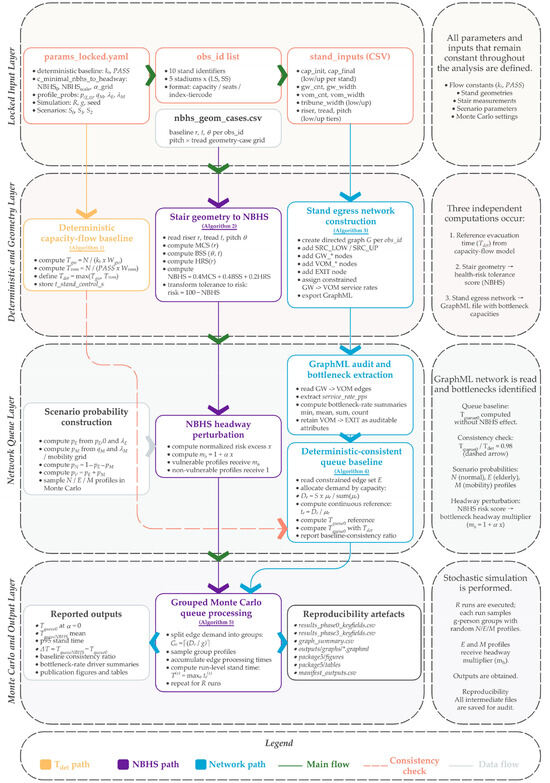
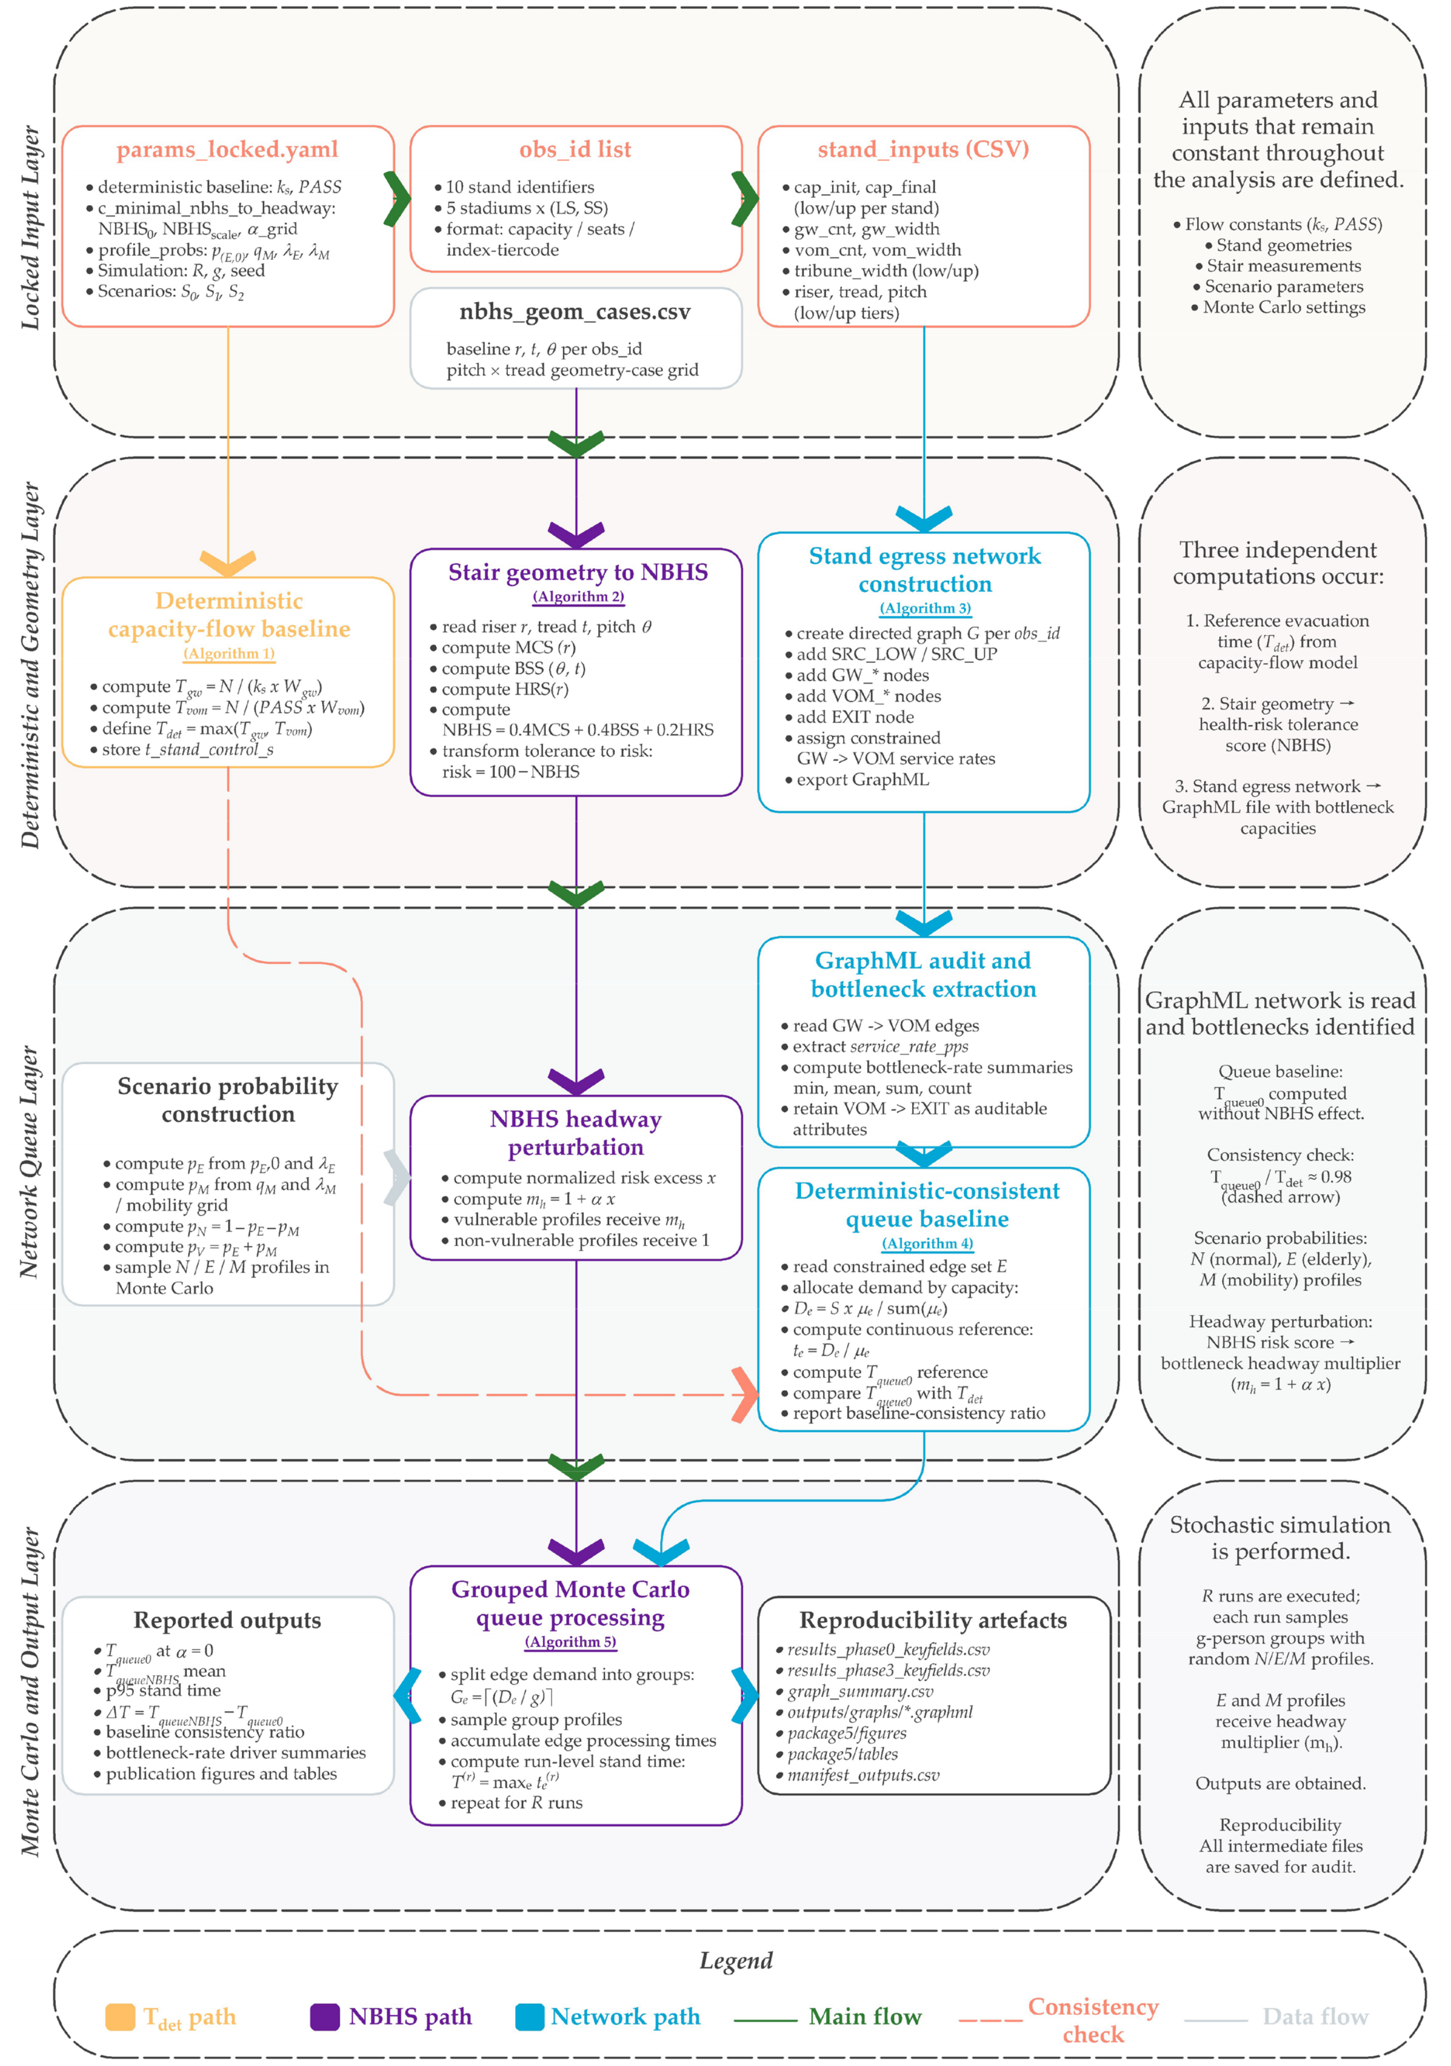
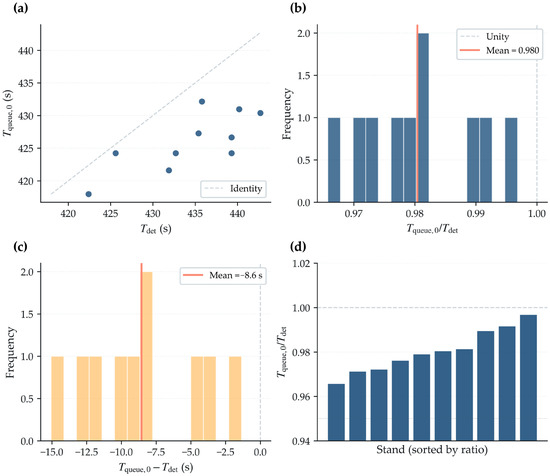
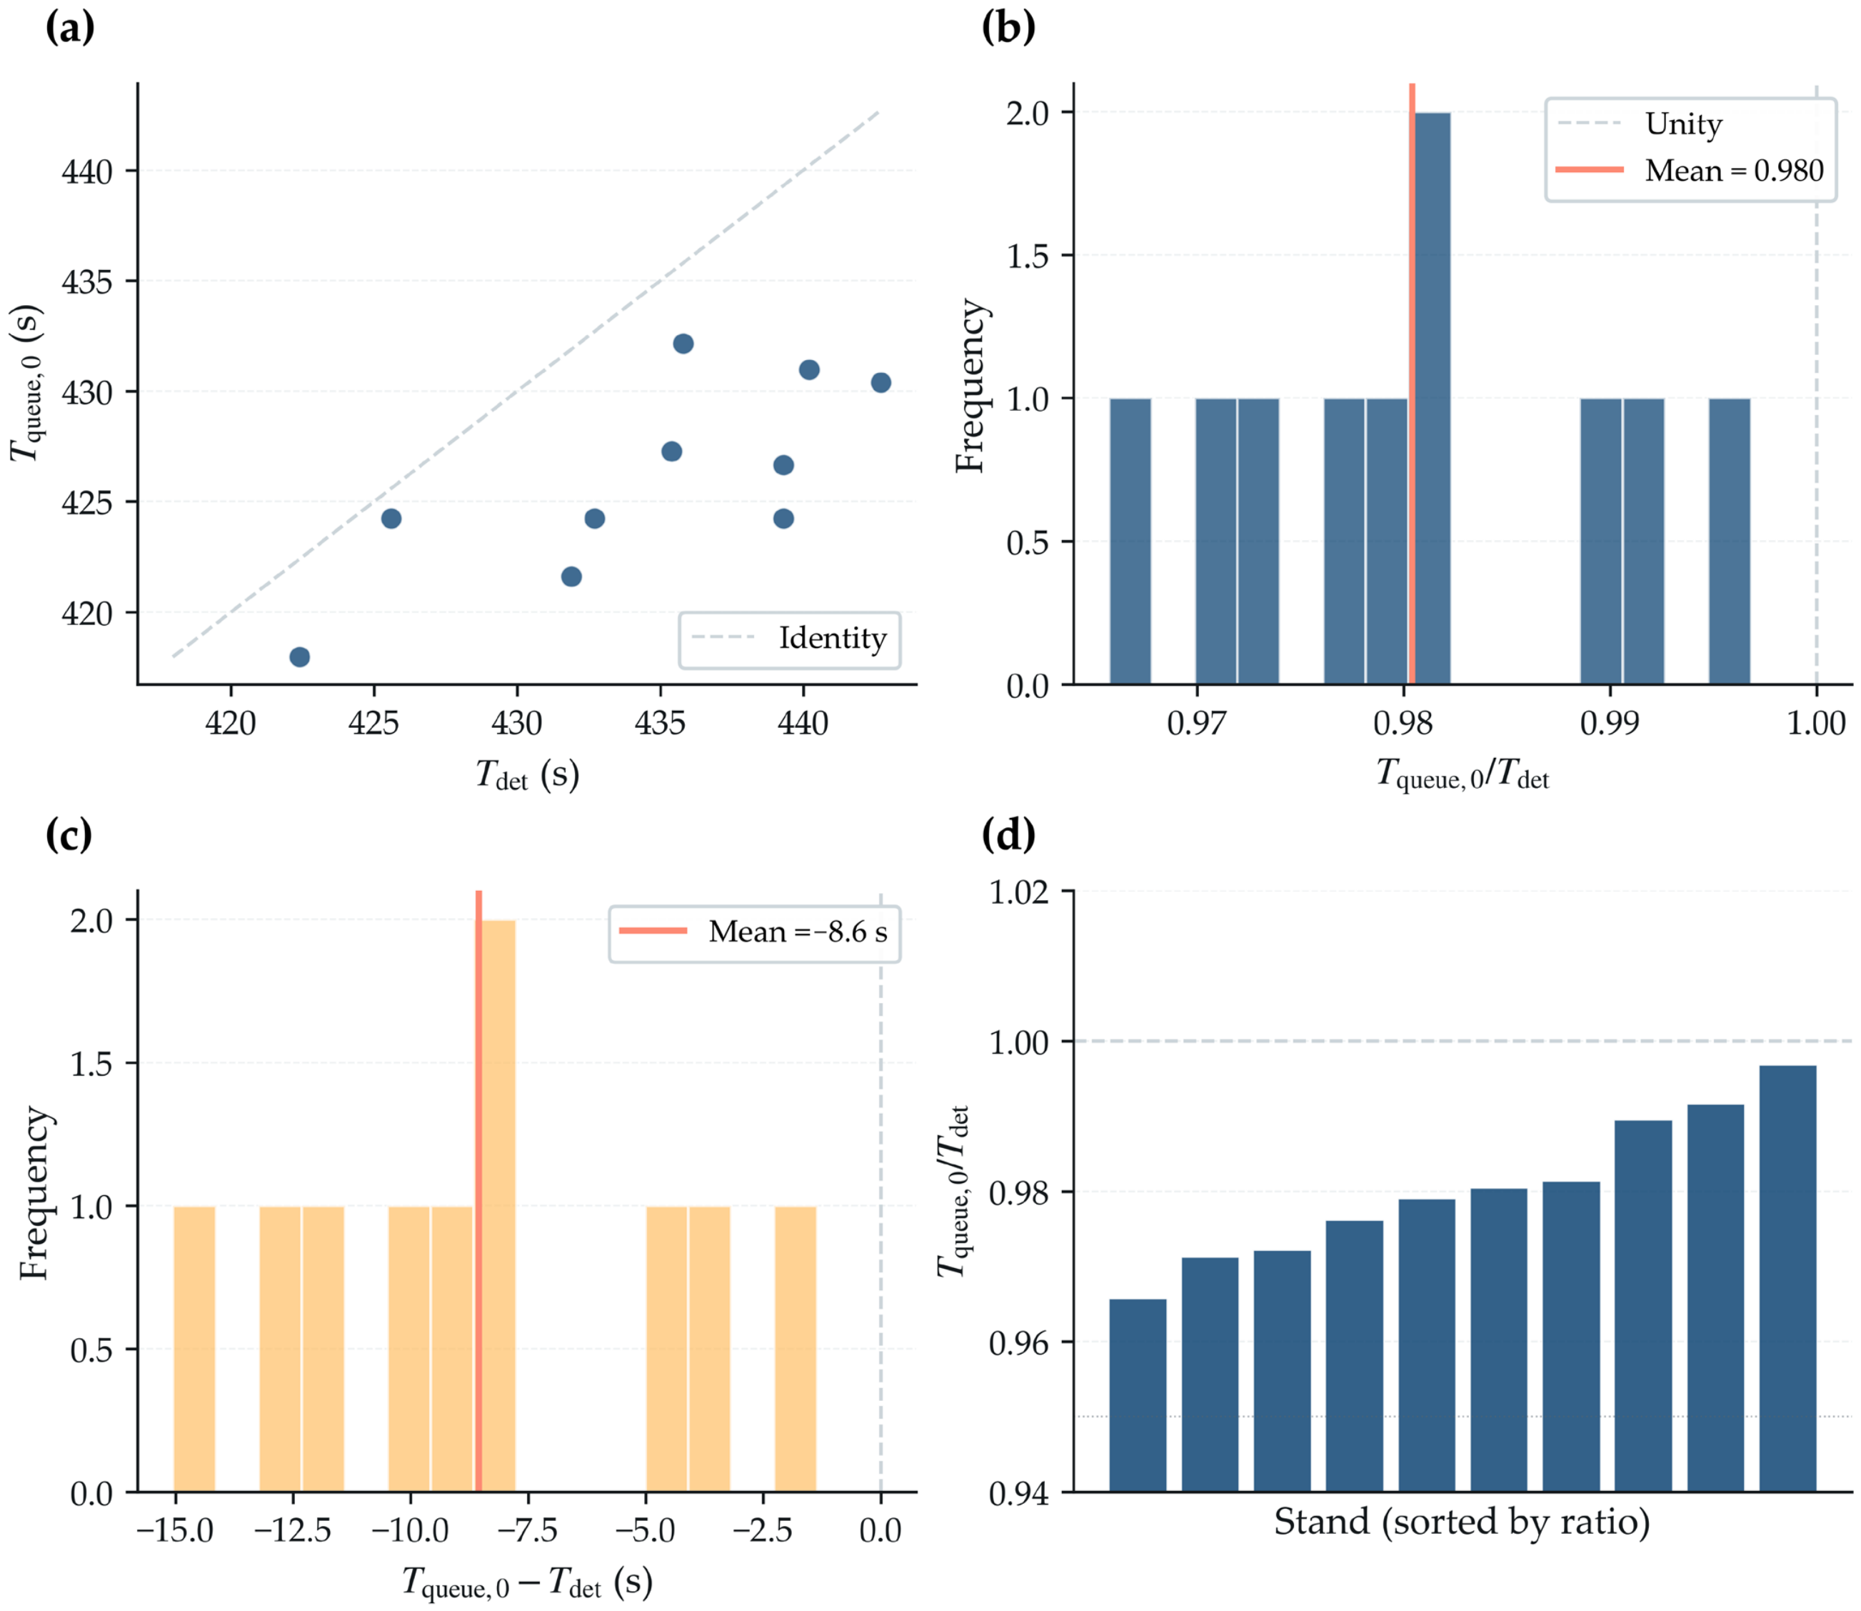
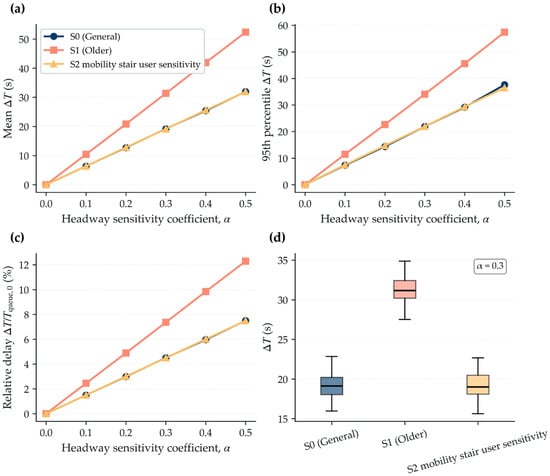
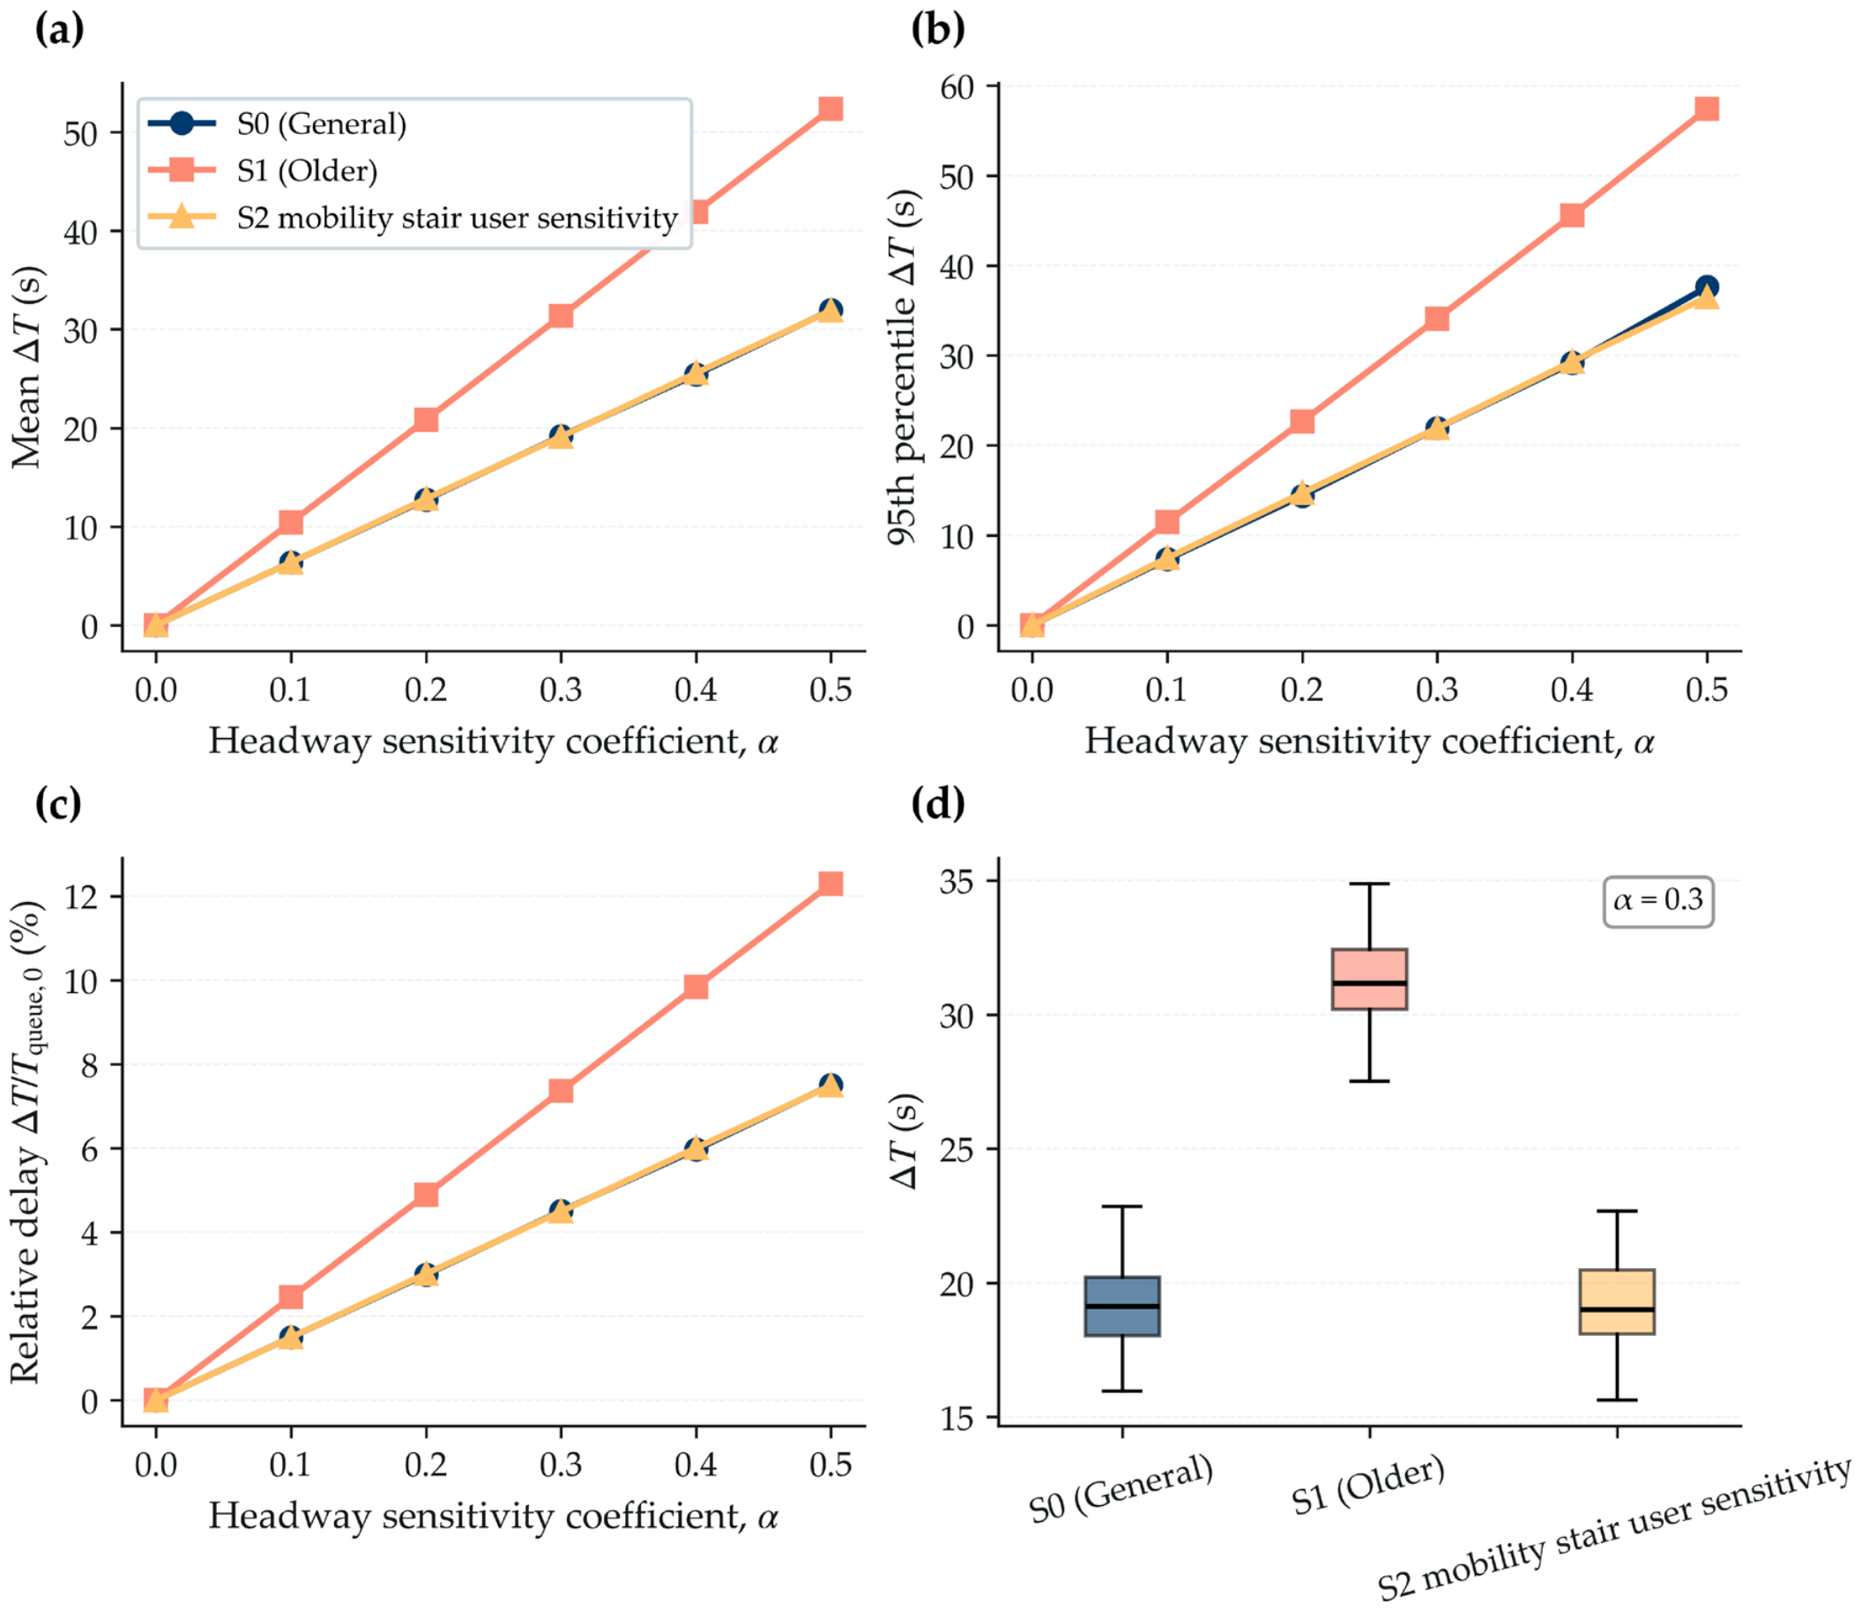
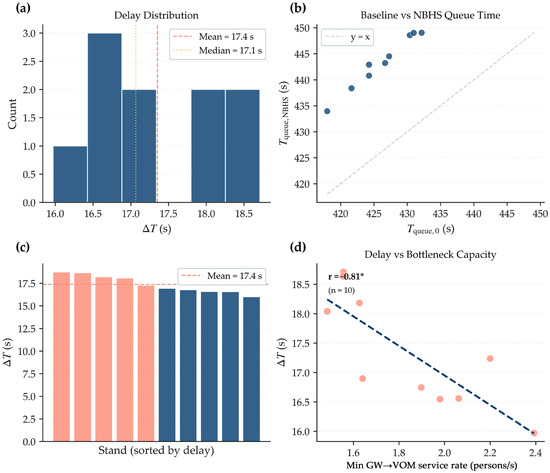
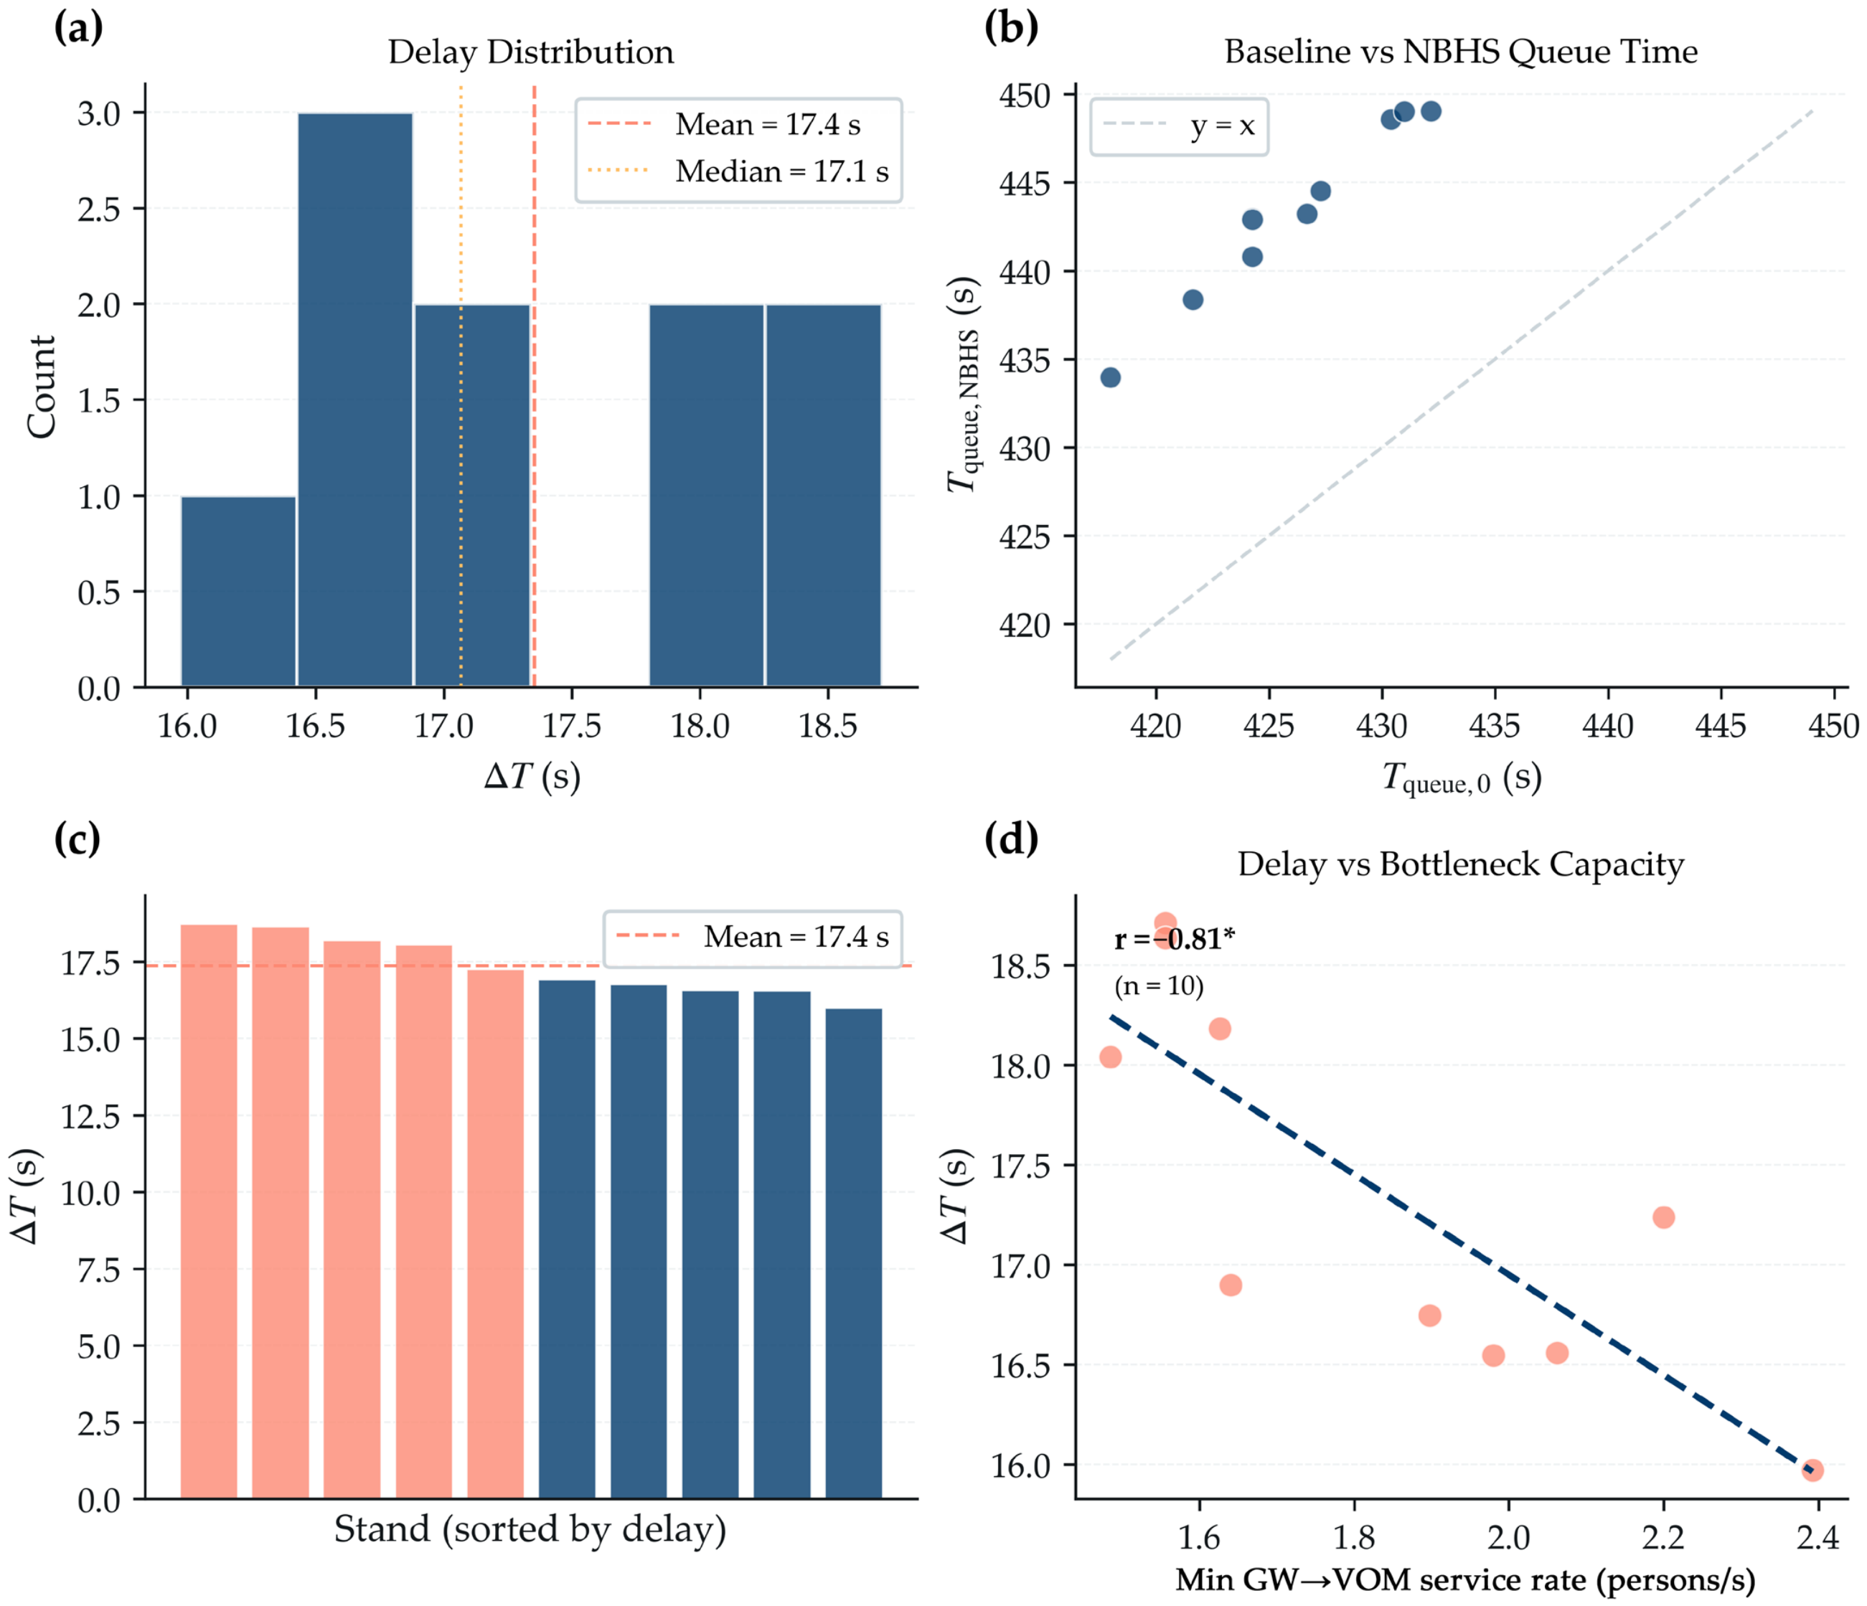
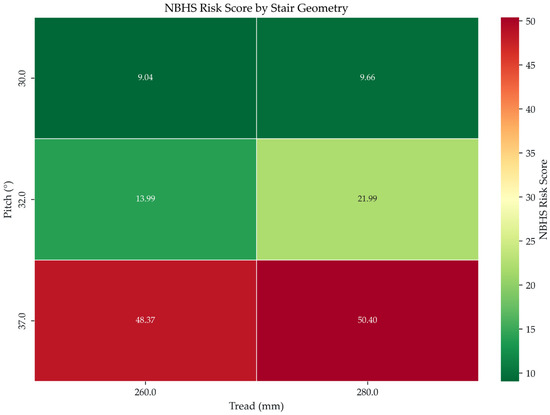

Disclaimer/Publisher’s Note: The statements, opinions and data contained in all publications are solely those of the individual author(s) and contributor(s) and not of MDPI and/or the editor(s). MDPI and/or the editor(s) disclaim responsibility for any injury to people or property resulting from any ideas, methods, instructions or products referred to in the content. |
© 2026 by the authors. Licensee MDPI, Basel, Switzerland. This article is an open access article distributed under the terms and conditions of the Creative Commons Attribution (CC BY) license.