


Abstract
Commercial spaces are essential urban environments where consumer movement is inherently sequential, involving multiple destinations and complex spatial interactions. However, existing studies mainly rely on aggregated flow data and provide a limited understanding of how consumers organize their movements into complete spatial sequences. To address this limitation, this study proposes a framework based on typical routes to investigate sequential movement patterns in commercial spaces. Typical routes are conceptualized in two complementary ways: as representative routes extracted from observed traces and as highly probable routes generated from sequential destination choices. Accordingly, two approaches are integrated. First, route clustering is conducted using Levenshtein-ratio-based similarity measurement and affinity propagation (AP) clustering to identify representative route exemplars with distinct sequential structures. Second, route prediction is performed by combining discrete choice models (DCM), convolutional neural networks (CNN), and beam search to generate high-probability movement sequences. The framework is applied to 323 observed consumer routes collected from a large commercial complex in Shanghai, China. The results reveal several recurring movement patterns, such as task-oriented, fashion-oriented, dining-oriented, and family-oriented routes. Among them, the most dominant pattern is characterized by repeated movement between anchor stores through sequences of intermediate, smaller shops, highlighting the organizing role of anchor destinations in structuring consumer circulation. Both clustering and prediction demonstrate that consumer movement in commercial spaces is not random, but follows relatively stable sequential logics. In the prediction task, CNN achieves substantially higher accuracy than DCM, thereby providing stronger support for route simulation. Overall, the study demonstrates that integrating route clustering and route prediction provides a useful framework for understanding, interpreting, and simulating sequential consumer movement in commercial environments, with practical implications for circulation organization, anchor-store layout, and commercial space design.
1. Introduction
Commercial environments are among the most important everyday public spaces in contemporary cities [1]. Beyond their retail function, they accommodate a wide range of consumption, leisure, dining, entertainment, and social activities, and therefore constitute a visible expression of urban vitality. Physical commercial spaces such as shopping streets, shopping malls, and mixed-use commercial complexes have long played a crucial role in organizing public life and shaping urban experience [2,3]. As Gehl argues, public life includes necessary, optional, and social activities; and his analysis of Copenhagen’s Strøget shopping street further shows that pedestrian commercial spaces attract people not only through retail functions, but also by supporting leisure, observation, and social encounters [4].
In China, commercial spaces expanded rapidly during the period of accelerated urbanization and consumption growth [5], becoming key components of central areas and new towns. However, with the transformation of consumption patterns and the rise in e-commerce and new retailing, many traditional commercial spaces are now facing increasing pressure, including declining pedestrian flows, weakened business performance, vacant or underused spaces, and reduced spatial vibrancy [6,7]. This challenge is not merely a retail problem, but also an urban spatial problem: when physical commercial environments lose their attractiveness, cities may also lose important places of everyday encounter, activity concentration, and public vitality. An essential task for urban design is therefore to create high-quality commercial environments that meet consumers’ needs and stimulate their activities. Yet in practice, the organization and design of commercial space often rely heavily on designers’ own experience, top-down assumptions, and prescriptive technical standards [8], while the actual spatial behavior of consumers is insufficiently examined. As the primary users of commercial space, consumers provide the most direct evidence of how these spaces operate, where they perform well or poorly, and how their spatial quality may be improved [9]. Consequently, understanding how commercial spaces are used by consumers is essential for improving their spatial quality, operational performance, and long-term urban value.
A growing body of research has responded to this concern by introducing data-driven approaches into the analysis and design of commercial environments. Existing studies have examined the relationship between consumer distribution and various aspects of spatial configuration [10,11], greatly improving our understanding of where consumers tend to concentrate and which spatial features are associated with higher levels of activity. Nevertheless, much of the existing evidence remains spatially aggregated, relying primarily on count data that record the number of people visiting particular locations (Figure 1a). Such data are useful for identifying hotspots and evaluating local attractiveness, but they are less capable of explaining how individual consumers move through a sequence of places. In commercial complexes, consumer behavior is inherently multi-purpose, multi-stop, and sequential [12,13]. Consumers do not simply choose isolated destinations; rather, they move between anchor stores and smaller shops, combining planned and unplanned activities. The value of a location therefore depends not only on its own attractiveness but also on its position within broader movement sequences and its relationship with other destinations. To better understand the interactions between consumer behavior and commercial space, it is thus necessary to move beyond count data and examine how consumers’ individual routes are formed.
Figure 1.
Two types of spatial behavior data. Different colors represent different locations. In the trace data, “A” denotes an individual, and arrows indicate the sequential order of visited locations.
Trace data provide a promising basis for this perspective because they record the ordered sequence of places visited by individual consumers (Figure 1b). However, raw traces are often highly diverse, fragmented, and difficult to interpret: consumers may differ in their entrances, visited places, exits, activity purposes, route lengths, and visiting orders [14]. Directly examining a large number of individual traces may therefore obscure the dominant behavioral patterns, whereas over-aggregating them into pedestrian counts would eliminate the sequential information that makes trace data valuable. This paper addresses this challenge by focusing on typical routes as an intermediate representation between individual traces and aggregate flow patterns. Specifically, typical routes are understood in two complementary ways: first, as exemplar routes that characterize groups of observed routes with similar sequential patterns; and second, as high-probability routes arising from consumers’ step-by-step spatial choices. The first perspective emphasizes empirical representativeness, whereas the second emphasizes generative likelihood. Bringing these two perspectives together makes it possible to examine whether dominant route patterns are not only identifiable in observations but also replicable through the underlying logic of sequential destination choices in the commercial environment. Based on this understanding, the study proposes a methodological framework that combines route clustering and route prediction to identify and extract typical consumer routes from observed trace data. Drawing on trace data from WJC Wanda Square in Shanghai, the study aims to reveal the dominant spatial behavior patterns of consumers and provide behavioral evidence for the spatial design and management of commercial environments.
2. Literature Review
2.1. Consumer Spatial Behavior Based on Count Data
Empirical studies on consumer spatial behavior have provided important evidence for understanding how commercial environments are used and how their spatial performance can be assessed. A major focus of this literature is to describe the spatial distribution of pedestrian flow, usually through count data that record the number of consumers entering, staying in, passing through, or concentrating in specific locations within commercial environments [15,16]. Based on such distributional patterns, researchers have evaluated the vitality and spatial efficiency of commercial spaces [17,18], for example, by identifying crowded or underused areas, strong or weak flow linkages between different parts, and network effects of the whole commercial system. Meanwhile, these descriptive analyses are often extended by explanatory studies that relate consumer distribution to functional and spatial attributes of the built environment [19]. Functional factors commonly examined include tenant mix of different retail categories [10], brand attractiveness [20], and anchor stores [21], while spatial factors include overall layout [22], entrance access [23], distance impedance [24], and floor level [25]. Among these spatial factors, space syntax has been widely used to capture the network structure of commercial spaces and their configurational properties, using indicators such as connectivity, mean depth, integration, betweenness, and visibility to represent spatial accessibility and to explain pedestrian movement and visitor concentration [26,27,28].
These count-data-based studies have advanced the understanding of location-level attractiveness and spatial vitality by explaining which places tend to attract more consumers. However, their focus on aggregated flow patterns provides limited insight into how consumers organize multiple destinations into complete shopping routes. This limitation is important for understanding commercial environments, especially large commercial complexes, where consumers often visit multiple destinations within a single trip, and the performance of each location is closely related to its position within broader movement sequences.
2.2. Trace Data and Route Clustering
Compared with count data, individual trace data provide more detailed information because they record not only where people go, but also the order in which they visit multiple locations, thereby capturing individual movement as a spatiotemporal behavior chain. As a result, trace data have been widely used beyond commercial environments [29], such as tourism destinations [30], recreational areas [31], and urban mobility studies [32]. Clustering is one of the most commonly used approaches in these studies. By grouping similar records, it helps identify recurring movement patterns from large numbers of individual trajectories. A number of clustering algorithms have been applied to understand individual-level spatial behavior [31,33,34,35,36,37], classify pedestrians [30,37], detect abnormal behavior [38,39], recommend the optimal route or destination for users [29,40], and provide evidence for spatial planning and management [31,41]. In this sense, route clustering is not only a data-reduction technique for organizing complex movement records but also an important way to extract interpretable behavioral patterns from otherwise highly diverse traces.
Early and relatively traditional clustering studies usually transform traces into a set of predefined indicators, such as route length, movement speed, visited places, or other behavioral-chain characteristics [29,37,41]. These indicators provide a compact and interpretable representation of individual movement behavior, making it possible to compare otherwise heterogeneous traces within a common feature space. Based on such representations, conventional clustering methods such as K-means [36,37], hierarchical clustering [29], and density-based clustering [42] have been used to classify visitors, tourists, or shoppers into different behavioral groups. The resulting clusters are often interpreted as different user types or activity styles and can therefore be easily linked to planning or management implications. This approach has the advantage of simplicity; however, by converting routes into summary indicators, it tends to weaken the sequential structure of the original trace. Two consumers may visit the same set of places or have similar route lengths, but their routes may imply different behavioral meanings if the visiting orders are different.
To better preserve route information, another line of research focuses on measuring the similarity or distance between complete trajectories [33]. Instead of clustering routes only through derived indicators, these studies work directly on raw trace data using pairwise similarity measures. Some measures emphasize pointwise or distance-based correspondence between trajectories, such as Euclidean-based distance and dynamic time warping (DTW), which can compare trajectories with different lengths or temporal alignments [43]. Edit distance is also applied to real-valued trajectory points by treating spatially close points as matches, thereby improving robustness to noise [44]. Related sequence-matching measures, such as longest common subsequence (LCSS), emphasize partial overlap and local match by identifying shared segments between imperfectly aligned trajectories [45]. A related approach combines LCSS with Hausdorff distance to account for both local subsequence matching and spatial deviation [46]. Shape-oriented measures, such as Fréchet distance [47] and one-way distance [48], are more concerned with the geometric form of trajectories. In addition, shared nearest neighbor methods [49], context-aware DTW [50], and multi-attribute similarity measures [51] further consider structural relationships, semantic attributes, or contextual information beyond pure geometric distance. These methods are better suited to capturing the overall shape, order, overlap, or local matching relationships between trajectories, and they have been widely applied to coordinate-based traces in continuous space. More recently, deep learning and artificial intelligence methods have further expanded this field. Sequence-to-sequence autoencoders [34], deep reinforcement learning [52], and spatiotemporal representation learning [53] have been explored to learn latent representations of trajectories and discover more complex movement patterns. As summarized in a recent survey [14], trajectory representation learning is increasingly used to convert variable-length and heterogeneous routes into low-dimensional embeddings for downstream tasks such as similarity computation and route clustering. These state-of-the-art learning-based methods are especially useful for large-scale, high-dimensional, and irregular data.
Despite these advances, most trajectory clustering studies are method-oriented rather than application-oriented, as their primary objective is to develop or refine trajectory similarity measures and clustering algorithms. Their empirical analyses are mainly used as method validation and often rely on simulated data or benchmark datasets. These datasets are typically drawn from domains that are substantially different from ours, such as animal movement, aviation trajectories, and human gesture sequences. More importantly, the trajectory data in these studies are generally represented as continuous geometric traces in Euclidean space, defined by timestamped spatial coordinates (e.g., longitude-latitude or x-y positions). These representations emphasize geometric continuity, spatial proximity, and temporal alignment. While some studies on human trajectories also adopt this kind of data, typically based on GPS tracks, their focus is primarily on macro-level mobility patterns at the urban or regional scale. However, the present study focuses on fine-grained commercial environments, where consumer movement occurs within complex multi-level and multi-building spatial structures, often in indoor or semi-indoor settings at a much smaller scale. In such contexts, continuous trajectory acquisition is often impractical due to data collection constraints. Therefore, movement is more appropriately represented as ordered sequences of discrete spatial units with semantic meanings, reflecting which commercial zones, shops, restaurants, or public spaces are visited and in what order. This representation naturally connects to the literature on semantic trajectories [35], which emphasizes enriching movement records with meaningful places and contextual information. From a methodological perspective, clustering based on continuous geometric trajectories primarily captures spatial similarity, which is often difficult to interpret in behavioral terms. In contrast, semantic trajectories inherently embed interpretable spatial and functional information, making the resulting patterns directly meaningful for understanding consumer behavior. However, relatively few studies have examined consumer routes in commercial environments as semantic place sequences and used clustering to extract typical routes that are directly interpretable for spatial design and management. This gap provides the methodological basis for the route clustering approach adopted in this study.
2.3. Sequential Choice Modeling and Route Prediction
Route clustering is effective for identifying representative patterns from observed traces, but it is inherently constrained because it can only cluster routes that have actually been observed in the dataset. This limitation is particularly significant when the sample size is small and the number of possible route sequences is much larger, because each complete path consists of many sequential decisions and not all possible combinations are likely to be recorded. As a result, behaviorally plausible or even highly probable routes that do not appear in the sample cannot be captured. Some studies have therefore moved beyond clustering complete trajectories as fixed units and attempted to extract more generalized sequential structures from trace data. For example, Orellana et al. utilized Generalized Sequential Patterns (GSPs) to analyze visitor flows in natural recreational areas, where GSPs are defined as frequent generalized sequences of visited places, measured by support values and based on relative rather than absolute ordering [31]. As such, GSPs summarize common ordering structures across multiple traces, rather than corresponding to individual traces in their entirety. More broadly, the conceptual shift from complete routes to GSPs suggests that typical movement patterns can be understood not only as representative routes extracted from observed traces, but also as sequential structures generated from successive next-destination decisions. Therefore, route clustering and route prediction can be regarded as different yet related approaches that offer complementary insights into regularities of spatial behavior.
In empirical studies, the connection between route clustering and route prediction has been most clearly demonstrated in research with a predictive focus, where clustered trajectories are used to define motion prototypes or behavioral groups for inference of next location or subsequent route segment [54]. This method, referred to as general-pattern-based prediction, first identifies user clusters based on shared behavioral patterns in the past and then makes future predictions from the frequent common behaviors observed within each cluster [55]. Such studies suggest that prediction models rely on, and therefore indirectly reflect, recurrent sequential regularities in spatial behavior. However, few studies have used these prediction-derived regularities to identify typical movement structures that are not necessarily observed as complete routes but may emerge from modeled sequential choices.
Moreover, like many clustering studies, most prediction-oriented research is based on GPS tracks at relatively large spatial scales [56]. The developed models are not always directly applicable to micro-scale commercial environments, where a substantial portion of movement occurs indoors. GPS data in such settings is less accurate, often cannot reliably distinguish floors in multi-level buildings, and may be unavailable due to signal blockage [57]. As a result, consumer routes are better represented as ordered sequences of meaningful places, which could be decomposed into a series of origin–destination choices. Discrete choice models have provided a useful framework for this type of sequential modeling, because they can estimate the probability of each destination choice while explicitly accounting for the effects of spatial attractiveness, distance impedance, accumulated activities, and other relevant factors [58,59]. For example, Borgers and Timmermans applied the Multinomial Logit Model (MNL) to pedestrian movement in the downtown commercial areas of Eindhoven and Maastricht, demonstrating that sequential destination choices within urban-level commercial environments could be well predicted, and thus aggregate link loadings could be well simulated [60]. The same approach has also been successfully applied at extremely small scales, such as short shopping street segments of approximately 100 m [61]. Nevertheless, commercial spaces vary substantially in scale and configuration, while contemporary multi-level and multi-building commercial complexes have rarely been modeled. More importantly, existing studies mainly use MNL or more advanced approaches to explain next-destination choices and reproduce aggregate flow patterns, rather than generating complete routes that represent typical consumer movement patterns. One possible reason is that individual-level simulated trajectories may appear random, fragmented, or even idiosyncratic when examined separately, making them easy to overlook as lacking clear, interpretable regularity. This leaves room for further integrating sequential choice modeling with appropriate route generation methods, so that behaviorally plausible and highly probable typical routes can be identified from a large number of simulated individual trajectories, even if such routes are not necessarily observed.
3. Methodology
3.1. Analytical Framework for Typical Route Extraction
Building on the insights from the literature review, this study aims to extract typical consumer routes that capture representative movement patterns in urban commercial spaces. Recognizing that route behavior exhibits both structural patterns and probabilistic tendencies, two complementary methods are jointly employed. The first approach, route clustering, focuses on structural similarity, grouping observed routes according to shared sequences and patterns to identify exemplar routes that represent common behaviors. The second approach, route prediction, emphasizes behavioral likelihood, estimating the probability of route sequences and identifying the most likely paths as typical routes.
These two approaches are mutually complementary and together provide a comprehensive framework for understanding consumer movement in commercial environments. Clustering identifies patterns that are repeatedly observed across multiple individuals, providing a structural view of typical behavior. It aligns with the intuitive notion of pattern recognition: routes are grouped into distinct categories, with intra-cluster routes as similar as possible and inter-cluster routes as different as possible. A key limitation, however, is that the resulting routes must exist in the observed data—they cannot generate new, unobserved sequences. In contrast, prediction highlights routes that are statistically most probable from a probabilistic perspective. It is not constrained by existing observations and can generate virtual routes that may not have been observed in reality. The typicality or representativeness of these routes does not derive from their similarity to any observed route cluster, but rather from their high predicted probability of occurrence. The effectiveness of this approach, however, depends on the accuracy of the underlying predictive model, meaning the quality of generated routes may vary. By combining these approaches, the study leverages the strengths of both: route clustering provides reliable, observed exemplars, while route prediction allows exploration of likely routes beyond the dataset, offering complementary insights into consumer movement patterns. The comparison between the two sets of typical routes is also of theoretical significance. If both approaches reveal similar behavioral patterns despite their different analytical logics, such convergence reduces method-specific uncertainty in interpreting these results and provides stronger evidence that the identified patterns indeed reflect genuine structural regularities in consumer movement.
3.2. Route Clustering
A variety of clustering algorithms have been proposed in the literature, among which K-means is particularly popular due to its simplicity and computational efficiency. However, K-means requires the input data to be represented in a structured and vectorized form, whereas shopping routes are inherently sequential and unstructured. To enable the application of K-means, route data must therefore be transformed. Assuming there are consumers and places, a dichotomized visiting matrix could be constructed, where the element if consumer visited place and otherwise. In this way, each route is represented as an n-dimensional binary vector, which allows the direct application of the K-means algorithm.
Although this transformation makes K-means feasible, it neglects the visiting order of places, which is a defining feature of a route beyond the mere set of visited locations. To retain this important sequential information, a clustering approach specifically designed for route data is further employed. This approach consists of two steps: (1) pairwise similarities between routes are first quantified to construct a similarity matrix, capturing both the presence of shared locations and the relative ordering of visits; (2) clusters are then generated directly from the similarity matrix, rather than from the vectorized raw data, allowing the grouping to reflect not only which places are visited but also the patterns in which consumers navigate through them.
In the first step, the pairwise similarity between routes is measured using the Levenshtein distance, or edit distance, a metric widely employed in natural language processing to evaluate dissimilarity between strings. The observed routes used in this study are semantic trajectories represented as ordered sequences of discrete spatial units, rather than continuous geometric traces defined by x–y coordinates. Therefore, geometric similarity measures such as Hausdorff distance or Fréchet distance are not suitable for this analysis. Instead, each spatial unit can be treated as a character, and each route can be encoded as an ordered string of visited places. Levenshtein distance is therefore appropriate for comparing such route strings, as it measures the minimum number of edit operations—including insertions, deletions, or substitutions—required to transform one string into another. Under this representation, differences in both visited places and their sequential arrangement can be reflected through the required editing operations. For example, the route “A → B → C” encoded as “ABC” has a distance of 1 from “A → B” encoded as “AB”, because only one deletion operation is needed to transform “ABC” into “AB”. More complex examples of Levenshtein distance calculation are illustrated in Figure 2a.
Figure 2.
Calculation of similarity between two routes. Red letters indicate the matched segments between two routes, whereas black letters indicate unmatched segments.
A key advantage of the Levenshtein distance lies in its ability to detect identical local fragments within routes, even when the overall lengths and ordering of visits differ substantially. However, it quantifies only the absolute magnitude of dissimilarity and does not consider the relative scale of mismatched segments in relation to the total route length. This limitation becomes particularly evident when comparing routes of different lengths. For example, the Levenshtein distance between the routes “AB” and “A” is equal to one, which coincides with the distance between “ABCDEFGHIJKLMNOPQ” and “ABCDEFGHIJKLMNOP”. Intuitively, however, the latter pair is far more similar, as the single edit operation constitutes only a small fraction of the entire route. To overcome this issue, the similarity between routes and is defined using the Levenshtein ratio, as formalized in Equation (1), where denotes the number of places in a route and represents the corresponding Levenshtein distance. This normalized metric ranges from 0 to 1, with higher values indicating stronger similarity. As shown in Figure 2b, the Levenshtein ratio between “AB” and “A” is 0.67, while the ratio between “ABCDEFGHIJKLMNOPQ” and “ABCDEFGHIJKLMNOP” is 0.97, indicating a much higher similarity. By applying this measure to all route pairs, an similarity matrix can be constructed for the set of routes.
In the second step, the affinity propagation (AP) algorithm is applied to the similarity matrix for clustering analysis [62]. A major advantage of AP is that it imposes no assumptions on the data structure, since clustering is performed directly on pairwise similarities rather than on vectorized raw data. The primary objective of AP is to identify a set of exemplars that effectively represent other observations, such that each cluster consists of routes associated with the same exemplar. In the context of this study, these exemplars naturally correspond to typical routes. Technically, the AP algorithm operates through iteratively exchanging two types of similarity-based messages among routes. The first type, responsibility, is sent from route to route and reflects the extent to which is suitable to serve as a candidate exemplar for , considering other potential exemplars. The second type, availability, is sent from route to route and quantifies how appropriate it would be for to select as its exemplar, taking into account the support or preference of other routes for . Through repeated updates, the responsibilities and availabilities are adjusted to propagate local and global preference information across all route pairs. After convergence, routes for which the sum of self-responsibility and self-availability is positive are identified as exemplars. These exemplars define the final clusters, with each cluster representing a group of routes most closely associated with a particular exemplar.
3.3. Route Prediction
Route prediction in this study focuses on identifying the most probable consumer paths, which are treated as typical routes. This involves two tasks: one is to estimate the probability of any given pedestrian route, and the other is to find one or more routes with the highest probability. The first task is addressed using a logit model and a convolutional neural network, while the second is achieved through a beam search algorithm.
The key process of estimating route probability is to decompose each route into a series of consecutive “origin–destination (OD)” choices. For instance, the route “A → B → C” involves four sequential choices: the pedestrian first chooses place A at the entrance, then chooses to visit place B from place A, next chooses place C from place B, and finally decides to leave from place C. The set of alternatives in each choice situation comprises all possible spatial options, as well as a special “leaving” option representing the decision to end the trip. Discrete choice methods (DCM) provide a classical analytical framework for modeling this kind of choice data with various specific model forms. Among them, the multinomial logit model (MNL) is the most popular one for simplicity, interpretability, and robustness. It assumes that each alternative provides the decision maker with a certain utility, quantifying how well the alternative satisfies the requirements or preferences of the decision maker. Let denote the utility that consumer i derives from place j in an OD choice, it is composed of an observable utility and a random error term . The observed part could be explicitly parameterized as a linear combination of K explanatory variables and their coefficients (Equation (2)). The consumer is assumed to choose the place alternative with the highest total utility, although the outcome is probabilistic due to the existence of random errors. In the MNL model, random error is assumed to follow a type I extreme value (Gumbel) distribution, and error terms across all alternatives are independent, which yields a concise form for calculating the probability that place is chosen by consumer (Equation (3)). The leaving option could be modelled in the same way. Given observed choice outcomes from routes and explanatory variables, the preference coefficients could be estimated through maximum likelihood estimation, and these coefficients are subsequently used for predicting the choice probability of the next place and also for interpreting the relative importance of different explanatory variables to consumers’ spatial choices on average.
In addition to the MNL model, a convolutional neural network (CNN) is also trained to predict OD choices, with the aim of improving predictive accuracy. CNN is a powerful deep learning algorithm, most commonly applied to the analysis of visual imagery. It typically consists of multiple convolutional layers, where useful features of the input images can be automatically extracted by learnable filters. A filter is a smaller matrix that moves across the image and computes the dot product with corresponding patches to generate feature maps. Each layer usually contains multiple filters to extract different features, which are then propagated forward through successive layers to capture increasingly complex representations, ultimately yielding predictions. In this study, CNN is conceptually treated as a generalized version of the MNL model, using the same input data. For an OD choice situation with alternatives ( places plus the leaving option) and explanatory variables, the input data for the MNL model is typically organized in long form, where each row represents a single alternative for a single observation. Consequently, one observation corresponds to an matrix, which can be treated as a virtual image for CNN. The computation of observable utility in the MNL model is equivalent to applying a special filter (row vector) that scans the image from top to bottom; and the probability calculation in Equation (3) corresponds to the softmax function. Therefore, an equivalent neural network representation of the MNL model could be designed as a simple CNN with only one convolutional layer and a single filter, without any nonlinear activation, directly followed by a softmax output layer. This simple structure inherits the linear utility assumption of the MNL model, which greatly limits its capacity to capture more complex relationships that may exist in real-world data. The architecture could be readily generalized to include additional convolutional layers with nonlinear activations and multiple filters per layer. As network complexity increases, the model is expected to achieve more accurate predictions of OD choices compared with the MNL model.
Once the probability for the next place is available by either the MNL model or the CNN, a beam search algorithm is then employed to generate the complete route by making predictions step by step [63]. Unlike greedy search, which always selects the place with the highest probability at each step, beam search considers multiple candidate sequences simultaneously, thereby reducing the risk of prematurely committing to locally optimal but globally suboptimal routes. Greedy strategies are often too myopic to identify the route with the highest overall probability, since a place with slightly lower probability at a single step may lead to a subsequent sequence of destinations with a much higher joint probability. For example, as illustrated in Figure 3a, the most likely next destination from place C would be place X with , followed by place Y, which has the largest probability at the subsequent step with . However, the joint probability of this complete route is , significantly lower than that of an alternative route , where the first step chooses the seemingly nonoptimal place A with . In the beam search procedure, at each step, the top routes with the largest probabilities are retained. Given a choice set of possible next destinations, all potential route extensions are evaluated and sorted in descending order of joint probabilities, but only the first sequences are kept for the next step. Figure 3b illustrates how this process works with , where yellow cells denote the routes with the top-3 highest probabilities. Beam search ensures that multiple promising sequences are explored in parallel, increasing the likelihood of identifying the overall most probable route. It should be noted that larger values of are beneficial for achieving better results, but also more computationally expensive; and greedy search can be regarded as a special case of beam search with .
Figure 3.
Extracting typical routes with the highest probabilities. In (a), red arrows represent transitions between locations during greedy search. Solid red arrows indicate the highest-probability transition selected at each step, whereas dashed red arrows indicate alternative transitions with lower probabilities. In (b), gray arrows indicate the progression of the beam search process across different steps, and the symbol “→” denotes the sequential order of locations within candidate routes.
4. Data
The study area is Wujiaochang (WJC) Wanda Square, located in the Wujiaochang sub-center of Shanghai, one of the most established and functionally mature sub-centers in the city. Wanda Group is widely regarded as one of the most representative commercial real estate developers in China, whose projects have played a central role in shaping large-scale urban commercial development since the early 2000s. Within this context, WJC Wanda Square can be considered a flagship development, and it has maintained stable long-term operation and strong consumer attractiveness, thereby serving as an important commercial anchor supporting the consolidation of the Wujiaochang sub-center and demonstrating strong representativeness in China’s urban commercial landscape.
The complex comprises five commercial buildings, an underground shopping mall, three inner pedestrian streets, and a central open square (Figure 4a), forming an integrated, multi-layered, and mixed-use commercial system. The buildings accommodate a range of commercial functions, including a seven-storey department store focusing on fashion retail, such as apparel, footwear, and jewelry (Building A), a five-storey food-oriented mall with a food market and restaurants (Building B), a four-storey Walmart supermarket (Building C), a three-storey entertainment complex integrating a bookstore, a cinema, and a KTV (Building D), and a five-storey mixed-use complex offering fashion retail, catering, furniture, and personal services (Building E). In addition to the buildings, the underground space also contains a fully enclosed mall, primarily combining fashion and dining functions. This functional diversity reflects the typical “one-stop consumption” model of contemporary commercial space, where retail, dining, and entertainment are spatially co-located within a single integrated environment. For route representation, the entire spatial system of WJC Wanda Square was divided into 45 zones (Figure 4b), and each observed route was encoded as an ordered sequence of zone IDs. The zoning scheme was designed to ensure functional similarity within each zone, while different storeys of the same building were treated as separate zones. In addition, the complex has six major entrances (Figure 4b), including one directly connected to a metro station.
Figure 4.
Study area: WJC Wanda Square. (a) includes three high-rise office towers that are part of the existing built environment but outside the analytical scope. (b) focuses on five commercial buildings, with their vertical dimension amplified to facilitate visualization of spatial sequence and route analysis. Numbers 1–45 indicate the predefined spatial zones used for route representation and analysis.
The dataset consists of 323 individual shopping routes observed at WJC Wanda Square. Each route is represented as an ordered sequence of visited places (stores and public open spaces) within the mall, accompanied by contextual information such as activity types, starting time, duration, etc. These route records were subsequently reconstructed as zone-based sequences for analysis. Table 1 summarizes the demographic composition of the sample, which is primarily made up of young professionals and students and has a relatively higher proportion of female consumers (61.9%). This composition aligns with the mall’s customer profile and suggests good representativeness. Most routes are undertaken in small groups of two to three people (76.5%). A substantial majority exhibit planned behavior: 63.2% involve both scheduled activities and shopping, and 19.2% involve only scheduled activities without prearranged shopping stops.
Table 1.
Descriptive statistics of the sample.
5. Results
5.1. Typical Routes Extracted by Route Clustering
Both K-means and AP clustering methods were applied to the 323 observed routes. For the K-means algorithm, the input data consisted of a 323 by 45 matrix of order-irrelevant visiting records. Different values of K were tested and evaluated based on the mean silhouette, an index indicating the quality of clustering results. The silhouette value for case is calculated as , where denotes the mean intra-cluster distance and represents the nearest-cluster distance, i.e., the minimum mean distance to sample points in other clusters. Higher mean silhouette values suggest better clustering results, as points are closer to others in the same cluster than to points in other clusters. In this study, the mean silhouette value peaked at K = 5, leading to the division of 323 routes into five clusters.
Figure 5 illustrates spatial distributions and main OD flows (All of OD values were normalized to 0–10, and those larger than 1 were considered as main ODs) of consumers across different clusters, which vary significantly from each other. Consumers in Cluster 1 had their activities centered in the Paris Printemps department, and their ODs mainly connected different floors within this building. Cluster 2 centered on one of the busiest areas in the underground mall, where several famous fashion shops are located, and the main ODs correspondingly linked this area to other important locations. Consumers in Cluster 3 exhibited the most dispersed spatial distribution, yet core places could still be identified at the cinema in building D and the left segment of the main inner street, with the connection between these two being the most significant OD. The activities of Cluster 4 were mainly concentrated in the right segment of the main inner street, which also dominated the main OD flows. For Cluster 5, the vast majority of consumers only visited Walmart in building C, and the main ODs were confined to internal connections within this building. Based on these results, several core places in WJC Wanda Square were identified for different groups of consumers, along with corresponding secondary places that were connected with core places in each group through the main ODs. It is also remarkable that there were no secondary places in Cluster 5, suggesting that Walmart customers were highly task-oriented and rarely visited other casual locations, implying limited interactions between the large supermarket and other tenants in the commercial area.
Figure 5.
Results of K-means clustering analysis. Blue dots indicate observed consumer activities within spatial zones, where each dot represents one visit. Blue lines denote the main OD flows among spatial zones, with line width proportional to the number of movements between zones.
As discussed above, the valuable sequential information of routes is neglected by K-means, but could be effectively retained by the joint application of similarity measurement and AP clustering. As input data for AP clustering, a route similarity matrix was first calculated using the Levenshtein ratio. Figure 6 presents the top four routes with the highest mean similarities with all other routes. These routes could be regarded as typical in a broad sense, since they are highly similar to the overall dataset. However, most of them are also quite similar to each other, suggesting that they may represent the same pattern. This reveals an important limitation of identifying typical routes solely by their average similarity to all routes: such an approach tends to select the overall “center” routes but may fail to capture the diversity of route patterns. In fact, typical routes are not necessarily similar to all observed routes. Rather, they should be able to represent different groups of them with distinct sequential structures. This is precisely where AP clustering becomes useful. By identifying exemplars from the similarity matrix, AP clustering allows different representative routes and thereby provides a differentiated and diversified understanding of typical consumer movement patterns.
Figure 6.
Top four routes with the largest mean similarities (solid circles indicate route origins, whereas hollow circles indicate subsequent destinations along the route).
Figure 7 shows the six typical routes, or exemplars, extracted by the AP algorithm, with each exemplar standing for a route cluster. Exemplar 1 starts from the cinema, then moves through two zones along the main inner street, and finally ends at Paris Printemps. This exemplar accounts for the largest proportion (32.8%) of all routes, and also includes the top four routes shown in Figure 6. It reveals a common spatial behavior pattern, namely “anchor store → one or more smaller stores → another anchor store”. The cinema and Paris Printemps department were among the most popular anchor stores in WJC Wanda Square, owing to their functions and brand appeal, and they attracted a lot of customers who visited them as planned destinations. By contrast, the main inner street accommodated many smaller stores, especially beverage and fast-food shops. Located along the way from one anchor store to another, these shops benefited a lot from passing customers for many casual visits. Exemplar 2 is a simple route, only moving in Paris Printemps, representing 22.9% of samples who are mainly interested in fashion-related shopping. Similarly, Exemplar 3 is restricted to Walmart and represents 13.6% of the samples, suggesting a group of task-oriented consumers. Exemplar 4, accounting for 13.0% of the samples, shares Paris Printemps and cinema with Exemplar 1, but further includes the core area of fashion shops in the underground mall. This route indicates the associating potential between places with similar or complementary functions. Exemplar 5, representing 9.9% of the samples, consists of a food mall and the main inner street, possibly corresponding to consumers visiting primarily for dining. Exemplar 6, representing 7.7% of the samples, connects the food mall with the children’s shop area (zone 19), corresponding to the behavior pattern of parents with children.
Figure 7.
Typical routes extracted by AP clustering.
Overall, these six exemplars have demonstrated the advantage of combining sequence-based similarity measurement with AP clustering. Compared with simply selecting routes with the highest average similarity to all samples, this approach extracts representative routes for different groups of consumers, thereby revealing multiple types of movement patterns within the commercial space. In fact, if a larger number of exemplars is specified, more fine-grained typical routes for specific consumer groups, such as those represented by Exemplars 5 and 6, can be further identified (The number of exemplars (or clusters) in the AP algorithm is controlled by the preference parameter. There were 50+ exemplars when preference was set as the median of similarities by default, and we used a lower preference to obtain a reduced number of exemplars for simplicity). Compared with K-means clustering, which represents each route as a binary visiting vector and therefore neglects additional path-organizing information such as visiting order, the proposed approach explicitly preserves the sequential structure and length heterogeneity of routes, leading to more behaviorally coherent route groupings. To quantitatively evaluate this difference and the extent of information loss introduced by alternative clustering strategies, we compute both clustering agreement and intra-cluster similarity metrics. The consistency between AP and K-means is measured using the Adjusted Rand Index (ARI = 0.280) and Normalized Mutual Information (NMI = 0.363), which, respectively, capture pairwise assignment consistency and shared information between the two clustering solutions. These relatively low-to-moderate values indicate that the two clustering methods produce substantially different partition structures, reflecting the important impact of incorporating sequential information in AP clustering. Furthermore, intra-cluster similarity is computed as the mean Levenshtein ratio across all pairs of routes within the same cluster, serving as a measure of sequential homogeneity. The results show that AP achieves a much higher intra-cluster similarity (0.283) than K-means (0.160), indicating that K-means produces clusters with much greater internal heterogeneity, as path-ordering information is not considered in the representation of trajectories.
5.2. Typical Route Extracted by Route Prediction
As stated above, the key idea of route prediction is to predict the next destination consecutively within a sequence of OD choices, until the consumer chooses to leave. In this study, 323 individual routes were decomposed into 1761 OD choices. For each choice situation, the alternative set contained 46 options, including 45 spatial zones and the special “leaving” option. Both the MNL model and CNN were applied to the same dataset, using the same specification of explanatory variables. These variables were organized into three groups: attractiveness, spatial impedance, and accumulated activity indicators, as shown in Table 2. The specification generally follows previous sequential destination choice studies in commercial environments [58,59,60,61], but is extended to reflect emerging spatial and behavioral characteristics of contemporary multi-level and multi-building commercial complexes. Additional variables include vertical spatial impedance indicators, such as vertical distance and floor-specific dummies, and brand-related factors, such as anchor stores and consumer familiarity level. The attractiveness and spatial impedance variables were defined only for spatial zones, whereas the accumulated activity indicators were specified only for the leaving option.
Table 2.
Specification of explanatory variables.
Table 3 presents the estimated results of the MNL model. Most variables were statistically significant and readily interpretable, as the signs of their coefficients conformed to expectations. As to variables concerning attractiveness, consumers were more likely to choose zones with a larger business area and a greater number of anchor or sub-anchor stores, while entertainment-oriented zones were the most preferred among the six functions. Zones containing well-known brands that consumers were familiar with or had repeatedly visited before were also more attractive. For spatial impedance indicators, both distance and turning-back exhibited negative effects on destination choice, whether horizontal or vertical. The utility of different storeys peaked at the ground floor and decreased monotonically as pedestrians moved upward. The coefficients of horizontal and vertical entrance effects were also significant, supporting the assumption that consumers are more likely to choose places distant from entrances immediately after entering the mall, but gradually shift their preference towards locations closer to entrances, or more precisely, exits, as their routes approach completion. Regarding accumulated activity indicators, the results demonstrated that the probability of choosing to leave increased as consumers completed more activities or accumulated longer walking distances during their trips. Based on these estimated coefficients, the probability of each OD choice could then be calculated using Equation (3).
Table 3.
Estimation results of the MNL model.
Despite its good interpretability, the MNL was not the best option for pure prediction tasks. In contrast, CNN was utilized to improve accuracy, albeit at the cost of interpretability due to its black-box nature. Figure 8 illustrates the structure of the CNN used in this study. The input layer is a virtual image with dimensions of , where the height corresponds to 46 alternatives, and the width corresponds to 30 explanatory variables. To reduce the risk of overfitting, a compact CNN structure was selected rather than a deeper network. Specifically, the model uses only one convolutional layer with 10 filters of size and tanh activation, which scan the full set of variables for each alternative and generate 10 alternative-level feature maps. The extracted features are then flattened and mapped to a 46-dimensional utility vector, after which a softmax function is used to produce the predicted choice probabilities for the 46 alternatives. This architecture was determined through repeated trials and hyperparameter tuning using Ray Tune, in which different numbers of convolutional layers, filter numbers, and regularization settings were compared. The results showed that more complex architecture did not improve validation performance, suggesting that the route-prediction problem in this study could be better handled by a relatively simple model. In addition, dropout regularization with a dropout rate of 0.65 and L2 regularization with a coefficient of 0.01 were applied during model training to further prevent overfitting.
Figure 8.
Network structure of CNN.
The whole data was split into training (70%) and validation (30%) sets, with the latter reserved for objective evaluation of predictive accuracy. The CNN was trained using the Adam optimizer with a learning rate of 0.001, a batch size of 64, and 50 training epochs. Figure 9 compares the performance of the MNL model and the CNN on both datasets, where top-N accuracy denotes the proportion of observations for which the true chosen alternative is ranked among the N alternatives with the highest predicted probabilities. The results clearly show that the CNN outperformed the MNL model in terms of top-N accuracy and McFadden’s R2 on both the training and validation sets. Meanwhile, the performance gap between the two datasets remained limited, suggesting that the compact CNN architecture and regularization settings effectively reduced the risk of overfitting. The validation accuracy was even slightly higher than the training accuracy in the top-1 and top-2 cases, which may be attributed to sampling variation. Although the CNN still performed better on the training set in terms of top-3 and top-5 accuracy as well as McFadden’s R2, this difference was modest and expected for a model fitted on the training data. Consequently, the CNN achieved stronger predictive performance than the MNL model while retaining sufficient generalization ability, providing a robust basis for generating typical routes through prediction and simulation.
Figure 9.
Performance of the MNL model and the CNN in OD choice prediction.
In the next step, beam search with was implemented to find the three routes with the highest joint probabilities (Figure 10), based on the predicted OD probabilities at each sequential decision step. These simulated virtual routes appeared more complicated than the observed real routes, yet they still conformed to the common spatial behavior pattern identified above, namely “anchor store → smaller stores → another anchor store → smaller stores → another anchor store”. All three routes would visit the most important anchor stores, i.e., the cinema and Paris Printemps, while smaller shops located along the main inner streets served as transition places between them. Although the additional places visited differed across the three routes, they generally followed the same underlying behavioral logic. In other words, consumers tended to move repeatedly between highly attractive anchor destinations, with various intermediate stops occurring at smaller stores encountered along the primary circulation paths. These results suggest that the simulated routes generated by the CNN and beam search were not random combinations of destinations, but rather reflected coherent sequential movement structures within the commercial space.
Figure 10.
Simulated typical routes with the highest probabilities.
6. Discussion
6.1. Structured Movement Patterns in Commercial Space
The analysis of typical consumer routes in WJC Wanda Square reveals that movement within commercial spaces is not random but exhibits highly structured patterns. Across exemplars extracted by AP clustering and highest-probability virtual routes simulated by route prediction, certain behavioral logics have emerged, which can be categorized into several different patterns reflecting both consumer purpose and functional zoning. The most prevalent pattern, observed in Exemplar 1 and all three virtual routes with the highest probabilities, involves visitors starting from a prominent anchor store, such as the cinema, proceeding through a sequence of smaller shops along the main inner streets, and finally arriving at another anchor store, such as Paris Printemps. This “anchor → smaller stores → anchor” pattern highlights the central role and dual function of anchor stores, not only in attracting initial footfall but also in organizing the circulation of consumers within the mall. The intermediate smaller shops, particularly those located along main inner streets, function primarily as transitional or intermediate destinations and benefit a lot from passing customer flow. These findings are consistent with the spillover effect of anchor stores demonstrated in prior studies [64,65,66], which quantified the effect as a 14.2–26.5% increase in visits to non-anchor stores [67]. It is also worth noting that there is a clear distinction in consumer planning behavior between anchor stores and small shops, and planning has been shown to significantly shape consumers’ behavioral patterns [68]. Visitors tend to exhibit a high degree of planned purpose and planned visits for anchor stores: these stores are frequently treated as intentional destinations, chosen as part of a scheduled shopping plan. In contrast, for smaller shops along circulation paths, the level of planning is considerably lower. While some visits to these shops correspond to planned purposes, very few are explicitly planned as target stores before entering the mall. This distinction indicates a primary-secondary relationship between stores: anchor stores function as primary destinations that structure consumer movement and generate traffic, whereas smaller shops act as secondary destinations, largely visited as a consequence of flows induced by anchors. Viewed through Gehl’s distinction between three types of activities, planned anchor-store visits, which occupy the more necessary-like end of consumer behavior, can generate opportunities for more optional stops and occasional social encounters along circulation paths.
Beyond this dominant pattern, the other exemplars collectively illustrate distinct and independent behavioral strategies adopted by various consumer groups. Exemplar 2 and Exemplar 3 illustrate contrasting patterns of consumer behavior within large anchor stores. Exemplar 2, representing fashion-focused shoppers, is largely confined within Paris Printemps, yet many routes in this cluster also include visits to other zones, indicating that these shoppers, while focused, still contribute to the flow of consumers to surrounding stores. In contrast, Exemplar 3, representing Walmart customers, exhibits highly task-oriented behavior, with the routes represented by this exemplar largely restricted to the supermarket itself, reflecting a strong degree of functional isolation and leaving little room for optional or social activities. This distinction is also evident from the K-means clustering results shown in Figure 5, where Cluster 1 (corresponding to Paris Printemps) connects with multiple secondary zones, whereas Cluster 5 (corresponding to Walmart) remains largely self-contained. Extending Gehl’s argument, the contrast suggests that optional and social activities depend not only on spatial quality, but also on the type of necessary activity through which users initially engage with the space. Exemplar 4, which traverses cinema, Paris Printemps, and fashion shops in the underground mall, demonstrates associative movement across complementary functional zones. Exemplar 5 mainly connects the food mall with the main inner street, reflecting dining-oriented behavior, and Exemplar 6, linking food areas and children’s shops, captures family-oriented movement. Together, these findings reveal the heterogeneous strategies consumers employ, showing that in addition to a dominant anchor-driven pattern, a variety of alternative sequences coexist in the commercial environment. This further reflects the heterogeneous nature of shoppers associated with distinct behavior patterns and shopping orientations identified in previous studies [69,70].
6.2. The Importance of Sequential Information and Differentiated Typicality
The findings in Section 6.1 underscore the central role of sequential information in understanding consumer behavior within commercial spaces. Traditional clustering methods, such as K-means applied to unordered visiting vectors, are limited in their ability to preserve the sequential structure of routes, potentially obscuring the behavioral logic underlying observed movement. In contrast, the combined use of AP clustering with a Levenshtein-based similarity measure explicitly retains the order and length of visits, allowing for the identification of distinct groups of consumers characterized by unique sequential patterns. In addition, route prediction via MNL/CNN with beam search directly uses sequential dependencies to generate plausible routes. These approaches enable a more nuanced analysis of how anchor stores, intermediate shops, and functional zones are traversed.
Central to this framework is the concept of differentiated typicality, which captures the representative behavior of distinct consumer groups, while also accommodating the generation of plausible, high-probability routes. More specifically, the two approaches correspond to two complementary forms of typicality. AP clustering identifies empirical typicality, where each exemplar summarizes the characteristic sequential pattern of a specific consumer cluster. This reflects the diversity of observed behaviors and allows for the identification of multiple, coexisting movement modes. Route prediction, by contrast, identifies generative typicality. A route is regarded as typical when it can be produced with a high overall probability through successive destination choices, even if it has not actually appeared in the observed sample. In this sense, typical routes are not only retrospective summaries of finite trace samples, but also probabilistic expressions of behavioral logic embedded in the spatial and functional organization of the commercial environment. By integrating empirical and generative typicality, the proposed framework simultaneously captures group-specific observed regularities and behaviorally plausible route possibilities, enabling a richer understanding of both the structure and diversity of consumer movement in commercial spaces.
The theoretical value of this dual understanding becomes especially evident when the results of empirical and generative typicality are compared. Notably, the high-probability sequences generated through prediction are closely aligned with the most representative clustering exemplar (Exemplar 1). Although the generated routes are not identical to the observed exemplar, they reproduce a similar anchor-driven sequential logic. Since the two approaches are grounded in different forms of information, this convergence makes the identified route structure more convincing and less susceptible to method-specific uncertainty. Its significance therefore extends beyond methodological validation, as it suggests that the dominant anchor-driven structure is not simply a product of the observed sample or the prediction algorithm. Instead, it reflects an underlying regularity of consumer movement shaped by the interaction between consumer preferences and commercial space organization. This interpretation can be further understood through the concept of behavioral affordance [71,72]: the physical and functional layout of the mall affords and reinforces certain movement possibilities, making particular sequential structures both frequently observed and highly probable. In this sense, the groups of observed routes represented by the anchor-driven exemplars identified through clustering can be viewed as empirical instantiations of this affordance structure.
At the same time, the clustering results reveal a wider range of route types than those that appear prominently in the prediction-generated sequences. This divergence should not be interpreted as indicating that these observed exemplars are accidental, confined to a particular sample, or unimportant. Rather, it suggests that some routes represent distinct but less dominant consumer types, whose overall generation probabilities are lower than those of the dominant anchor-driven pattern. Therefore, convergence between clustering and prediction helps identify dominant movement structures, whereas divergence helps reveal minority or functionally specific route patterns that remain behaviorally meaningful.
6.3. Design Implications for Commercial Environments
The findings suggest that commercial environments should strategically reinforce the dominant anchor-driven movement structure identified in this study. Both the observed exemplars and the predicted virtual routes indicate that consumers frequently move between major anchor stores through sequences of intermediate retail spaces. Quantitatively, Exemplar 1 most directly represents this pattern, accounting for 32.8% of all observed routes. Together with Exemplar 4, which is also associated with anchor-driven movement, these two exemplars collectively account for 46% of all samples. This dominance is further corroborated by the route prediction results, where 55% of the top 20 highest-probability simulated routes follow the same sequential structure. Therefore, rather than treating anchor stores as isolated destinations, commercial space design should utilize their linking effect to organize pedestrian circulation across the entire commercial area. By arranging major anchor stores at appropriate distances and strengthening the continuity and attractiveness of intermediate retail corridors, customer flows generated by anchor stores can be more effectively transformed into commercial opportunities for smaller shops along the way.
In addition, anchor stores often possess relatively high levels of planned visitation, meaning that consumers are willing to travel longer distances specifically for these destinations. As a result, anchor stores may still attract substantial pedestrian flows even when located in relatively deep or less accessible positions, such as the far ends of floor plans or upper levels within vertical commercial complexes. Some scholars have therefore proposed spatial layouts that intentionally position anchor stores in such locations to encourage pedestrian movement through intermediate retail areas [8,73], as shown in Figure 11. Such a layout strategy appears reasonable according to this study, as anchor stores were repeatedly observed as effective spatial attractors shaping customer flows through intermediate retail spaces. This suggestion is further supported by the MNL model, where floor-level utility coefficients reveal a marked acceleration in decline above the 5th floor (5F: β = −1.458 vs. 2F: β = −0.585). The results indicate that only highly compelling anchor tenants—such as flagship cinemas or large-scale dining destinations—can sustain meaningful visitor volumes at these upper levels.
Figure 11.
Suggested spatial layout of anchor stores and small stores [73].
However, the findings also show that not all anchor stores generate the same spatial spillover effects. Notably, large supermarkets may exhibit much more self-contained movement patterns due to the strongly utilitarian nature of supermarket shopping behavior. As demonstrated by Exemplar 3, 13.6% of consumers largely restricted their activities to the supermarket with minimal spillover effects. This finding contrasts with some previous evidence that emphasized the role of supermarkets, grocery stores and convenience stores in generating linked shopping trips and spillover effects [74,75,76]. The discrepancy may arise because the case investigated in this study exhibited a particularly strong contrast between hedonic-oriented and task-oriented retail functions. In practice, some commercial complexes in China intentionally offer lower rents to large supermarkets to attract them as major traffic generators for the entire complex. However, the results of this study imply that high visitor volumes alone do not necessarily translate into broader circulation benefits for surrounding retail spaces.
More broadly, the coexistence of multiple route types indicates that commercial environments should accommodate diverse consumer movement needs. Specifically, the shares of the six exemplar route types () are 32.8%, 22.9%, 13.6%, 13.0%, 9.9%, and 7.7%, respectively. Route diversity could be measured by Shannon entropy , and normalized entropy , indicating high behavioral diversity. While some consumers exhibit exploratory movement characterized by repeated transitions between different retail areas, others demonstrate highly task-oriented behavior with relatively direct and concentrated routes. This suggests that commercial spaces should simultaneously provide efficient navigation for purpose-driven consumers and diversified spatial experiences for hedonic-oriented visitors. The MNL model further indicates that leaving probability increases significantly with accumulated horizontal distance (β = 0.007) and vertical distance (β = 0.062), suggesting that overlong circulation paths may accelerate consumer departure. Therefore, combining direct circulation systems with secondary exploratory paths may help support heterogeneous movement strategies and improve the adaptability of commercial environments to different consumer groups.
Finally, the route patterns associated with fashion-related consumption suggest that comparative shopping behavior tends to involve repeated movement between functionally similar retail spaces. Although Exemplar 4 itself includes several fashion-related destinations that are not necessarily located in very close proximity, the routes represented by Exemplars 1 and 2—both organized around Paris Printemps as a major fashion-oriented anchor—frequently involve subsequent visits to nearby fashion retail areas. This indicates that consumers engaged in fashion-related shopping often continue exploring additional stores after reaching a major anchor destination. Descriptive statistical analysis further supports this tendency. In WJC Wanda Square, 53% of comparative shopping activities occur in zones that are both spatially adjacent and functionally similar, whereas the proportion drops to only 16% when functionally similar zones are spatially separated. This 3.3-fold difference indicates that spatial proximity is a decisive factor in activating comparison shopping behavior. Accordingly, for comparison-based shopping primarily associated with fashion-related retail, arranging functionally similar stores within relatively proximate locations may help support efficient comparison activities and improve the overall shopping experience.
6.4. Limitations
This study also has several limitations. First, the empirical analysis was conducted in a single shopping mall, which limits the representativeness and generalizability of the findings. Although WJC Wanda Square provides a useful case for examining indoor consumer movement patterns, other cases may possess their own unique characteristics, potentially leading to different movement logics and additional route patterns. More importantly, commercial spaces exist in many spatial forms beyond shopping malls, such as traditional linear open streets and mixed-use retail districts integrating cultural, tourism, and leisure functions, some of which may involve more complex and less controlled movement structures. Future studies should therefore apply similar analytical frameworks to a wider range of commercial environments. In addition, the collection of individual trace data in indoor commercial environments is highly labor-intensive and costly, which constrains the scale of empirical observations in this study. However, with the development of positioning techniques and big data analytics, future research may leverage large-scale behavioral datasets to further validate the proposed analytical framework.
Second, the present study mainly focused on the spatial sequence of consumer movement, while the temporal dimensions of route behavior were not fully incorporated. In practice, consumer movement patterns may differ substantially across different time periods, and the duration of stay at different locations may also reflect important behavioral differences. However, the current analysis primarily concentrated on the order of visited destinations rather than the precise timing and duration of activities. Incorporating temporal dynamics and dwell-time information into route analysis remains technically challenging, but it may provide a more comprehensive understanding of consumer behavior in commercial environments. Future research may therefore further integrate spatiotemporal behavioral analysis with emerging techniques.
7. Conclusions
This paper proposes two complementary approaches for extracting typical consumer routes from observed trace data, with the aim of better understanding sequential spatial behavior in commercial environments. The first approach conceptualizes typical routes as representative behavioral patterns and identifies them through route clustering. Compared with conventional K-means clustering based on unordered visiting matrices, the combination of Levenshtein-ratio similarity measurement and AP clustering preserves the sequential structure and length differences in routes, enabling the identification of exemplars that more effectively represent distinct groups of consumers and their movement logics. The second approach conceptualizes typical routes as highly probable behavioral sequences and extracts them through route prediction. By decomposing routes into a series of consecutive OD choices, both the MNL model and CNN are able to estimate destination choice probabilities for each movement step, while beam search further enables the generation of complete high-probability routes. The CNN achieves substantially higher predictive accuracy and demonstrates stronger capability for route simulation, whereas the MNL model still retains important advantages in interpretability and theoretical transparency. In this way, the paper connects route clustering and route prediction within a unified analytical framework, showing that typical routes can be understood both as representative observed patterns and as highly probable behavioral sequences generated from successive destination choices.
Both approaches were demonstrated through a case study of WJC Wanda Square in Shanghai, China. Six typical observed routes were extracted as exemplars through AP clustering, while three additional highest-probability virtual routes were simulated through CNN-based prediction and beam search. Although these two types of routes originated from different analytical logics—one emphasizing representativeness within observed data and the other emphasizing probabilistic plausibility—they exhibited remarkably consistent sequential structures. Both approaches revealed a dominant movement pattern organized around transitions between anchor stores and intermediate, smaller shops. Such convergence links empirical typicality and generative typicality: the dominant route structure is recurrent in observed traces and reproducible through sequential choice predictions. These findings suggest that consumer movement in commercial spaces is not random, but instead follows relatively stable and predictable sequential logic shaped jointly by anchor destinations, functional zoning, and circulation structure. The findings provide practical implications for commercial space design and management, particularly regarding the spatial organization of anchor stores, intermediate retail corridors, and differentiated circulation strategies for various consumer groups. Overall, the study demonstrates that integrating semantic route sequences with clustering and predictive modeling provides a useful framework for understanding, interpreting, and simulating consumer movement behavior in complex commercial environments.
Author Contributions
Conceptualization, C.W. and Y.C.; Methodology, C.W. and Y.C.; Software, C.W.; Validation, Y.C.; Formal analysis, C.W., H.W. and J.Y.; Investigation, C.W., H.W. and J.Y.; Resources, H.W., J.Y. and Y.C.; Data curation, H.W. and J.Y.; Writing—original draft, C.W. and H.W.; Writing—review and editing, Y.C.; Visualization, C.W. and H.W.; Supervision, Y.C.; Project administration, Y.C.; Funding acquisition, C.W. All authors have read and agreed to the published version of the manuscript.
Funding
This research was funded by National Natural Science Foundation of China, grant number 52208078.
Data Availability Statement
The data presented in this study are openly available in Zenodo at https://doi.org/10.5281/zenodo.20388545, reference number 20388545.
Conflicts of Interest
The authors declare no conflicts of interest.
References
- Heer, B. Shopping malls as social space: New forms of public life in Johannesburg. In Cities in Flux: Metropolitan Spaces in South African Literary and Visual Texts; LIT: Zürich, Switzerland, 2017; pp. 101–122. [Google Scholar]
- Giampino, A.; Picone, M.; Schilleci, F. The shopping mall as an emergent public space in Palermo. J. Public Space 2017, 2, 85–98. [Google Scholar] [CrossRef] [Scilit]
- Xu, M. The making of everyday space of publicness: Insights from a mall in Beijing. J. Contemp. Ethnogr. 2024, 53, 796–821. [Google Scholar] [CrossRef] [Scilit] [PubMed]
- Gehl, J. Life Between Buildings: Using Public Space; Island Press: Washington, DC, USA, 2011. [Google Scholar]
- Chen, Y.; Xue, C.Q.L.; Sun, C. American shopping malls in China: A mosaic analysis of databases. J. Asian Archit. Build. Eng. 2023, 22, 3224–3234. [Google Scholar] [CrossRef] [Scilit]
- Zheng, T. The impact of e-commerce on physical retail: An empirical study of Beijing, Wuhan, and Hangzhou. J. Bus. Mark. 2025, 2, 131–135. [Google Scholar] [CrossRef] [Scilit]
- Wang, F.; Hou, J.; Niu, F. The impact of Chinese residents’ online shopping on the physical shopping behavior. Acta Geogr. Sin. 2024, 79, 2083–2096. [Google Scholar] [CrossRef]
- Wang, C.; Wang, D.; Zhu, W.; Yin, Z.; Song, S. Spatial improvement strategies for commercial complexes based on simulations of consumer behavior. J. South Archit. 2025, 2, 24–36. [Google Scholar] [CrossRef] [Scilit]
- Berkhout, C.; Quartier, K. The role of consumers in the retail design process. In Proceedings of the Designing Retail & Services Futures Colloquium 2025: Sustainable Retail and Services Futures; Design Research Society: London, UK, 2025. [Google Scholar]
- Tsui, C.W. An Empirical Analysis of the Retail Tenant Mix of General Shopping Centres in Hong Kong. Master’s Thesis, University of Hong Kong, Hong Kong, China, 2003. [Google Scholar]
- Zhuang, Y.; Zhang, L.; Dai, X. Configuration study of pedestrian flows in multi-level commercial space. J. Tongji Univ. Nat. Sci. 2012, 40, 1620–1626. [Google Scholar]
- Kaneda, T.; Inagaki, S. A review of a shop-around behavior survey in the Osu district. In Downtown Dynamics; Kaneda, T., Ed.; Springer: Tokyo, Japan, 2020; pp. 3–25. ISBN 978-4-431-54901-7. [Google Scholar]
- Yoshida, T. ASSA: Agent-based simulation model for shop-around agent model. In Downtown Dynamics; Kaneda, T., Ed.; Springer: Tokyo, Japan, 2020; pp. 121–147. ISBN 978-4-431-54901-7. [Google Scholar]
- Meng, X.; Sun, S.; Zhang, X.; Leng, Q.; Fang, J. A survey on trajectory representation learning methods. Front. Comput. Sci. 2025, 19, 1912379. [Google Scholar] [CrossRef] [Scilit]
- Takeuchi, M.; Yoshida, T.; Kaneda, T. A transition analysis of shopping street complex district from the viewpoint of shop-around behaviors. J. Archit. Plan. Trans. AIJ 2011, 76, 361–368. [Google Scholar] [CrossRef] [Scilit]
- Kobayashi, Y.; Harasaki, M.; Kaneda, T. Analyses on transition factors of tenants inside shopping district by using shop-around behavior survey data. AIJ J. Technol. Des. 2015, 21, 811–814. [Google Scholar] [CrossRef] [Scilit]
- Wang, C.; Wang, D.; Zhu, W.; Song, S. Construction of assessment system on commercial space performance based on consumer behavior. City Plan. Rev. 2021, 45, 33–45. [Google Scholar] [CrossRef]
- Istrate, A.-L. Street vitality: What predicts pedestrian flows and stationary activities on predominantly residential Chinese streets, at the mesoscale? J. Plan. Educ. Res. 2025, 45, 66–80. [Google Scholar] [CrossRef] [Scilit]
- Lerman, Y.; Omer, I. Urban area types and spatial distribution of pedestrians: Lessons from Tel Aviv. Comput. Environ. Urban Syst. 2016, 55, 11–23. [Google Scholar] [CrossRef] [Scilit]
- El-Adly, M.I.; Eid, R. An empirical study of the relationship between shopping environment, customer perceived value, satisfaction, and loyalty in the UAE malls context. J. Retail. Consum. Serv. 2016, 31, 217–227. [Google Scholar] [CrossRef] [Scilit]
- Babaee, S.; Araghi, M.; Castillo, I.; Rostami, B. Attractiveness factors in retail category space location-allocation problem. Int. J. Prod. Res. 2023, 61, 5566–5584. [Google Scholar] [CrossRef] [Scilit]
- Riaz, H.; Amina, N.; Khan, M.A.; Iqbal, A.; Irfan, A.; Ishitaq, H.; Noshin, S.; Mohsin, H.; Shahbaz, I. Role of spatial efficiency, layout planning, and sustainability in the success of shopping malls. Adv. Civ. Archit. Eng. 2024, 15, 58–75. [Google Scholar] [CrossRef] [Scilit]
- Torrens, P.M. Data science for pedestrian and high street retailing as a framework for advancing urban informatics to individual scales. Urban Inform. 2022, 1, 9. [Google Scholar] [CrossRef] [Scilit] [PubMed]
- Verma, R.; Chiara, G.D.; Goodchild, A. Does proximity matter in shopping behavior? Transp. Res. Part Policy Pract. 2025, 196, 104471. [Google Scholar] [CrossRef] [Scilit]
- Hayashi, K.; Ikemoto, M.; Kaneda, T.; Koyama, Y.; Nakamura, J. Actual surveys on visitor’s shop-around behaviors and vertical floor use in Akihabara, Tokyo, 2011. AIJ J. Technol. Des. 2013, 19, 315–319. [Google Scholar] [CrossRef] [Scilit]
- Derya Arslan, H.; Ergener, H. Comparative analysis of shopping malls with different plans by using space syntax method. Ain Shams Eng. J. 2023, 14, 102063. [Google Scholar] [CrossRef] [Scilit]
- Andi, A.; Abednego, I.A.; Gultom, B.J.B. Space syntax guide to optimize shopping mall: A systematic review. Int. J. Environ. Archit. Soc. 2021, 1, 19–30. [Google Scholar] [CrossRef] [Scilit]
- Hou, X.; Zheng, L. Simulation of pedestrian flow in traditional commercial streets based on space syntax. Procedia Eng. 2017, 205, 1344–1349. [Google Scholar] [CrossRef] [Scilit]
- Millonig, A.; Gartner, G. Shadowing—Tracking—Interviewing: How to explore human spatio-temporal behaviour patterns. In Technical Report 48: Workshop on Behavior Monitoring and Interpretation BMI ’08; Gottfried, B., Aghajan, H., Eds.; TU Wien Academic Press: Vienna, Austria, 2008; pp. 1–15. [Google Scholar]
- Sugimoto, K.; Ota, K.; Suzuki, S. Visitor mobility and spatial structure in a local urban tourism destination: GPS tracking and network analysis. Sustainability 2019, 11, 919. [Google Scholar] [CrossRef] [Scilit]
- Orellana, D.; Bregt, A.K.; Ligtenberg, A.; Wachowicz, M. Exploring visitor movement patterns in natural recreational areas. Tour. Manag. 2012, 33, 672–682. [Google Scholar] [CrossRef] [Scilit]
- Cao, H.; Xu, F.; Sankaranarayanan, J.; Li, Y.; Samet, H. Habit2vec: Trajectory semantic embedding for living pattern recognition in population. IEEE Trans. Mob. Comput. 2020, 19, 1096–1108. [Google Scholar] [CrossRef] [Scilit]
- Hung, C.-C.; Peng, W.-C.; Lee, W.-C. Clustering and aggregating clues of trajectories for mining trajectory patterns and routes. VLDB J. 2015, 24, 169–192. [Google Scholar] [CrossRef] [Scilit]
- Yao, D.; Zhang, C.; Zhu, Z.; Huang, J.; Bi, J. Trajectory clustering via deep representation learning. In Proceedings of the 2017 International Joint Conference on Neural Networks (IJCNN), Anchorage, AK, USA, 14–19 May 2017; pp. 3880–3887. [Google Scholar] [CrossRef] [Scilit]
- Parent, C.; Spaccapietra, S.; Renso, C.; Andrienko, G.; Andrienko, N.; Bogorny, V.; Damiani, M.L.; Gkoulalas-Divanis, A.; Macedo, J.; Pelekis, N.; et al. Semantic trajectories modeling and analysis. ACM Comput. Surv. 2013, 45, 1–32. [Google Scholar] [CrossRef] [Scilit]
- Li, Y.; Liu, J.; Yan, Z.; Wang, D. Spatial behavior patterns of tourists based on satellite navigation data—A case study of Gulangyu. Chin. Landsc. Archit. 2019, 35, 73–77. [Google Scholar]
- Wang, Z.; Fang, Z. Spatial behavior patterns and evolution characteristics of hikers based on GPS data: A case study of the Wugong mountain in Jiangxi province. Areal Res. Dev. 2021, 40, 118–122, 146. [Google Scholar]
- Wu, H.; Tang, X.; Wang, Z.; Wang, N. Uncovering abnormal behavior patterns from mobility trajectories. Sensors 2021, 21, 3520. [Google Scholar] [CrossRef] [Scilit] [PubMed]
- Zhang, Z.; Amiri, H.; Liu, Z.; Zhao, L.; Zuefle, A. Large language models for spatial trajectory patterns mining. In Proceedings of the 1st ACM SIGSPATIAL International Workshop on Geospatial Anomaly Detection; Association for Computing Machinery: New York, NY, USA, 2024; pp. 52–55. [Google Scholar]
- Wang, S.; Bao, Z.; Culpepper, J.S.; Sellis, T.; Sanderson, M.; Qin, X. Answering top-k exemplar trajectory queries. In Proceedings of the 2017 IEEE 33rd International Conference on Data Engineering (ICDE), San Diego, CA, USA, 19–22 April 2017; IEEE: Piscataway, NJ, USA; pp. 597–608.
- Zheng, J.; Bai, X.; Na, L.; Wang, H. Tourists’ spatial–temporal behavior patterns analysis based on multi-source data for smart scenic spots: Case study of Zhongshan botanical garden, China. Processes 2022, 10, 181. [Google Scholar] [CrossRef] [Scilit]
- Palma, A.T.; Bogorny, V.; Kuijpers, B.; Alvares, L.O. A clustering-based approach for discovering interesting places in trajectories. In Proceedings of the 2008 ACM Symposium on Applied Computing; Association for Computing Machinery: New York, NY, USA, 2008; pp. 863–868. [Google Scholar]
- Sakurai, Y.; Yoshikawa, M.; Faloutsos, C. FTW: Fast similarity search under the time warping distance. In Proceedings of the Twenty-Fourth ACM SIGMOD-SIGACT-SIGART Symposium on Principles of Database Systems; ACM: Baltimore, MD, USA, 2005; pp. 326–337. [Google Scholar]
- Chen, L.; Özsu, M.T.; Oria, V. Robust and fast similarity search for moving object trajectories. In Proceedings of the 2005 ACM SIGMOD International Conference on Management of Data; Association for Computing Machinery: New York, NY, USA, 2005; pp. 491–502. [Google Scholar]
- Vlachos, M.; Kollios, G.; Gunopulos, D. Discovering similar multidimensional trajectories. In Proceedings of the 18th International Conference on Data Engineering (ICDE 2002); IEEE: San Jose, CA, USA, 2002; pp. 673–684. [Google Scholar]
- Wei, L.; He, X.; Teng, Q.; Gao, M. Trajectory classification based on Hausdorff distance and longest common subsequence. J. Electron. Inf. Technol. 2013, 35, 784–790. [Google Scholar] [CrossRef] [Scilit]
- Khoshaein, V. Trajectory Clustering Using a Variation of Frechet Distance. Master’s Thesis, University of Ottawa, Ottawa, ON, Canada, 2014. [Google Scholar]
- Lin, B.; Su, J. One way distance: For shape based similarity search of moving object trajectories. GeoInformatica 2008, 12, 117–142. [Google Scholar] [CrossRef] [Scilit]
- Qiao, D.; Yang, X.; Liang, Y.; Hao, X. Rapid trajectory clustering based on neighbor spatial analysis. Pattern Recognit. Lett. 2022, 156, 167–173. [Google Scholar] [CrossRef] [Scilit]
- Sharif, M.; Alesheikh, A.A. Context-awareness in similarity measures and pattern discoveries of trajectories: A context-based dynamic time warping method. GIScience Remote Sens. 2017, 54, 426–452. [Google Scholar] [CrossRef] [Scilit]
- Xiao, P.; Ang, M.; Zhang, J.; Lei, W. Approximate similarity measurements on multi-attributes trajectories data. IEEE Access 2019, 7, 10905–10915. [Google Scholar] [CrossRef] [Scilit]
- Liang, A.; Yao, B.; Wang, B.; Liu, Y.; Chen, Z.; Xie, J.; Li, F. Sub-trajectory clustering with deep reinforcement learning. VLDB J. 2024, 33, 685–702. [Google Scholar] [CrossRef] [Scilit]
- Wang, C.; Huang, J.; Wang, Y.; Lin, Z.; Jin, X.; Jin, X.; Weng, D.; Wu, Y. A deep spatiotemporal trajectory representation learning framework for clustering. IEEE Trans. Intell. Transp. Syst. 2024, 25, 7687–7700. [Google Scholar] [CrossRef] [Scilit]
- Wu, A.; Banerjee, T.; Rangarajan, A.; Ranka, S. Trajectory prediction via learning motion cluster patterns in curvilinear coordinates. In Proceedings of the 2021 IEEE International Intelligent Transportation Systems Conference (ITSC); IEEE: Indianapolis, IN, USA, 2021; pp. 2200–2207. [Google Scholar]
- Ying, J.J.-C.; Lee, W.-C.; Weng, T.-C.; Tseng, V.S. Semantic trajectory mining for location prediction. In Proceedings of the 19th ACM SIGSPATIAL International Conference on Advances in Geographic Information Systems; ACM: Chicago, IL, USA, 2011; pp. 34–43. [Google Scholar]
- Zaier, M.; Wannous, H.; Drira, H.; Boonaert, J. Pedestrian trajectory prediction: A literature review and current trends. Neural Comput. Appl. 2025, 37, 28869–28906. [Google Scholar] [CrossRef] [Scilit]
- Kjærgaard, M.B.; Blunck, H.; Godsk, T.; Toftkjær, T.; Christensen, D.L.; Grønbæk, K. Indoor positioning using GPS revisited. In Proceedings of the Pervasive Computing; Floréen, P., Krüger, A., Spasojevic, M., Eds.; Springer: Berlin/Heidelberg, Germany, 2010; pp. 38–56. [Google Scholar]
- Wang, D.; Li, G.; Zhu, W.; Wang, C.; Fan, L. Establishment and application of consumers’ behavior model in Guanqian commercial street, Suzhou. City Plan. Rev. 2013, 37, 28–33, 66. [Google Scholar]
- Oyama, Y.; Hato, E. Move-stay choice model using Voronoi-based overlay networks. J. City Plan. Inst. Jpn. 2013, 48, 1107–1112. [Google Scholar] [CrossRef] [Scilit]
- Borgers, A.; Timmermans, H. Modeling Pedestrians’ Shopping Behavior in Downtown Areas. In Proceedings of the 14th International Conference on Computers in Urban Planning and Urban Management (CUPUM), Cambridge, MA, USA, 7–10 July 2015. [Google Scholar]
- Borgers, A.; Kemperman, A.; Timmermans, H. Modeling pedestrian movement in shopping street segments. In Pedestrian Behavior; Emerald Group Publishing Limited: Leeds, UK, 2009; pp. 87–111. ISBN 978-1-84855-750-5. [Google Scholar]
- Frey, B.J.; Dueck, D. Clustering by passing messages between data points. Science 2007, 315, 972–976. [Google Scholar] [CrossRef] [Scilit] [PubMed]
- Ow, P.S.; Morton, T.E. Filtered beam search in scheduling. Int. J. Prod. Res. 1988, 26, 35–62. [Google Scholar] [CrossRef] [Scilit]
- Eppli, M.J.; Shilling, J.D. Large-scale shopping center development opportunities. Land Econ. 1995, 71, 35–41. [Google Scholar] [CrossRef] [Scilit]
- Damian, D.; Curto, J.; Pinto, J. The impact of anchor stores on the performance of shopping centres: The case of Sonae Sierra. Int. J. Retail Distrib. Manag. 2011, 39, 456–475. [Google Scholar] [CrossRef] [Scilit]
- Wei, S.; Huo, H.; Xu, M.; Kadirov, D.; Fam, K.-S. Shop-hop till you drop! the effect of the image gap on spillover patronage within retail agglomerations. J. Retail. Consum. Serv. 2021, 63, 102682. [Google Scholar] [CrossRef] [Scilit]
- Vallapuram, A.K.; Kwon, Y.D.; Lee, L.-H.; Xu, F.; Hui, P. Causal Analysis on the Anchor Store Effect in a Location-Based Social Network; IEEE Computer Society: Los Alamitos, CA, USA, 2022; pp. 202–209. [Google Scholar]
- Chang, Y.; Geng, L. Planned or unplanned purchases? the effects of perceived values on omnichannel continuance intention. Int. J. Retail Distrib. Manag. 2022, 50, 1535–1551. [Google Scholar] [CrossRef] [Scilit]
- Teller, C.; Reutterer, T. The evolving concept of retail attractiveness: What makes retail agglomerations attractive when customers shop at them? J. Retail. Consum. Serv. 2008, 15, 127–143. [Google Scholar] [CrossRef] [Scilit]
- Sorensen, H.; Bogomolova, S.; Anderson, K.; Trinh, G.; Sharp, A.; Kennedy, R.; Page, B.; Wright, M. Fundamental patterns of in-store shopper behavior. J. Retail. Consum. Serv. 2017, 37, 182–194. [Google Scholar] [CrossRef] [Scilit]
- Gibson, J.J. The Ecological Approach to Visual Perception: Classic Edition; Houghton Mifflin: Boston, MA, USA, 1979. [Google Scholar]
- Maier, J.R.A.; Fadel, G.M.; Battisto, D.G. An affordance-based approach to architectural theory, design, and practice. Des. Stud. 2009, 30, 393–414. [Google Scholar] [CrossRef] [Scilit]
- Fujie, S.; Nishikawa, H.; Miyashita, M.; Sakurazawa, T.; Abe, E.; Takahashi, K.; Ishikawa, M.; Omura, M. Commercial Facilities; Ichigaya Publishing Co., Ltd.: Tokyo, Japan, 1995; ISBN 4-87071-254-7. [Google Scholar]
- Bodkin, C.D.; Sewell, E. Assessing grocery store attraction via cross-shopping linkages. Bus. Econ. Res. 2012, 2, 209–229. [Google Scholar] [CrossRef] [Scilit]
- Lambiri, D.; Faggian, A.; Wrigley, N. Linked-trip effects of ‘town-centre-first’ era foodstore development: An assessment using difference-in-differences. Environ. Plan. B Urban Anal. City Sci. 2017, 44, 160–179. [Google Scholar] [CrossRef] [Scilit]
- Wrigley, N.; Wood, S.; Lambiri, D.; Lowe, M. Corporate convenience store development effects in small towns: Convenience culture during economic and digital storms. Environ. Plan. Econ. Space 2019, 51, 112–132. [Google Scholar] [CrossRef] [Scilit]
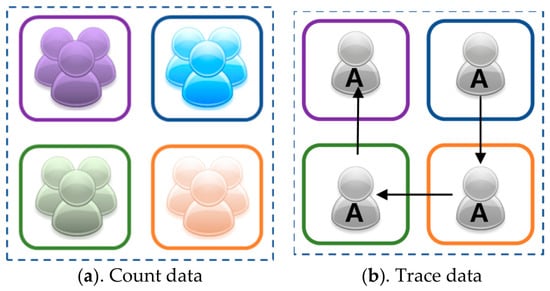
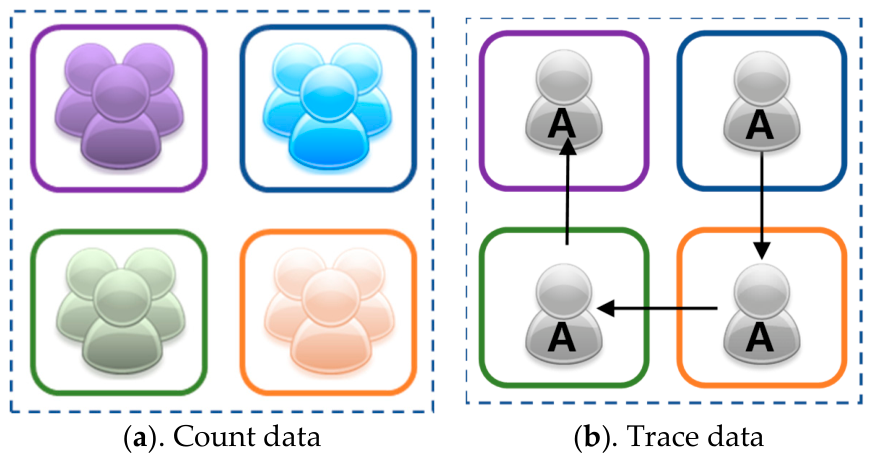
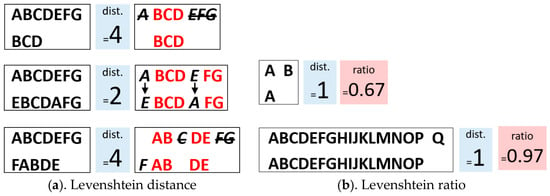
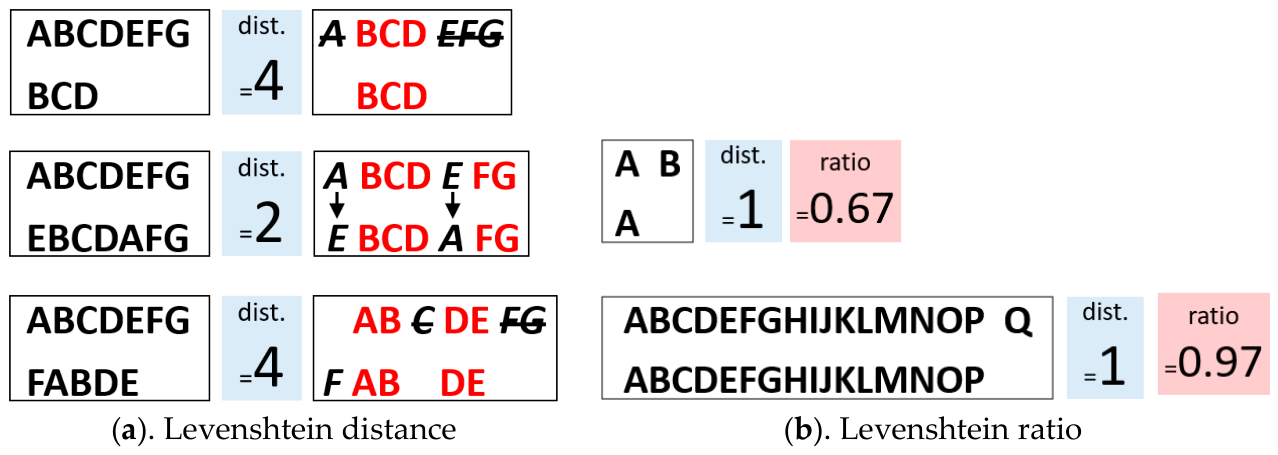
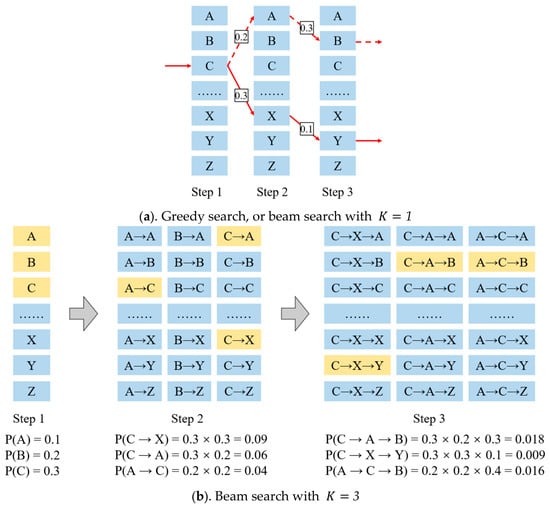
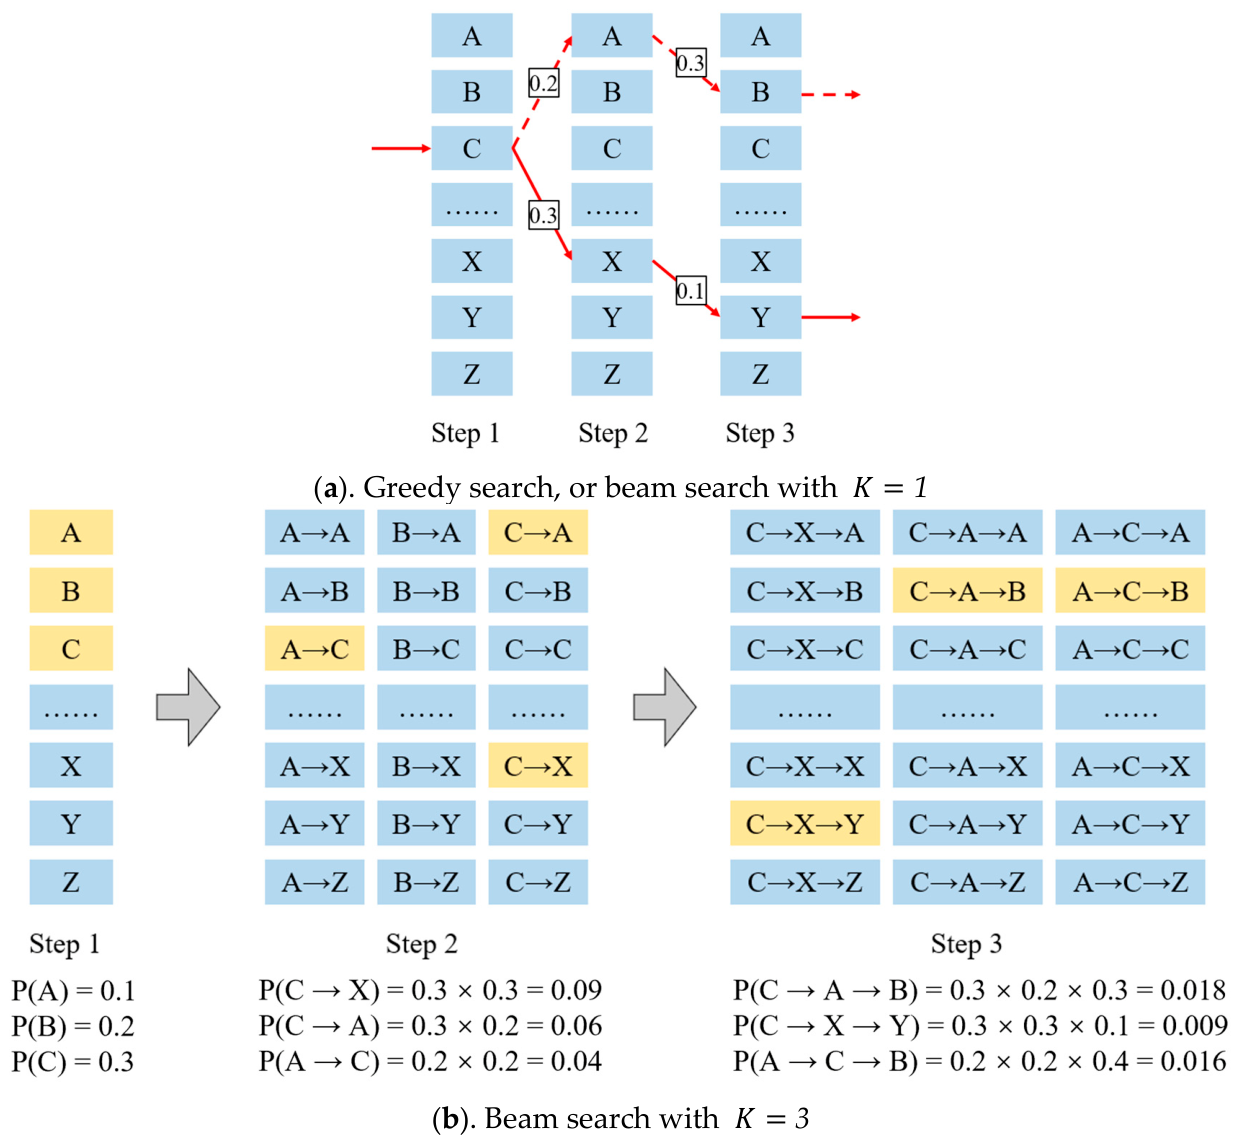
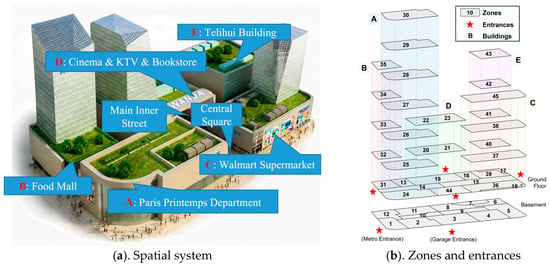
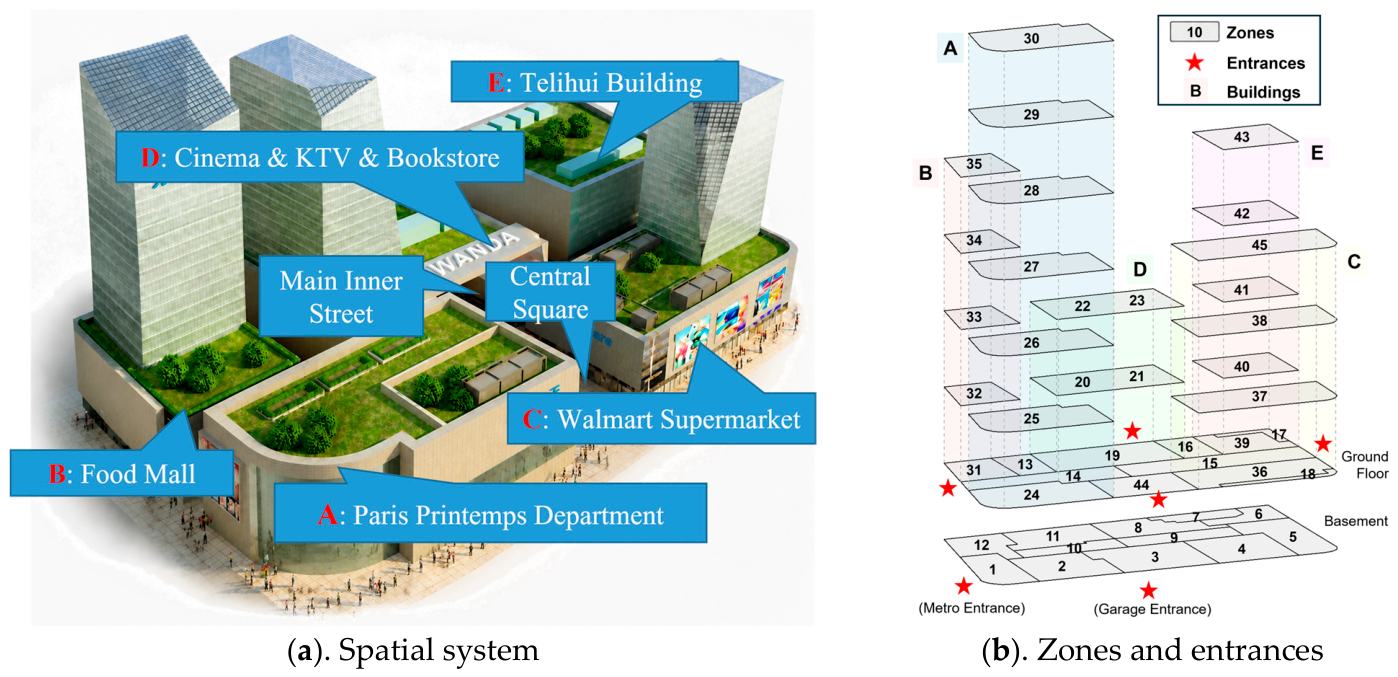
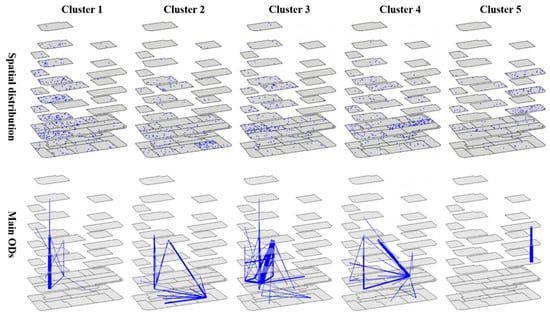
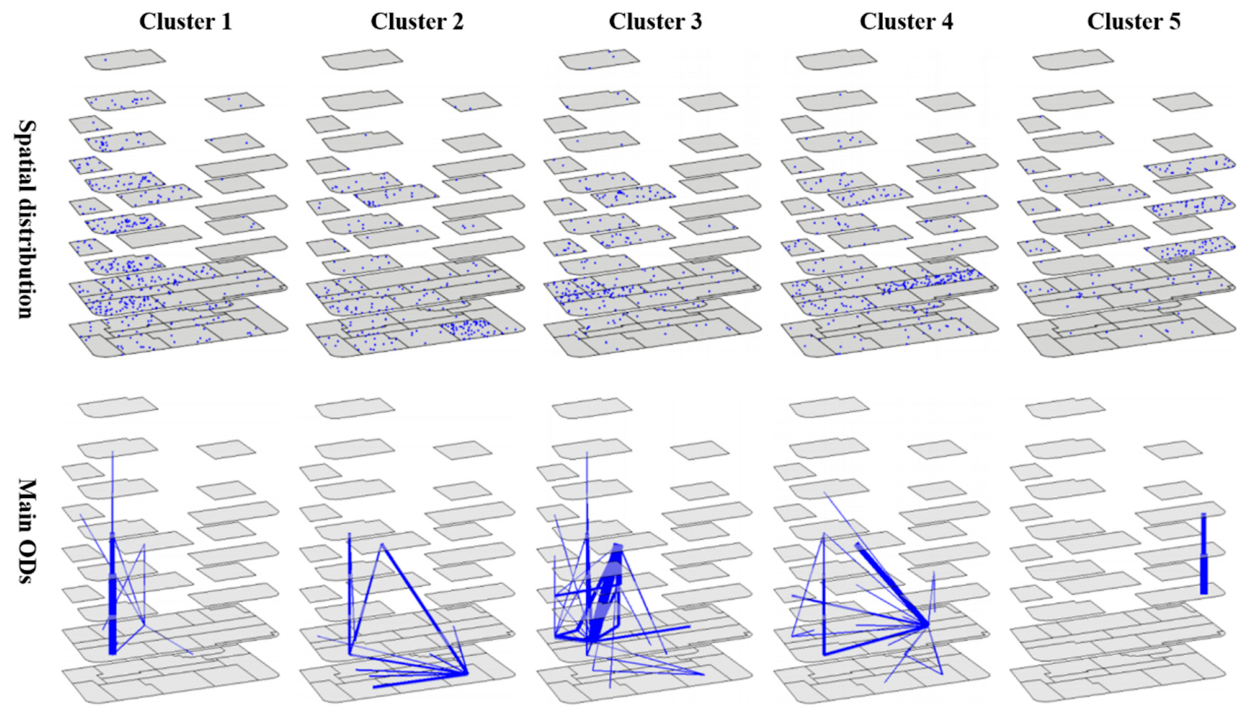
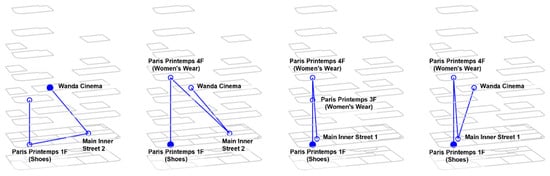
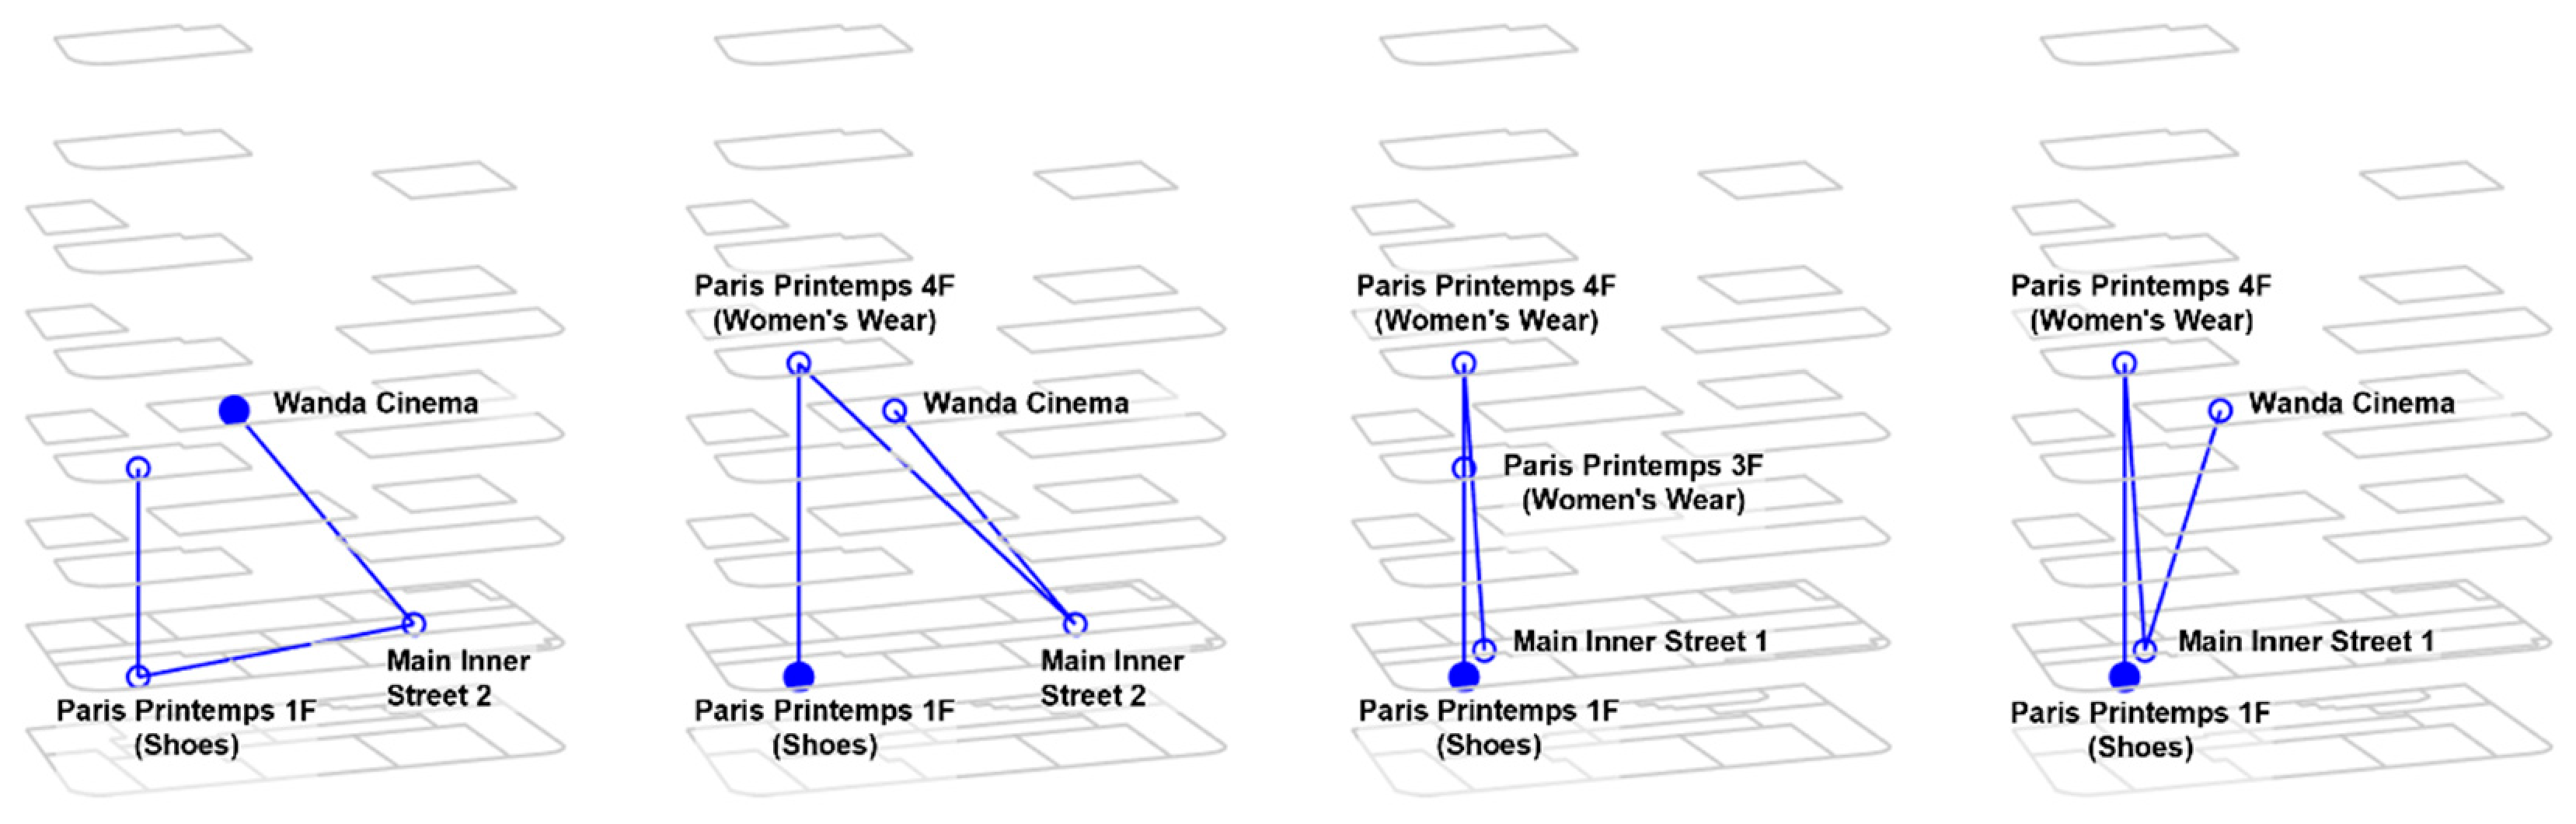
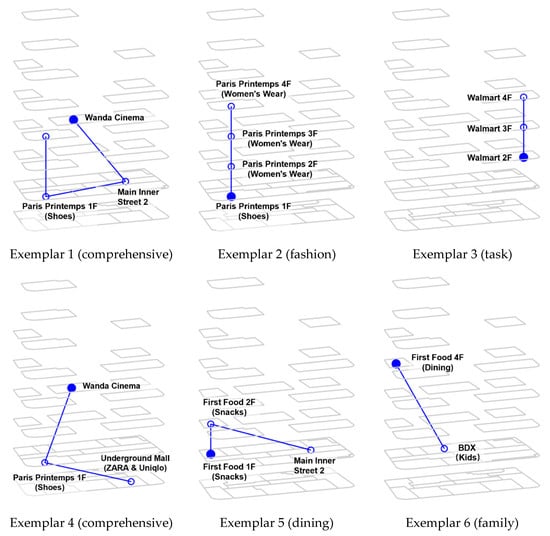
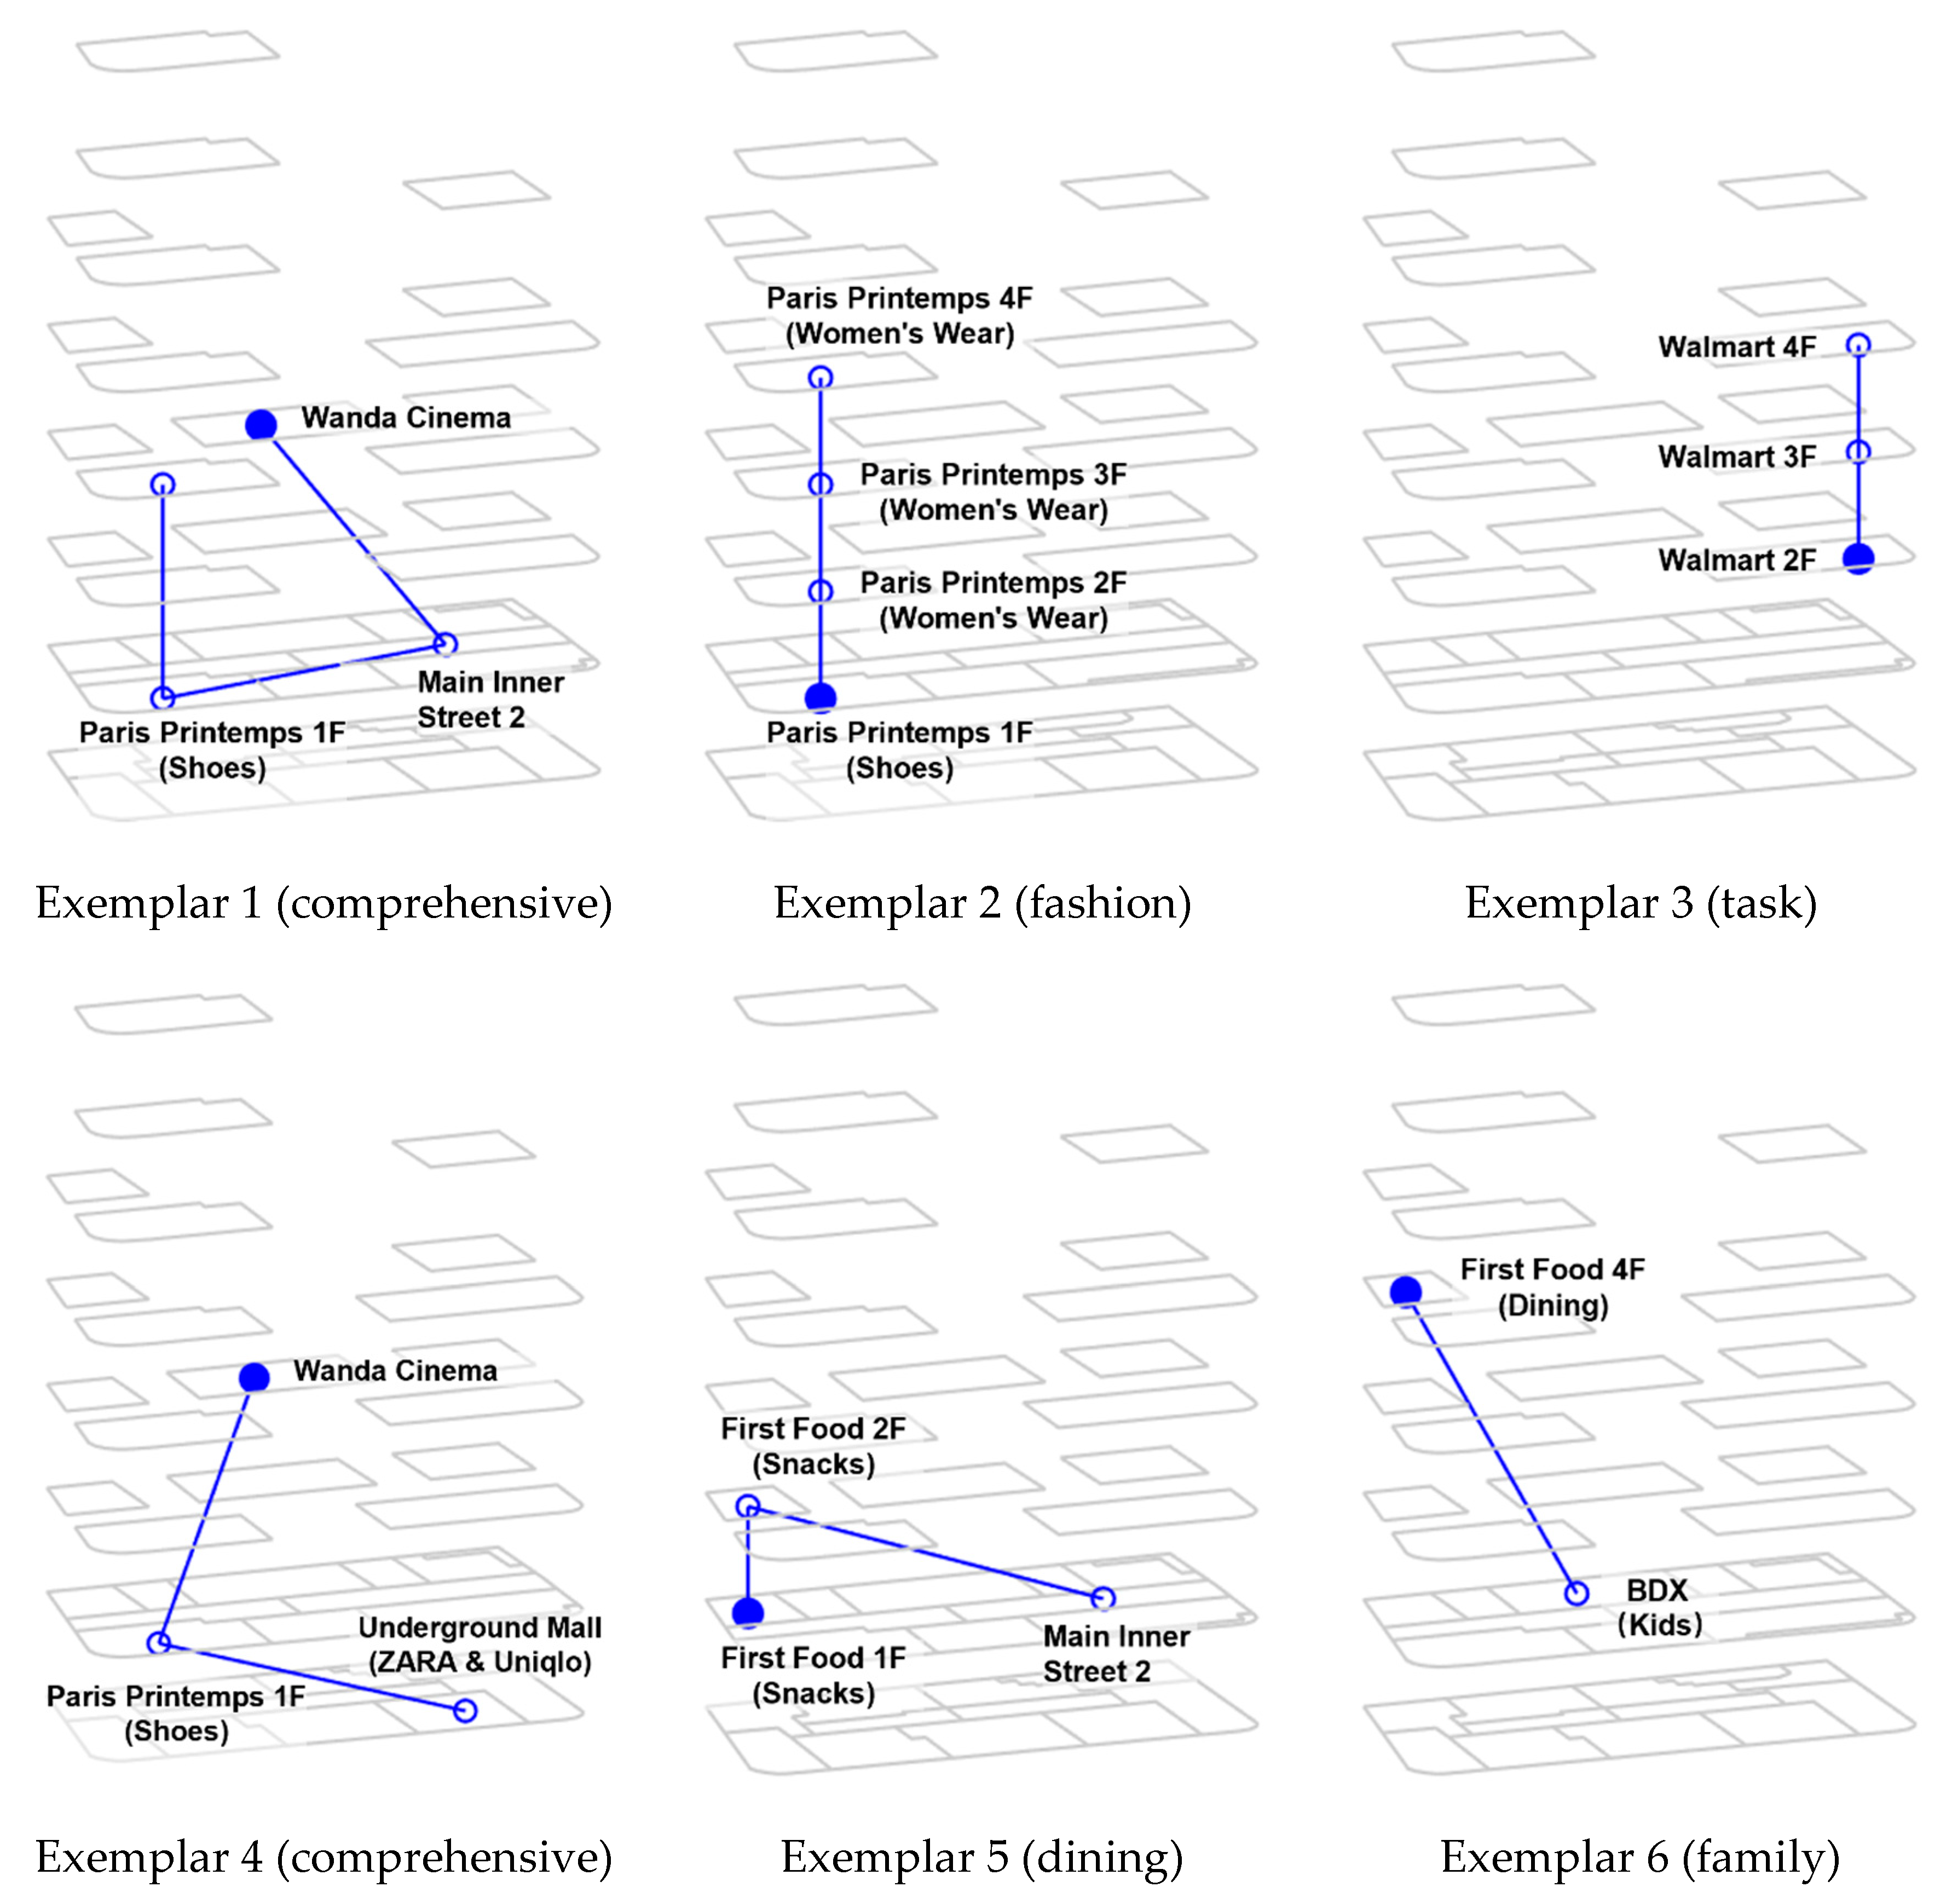
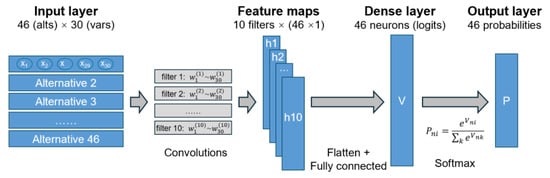
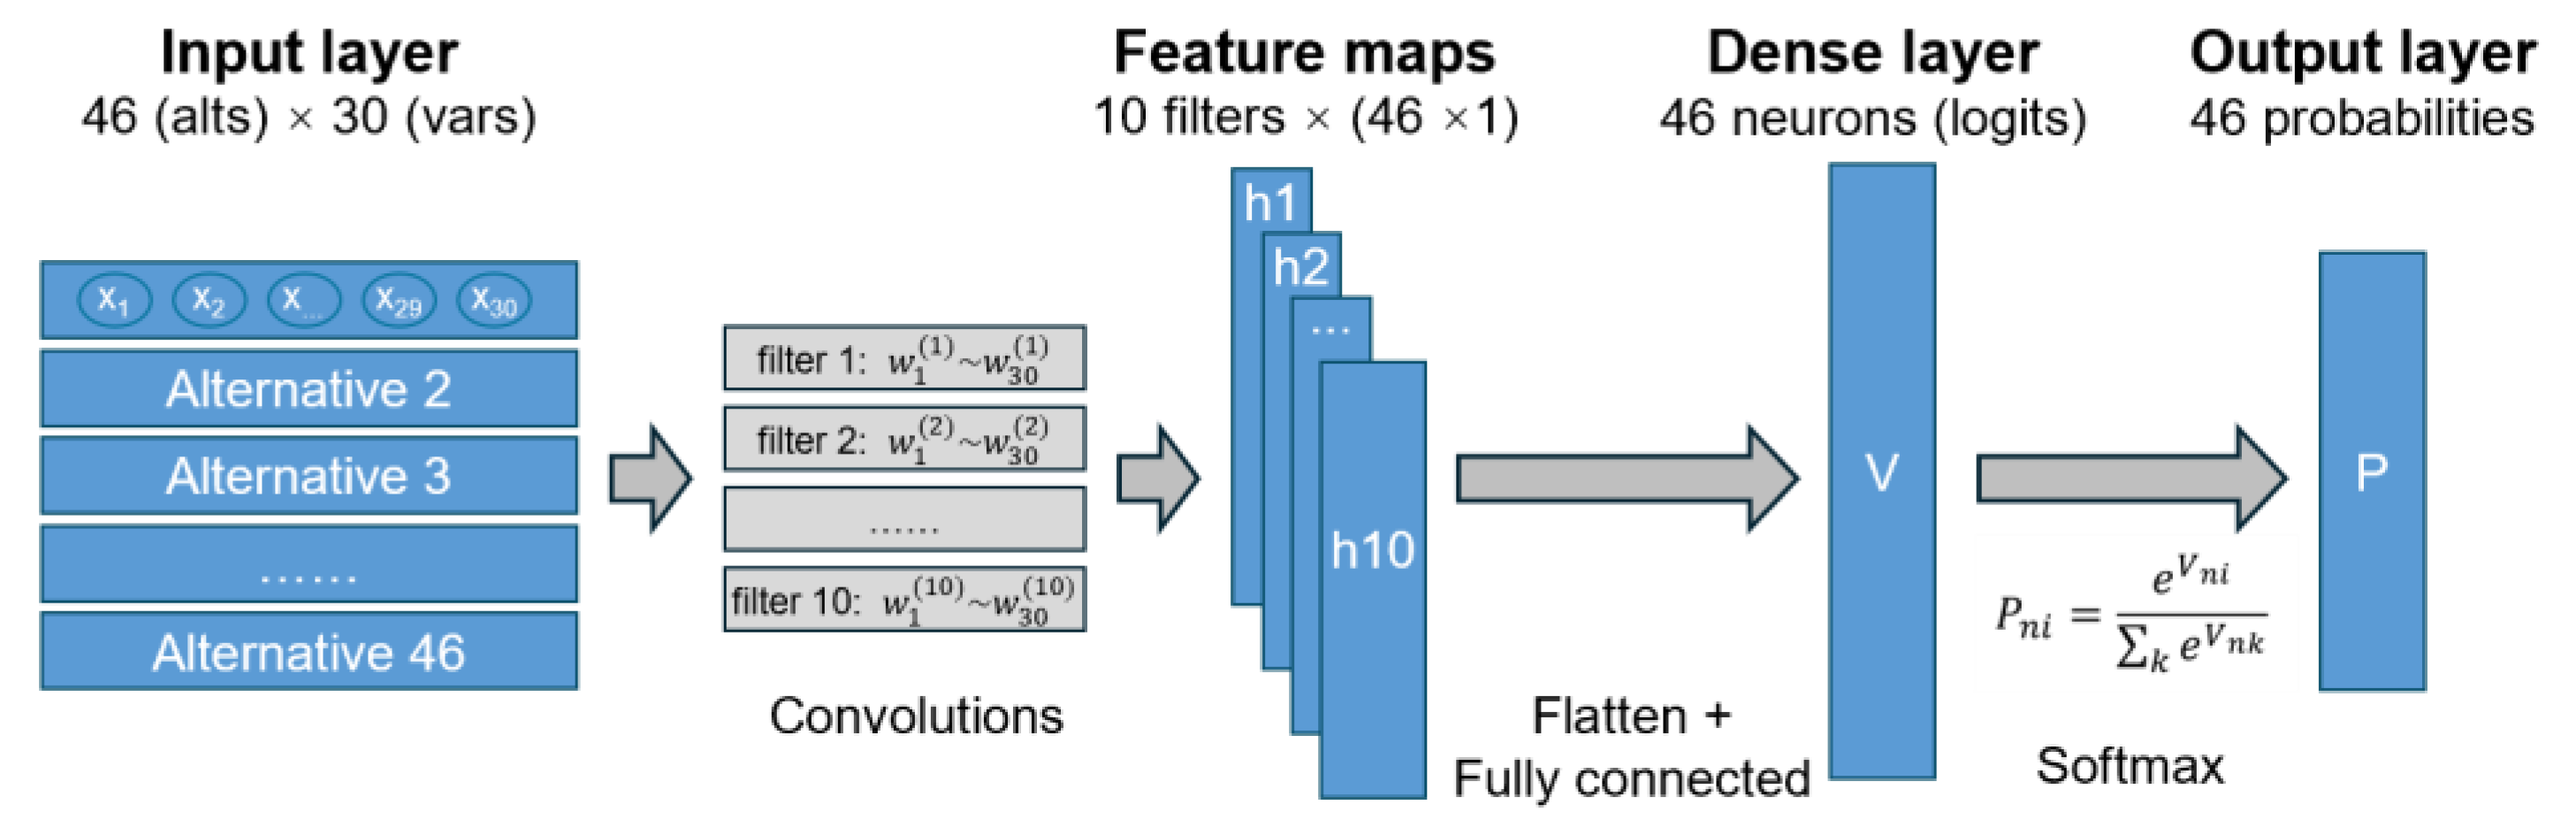
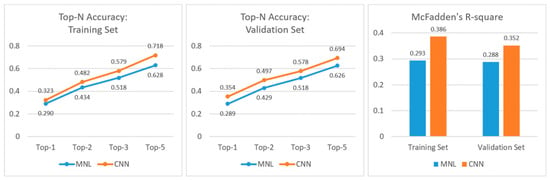
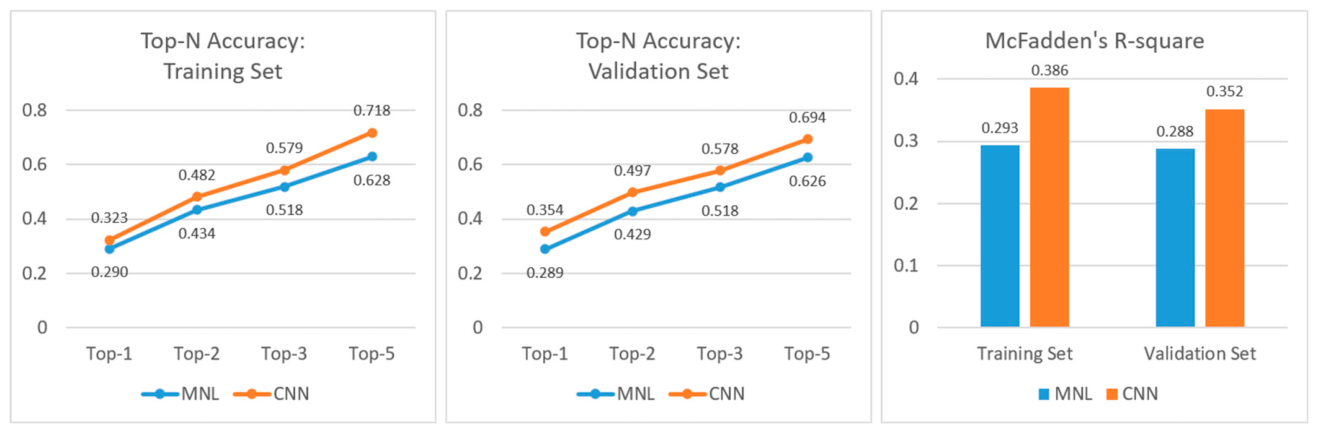
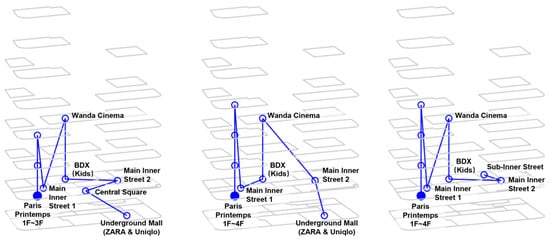
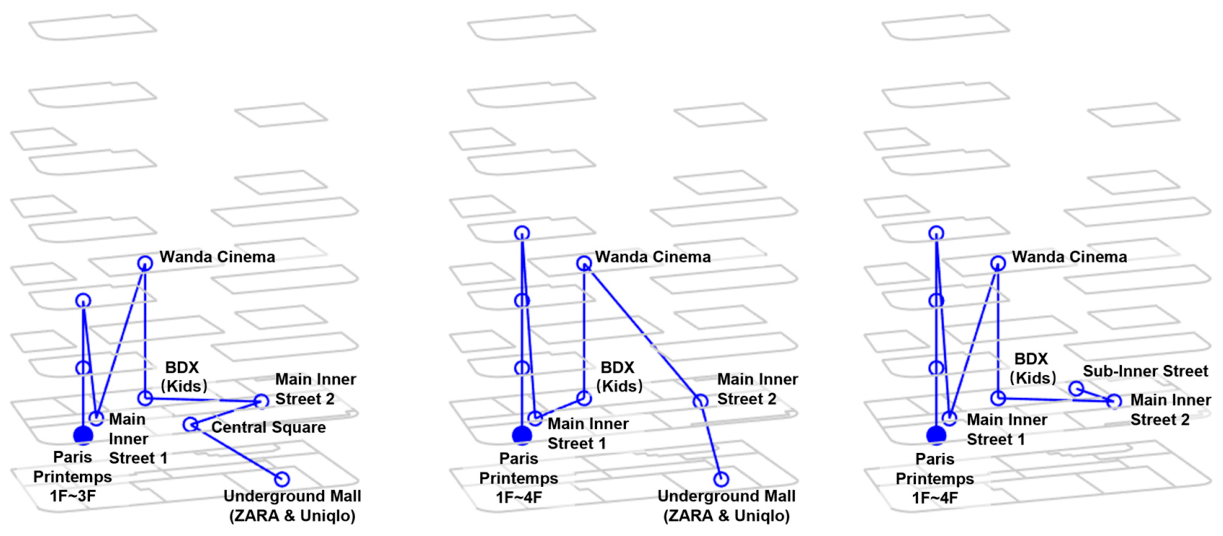
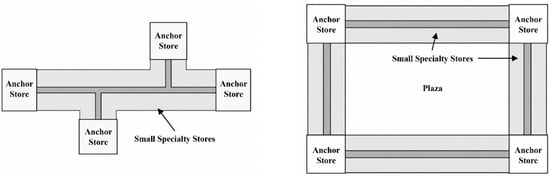
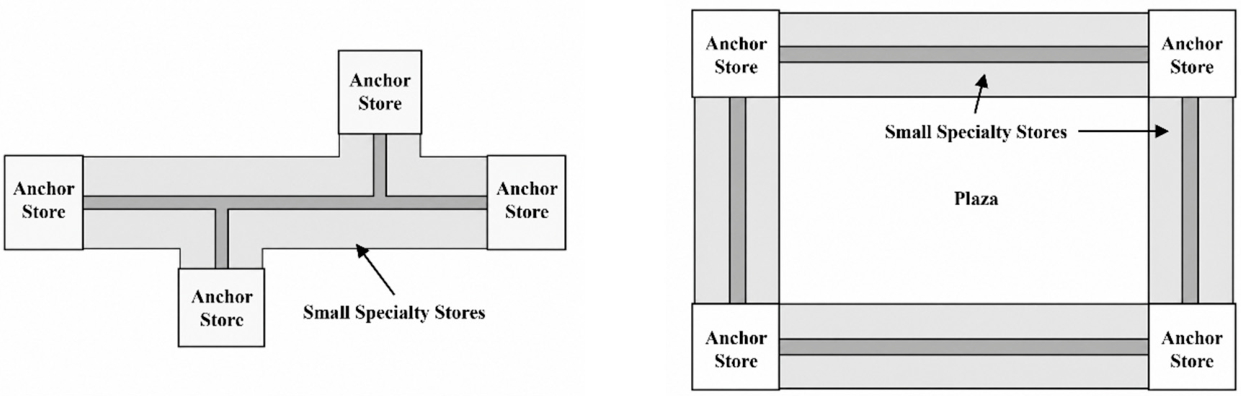

Disclaimer/Publisher’s Note: The statements, opinions and data contained in all publications are solely those of the individual author(s) and contributor(s) and not of MDPI and/or the editor(s). MDPI and/or the editor(s) disclaim responsibility for any injury to people or property resulting from any ideas, methods, instructions or products referred to in the content. |
© 2026 by the authors. Licensee MDPI, Basel, Switzerland. This article is an open access article distributed under the terms and conditions of the Creative Commons Attribution (CC BY) license.