


Abstract
To clarify the heating characteristics of the refrigerant direct condensing capillary pipe floor (CPF) used in an air source heat pump (ASHP), simulation studies were conducted. Based on a practical CPF structure with a pipe diameter of 3 mm, the heating characteristics of the condensing and superheated sections were simulated in a steady state. For the refrigerant condensing section, the heating parameters of floor surface temperature (FST) and heat flux (HF) are analyzed by considering different floor surface material, pipe spacing, room temperature, and condensing temperature. For the superheated section, possible solutions to reduce the high FST are the main concern. It is found that mean FST and HF generally increase with higher thermal conductivity of the surface material, smaller pipe spacing, higher condensation temperatures, and lower indoor temperatures. The results are arranged in linear diagrams, which can be referred to easily in the design and operation of the CPF system. Increasing the covering thickness is found to be more effective than increasing the pipe spacing to decrease the FST of the superheated section. Considering practical feasibility, increasing covering thickness with enlarged pipe spacing is recommended. The study provides comprehensive data of HF and FST under different CPF structures, which can be referred to to guide the application of this heating technique in ASHP systems.
1. Introduction
Space heating constitutes a dominant share of global building energy consumption and carbon emissions, driving international efforts towards renewable resources, energy saving and decarbonization. Reducing the energy use of heating systems has also become a key direction in the implementation of the “dual-carbon” strategy of China. Promoting the use of renewable energy in the heating system has become a consensus, in which heat pumps play an important role [1,2]. Among the various heat pump types, the air source heat pump (ASHP), which extracts heat from ambient air, has received widespread attention [3]. ASHPs are favored due to their advantages, including ease of installation, convenience of operation, low initial investment costs, etc. [4,5,6]. Recent studies have continued to advance ASHP technologies, with research focusing on defrosting performance prediction [7] and system modeling for low-carbon building applications [8]. Some papers provide a broader field for ASHP system modeling based on various approaches, which complement building energy simulation with fast transient prediction [9,10,11].
The indoor heating units of ASHP can be categorized as those using refrigerant and water, according to the heating medium. If refrigerant is used, the indoor heating unit is actually the condenser, which usually takes the form of a fan-coil unit, and the refrigerant heats the indoor air by forced convection during condensation [12]. This type of indoor unit is adopted mostly in small ASHPs. The indoor air can be heated quickly, but it also brings adverse effects such as a draft sensation, making occupants feel dry [13]. Another widely used type of terminal unit is the ducted forced-air system, in which air is heated and then distributed to the conditioned space via ducts. Such systems are very common in commercial buildings and large spaces. However, they also have drawbacks such as a noticeable draft, temperature stratification, and increased fan energy use [14,15,16]. For indoor units with a water circuit, there is a heat exchanger between the refrigerant loop and water loop. The refrigerant in the condenser transfers heat to the circulating water, which then heats the indoor air with an indoor unit of a fan coil, air-handling unit, radiator or radiant floor. The circulating water temperature of ASHP typically ranges from 35 °C to 45 °C depending on specific requirements for heating the water temperature. In well-insulated and energy-efficient buildings, a supply temperature as low as 35 °C is sufficient for radiant floor heating, which facilitates the application of floor heating and improvement of thermal comfort [17]. For such systems, the heat exchanger and pump in the water loop increase system complexity, operating maintenance work, and extra power use [18,19].
To simplify ASHP heating systems and enhance indoor thermal comfort, novel indoor heating units have been proposed in a few studies. In these studies, to avoid secondary heat exchange, maintain a steady thermal environment during defrosting, reduce the condensing temperature, and improve the coefficient of performance (COP), direct heating of refrigerant by various radiators and floor-heating copper pipes was proposed.
Zhang et al. introduced a heat-storage refrigerant radiator that directly delivers high-temperature refrigerant vapor to the radiator, which maintained comfortable indoor temperatures during defrost [20]. Shao et al. proposed a refrigerant-heated radiator coupled with an ASHP system [21]. The radiator consisted of two steel plates with copper pipes inside, and water filled the gap to store thermal energy. The convective heat transfer coefficient, heat flux (HF) of the radiator and COP of the system were analyzed [21]. Dong et al. presented a novel radiant–convective heating terminal coupled into the ASHP system [22]. The terminal mainly comprised a radiant panel, copper pipes and fins, an air fan, and an insulating layer constituted a series of air passages, which allow air to flow in and out. The refrigerant passing through the copper pipes transferred heat to the radiant panel and then to the indoor space in the form of radiation and natural convection. It also transferred heat to the fins and then to the indoor space in the form of forced convection by the fan. Therefore, this terminal heated the indoor space in the form of radiation and convection simultaneously [22]. Sun et al. studied a novel direct condensing ASHP system using thermal storage heat pipe radiators, and the thermal performance in radiators and operational behavior of the coupled system were assessed [19]. They stated that with integrated heat storage materials, the heat pipe radiator enhanced system performance and mitigated indoor temperature fluctuations during defrosting.
Ma et al. suggested a floor-heating coil with refrigerant flowing inside the pipes and studied the heat transfer performance of heating the floor by simulation [23]. Dong et al. conducted experiments to analyze the performance of ASHP integrated with solar energy for radiant floor heating by the refrigerant [24]. Niu et al. conducted experiments on a new ASHP with capillary direct floor heating, in which the vapor refrigerant condensed directly in the capillary pipes buried in the floor [25]. They gave the theoretical calculation equations of heat transfer by the capillary pipe floor (CPF). They also recommended the optimal CPF structure and operating parameters [25]. Wang et al. conducted a field measurement on an actual ASHP system using CPF in heating for a swimming building [26]. The indoor temperature, floor surface HF and floor surface temperature (FST), condensing temperature, and operating COP on typical days were analyzed [26]. With a mean condensing temperature of 38.8 °C, they reported that the mean FST was approximately 32.6 °C, and the floor HF ranged from 97 to 119 W/m2. They also found that the indoor temperature was not affected during the defrosting of ASHP due to the thermal inertia of the floor structure, which can still dissipate heat during defrosting. From their field test, the high heating capacity of capillary pipes led to overheating of the indoor environment sometimes. In addition, they found that the superheated refrigerant vapor discharged from the compressor caused high FST of approximately 60 °C in areas with dense branch pipes.
Among these studies, the CPF structure attracts more attention. This type of heating facility not only provides a comfortable indoor environment for radiant floor heating, but also maintains a stable indoor temperature by utilizing the floor’s thermal storage during the defrosting of ASHP. Additionally, it has the potential to decrease the condensation temperature and improve the COP of ASHP. Both experimental and numerical studies have been conducted for this system. Although current studies have contributed valuable insights into the CPF heating terminals of ASHP, several critical gaps still remain. First, the structure of CPF pipes proposed in the references [23,24,25] was not the same as that used in practical applications [26]. The capillary pipe diameters used in previous numerical and laboratory studies (ranging from 5 mm to 60 mm) are larger than those used in practice (3 mm), raising questions about the applicability of these findings to actual systems. Secondly, reference [23] focuses on the effects of pipe diameter, spacing, flooring material on surface HF without reporting the FST, while reference [25] focuses on the transient process during starting and its effects on indoor FSTs and ASHP heating capacity under difference outdoor temperatures without stating the surface HF. A comprehensive analysis covering both FST and HF under varying condensing temperatures, pipe spacings, floor materials, and room temperatures is still lacking. In addition, these studies mainly focus on the condensing heat transfer process of CPF, and none of them addressed the influence of superheated vapor section. It is necessary to propose practical solutions to mitigate the high FST issue in the superheated section.
Building upon these gaps, referring to the CPF configuration from reference [26], CFD models will be developed for the condensing and superheated sections. For the condensing section, the effects of refrigerant condensation temperature, room temperature, pipe spacing, and floor surface materials on FST and HF are simulated systematically, with the aim to present quantified data for the CPF terminal. For the superheated vapor section, measures of increasing pipe coverage thickness and pipe spacing will also be investigated to give possible solutions to reduce FST. The results will offer a better understanding about the direct condensation CPF coupled with the ASHP system. The data can also be referred to in the design of such systems to avoid overheating, and in adjustment of the ASHP unit to adapt to this new heating floor.
2. CFD Modeling and Validation
2.1. Floor Model and Simulation Settings
In reference [26], the details about direct condensation CPF, ASHP, and the building were introduced. The CFD model in this study was developed and validated based on field measurement data from this study. To get a better understanding of the system, general information about the building and ASHP is introduced first. Inside the building, there were family-friendly swimming facilities with swimming pools, a playing zone, showering room, waiting room, etc., which were all located on the ground floor. The total area was approximately 2000 m2. Five independent ASHP (Version R19.0 and 2021 R1, ANSYS Inc., Canonsburg, PA, USA) units utilizing R410a refrigerant were installed; each had a rated heating output of 18 kW and rated input power of 5.83 kW.
Introduction of CPF System in Field Test
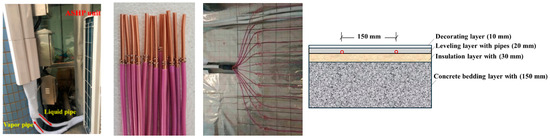
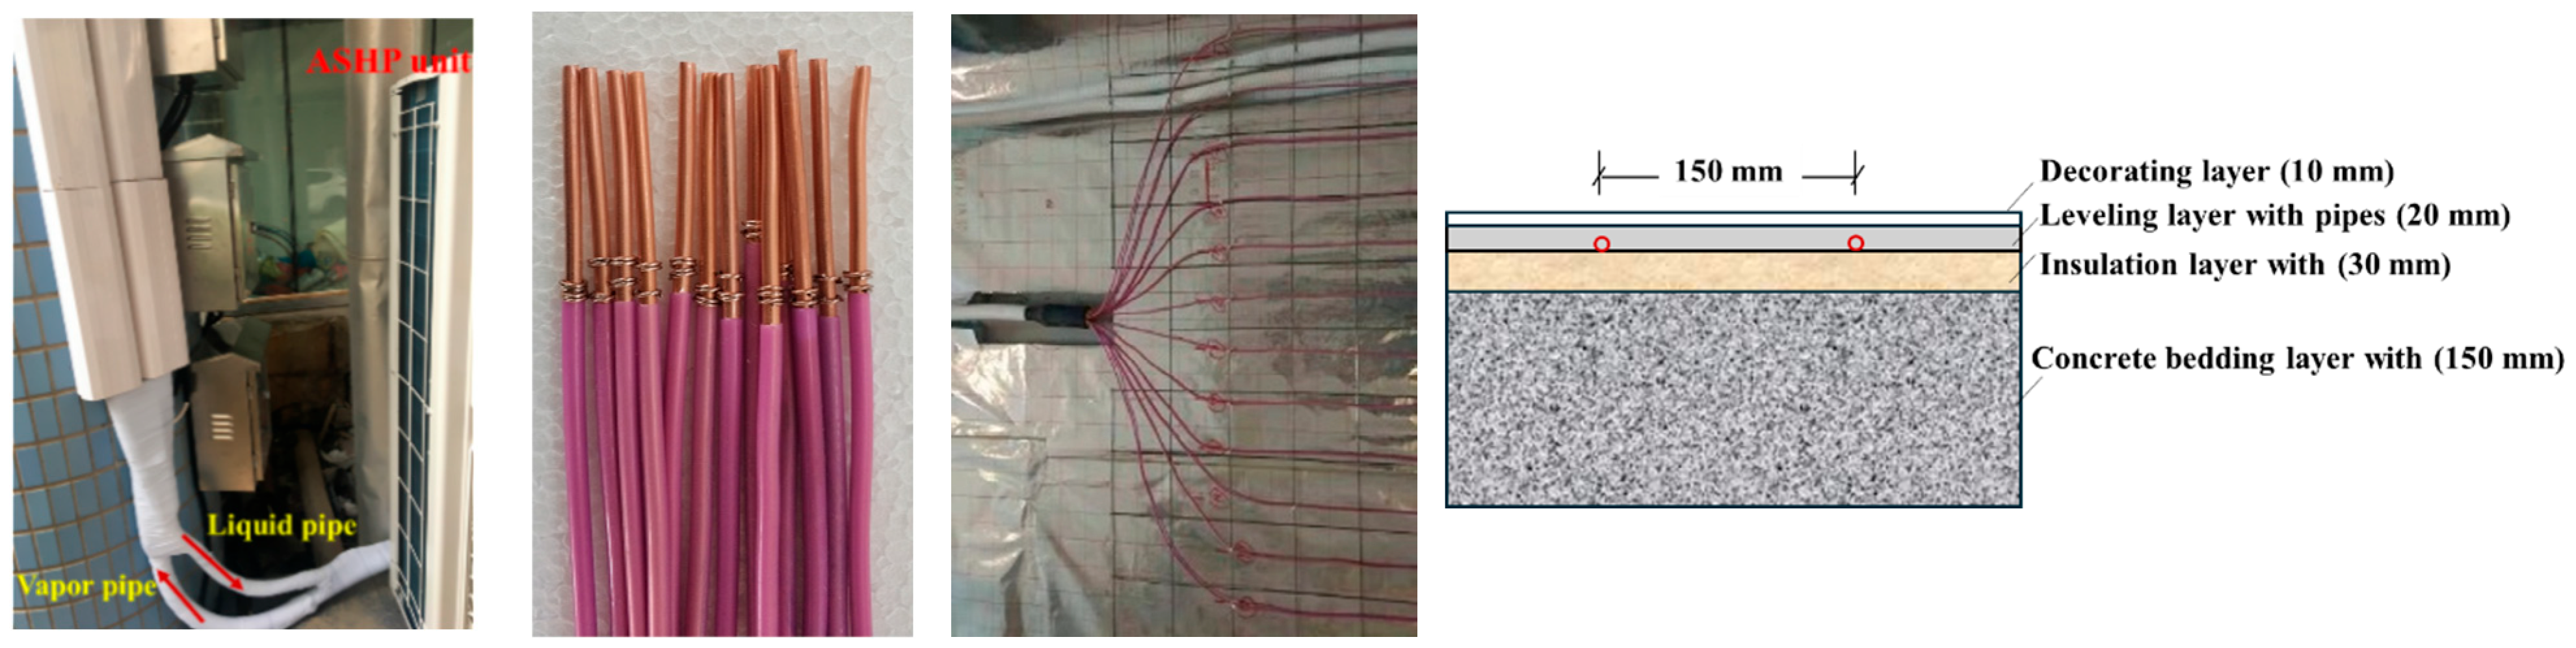
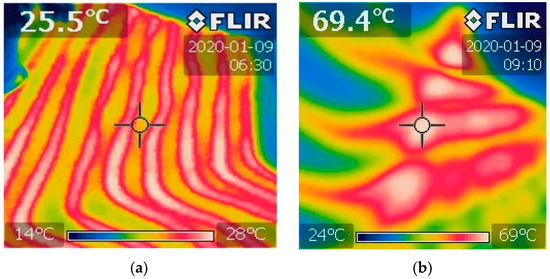
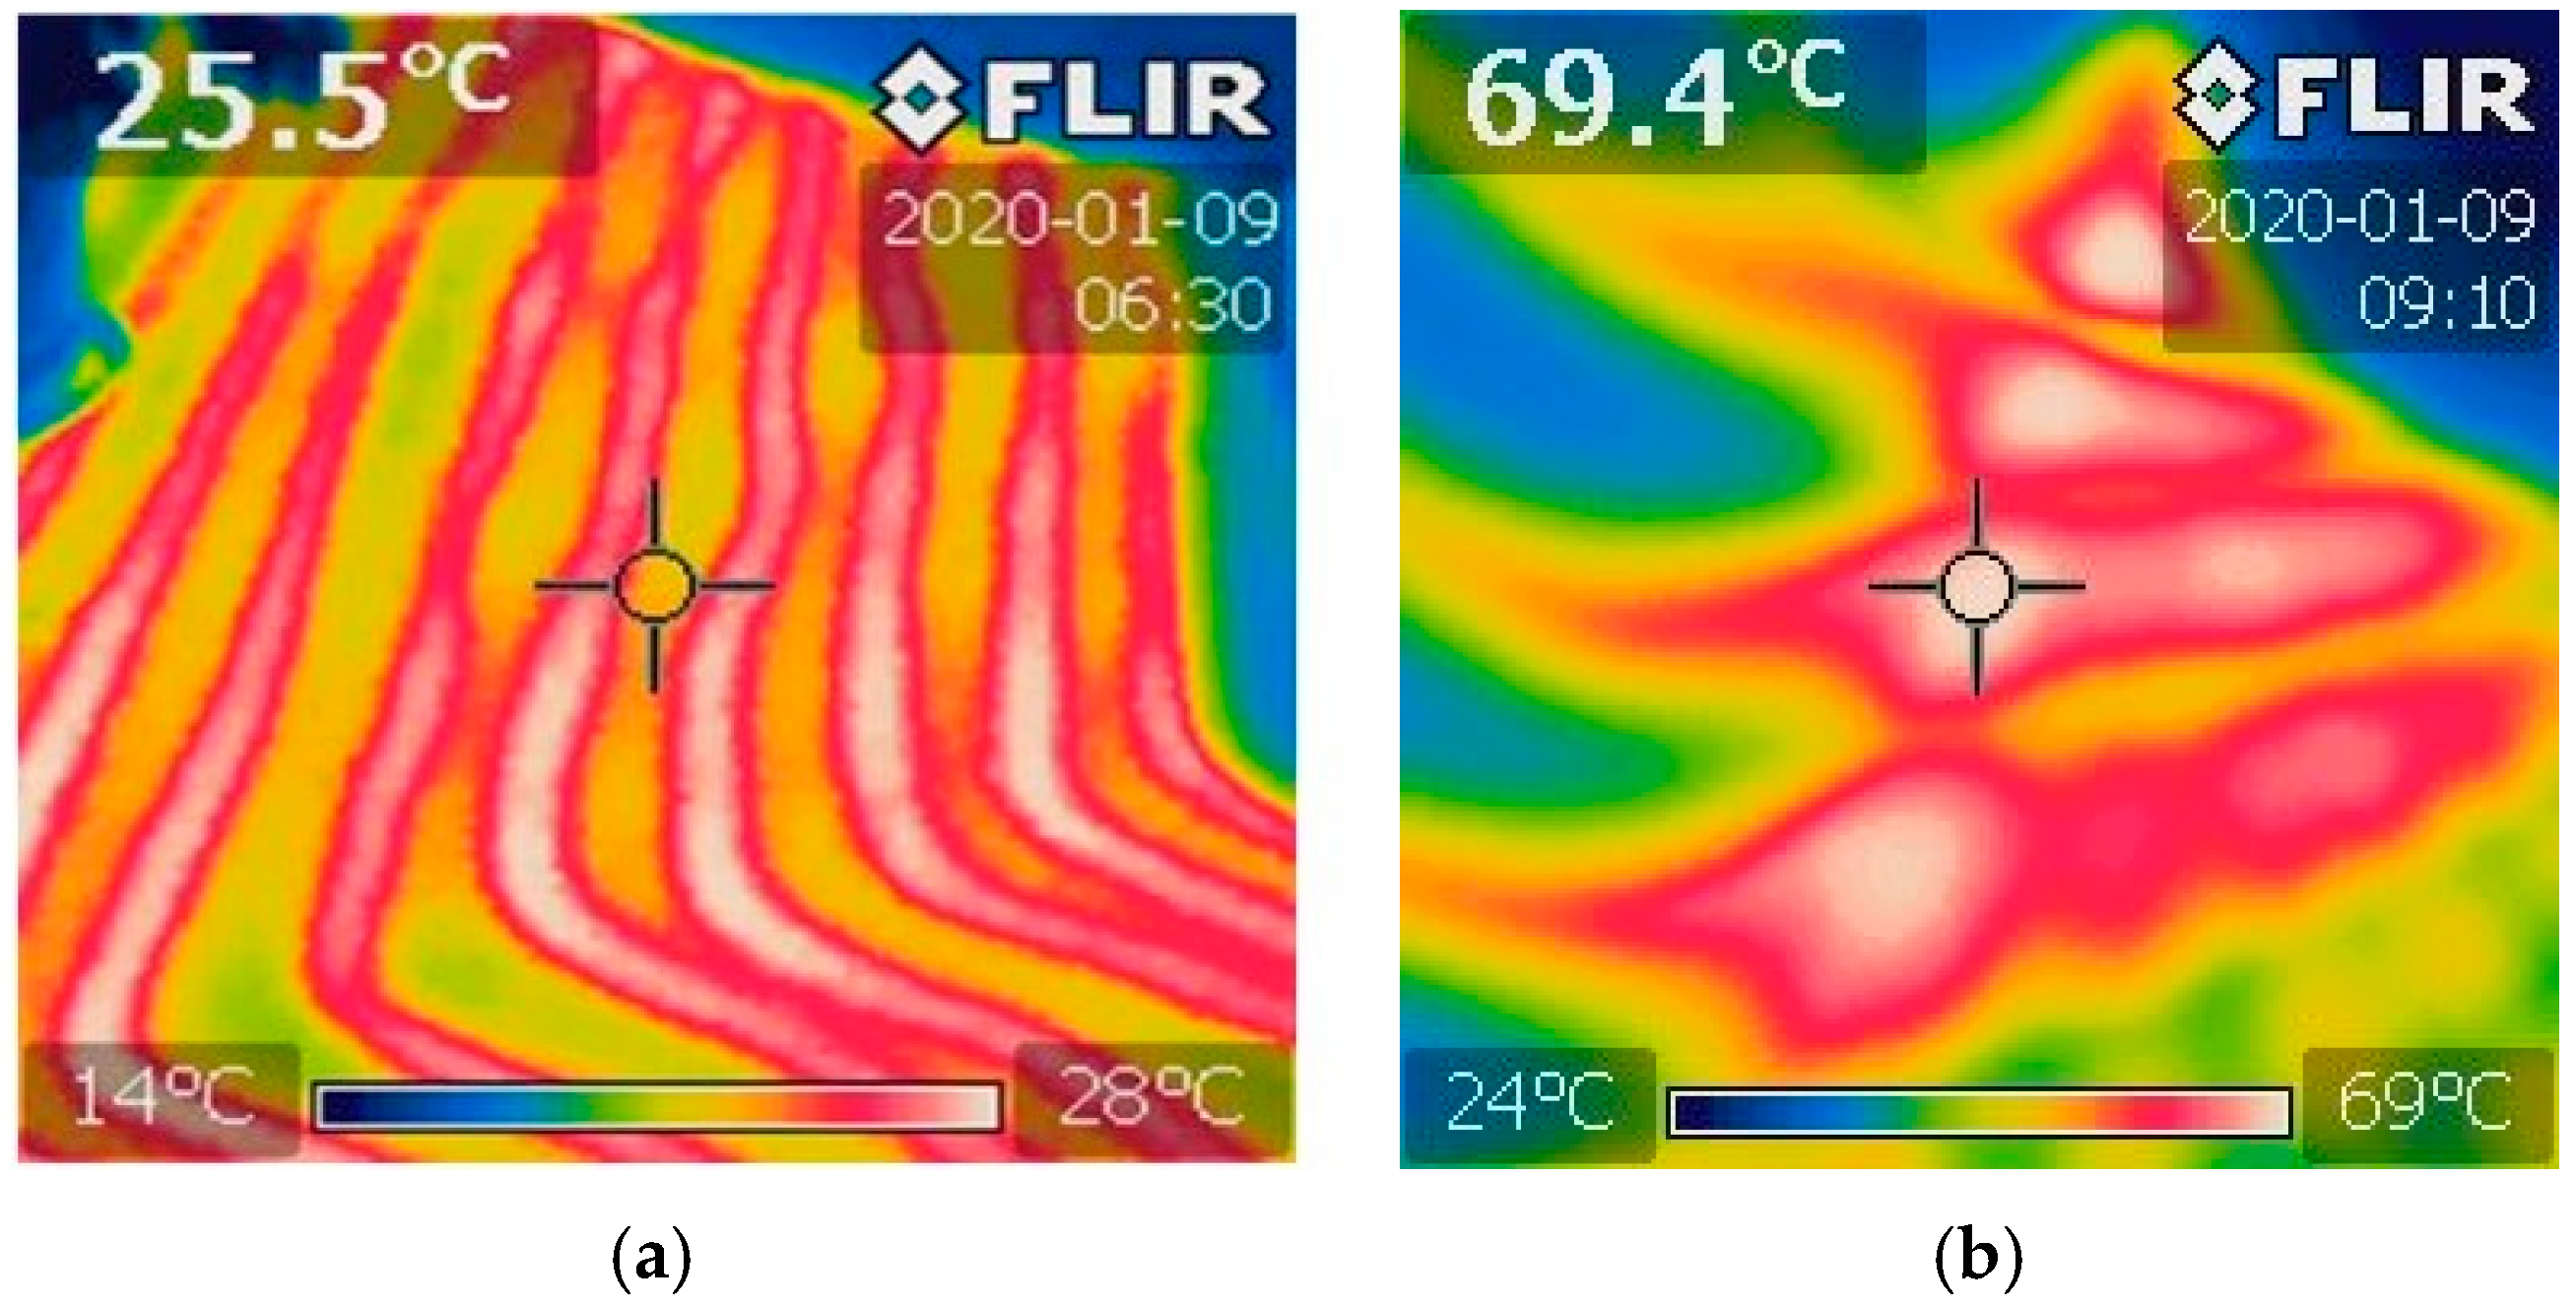
The copper capillary pipe had an outer diameter of 3 mm and an inner diameter of 2 mm. Plastic film was applied outside the pipes to protect them from corrosion by floor materials. The film was made of modified PE (Polyethylene) material to strengthen its durability and thermostability, and the thickness was 0.2 mm. Each ASHP unit was connected with 12 capillary pipe circuits by branch joints. Each circuit measured 19 m in length and the total length of the capillary pipes was 228 m for an ASHP unit. The CPF primarily consisted of a concrete bedding layer (150 mm), insulation layer (30 mm), leveling layer (20 mm), and decorative layer (muti-layer PVC (Polyvinyl chloride) of 10 mm). The spacing of the pipes was 150 mm. Pictures of the ASHP unit, capillary pipes, branch joint and the structure of the floor are shown in Figure 1.
Figure 1.
ASHP, capillary pipes and floor structure.
In the field test, the floor temperature was monitored by an infrared camera (FLIR i5, FLIR Systems Inc., Wilsonville, OR, USA). The measurement range of the device is −20 °C to +250 °C, and the accuracy is ±2% of the indicated temperature. The infrared images of the condensing area and superheated vapor section are shown in Figure 2. For the condensing section, the FST exhibited a regular and uniform distribution, with higher temperatures at the corresponding pipe positions and slightly lower temperatures between the pipes. The overall FST ranged from 25 °C to 28 °C. In the superheated section, the maximum FST reached up to 69.4 °C, and the mean FST was approximately 46 °C, which exceeded the maximum temperature limit of FST.
Figure 2.
Infrared images of field test. (a) Condensation section and (b) superheated section.
The indoor air temperature was set to 24 °C during opening hours (from 9:00 to 18:00) and 18 °C during closing hours [26]. During a typical day field test, both the indoor and outdoor air temperature and relative humidity (RH) were recorded, while the floor surface HF, FST, supply and return refrigerant temperature, and ASHP power use were measured. The outdoor temperature was in the range of 0 °C to 4.4 °C, and RH in the range of 40% to 80%. It was found that the indoor air temperature became higher than the set value during 10:00–16:00, and the maximum value reached 25.4 °C. With a lower indoor temperature during night, the HF of floor surface ranged between 30 W/m2 and 60 W/m2, which increased quickly during working hours and stabilized between 97 W/m2 and 119 W/m2. Due to the higher indoor temperature during working hours and the floor’s thermal storage capacity, the ASHP operated for only a brief period during the night, specifically between 3:00 and 5:00. The average refrigerant temperature supplied to CPF was approximately 55 °C, while the return temperature from CPF ranged from 23 to 25 °C. During working hours, the refrigerant supply temperature increased to approximately 65–80 °C, with the return temperature in the range of 35–40 °C. The FST was about 21–23 °C at night, which rose to 26–33 °C during daytime. The calculated COP of ASHP was in the range of 2.07–2.91 with a mean value of 2.52.
From the field test, the CPF system releases higher HF from the floor surface, which can easily lead to a higher indoor temperature and FST. Moreover, both the superheated vapor and compensated refrigerant temperature are significantly influenced by the setting of the indoor temperature, thereby affecting the FST and HF. Clarifying the characteristics of FST and HF under different condensation temperatures is important for both the design and operation of the CPF system. Meanwhile, this should also be considered across various CPF configurations, including floor surface material, room temperature, pipe spacing, etc. In addition, the problem of an excessive FST in the superheated section of CPF should also be solved effectively.
The heat transfer of the condensing and superheated sections should be studied separately. The heat transfer process in the CPF primarily involves the convective and condensation heat exchange between the refrigerant inside the pipes and the wall of capillary pipes, thermal conduction through the wall of pipes, thermal conduction through the floor layers, and convective and radiative heat dissipation from the floor surface to the heated room.
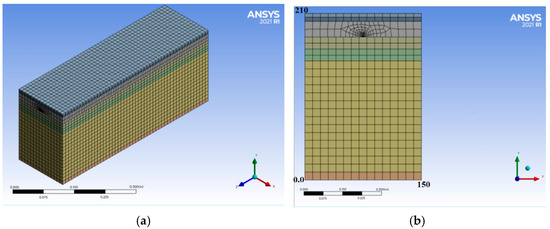
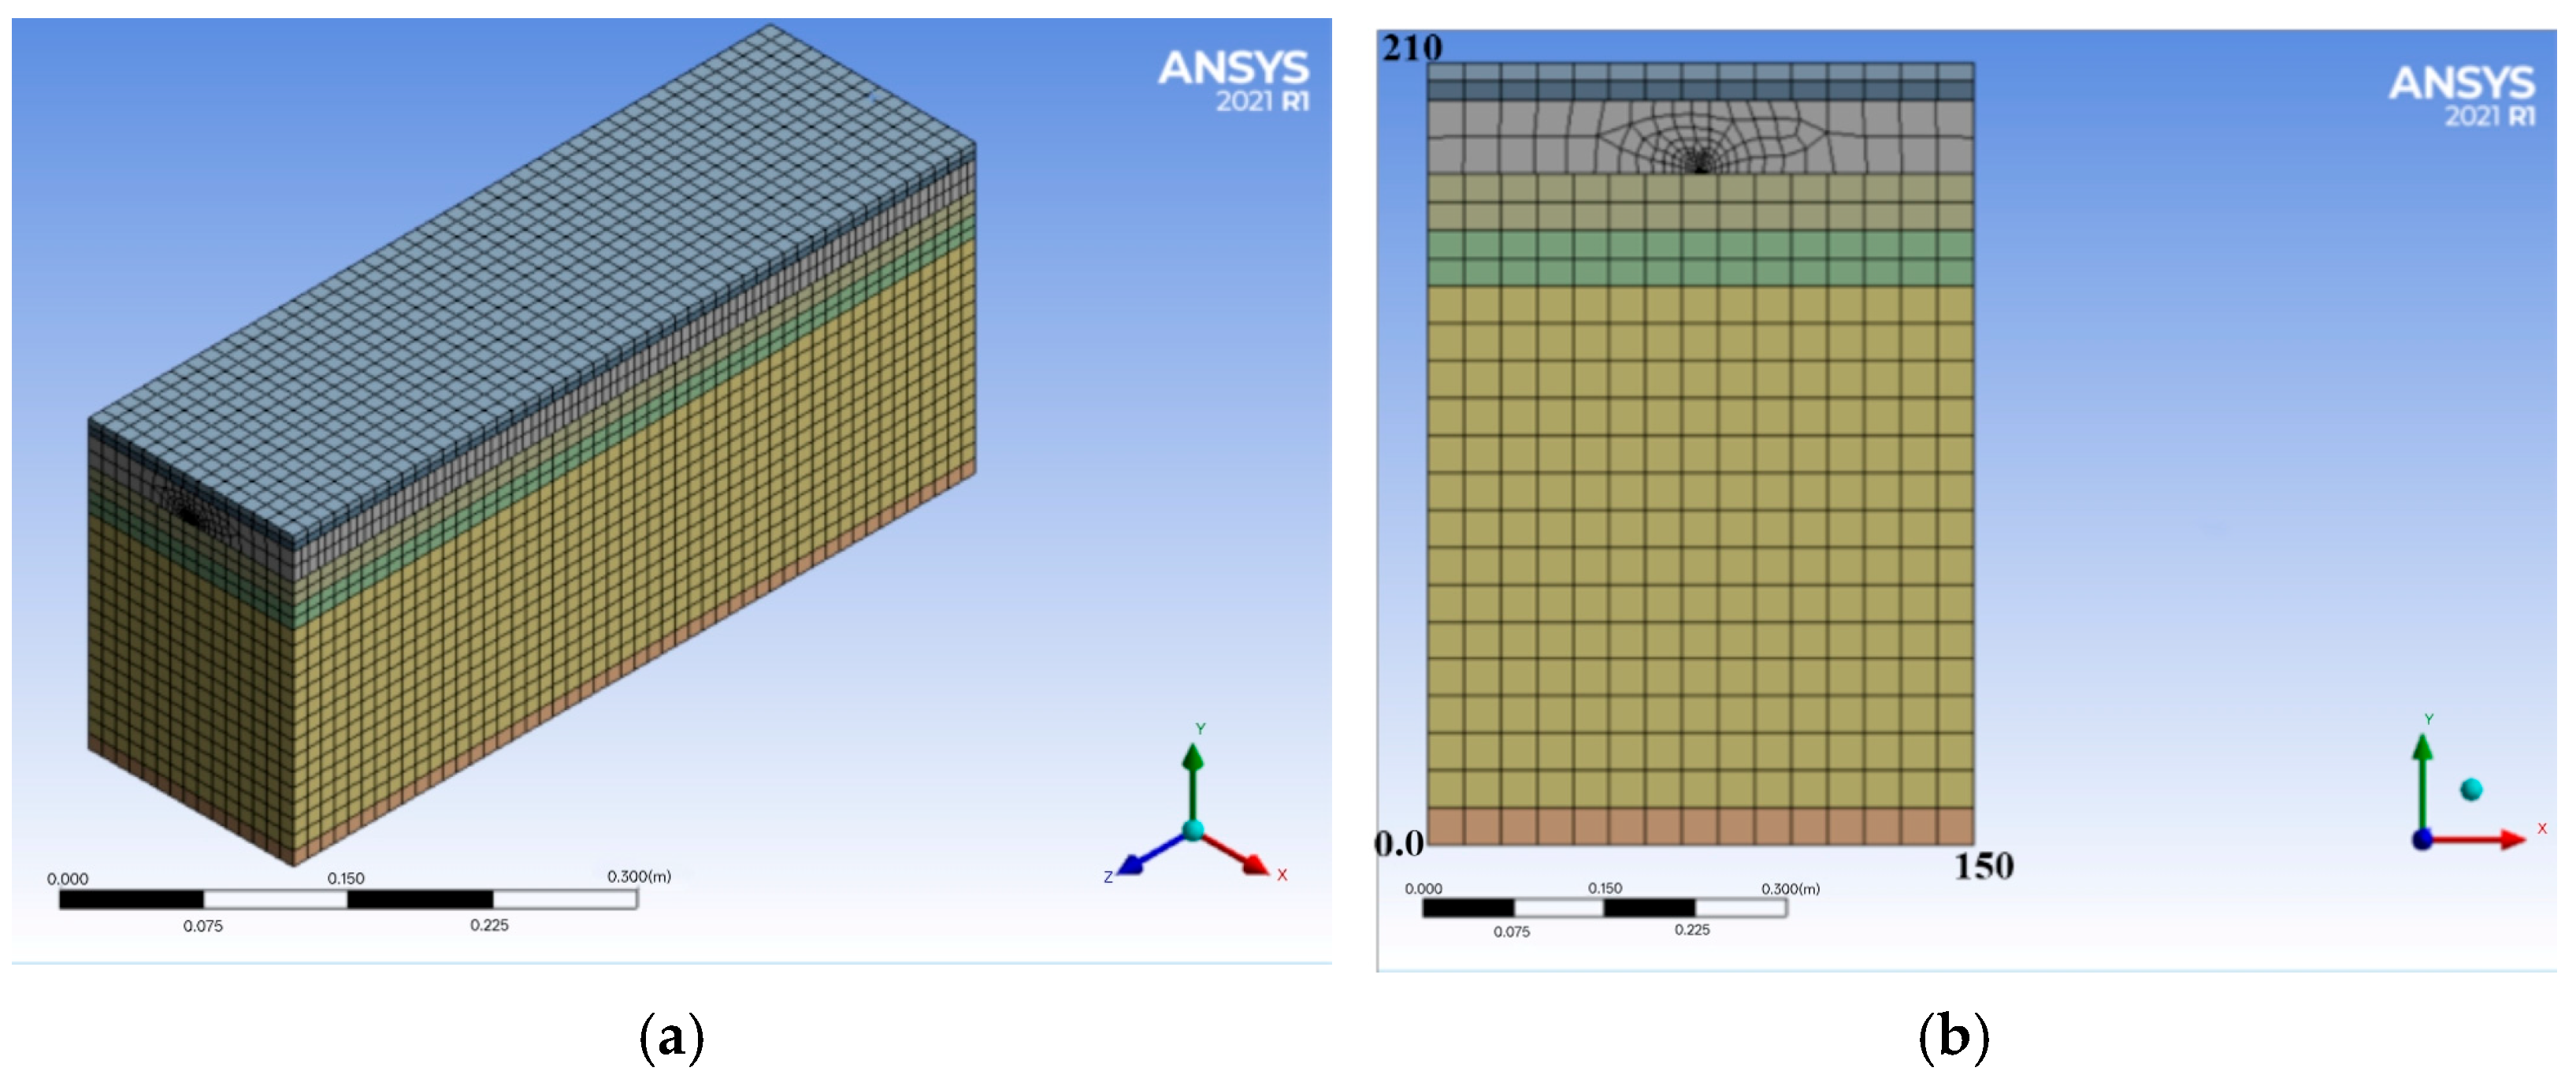
In simulation, establishing a CPF heat transfer model for the entire floor system would involve excessive computational resources and have risks of not converging. Considering the symmetric distribution of pipes and the constant refrigerant temperature during condensing, a small-sized CPF model containing one capillary pipe was built up with ANSYS (Version 2021), which is shown in Figure 3. The CPF model was 150 mm in width, 210 mm in height, and 500 mm in length. Copper has a high thermal conductivity, making its thermal resistance negligible. In the model, the thermal resistance of the pipe wall was primarily attributed to the plastic film. To simplify the model, a pipe with diameter of 2 mm and wall thickness of 1.2 mm was set. The thermal conductivity resistance of the pipe wall was set considering the thermal conductivity of copper and PE, which is shown in the following equation.
where Rpipe is the total wall resistance of copper pipe and PE film, (m·k)/W; λcopper and λPE are the thermal conductivity coefficients for copper and PE, respectively, and (m·k)/W; din, dout, and dPE.out are the inner and outer diameters of copper pipe and the outer diameter of PE film, in mm. The thermal capacity and density of the pipe wall were calculated based on the volume ratio of the two materials.
Figure 3.
CPF Model. (a) 3D view and (b) cross-section view.
Hybrid mesh was employed with the solid and fluid domains meshed separately. The total number of mesh nodes was 42,397, and the number of elements was 31,538. A mesh check was conducted to ensure the meshing quality. A mesh independence study was also conducted to ensure that the simulation results were independent of the mesh size.
The thermal parameters of the materials were set in the model, which are listed in Table 1.
Table 1.
Thermal parameters of materials in the CPF model.
In this study, the steady heat transfer process was considered. To simplify the simulation process, the following assumptions were made for the CPF model:
- (1)
- The material properties of each layer in the floor structure were assumed to be uniform and constant; and the contact thermal resistance between layers was neglected.
- (2)
- The convective heat transfer coefficient inside the pipe was quite large during condensing, and the inner pipe wall temperature was assumed to be the same as the refrigerant.
- (3)
- The temperature between adjacent pipes was symmetrically distributed along the central cross-section, and the central cross-sections were considered as adiabatic surfaces.
- (4)
- The bottom of the floor was well insulated, and was taken as an adiabatic surface.
- (5)
- The floor surface was assumed to be unobstructed, ignoring the obstruction to heat transfer caused by floor furniture.
The upper surface of the radiant floor was subjected to a combined convective–radiative heat loss boundary condition to the conditioned room. In the numerical implementation (without an explicit air domain), the radiative temperature was linearized and incorporated into a synthesized convective heat transfer coefficient, which was applied as a convection boundary with a free-stream temperature (room air temperature). Therefore, heat transfer from the floor surface is calculated with the following equation [23,25]:
where q is the floor surface HF, W/m2; tw is the FST, °C; tn is indoor air temperature, °C; and htot is synthesized convective and radiative heat transfer coefficient, W/(m2·K). Niu et al. set the htot to 8.7 W/(m2⋅K) in their study [25]. According to results of Ma et al. [23], the htot was approximately 10 W/(m2⋅K). Referring to [27], the htot is in the range of 10 to 10.5 W/(m2⋅K), which changes slightly with room temperature and FST. In the modeling, htot was set differently considering the emissivity of different surface materials [28], which was generally in the range of 10 to 10.5 W/(m2⋅K).
For the simulation of the condensing process in the model, referring to assumption (2) in the CPF model, the constant inner wall temperature, the same as that of the refrigerant, was set. For the simulation of superheated vapor refrigerant flowing in the model pipe, the velocity inlet was set based on a theoretical calculation, in which data from the field test was referred to. These data included the inlet and outlet refrigerant pressure and temperature of the compressor, and the total supplied heating of the ASHP unit. The thermal parameters (enthalpy and specific volume) of the refrigerant were determined using an R410a pressure-enthalpy chart. The heating capacity per unit mass was decided, and the refrigerant circulation flow rate was calculated. Then, the inlet flow velocity for the capillary pipe was determined based on the total flow area.
For the condensing section, the steady-state heat conduction equations were applied due to the constant wall temperature setting. For the superheated section, refrigerant flowing inside the pipe, the heat transfer was modeled as steady incompressible flow; outside the pipe, the heat transfer was governed by steady-state heat conduction within the floor structure. In this study, the details of governing equations (mass conservation, momentum, and energy equations) and the boundary condition settings were similar to those used in references [23,25,29], which would not be presented anymore.
2.2. Validation of Model
In the field test [26], the room temperature was kept at approximately 24 °C, and the measured superheated vapor temperature ranged from 75 °C to 81 °C, corresponding to condensing temperatures from 35 °C to 41 °C. For model validation, a relatively stable operating period (10:00–12:00) was selected, during which both the indoor air temperature and the condensing temperature remained nearly constant. The measured data at 11:00 were used for the validation, which corresponded to superheated vapor temperature of approximately 80 °C, and condensation temperature of 41 °C. Given that the superheated section length may exceed 500 mm, the simulation process begins with the 500 mm model. The output data from the previous calculation were then used as the inlet condition for subsequent simulations until the refrigerant temperature dropped to the condensing temperature (41 °C). For the refrigerant vapor condensing section, the 41 °C condensing temperature was set. The room temperature was set to 24 °C according to a field test. The simulated FSTs were compared with those measured in Figure 4 and Figure 5.
Figure 4.
Comparison of FST in superheated section. (a) Simulation; (b) measured; and (c) comparison.
Figure 5.
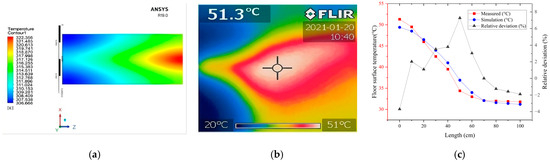
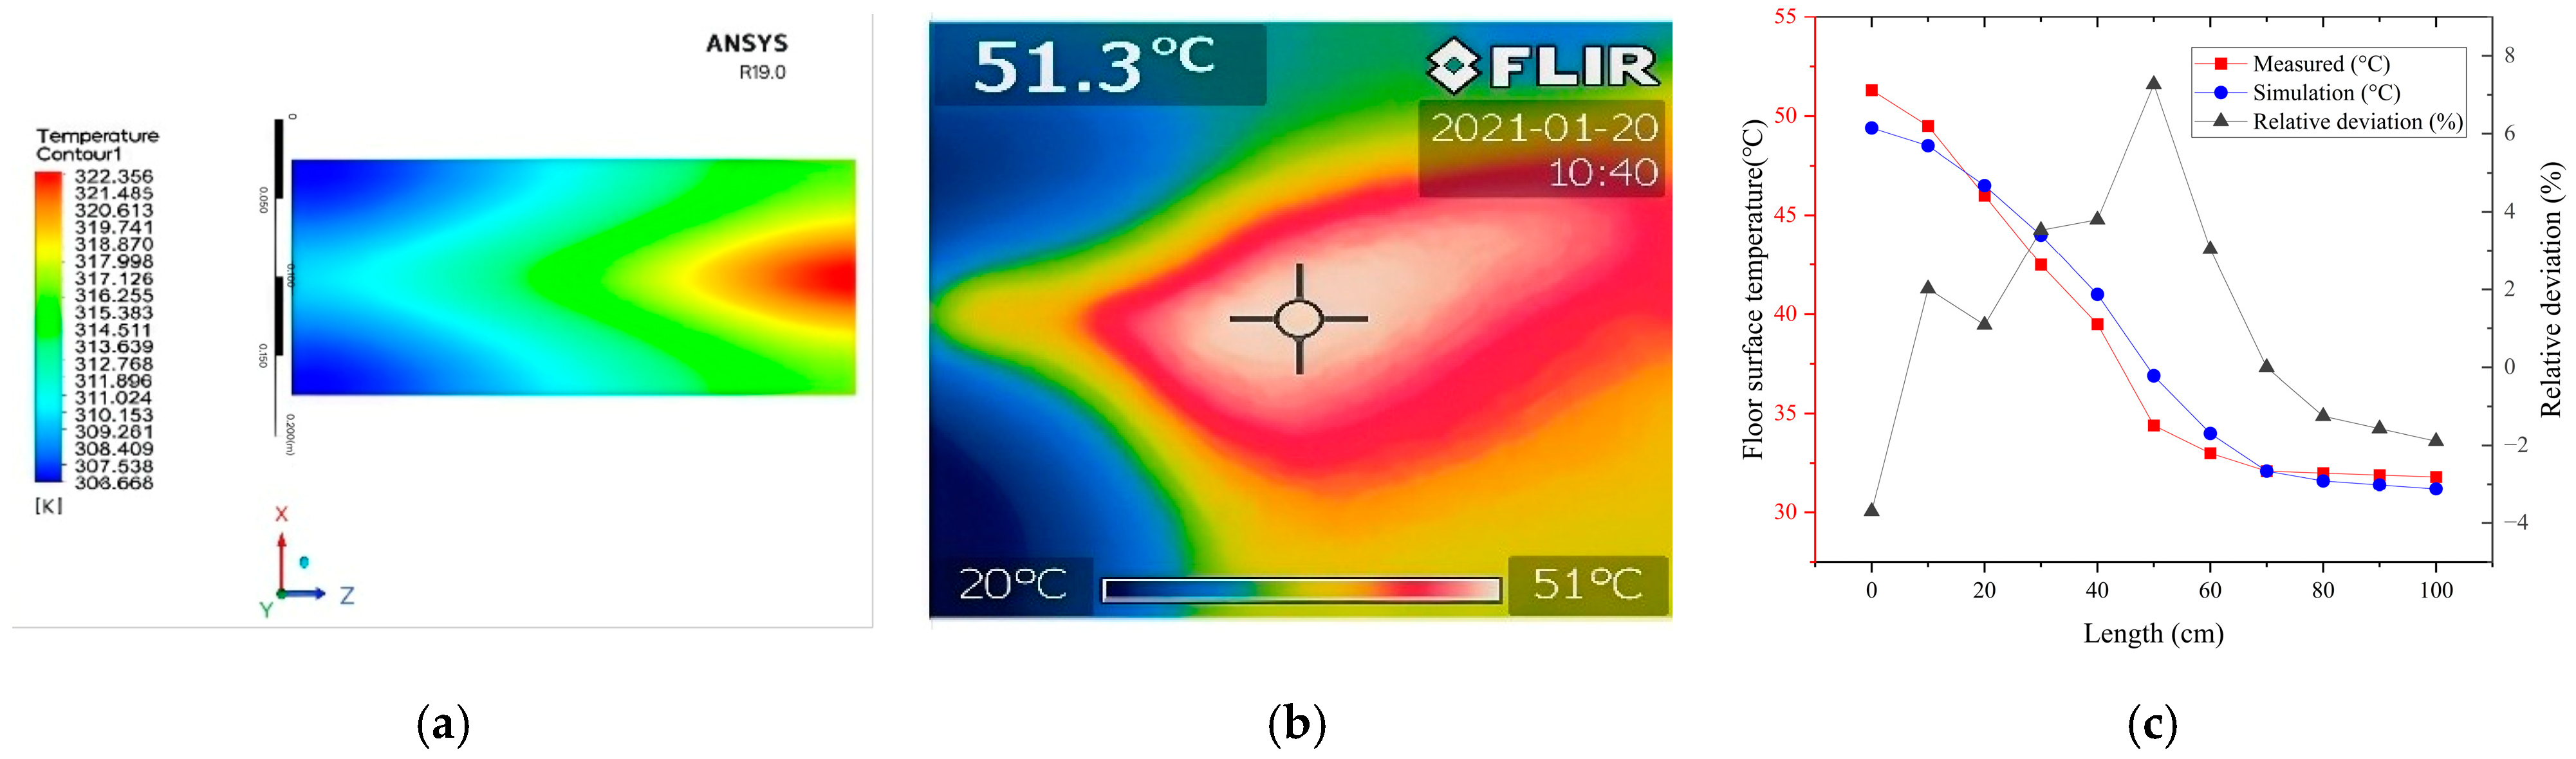
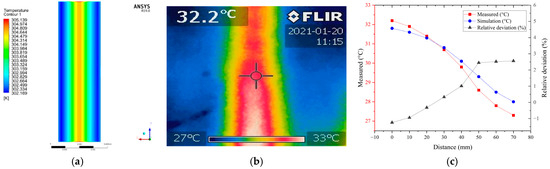
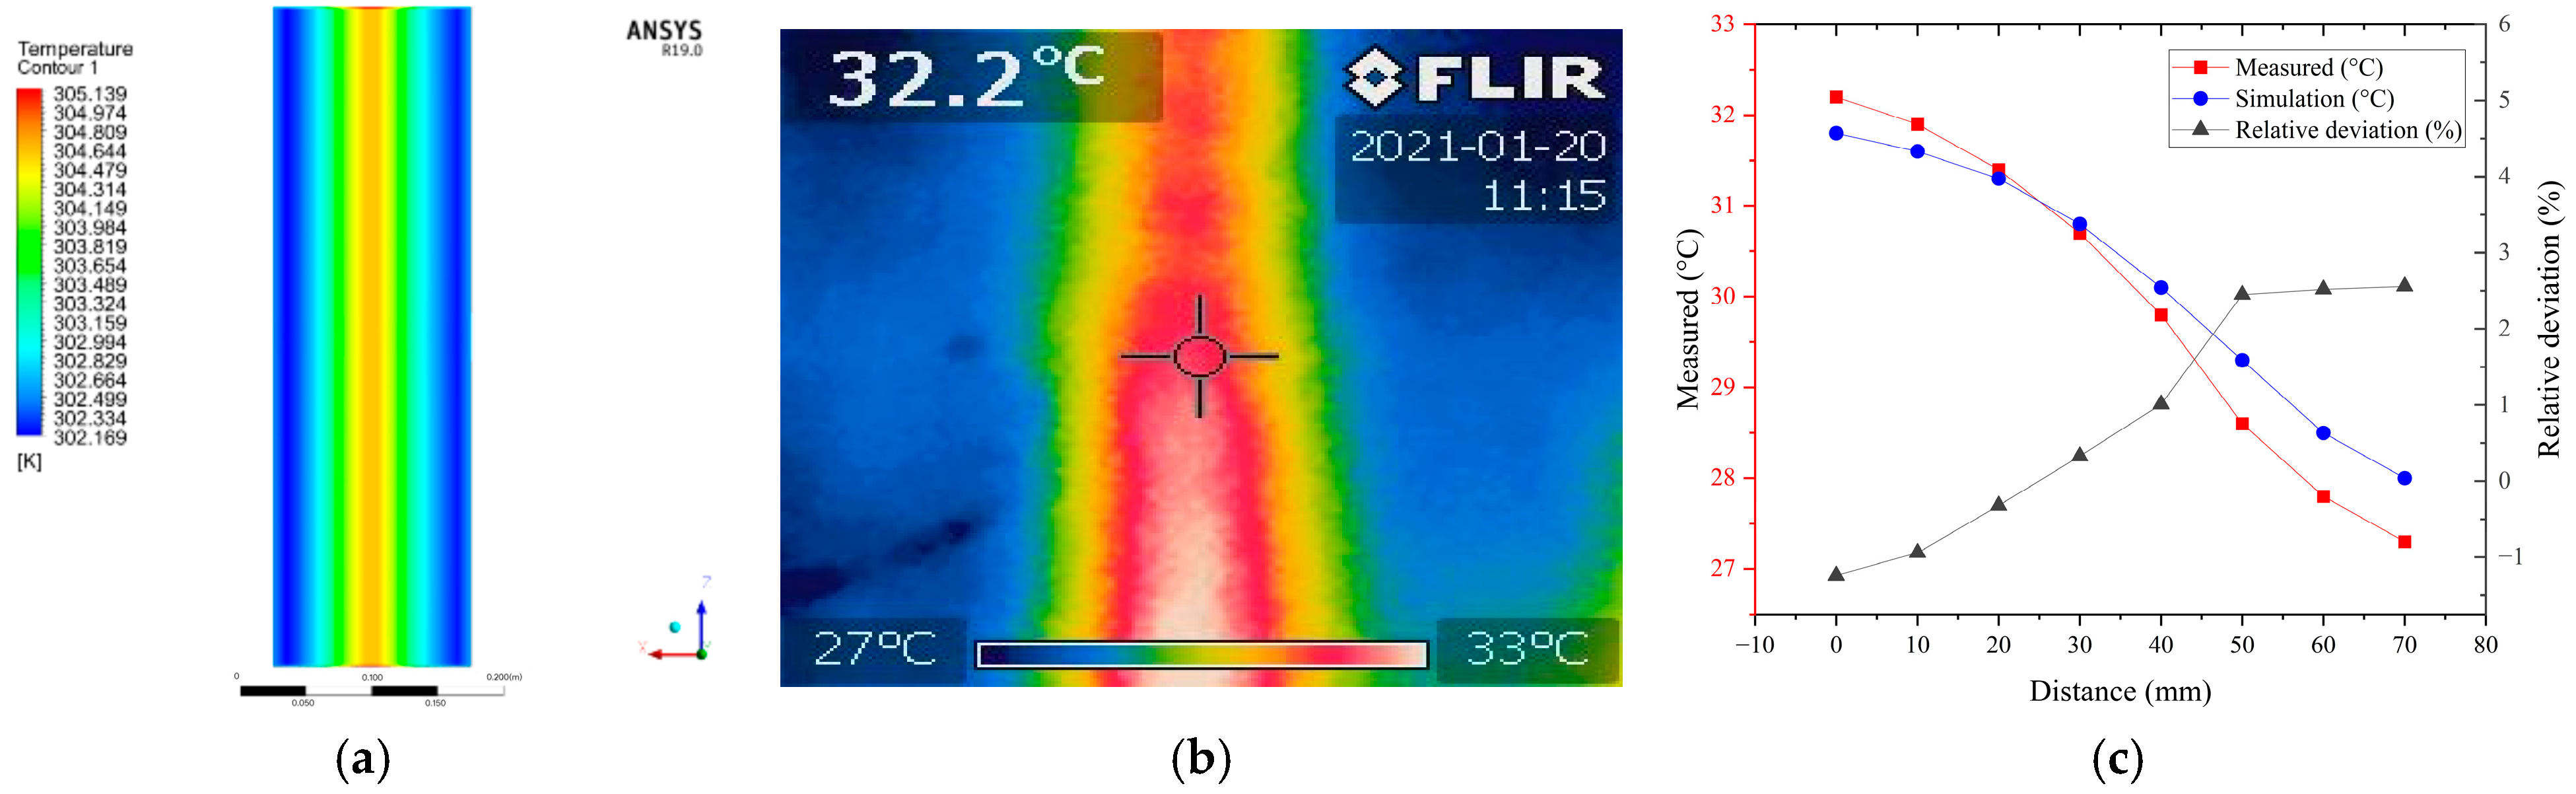
Comparison of FST in condensing section. (a) Simulation; (b) measured; and (c) comparison.
Figure 4 is the comparison of FST for the superheated section. The superheated vapor discharged from the compressor was cooled to the condensing temperature after approximately 700 mm. From the measured data, the FST at the surface center dropped from 51.3 °C to 32.1 °C. According to the simulation, the center FST was in the range of 49.4 °C to 31.2 °C. The maximum relative error of simulation was 3.7%.
Figure 5 is the FST of the condensing section. The FST at the surface center in the model was stabilized at 31.8 °C, while the measured temperature was 32.2 °C. The FST decreased gradually from the surface center to both sides. The measured temperature decreased to approximately 27 °C, while the simulated one was 29 °C. The maximum relative error was 7.4%.
To quantitatively evaluate the agreement between the simulated and measured FST, the mean absolute error (MAE), mean squared error (MSE), and Pearson correlation coefficient (R) were calculated. For the superheated section (Figure 4), the MAE was 1.04 °C, the MSE was 1.58 °C, and the Pearson correlation coefficient was 0.986. For the condensing section (Figure 5), the MAE was 0.41 °C, the MSE was 0.23 °C, and the Pearson correlation coefficient was 0.998. These statistical indicators demonstrate good agreement between the simulation results and the field test data.
2.3. Simulation Cases
The influences of condensing temperature, room temperature, pipe spacing, and floor surface materials on heat transfer were further simulated. For the condensing section, three commonly used floor surface materials were selected, including wood (solid wood composite flooring), ceramic tile and marble; seven condensing temperatures ranged from 29 °C to 41 °C were simulated; four spacings of 100 mm, 150 mm, 200 mm, and 250 mm were decided; and three frequently used room temperatures (18 °C, 20 °C, and 22 °C) were set. There were 252 simulation cases for the condensing section.
To reduce FST in the superheated vapor section, the impact of increasing covering thickness and spacing was explored. In the simulation of the superheated section, only the wood surface was simulated, in which room temperature was set to 20 °C and the vapor temperature was 80 °C. The covering thickness was set in the range of 20 to 100 mm, while the pipe spacing was in the range of 150 to 250 mm. The simulated cases are shown in Table 2. The thermal parameters of floor surface materials were set in the models. The thermal conductivity coefficients of wood, ceramic tile and marble are 0.20, 1.25 and 3.5 W/(m·K), respectively; the corresponding specific heat capacities are 2400, 800 and 880 (J/(kg·K)); and the densities are 800, 2700 and 2800 (kg/m3).
Table 2.
Explanation of simulation cases.
3. Results
3.1. Condensing Section
There were 252 cases in the simulation of the condensing section. The simulation results of FST and HF are compared. Part of the data were analyzed in detail through graphical representation. All the simulation results were compiled into linear diagrams at the end of this section.
3.1.1. Influence of Surface Materials
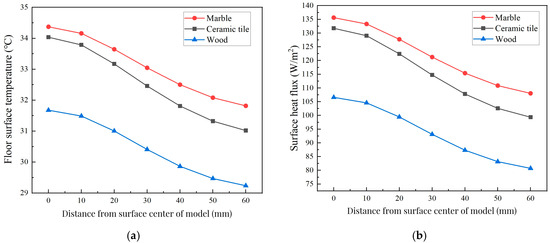
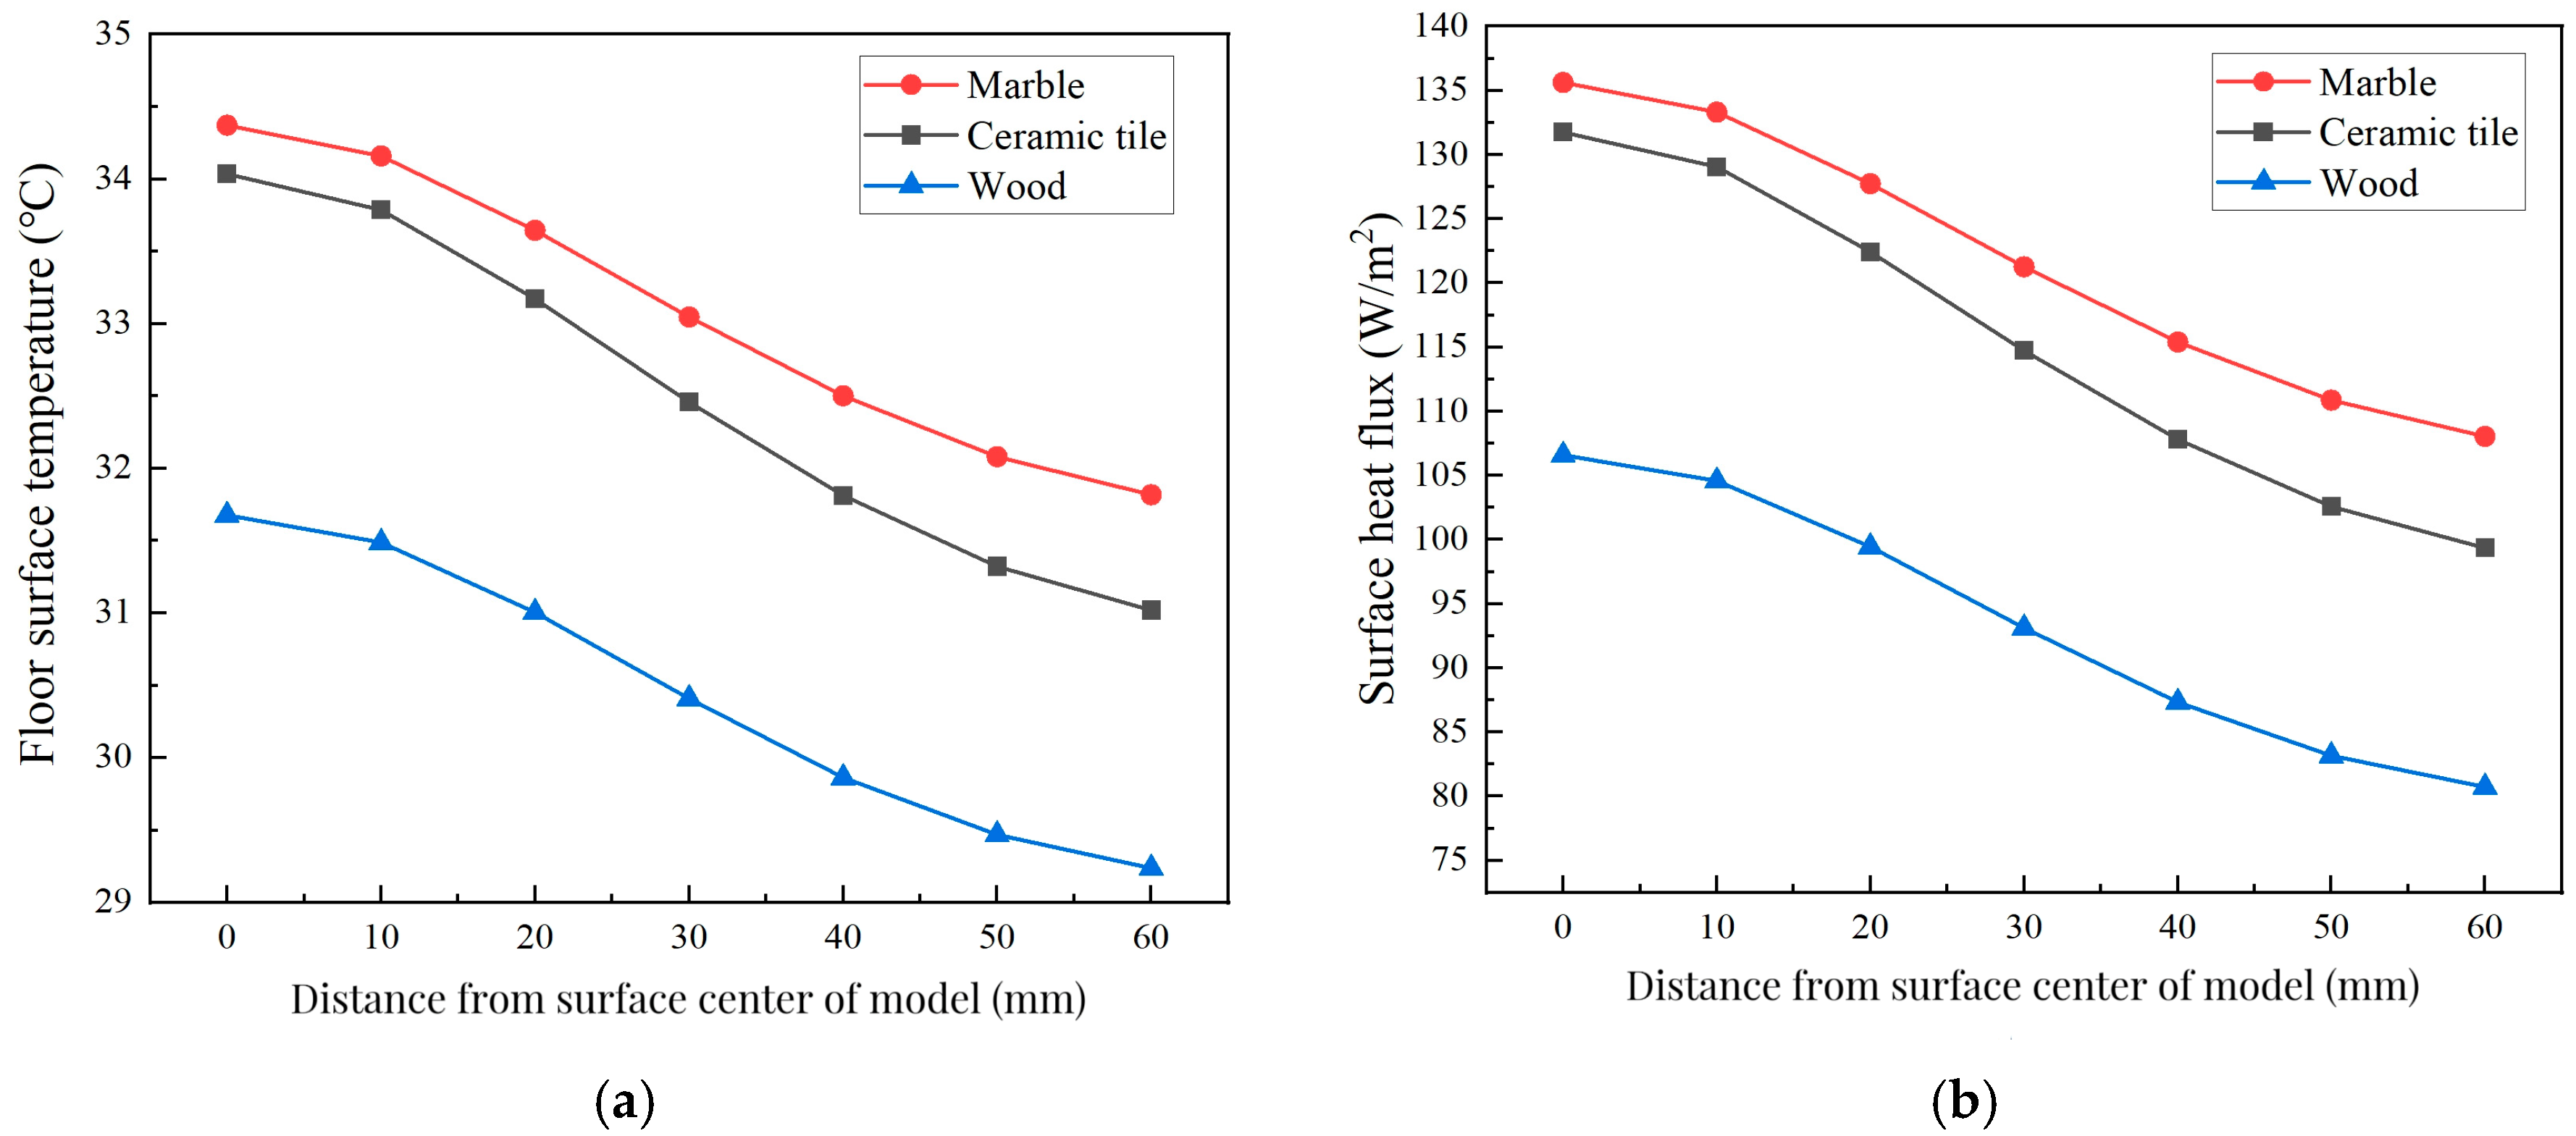
The data of simulation cases with room temperature of 22 °C, condensing temperature of 41 °C, and spacing of 150 mm are shown in Figure 6. The distribution of FST is compared in Figure 6a. The FST of marble is the highest, which decreases from 34.4 °C at the center to 31.8 °C at 60 mm. For the ceramic tile floor, the FST decreases from 34 °C to 31 °C and for the wooden floor, the FST decreases from 31.7 °C to 29.2 °C. The decreases are 2.6 °C, 3 °C, and 2.4 °C under the three floor material conditions, and the mean FSTs are 33.1 °C, 32.5 °C, and 30.5 °C, respectively.
Figure 6.
Distribution of FST and HF across different floor materials. (a) FST and (b) surface HF.
The distribution of surface HF is shown in Figure 6b. The HF of marble surface is the highest, which decreases from 136.6 W/m2 to 108 W/m2. The HF of ceramic tile is in the range of 131.8 W/m2 to 99.3 W/m2 and for the wooden floor, it is in the range of 106.6 W/m2 to 80.7 W/m2. The mean HFs for the three surface materials are 121.7 W/m2, 115.4 W/m2, and 93.6 W/m2, respectively.
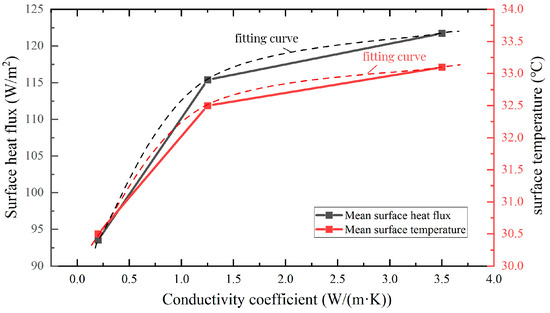
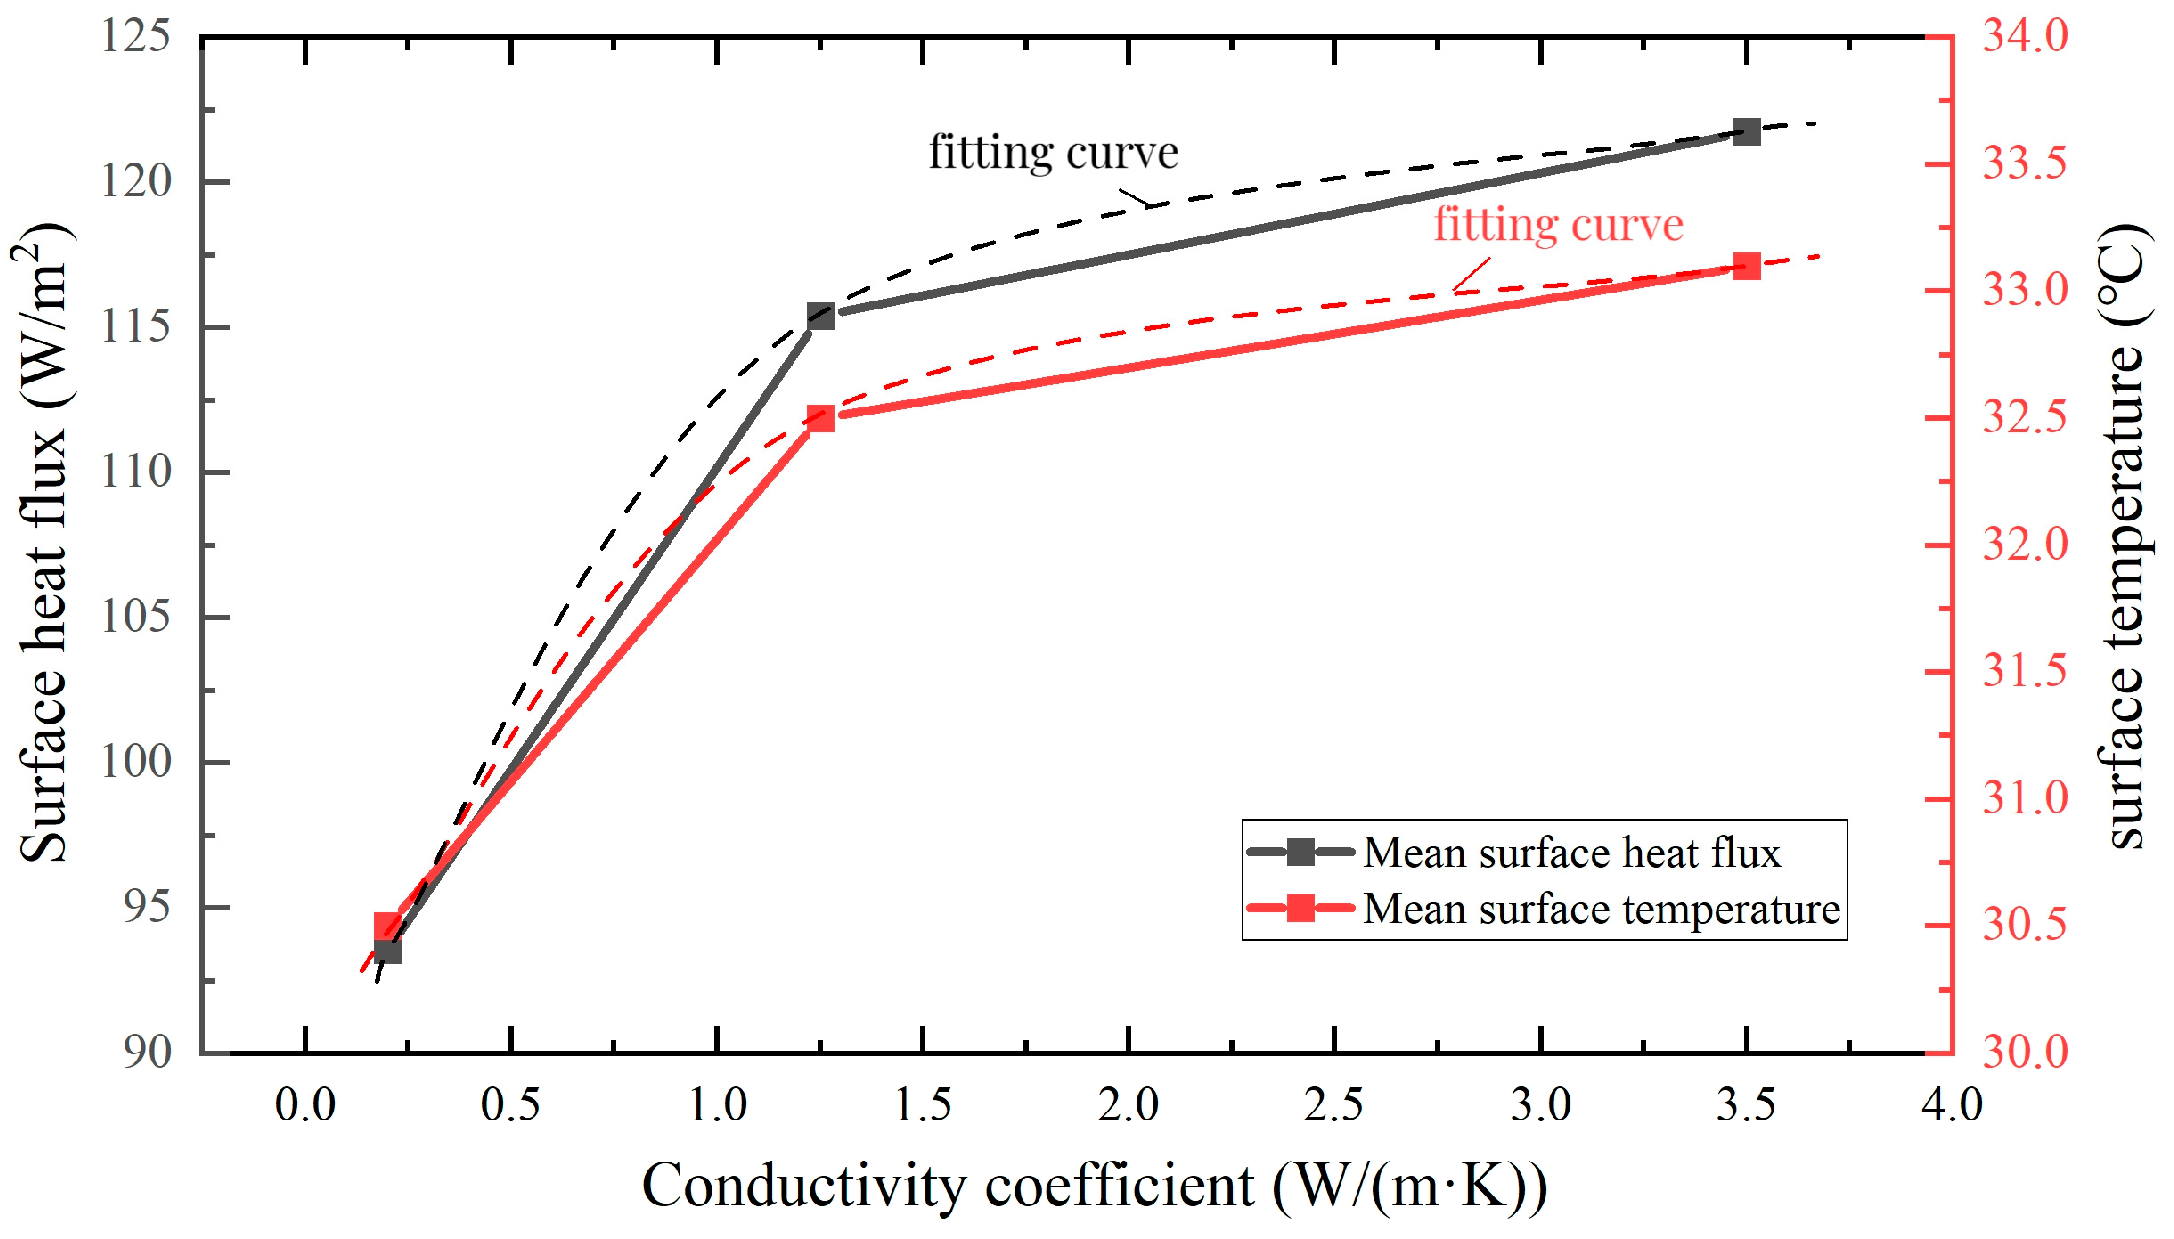
From the results, the surface material has a significant influence on the FST and HF. With higher thermal conductivity, the FST and HF increase remarkably. The effect of the conductivity coefficient on mean FST and HF is further analyzed in Figure 7. From the fitting curve, when the conductivity coefficient is lower than 1.2 W/(m·K), the variation in coefficient has a more significant impact on the mean FST and HF. The changes in FST and HF become smaller when the coefficient is higher than 1.2 W/(m·K).
Figure 7.
Effect of the conductivity coefficient on mean FST and HF.
3.1.2. Influence of Condensing Temperature
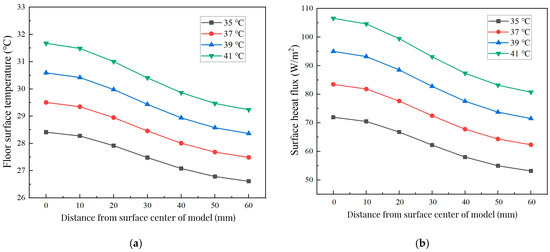
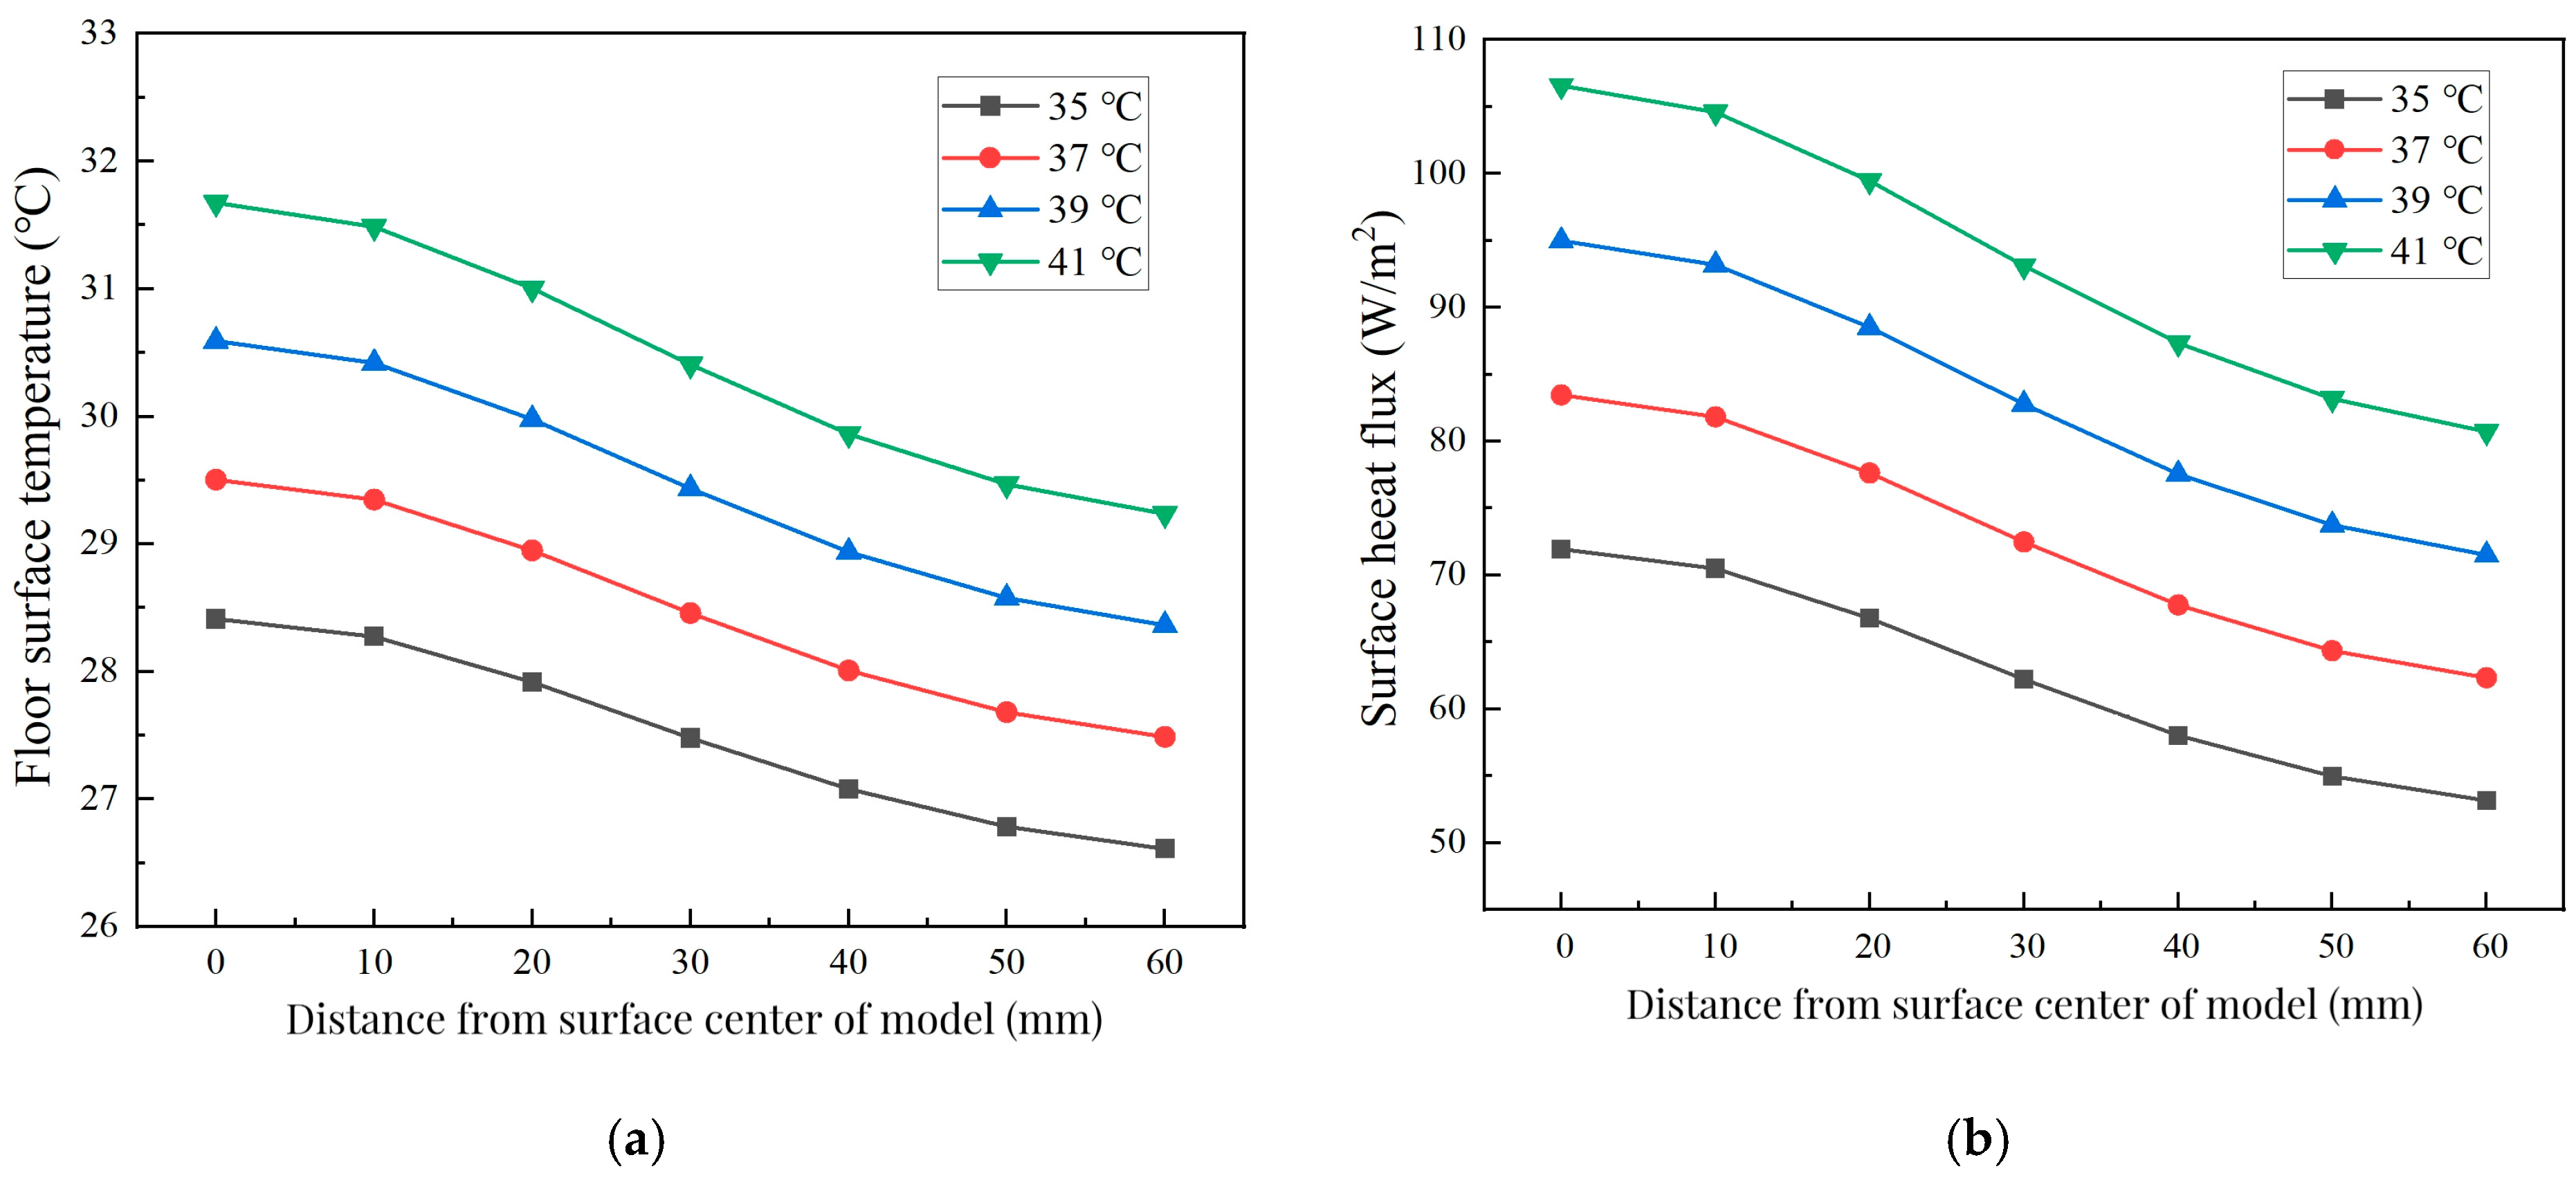
The data of simulation cases of wood floor with room temperature of 22 °C, spacing of 150 mm, and condensing temperature in the range of 35 °C to 41 °C are shown in Figure 8. As shown in Figure 8a, the FST decreases as the condensing temperature drops. The mean FSTs are 30.4 °C, 29.5 °C, 28.5 °C, and 27.5 °C, respectively, with condensing temperatures of 41 °C, 39 °C, 37 °C, and 35 °C. The mean FST decreases by approximately 1 °C for every 2 °C decrease in condensing temperature. With a condensing temperature of 41 °C, the FST drops from 31.7 °C at the center to 29.2 °C at 60 mm. The FST difference along the distance from the middle of the model decreases from 2.5 °C with a condensing temperature of 41 °C to 1.8 °C with a condensing temperature of 35 °C, which indicates that with a lower condensing temperature, the distribution of FST becomes more uniform.
Figure 8.
Distribution of FST and HF at different condensing temperatures. (a) FST and (b) surface HF.
As shown in Figure 8b, the surface HF decreases as the condensing temperature declines. In the 41 °C condition, the HF is approximately in the range of 106.6 W/m2 to 80.7 W/m2. The maximum difference is 25.9 W/m2, which decreases to 23.48 W/m2, 21.1 W/m2, and 18 W/m2 with the drop in the condensing temperature. The mean HFs are 93.6 W/m2, 83.1 W/m2, 72.8 W/m2, and 62.5 W/m2, respectively. With every 2 °C decrease in condensing temperature, the mean HF decreases by approximately 10 W/m2.
3.1.3. Influence of Pipe Spacing
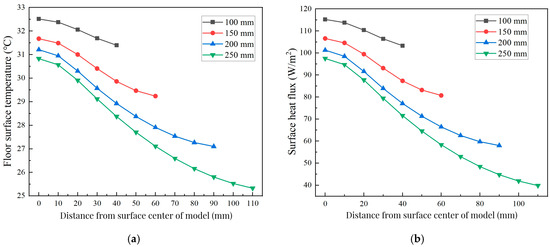
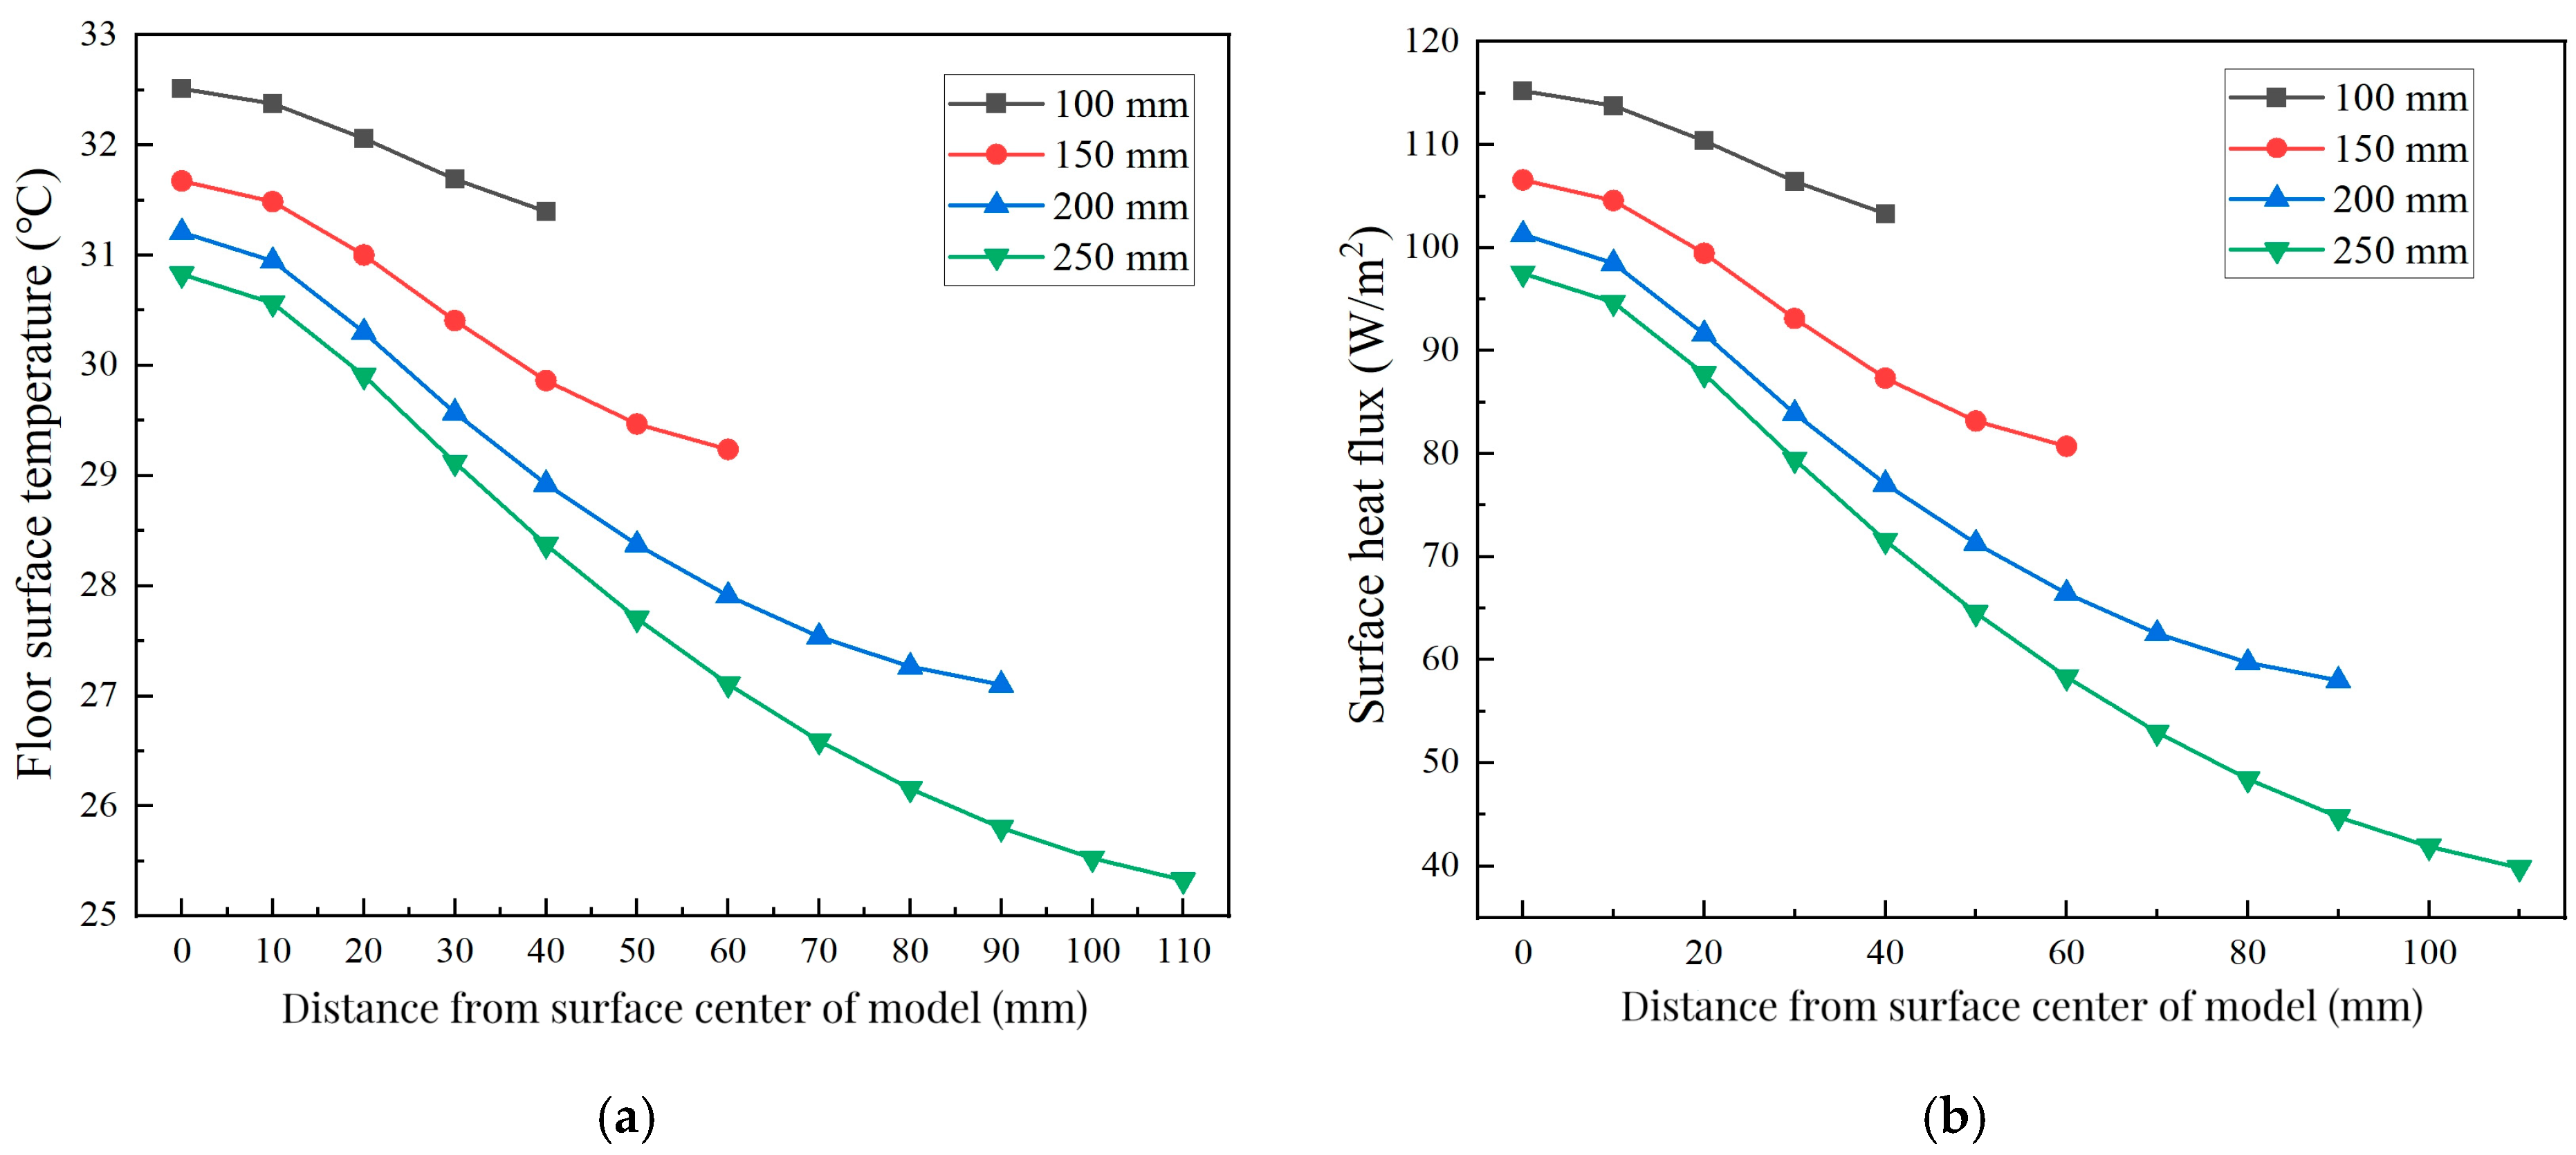
The data from simulation cases of a wood floor with a room temperature of 22 °C, a condensing temperature of 41 °C, and different pipe spacing are shown in Figure 9.
Figure 9.
Distribution of FST and HF with different pipe spacing. (a) FST and (b) surface HF.
As shown in Figure 9a, the FST decreases with the increase in pipe spacing. The maximum FSTs of the four spacings are 32.5 °C, 31.7 °C, 31.2 °C, and 30.8 °C, and the mean FSTs are 32 °C, 30.4 °C, 28.9 °C, and 27.7 °C, respectively. As the pipe spacing increases, the FST drop along the distance from the centerline is enlarged. In the four spacing cases, the maximum FST differences are 1.1 °C, 2.4 °C, 4.1 °C, and 5.5 °C, respectively. The uniformity in FST distribution decreases as the spacing increases.
Figure 9b shows the surface HF. The changes in HF in the four spacing cases are similar to those of the FST. The increase in spacing is accompanied by a decrease in surface HF and uniformity of distribution. The maximum HFs are 115.2 W/m2, 106.6 W/m2, 101.3 W/m2, and 97.5 W/m2, respectively, and the maximum differences in HF are 11.93 W/m2, 25.9 W/m2, 43.3 W/m2, and 57.6 W/m2. The mean HFs are 109.8 W/m2, 93.6 W/m2, 77 W/m2, and 65.1 W/m2, correspondingly.
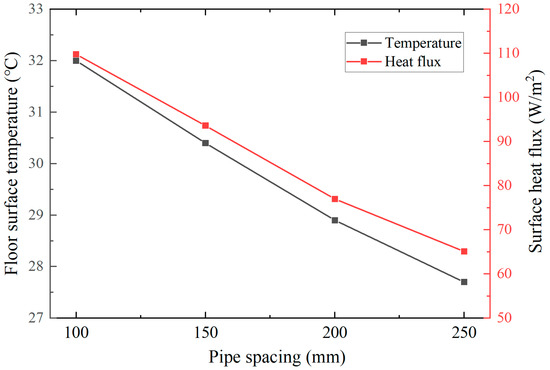
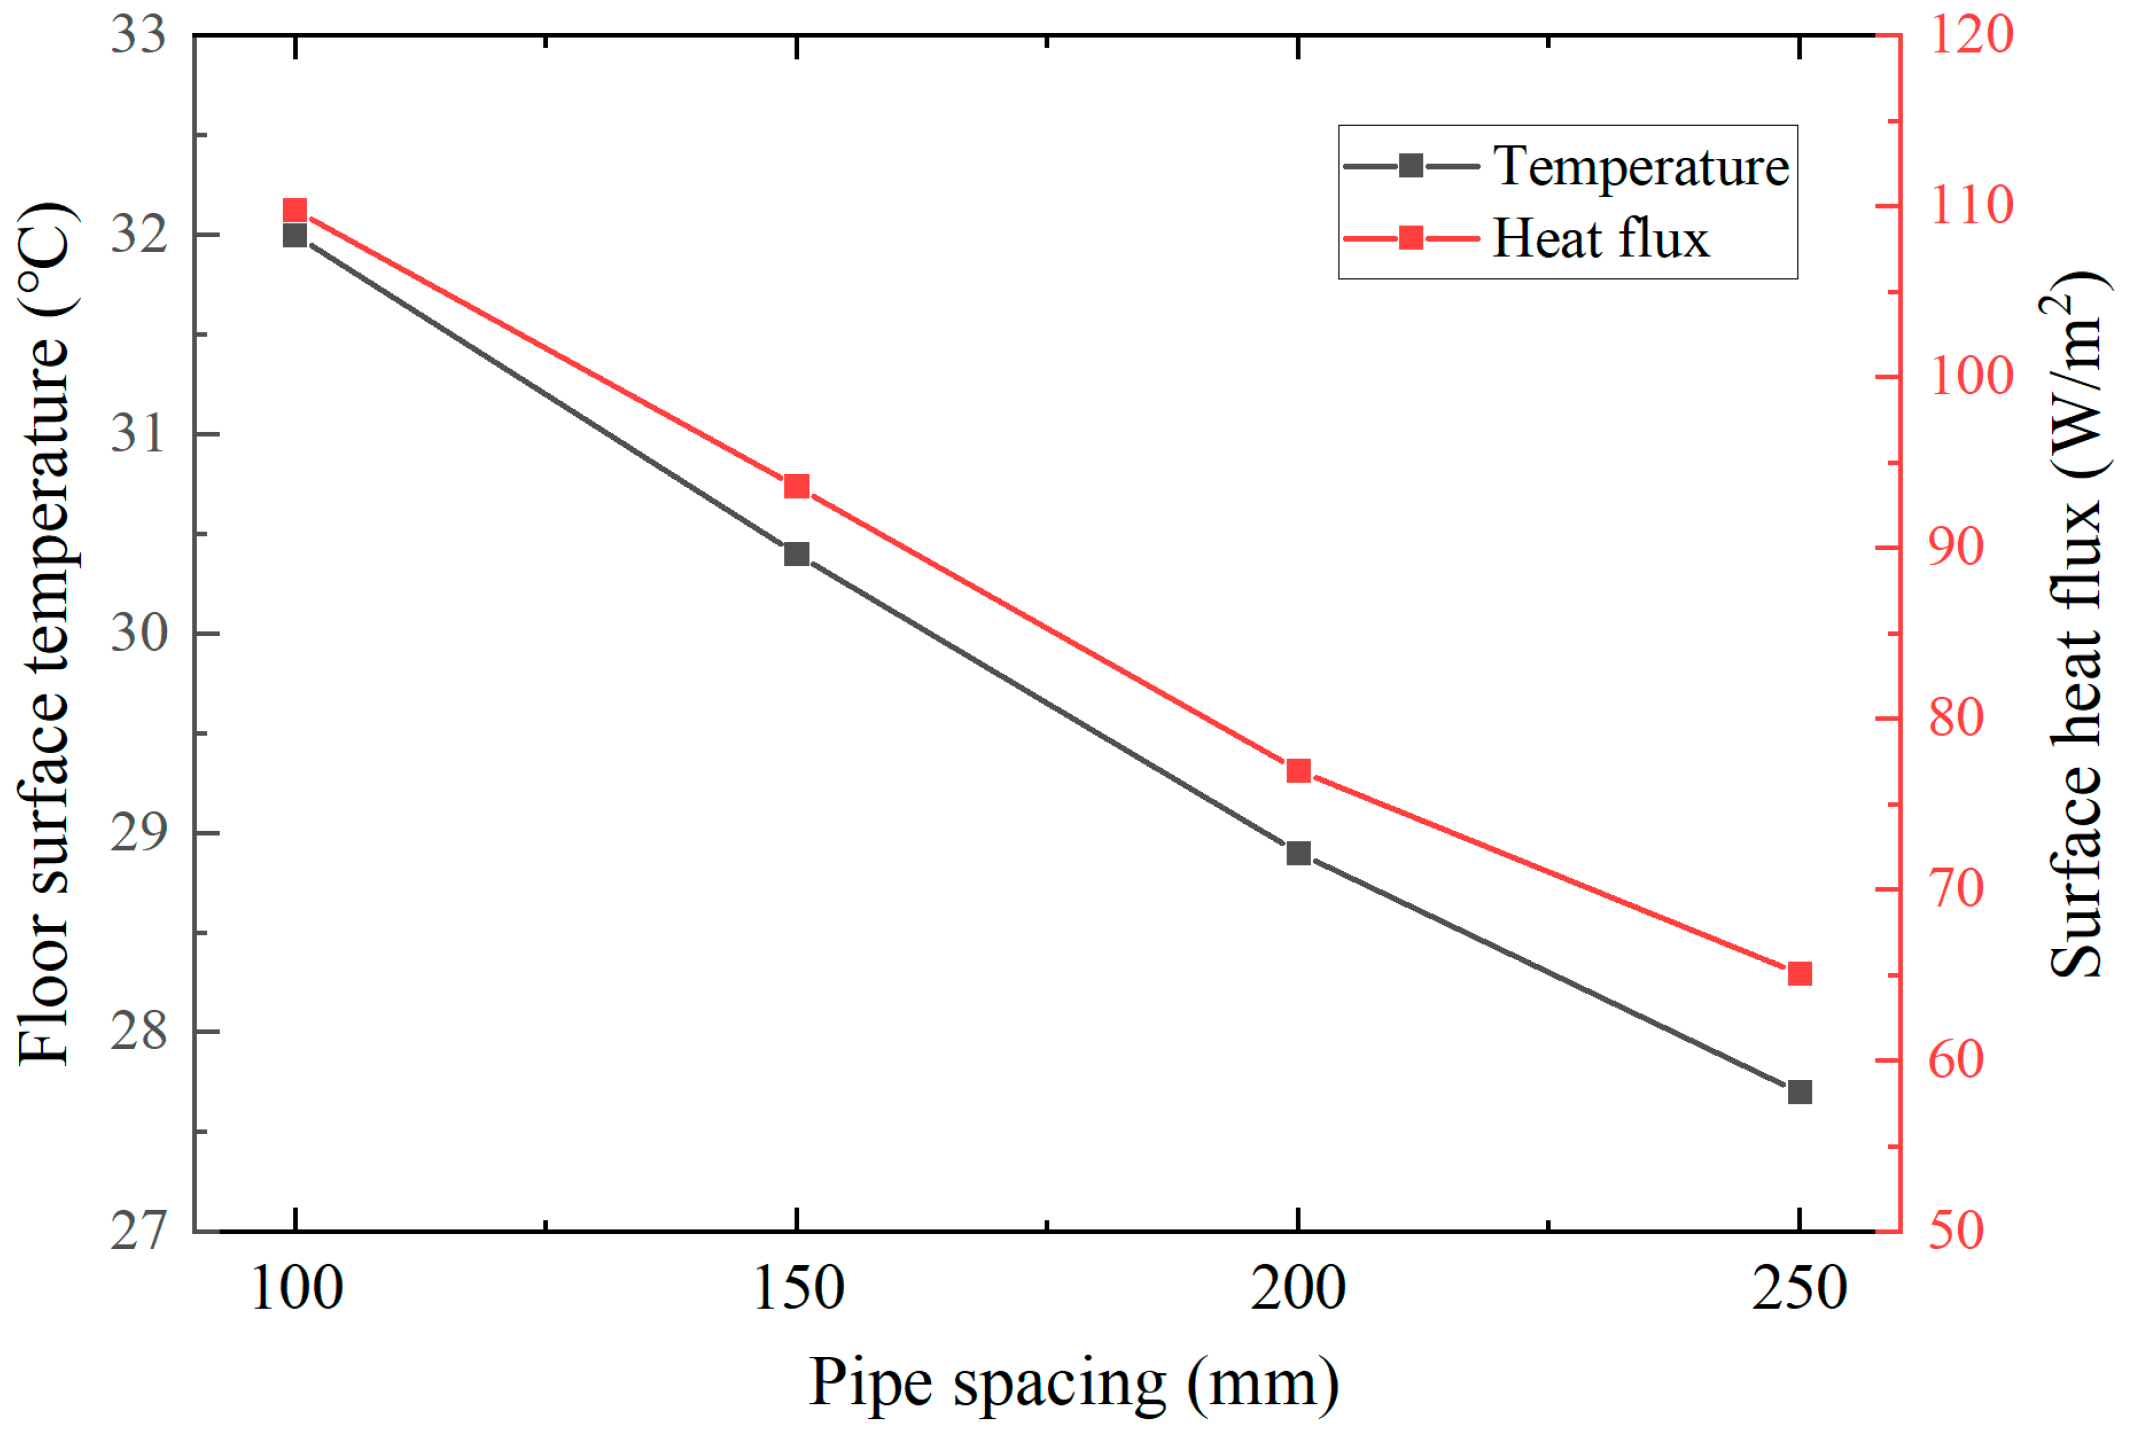
From the comparison, the pipe spacing has a significant impact on the FST and HF. With increased spacing, the mean FST and HF decrease significantly. The influence of spacing is further analyzed in Figure 10. It can be seen that the mean FST would drop by approximately 1.4 °C with a 50 mm increase in spacing, while the mean HF would drop by approximately 15 W/m2.
Figure 10.
Changes in mean FST and HF with spacing.
3.1.4. Data of All Simulated Cases
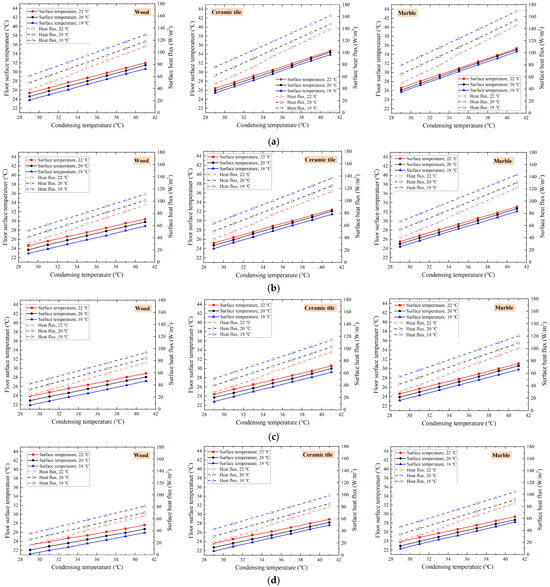
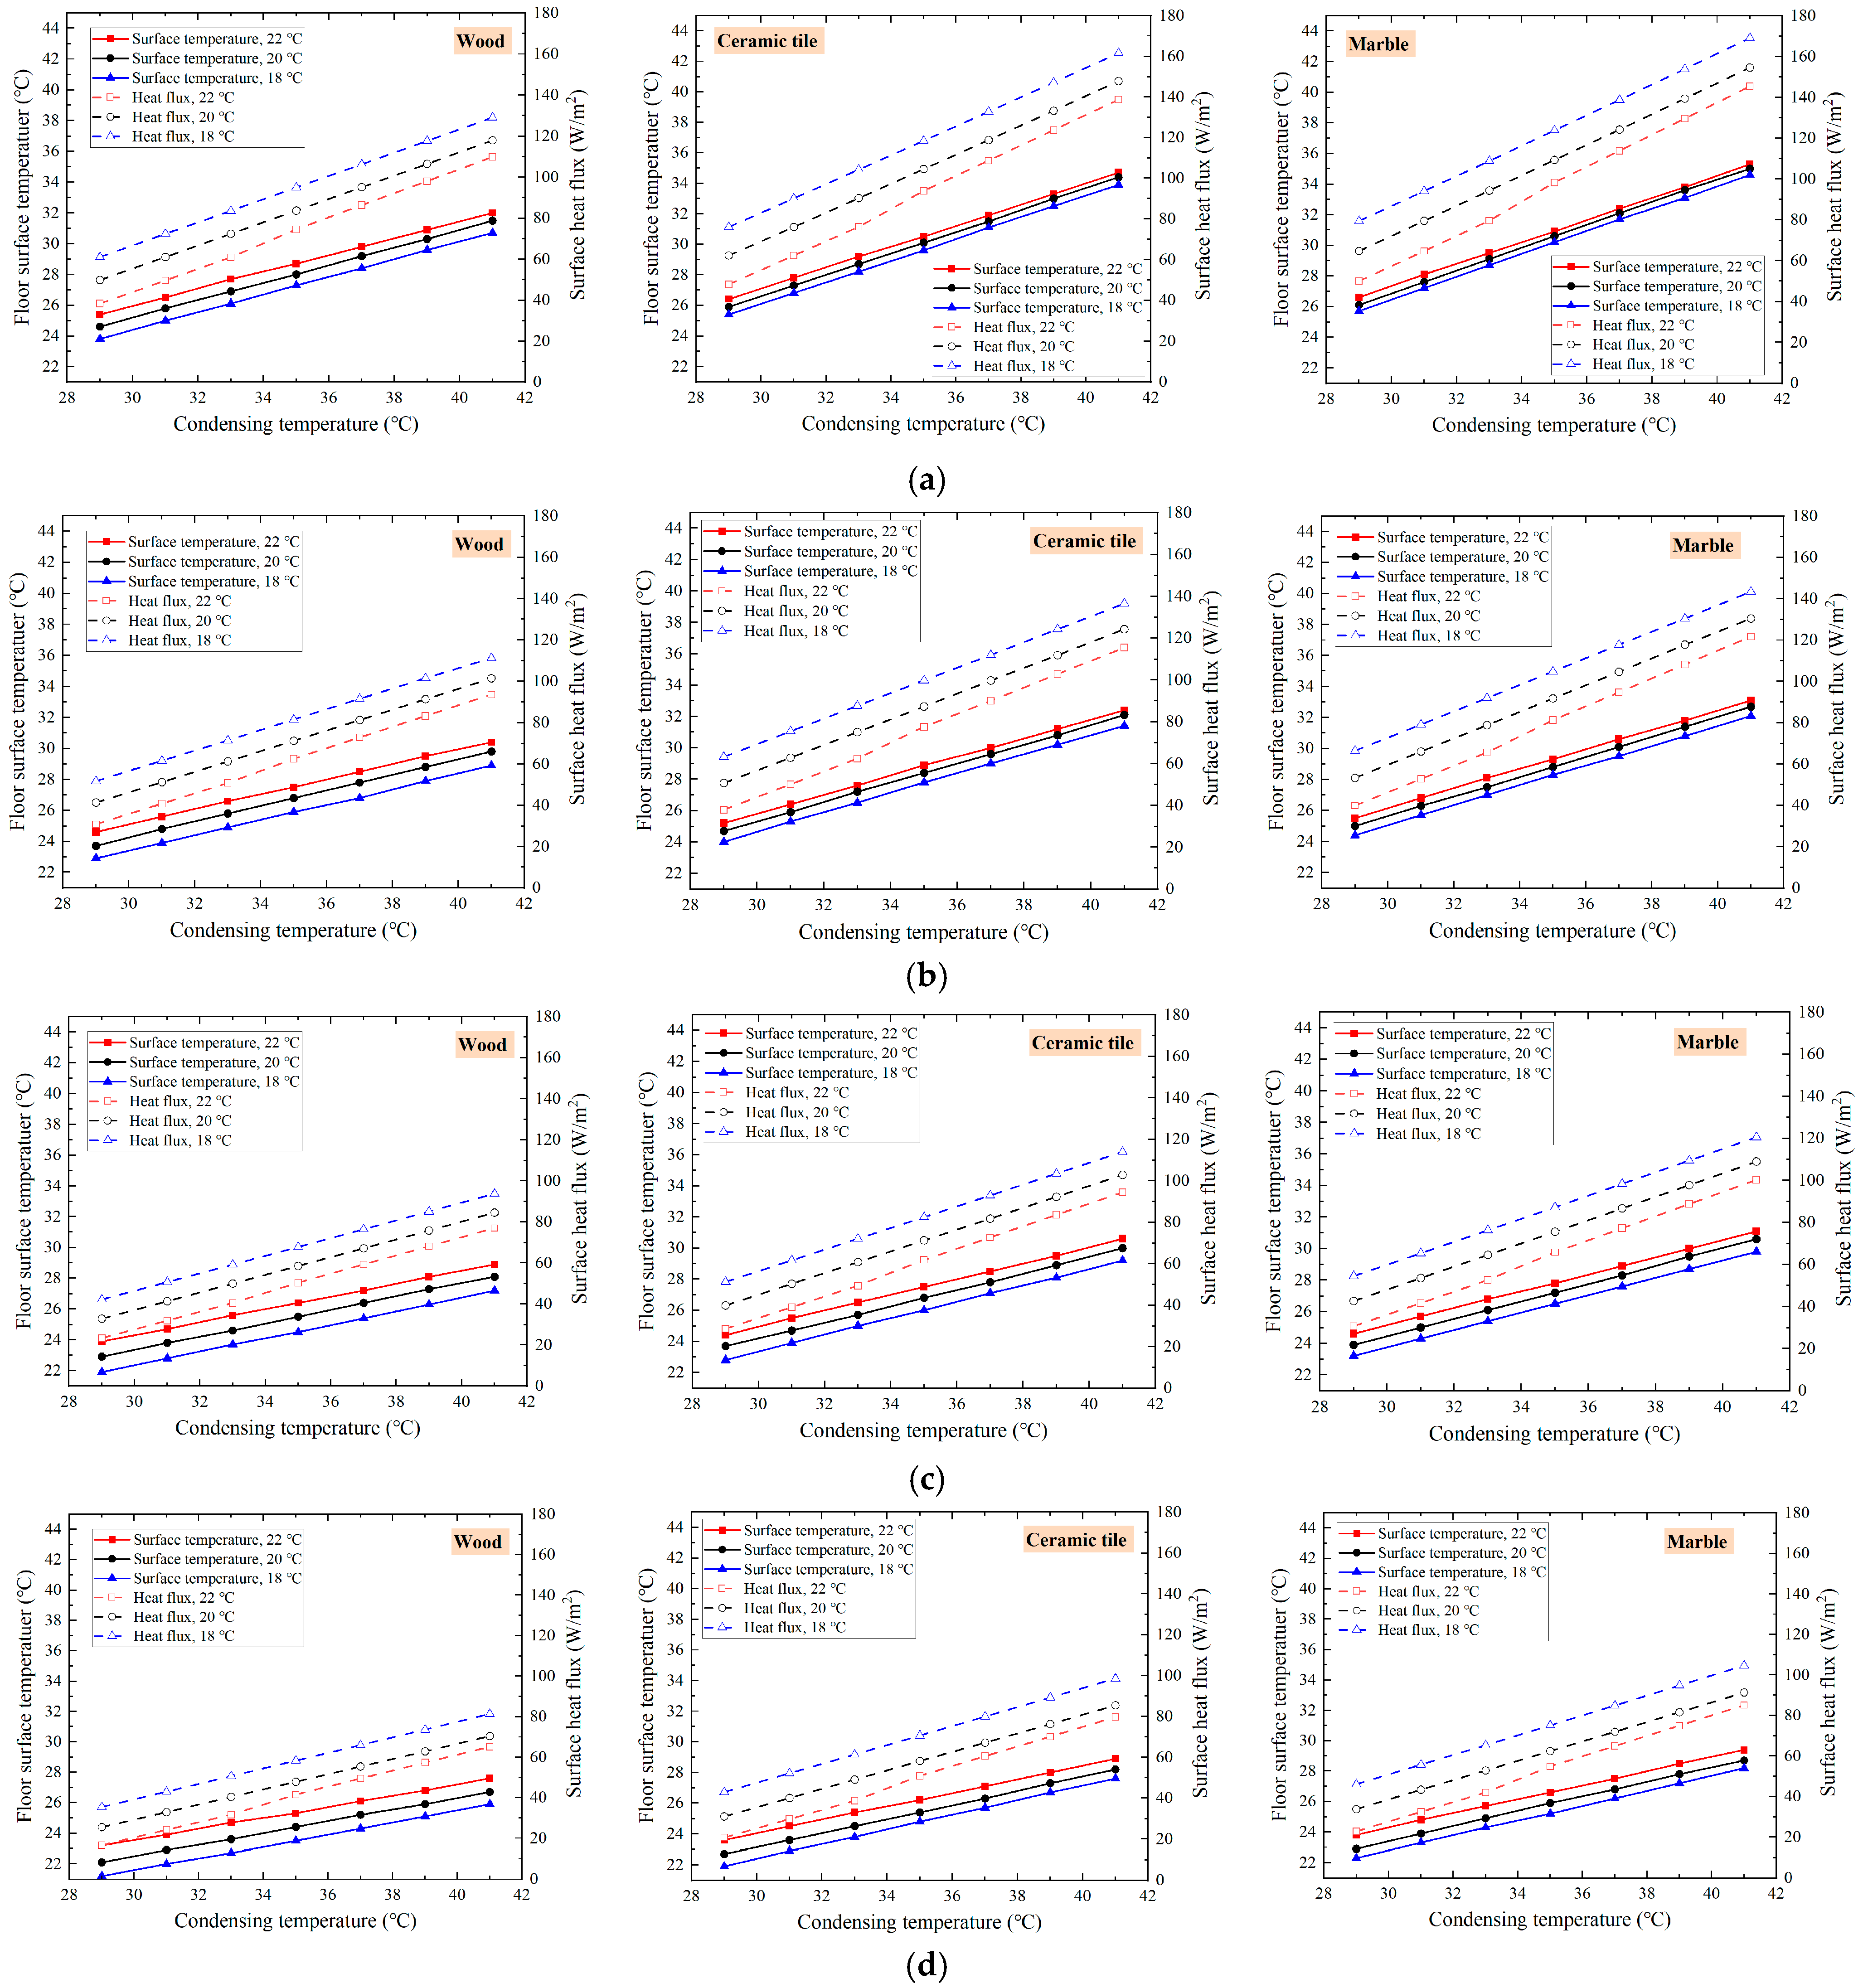
The data of the 252 cases are summarized in Figure 11. To make it easier to reference, all data is organized in the form of a linear diagram, in which the changes in mean FST and HF are shown based on room temperature, spacing, condensing temperature, and floor material. The effect of these factors on HF and FST is the same as that presented in the previous cases, which will not be discussed anymore. For the simulated cases, the FST is in the range of 21.2 °C to 35.3 °C, and the HF is in the range of 16.6 W/m2 to 169.1 W/m2.
Figure 11.
FST and HF of all the simulated cases. (a) Pipe spacing of 100 mm. (b) Pipe spacing of 150 mm. (c) Pipe spacing of 200 mm. (d) Pipe spacing of 250 mm.
From the results, room temperature also has an influence on the FST and HF. Taking the condition of 100 mm spacing as an example, when the room temperature increases from 18 °C to 22 °C, the FST increases by 1.6 °C and the HF decreases by 22.7 W/m2 with a wood material and condensing temperature of 29 °C. It can also be seen that the increase in FST and decrease in HF become smaller as the condensing temperature increases, and they change to 1.3 °C and 19.1 W/m2 with a condensing temperature of 41 °C. When the floor material is ceramic tile or marble, the difference among FST becomes smaller, while the difference among HF increases. This indicates that the room temperature has a smaller influence on the FST if ceramic tile or marble is used, while the influence on HF is still noticeable.
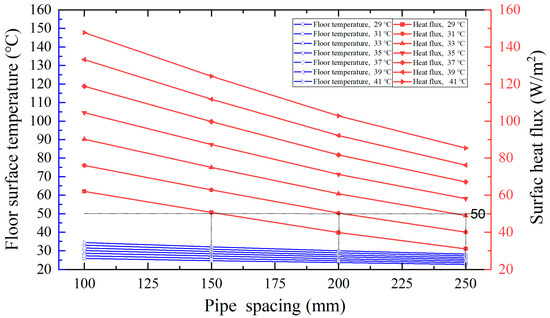
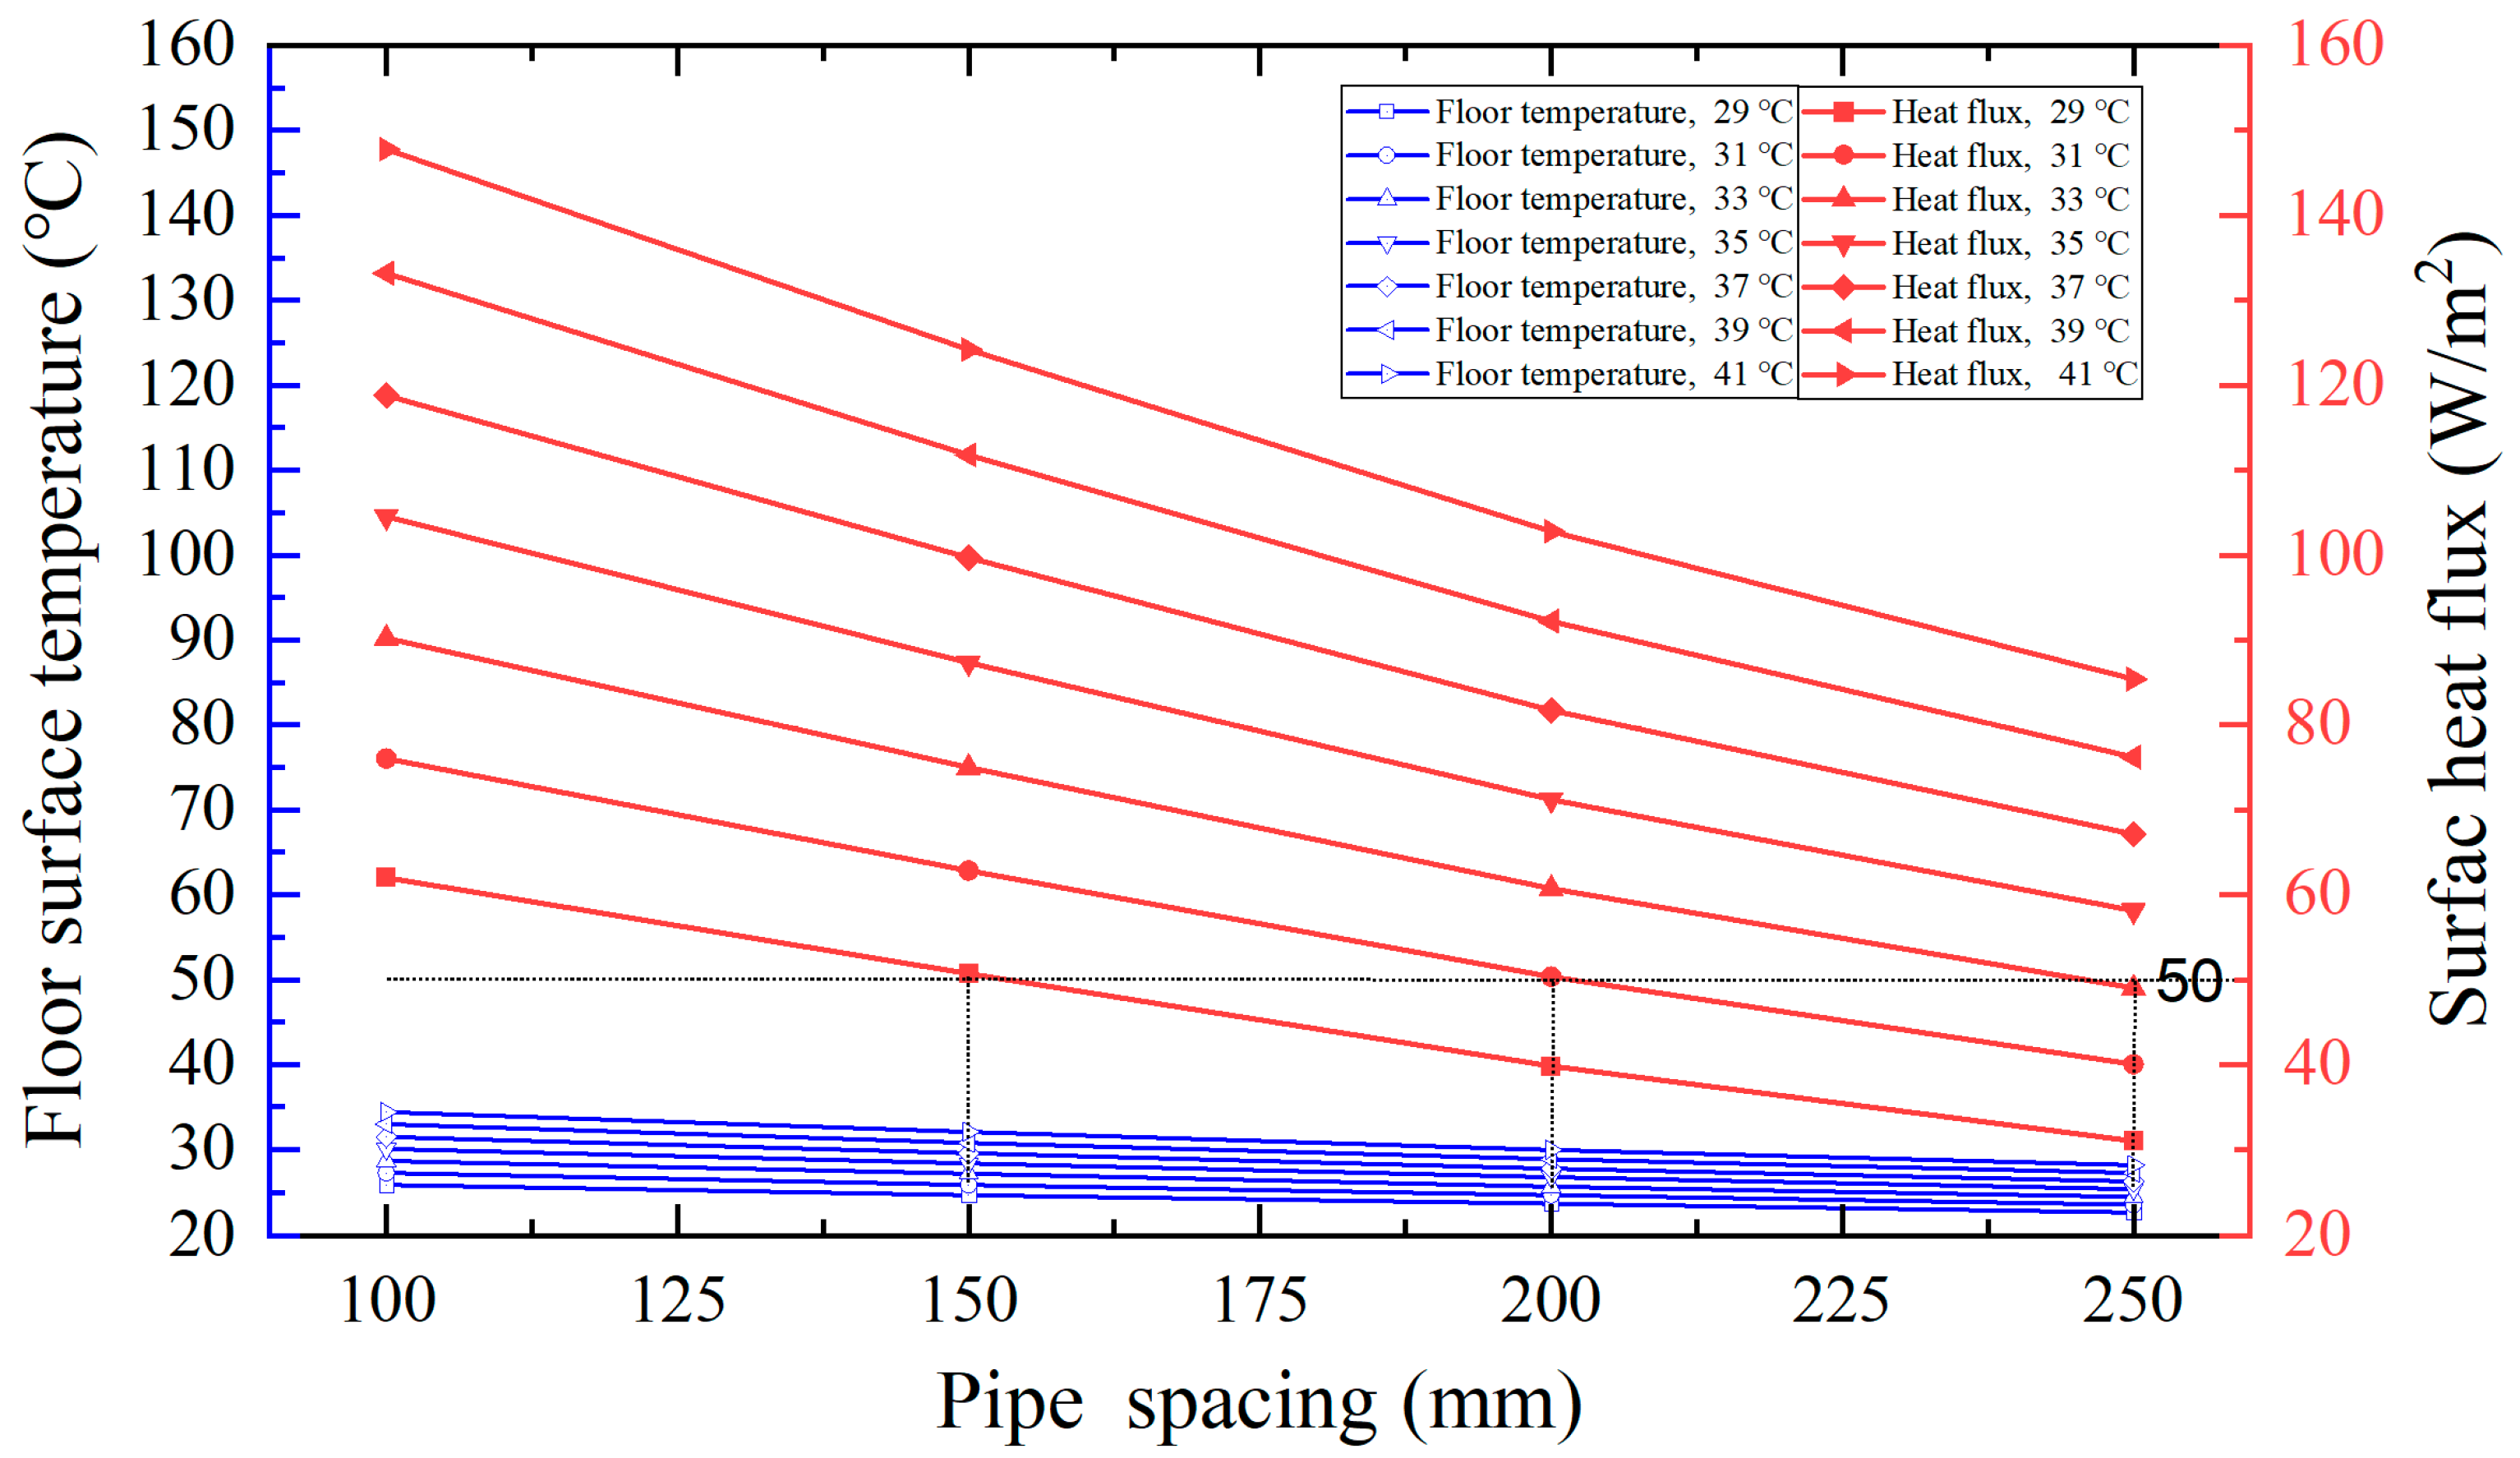
Figure 11 provides a reference for the pipe arrangement in the design of the CPF system and can be used to guide the adjustment of the ASHP during operation. The following is a brief applied example. We assume that there is a room with a ceramic tile floor, and the room temperature is 20 °C with heating load of 50 W/m2. To decide the reasonable CPF structure, Figure 12 is drawn based on data from Figure 11. It can be seen that the surface HF exceeds 50 W/m2 at a 29 °C condensing temperature with 100 mm spacing. For the 150 mm spacing, when the condensing temperature reaches 31 °C, the HF is 50 W/m2. For the 200 mm and 250 mm spacing, the target HF corresponds to condensing temperatures of 33 °C and 35 °C, respectively. For the three choices, the FST is approximately in the range of 25 °C to 26 °C, which satisfies the requirement that the FST of the floor should not exceed 29 °C for frequently occupied spaces [27]. With smaller spacing, the condensing temperature can be lower than that of larger spacing, which is beneficial to improve the COP of ASHP. It should also be noticed that when the heating load changes, the condensing temperature should also be adjusted. For the case room, under the 150 mm spacing, the condensing temperature will be lower than 29 °C when heating loads decrease. The condensing temperature of ASHP is usually in the range of 40 °C to 50 °C during heating to heat water to 35 °C to 40 °C. The low condensing temperature requirement from CPF requires adjustment or retrofit in ASHP units, in which the units should adapt to and be well regulated in a low condensing temperature range.
Figure 12.
Case of the ceramic tile floor with a room temperature of 20 °C.
To facilitate data referencing and comparison, the mean FST and HF for all 252 cases are summarized in Table 3, Table 4, Table 5 and Table 6.
Table 3.
Simulated results for pipe spacing of 100 mm.
Table 4.
Simulated results for pipe spacing of 150 mm.
Table 5.
Simulated results for pipe spacing of 200 mm.
Table 6.
Simulated results for pipe spacing of 250 mm.
3.2. Simulation Analysis of Superheated Section
To reduce the FST of the superheated section, corresponding measures of increasing the thickness of the covering layer and the spacing between pipes were studied under the condition of room temperature 20 °C and a wood floor. In the modeling of covering thickness, the covering material was set as cement mortar, and the thickness of 20 mm, 50 mm, and 100 mm were compared. The total thicknesses of the floor model were 210 mm, 240 mm and 290 mm, respectively. The current spacing of 150 mm was compared with 200 mm and 250 mm. The other part of the floor structure was the same, while the width of the floor model increased accordingly. The comparison was conducted with a superheated temperature of 80 °C.
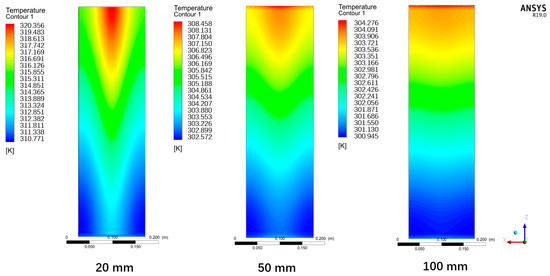
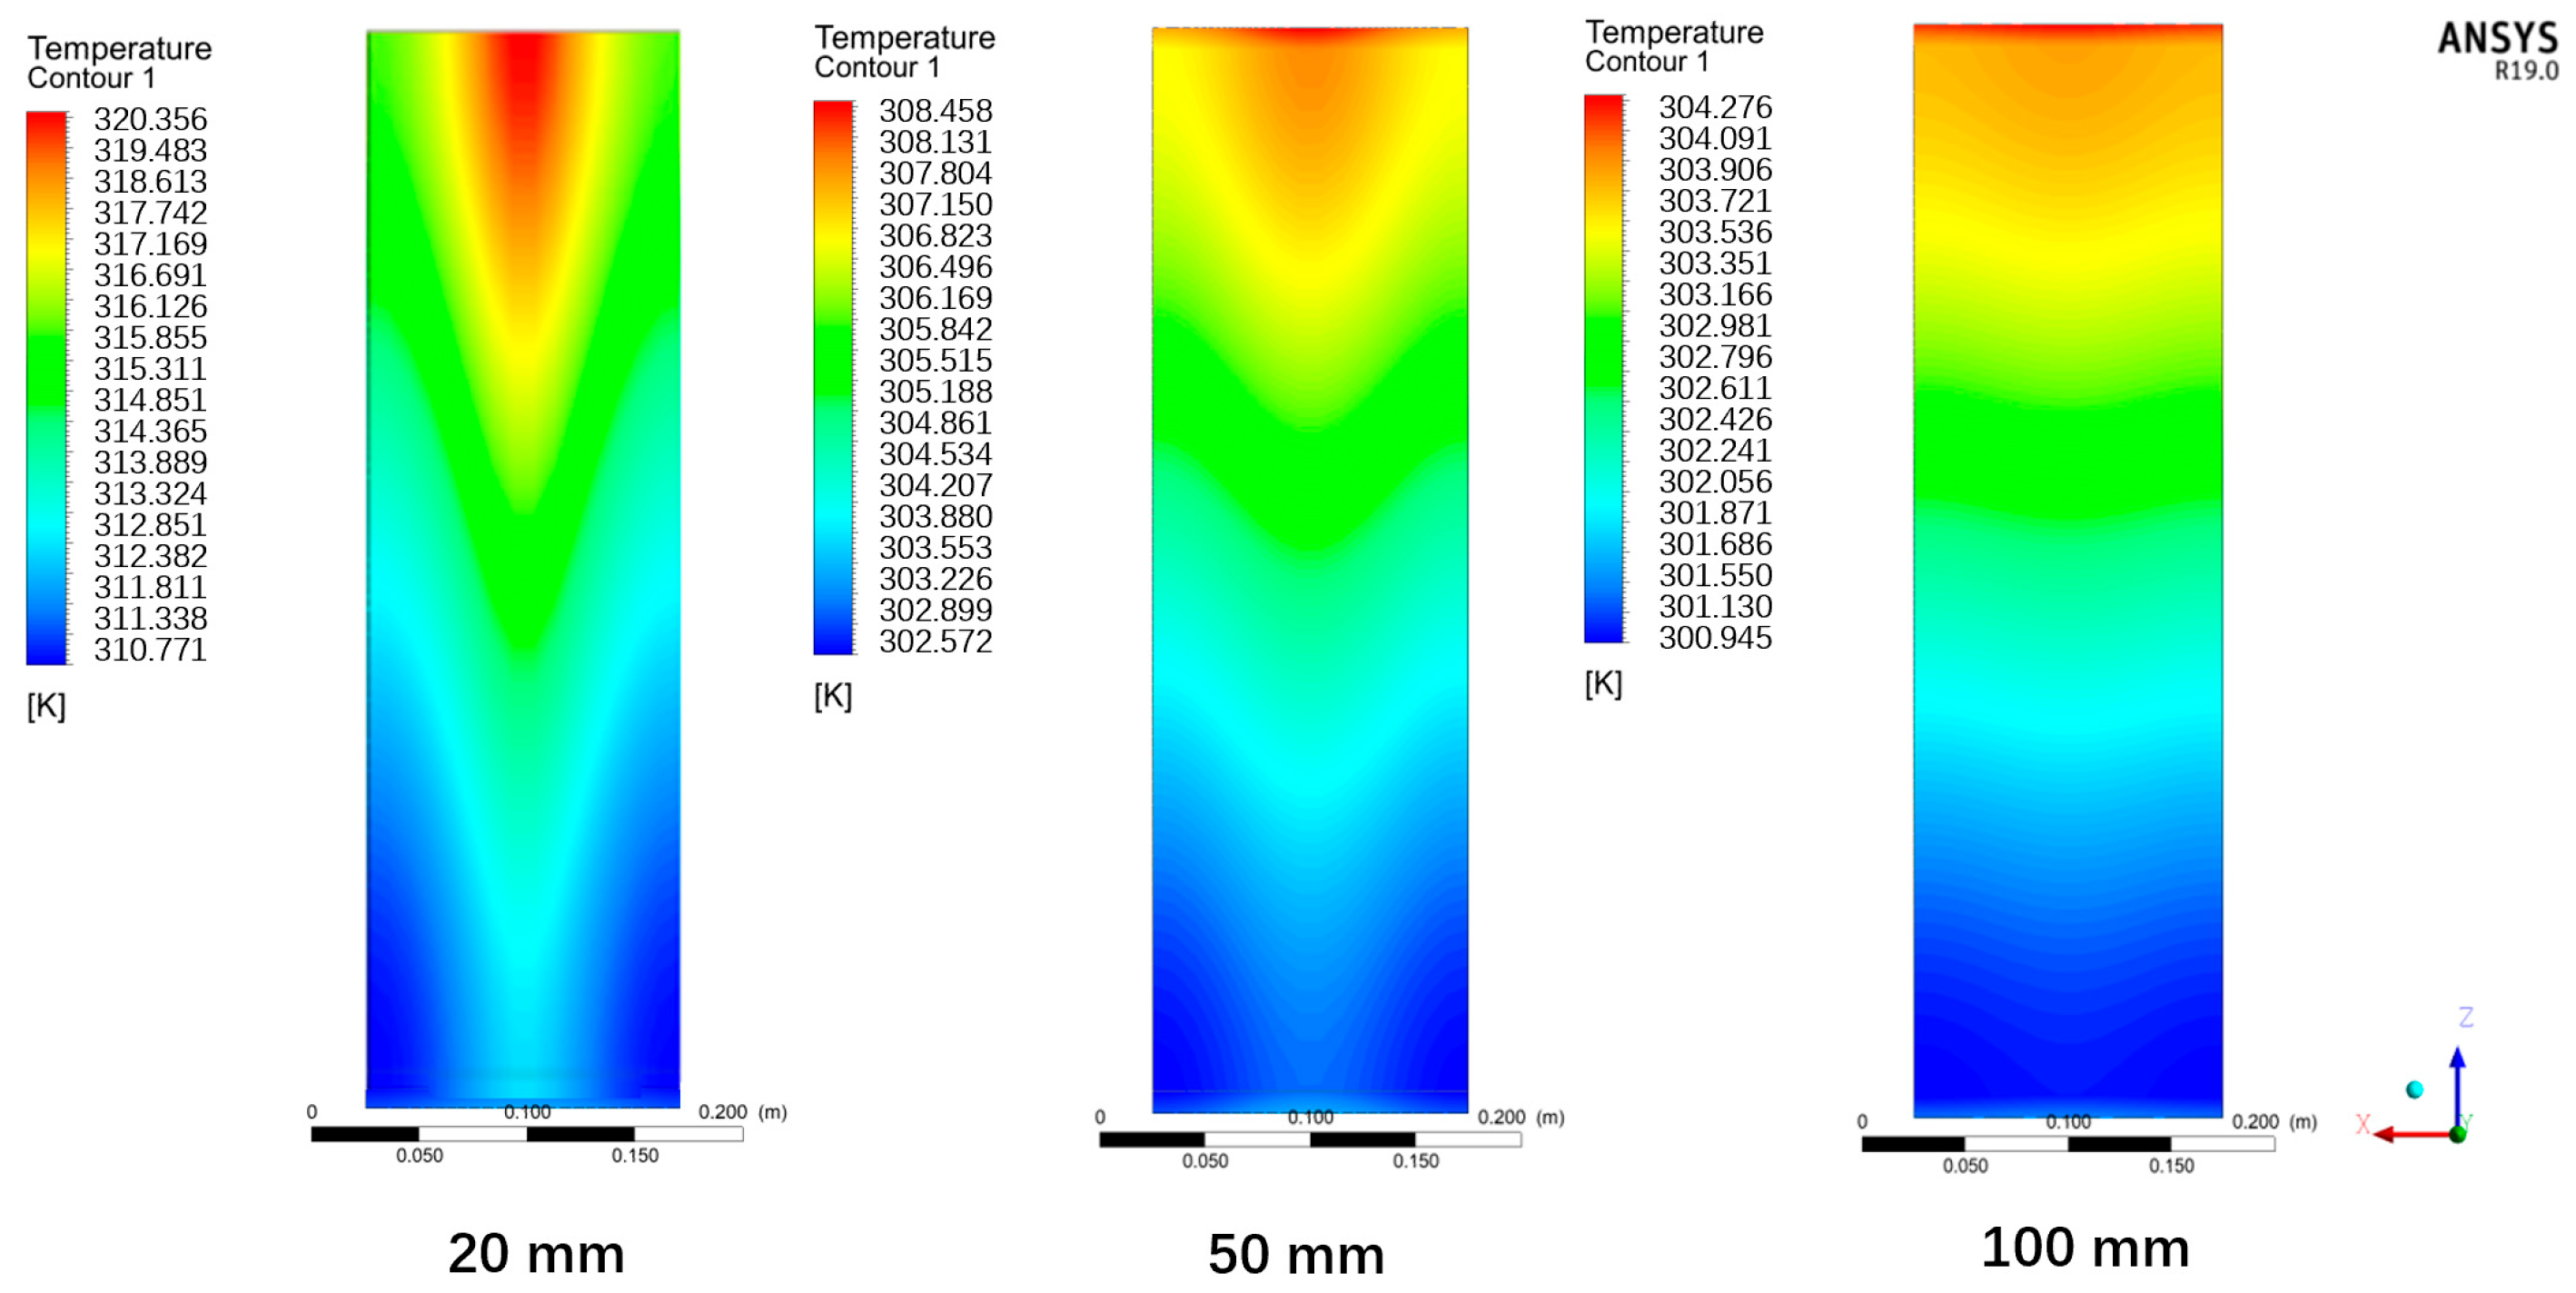
Figure 13 shows the distribution of FST under different covering thicknesses. In the 20 mm thickness, the maximum FST is 47.2 °C, which decreases to 37.7 °C within 500 mm. The mean FST is approximately 43.2 °C. In the 50 mm and 100 mm covering simulation cases, the maximum FST is reduced to 35.5 °C and 31.3 °C, respectively, and the mean FST drops to 32.4 °C and 29.6 °C. Increasing the covering thickness can significantly reduce the FST of the superheated section.
Figure 13.
Effect of covering thickness on FST.
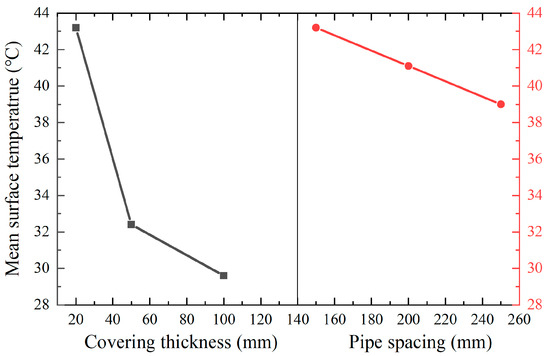
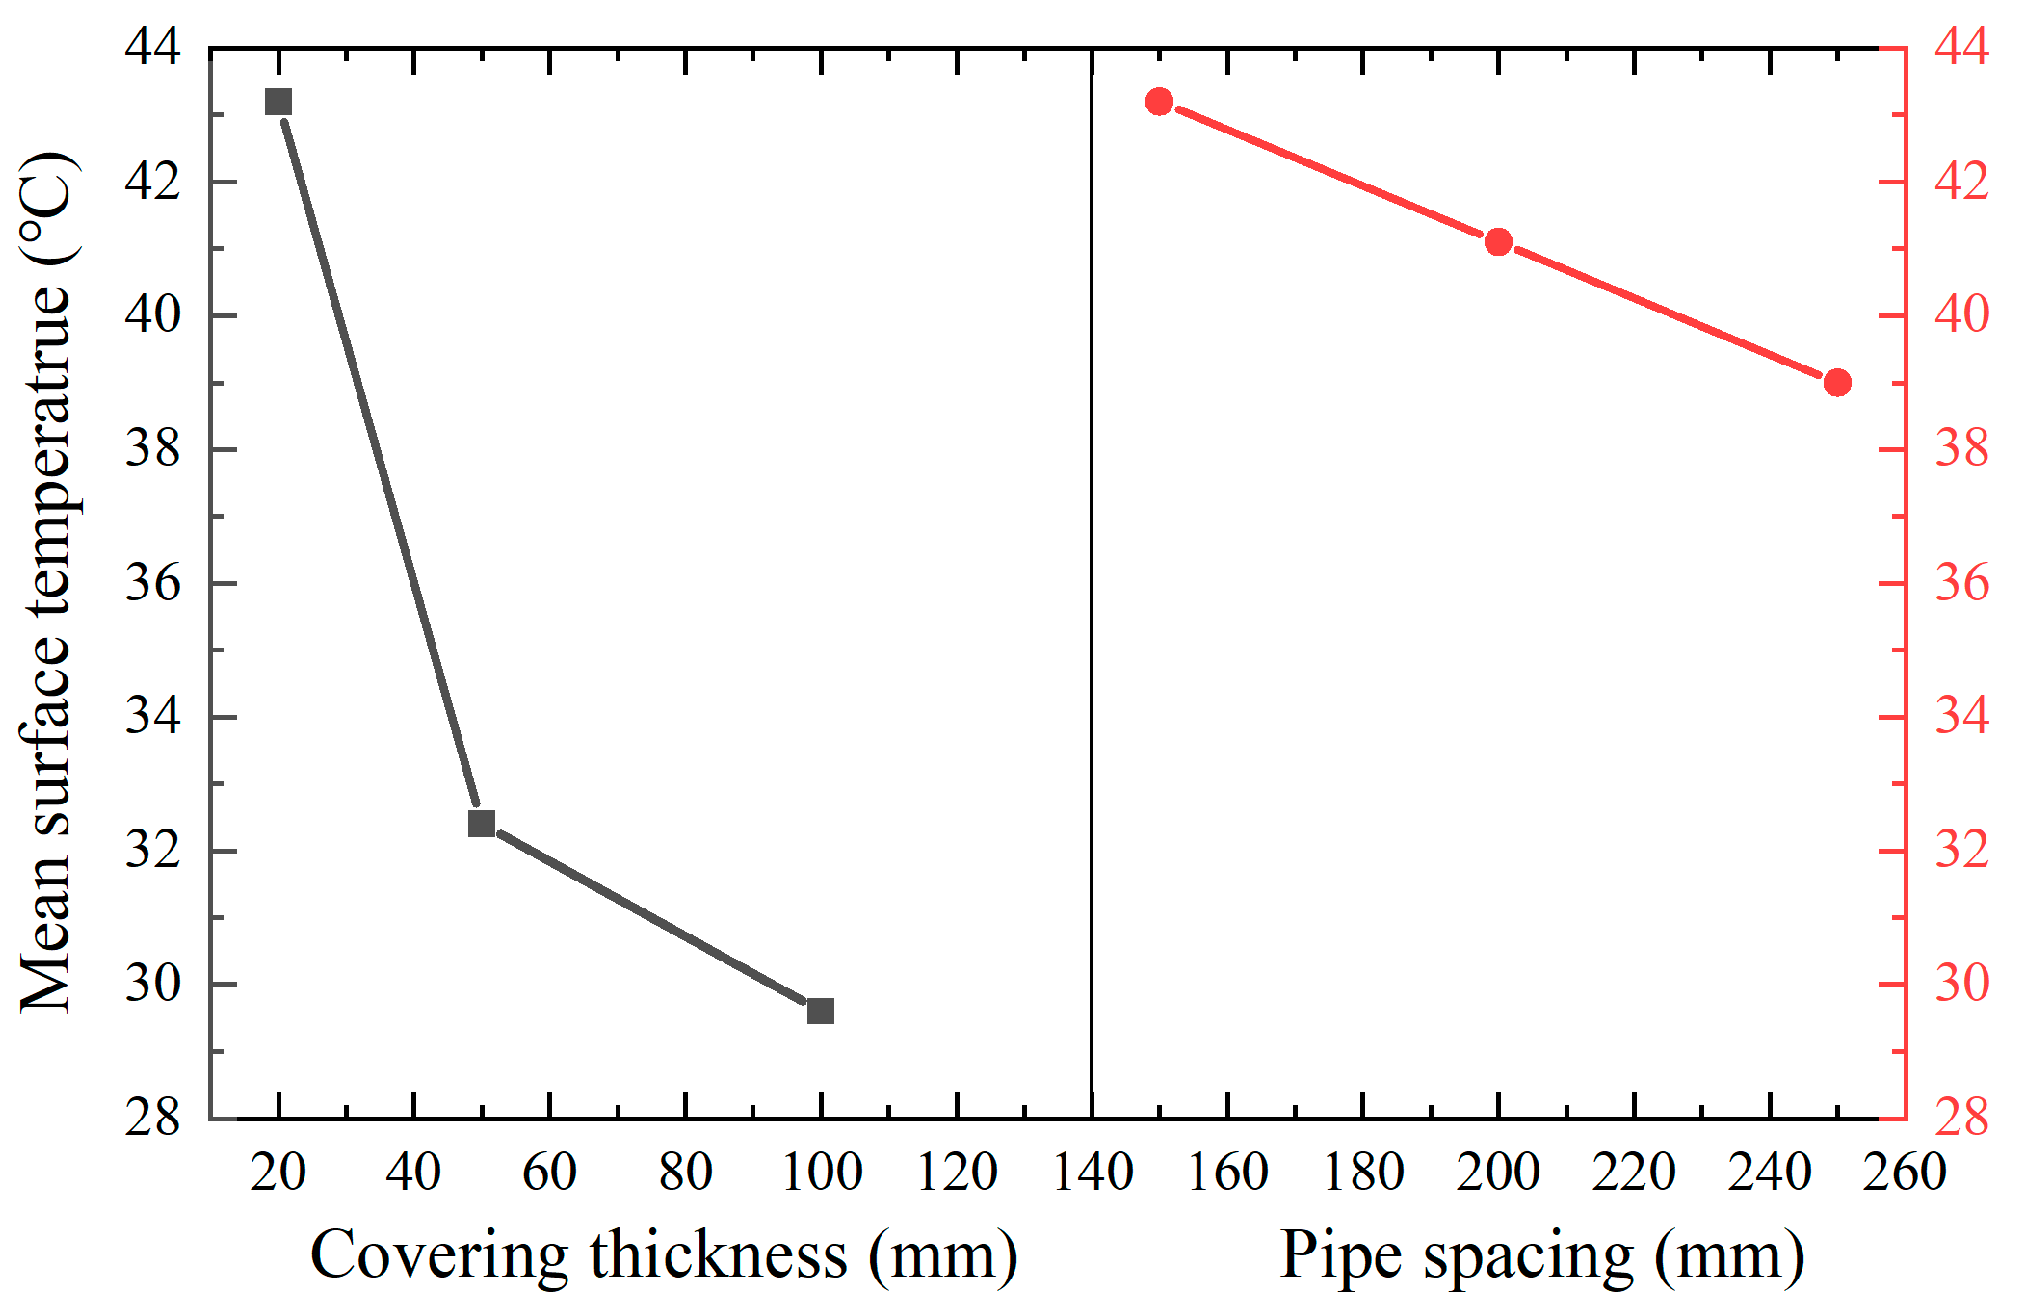
To avoid repetition of similar figures, the distributions of FSTs with different pipe spacing are not presented here, while the mean FST is shown in Figure 14. In this figure, the changes in mean FST of the two measures are compared together. With the 200 mm and 250 mm spacing, the mean FST becomes 41.1 °C and 39 °C, and the decreases are approximately 2 °C and 4 °C, respectively. From the figure, increasing the pipe spacing is not as effective as increasing the covering thickness in reducing the FST of the superheated section.
Figure 14.
Mean FST with different covering thicknesses and spacing.
Increasing the pipe covering thickness is quite effective, but it also increases the overall thickness of the floor. Alternatively, the pipes can also be placed in the concrete bedding layer without increasing the floor thickness. Generally, considering the possibility in practice, the pipe depth of the superheated section can be increased to 40 mm to 60 mm with pipe spacing increasing to 250 mm or larger.
4. Discussion
In this study, through numerical simulations, the variations in mean FST and HF were analyzed under various conditions, including different pipe spacings, surface layer materials, condensation temperatures, and indoor temperatures. It was found that mean FST and HF generally increase with higher thermal conductivity of the surface material, smaller pipe spacing, higher condensation temperatures, and lower indoor temperatures, which is consistent with findings from previous studies [23]. Based on simulated cases, relevant data were compiled in figures and tables for reference in practical engineering design and operational adjustments. Furthermore, effective strategies for reducing the FST of the superheated sections were identified, offering guidance for engineering design and construction of CPF.
In this paper, the heat transfer characteristics of the CPF were analyzed under different condensing temperatures, while its effect on ASHP COP was not considered. Theoretically, the COP of ASHP is affected by multiple factors, including condensing temperature, evaporative temperature, defrosting, etc. From reference [19], the measured COP for the system coupling thermal storage heat pipe radiators with ASHP was 3.3 in an outdoor temperature of 7 °C and mean radiator FST of 40 °C. Zhang et al. [30] suggested a radiant–convective heating system coupled with ASHP, and the COP was 3.11 and 2.78 in standard heating condition and frosting condition, respectively. In reference [24], the ASHP heating system with CPF terminal was tested, which had an average COP of 2.72. A study by Niu et al. [25] reported the COPs of ASHP coupled with CPF, which were 4.99, 4.01, 3.05, respectively, corresponding to outdoor temperatures of 0 °C, −5 °C, and −10 °C. From the field test, the COP was in the range of 2.1 to 2.9 during the operation of a typical day [26]. As the actual conditions of the test were quite different, there were significant differences among the reported COPs. From the results, with the CPF terminal, the condensing temperature can be reduced by at least 5 °C to 10 °C compared to the water circuit ASHP system under the same heating load, which may correspond to the COP increase from 10% to 25%. As this study primarily focuses on the heating performance of the CPF structure, a detailed analysis of the specific performance parameters and related impacts of the ASHP unit are still lacking. Future work should involve developing a comprehensive ASHP system model to evaluate the overall operational effectiveness.
In the simulations, the floor models were developed based on a specific engineering application. While this selected configuration represents a commonly adopted practice in engineering, the resulting FST and HF of CPF may vary if the floor structure or pipe embedding depth changes. Therefore, the current results for FST and HF are limited to the model structure. To promote the application of CPF, it is necessary to conduct further research in different floor structures. In addition, this study primarily focuses on the steady-state heating performance of the CPF structure. Consequently, transient conditions are not simulated. Niu et al. analyzed transient processes such as system heating start-up for a similar structure, indicating a stabilization time of approximately 120 min [25]. Given that the pipe diameters and floor structures employed in their work differ from those in this study, further analysis of the transient process is necessary in order to clarify the dynamic characteristics during the transient process.
In the field test, the 3 mm diameter copper pipes were installed and the length of the pipe of each circuit was 19 m. Practically, the 3 mm diameter is quite beneficial to the floor structure, which allows a minimal increase in floor thickness. However, there will inevitably be a refrigerant pressure drop alongside the pipes. Meanwhile, the pressure drop will also affect the condensing temperature. These factors were neglected in the simulation, and constant condensing temperatures were assumed for the condensing section. In addition, the pressure losses may increase the compressor load and lead to higher power use. Subsequent research can focus on this topic to give a comprehensive evaluation of the capillary pipe diameter and length, pressure drop, and compressor performance.
The effect of pipe diameter has been studied in reference [23], in which the pipe diameter was in the range of 5 mm to 9 mm with pipe spacing of 80 mm to 140 mm. In one simulating case, the mean HF for wood floor surface was approximately 90 W/m2 with a 40 °C condensing temperature and 140 mm spacing, which was close to the value of 98 W/m2 in the simulated case of a wood floor, with a 39 °C condensing temperature, 150 mm spacing, and 22 °C room temperature, in this study. This indicates that the results of HF are quite similar, though the model presented in the reference is not entirely consistent with that of this study. From reference [23], the HF gets higher with an increased pipe diameter. From the point of increasing HF and decreasing refrigerant pressure drop, it is advantageous to increase the capillary pipe diameter. However, increased pipe diameter can make the packing layer thicker. Therefore, the optimal pipe diameter in CPF should be further investigated.
Niu et al. conducted experiments on a prototype ASHP coupling with CPF, which was built based on a 1 HP compressor [25]. The pipe spacing, filling layer thickness and condensation temperature to the floor were studied through theoretical calculation, and the heating process for a constant CPF structure was experimentally investigated. They suggested an optimal capillary spacing of 100 mm and an appropriate condensing temperature range between 34 °C and 40 °C. According to results presented in this paper, increasing the pipe spacing leads to larger temperature unevenness on the floor surface. However, with small pipe spacing, both the FST and HF values become higher under same condensing temperature, which may lead to overheating. Therefore, the actual selection of pipe spacing requires comprehensive consideration, and should be based on the heating load. The CPF provides high surface HF, thereby significantly facilitating the further reduction in condensing temperature. In the development of ASHP units coupled with CPF, this characteristic should be fully utilized to achieve COP improvement while maintaining stable operation.
5. Conclusions
Based on an actual engineering application and typical floor structure, this paper studied the heating characteristics of CPF used in ASHP units. Based on the 3 mm diameter of capillary copper pipe, the effects of pipe spacing, floor surface material, condensing temperature, and room temperature on the FST and HF were analyzed by simulation. Possible solutions to reduce the high FST in the superheated section were also proposed. The study provides comprehensive data that can be referred to in the design of the CPF system and the adjustment of the condensing temperature of the ASHP unit during operation. The main conclusions are as follows.
For the three commonly used floor surface materials, with the highest conductivity coefficient, the marble surface has the highest FST and releases more heat under the same CPF structure and condensing temperature, which is followed by the ceramic tile and wood surface. The difference between marble and ceramic tile is much smaller. Analysis shows that the changes in HF and FST are more significant when the conductivity coefficient is smaller than 1.2 W/(m·K).
With an increase in condensing temperature, both the FST and HF increase accordingly. The increase is different under a different CPF structure. When the pipe spacing becomes larger, the increase declines. The increase with marble floor is the highest among the three floor materials. When the room temperature increases, the FST also increases, while the HF decreases. For the simulated cases, the FST is in the range of 21.2 °C to 35.3 °C, and the HF is in the range of 16.6 W/m2 to 169.1 W/m2, which provides various selections for practical applications during heating.
To show how the simulated data can be used from the perspective of CPF design, based on the assumed requirements of room heating, an example application was presented. The selection of appropriate pipe spacing should be based on the requirement of FST and HF. Meanwhile, the adjustable range of the refrigerant condensing temperature should also be considered.
To reduce the FST of the superheated section, measures of increasing covering thickness and spacing are simulated. The results indicate that increasing the covering thickness of the superheated section is more effective than increasing the pipe spacing. Increasing the covering thickness of the pipes can be achieved by increasing the local thickness of the floor, which may be impractical, as it would cause an uneven floor level and introduce construction complications. As an alternative choice, the pipes carrying superheated refrigerant could be placed at a greater depth beneath the floor surface without increasing the floor thickness. Considering the feasibility in practice, the pipe depth of the superheated section is recommended to be 40 mm to 60 mm, with the pipe spacing increasing to 250 mm or larger.
Author Contributions
Conceptualization, H.W.; methodology, H.W.; software, L.C.; validation, L.C. and Y.W.; formal analysis, H.W., L.C. and A.Y.; investigation, Y.W., L.C. and C.D.; resources, X.F. and K.G.; data curation, X.F. and A.Y.; writing—original draft preparation, H.W. and L.C.; writing—review and editing, H.W., L.C. and X.F.; visualization, K.G. and C.D.; supervision, H.W.; project administration, H.W.; funding acquisition, H.W. All authors have read and agreed to the published version of the manuscript.
Funding
This research is funded by the National Natural Science Foundation of China (Grant No. 52378100) and the Natural Science Foundation of Shandong Province (No. ZR2022ME035).
Data Availability Statement
The data presented in this study are available upon request from the corresponding author.
Conflicts of Interest
The authors declare no conflicts of interest.
Nomenclature
The following nomenclature are used in this manuscript:
| Variable | |||
| din | Inner diameter of copper pipe (mm) | Rpipe | Total wall resistance of copper pipe and PE film ((m·k)/W) |
| dout | Outer diameter of copper pipe (mm) | λcopper | Thermal conductivity coefficient for copper ((m·k)/W) |
| dPE.out | Outer diameter of PE film (mm) | λPE | Thermal conductivity coefficient for PE ((m·k)/W) |
| q | Floor surface heat flux (W/m2) | htot | Synthesized convective and radiative heat transfer coefficient (W/(m2·K)) |
| tn | Indoor air temperature (°C) | tw | Floor surface temperature (°C) |
| Abbreviation | |||
| ASHP | Air source heat pump | HF | Heat flux |
| CFD | Computational fluid dynamics | PE | Polyethylene |
| COP | Coefficient of performance | PVC | Polyvinyl chloride |
| CPF | Capillary pipe floor | RH | Relative humidity |
| FST | Floor surface temperature | ||
References
- Han, C.; Kim, J.; Jang, D.S.; Kim, Y. Energy, economic, and environmental performance analysis of hybrid water source heat pumps with directly connected solar collectors. Appl. Therm. Eng. 2025, 284, 129082. [Google Scholar] [CrossRef] [Scilit]
- Sun, Z.; Xu, H.; Hou, F.; Wang, Q.; Zhang, W.; Guo, S. Performance of air-source heat pump system with flow-proportioning rectifying nozzle distributor. Appl. Therm. Eng. 2026, 288, 129609. [Google Scholar] [CrossRef] [Scilit]
- Seo, J.; Jung, D.E.; Shin, D.H.; Kim, T.; Kim, J. Performance gap analysis of air-source heat pumps: From rated specifications to field measurements. J. Build. Eng. 2026, 119, 115382. [Google Scholar] [CrossRef] [Scilit]
- Kazjonovs, J.; Sipkevics, A.; Jakovics, A.; Dancigs, A.; Bajare, D.; Dancigs, L. Performance analysis of air-to-water heat pump in Latvian climate conditions. Environ. Clim. Technol. 2014, 14, 18–22. [Google Scholar] [CrossRef] [Scilit]
- Zhao, M.; Gu, Z.L.; Kang, W.B.; Liu, X.; Zhang, L.Y.; Jin, L.W.; Zhang, Q.L. Experimental investigation and feasibility analysis on a capillary radiant heating system based on solar and air source heat pump dual heat source. Appl. Energy 2017, 185, 2094–2105. [Google Scholar] [CrossRef] [Scilit]
- Zhang, S.; Liu, S.; Shen, Y.; Shukla, A.; Mazhar, A.R.; Chen, T. Critical review of solar-assisted air source heat pump in China. Renew. Sustain. Energy Rev. 2024, 193, 114291. [Google Scholar] [CrossRef] [Scilit]
- Wei, W.; Guo, Y.; Wang, W.; Jiang, Z.; Zhang, X.; Dai, C.; Sun, Y.; Li, B.; Wang, S.; Zhang, C. Development of a universal frosting rate prediction model for optimizing the defrosting control strategy of air source heat pumps. Energy 2026, 344, 139859. [Google Scholar] [CrossRef] [Scilit]
- Wang, W.; Tan, Y.; Wei, W.; Sun, Y.; Han, S.; Dai, C. A performance prediction model of variable frequency air source heat pump used for photovoltaic power generation scheduling in low-carbon buildings. Renew. Energy 2025, 238, 121960. [Google Scholar] [CrossRef] [Scilit]
- Qiao, H.; Aute, V.; Radermacher, R. Transient modeling of a flash tank vapor injection heat pump system–Part I: Model development. Int. J. Refrig. 2015, 49, 169–182. [Google Scholar] [CrossRef] [Scilit]
- Yousaf, S.; Bradshaw, C.R.; Kamalapurkar, R.; San, O. Development and performance evaluation of empirical models compatible with building energy modeling engines for unitary equipment. Sci. Technol. Built Environ. 2025, 31, 533–550. [Google Scholar] [CrossRef] [Scilit]
- Yousaf, S.; Raza, S.M.M.; Khan, A.; Bradshaw, C.R. A reduced-order model for predicting transient performance of air-source heat pumps. Appl. Energy 2026, 408, 127412. [Google Scholar] [CrossRef] [Scilit]
- Ibrahim, O.; Fardoun, F.; Younes, R.; Louahlia-Gualous, H. Air source heat pump water heater: Dynamic modeling, optimal energy management and mini-tubes condensers. Energy 2014, 64, 1102–1116. [Google Scholar] [CrossRef] [Scilit]
- Lin, B.; Wang, Z.; Sun, H.; Zhu, Y.; Ouyang, Q. Evaluation and comparison of thermal comfort of convective and radiant heating terminals in office buildings. Build. Environ. 2016, 106, 91–102. [Google Scholar] [CrossRef] [Scilit]
- Sun, Y.; Chen, X.; Wu, S.; Wei, W.; Wang, W.; Deng, S. Performance analysis of air source heat pump space heating system with an adaptive control for supply water temperature. Appl. Therm. Eng. 2022, 211, 118401. [Google Scholar] [CrossRef] [Scilit]
- Wang, W.; Jiang, J.; Hu, B.; Wang, R.Z.; Luo, M.; Zhang, G.; Xiang, B. Performance improvement of air-source heat pump heating system with variable water temperature difference. Appl. Therm. Eng. 2022, 210, 118366. [Google Scholar] [CrossRef] [Scilit]
- Liao, W.; Peng, J.; Luo, Y.; He, Y.; Li, N.; Yongga, A. Comparative study on energy consumption and indoor thermal environment between convective air-conditioning terminals and radiant ceiling terminals. Build. Environ. 2022, 209, 108661. [Google Scholar] [CrossRef] [Scilit]
- Hu, B.; Wang, R.Z.; Xiao, B.; He, L.; Zhang, W.; Zhang, S. Performance evaluation of different heating terminals used in air source heat pump system. Int. J. Refrig. 2019, 98, 274–282. [Google Scholar] [CrossRef] [Scilit]
- Ji, J.; Pei, G.; Chow, T.T.; He, W.; Zhang, A.; Dong, J.; Yi, H. Performance of multi-functional domestic heat-pump system. Appl. Energy 2005, 80, 307–326. [Google Scholar] [CrossRef] [Scilit]
- Sun, S.; Xu, S.; Rong, W.; Ma, G.; Zhang, Y. Experimental study of a system coupling thermal storage heat pipe radiators with air-source heat pump. Appl. Therm. Eng. 2025, 280, 128454. [Google Scholar] [CrossRef] [Scilit]
- Zhang, H.; Jiang, L.; Zheng, W.; You, S.; Jiang, T.; Shao, S.; Zhu, X. Experimental study on a novel thermal storage refrigerant-heated radiator coupled with air source heat pump heating system. Build. Environ. 2019, 164, 106341. [Google Scholar] [CrossRef] [Scilit]
- Shao, S.; Wei, W.; Li, W.; Xu, C. Performance evaluation and optimization research of a direct condensation aluminum heating panel integrated with the air source heat pump system. Energy Build. 2025, 341, 115841. [Google Scholar] [CrossRef] [Scilit]
- Dong, J.; Zhang, L.; Deng, S.; Yang, B.; Huang, S. An experimental study on a novel radiant-convective heating system based on air source heat pump. Energy Build. 2018, 158, 812–821. [Google Scholar] [CrossRef] [Scilit]
- Ma, K.R.; Hou, N.N.; Wang, X.; Wang, X.G.; Gao, Y. Analysis and Study of the Effect of the Direct Floor Radiant Heating System of the Air Source Heat Pump at Heating Working Conditions. Int. J. Simul. Syst. Sci. Technol. 2016, 17, 1. [Google Scholar] [CrossRef] [Scilit]
- Dong, X.; Tian, Q.; Li, Z. Energy and exergy analysis of solar integrated air source heat pump for radiant floor heating without water. Energy Build. 2017, 142, 128–138. [Google Scholar] [CrossRef] [Scilit]
- Niu, J.; Wang, H.; Lv, T.; Xu, S. Experimental research of heating characteristics on an air source heat pump system with capillary direct floor radiant. Int. J. Refrig. 2025, 170, 224–235. [Google Scholar] [CrossRef] [Scilit]
- Wang, L.; Wang, H.; Shi, C.; Li, W.; Wang, J.; Wang, G. Experimental Study on Operation Characteristics of Air Source Heat Pump System Based on Refrigerant Capillary Floor Heating. Build. Sci. 2022, 38, 105–114. (In Chinese) [Google Scholar] [CrossRef]
- JGJ 142-2012; Industry Standards of the People’s Republic of China. Technical Specification for Radiant Heating and Cooling. China Architecture & Building Press: Beijing, China, 2012. (In Chinese)
- Zou, R.; Wu, H.; Liu, Y.; Yang, W.; Wang, Y. The Influence of Floor Surface Emissivity on Performance of Floor Heating. J. Build. Energy Environ. 2021, 40, 14–18. (In Chinese) [Google Scholar] [CrossRef]
- Liu, Y.; Wang, D.; Liu, J. Study on heat transfer process for in-slab heating floor. Build. Environ. 2012, 54, 77–85. [Google Scholar] [CrossRef] [Scilit]
- Zhang, L.; Dong, J.; Jiang, Y.; Deng, S.; Huang, S. An experimental study on frosting and defrosting performances of a novel air source heat pump unit with a radiant-convective heating terminal. Energy Build. 2018, 163, 10–21. [Google Scholar] [CrossRef] [Scilit]

Disclaimer/Publisher’s Note: The statements, opinions and data contained in all publications are solely those of the individual author(s) and contributor(s) and not of MDPI and/or the editor(s). MDPI and/or the editor(s) disclaim responsibility for any injury to people or property resulting from any ideas, methods, instructions or products referred to in the content. |
© 2026 by the authors. Licensee MDPI, Basel, Switzerland. This article is an open access article distributed under the terms and conditions of the Creative Commons Attribution (CC BY) license.