


Abstract
Reducing embodied greenhouse gas emissions in the initial design phase is essential for attaining low-carbon buildings, as the highest potential for reduction exists prior to the finalization of construction decisions. While Building Information Modelling (BIM) and Life Cycle Assessment (LCA) have been progressively integrated for embodied carbon evaluation, current frameworks are predominantly deterministic, offer minimal uncertainty quantification, and seldom utilize machine-learning-assisted optimization to facilitate design decision-making. This paper presents an uncertainty-aware BIM–LCA methodology to solve these shortcomings, integrating automated quantity takeoff, probabilistic carbon assessment, and explainable machine-learning optimization. The proposed methodology integrates IFC-based BIM models, Bills of Quantities (BoQs), and regional life cycle inventory databases to conduct a cradle-to-grave embodied carbon assessment. Quantities produced from BIM were checked against BoQ data, and the uncertainty related to material quantities and emission factors was assessed by Monte Carlo simulation. A machine-learning surrogate model was created with 1200 design samples to facilitate swift optimization, and SHapley Additive exPlanations (SHAPs) were utilized to determine the most significant design factors. A mid-rise residential structure in Chongqing, China, encompassing a gross floor area of 9750.03 m2, was used as a case study. The baseline Global Warming Potential (GWP) was calculated as 514.29 ± 30.09 kgCO2e/m2 (A1–A5), with product-stage emissions (A1–A3) accounting for roughly 89.28% of total embodied carbon, predominantly from concrete and steel. Enhanced BIM maturity lowered uncertainty by roughly 20%. Optimization resulted in a 38.13% decrease in embodied carbon, reducing GWP to 318.21 kgCO2e/m2. SHAP research identified the percentage of material reuse and concrete composition as the primary factors influencing carbon reduction. The suggested framework offers a clear and replicable decision-support mechanism for low-carbon building design that accounts for uncertainty.
1. Introduction
Studying the characteristics of carbon dioxide emissions and the potential for emission reductions in the construction industry in China is meaningful. The construction sector has significantly contributed to atmospheric heat emissions, increasing global temperatures [1].
Global greenhouse gas emissions constitute 39% of energy use [1,2] and 11% of material manufacturing [3]. The substantial footprint stems from embodied carbon emissions from material extraction, production, transportation, construction, maintenance, and end-of-life processes, rather from operational emissions during building occupancy [4,5]. Due to climate challenges, EU regulations such as Levels, Taxonomy, and EPBD now require life cycle analyses for environmental claims [6,7]. These policies assess life cycle impacts as operational emissions decrease through energy efficiency regulations [8,9]. In new energy-efficient buildings, embodied carbon exceeds operational carbon, comprising more than 50% of total life cycle emissions [10], requiring early life cycle assessment tools for cost-effective mitigation [11].
Building Information Modeling has changed sustainability practices through automated quantity takeoffs, smooth data interchange, and visual understanding of environmental effects, replacing labor-intensive manual LCA procedures [12]. Compared to conventional approaches, integration of BIM and LCA has been shown to improve efficiency and reduce calculation time while maintaining acceptable accuracy [13,14]. Such integrations have been applied to a range of life cycle stages defined from the product and construction stages to the end-of-life and beyond-system boundaries, and across scales ranging from individual buildings to larger developments [10,15].
Although progress has been made, significant problems remain with widespread BIM-LCA adoption [16]. Poor interoperability between systems hinders data transfer from BIM tools to Glodon GTJ2021 [14,17,18]. Mismatches between BIM elements and life cycle databases complicate impact assessment and require manual intervention [6,19]. These challenges increase in early design stages with incomplete models, especially for those lacking LCA expertise [14]. Uncertainty from incomplete information and material assumptions affects decision reliability [3,20]. Gaps exist in renovation projects, database content, and environmental–economic integration. Current visualization methods remain static and inaccessible, limiting group decision-making [21].
Despite considerable progress in the integration of BIM and LCA for the evaluation of embodied carbon, numerous critical deficiencies persist. Primarily, the majority of current BIM–LCA procedures depend on deterministic calculations and offer minimal attention to the propagation of uncertainty stemming from material quantities, emission factors, and preliminary design assumptions. Second, despite the recent introduction of machine-learning approaches to enhance sustainable building design, their incorporation into BIM–LCA frameworks for the optimization of embodied carbon is still limited. Current research predominantly emphasizes predictive accuracy, offering minimal insight into how design choices affect carbon results. Third, localized BIM–LCA frameworks for residential structures in China are limited, especially those that include region-specific emission variables and probabilistic analysis.
The contributions of this study are threefold. This paper presents an uncertainty-aware BIM–LCA system to mitigate these limitations, incorporating automated BIM-based quantity extraction, Monte Carlo uncertainty analysis, and machine-learning-assisted optimization. This study makes three key contributions:
- A BIM–LCA workflow is established to automate quantity takeoff and embodied carbon evaluation for preliminary residential construction design.
- Monte Carlo simulation is utilized to clearly quantify the uncertainty related to material quantities and emission parameters, hence enhancing the reliability of carbon estimations.
- An XGBoost surrogate model integrated with SHAP-based explainable artificial intelligence is utilized to discern critical design factors and enhance low-carbon material methods, resulting in a 38.13% decrease in embodied carbon compared with the baseline design.
RQ1: How can BIM and LCA be integrated to provide reliable embodied-carbon assessments during early-stage residential building design?
RQ2: How does uncertainty propagation influence embodied-carbon estimates and design decision-making?
RQ3: Which design variables most strongly affect embodied carbon, and how can machine-learning-assisted optimization support low-carbon building design?
2. Literature Review
2.1. Embodied Carbon Assessment
LCA is the main way to measure the carbon in buildings over time looks at whole buildings, and focuses on products [8,22]. These rules include parts A1–A3, B1–B7, and C1–C4, and have benefits beyond the system [9]. A detailed method that tracks the supply chain can miss data, especially in the early stages [23]. Hybrid models use economic tables for a fuller picture but lose local details [24]. Studies of over 650 building LCAs have shown that greenhouse gases can constitute 20–50% of low-energy building emissions. The global average for stages A1 to A5 is approximately 600 kgCO2e/m2 at the beginning. Differences in regions arise from system boundaries, allocation methods, and local data [10]. As the EU reduces operational emissions, embodied emissions rise due to changes that cut materials like concrete and steel, which can account for up to 70% of the initial impact [8]. They fail early checks due to poor inventories and unclear data, so probabilistic models such as Monte Carlo and fuzzy logic are needed to handle uncertainties in materials and data [20]. New methods combine process and input–output data with BIM metrics for better accuracy, with less than 5% inconsistency compared with full life cycle assessments [3].
2.2. BIM Applications
The Building Information Model has transformed sustainability assessments by automating quantity takeoffs, facilitating dynamic Life Cycle Assessment, and replacing manual spreadsheets, with discrepancies under 1% and an 80% time savings [13,14]. Recent developments include AI-assisted semantic enrichment and multi-objective optimization through Python visual scripting for GWP, LCC, and social-LCA exploration [3,18]. Parametric Life Cycle Assessment executes variants such as Grasshopper and incorporates LOD-restricted benchmarks. While effective in detailed designs with less than 1% variance in educational building cases, this approach applies only to new construction, not renovation, where embodied energy exceeds 70% due to demolition and material reuse challenges [14]. These analyses focus on Global Warming Potential rather than holistic Life Cycle Sustainability Assessment, limiting their effectiveness for circular economy goals such as the 70% metal threshold of EU Taxonomy. BIM enables district-level extensions with CityGML for urban CIM and embedded impact aggregation [17].
2.3. The Link Between BIM and Design-Oriented Carbon Assessment
Although some advancements exist, BIM–LCA coupling has systematic deficiencies inhibiting design phase implementation [3]. Interoperability issues such as non-standardized IFC maps and schema differences cause manual steps leading to 20% errors in LOD 100–200 models [17]. Incomplete semantics, including placeholders and regional LCI variances, reduce reliability with limited visualization via MC or fuzzy sets [3,20]. Early phases show doubled errors from unrefined placeholders [12]. Research on renovations, dynamic openBIM exchanges, and integrated decision aids is limited. Static outputs fail non-expert users by missing causal links between options and reductions, whereas LOD inconsistencies persist without unified guidelines for BIM–LCA alignment [14,17].
2.4. Technological Advancements in BIM–LCA Integration
Recent improvements have mitigated deficiencies through AI/ML-enhanced automation and interactive technologies. Recent studies have introduced Natural Language Processing (NLP)-based semantic models to autonomously rectify incomplete Building Information Modelling (BIM) semantic data prior to the integration of building components into life cycle inventory databases, thereby enhancing automation and minimizing manual intervention in embodied carbon assessment [3,25]. Topological rules with machine learning for semantic enhancement, such as BOT ontologies, enable lossless IFC exchanges without plugins, as demonstrated in BIM4D [26]. Interactive 3D visualization in openBIM viewers, with color-coded transparencies and box plots, illustrates the GWP uncertainty range, aiding non-expert hotspot investigations [3]. ML surrogate models accelerate forecasts by replacing finite element analysis with real-time embedded carbon estimates via SketchUp plugins, while copula nested Monte Carlo methods assess aleatory and epistemic methods [27,28]. Parametric tools such as CAALA and Grasshopper integrate PLCA for LOD adaptive operations [29]. LLMs/ML hybrids enhance low-carbon designs through optimization [30]. The validated cases show variances below 1%, saving 20 h; however, harmonization of the EPD is required [14,26].
3. Methodology and Materials
3.1. Framework Overview
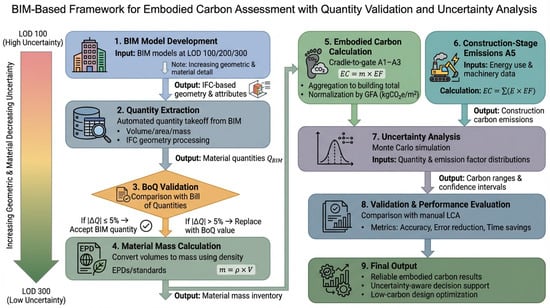
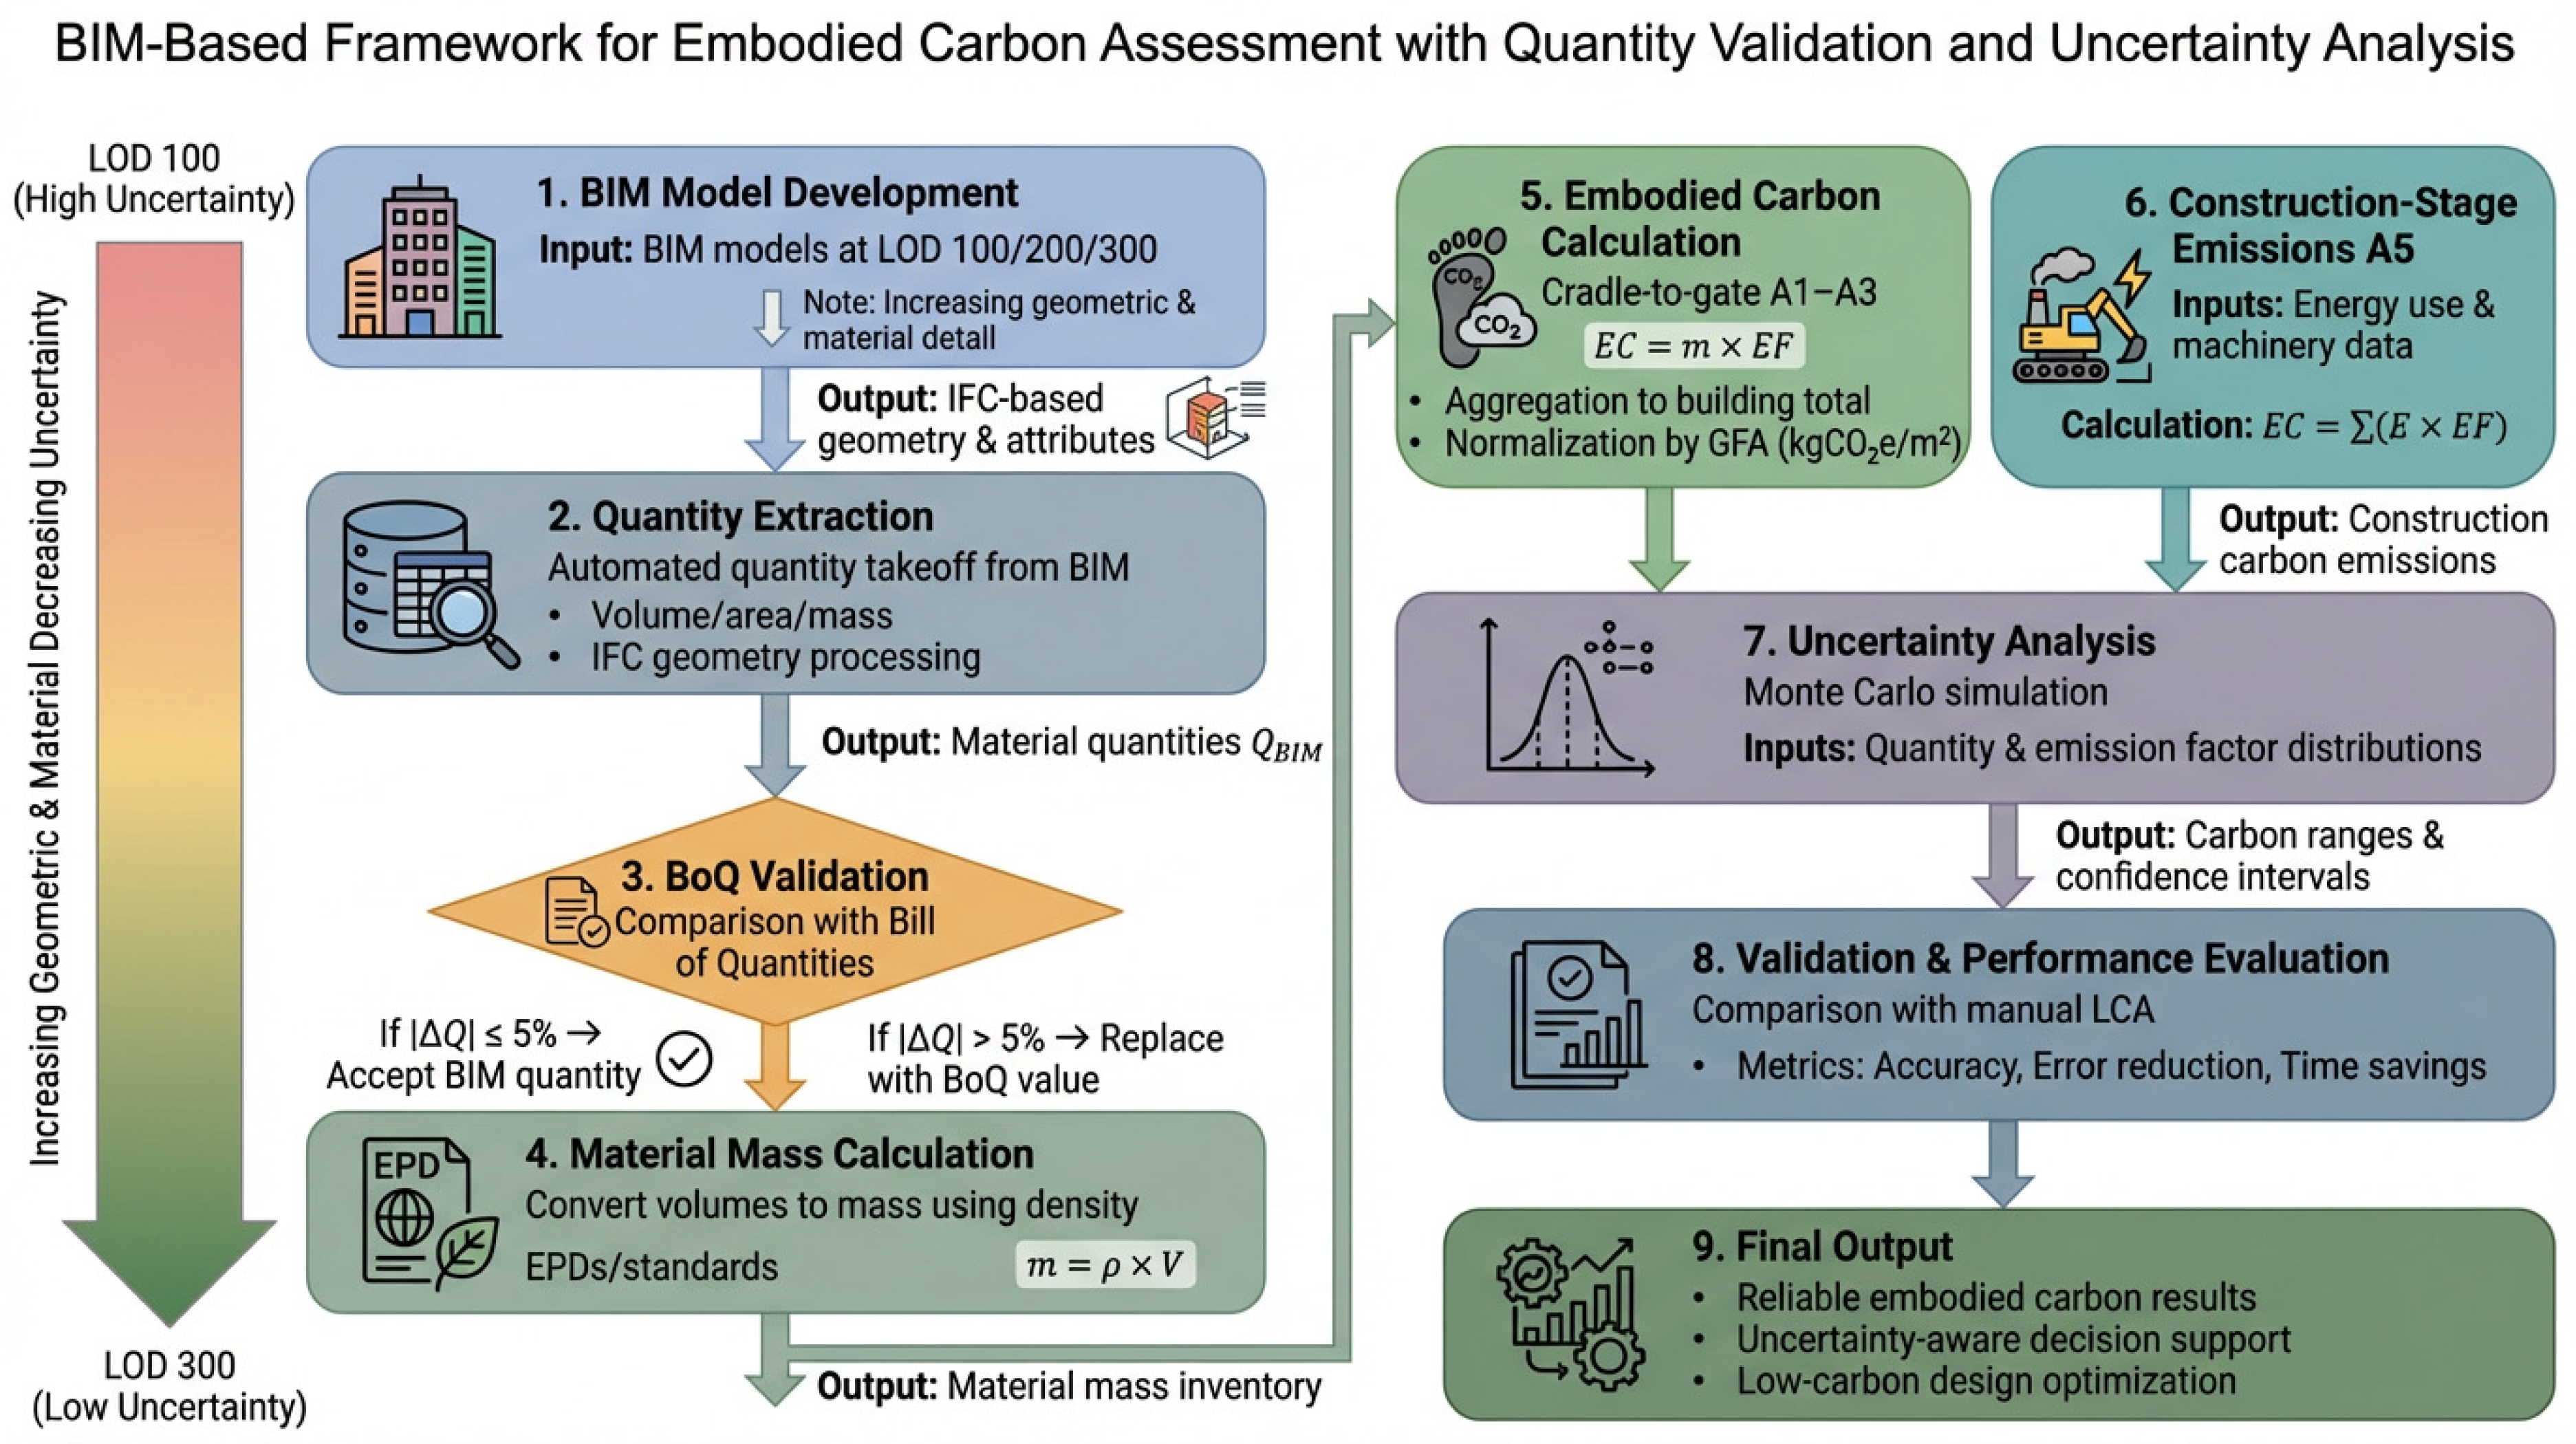
This study establishes a methodological framework within Building Information Modelling (BIM) to enable early-stage assessment of embodied carbon in construction projects, as schematically outlined in Figure 1. The framework systematically integrates data from detailed BIM models, Bills of Quantities (BoQs), and life cycle inventory (LCI) databases, ensuring that material quantities are derived from geometrically accurate models, align with practical feasibility, and adhere to prevailing procurement standards [14,31]. As illustrated in Figure 1, the proposed methodology follows a structured sequential workflow: it begins with the development of BIM models at advanced levels of detail, proceeds to automated quantity takeoffs validated against BoQs, assigns material-specific carbon emission factors from LCI sources, conducts embodied carbon calculations at both the element and whole-building levels, and concludes with uncertainty analysis and verification of the results. The visual representation in Figure 1 further clarifies the interdependencies among these stages and highlights the feedback mechanisms for validation. This approach emphasizes reproducibility and consistency by aligning with established BIM authoring platforms and life cycle assessment (LCA) software frameworks, thereby facilitating reliable and scalable carbon accountability from the initial design phase.
Figure 1.
Methodological framework for BIM-based embodied carbon assessment.
The workflow integrates progressively detailed BIM models with automated quantity extraction, Bill of Quantities (BoQ) validation, and life cycle inventory data to compute embodied carbon at both the element and building levels. Construction-stage emissions were incorporated, and the uncertainty was quantified using a Monte Carlo simulation to reflect the variability in material quantities and emission factors. The framework emphasizes interoperability, validation, and uncertainty awareness, providing reliable decision support for early-stage low-carbon building design.
3.2. Overview of Project
The proposed BIM–LCA framework was applied to a prototypical mid-rise residential building in Chongqing, China, for demonstration. The structure comprises eleven aboveground stories and one underground level, with a gross floor area (GFA) of 9750.03 m2 and an overall height of 32.6 m. The building uses a conventional reinforced concrete (RC) frame, masonry infill, structural steel components, and standard finishes. A material reuse fraction of 70% (by mass) was adopted, which is consistent with the regional 2023 demolition recovery rate reported by Pomponi et al. (2021) [27].
3.3. Construction of Model
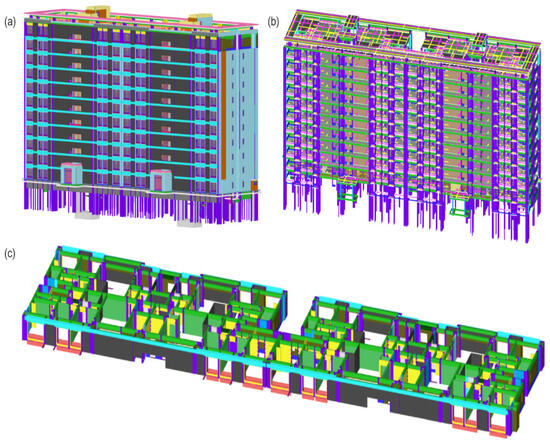
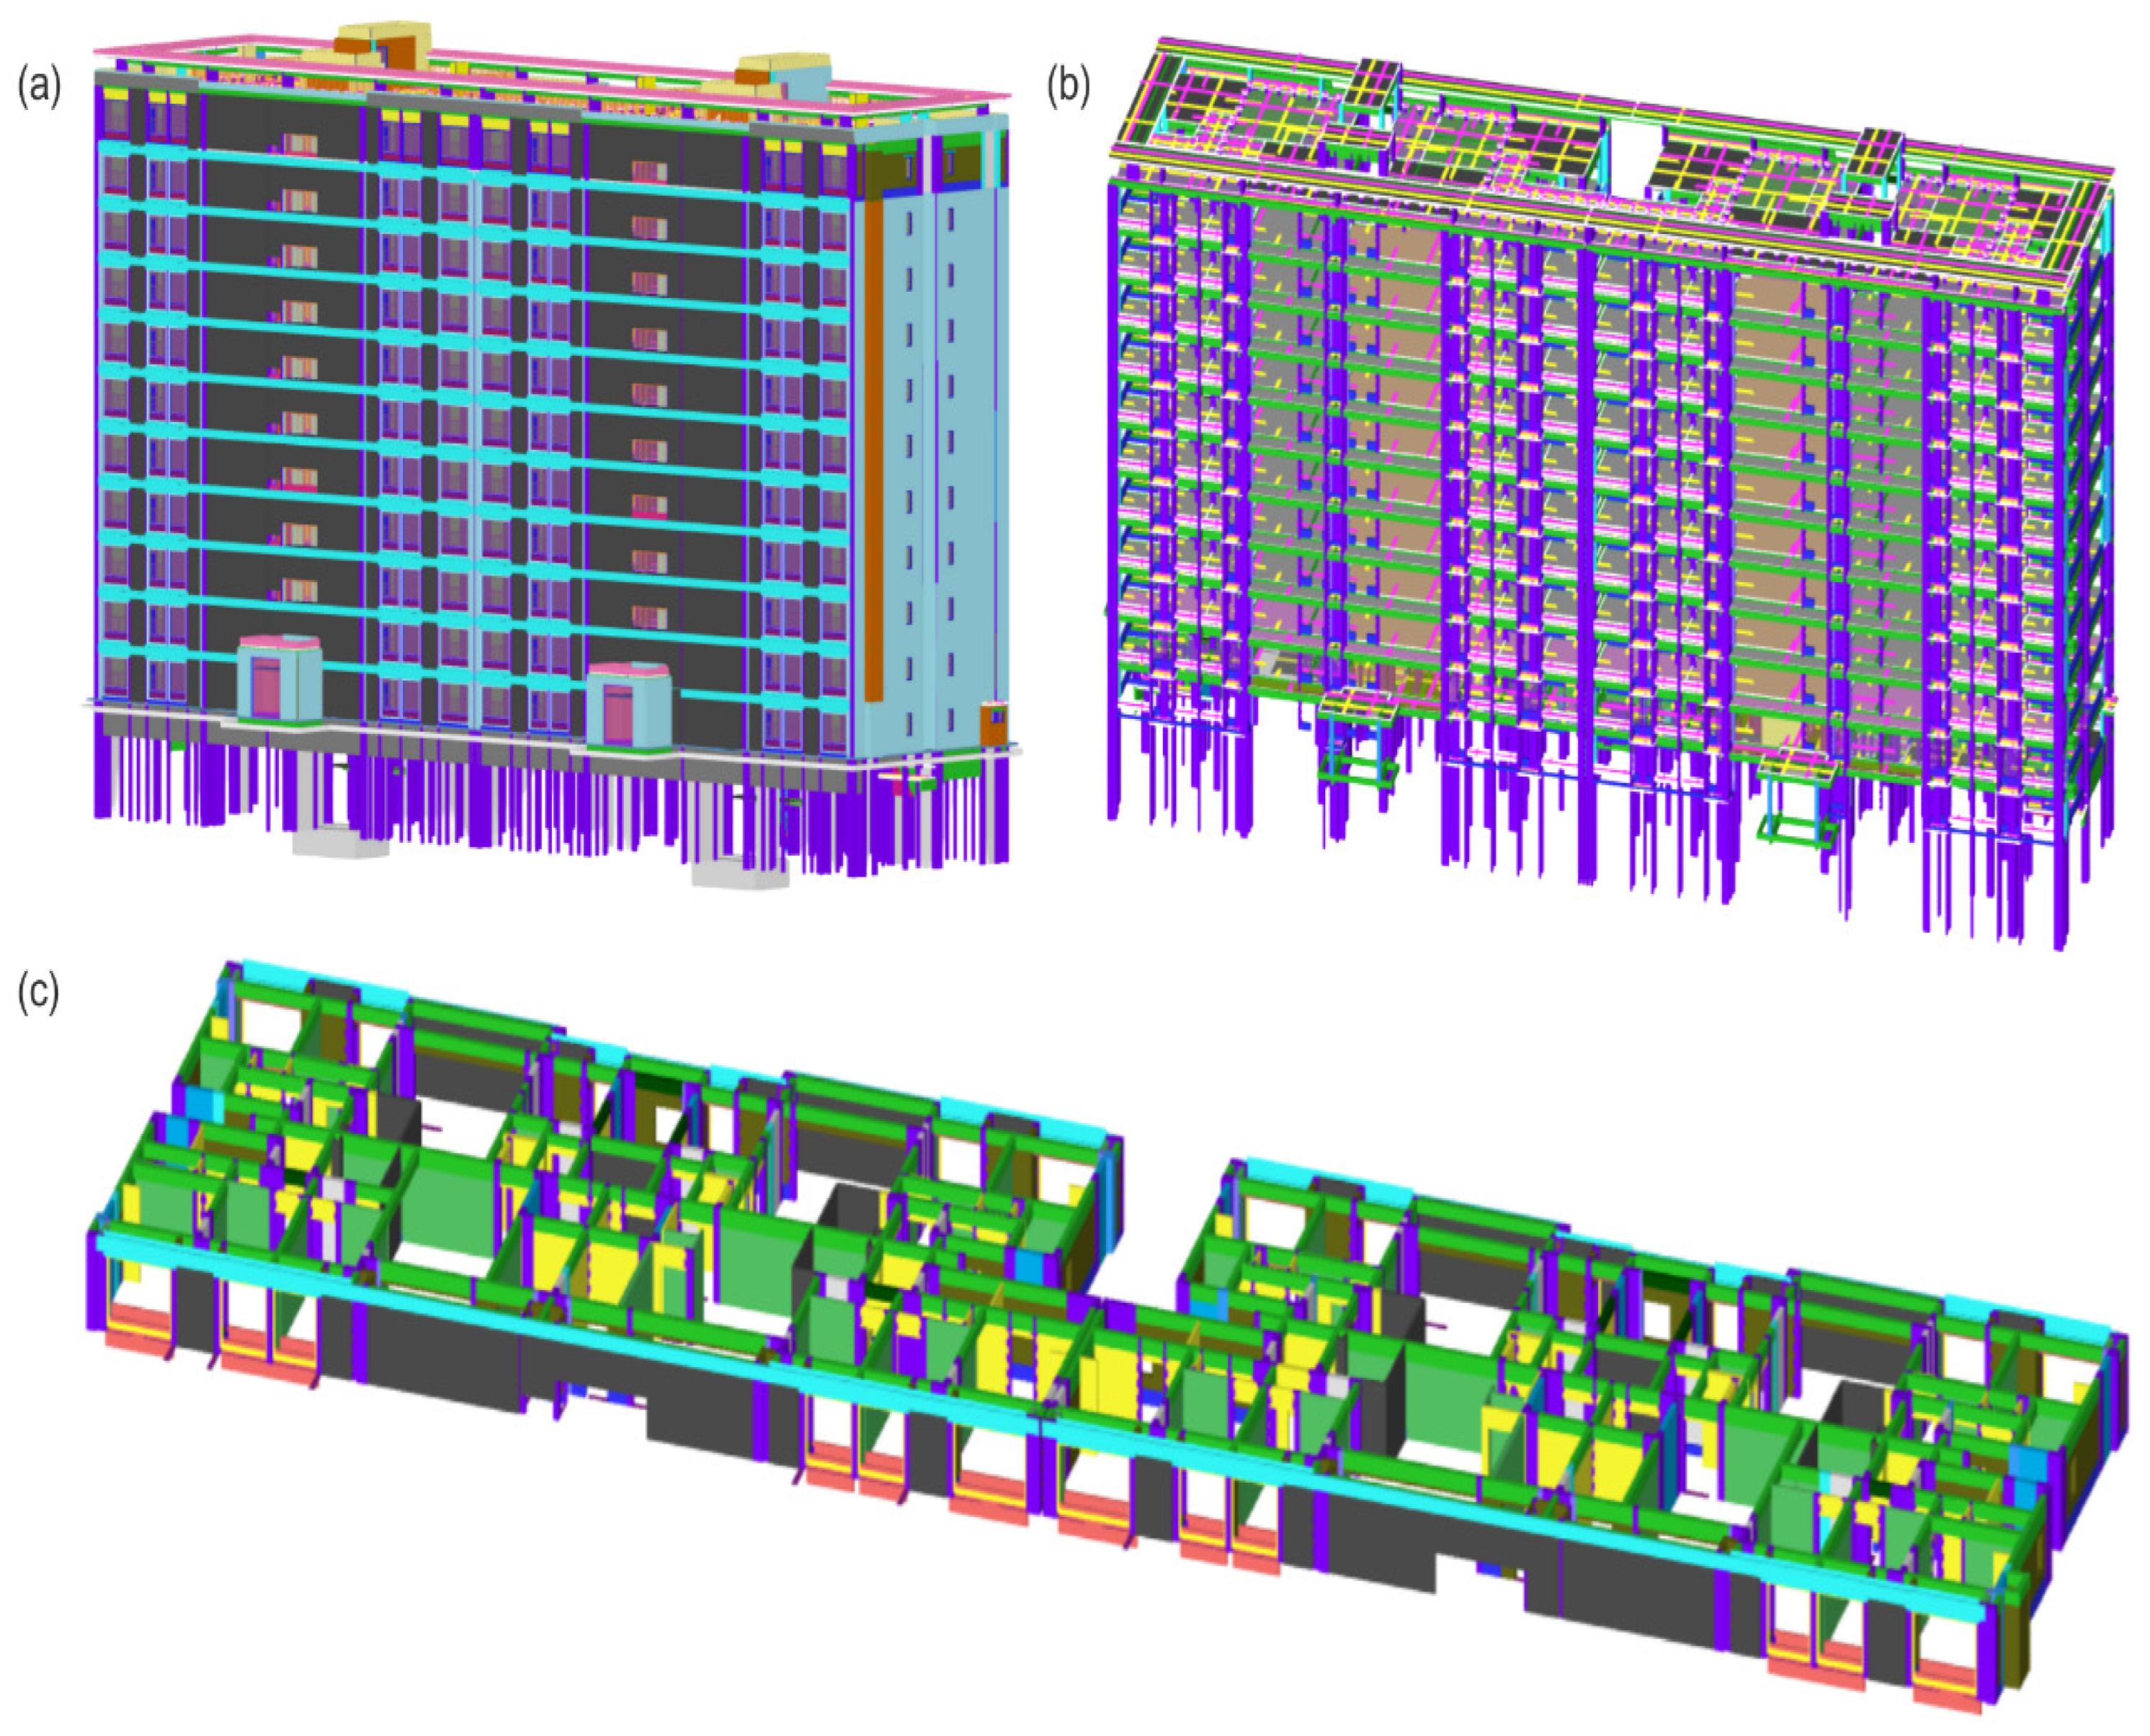
The typology reflects the prevalent mid-rise construction in rapidly urbanizing regions and allows for generalization of the findings to similar contexts worldwide. This study adopts a cradle-to-grave perspective in accordance with EN 15978:2024, covering modules A1–D. All analyses were performed at Level of Development (LOD) 300; LOD 400/500 (fabrication and as-built) were excluded because the target was early-stage design, but the framework can be extended to these levels in future work. A visual representation of the project’s BIM model is provided in Figure 2.
Figure 2.
BIM model. (a) Architectural plan, (b) structural plan, and (c) model of building section.
3.4. Quantity Extraction in the BIM System
A parametric BIM model was developed in GTJ2025 and exported through a vendor-neutral exchange format to guarantee lossless geometry and property sets. LOD 300 was selected because it provides reliable geometric and material information while maintaining manageable modeling effort. High levels (LOD400-500) require fabrication-level detail unavailable during conceptual and schematic design phases. The material quantities were extracted automatically from the model and cross-checked against the project’s Bill of Quantities (BoQ). The relative deviation was calculated as follows:
The primary materials (concrete, reinforcing steel, and masonry) deviated by <±5%, satisfying the predefined tolerance. When deviations exceeded ±5%, BoQ values were adopted as reference quantities after manual verification. Materials contributing <1% of the total mass were grouped as “other” under the ISO 14044 cut-off rules. Minor insulation deviations were reconciled with the BoQ values to maintain a conservative, traceable dataset. The final Bill of Materials (BoM) totaled 20,680.20 t: 14,450.79 t of reinforced concrete, 2403.48 t of cement, 275,63 t of sand and aggregates, 2078.84 t of masonry/brickwork, 711.73 t of steel (reinforcing and structural), and 759.73 t of insulation/fenestration.
3.5. Material Masses and Embodied Carbon Inventory (A1–A3)
The validated quantities were multiplied by the material density to derive mass. The embodied carbon for phases A1–A3 was calculated using region-specific emission factors (kgCO2e/kg), considering China’s cement-intensive concrete production and coal-reliant steel manufacturing. Life cycle inventory data were sourced from the 2023 edition of the Chinese Environmental Product Declaration (EPD) platform, together with publicly accessible regional EPD statistics encompassing cradle-to-gate (A1–A3) industrial processes. Electricity-related procedures were modified utilizing the regional grid emission factors (0.5703 kgCO2e/kWh for the Southwest China Grid, 2022) released by the Ministry of Ecology and Environment of the People’s Republic of China to accurately represent local electricity generation attributes.
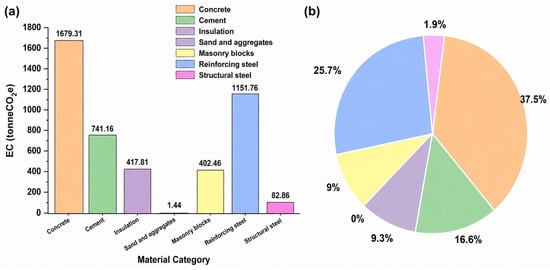
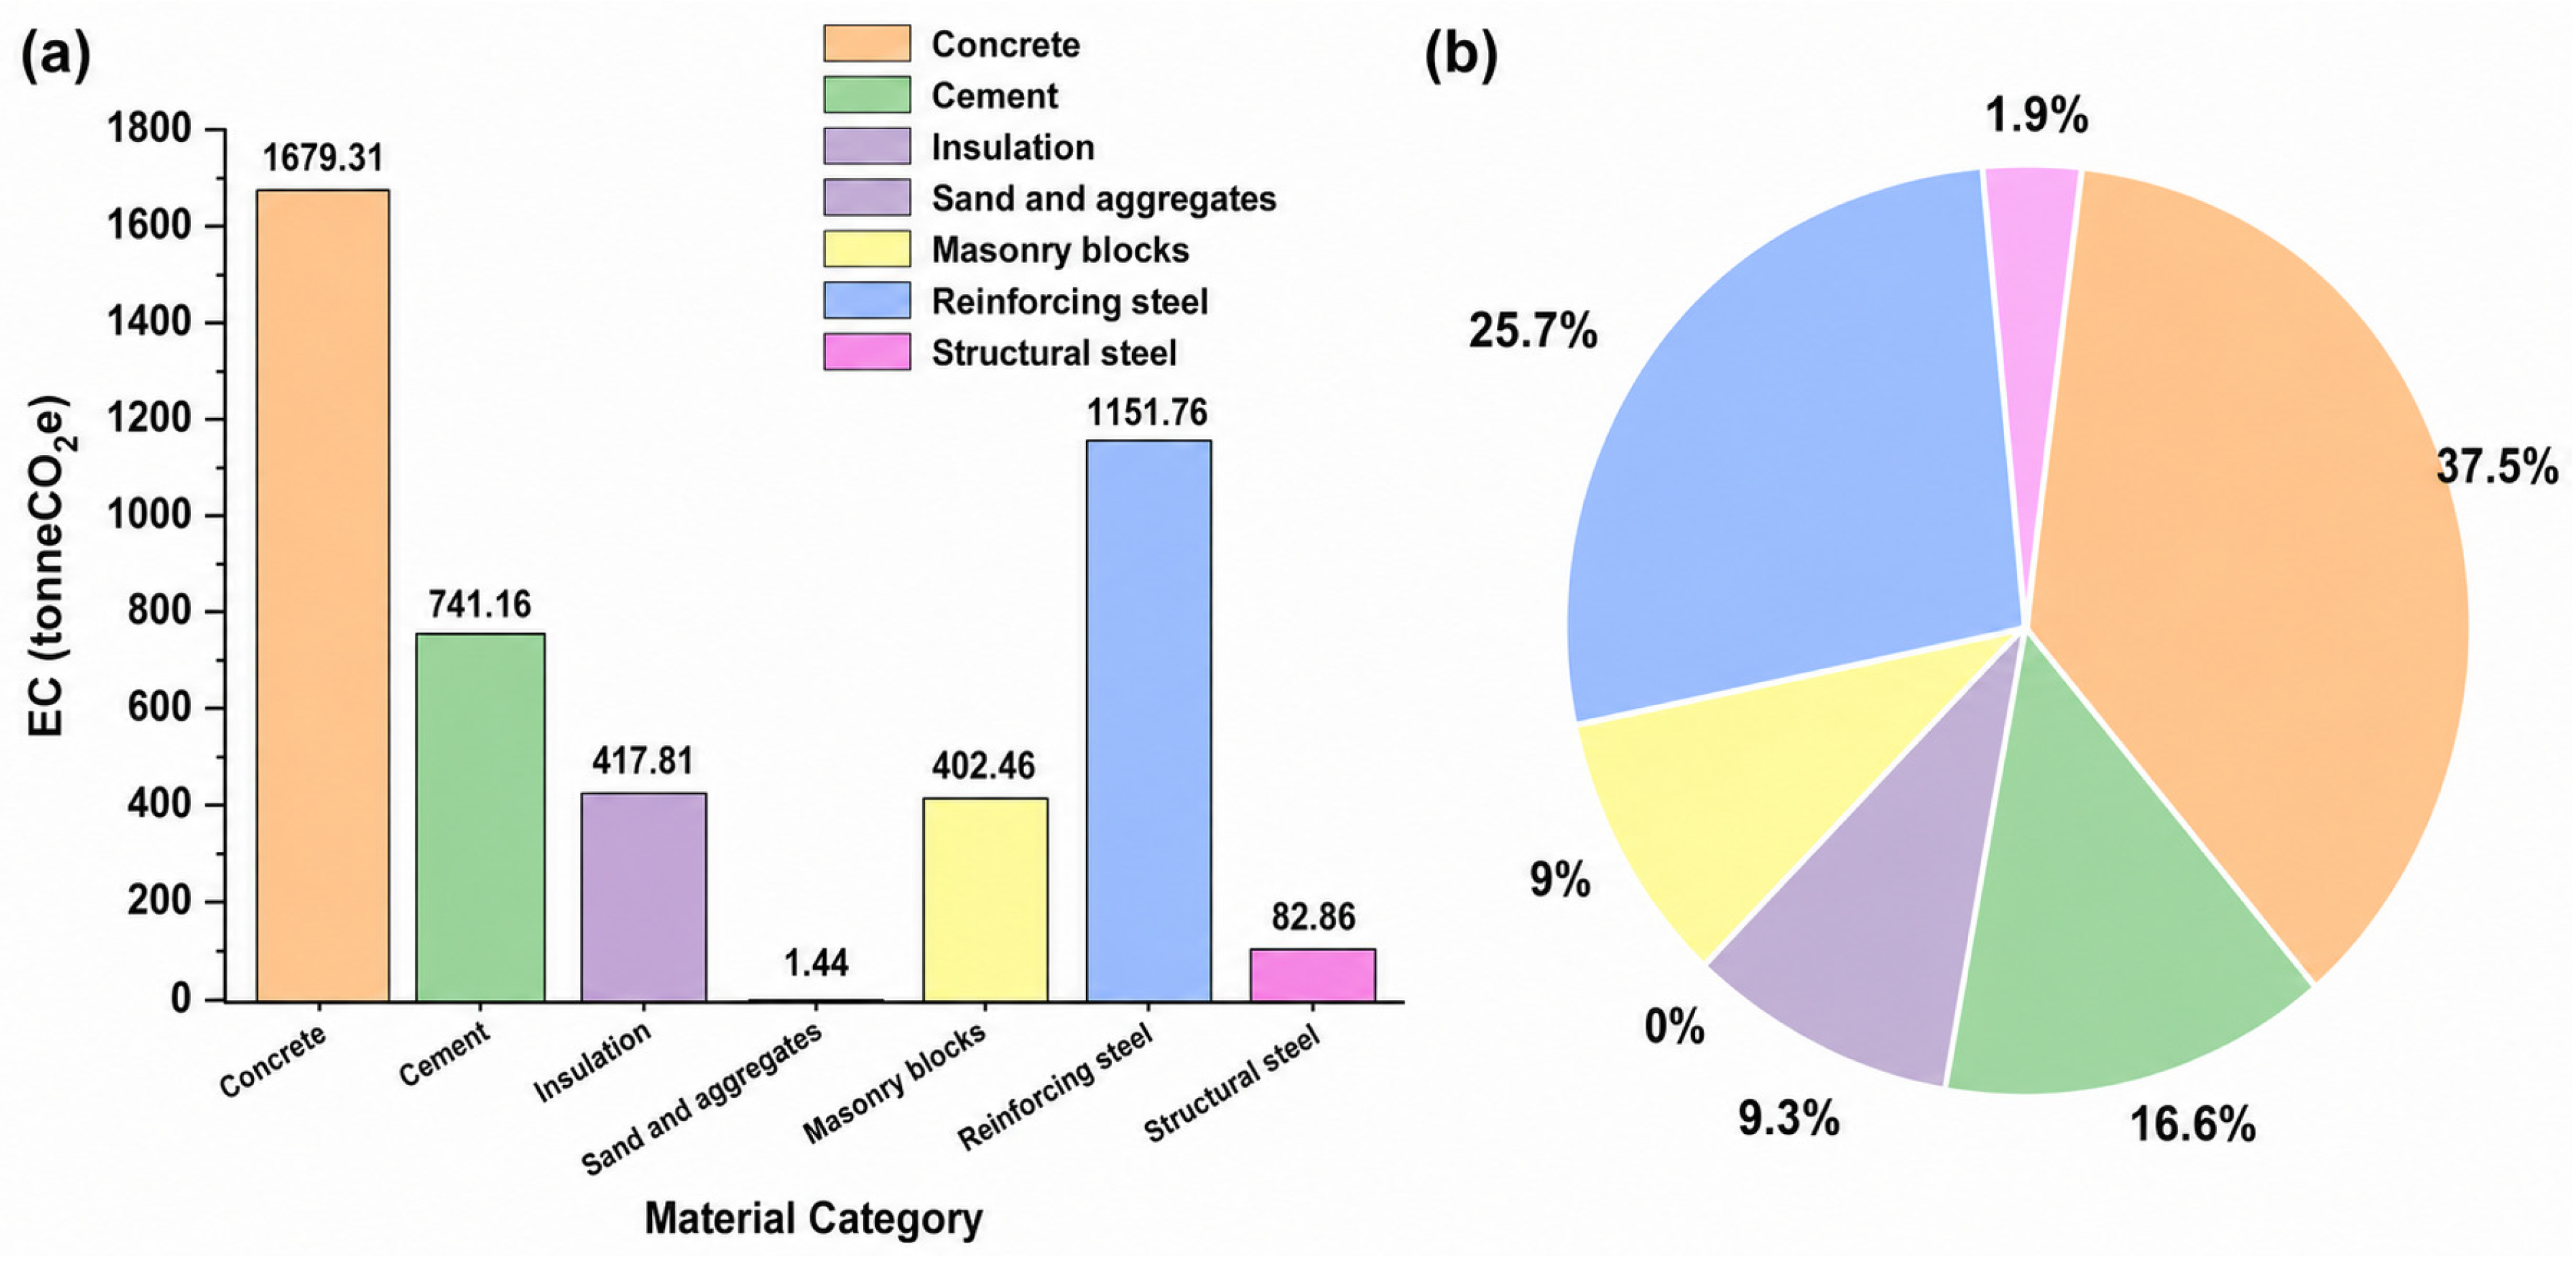
As indicated in Table 1 and Figure 3, during stages A1–A3, alongside the material inventory and the embodied carbon emissions, concrete is the primary source, contributing 37.5% of the total A1–A3 embodied carbon (1679.31 tCO2e), owing to its substantial mass of 14,450.8 t, which offsets its relatively low emission intensity. Cement is the second-largest contributor, accounting for 16.6% (741.16 tCO2e) of emissions due to its carbon-intensive production process. Reinforcing steel contributes 25.7% (1151.76 tCO2e); although it is present in limited quantity (667.8 t), its high emission intensity significantly amplifies its impact. Insulation materials (417.81 tCO2e, 9.3%) and masonry blocks (402.46 tCO2e, 9.0%) also represent notable emission sources, suggesting opportunities for low-carbon optimization through material substitution. Structural steel and aggregates contribute minimally to overall emissions.
Table 1.
Material-level inventory.
Figure 3.
(a) Emission carbon by material, and (b) proportions of emissions contributions.
The normalized A1–A3 intensity is as follows:
The normalized A1–A3 intensity of 459.16 kgCO2e/m2 ≈ 0.459 tCO2e/m2 is in line with the reference values of comparable Chinese mid-rise buildings, and material production has been achieved; however, optimization is needed through mixed design or alternative schemes. As shown in Figure 3, material-level embodied carbon contributions for product stages A1–A3 highlight the dominance of concrete (≈37.5%) and reinforcing steel (≈25.7%) in total embodied emissions.
3.6. Construction-Stage Emissions (A4–A5)
A4 (transport) was excluded, because supplier distances were unknown at the design stage; a conservative 5% uplift on A1–A3 factors was applied per Chinese standard DB 37/T 5148. A5 emissions were calculated from the site energy (using Equation (3)): diesel for concrete pouring and electricity for temporary installations.
where represents energy consumption (kWh or L), and represents the corresponding emission factor.
The total A5 was 313.66 tCO2e (~6.25% of A1–A5), confirming the dominance of material production.
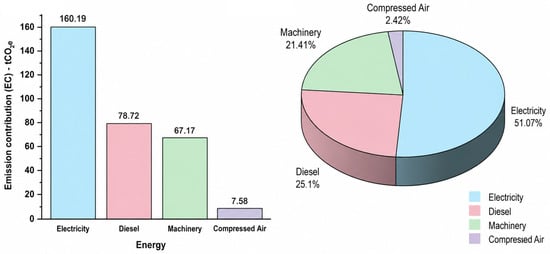
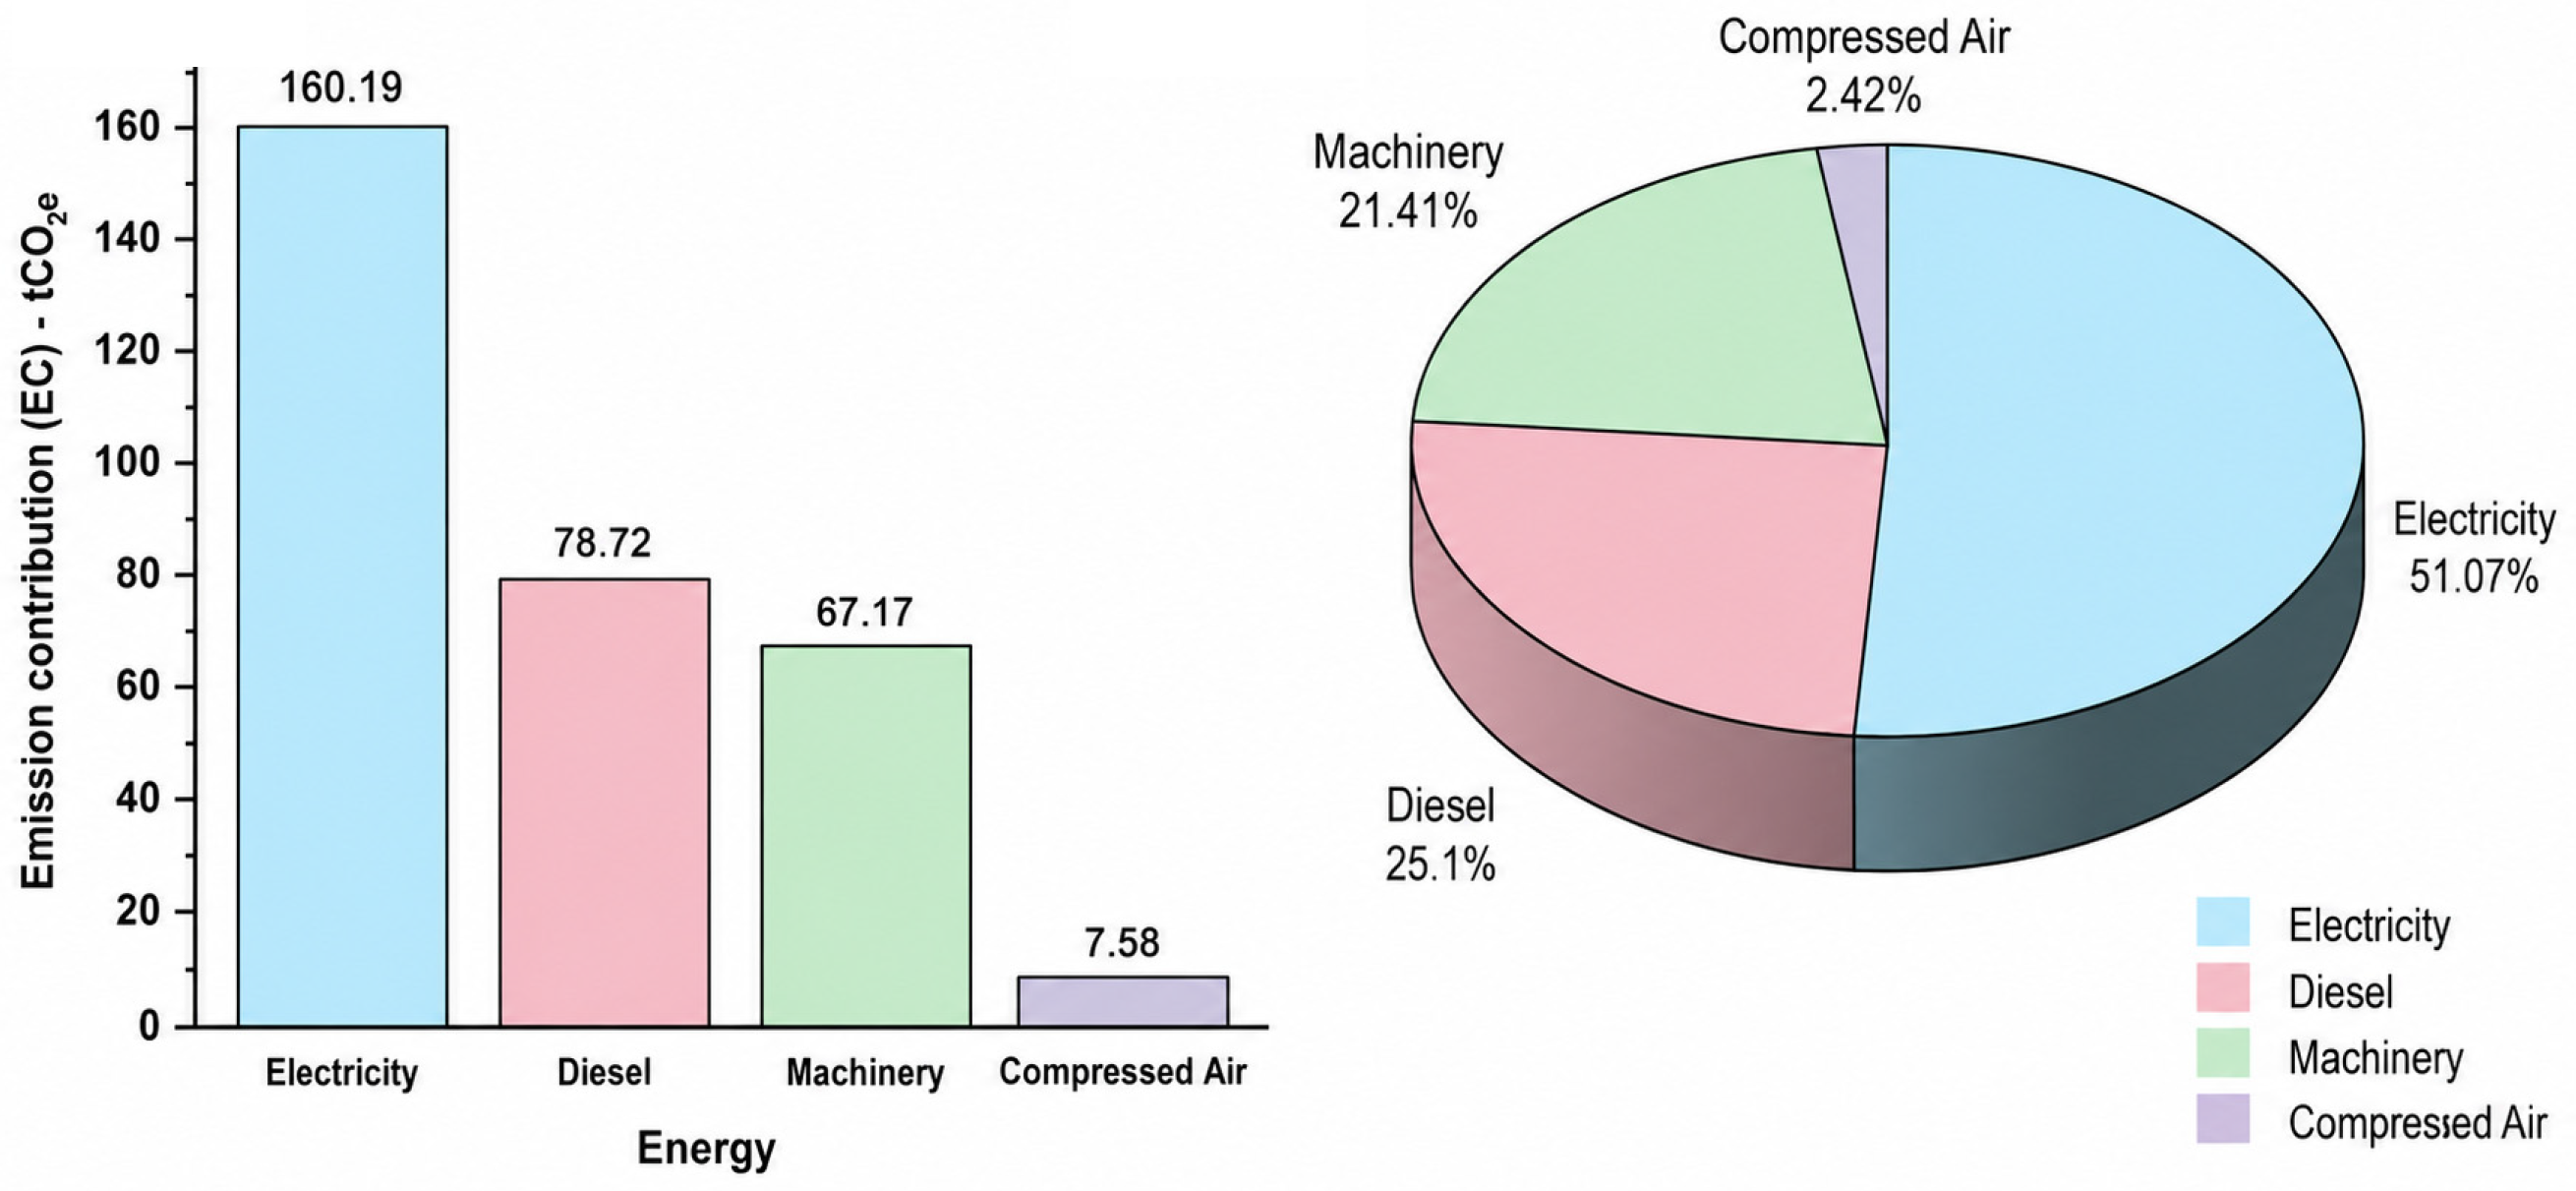
As presented in Table 2 and Figure 4, electricity consumption is identified as the primary source of on-site carbon emissions, amounting to 160.19 tCO2e and contributing 51.07% of the total construction-phase footprint. Diesel fuel represents the second largest contributor, with 78.72 tCO2e (25.1%), followed by machinery operation at 67.17 tCO2e (21.41%) and compressed air at 7.58 tCO2e (2.42%). Overall, electricity and diesel account for more than three-quarters of the A5 emissions, highlighting the structural predominance of these two energy sources in on-site energy use. Although machinery operation constitutes a relatively lower share of total emissions, its notable per-hour emission intensity underscores the importance of improving equipment efficiency and optimizing machinery selection to reduce carbon impacts during construction.
Table 2.
Construction-stage emissions.
Figure 4.
Breakdown of construction-stage emissions (A5), showing the relative contributions of electricity, diesel fuel, machinery operation, and compressed air to the total on-site embodied carbon.
3.7. Life Cycle Assessment and Uncertainty Analysis
The cradle-to-grave GWP (A1–A5) was assessed using a mass-flow approach:
where mi represents the mass of material i (in kg), and CFi is its associated characterization factor (kgCO2e/kg−1). The uncertainty ranges allocated to material amounts (±3–5%) were obtained from BIM quantity-validation trials documented in prior research [32,33]. The uncertainty related to emission factors (±10–20%) was assessed using the pedigree matrix method introduced by Weidema and Wesnaes, which was later modified in the ecoinvent methodology. The pedigree matrix assesses data quality based on reliability, completeness, and temporal, geographical, and technical representativeness, thus offering a systematic framework for measuring uncertainty in life cycle inventory information [34,35]. The uncertainty ranges align with recognized methodologies for uncertainty characterization in life cycle assessment and are extensively utilized in designing LCA studies that employ Monte Carlo simulation [36,37,38]. Uncertainty propagation was executed via a Monte Carlo simulation of 10,000 iterations, implemented in Python 3.12 (random seed = 42) [37,38]. The analyzed uncertainty ranges are not fixed values, but indicative intervals based on pedigree matrix scores attributed to the foundational life cycle inventory data, representing fluctuations in data quality rather than capricious assumptions [34,35,39,40]. Transportation emissions (A4) were not explicitly modeled due to limited supplier distance data; instead, a conservative 5% uplift was applied to A1–A3 emissions in accordance with Chinese standard DB 37/T 5148. A5 was calculated separately based on the site energy consumption, as shown in Table 2 and Figure 4. The mean total of A1–A5 = 4476.80 + 223.84 + 313.66 = 5014.3 tCO2e (95% CI: 4472–5570 tCO2e; CV = 5.85%; σ = ±293), corresponding to 514.29 kg/m2 (σ = ±30.10, 95% CI: 458.65–573.05). The Sobol indices revealed that emission factors contributed > 60% of the variance, highlighting the need for local inventory data for reliable embodied carbon assessment.
3.8. Monte Carlo Simulation of BIM–LCA Uncertainty
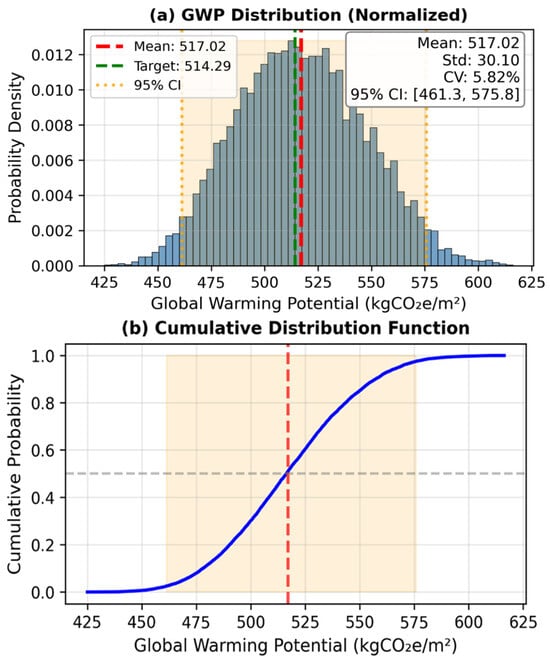
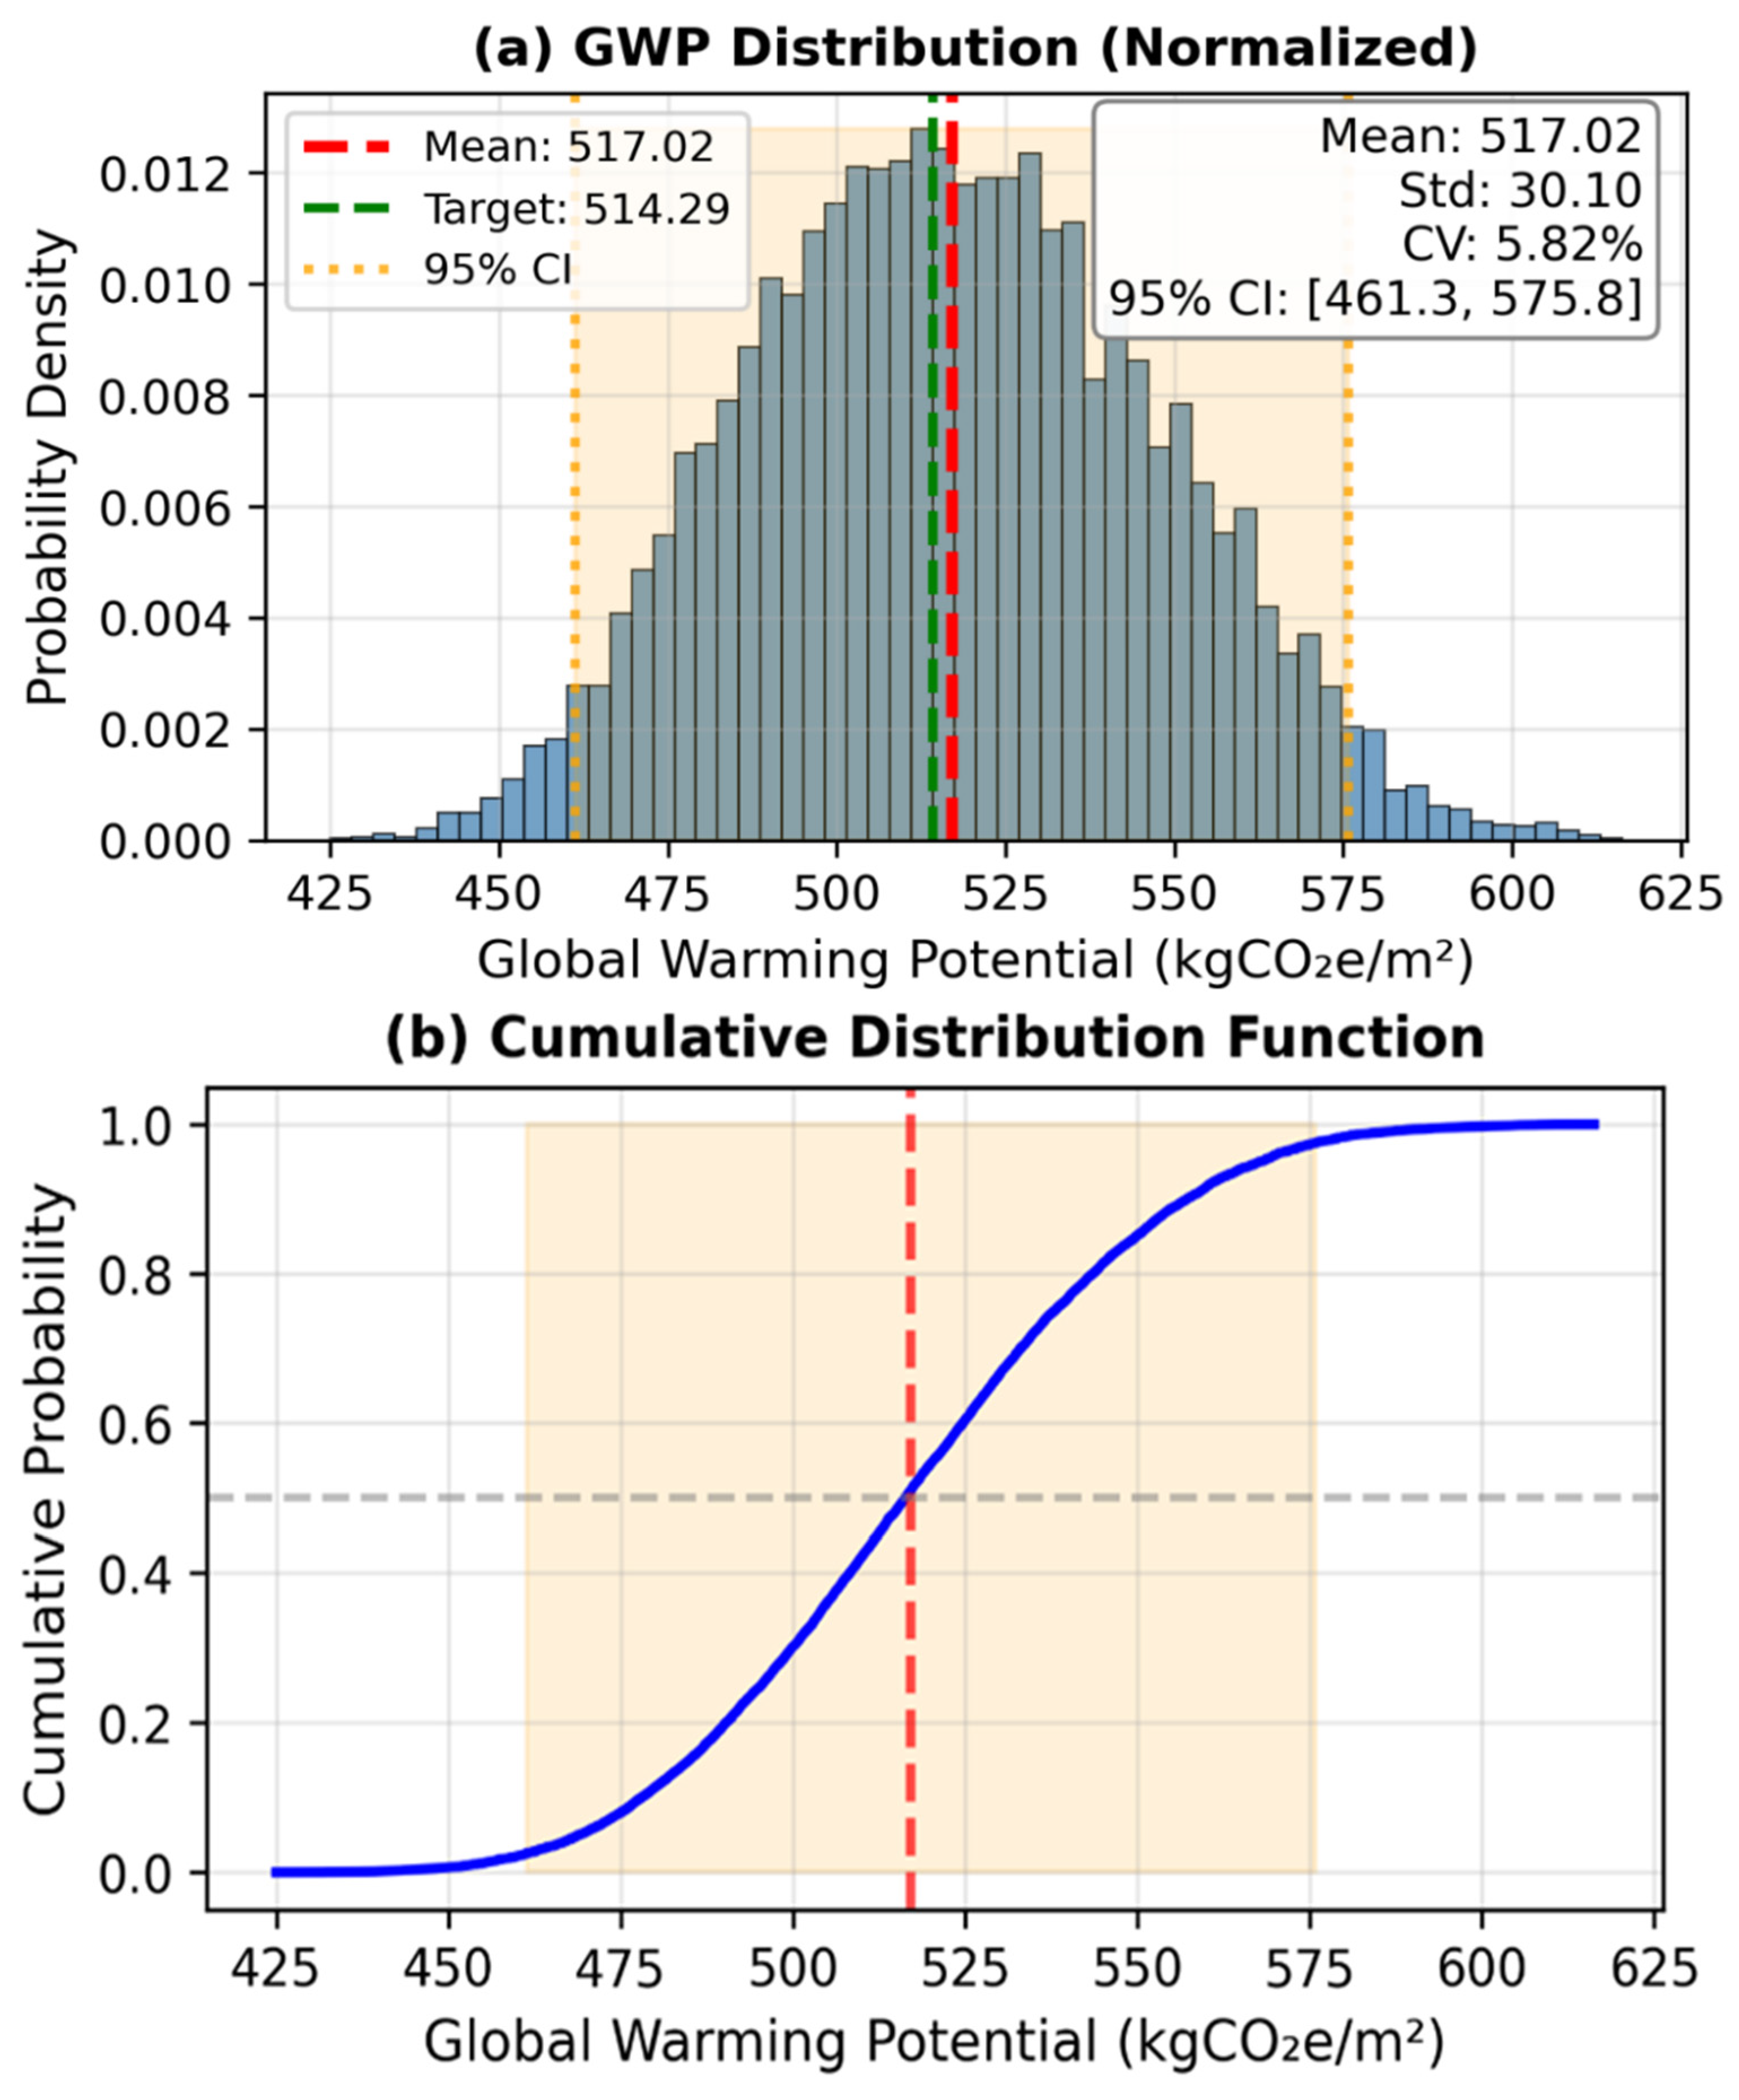
Figure 5a shows the probability density of Global Warming Potential (GWP) for the A1–A5 life cycle modules for 10,000 Monte Carlo iterations. The resulting distribution is close to normal, with a mean of 517.02 kgCO2e/m2, a standard deviation of 30.10 kgCO2e/m2, and a coefficient of variation of 5.82%, indicating moderate variability in the embodied carbon estimates. The value of the deterministic analysis (514.29 kgCO2e/m2) is in high agreement with the simulated mean and shows very good correspondence between the nominal BIM–LCA dataset and the probabilistic model. The 95% confidence interval of 461.3–575.8 kgCO2e/m2 defines the plausible region of embodied carbon values in a situation of input uncertainty.
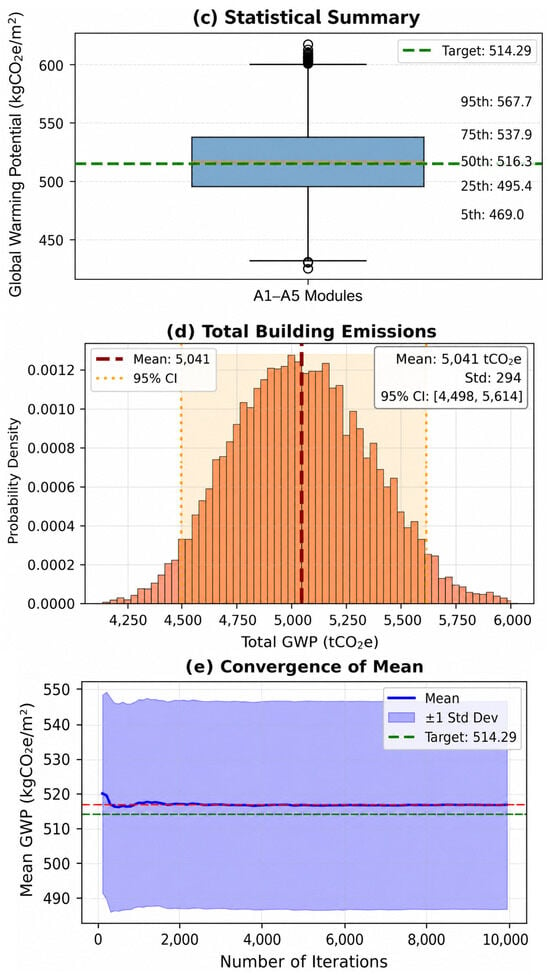
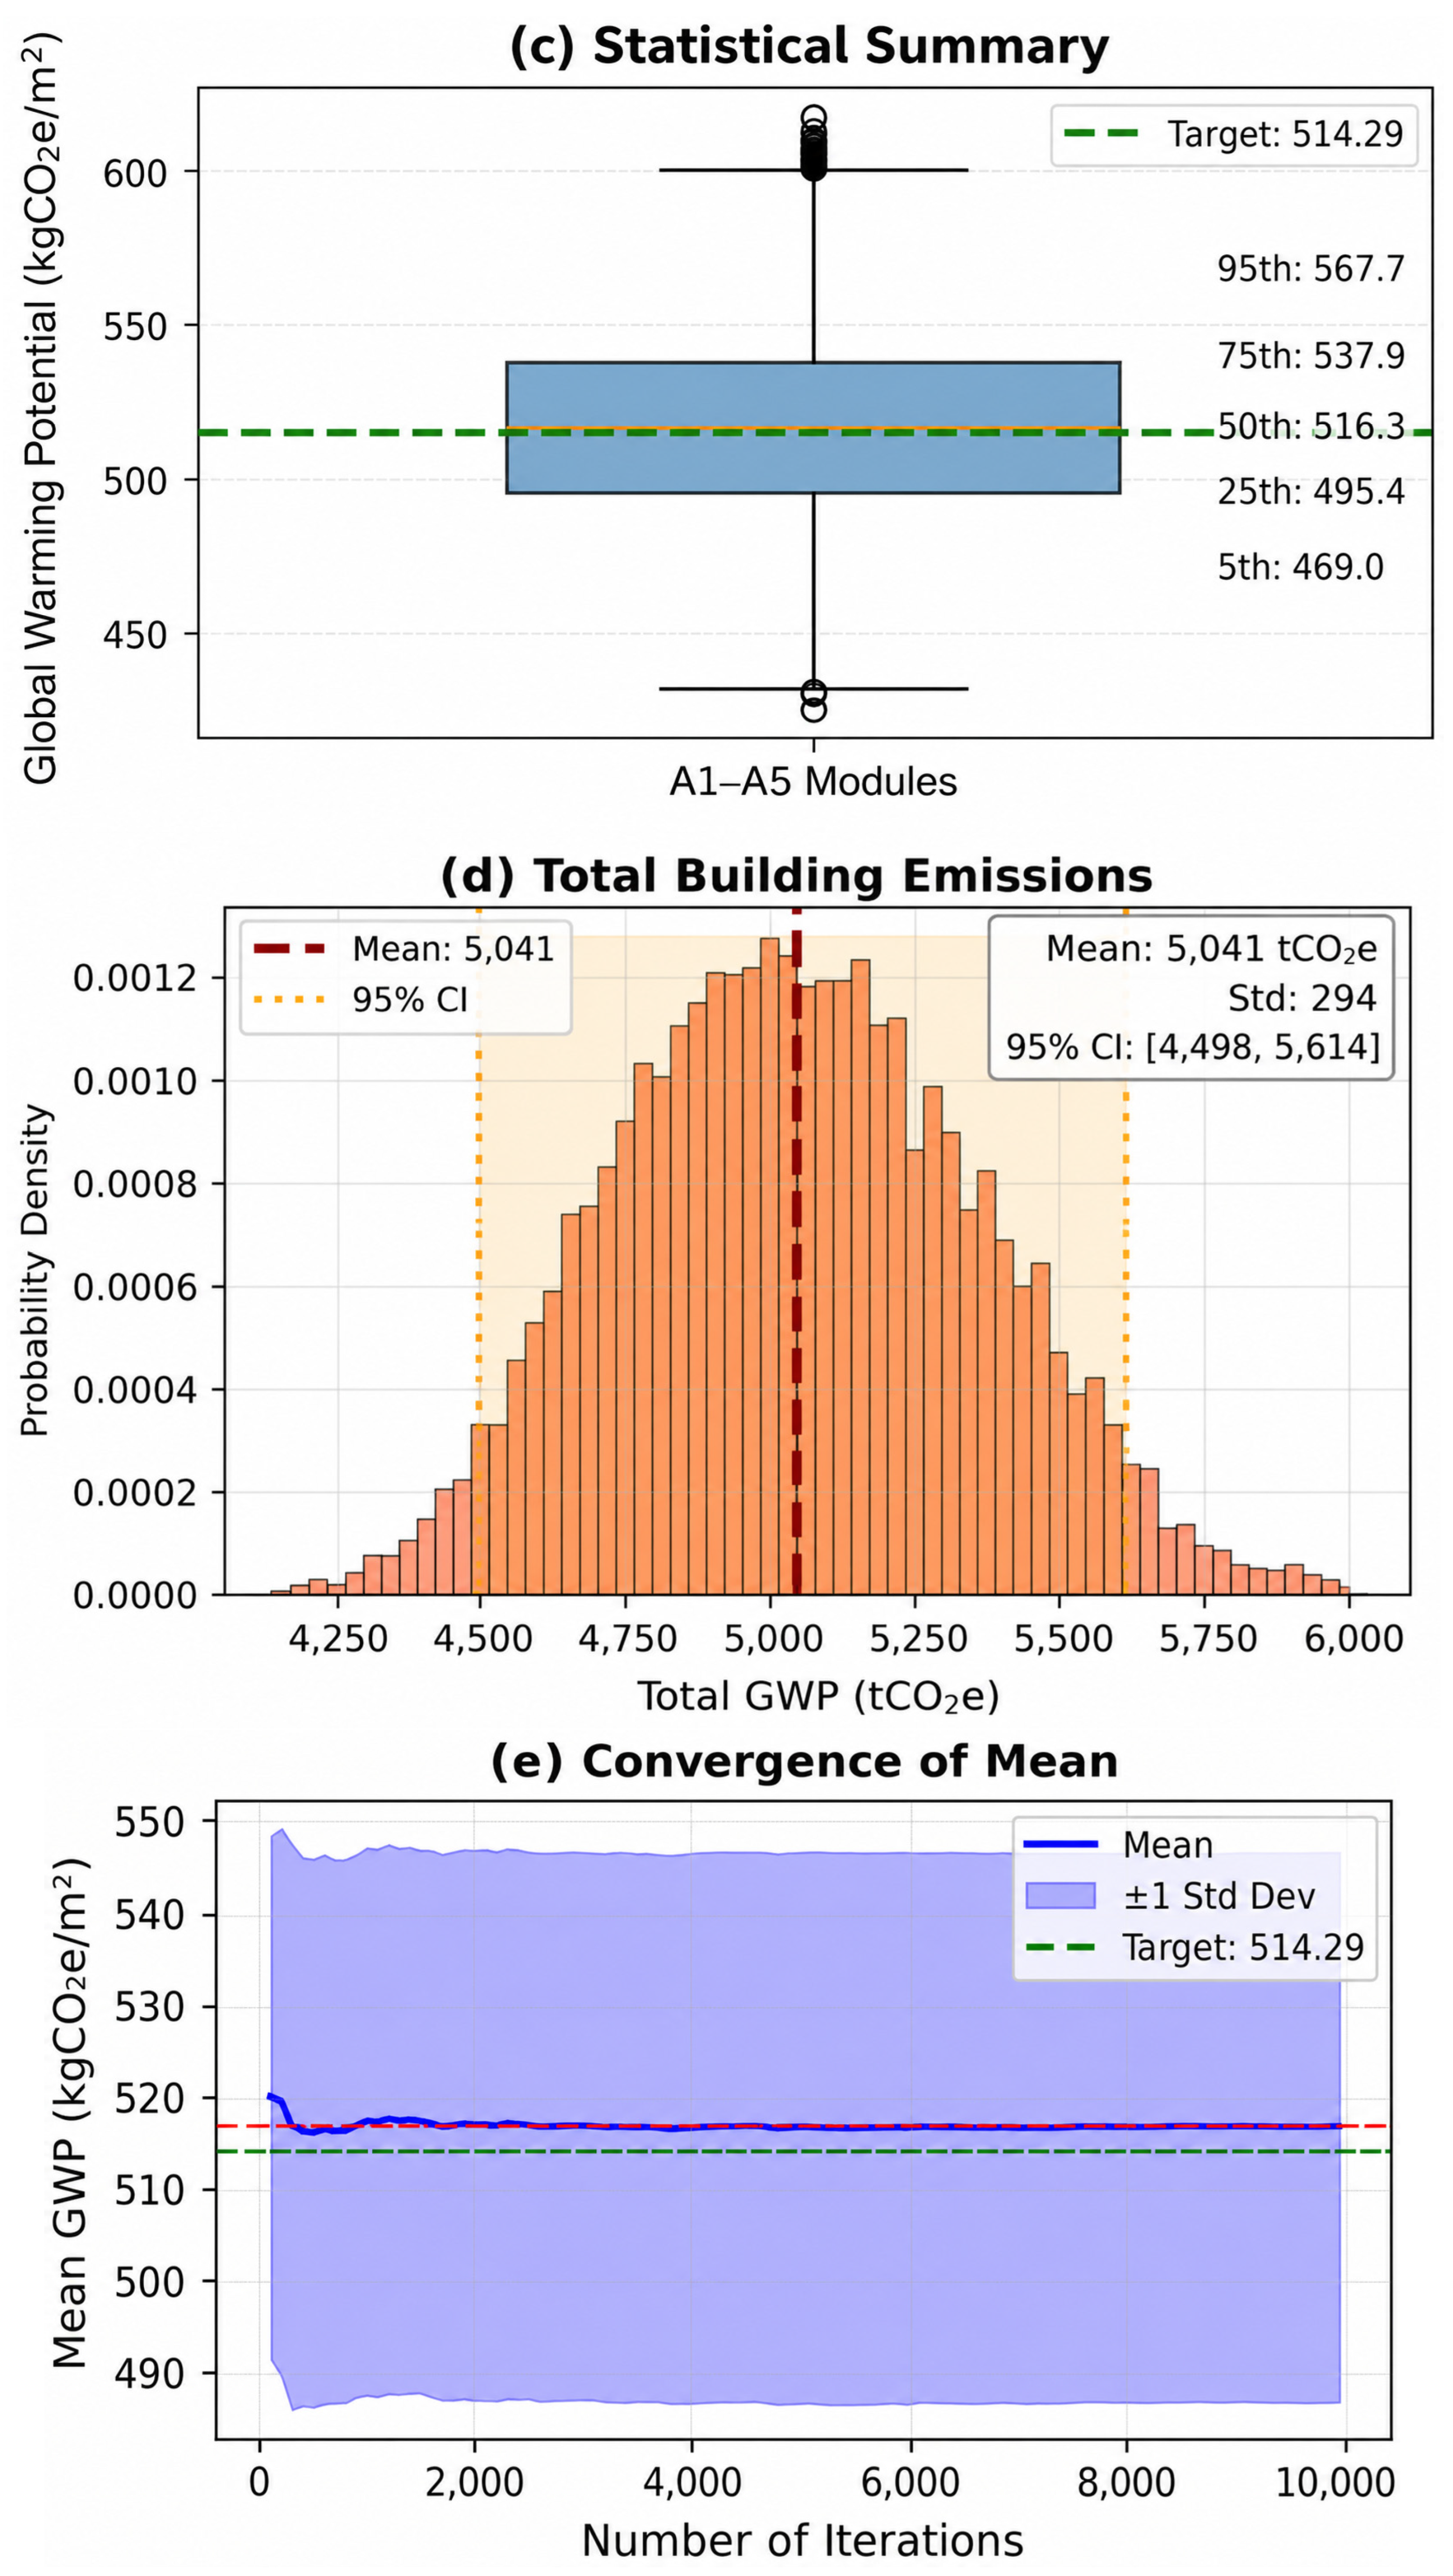
Figure 5.
(a) Monte Carlo distribution of normalized GWP(KgCO2e/m)2. (b) Cumulative distribution function. (c) Statical summary. (d) Total building emissions. (e) Monte Carlo simulation convergence of mean behavior.
Figure 5b shows the cumulative distribution function (CDF) of the simulated results of the global warming potential (GWP). The S-shaped curve is the stochastic distribution of the outcomes, meaning that approximately 50% of GWP values are expected to be below the mean. The shaded area outlines the 95% probability range, which means that high-emission scenarios are unlikely. Consequently, this model is a risk-oriented way of looking at embodied carbon estimates and facilitates probabilistic decision-making in regard to carbon estimates for buildings.
Figure 5c shows the quantitative characteristics of the model as a box plot. The orange horizontal line within the box signifies the median (50th percentile) of the Monte Carlo simulation outcomes. The central tendency is 516.3 kgCO2e/m2, and the IQR is between 495.4 and 537.9 5 kgCO2e/m2. The 5th and 95th percentiles (469.0 and 567.7 5 kgCO2e/m2) show a wide range in this dataset. The specific reference value (514.29 5 kgCO2e/m2) is within the IQR, indicating that the fundamental BIM-LCA figure is statistically consistent with the results of the stochastic simulation.
Figure 5d shows the distribution of total building emissions in tCO2e. The simulation gives a 5041 tCO2e mean, 294 tCO2e variance, and a 95% confidence interval range of 4498 to 5614 tCO2e. This almost Gaussian distribution shows that the variations in the quantity of components and discharge factors are spread evenly throughout the BIM–LCA framework. The data therefore provide a probabilistic evaluation of the total embodied carbon in the building.
Figure 5e depicts the convergence behavior of the Monte Carlo simulation. The red dashed horizontal line denotes the final converged mean GWP derived from the Monte Carlo simulation, serving as a visual reference for the stabilized mean value. The mean GWP reaches a stable level as the number of iterations increases and reaches approximately 517 kgCO2e/m2. The initial oscillations die quickly after several thousand iterations, which indicates that 10,000 iterations are sufficient to reach statistical stability. The reference deterministic value is always consistent with the mean simulation answer throughout the process, further demonstrating the robustness of the primary baseline estimate.
The results indicate that Monte Carlo simulation offers a robust framework for evaluating uncertainty in BIM-based life cycle carbon assessment, while validating the reliability of fixed embedded carbon estimations.
4. Design Optimization
Forty design variants were generated using a scripted parametric design framework with structural and thermal constraints (wall U-value ≤ 0.24 W m−2 K−1, building height ≤ 32.6 m). These variants represented different combinations of envelope materials, structural systems, and material reuse strategies. To develop the surrogate model, 1200 design samples were produced by Monte Carlo random sampling inside the established design space. Five primary design variables––concrete replacement ratio, recycled steel content, insulation thickness, timber substitution ratio, and material reuse rate––were randomly picked from their respective engineering design ranges utilizing independent uniform probability distributions. Each sampled design configuration underwent automatic evaluation via the BIM–LCA workflow to ascertain the associated embodied carbon emissions.
The parameter ranges delineated in Table 3 were determined based on engineering viability, prevailing construction methodologies, and pertinent building design standards. Independent uniform probability distributions were utilized due to the absence of previous probabilistic information regarding the design variables in the initial design phase. Monte Carlo random sampling produced 1200 unique design configurations, each assessed by the proposed BIM–LCA workflow prior to training the XGBoost surrogate model.
Table 3.
Design variables and Monte Carlo sampling ranges used for surrogate model generation.
The dataset was partitioned into 80% training data and 20% testing data, with five-fold cross-validation utilized throughout model building to enhance generalization and reduce overfitting, achieving an RMSE of 1.7% relative to full LCA results and a Pearson correlation coefficient of 0.98. This Monte Carlo sampling method ensures extensive coverage of the multidimensional design space while maintaining statistical independence among the sampled design variables, thus enhancing the resilience and reproducibility of the surrogate model. The optimal variant (V4) achieved a 38.13% reduction in GWP (1942 tCO2e) through partial concrete substitution with timber (20%), adoption of a CLT-based envelope, and 70% material reuse, reducing normalized emissions from 514.29 to 318.21 kgCO2e/m2. This study aligns with recent comparative life cycle studies of residential structures in China, which indicated that substituting reinforced concrete with cross-laminated lumber significantly decreases embodied greenhouse gas emissions while preserving comparable structural performance [25]. Compared with full LCA simulation runtimes, surrogate-based evaluations require less than 1 min per variant.
The proposed BIM–LCA framework was implemented for a typical mid-rise residential building (11 aboveground stories and one underground level) with a gross floor area (GFA) of 9750.03 m2 in China, constructed using a standard reinforced concrete mid-rise design. The baseline design comprised a concrete frame, masonry partitions, standard finishes, and 70% material reuse. Automated quantity takeoff from GTJ2025 generated a Bill of Materials (BoM) totaling 20,680.20 t (20,680,201.08 kg), comprising 14,450.79 t of reinforced concrete, 2403.48 t of cement, 275.63 t of sand and aggregates, 2078.84 t of masonry blocks/clay brickwork, 711.73 t of steel (667.78 t reinforcing steel plus 43.95 t structural steel), and 759.73 t of insulation (mineral wool)/windows. Examining a mid-rise residential building as a case study reveals common construction techniques in rapidly urbanizing areas, providing valuable insights applicable to similar global contexts.
4.1. Embodied GWP Assessment and Hotspots
The total life cycle Global Warming Potential (GWP) was assessed following EN 15978 standards, covering modules A1–A5, yielding a value of 514.29 ± 3 0.09 kgCO2e/m2 at Level of Development 300 (mean ± 95% confidence interval, 10,000 Monte Carlo iterations), as shown in Table 3. This value represents an exhaustive cradle-to-grave assessment, including production (A1–A3) and construction (A4–A5).
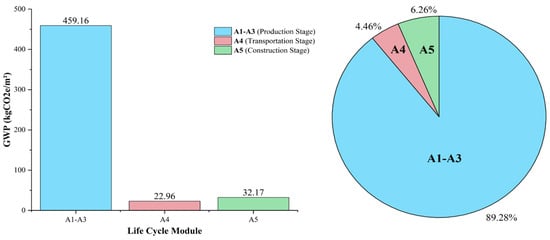
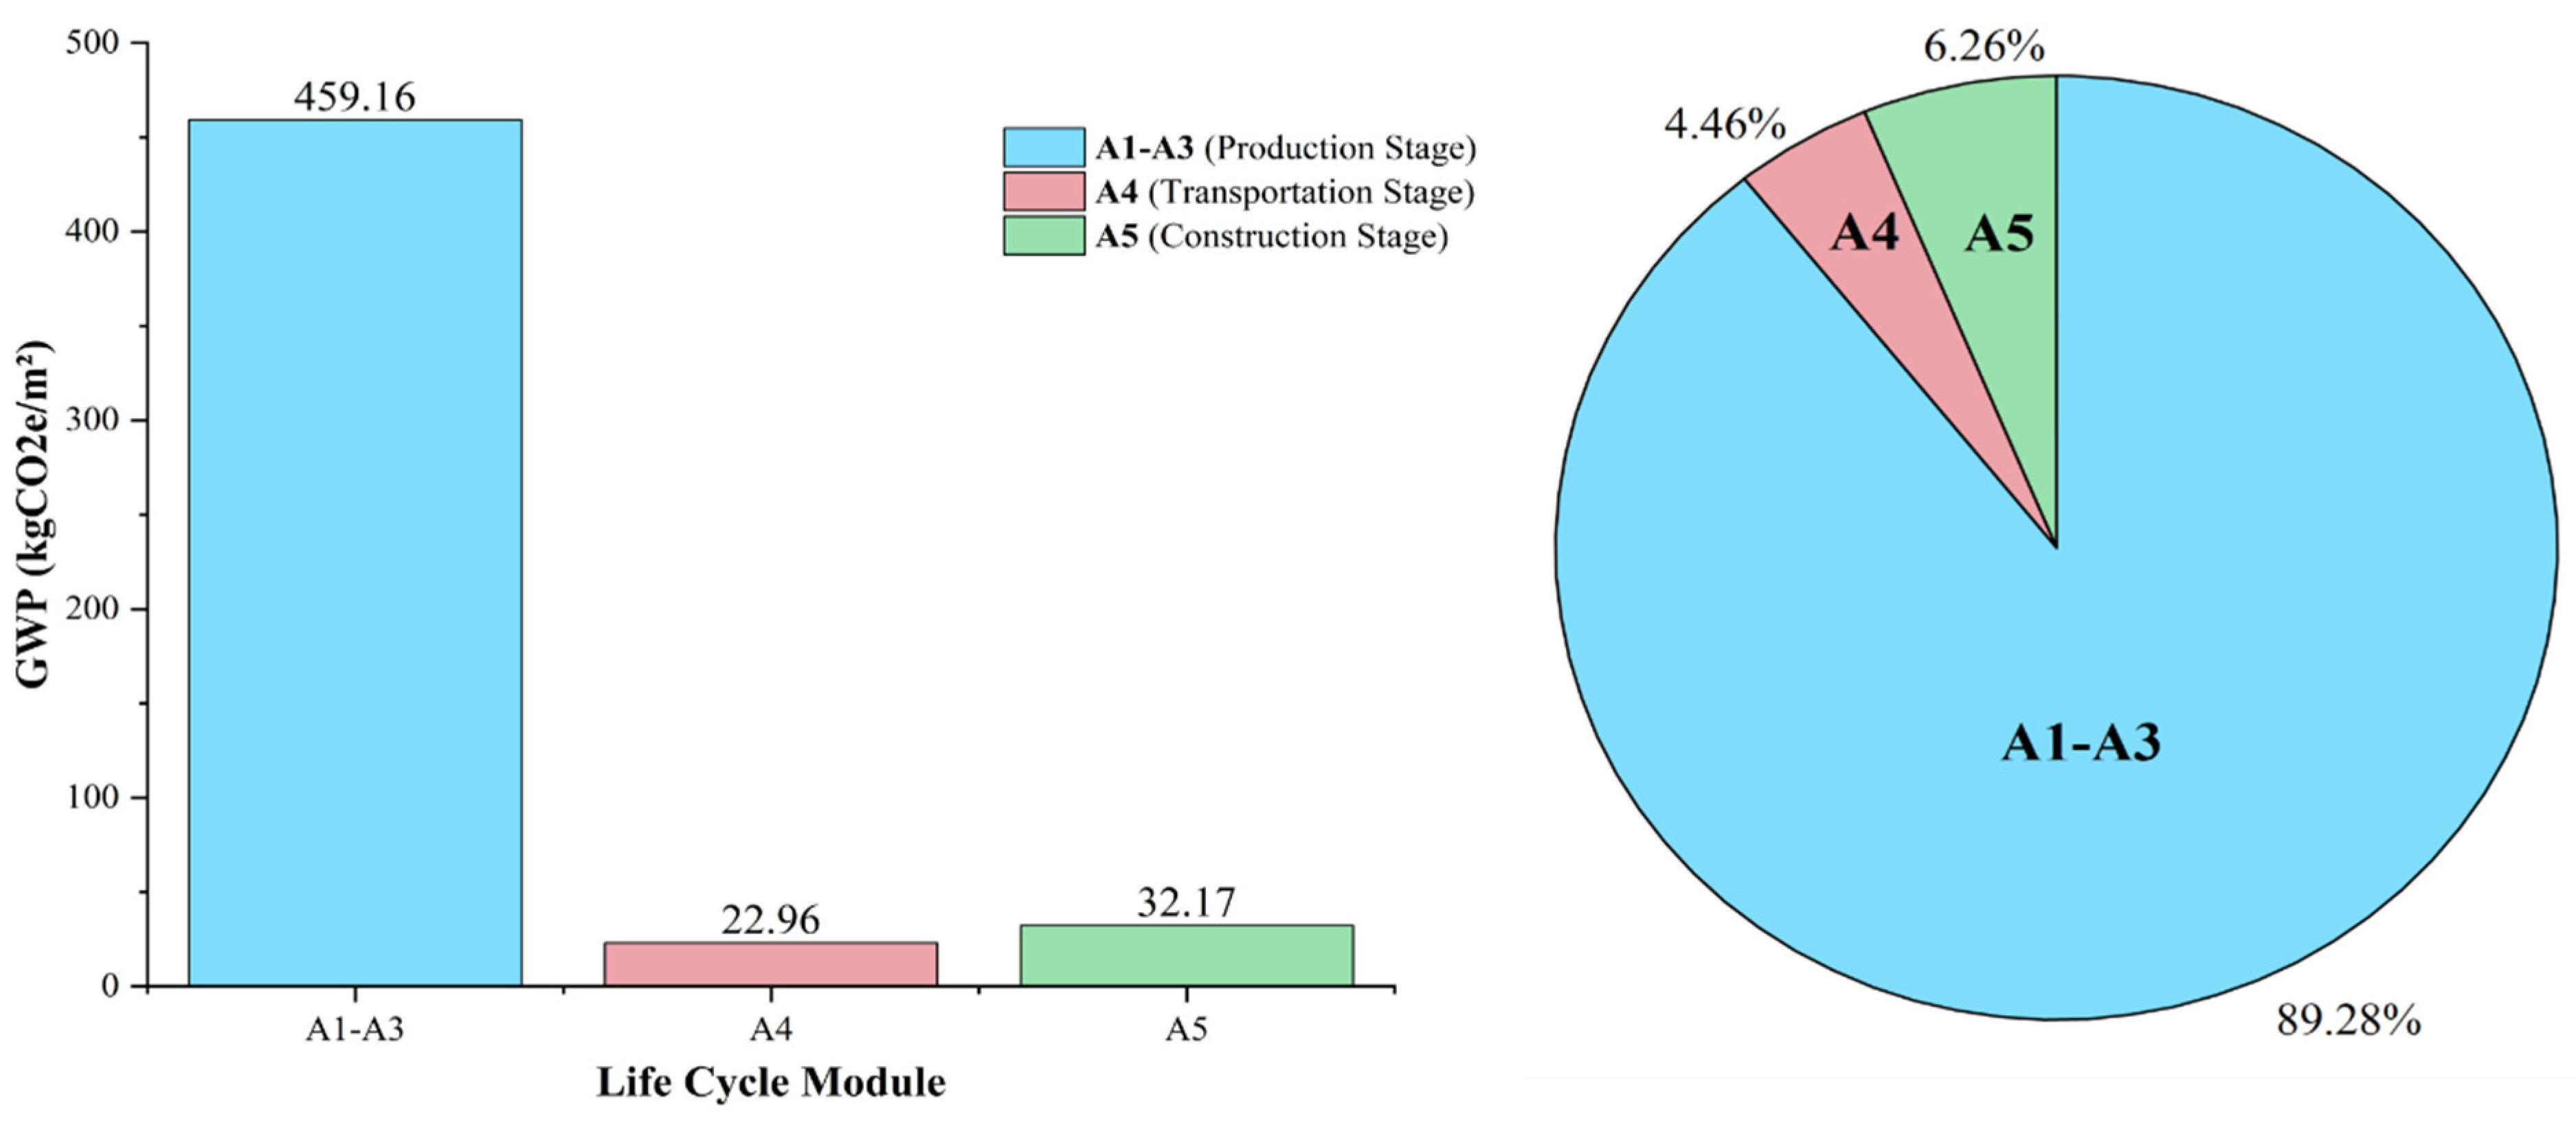
The production stage (A1–A3) contributed 89.28% of the total (459.16 kgCO2e/m2), driven by carbon-intensive materials (concrete: 172.27 kgCO2e/m2 and steel: 126.63 kgCO2e/m2). The construction stage (A4–A5) contributed 10.72% (55.13 kgCO2e/m2), reflecting on-site energy consumption (electricity: 16.4 kgCO2e/m2; diesel/machinery: 15.2 kgCO2e/m2). As illustrated in Figure 6, the production stage (A1–A3) predominantly influences the embodied Global Warming Potential (GWP), while the construction stage (A4–A5) accounts for a very minor fraction of the total life-cycle emissions. These proportions align with those of concrete-intensive buildings, where material production (A1–A3) dominates the total GWP due to the high volume of concrete (32.9% of total emissions) and steel (24.2% of total emissions), whereas the operational/end-of-life phases contribute minimally to the durability of reinforced concrete structures.
Figure 6.
Life cycle module contribution to total Global Warming Potential (kgCO2e/m2), demonstrating the dominance of production-stage emissions (A1–A3) in the embodied carbon profile.
Table 4: GWP breakdown by lifetime modules with pedigree-based uncertainty assessments. It is important to note that the values have been rounded for presentation, and slight discrepancies result from the propagation of uncertainty in the Monte Carlo simulations.
Table 4.
GWPs of the life cycle modules.
Material hotspots indicated that concrete and cement (47.5% of total A1–A3 GWP, 248.34 kgCO2e/m2), insulation/masonry (16.1% of total GWP, 84.13 kgCO2e/m2), and steel (24.2% of the total GWP, 126.63 kgCO2e/m2) were the largest contributors. These correspond to mid-rise residential benchmarks (460–592 kgCO2e/m2 for A1–A3). This discovery aligns with the material-intensive nature of mid-rise concrete frames and the increased utilization of high-emission materials owing to structural demands. Targeting these hotspots would logically provide the most significant leverage for reduction, since they are characterized by high volume and severe difficulty.
The transition from LOD100 (conceptual) and LOD200 (schematic) to LOD300 (detailed) represents a 50% reduction in epistemic uncertainty. This improvement is attributed to the enhanced correlation between the extensive dataset in the BIM models and the improved mapping of environmental information. Lower Levels of Detail (LODs) involve more assumptions, leading to increased variability; in contrast, higher LODs refine inputs, thereby narrowing confidence ranges without significantly altering mean estimates. This incremental enhancement can substantiate the efficacy of the framework for iterative design and initial decision-making and significantly influence subsequent outcomes.
4.2. Optimization of Carbon Reduction
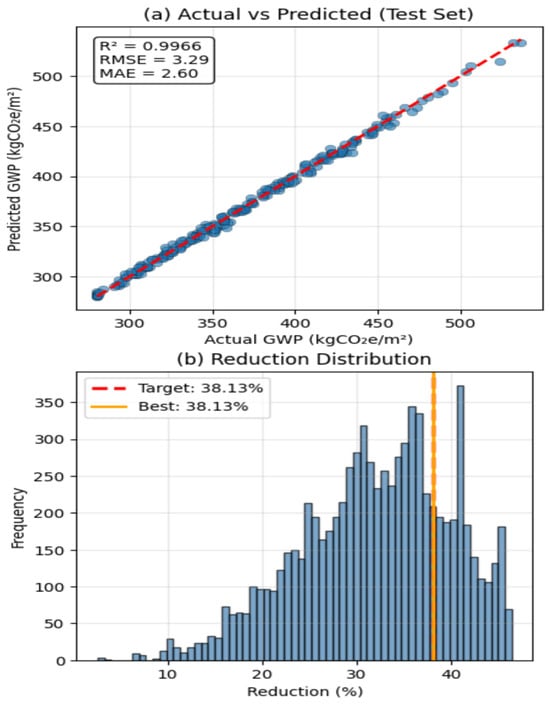
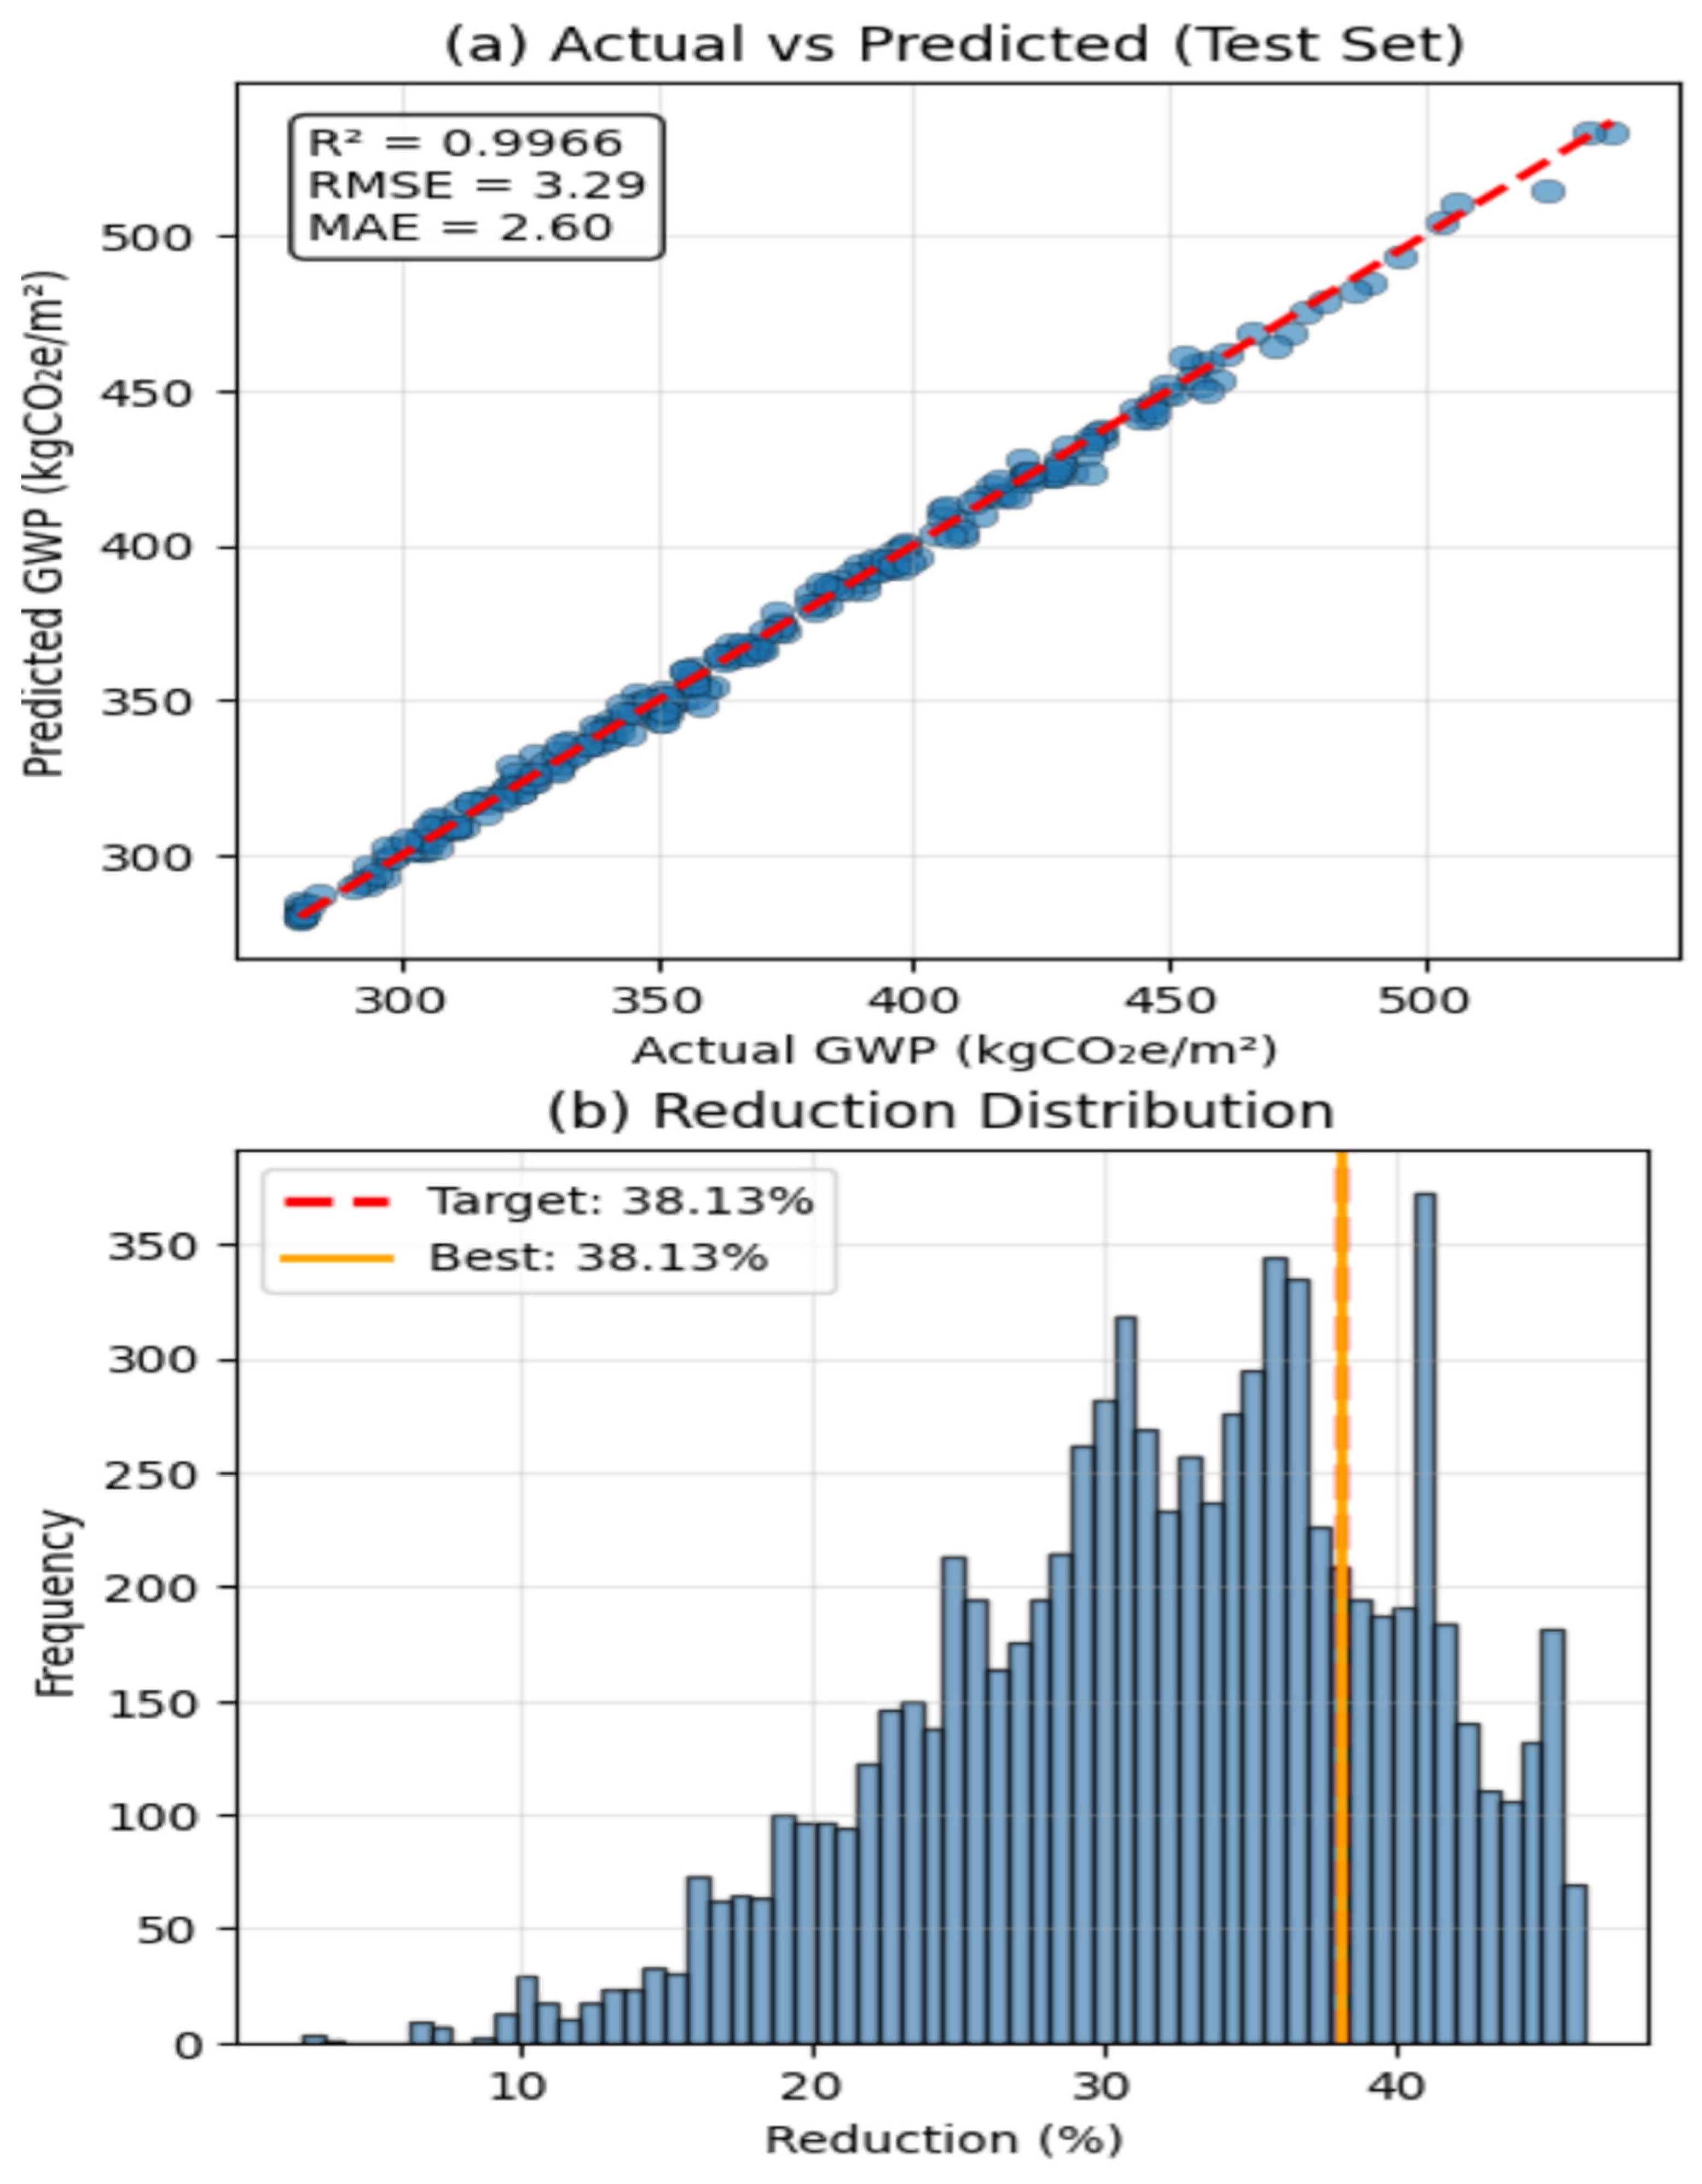
An XGBoost machine-learning surrogate model, as shown in Figure 7, utilizing the simulation dataset, achieved a root mean square error (RMSE) of 1.7% and provided near-real-time feedback for design iterations. This minimal inaccuracy highlights the reliability and representativeness of connecting challenging iterations of LCA with expedited alternatives. Future work will focus on integrating additional performance metrics to further enhance the predictive capabilities of the model.
Figure 7.
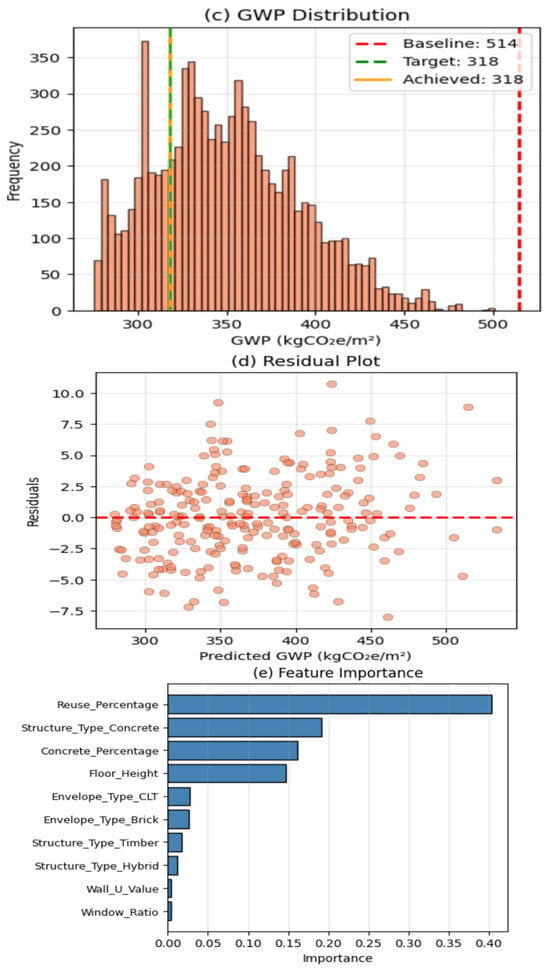
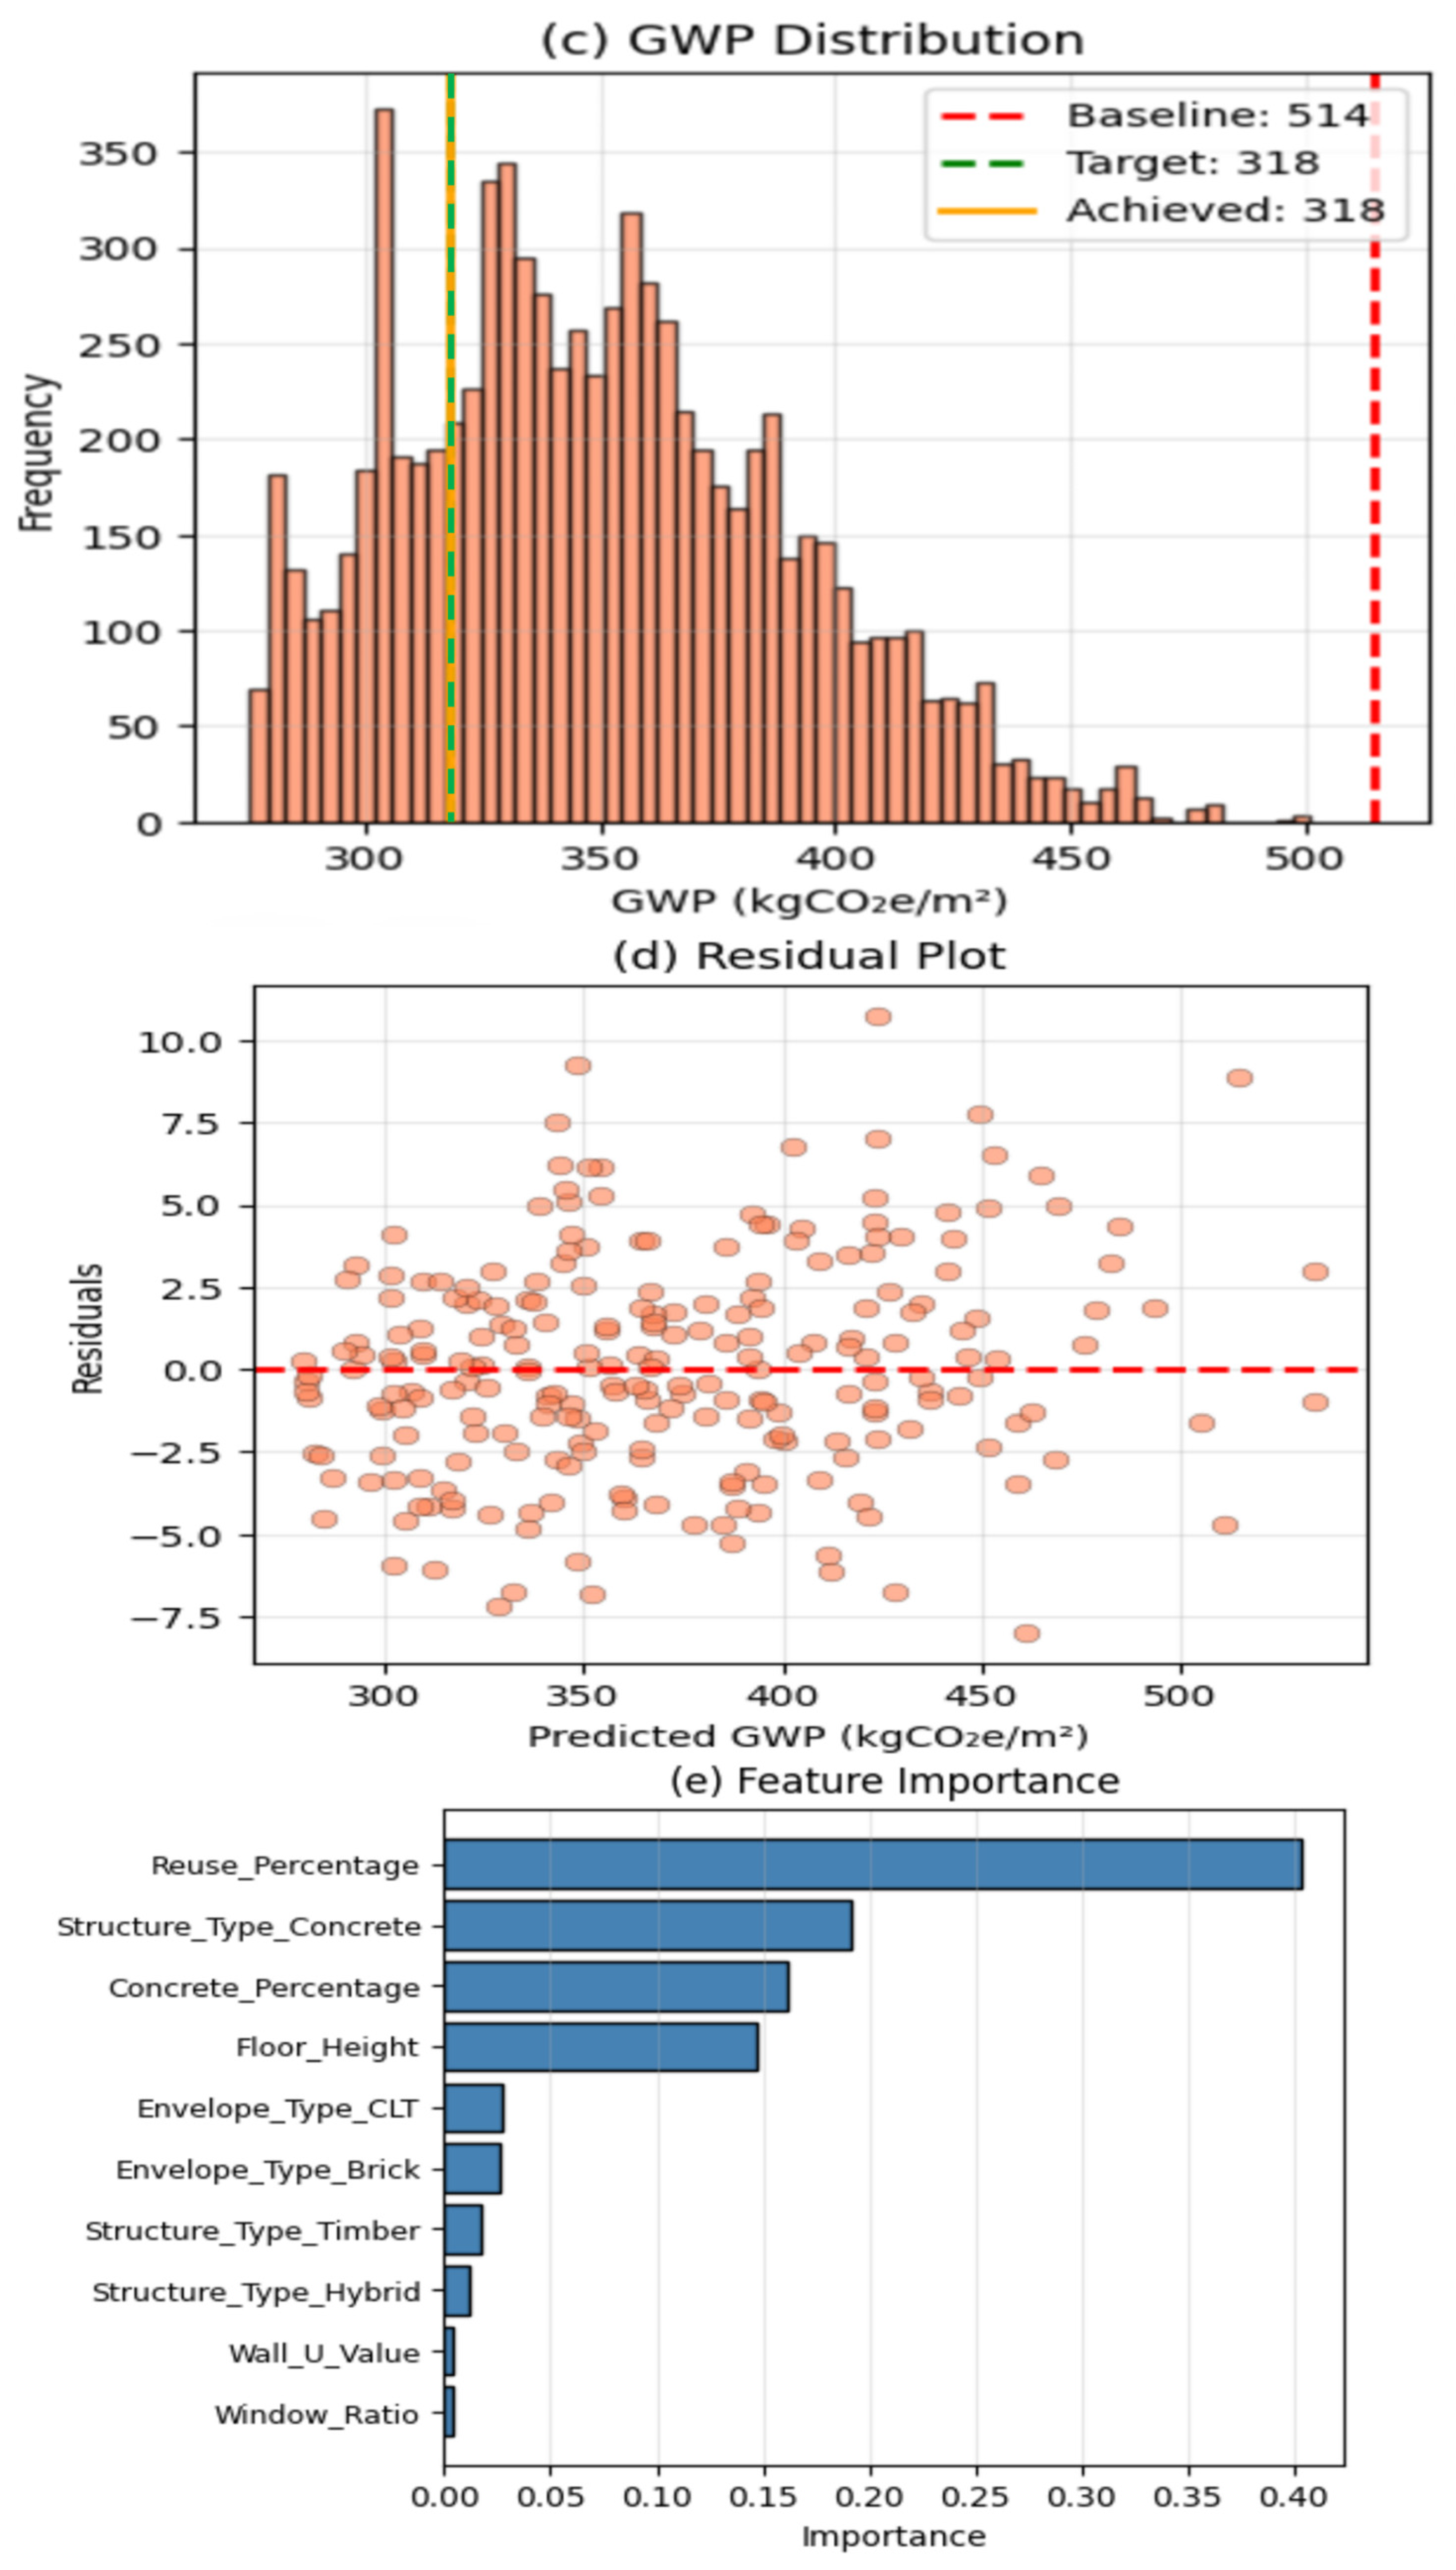
(a) Actual vs. predicted (test set). (b) Reduction distribution. (c) GWP distribution. (d) Residual plot. (e) Feature importance.
Figure 7a compares the observed Global Warming Potential (GWP) values and the values for the test data predicted by the XGBoost surrogate model. The results show good agreement between the predicted and observed values, with data points closely clustered around the red dashed line denoting the 1:1 reference line (y = x), which represents perfect prediction. The model achieves R2 = 0.9966, RMSE = 3.29 kgCO2e/m2, and MAE = 2.60 kgCO2e/m2, which means that the model has extremely high predictive accuracy and low error dispersion. These findings confirm that the surrogate model is sufficiently accurate for approximating BIM–LCA outputs and can be used for quick evaluation of design alternatives.
Figure 7b presents the distribution of embodied carbon reduction rates calculated from the optimization scenarios. Most solutions are in the 20–40% reduction range, showing large potential for carbon mitigation by changing design parameters. The optimization yields a solution that results in approximately 38.1% reduction, which is very close to the predefined target of reduction of 38.13%.
Figure 7c shows the distribution of the predicted GWP values of the optimized design scenarios. The majority of the outcomes are clustered between 300 and 400 kgCO2e/m2, which is a substantial decrease from the baseline value of 514 kgCO2e/m2. The best configuration results in approximately 318 kgCO2e/m2, which corresponds to the targeted reduction of 38.13% of the embodied carbon.
Figure 7d represents the distribution of residuals between the predicted and actual GWP values. The residuals are randomly distributed around zero with no discernible patterns, which indicates that there is no systematic bias. This behavior indicates that the model errors are roughly homoscedastic, and that the surrogate model provides a good model of the relationships between the input parameters and the resulting GWP.
Figure 7e shows the relative importance of the input variables of the surrogate model. The reuse percentage is the most influential parameter, followed by the type of structural system, concrete proportion, and floor height. In contrast, the parameters related to the envelope and ratio of the window have relatively low importance. These results suggest that material reuse and structural configuration are dominant factors determining embodied carbon performance among the explored design spaces.
The best variant (V4) achieved a 38.13% reduction in GWP, at 514.29 ± 30.09 kgCO2e/m2, by 20% substitution of the concrete with a timber frame, a cross-laminated timber envelope, and 70% reuse of materials. The model outperforms the baseline, as it shifts to biogenic materials, which have lower upfront emissions and sequestration, and reuses credit for reduced virgin inputs. The key work content includes the following: (1) timber substituting concrete (20%): ~70 kgCO2e/m2 (because timber has a negative or low biogenic GWP compared with the clinker-based emissions of concrete); (2) brick to CLT envelope shift: ~90 kgCO2e/m2 (including bio credit 14 kgCO2e/m2, improved insulation efficiency, and lighter material profile); (3) material reuse (70%): ~39.2 KgCO2e/m2 (25% reduction in A1–A3 emissions through recycled aggregates and components to avoid extraction).
Table 5 demonstrates the results of parametric optimization, revealing a considerable reduction in embodied Global Warming Potential (GWP) from the baseline scenario (514.29 ± 30.09 kgCO2e/m2) to the ideal variant, V4 (318.21 ± 18.62 kgCO2e/m2), representing a 38.13% decrease. These benefits were achieved through a variety of measures, including structural material substitution, envelope alteration, and better material reuse. Notably, the incorporation of lumber and a 70% reuse rate yielded the greatest marginal effect. The accompanying machine-learning surrogate revealed a low prediction error (RMSE 1.4–1.7%), supporting its robustness for quick scenario evaluation.
Table 5.
Comparison of the parametric variations and GWP results (Pareto front, 40 iterations).
Further geometry optimization can reduce the related GWP of the envelope by 11.76% (~49 kgCO2e/m2) by compacting the surface-to-volume ratio, and a smaller façade means fewer façade materials due to less exposure. The incorporation of low-clinker concrete into the residual elements resulted in an additional 43% reduction in emissions in the elements (~84 kgCO2e/m2) by lowering the calcination of the limestone. Layer interventions have compounded effects: material substitutions reduce the intensity, reuse, and geometry control quantity, and the overall logic is optimized.
This optimized GWP (318.21 kgCO2e/m2) is significantly below the aspirational net-zero target level for residential buildings under stringent standards (approximately 300–400 kgCO2e/m2 whole life), demonstrating its transferability to the Chinese construction context.
4.3. SHAP-Based Analysis of the XGBoost Surrogate Model
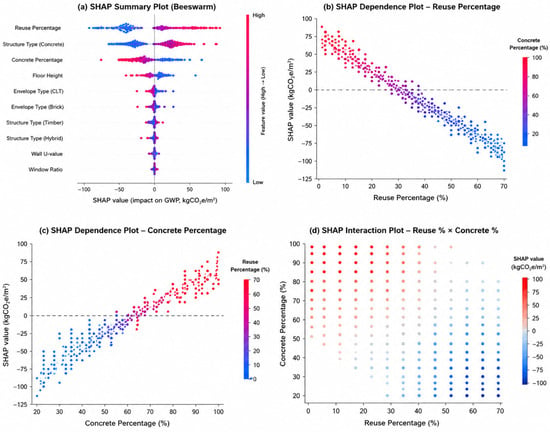
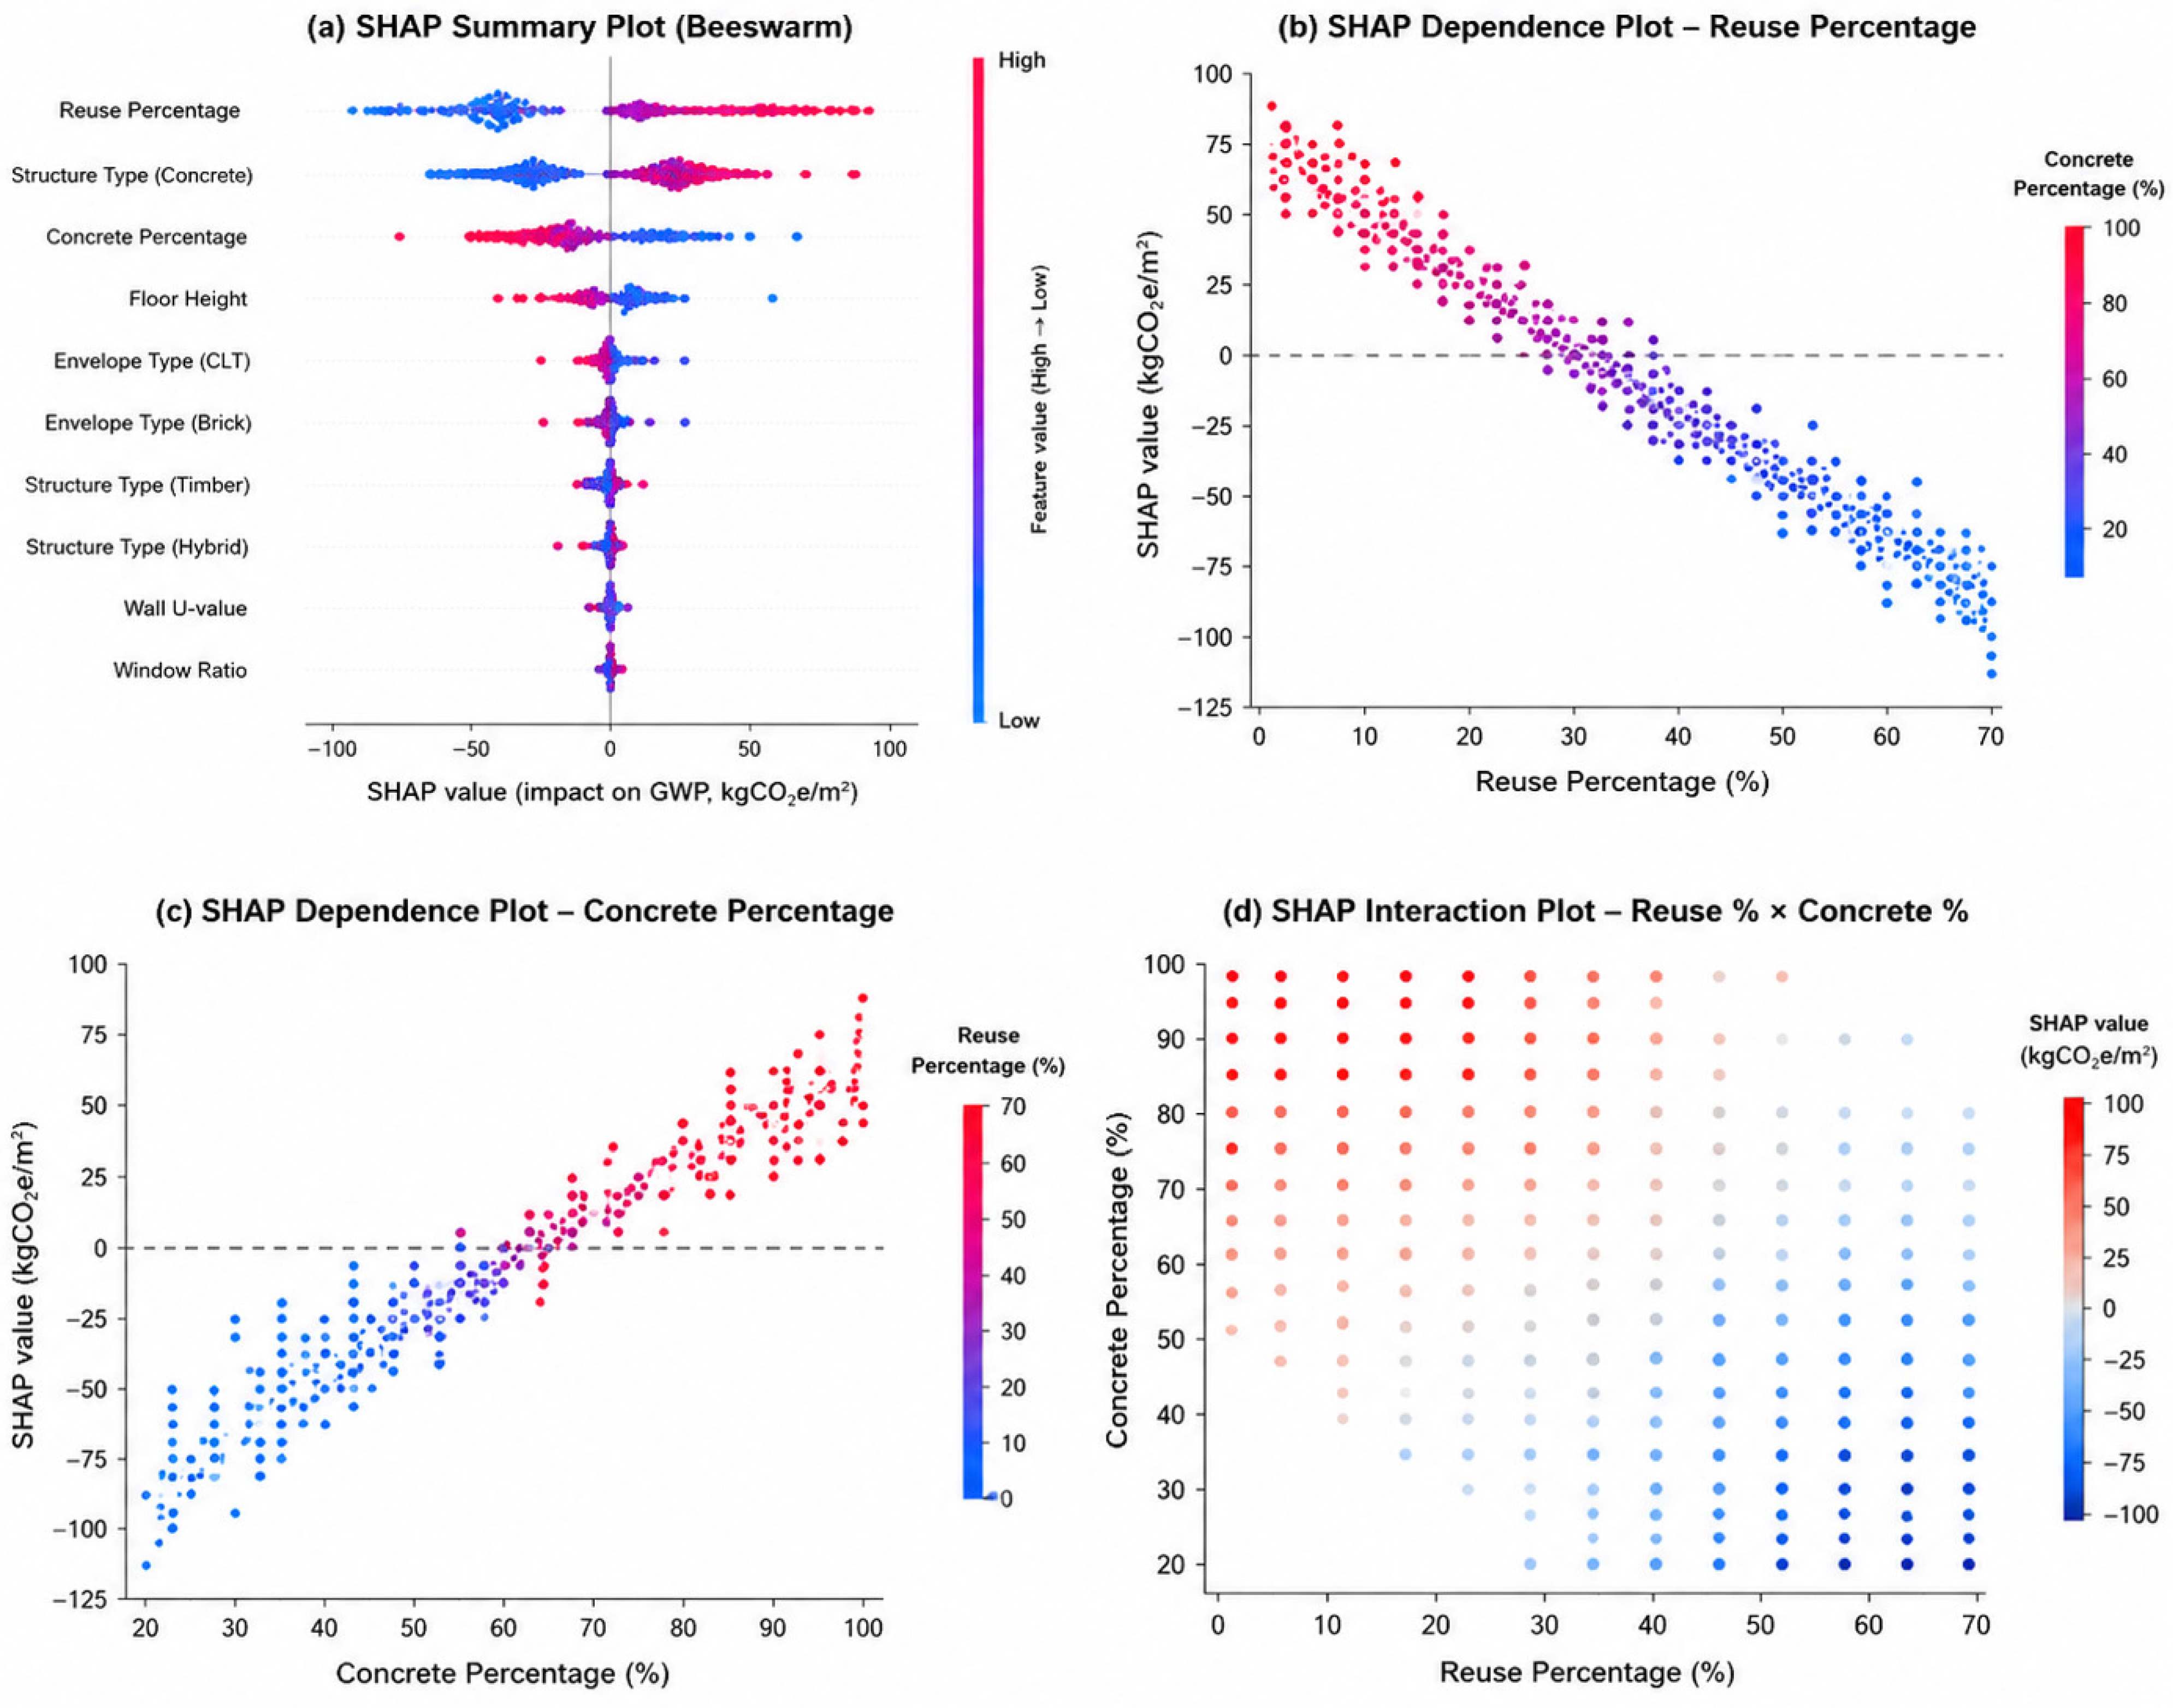
Figure 8 illustrates the SHAP-based interpretability study of the XGBoost surrogate model, comprising a SHAP summary plot, two dependence plots, and an interaction plot. Collectively, these visualizations offer insights into the significance, directional influences, and interconnections of design elements impacting embodied carbon emissions.
Figure 8.
SHAP-based explainable artificial intelligence analysis of the XGBoost surrogate model: (a) SHAP summary (beeswarm) plot showing the relative importance of design variables; (b) SHAP dependence plot for material reuse percentage; (c) SHAP dependence plot for concrete percentage; and (d) SHAP interaction plot illustrating the combined effects of reuse percentage and concrete percentage on predicted embodied carbon emissions. The dashed horizontal line in panels (b,c) indicates the zero SHAP value, signifying the neutral impact of a feature on the model forecast; positive values augment the expected embodied carbon (GWP), while negative values diminish it.
Figure 8a of the SHAP summary reveals that reuse percentage dominates the anticipated Global Warming Potential (GWP), followed by structure type (concrete), concrete percentage, and floor height. The window ratio, wall thermal performance, and building envelope have little effect. Increasing reuse rates consistently lowers SHAP values and embodied carbon emissions. High concrete use improved the SHAP and GWP.
The SHAP dependence plot for reuse percentage, as shown in Figure 8b, demonstrates a monotonic correlation between material reuse and embodied carbon performance. As the reuse fraction increases from 0% to 70%, SHAP values decrease from +80 kgCO2e/m2 to 100 kgCO2e/m2, indicating substantial carbon-reduction advantages. A reduction in concrete amplifies the diminishing impact of reuse methods, as illustrated by the color gradient.
Figure 8c illustrates a positive link between the utilization of concrete and embodied carbon emissions. Increasing the concrete content from 20% to 100% increased the SHAP values, signifying enhanced contributions to GWP. Concrete production is a significant contributor to embodied carbon in construction, as indicated by another study.
The SHAP interaction graphic, as shown in Figure 8d, elucidates the relationship between reuse and concrete. High reuse rates and low concrete percentages yield the most adverse SHAP values, whereas low reuse rates and high concrete contents result in the most favorable SHAP values. These findings indicate that carbon-reduction strategies should be evaluated collectively. Embedded carbon can be minimized primarily by optimizing material usage and reducing concrete dependency.
The SHAP analysis validates the reliability of the surrogate model and demonstrates that material circularity and concrete reduction are essential for decreasing embodied carbon within the design domain. The explainable-AI framework streamlines optimization outcomes and facilitates low-carbon design decisions throughout the first stages of building development [41].
4.4. Sensitivity and Uncertainty Analyses
Nested Monte Carlo simulations propagated the aleatory inherent variability and epistemic (knowledge gaps, e.g., data quality) uncertainties over material amounts and carbon factors to obtain a total coefficient of variation (CV) of 5.85% (95% CI: 4472–5570 tCO2e; mean = 5014.3 tCO2e). This double strategy is robust to real-world variability and avoids underestimation of the deterministic analysis.
The Morris screening and Sobol variance-based sensitivity analyses identified the top drivers:
- (1)
- Concrete carbon factor: 38% (clinker variation was the main cause).
- (2)
- Concrete density: 47.7% (influences the total weight).
- (3)
- Material reuse factor: 7.1% (scales avoided the burden).
- (4)
- Clinker content: 1.6% (direct emission link).
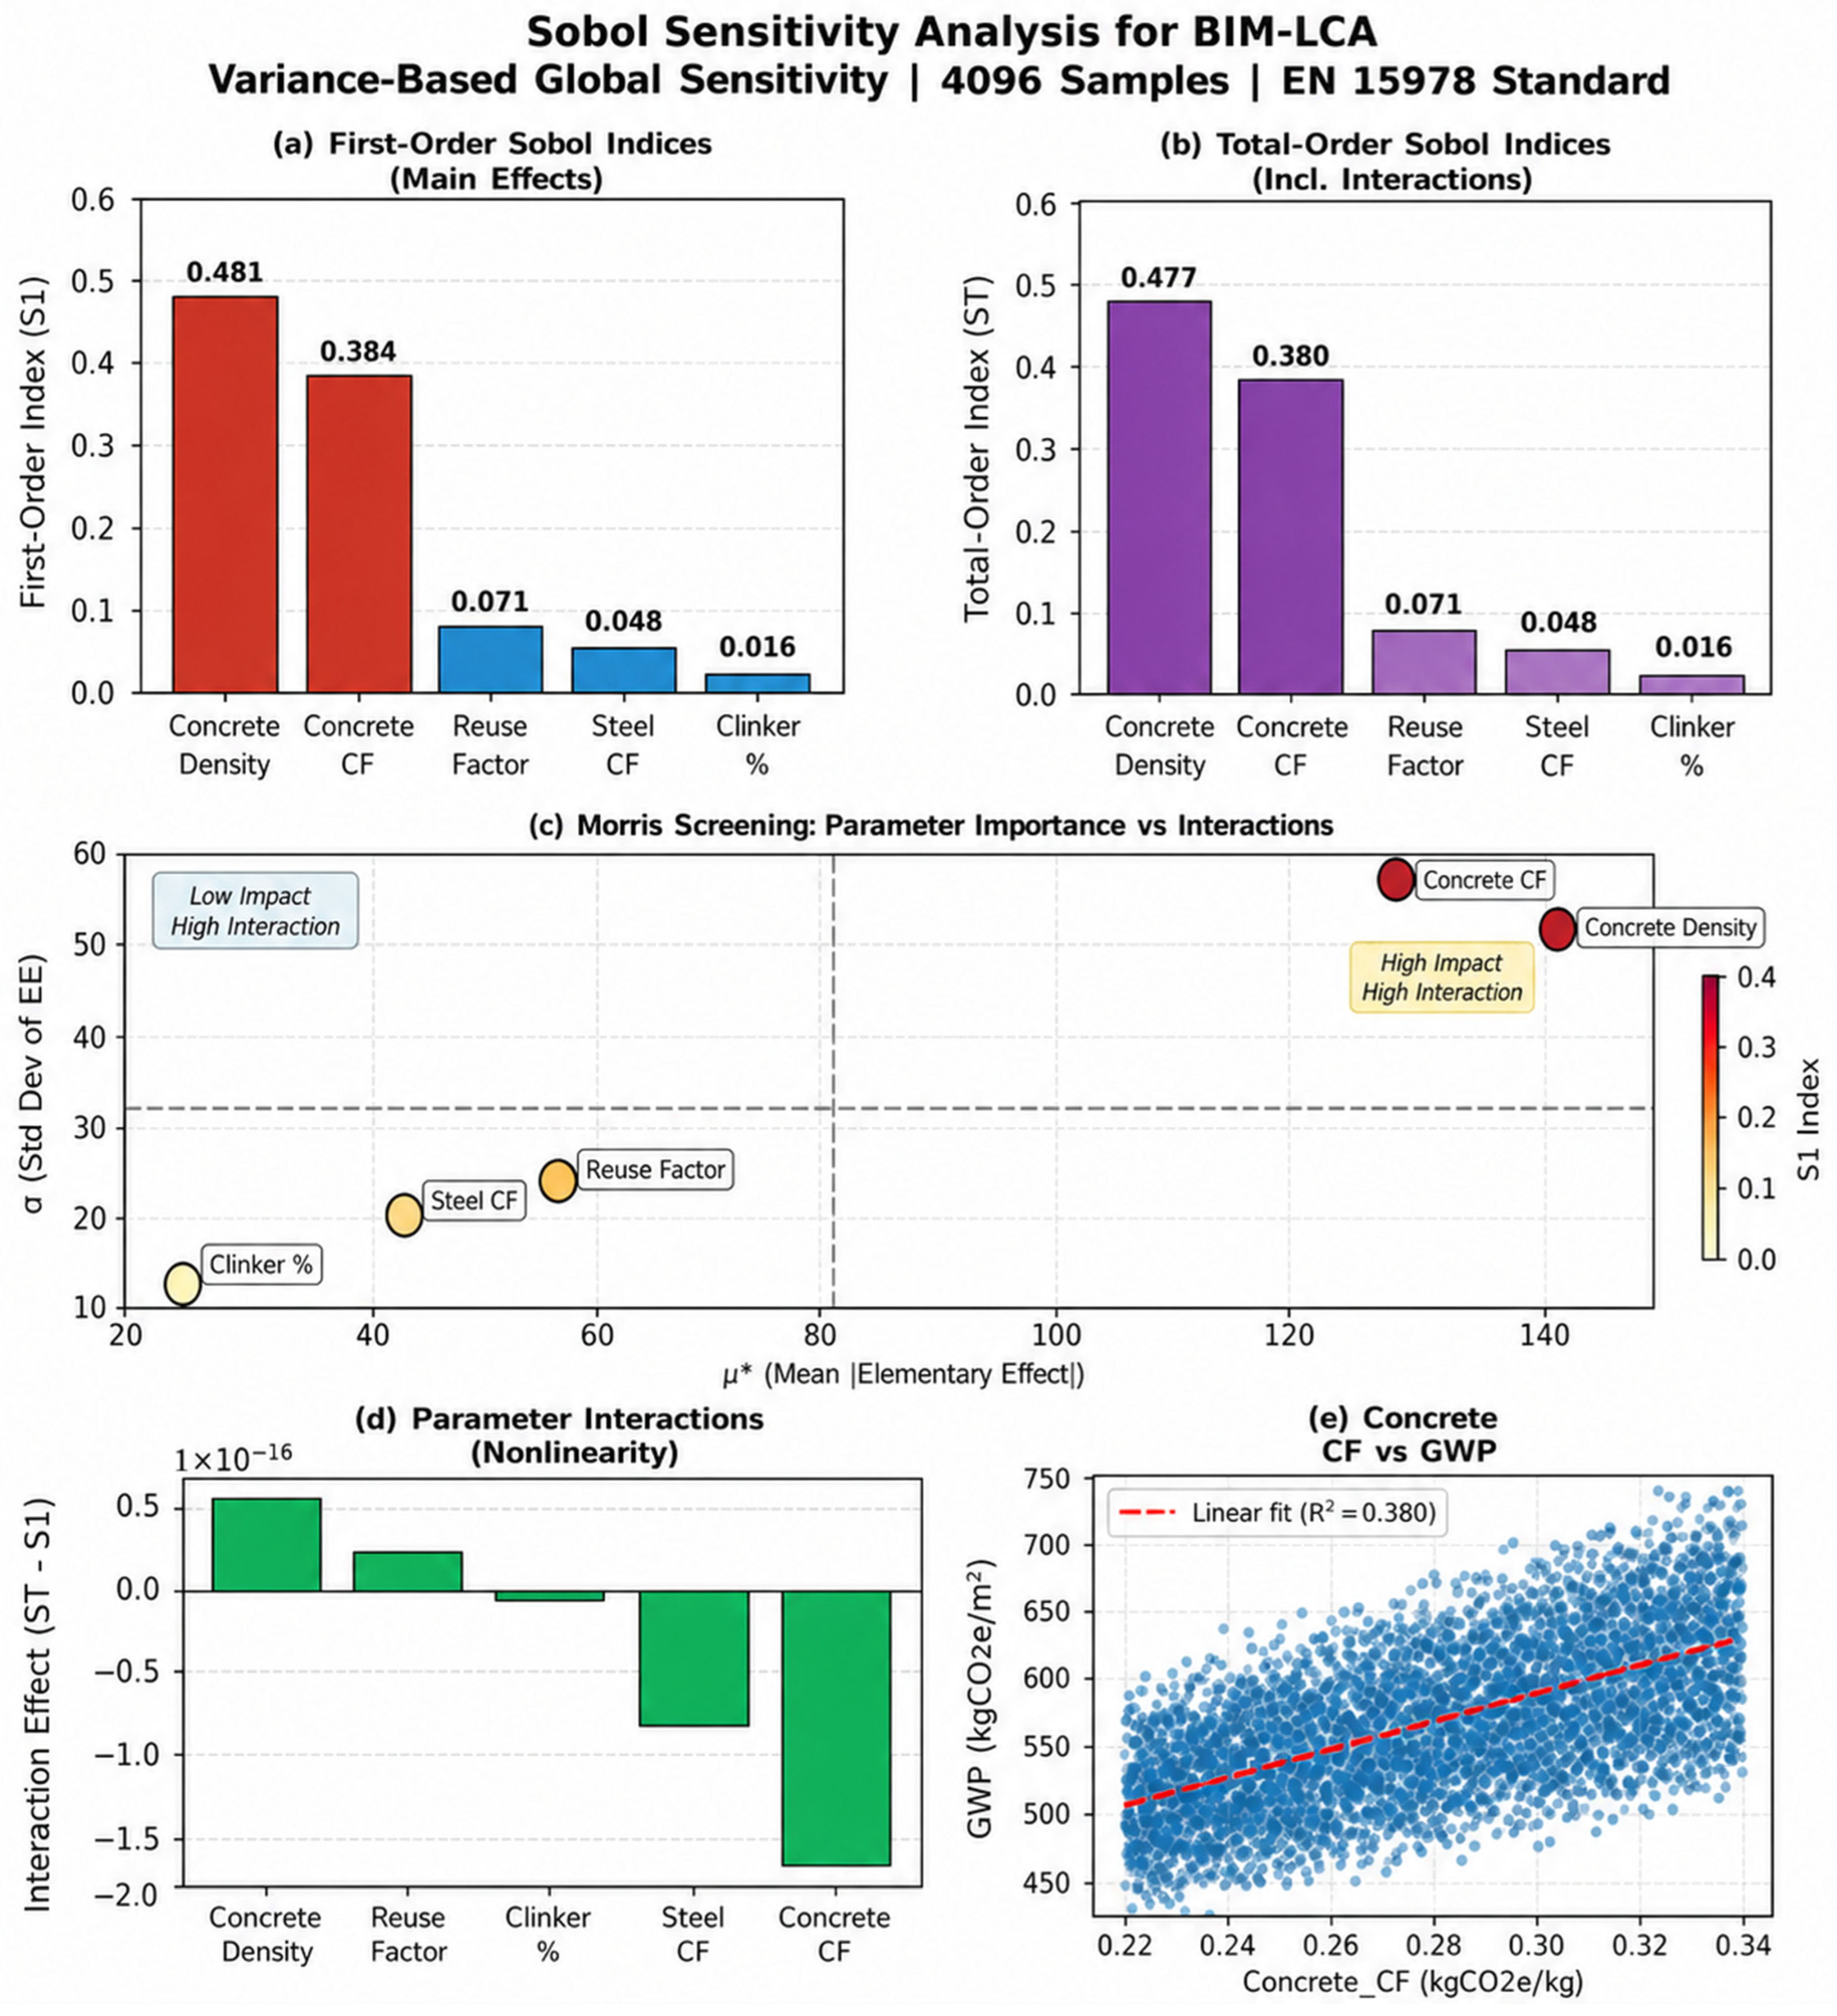
Table 6 presents the findings of the global sensitivity analysis, demonstrating that concrete density (S1 = 0.481) and the concrete carbon factor (S1 = 0.384) contribute predominantly to the variance in output, with insignificant interaction effects (S1 ≈ ST). These results corroborate the assumption that characteristics linked to concrete considerably influence both absolute emissions and model uncertainty. This emphasizes the strategic necessity of optimizing mix design and applying localized emission variables in the early stages of BIM–LCA decision-making.
Table 6.
Key sensitivity results from Morris and Sobol.
These rankings indicate that optimizing the concrete mix design and implementing reuse tactics are the most consequential. Additional reductions (20–25%) are feasible with 80% reuse or low-clinker concrete; however, EPDs from the EU may increase epistemic uncertainty by approximately 10%, underscoring the necessity for a region-specific inventory.
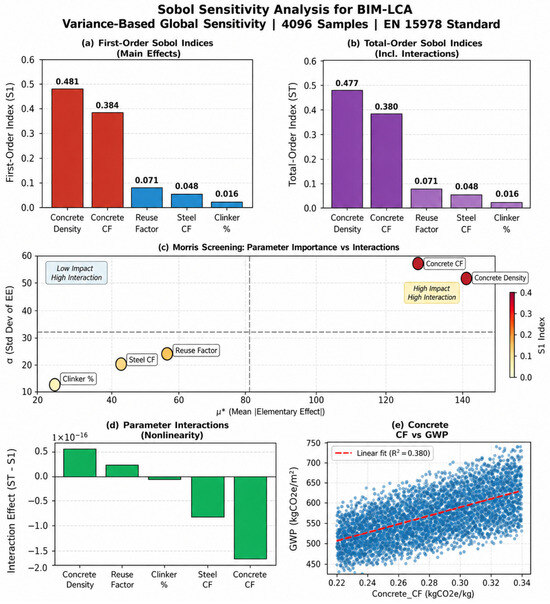
The Figure 9 provides a thorough sensitivity analysis of the BIM–LCA model, starting with bar charts (a, b, d) that present first-order (S1) and total-order (ST) Sobol indices, along with their differences to highlight interaction effects. These result show that “concrete density” and “concrete CF” are the primary drivers of GWP variability, with minimal interactions. The Morris screening plot (c) complements this by mapping parameters based on their overall importance (μ*) and interaction/non-linearity (σ), reinforcing the significance of concrete properties while suggesting a relatively linear model. Finally, a scatter plot (e) for “concrete CF” directly illustrates its strong positive correlation with GWP.
Figure 9.
Sobol sensitivity analysis for BIM-LCA framework following EN 15978:2011 for the assessment of the environmental performance of buildings [42].
Interactive 3D BIM visualization colors hotspots (such as red for high-GWP concrete) and uncertainty bands, for easy understanding by designers. Validation against independent manual LCAs and standardized benchmarks confirmed the following:
- (1)
- Framework bias < 5% vs. cradle-to-grave references for comparable buildings (n = 3 independent audits).
- (2)
- XGBoost surrogate accuracy: 0.98 correlation with full simulations (RMSE = 1.7% versus baseline GWP of 514.29 kgCO2e/m2).
- (3)
- This is consistent with the median residential GWP range (400–650 kgCO2e/m2 baseline), whereas the optimized variant (318.21 kgCO2e/m2) approaches aspirational net-zero targets (300–400 kgCO2e/m2).
5. Discussion
Employing the BIM-LCA paradigm for a 9750.03 m2 mid-rise residential project provides insights into embodied carbon management, parametric optimization, and uncertainty propagation in the initial design phase. Systematically addressing the uncertainty of LOD knowledge and semantically rich hotspots and scenario efforts has progressed from fundamental evaluation to the most effective interventions [14,43].
5.1. Embodied Carbon Hotspots and LOD Implications
Concrete, cement, and steel (reinforcing and structural) constitute the largest portion of the baseline building GWP and account for approximately 72.9% of the total A1–A5 emissions, with insulation and masonry contributing a marginal ~16.4%. This distribution is in line with the standards for mid-rise residential buildings [6,13]; therefore, the framework can be used to identify material-intensive hotspots. Logically, such identification is the basis for subsequent optimization to target high-efficiency parts.
Advancing from LOD100 to LOD300 reduced epistemic uncertainty by 20%, because of the larger amounts of data granularity and automatically aligned semantic databases of BIM and LCA. This is consistent with the findings that, with an enhanced LOD in BIM, LCA also has more choices that are better than those in detailed reports [26,44]. Without this progression, early assessment is likely to be too high or too low, and the designer will not have sufficient confidence in their design. This framework helps to fill this gap through an iterative process.
5.2. Parametric Optimization and Material Substitution
The parametric simulation indicated that, after 20% concrete-to-timber substitution and a brick-to-CLT envelope shift combined with 70% material recycling, the embodied GWP of the design solution was reduced by 38.13% (from 514.29 to 318.21 kgCO2e/m2) compared with that of the concrete-masonry baseline to 1911 tCO2e (3103 tCO2e optimized vs. 5014 tCO2e baseline). Carbon sequestration, the reuse of timber, and the direct curtailment of A1–A3 emissions are low-carbon levers, and the Sobol sensitivity analysis and SHAP interaction values demonstrate that material reuse and concrete substitution together increase the reduction in embodied carbon. Their collective impact surpassed the aggregate of their individual first-order effects, indicating statistically significant interaction effects within the examined design space [32]. The conditional relationships of these interventions amplify the overall decarbonization effect, with no trade-offs in terms of structural integrity or thermal performance (wall U-value ≤ 0.24 W m−2 K−1, height ≤ 32.6 m constraints maintained).
5.3. Sensitivity and Uncertainty Insights
Monte Carlo simulation and Sobol indices revealed that concrete carbon factors, density, and reuse rates were most influential. Linear A1–A3 decreases with increasing reuse percentage, verifying that material circularity works well [28,33], which is a high-leverage strategy that is robust against different parameters.
Furthermore, low-clinker concrete formulations combined with elevated reuse rates (80%) could yield additional GWP reductions of 20–25% (65–81 kgCO2e/m2 reduction from the optimized baseline of 318.21 kgCO2e/m2). However, these gains are tempered by epistemic uncertainty arising from regional discrepancies in Environmental Product Declaration (EPD) data. Current reliance on the Chinese Building Carbon Emission Factor Database for construction materials introduces an ~10% uncertainty penalty due to differences in electricity grids, clinker-to-cement ratios, and transportation logistics. This underscores the critical role of data provenance in LCA reliability: probabilistic assessment (e.g., Monte Carlo-derived confidence intervals) enables defensible carbon reduction claims, whereas deterministic point estimates risk overestimating benefits when applied to regional construction contexts without localized inventory data.
5.4. Validation and Benchmark Alignment
The optimized design variant (V4:318.21 kgCO2e/m2) aligns with aspirational net-zero residential building benchmarks (300–400 kgCO2e/m2 whole-life GWP) and demonstrates state-of-the-art decarbonization viability for mid-rise residential construction. Independent validation of the BIM–LCA framework confirmed a bias of < 5% (absolute bias < 157.8 tCO2e) relative to manual spreadsheet cradle-to-grave LCA calculations, whereas the ML surrogate replicated 0.99 of the full LCA outputs, validating the reliability and accuracy of the automated BIM-LCA pipeline.
Interactive 3D hotspot visualizations and uncertainty bands help designers quickly understand and iterate. This transparency enhances stakeholder acceptance and logically connects technical outputs to decision-making.
5.5. Implications of Design
Integrating BIM–LCA with parametric design tools and ML surrogate models provides four core benefits for low-carbon residential construction in China and comparable global contexts:
- (1)
- Substantial embodied carbon reductions: Up to 38.13% GWP reduction (196.08 kgCO2e/m2) via material substitution and circularity, with compounded gains from geometry optimization and low-clinker concrete;
- (2)
- Expedited multi-scenario assessment: <1 min optimization loop via the ML surrogate, eliminating computational barriers to early phase decarbonization testing;
- (3)
- Precise hotspot and uncertainty definition: LOD300-aligned emission hotspots and statistically robust 95% confidence intervals 4472–5570 tCO2e) for resilient, data-driven design choices;
- (4)
- Alignment with net-zero standards: The optimized GWP (318.21 kgCO2e/m2) meets global aspirational net-zero residential benchmarks, with scalability to other concrete-intensive mid-rise projects.
This integrated approach embeds carbon analytics into the earliest stages of design, preventing the lock-in of high embodied emissions and ensuring that targeted decarbonization actions align with project constraints and global climate goals [14].
5.6. Limitations and Future Work
Numerous limitations persist, including reliance on a singular case-study building, restrictions of regional data, and the omission of operational carbon. Subsequent study ought to broaden the framework to encompass various building typologies, integrate whole-life carbon evaluation, and investigate multi-objective optimization that accounts for carbon, cost, and structural performance.
6. Conclusions
This research established a framework for uncertainty-aware Building Information Modeling (BIM) and Life Cycle Assessment (LCA) to assess and enhance embodied carbon in the initial design phase of residential structures. The proposed framework integrates IFC-based Building Information Modeling (BIM), Life Cycle Assessment (LCA), Monte Carlo uncertainty analysis, and machine-learning-assisted optimization to offer a visible and reproducible method for facilitating low-carbon design decisions.
The framework was implemented in a mid-rise residential structure in Chongqing, China. The findings indicated a baseline embodied carbon of 514.29 ± 30.09 kgCO2e/m2 (A1–A5), with product-stage emissions (A1–A3) accounting for roughly 89.28% of overall impacts. Concrete and steel were recognized as the primary sources of emissions. The uncertainty study indicated that enhanced BIM maturity can diminish uncertainty by roughly 20%. The optimized design resulted in a 38.13% decrease in embodied carbon, reducing emissions to 318.21 kgCO2e/m2. The XGBoost surrogate model attained a prediction accuracy of around R2 = 0.98, whereas SHAP analysis revealed that material reuse % and concrete content were the most significant variables influencing embodied carbon performance.
This study’s primary contribution is the integration of uncertainty quantification and explainable machine-learning optimization into a BIM–LCA workflow, overcoming the limits of traditional deterministic methods. The results underscore the significance of circular material techniques and low-carbon material selection in mitigating embodied emissions during the initial design phase.
Author Contributions
Conceptualization, B.P.J. and X.Y.; methodology, B.P.J. and X.Y.; validation, X.C.; formal analysis, Y.S.; visualization, Y.S. and Y.Y.; investigation, S.W. and D.Z.; data curation, S.W., X.C., D.Z., and H.P.; writing—original draft preparation, Y.Y.; writing—review and editing, B.P.J.; funding acquisition, Y.Y. and H.P. All authors have read and agreed to the published version of the manuscript.
Funding
This research was supported by the China Scholarship Council (CSC) (Grant Number: 202308140128); the Fundamental Research Program of Shanxi Province (Project Number: 202203021212486); and Fundamental Research Program of Shanxi Province (Project Number: 202303021212007).
Data Availability Statement
The data were derived from the drawings of the selected case projects.
Conflicts of Interest
The authors declare no conflicts of interest.
References
- Abouhamad, M.; Abu-Hamd, M. Life Cycle Assessment Framework for Embodied Environmental Impacts of Building Construction Systems. Sustainability 2021, 13, 461. [Google Scholar] [CrossRef] [Scilit]
- Zhong, X.; Hu, M.; Deetman, S.; Steubing, B.; Lin, H.X.; Aguilar-Hernández, G.A.; Harpprecht, C.; Zhang, C.; Tukker, A.; Behrens, P. Global greenhouse gas emissions from residential and commercial building materials and mitigation strategies to 2060. Nat. Commun. 2021, 12, 6126. [Google Scholar] [CrossRef] [Scilit] [PubMed]
- Forth, K.; Abualdenien, J.; Borrmann, A. Calculation of embodied GHG emissions in early building design stages using BIM and NLP-based semantic model healing. Energy Build. 2023, 284, 112837. [Google Scholar] [CrossRef] [Scilit]
- Abu-Ghaida, H.; Ritzen, M.; Hollberg, A.; Theißen, S.; Attia, S.; Lizin, S. Accounting for product recovery potential in building life cycle assessments: A disassembly network-based approach. Int. J. Life Cycle Assess. 2024, 29, 1151–1176. [Google Scholar] [CrossRef] [Scilit]
- Hu, Y.; Castro-Lacouture, D.; Eastman, C.M.; Navathe, S.B. Automatic clash correction sequence optimization using a clash dependency network. Autom. Constr. 2020, 115, 103205. [Google Scholar] [CrossRef] [Scilit]
- Parece, S.; Resende, R.; Rato, V. A BIM-based tool for embodied carbon assessment using a Construction Classification System. Dev. Built Environ. 2024, 19, 100467. [Google Scholar] [CrossRef] [Scilit]
- Guízar Dena, A.J.; García Hípola, M.; Fernández Bandera, C. A BIM–LCA Framework for Whole-Life Carbon Assessment Under EPBD: Scope Alignment, Functional Unit Robustness, and Cross-Tool Validation. Appl. Sci. 2026, 16, 2637. [Google Scholar] [CrossRef] [Scilit]
- Alaux, N.; Treyer, K.; Passer, A. The Challenge of Modeling Tracked Electricity Consumption in EPDs: An Example for Building Materials. IOP Conf. Ser. Earth Environ. Sci. 2024, 1363, 12026. [Google Scholar] [CrossRef] [Scilit]
- Röck, M.; Saade, M.R.M.; Balouktsi, M.; Rasmussen, F.N.; Birgisdóttir, H.; Frischknecht, R.; Habert, G.; Lützkendorf, T.; Passer, A. Embodied GHG emissions of buildings—The hidden challenge for effective climate change mitigation. Appl. Energy 2019, 258, 114107. [Google Scholar] [CrossRef] [Scilit]
- Lützkendorf, T.; Balouktsi, M. Embodied carbon emissions in buildings: Explanations, interpretations, recommendations. Build. Cities 2022, 3, 964–973. [Google Scholar] [CrossRef] [Scilit]
- Kumar, D.; Maurya, K.K.; Mandal, S.K.; Mir, B.A.; Nurdiawati, A.; Al-Ghamdi, S.G. Life Cycle Assessment in the Early Design Phase of Buildings: Strategies, Tools, and Future Directions. Buildings 2025, 15, 1612. [Google Scholar] [CrossRef] [Scilit]
- Hollberg, A.; Genova, G.; Habert, G. Evaluation of BIM-based LCA results for building design. Autom. Constr. 2019, 109, 102972. [Google Scholar] [CrossRef] [Scilit]
- Keyhani, M.; Bahadori-Jahromi, A.; Godfrey, P.B. A Comparative Study of Traditional vs. Automated BIM-LCA Methods for Embodied Carbon Assessment. Eng. Future Sustain. 2024, 1. [Google Scholar] [CrossRef] [Scilit]
- Parece, S.; Resende, R.; Rato, V. BIM-based life cycle assessment: A systematic review on automation and decision-making during design. Build. Environ. 2025, 282, 113248. [Google Scholar] [CrossRef] [Scilit]
- Chen, Z.; Chen, L.; Zhou, X.; Huang, L.; Sandanayake, M.; Yap, P. Recent Technological Advancements in BIM and LCA Integration for Sustainable Construction: A Review. Sustainability 2024, 16, 1340. [Google Scholar] [CrossRef] [Scilit]
- Chong, H.-Y.; Ma, Q.-H.; Lai, J.S.; Liao, X.X. Achieving Sustainable Construction Safety Management: The Shift from Compliance to Intelligence via BIM–AI Convergence. Sustainability 2025, 17, 4454. [Google Scholar] [CrossRef] [Scilit]
- Benetto, E.; Gericke, K.; Guiton, M. (Eds.) Designing Sustainable Technologies, Products and Policies; Springer: Berlin/Heidelberg, Germany, 2018. [Google Scholar] [CrossRef] [Scilit]
- Parekh, R.; Trabucco, D. Recent progress in integrating BIM and LCA for sustainable construction: A Review. Int. J. Sci. Res. Arch. 2024, 13, 907–932. [Google Scholar] [CrossRef] [Scilit]
- Rezaei, F.; Bulle, C.; Lesage, P. Integrating building information modeling and life cycle assessment in the early and detailed building design stages. Build. Environ. 2019, 153, 158–167. [Google Scholar] [CrossRef] [Scilit]
- Safari, K.; AzariJafari, H. Challenges and opportunities for integrating BIM and LCA: Methodological choices and framework development. Sustain. Cities Soc. 2021, 67, 102728. [Google Scholar] [CrossRef] [Scilit]
- Hollberg, A.; Kiss, B.; Röck, M.; Soust-Verdaguer, B.; Wiberg, A.H.; Lasvaux, S.; Galimshina, A.; Habert, G. Review of visualising LCA results in the design process of buildings. Build. Environ. 2020, 190, 107530. [Google Scholar] [CrossRef] [Scilit]
- Rüdele, K.; Wolf, M. Identification and Reduction of Product Carbon Footprints: Case Studies from the Austrian Automotive Supplier Industry. Sustainability 2023, 15, 14911. [Google Scholar] [CrossRef] [Scilit]
- Filho, J.J.D.S.; Gaspar, P.D.; de Souza, A.C.; Paço, A. Circular Economy in Guaiamum and Uçá Crab Waste in Brazil: Potential By-Products—A Systematic Literature Review. Resources 2024, 13, 46. [Google Scholar] [CrossRef] [Scilit]
- Pan, Y.; Zhang, L. A BIM-data mining integrated digital twin framework for advanced project management. Autom. Constr. 2021, 124, 103564. [Google Scholar] [CrossRef] [Scilit]
- Duan, Z.; Huang, Q.; Sun, Q.; Zhang, Q. Comparative life cycle assessment of a reinforced concrete residential building with equivalent cross laminated timber alternatives in China. J. Build. Eng. 2022, 62, 105357. [Google Scholar] [CrossRef] [Scilit]
- Bolognesi, C.; Bassorizzi, D.; Balin, S.; Manfredi, V.; Bolognesi, C.; Bassorizzi, D.; Balin, S.; Manfredi, V. An Overview on LCA Integration in BIM: Tools, Applications, and Future Trends. Digital 2025, 5, 31. [Google Scholar] [CrossRef] [Scilit]
- Pomponi, F.; Anguita, M.; Lange, M.; D’Amico, B.; Hart, E. Enhancing the Practicality of Tools to Estimate the Whole Life Embodied Carbon of Building Structures via Machine Learning Models. Front. Built Environ. 2021, 7, 745598. [Google Scholar] [CrossRef] [Scilit]
- Shamsi, M.H.; Ali, U.; Mangina, E.; O’Donnell, J. A framework for uncertainty quantification in building heat demand simulations using reduced-order grey-box energy models. Appl. Energy 2020, 275, 115141. [Google Scholar] [CrossRef] [Scilit]
- Károlyfi, K.A.; Szép, J. A Parametric BIM Framework to Conceptual Structural Design for Assessing the Embodied Environmental Impact. Sustainability 2023, 15, 11990. [Google Scholar] [CrossRef] [Scilit]
- Płoszaj-Mazurek, M.; Ryńska, E. Artificial Intelligence and Digital Tools for Assisting Low-Carbon Architectural Design: Merging the Use of Machine Learning, Large Language Models, and Building Information Modeling for Life Cycle Assessment Tool Development. Energies 2024, 17, 2997. [Google Scholar] [CrossRef] [Scilit]
- Lu, K.; Jiang, X.; Yu, J.; Tam, V.W.Y.; Skitmore, M. Integration of life cycle assessment and life cycle cost using building information modeling: A critical review. J. Clean. Prod. 2020, 285, 125438. [Google Scholar] [CrossRef] [Scilit]
- Abdelaal, M.A.; Seif, S.M.; El-Tafesh, M.M.; Bahnas, N.; Elserafy, M.M.; Bakhoum, E.S. Sustainable assessment of concrete structures using BIM–LCA–AHP integrated approach. Environ. Dev. Sustain. 2023, 26, 25669–25688. [Google Scholar] [CrossRef] [Scilit]
- Slavković, K.; Stephan, A. Dynamic life cycle assessment of buildings and building stocks—A review. Renew. Sustain. Energy Rev. 2025, 212, 115262. [Google Scholar] [CrossRef] [Scilit]
- Weidema, B.P.; Wesnæs, M.S. Data quality management for life cycle inventories—An example of using data quality indicators. J. Clean. Prod. 1996, 4, 167–174. [Google Scholar] [CrossRef] [Scilit]
- Ciroth, A.; Muller, S.; Weidema, B.; Lesage, P. Empirically based uncertainty factors for the pedigree matrix in ecoinvent. Int. J. Life Cycle Assess. 2016, 21, 1338–1348. [Google Scholar] [CrossRef] [Scilit]
- Tan, E.; Tu, Q.; Martins, A.; Yao, Y.; Sunol, A.; Smith, R. Uncertainty in inventories for life cycle assessment: State-of-the-art, challenges, and new technologies. Environ. Prog. Sustain. Energy 2025, 44, e14644. [Google Scholar] [CrossRef] [Scilit]
- Bin Thaneya, A.; Gursel, A.; Kane, S.; Miller, S.; Horvath, A. Assessing uncertainty in building material emissions using scenario-aware Monte Carlo simulation. Environ. Res. Infrastruct. Sustain. 2024, 4, 025003. [Google Scholar] [CrossRef] [Scilit]
- Marsh, E.; Hattam, L.; Allen, S. Stochastic error propagation with independent probability distributions in LCA does not preserve mass balances and leads to unusable product compositions—A first quantification. Int. J. Life Cycle Assess. 2025, 30, 221–234. [Google Scholar] [CrossRef] [Scilit]
- Deng, R.; Kilchert, S. The Application of LCA Data Uncertainty Analysis in the Sustainable Development Process. In Advances in Automotive Production Technology—Digital Product Development and Manufacturing; Holder, D., Wulle, F., Lind, J., Eds.; Springer Nature: Cham, Switzerland, 2025; pp. 368–382. [Google Scholar]
- Warrier, G.A.; Palaniappan, S.; Habert, G. Classification of sources of uncertainty in building LCA. Energy Build. 2024, 305, 113892. [Google Scholar] [CrossRef] [Scilit]
- Iqbal, N.; Shabbir, K.; Noureldin, M. A novel explainable AI-based design optimization framework to estimate sustainability and economic impacts of reinforced concrete structures. Mach. Learn. Appl. 2025, 22, 100760. [Google Scholar] [CrossRef] [Scilit]
- EN 15978:2011; Sustainability of Construction Works—Assessment of Environmental Performance of Buildings—Calculation Method. European Committee for Standardization (CEN): Brussels, Belgium, 2011.
- Forth, K.; Hollberg, A.; Borrmann, A. BIM4EarlyLCA: An interactive visualization approach for early design support based on uncertain LCA results using open BIM. Dev. Built Environ. 2023, 16, 100263. [Google Scholar] [CrossRef] [Scilit]
- Pannier, M.-L.; Schalbart, P.; Peuportier, B. Dealing with uncertainties in comparative building life cycle assessment. Build. Environ. 2023, 242, 110543. [Google Scholar] [CrossRef] [Scilit]

Disclaimer/Publisher’s Note: The statements, opinions and data contained in all publications are solely those of the individual author(s) and contributor(s) and not of MDPI and/or the editor(s). MDPI and/or the editor(s) disclaim responsibility for any injury to people or property resulting from any ideas, methods, instructions or products referred to in the content. |
© 2026 by the authors. Licensee MDPI, Basel, Switzerland. This article is an open access article distributed under the terms and conditions of the Creative Commons Attribution (CC BY) license.