


Abstract
This study investigates the dynamic response and local stability of gravity-anchored foundations constructed in layered argillaceous sandstone under the coupled effects of wet–dry cycling degradation and cyclic vehicle loads. Based on in situ direct shear tests and FLAC3D 7.0 numerical simulations, a concrete–rock interface model, a rock mass direct shear model, and a three-dimensional dynamic model of the anchored foundation were developed. The parameters of the interface model were validated using the results of the direct shear tests. Wet–dry cycling degradation was subsequently incorporated to analyze the cyclic shear response of the interface and rock mass under different numbers of cycles. Cyclic vehicle loads were modeled as increments in main cable tension with an equivalent sinusoidal waveform. The results indicate that as the number of wet–dry cycles increases, the cyclic shear hysteresis loops shift overall toward lower shear stress levels. Peak shear stress decreases by approximately 49.26–51.64% compared to the natural state, and the hysteresis loop area decreases significantly. This indicates that wet–dry cyclic degradation weakens the cyclic shear resistance and energy dissipation capacity of the contact surface and rock structural planes. Dynamic analysis results for the anchor foundation indicate that wet–dry cycling degradation significantly increases the displacement response levels of the rock mass near the front toe and rear heel. Specifically, under the n = 20 condition, the displacement at the last peak increased by approximately 109.3–123.9% compared to the undisturbed state; simultaneously, the local plastic zones in the rock mass surrounding the anchorages gradually expanded, and the local safety factors of the rock mass near the toe and heel decreased overall. This study elucidates the degradation mechanisms and dynamic behavior of gravity anchors under the combined action of environmental and operational loads, providing a basis for the design and safety assessment of foundations for long-span suspension bridges.
1. Introduction
An anchorage is the critical structure that transfers the enormous tension of the main cable of a suspension bridge to the ground, and its stability directly affects the construction safety and long-term operational safety of the bridge. Gravity anchorages rely mainly on self-weight, base friction, front rock mass resistance, and local structural measures to maintain stability, and are widely used in long-span suspension bridges in mountainous areas. Regarding the safety assessment of gravity anchorages, Li et al. [1] established a safety evaluation method based on a simplified mechanical model, Xiong et al. [2] proposed a target reliability safety margin design method for gravity anchorages of super-long-span suspension bridges, and Wang et al. [3] revealed the bearing mechanism of composite gravity anchorages by combining physical model tests and numerical simulations. In addition, research in the field of marine engineering has also investigated the dynamic response and bearing behavior of gravity anchors in terms of wave action, mooring angle, anchorage geometry, and embedment depth [4,5,6]. These studies provide a reference for understanding the mechanical behavior of gravity-type anchoring structures, but significant differences exist between marine gravity anchors and bridge gravity anchorages in structural scale, foundation conditions, and load transfer paths, and special research on suspension bridge anchorage foundations is still needed.
Gravity anchorages of suspension bridges are often located in layered argillaceous sandstone, argillaceous siltstone, or similar red-bed soft rock foundations. Such rock masses possess well-developed bedding planes and weak interlayers and exhibit strong water sensitivity, making them prone to irreversible deterioration under the effects of rainfall infiltration, groundwater table fluctuation, and seasonal wetting–drying alternation. Previous studies have shown that mudstone, argillaceous sandstone, and sandstone subjected to wetting–drying cycles can develop pore expansion, fracture coalescence, cementation weakening, and declining structural integrity [7,8,9,10,11,12]. In terms of mechanical parameters, wetting–drying cycles generally reduce the elastic modulus, uniaxial compressive strength, cohesion, internal friction angle, tensile strength, and fracture toughness, and alter the macro- and micro-failure mechanisms of rocks [13,14,15,16,17,18]. Overall, soft rocks and argillaceous sandstone typically exhibit pronounced staged deterioration characteristics under wetting–drying cycles, namely rapid deterioration in the early cycles, followed by a gradual decrease in the deterioration rate that eventually stabilizes [7,8,9,10,11,12,13,14,15,16,17,18].
Model tests, field measurements, and numerical simulations have been widely applied to study the stability of gravity anchorage foundations. Liu et al. [19] analyzed the stability of the gravity anchorage of the Taizhou Yangtze River Bridge by combining model tests and the finite element method, Wen et al. [20] evaluated the long-term stability of tunnel anchorage foundations through in situ creep model tests and numerical analysis, and Zhou et al. [21] investigated the anti-sliding, anti-overturning, and contact stress characteristics of a suspension bridge gravity anchorage based on a large-scale field test. In our previous study, field in situ bearing capacity tests, concrete–bedrock interface shear tests, rock mass direct shear tests, and laboratory wetting–drying cycle tests were conducted for the layered argillaceous sandstone gravity anchorage foundation of a suspension bridge in Southwest China, and an FLAC3D numerical model was established, revealing the parameter degradation of argillaceous sandstone, the increased deformation of the anchorage base, and the transition of failure modes under wetting–drying cycles [22]. However, research on the dynamic response of gravity anchorage foundations under operational traffic loads or cyclic vehicle loads remains limited. Li [23] studied the dynamic response of a gravity anchorage slope of a suspension bridge under highway traffic loads and pointed out that traffic loads can reduce the stability of the anchorage slope. Some studies have also investigated the stability of anchored rock slopes and anchorage foundations under strong dynamic actions such as earthquakes [24,25,26], and our group has analyzed the dynamic stability of layered argillaceous sandstone gravity anchorage foundations under the coupled action of earthquakes and wetting–drying cycles [27]. Nevertheless, most of these studies focus on single traffic loads, seismic safety, or static deterioration due to wetting–drying cycles, and have not yet fully revealed the dynamic response and local stability evolution of the anchorage foundation under the combined effects of wetting–drying cycle deterioration and cyclic vehicle loads.
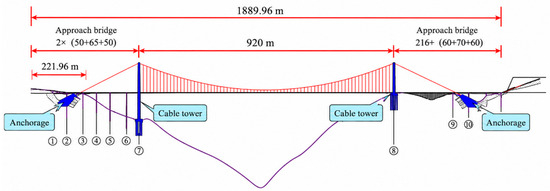
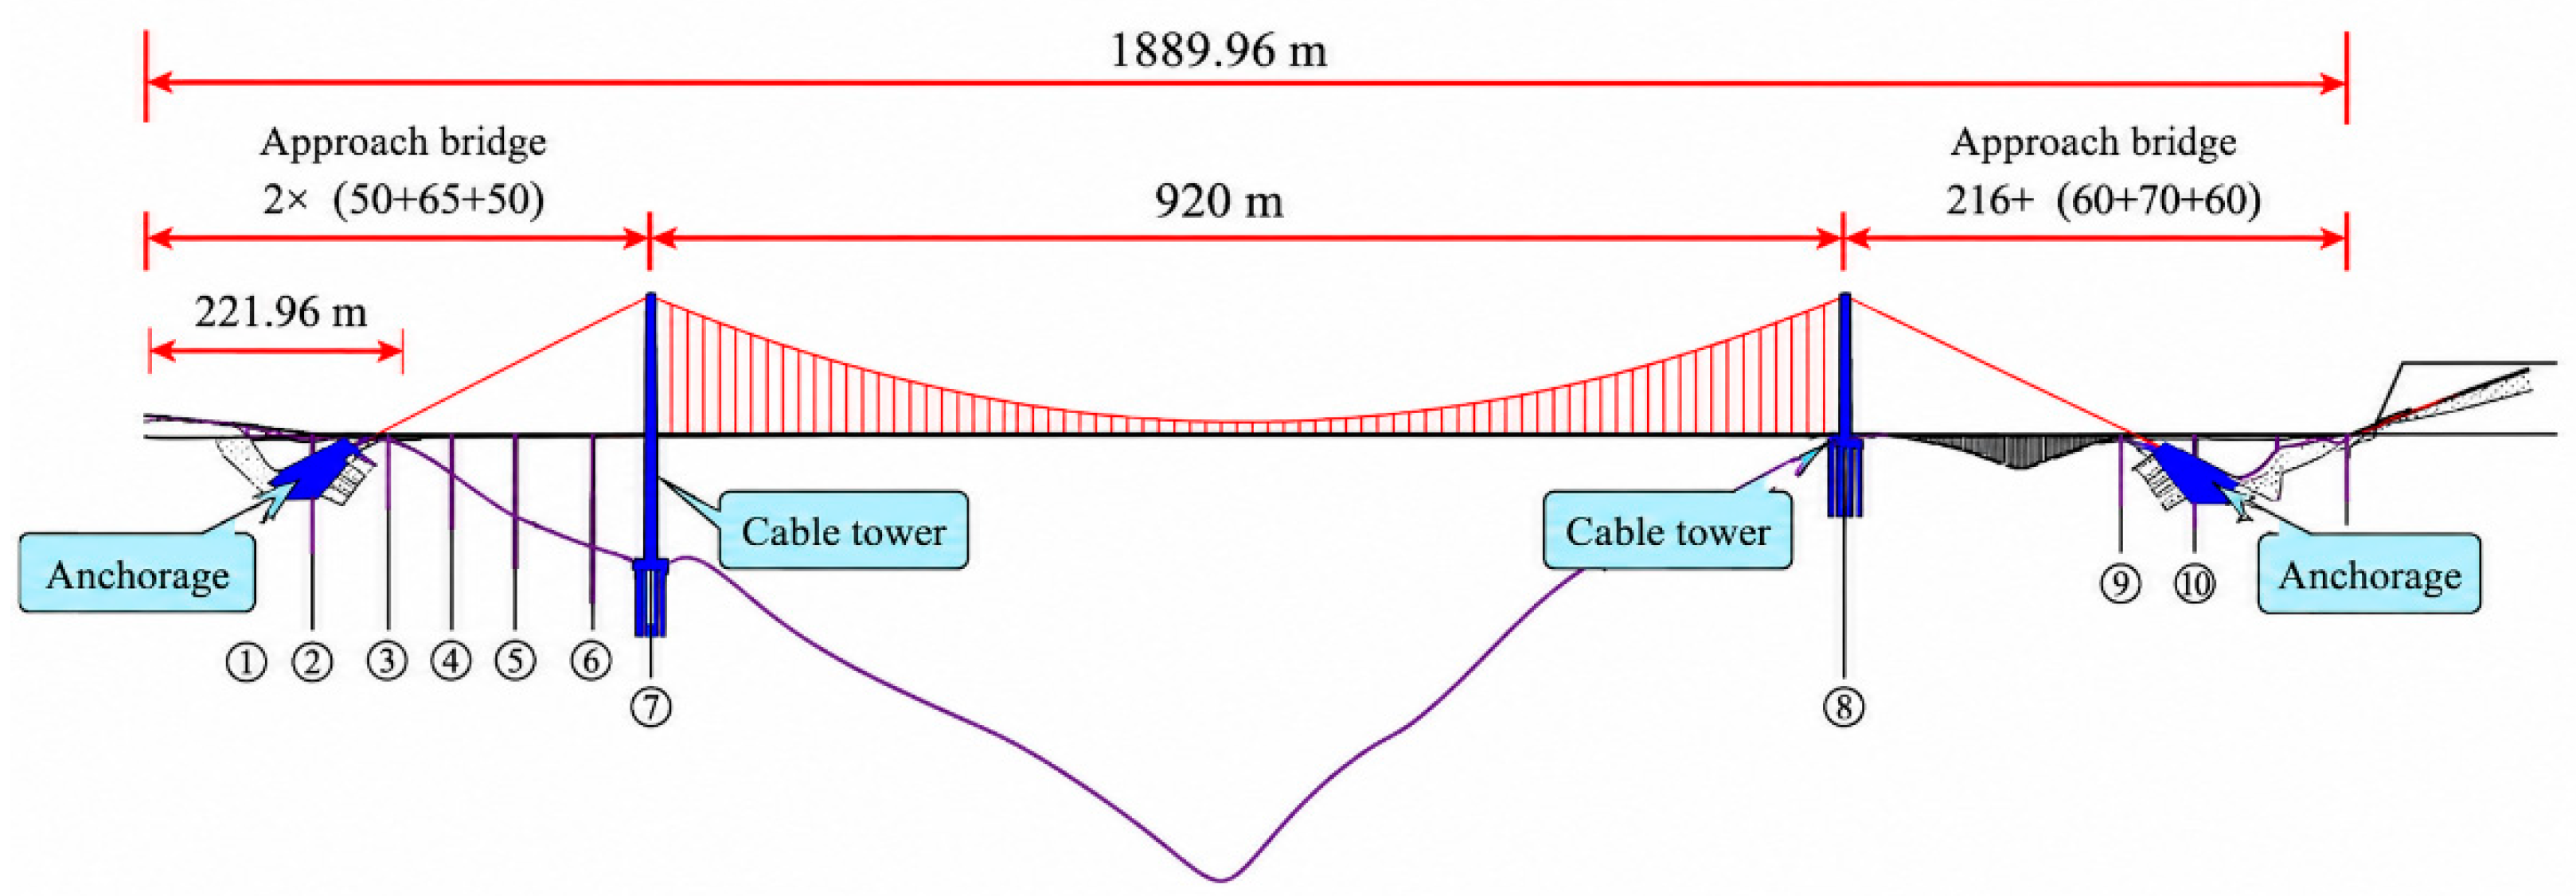
In summary, existing studies have sufficiently revealed the microscopic damage and strength deterioration laws of soft rocks and argillaceous sandstone under wetting–drying cycles, and have analyzed the bearing mechanism of gravity anchorage foundations from perspectives such as simplified mechanical models, reliability-based design, field tests, and numerical simulations. However, research on the stability of gravity anchorage foundations in layered argillaceous sandstone under the combined effects of wetting–drying cycle deterioration and operational cyclic vehicle loads is still limited, particularly lacking systematic analyses of accumulated foundation deformation, anchorage–bedrock contact response, local plastic zone expansion, and changes in safety margin. Therefore, this paper is based on a suspension bridge project in Southwest China, as shown in Figure 1. By validating with field direct shear tests and performing FLAC3D 7.0 dynamic calculations, a numerical model of the layered argillaceous sandstone gravity anchorage foundation that incorporates wetting–drying cycle strength deterioration and equivalent cyclic vehicle load input is established to study its deformation response, plastic zone evolution, and local safety variation, thereby providing a reference for the safety assessment of suspension bridge gravity anchorage foundations under the combined effects of complex environments and operational loads.
Figure 1.
Elevation of a suspension bridge in Southwest China.
Compared with the research group’s previous work [22], this paper does not revisit the development of a three-dimensional numerical model for the anchor–rock foundation or the verification of its static stability. Instead, building upon the existing validated model and the strength degradation patterns under wet–dry cycling, this study further incorporates cyclic vehicle loads during the operational phase to investigate the dynamic response and evolution of local stability in the anchor–rock system under the combined effects of wet–dry cycling degradation and cyclic vehicle loads. The main contributions of this paper are reflected in the following three aspects:
(1) Based on previous in situ direct shear tests and validated contact surface parameters, this study analyzes the cyclic shear hysteresis response of the concrete–rock interface and the direct shear plane of argillaceous sandstone under wet–dry cycling degradation conditions;
(2) Referring to the equivalent method for transportation design loads, the action of vehicle loads transmitted to the anchor head is simplified as an incremental dynamic main cable tension, which is then applied to a validated numerical model of a gravity-type anchor foundation;
(3) By examining three aspects—foundation displacement response, the expansion of the plastic zone in the rock mass surrounding the anchorage, and changes in the local safety factor of the rock mass near the toe and heel—this study reveals the amplification effect of wet–dry cycling degradation on the local stability of the anchorage–bedrock system under cyclic vehicle loads.
2. Materials and Methods
2.1. Engineering Background and In Situ Direct Shear Tests
This paper presents research based on a large-span suspension bridge project in southwest China. The bridge’s gravity-type anchorage foundation is situated in a layered argillaceous sandstone subgrade characterized by well-developed rock bedding, localized weak interlayers, and significant water sensitivity. During long-term service, the anchorage–bedrock system not only bears the enormous tensile forces transmitted by the main cables but is also subjected to the combined effects of seasonal wet–dry cycles and cyclic vehicle loads during operation. Therefore, it is necessary to first clarify the shear mechanical properties of the concrete–rock interface at the base of the anchorage foundation and the potential structural planes within the underlying argillaceous sandstone formation, thereby providing a parametric basis for subsequent numerical modeling and stability analysis.
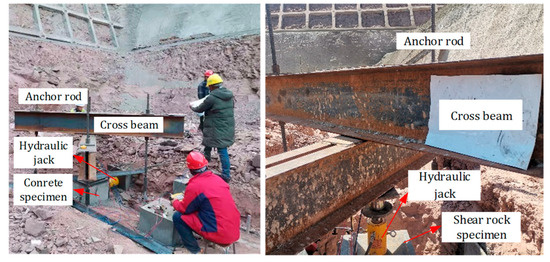
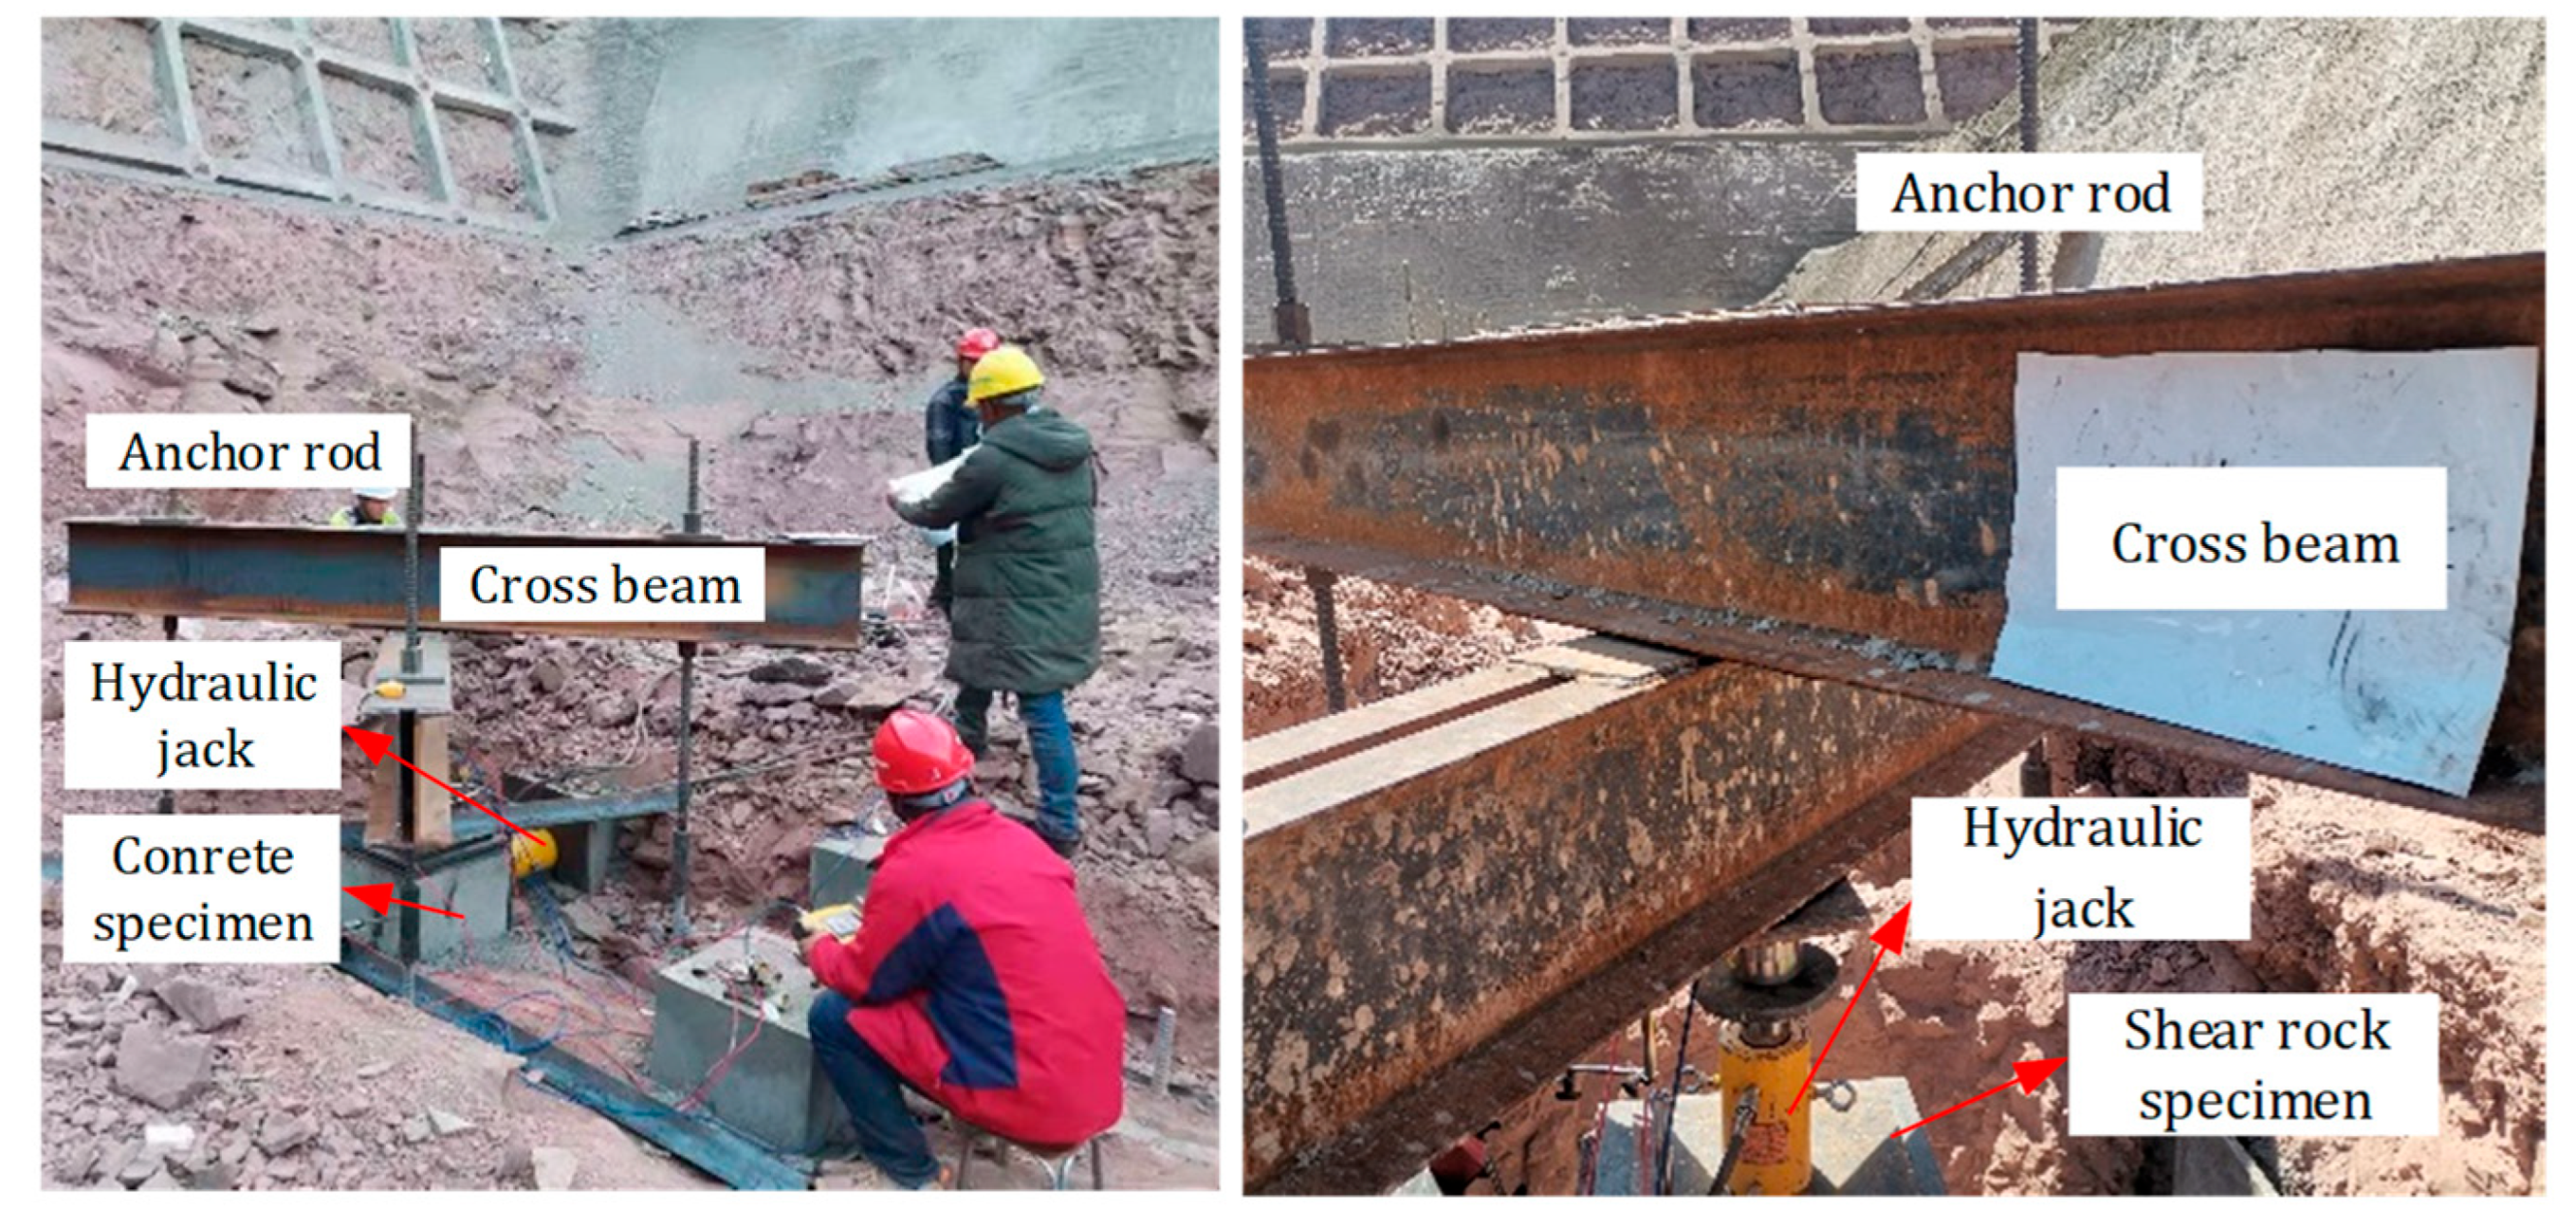
For obtaining shear strength parameters for the anchor–bedrock interface and the underlying rock mass, the research team previously conducted in situ direct shear tests at the project site. The tests primarily consisted of two types: one was a direct shear test at the concrete–argillaceous sandstone interface, used to characterize the shear behavior at the contact between the base of the gravity anchor foundation and the underlying bedrock; the other was a direct shear test on the argillaceous sandstone rock mass, used to characterize the shear properties of potential structural planes or weak shear planes within the underlying mudstone. The in situ direct shear tests and the loading apparatus are shown in Figure 2.
Figure 2.
Field in situ testing.
During the testing process, a specified normal pressure was first applied to the top of the specimen, and the normal load was kept essentially constant to allow the specimen to reach a stable stress state; subsequently, a shear load was applied in the horizontal direction to obtain the shear stress–shear displacement relationship under different normal pressure conditions. The normal pressure, horizontal shear force, and shear displacement were recorded simultaneously during the test, and the peak or steady-state shear strength under each normal pressure condition was determined based on these measurements. The in situ direct shear tests conducted in this study included five normal pressure levels: 180, 360, 540, 720, and 900 kPa. Both types of tests employed the same normal pressure levels to facilitate a comparative analysis of the shear behavior at the concrete–rock interface and the direct shear plane within the argillaceous sandstone mass.
Given that in situ direct shear tests are constrained by site conditions, specimen preparation, loading apparatus configuration, and testing costs, the number of repeat tests is typically limited. To enhance the reliability of the test data for calibrating numerical models, the loading system and displacement measurement devices were inspected and verified prior to testing. Following the tests, the results were comprehensively analyzed and evaluated based on the complete shear stress–shear displacement curves and the variation in peak shear strength with normal stress under different normal pressures.
2.2. Direct Shear Numerical Model and Validation Strategy
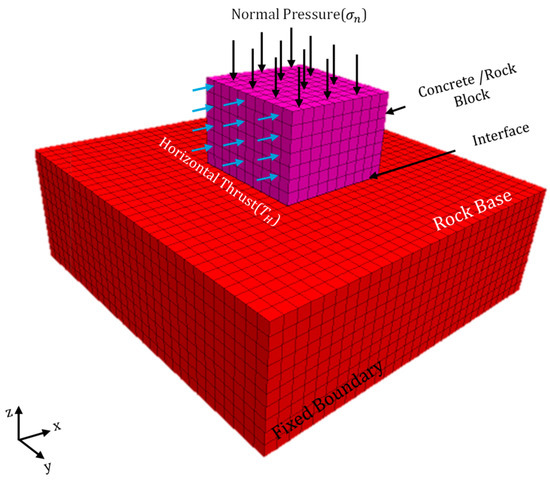
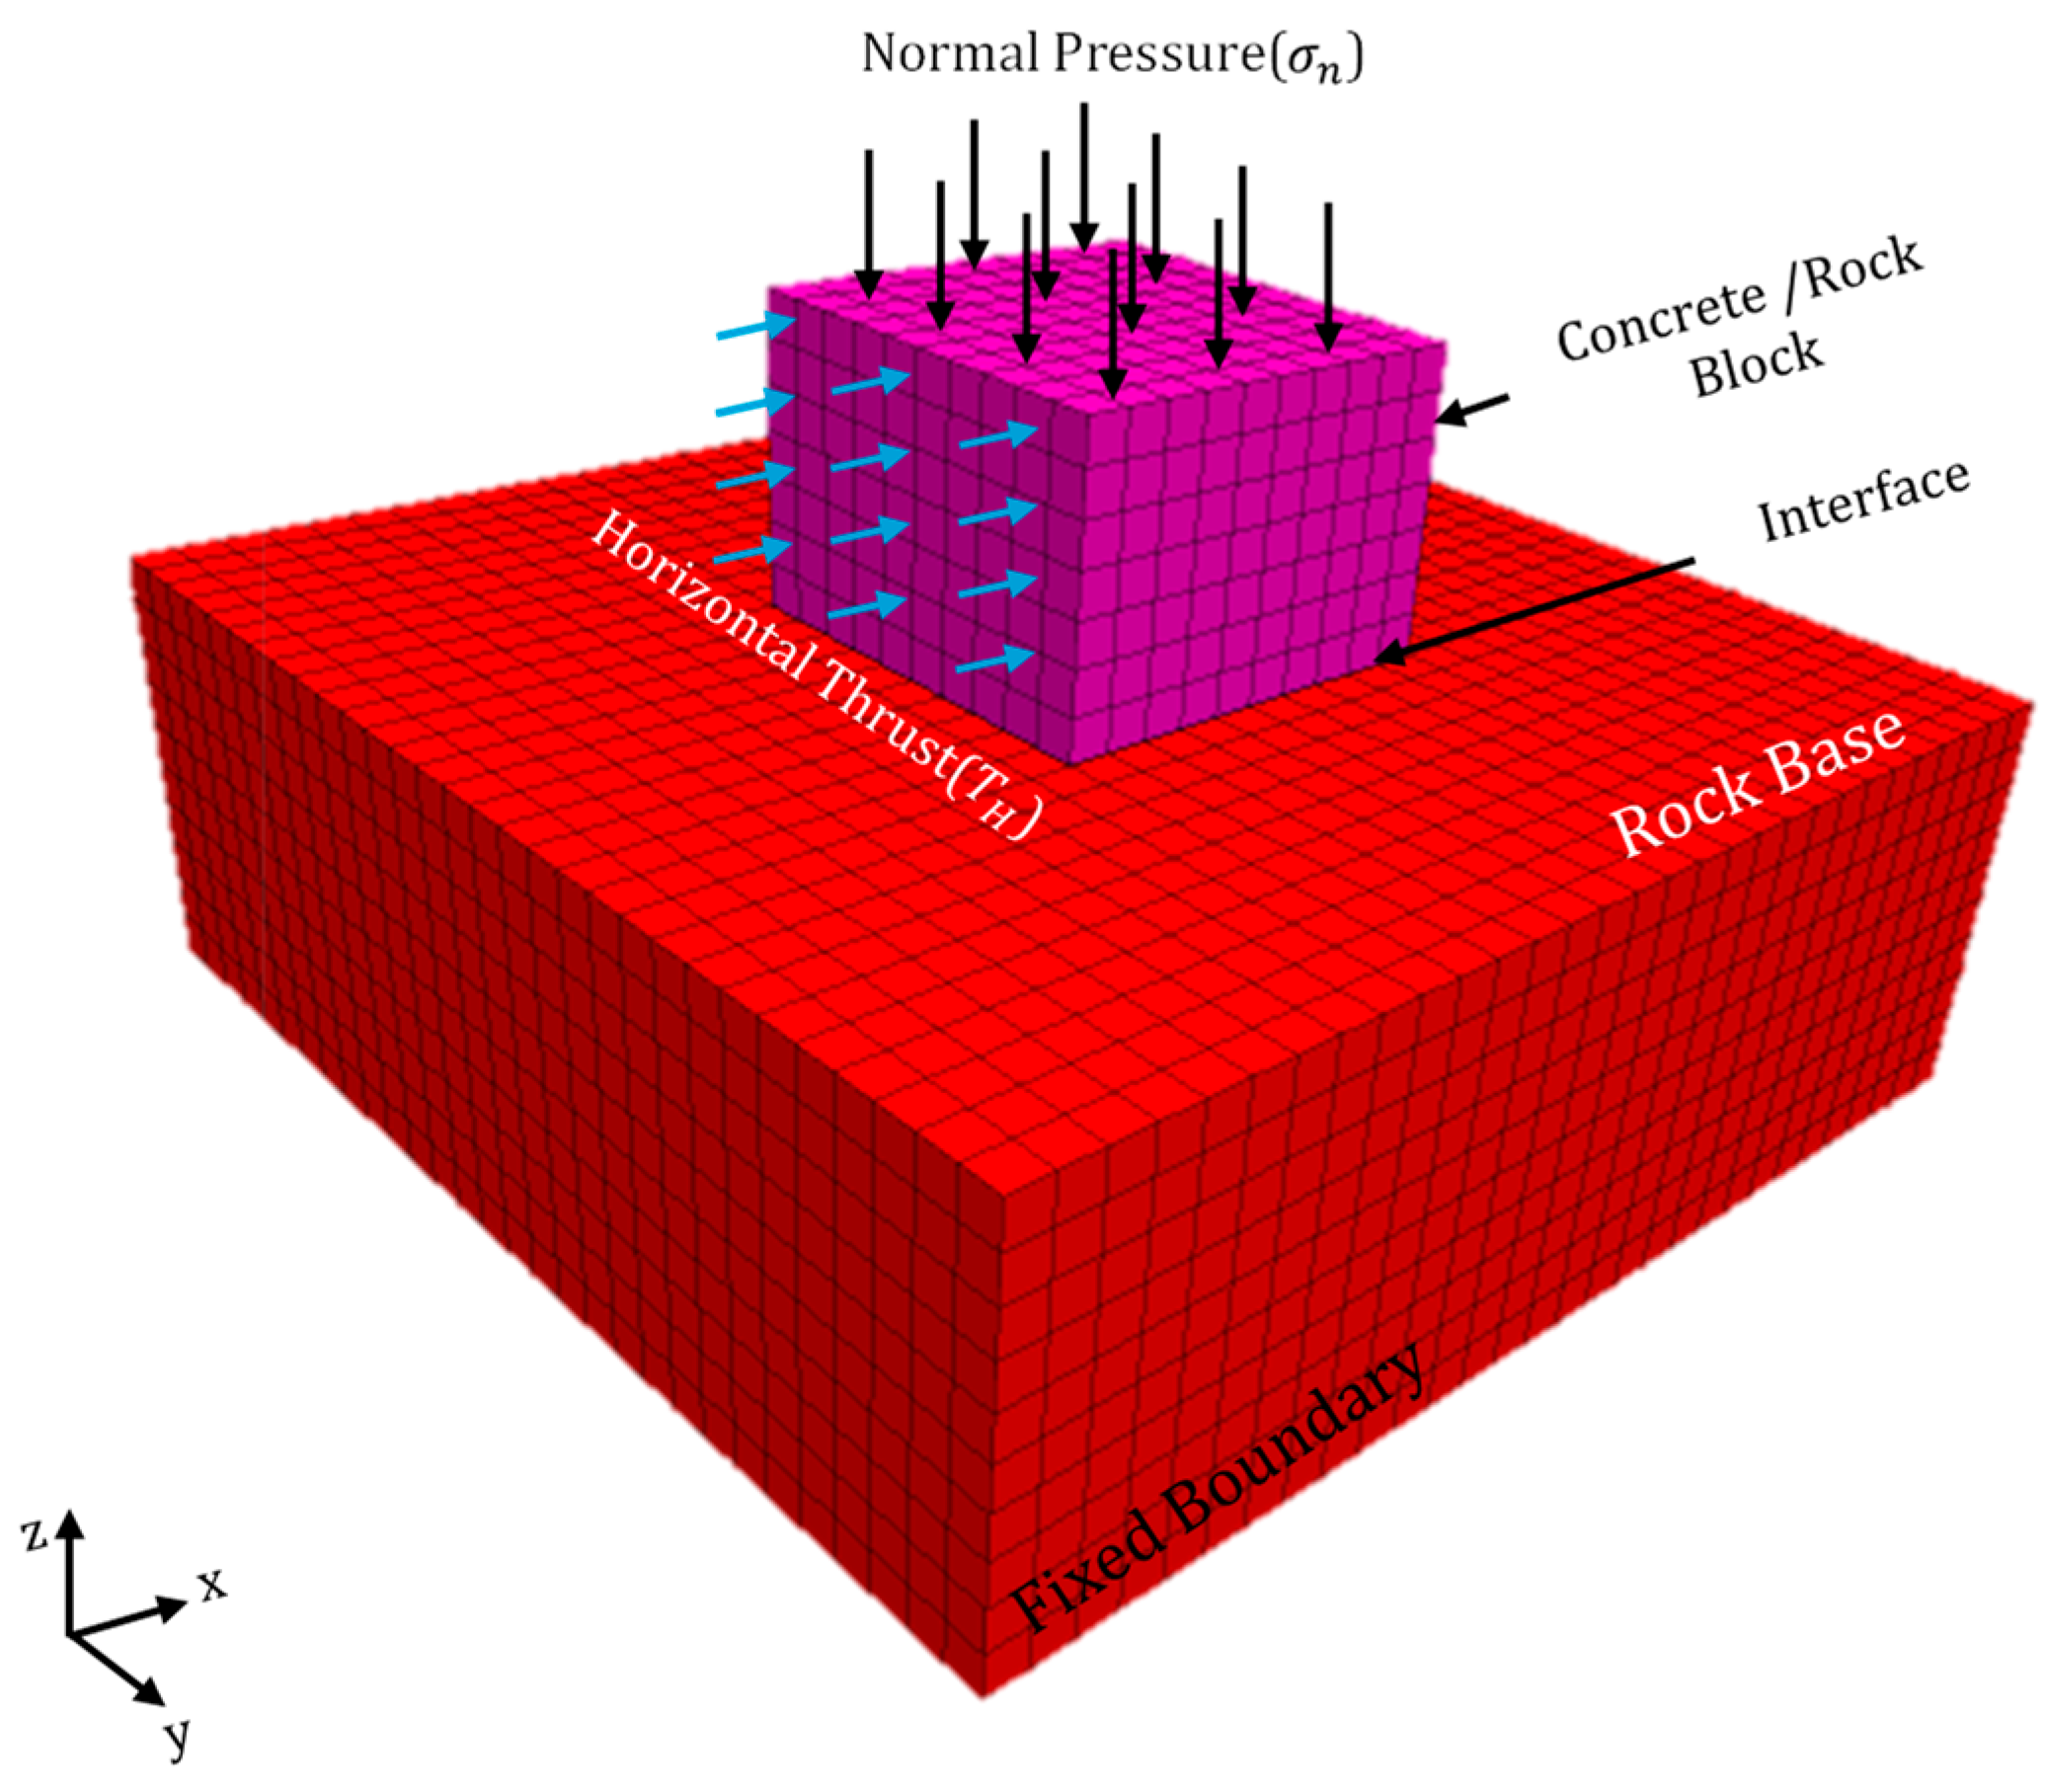
The subsequent monotonic direct shear verification, cyclic shear loading, and wet–dry cycling reduction scenarios in this chapter all utilize the basic numerical model frame-work shown in Figure 3. The differences between the various scenarios primarily lie in the material parameters, interface parameters, level of normal pressure, and shear loading path, while the model geometry, boundary conditions, and interface configuration remain consistent. The mechanical parameters of the argillaceous sandstone, anchorage foundation, and contact surface in the model are derived from the research group’s previous studies and field measurement data; specific values are shown in Table 1. The validity of the contact surface model parameters will be verified by comparing experimental results with numerical simulation results.
Figure 3.
Numerical simulation model for shear testing.
Table 1.
Parameter values for the shear test computational model.
2.3. Deterioration Parameters for Dry–Wet Cycling and Settings for Cycling Shear Conditions
After verifying the comparison between direct shear test results and numerical simulation results, the effects of wet–dry cycling degradation were further incorporated to analyze the cyclic shear response at the concrete–argillaceous sandstone interface and along the joints in the argillaceous sandstone under different numbers of wet–dry cycles. Based on the research group’s previous dry–wet cycling test results [22], this study models the effects of dry–wet cycling as a degradation of the mechanical properties of the rock mass and the contact interface. Three representative dry–wet cycling conditions were selected, n = 0, n = 10, and n = 20, where n = 0 represents the natural state, n = 10 represents a moderate level of dry–wet cycling degradation, and n = 20 represents a long-term dry–wet cycling degradation state.
The parameters of argillaceous sandstone under different numbers of wet–dry cycles are determined based on the degradation patterns observed in previous experiments. Let the elastic modulus, cohesion, and angle of internal friction of argillaceous sandstone in its natural state be , , and , respectively, and the corresponding parameters after n wet–dry cycles be , , and , respectively. Then, the reduction factors can be expressed as:
For the interface between concrete and argillaceous sandstone, as well as the joint surfaces within the argillaceous sandstone, this paper primarily examines the weakening effect of wet–dry cycling on the shear strength at the interface. Therefore, the cohesion and angle of internal friction at the interface are reduced according to the strength degradation coefficient of the argillaceous sandstone, while the normal and tangential stiffness at the interface are maintained at the values determined through experimental–numerical calibration. The reduction in the interface strength parameters is as follows:
where and represent the cohesive force at the interface and the angle of internal friction, respectively. It should be noted that, due to the current lack of independent direct shear test data for the anchorage–rock interface and rock joint surfaces under different numbers of wet–dry cycles, this paper applies a simultaneous reduction to the interface parameters based on the deterioration coefficient of argillaceous sandstone, as a conservative engineering assumption regarding the degradation of the interface’s shear resistance under wet–dry cycling.
All cyclic shear simulations employed the direct shear numerical model shown in Figure 3. During the calculations, a constant normal pressure was first applied to establish initial equilibrium, followed by the application of reciprocating shear displacement in the horizontal direction to obtain shear stress–shear displacement hysteresis loops for different numbers of wet–dry cycles. In this study, a representative normal pressure of 540 kPa, a cyclic shear displacement amplitude of 2.0 mm, and five cycles were selected. The hysteresis curve from the final week was analyzed to investigate the effect of wet–dry cycling degradation on the cyclic shear response. The parameter values for different numbers of wet–dry cycles are shown in Table 2.
Table 2.
Parameter values for different numbers of dry–wet cycles.
2.4. Gravity Anchorage Foundation Model
The long-term stability of gravity-type anchorage foundations is a critical prerequisite for ensuring the safe operation of suspension bridges. In actual engineering environments, anchorages not only endure enormous eccentric tensile forces from the main cables over the long term but are also inevitably subjected to the dual coupled effects of wet–dry cycles and bridge deck traffic (cyclic dynamic loads from vehicles). In this section, based on the strength decay model and contact surface parameters established in the research group’s prior studies, a three-dimensional computational model of the anchorage foundation was constructed using FLAC3D 7.0 [22], incorporating equivalent cyclic vehicle loads. Through a systematic analysis of the cumulative deformation characteristics of the foundation, the evolution of the plastic zone, and the local safety factor under coupled conditions, this study aims to reveal the dynamic response characteristics and local stability degradation mechanisms of this type of anchorage foundation under the combined effects of environmental degradation and operational loads, thereby providing a reference for the safety assessment of anchorage foundations.
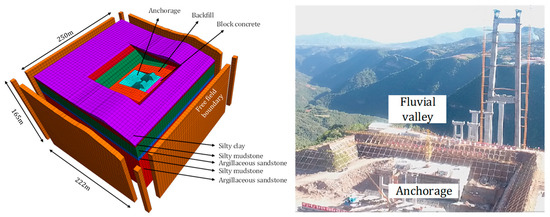
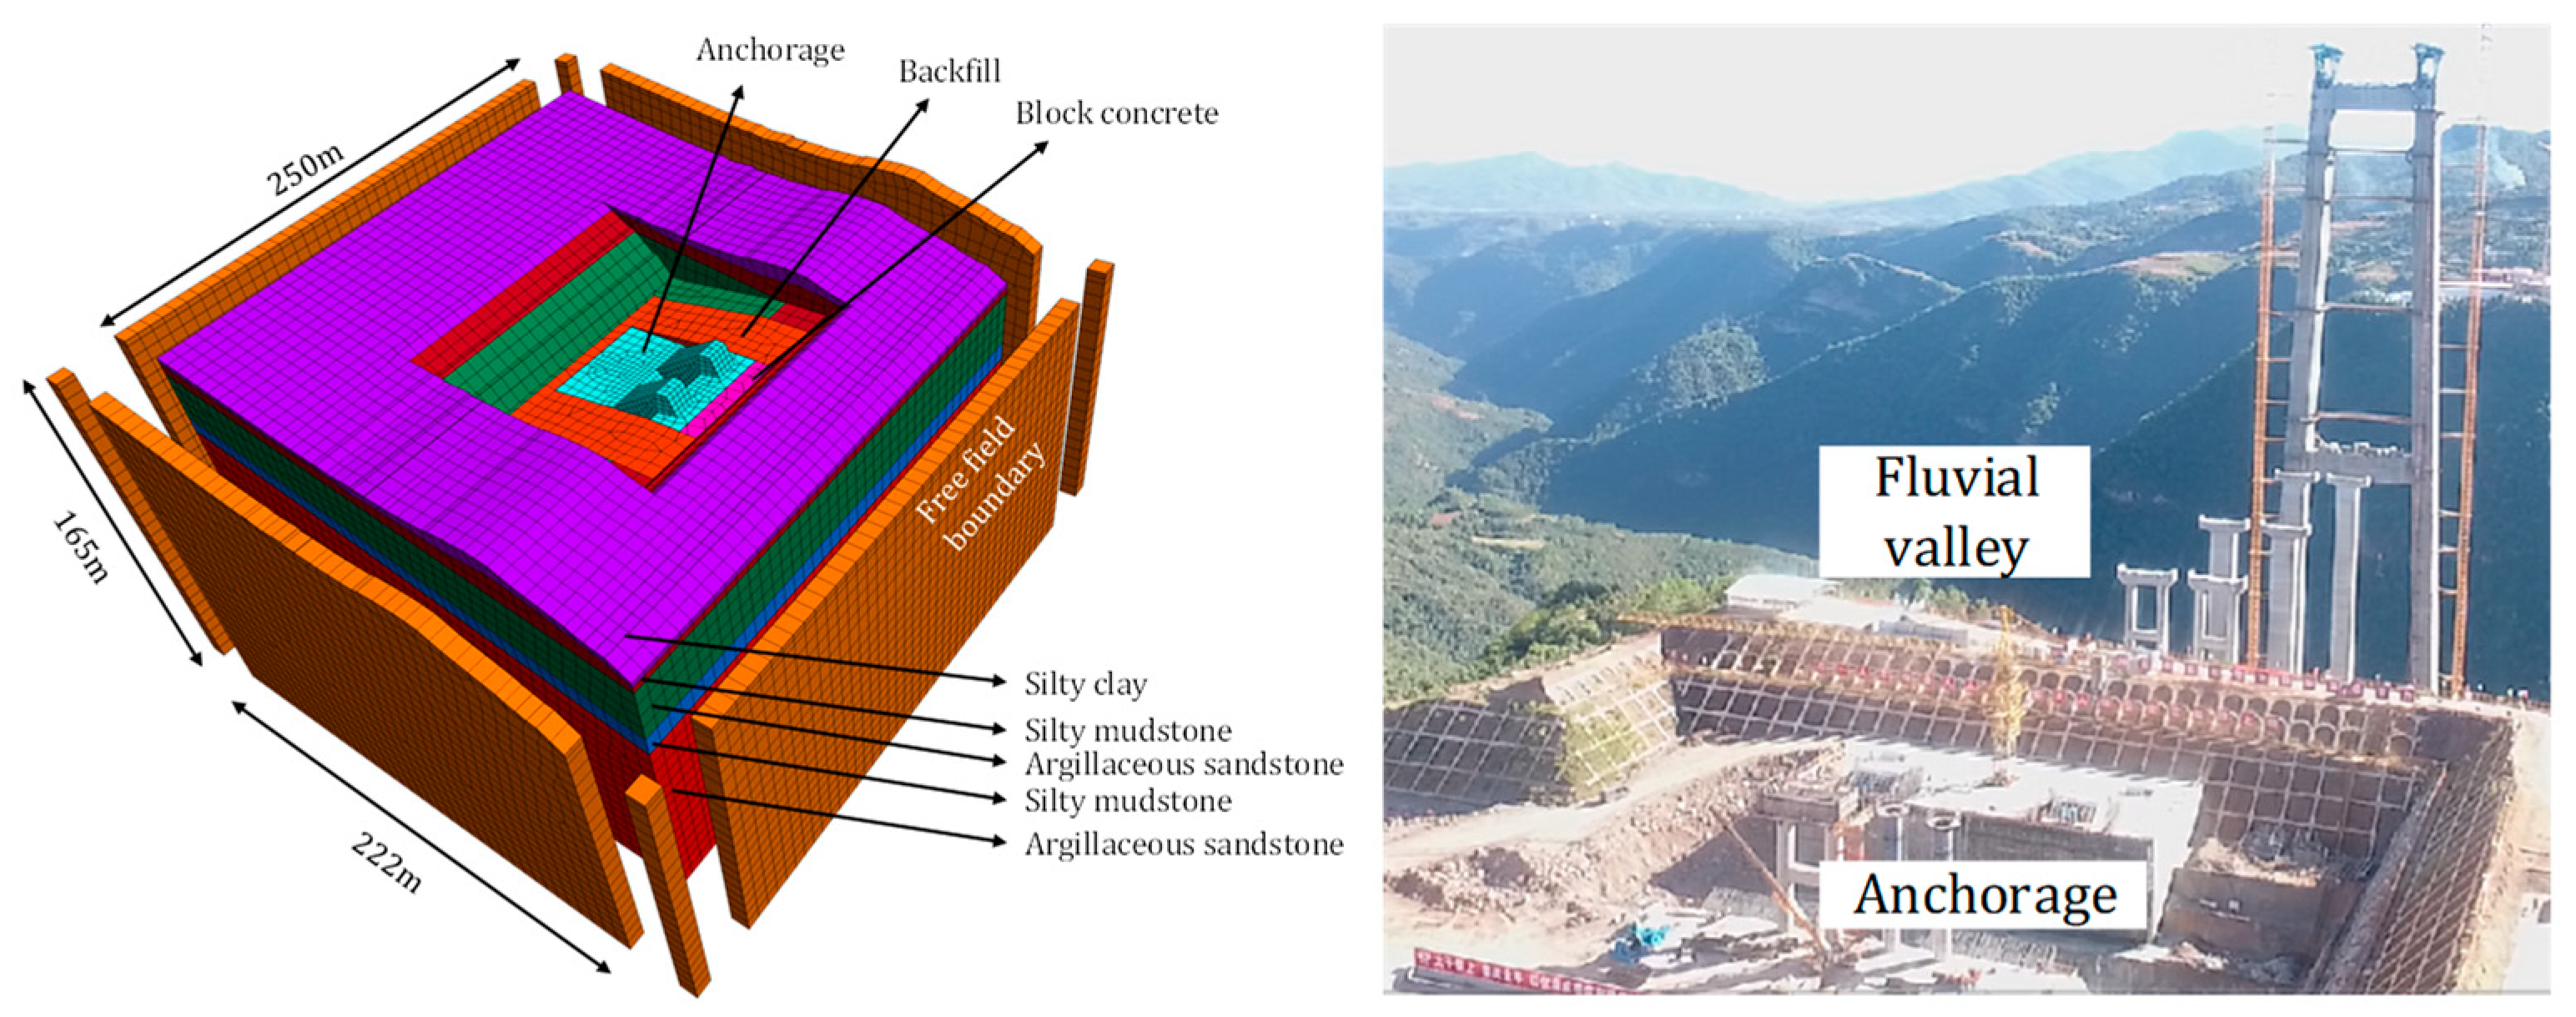
Ensuring the consistency and reliability of the research results, the macro-scale numerical simulation model was developed on the FLAC3D 7.0 computational platform. Its three-dimensional geometric structure and boundary conditions adhere to the model system established and validated by the research team in previous studies conducted for this project [22]. Therefore, this study did not conduct a new mesh sensitivity analysis but directly adopted the mesh and computational parameters recommended in that paper. This model has been thoroughly validated through prior static stability evaluations and comparisons with in situ test data. Building on this foundation, this paper further conducts an extended analysis of operating conditions under the combined effects of wet–dry cycles and vehicle cyclic loads, incorporating the cyclic shear response characteristics of the contact surface obtained in Section 2. The numerical simulation model and the on-site construction are shown in Figure 4.
Figure 4.
Numerical simulation model of the anchorage foundation and on-site construction.
The natural state parameters for various rock and soil masses, anchorage foundations, and contact surfaces in the model are consistent with those from the research group’s previous studies; specific values are shown in Table 3.
Table 3.
Parameter values of the numerical model under natural conditions.
2.5. Equivalent Vehicle Cyclic Load
During the operation of a suspension bridge, vehicle loads are transmitted through the deck system, suspension cables, and main cable system to the anchorage ends, causing the tension in the main cables to fluctuate periodically around the design reference value. Since the subject of this study is the anchorage–rock system, establishing a complete vehicle–bridge–cable-coupled model would significantly increase computational complexity and would not effectively highlight the impact of wet–dry cycling degradation on the dynamic response of the anchorage foundation. Therefore, this study does not directly simulate the movement of vehicles on the bridge deck. Instead, referring to the equivalent treatment methods for traffic design loads on anchorage tension in existing studies, the action of vehicle loads transmitted to the anchorage ends is simplified to an equivalent sinusoidal main cable tension time history.
In Reference [28], the dynamic forces exerted by traffic design loads on the anchorage blocks are expressed as:
with
where represents the tensile force exerted on the abutment by the design traffic load; represents the static equivalent tensile force corresponding to the design traffic load; represents the standard value of the concentrated load; represents the standard value of the uniformly distributed lane load; represents the bridge length; represents the impact factor; and is the natural frequency.
According to the General Specifications for the Design of Highway Bridges and Culverts (JTG D60—2015) [29], the standard value for uniformly distributed loads in Class I highway lane loads is taken as ; when the calculation length exceeds 50 m, the standard value for concentrated loads is taken as . Following the conservative approach in Reference [28], this paper assumes that vehicle loads act uniformly over the entire length of the bridge and uses the maximum impact coefficient to calculate the equivalent dynamic action after the vehicle load is transmitted to the abutment ends. The total length of the bridge is , so we have:
Considering the impact effects of the vehicle and to ensure a conservative power input, this paper adopts the maximum impact coefficient, denoted as . The amplitude of the dynamic main cable tension increment caused by the vehicle’s cyclic loads is then:
Since the most unfavorable design main cable tension has already been applied during the static phase, only the dynamic increment is applied during the dynamic phase to avoid repeated application of the constant load. Therefore, the equivalent vehicle cyclic load in this paper is taken as:
where represents the equivalent vehicle cycle excitation frequency. It should be noted that this is not the frequency corresponding to a single vehicle crossing the entire bridge, but rather the frequency used to characterize the repetitive excitation effects resulting from the transfer of loads to the abutment ends.
2.6. Dynamic Calculation Conditions
This paper primarily investigates the dynamic response and stability evolution of gravity-type anchorage foundation in laminated argillaceous sandstone under the combined effects of wet–dry cycling degradation and cyclic vehicle loads. To ensure comparability across different conditions, all computational scenarios employ the same geometric model, boundary conditions, initial stress equilibrium method, and main cable load application points; only the number of wet–dry cycles and the corresponding rock mechanical parameters are varied.
This study selected wet–dry cycling cycles n = 0, n = 10, and n = 20 as representative operating conditions. The elastic modulus, cohesion, and angle of internal friction of the argillaceous sandstone under different numbers of dry–wet cycles were all reduced according to the degradation relationships provided in Reference [22] and input into the corresponding numerical model. It should be noted that, considering that laboratory wet–dry cycling tests are primarily conducted on argillaceous sandstone, for silty clay and silty mudstone, due to the lack of independent wet–dry cycling test data, this study applied the same reduction factors as those for argillaceous sandstone to their parameters. This treatment serves as a conservative engineering assumption for the overall degradation of layered soft ground. The values of the main geotechnical parameters for different operating conditions are shown in Table 4. Additionally, the treatment of the interface is consistent with the interface reduction method in the cyclic shear model described in Section 2, which is used to characterize the reduction in shear resistance at the anchorage–rock interface under long-term wet–dry cycling.
Table 4.
Parameters of the main rock and soil layers under different dry–wet cycle numbers.
Each design condition is divided into two stages: static equilibrium and dynamic analysis. First, the initial static stress equilibrium is established under the action of self-weight; the main cable tension is applied as a uniformly distributed normal load to the front anchorage surface of the anchorage foundation, with the resultant force taken as the most unfavorable design main cable tension, T0 = 220,216 kN, to bring the model to a state of static equilibrium. On this basis, the equivalent vehicle cyclic load defined in Section 2.5 is further applied. Since T0 applied in the static stage has already been taken as the most unfavorable design main cable tension, this paper does not reapply the static component of the traffic load in the dynamic stage, but only applies the dynamic incremental portion corresponding to the impact effect of the vehicle load. This is converted into an equivalent normal force based on the force-bearing area of the front anchorage face and applied to the corresponding group of the front anchorage face.
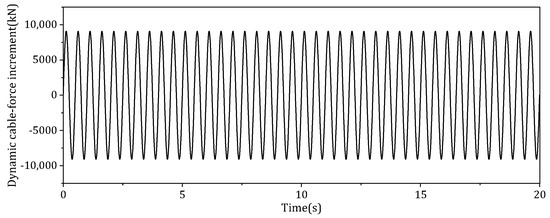
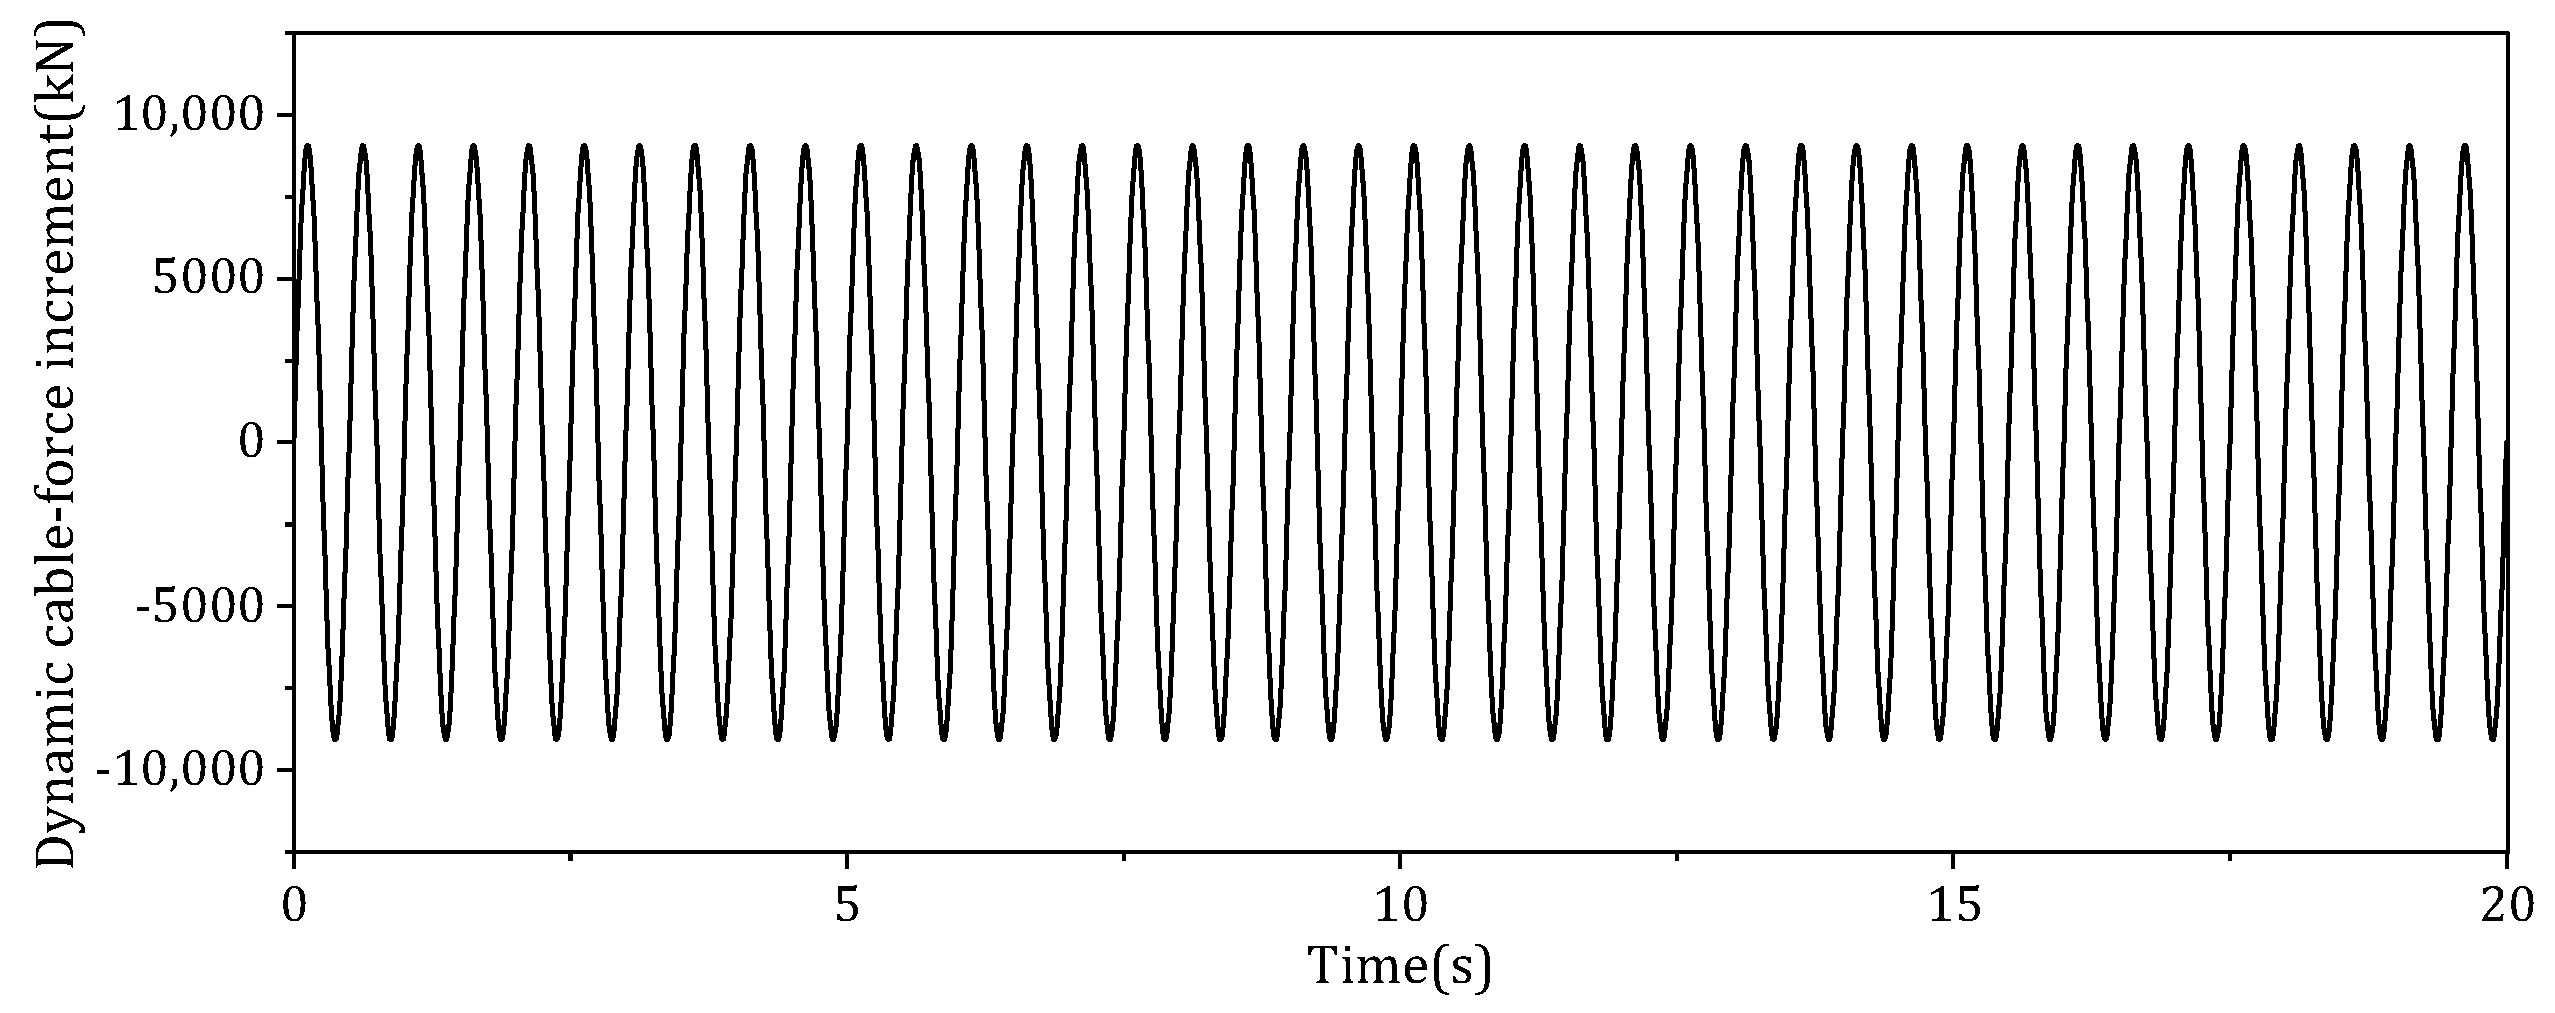
In FLAC3D 7.0, this paper uses the FISH language to generate dynamic tensile force time histories that satisfy the equivalent load function described in Section 2.5, and applies them to the front anchorage surface of the anchorage foundation in the form of dynamic normal forces. The equivalent vehicle cycle disturbance frequency is set to , corresponding to a period of 0.5 s. The total duration of the dynamic analysis is set to 20 s, corresponding to 40 load cycles.
To minimize the impact of manually truncated boundaries on the dynamic response calculation results, the lateral boundaries of the model are defined as free-field boundaries, while the bottom boundary is defined as a viscous boundary to absorb outwardly propagating dynamic waves and attenuate boundary reflection effects. Figure 5 shows the equivalent dynamic main cable tension increment time history applied to the front anchorage surface during the dynamic stage.
Figure 5.
Time–history curve of the dynamic incremental tension in the main cable caused by equivalent vehicle cyclic loads.
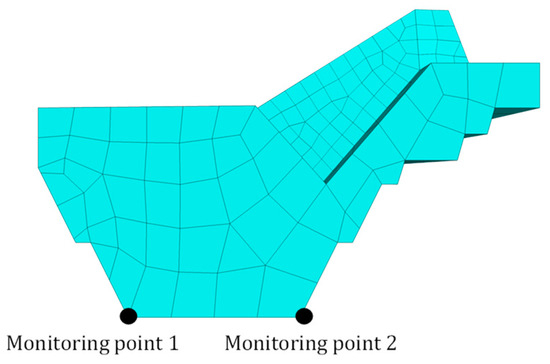
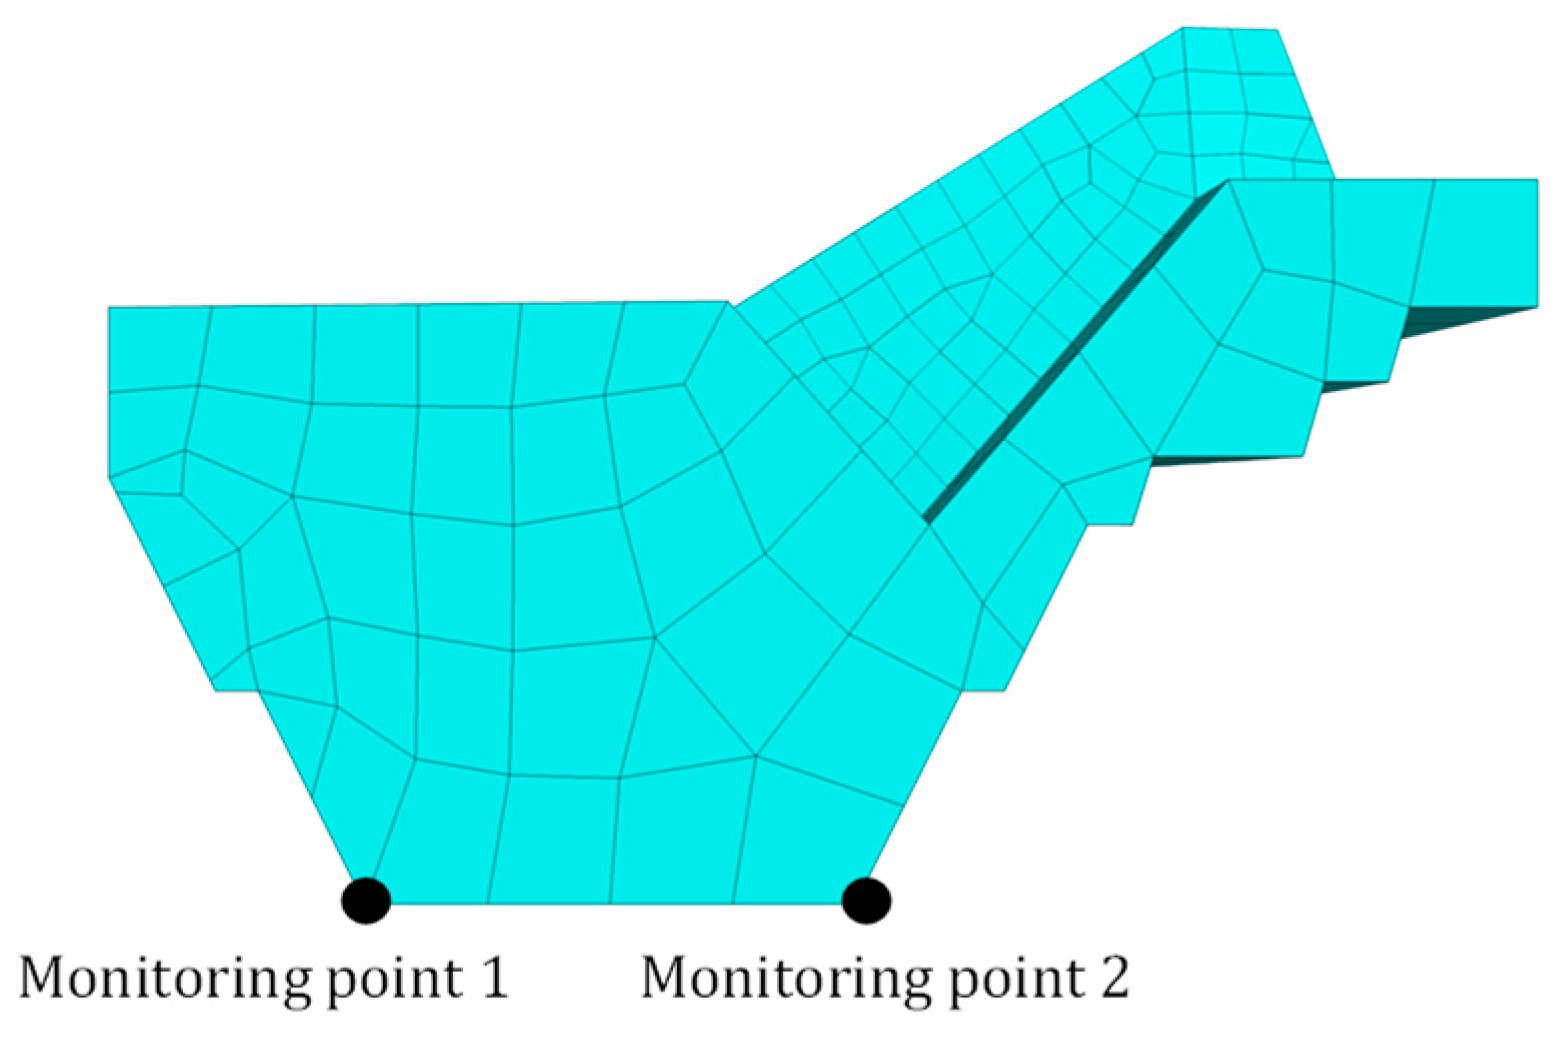
To monitor the local deformation and changes in stability of the anchorage foundation under coupled actions, monitoring points were established at the toe and heel of the anchorage foundation, as shown in Figure 6.
Figure 6.
Monitoring station layout map.
3. Results and Discussion
3.1. Validation of Direct Shear Numerical Results
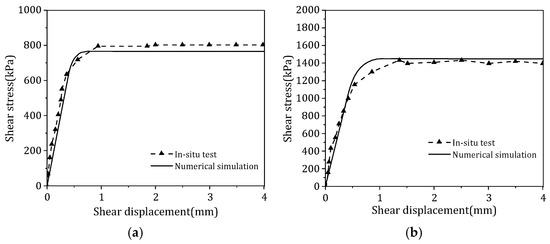
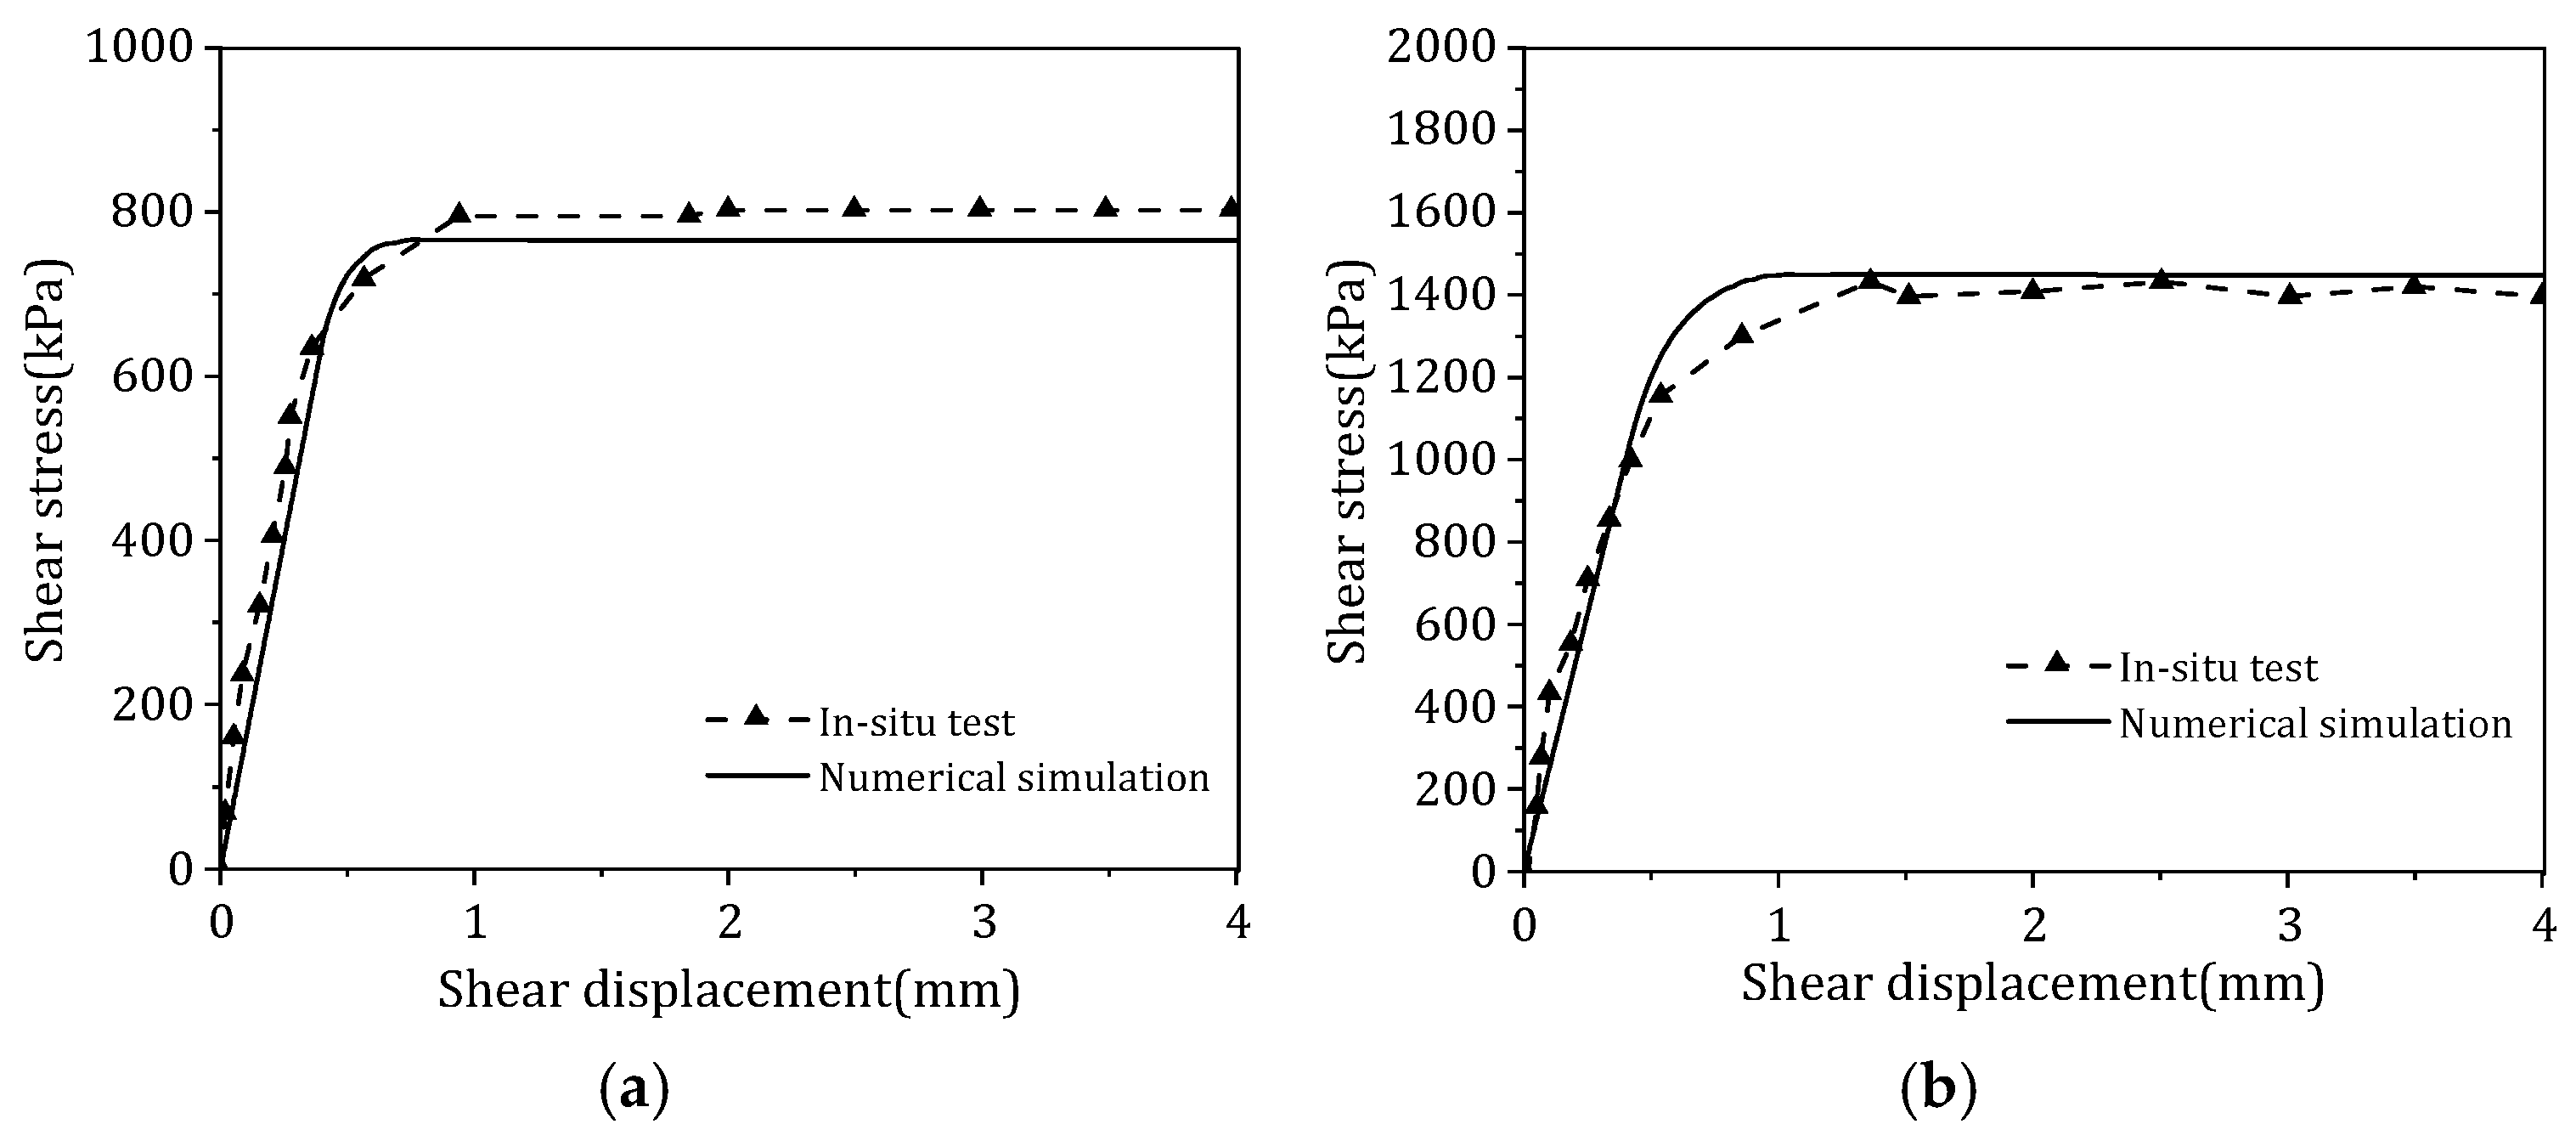
The purpose of this study is to verify the validity of the numerical model of the interface and the appropriateness of the parameter values. This study uses the FLAC3D 7.0 direct shear numerical model shown in Figure 3 to perform scaled simulations of both concrete–argillaceous sandstone interface shear tests and mudstone rock mass direct shear tests. A normal pressure of 540 kPa was selected as a typical operating condition, and the shear stress–shear displacement curves obtained from the numerical simulations were compared with the field test results, as shown in Figure 7.
Figure 7.
Verification of numerical simulation results: (a) shear strength at the concrete–argillaceous sandstone interface; (b) direct shear of the argillaceous sandstone mass.
As shown in Figure 7, the shear stress–shear displacement curves obtained from the numerical simulation generally agree well with the experimental results, reflecting the rapid increase in stress during the initial shear stage, followed by yielding and stabilization. Whether for shear at the concrete–rock interface or direct shear within the rock mass, the numerical results show good consistency with the experimental results in terms of the trend of the curves and the peak shear strength. This indicates that the interface model and parameters adopted can reasonably characterize the shear behavior of the anchorage–rock interface and rock joint surfaces. It should be noted that some discrepancies still exist between the numerical simulation results and the experimental results. This may be attributed to friction between the top of the test specimen and the load-bearing plate during field testing, local surface irregularities of the rock mass, and the difficulty in fully idealizing the field boundary conditions.
Therefore, the subsequent cyclic shear analysis in this paper continues to employ the experimentally validated numerical model and interface parameters. On this basis, by introducing a wet–dry cycle degradation coefficient, the mechanical parameters of the rock mass and the interface are reduced to further analyze the variation patterns of the interface’s cyclic shear response under wet–dry cycling.
3.2. Cyclic Shear Hysteresis Response Under Wet–Dry Degradation
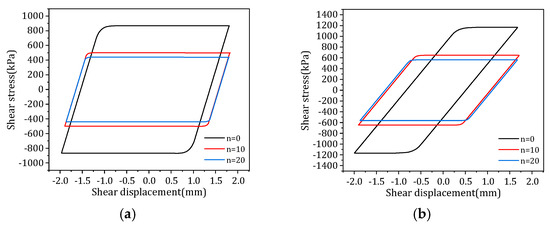
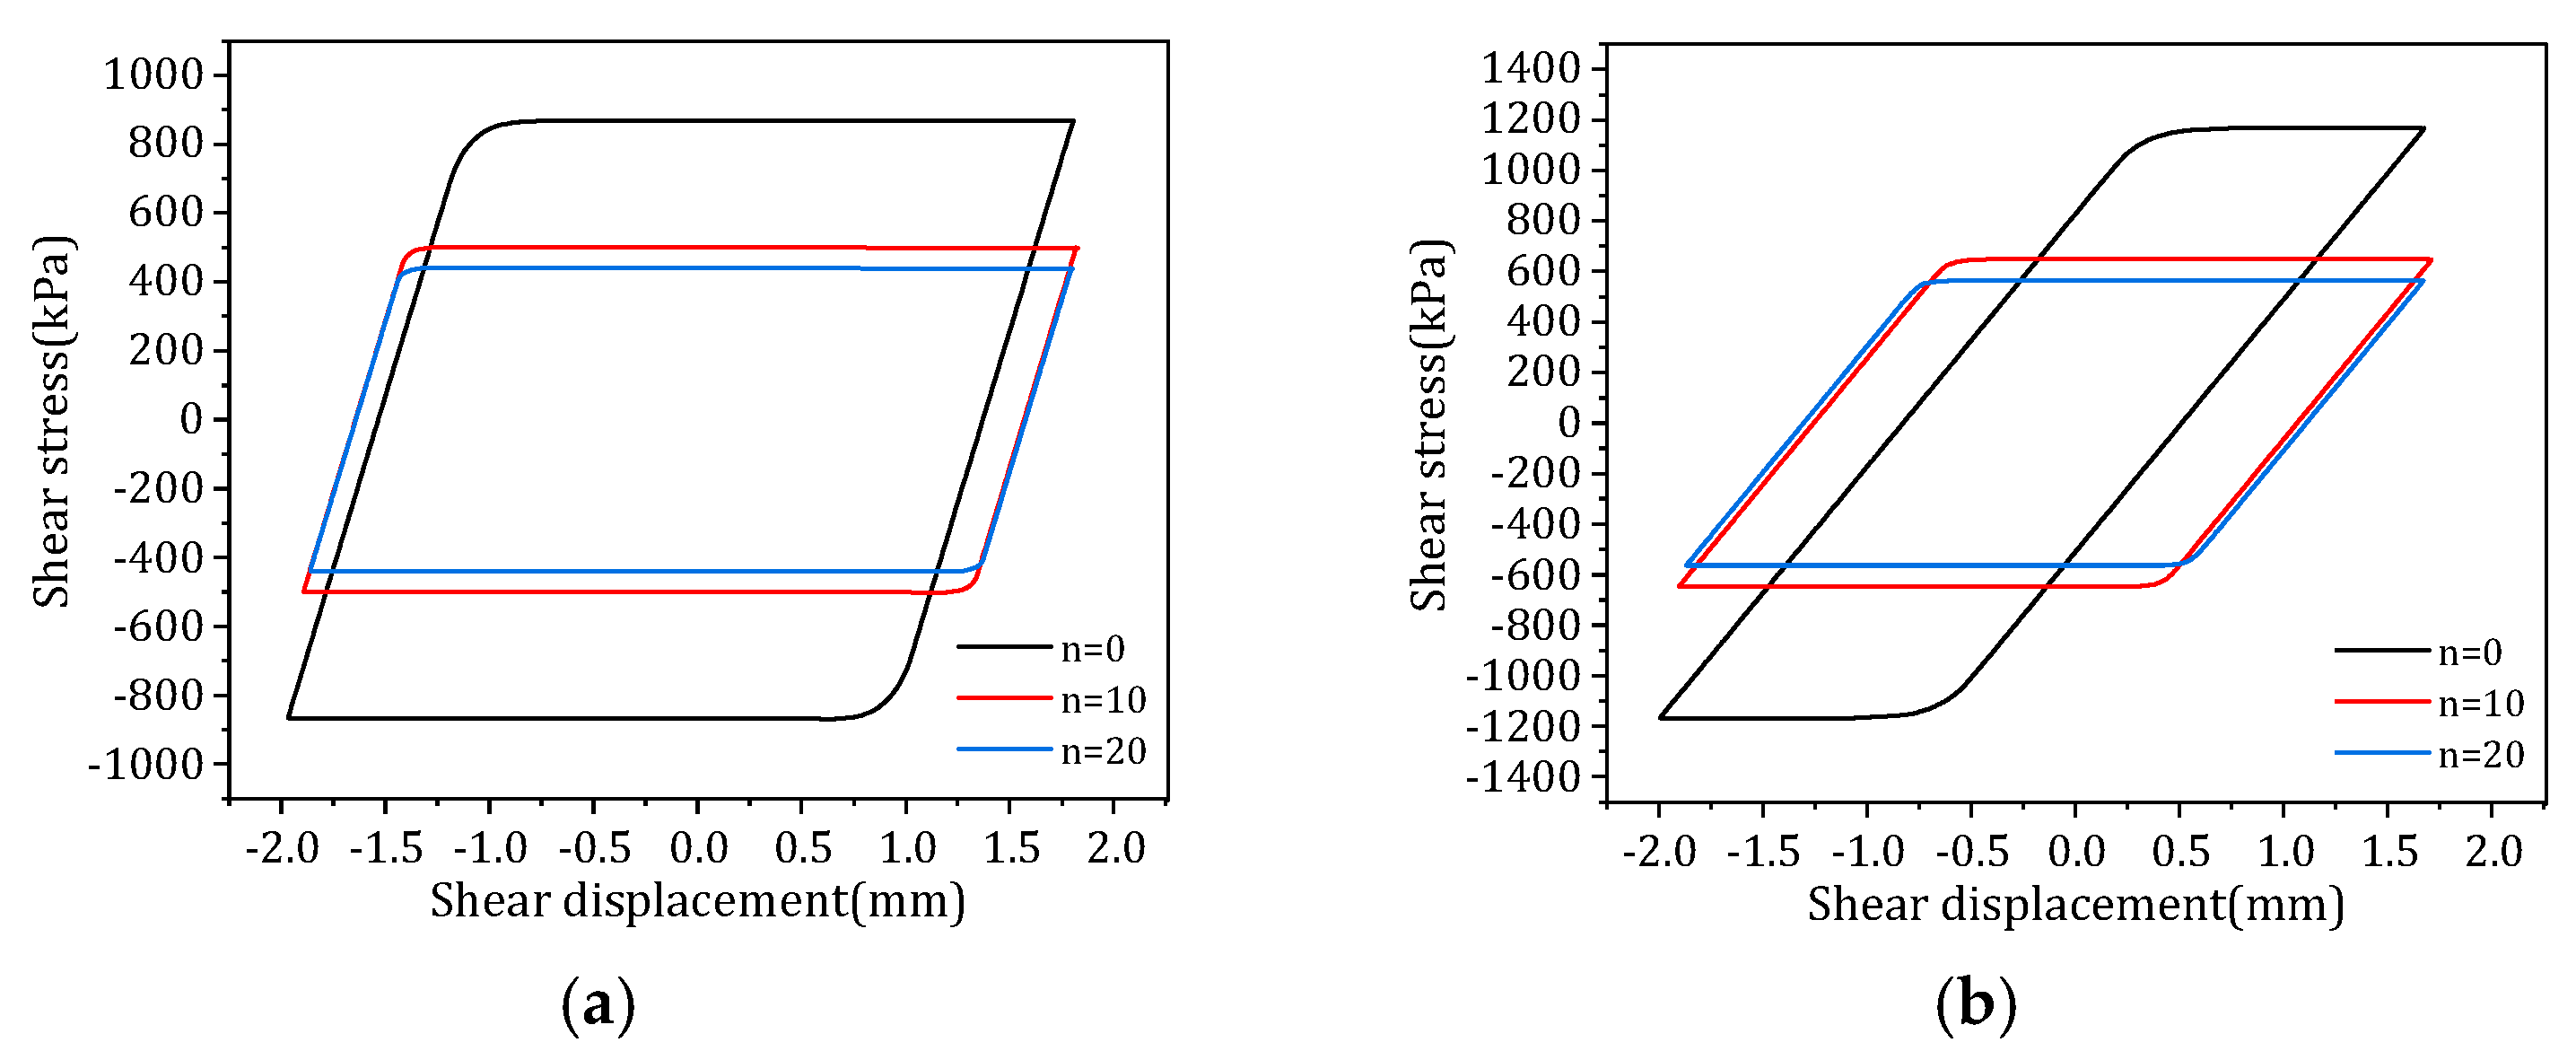
Figure 8 shows the shear hysteresis curves for the final week of cycling under different wet–dry cycling conditions at a normal pressure of 540 kPa. Figure 8a presents the shear results at the concrete–argillaceous sandstone interface, while Figure 8b shows the direct shear results for the argillaceous sandstone mass. To minimize the influence of the initial loading phase on the hysteretic response, this study selected the hysteresis curves from the final week after the cyclic loading had stabilized for comparative analysis.
Figure 8.
Shear hysteresis curves for the final week of different dry–wet cycling conditions: (a) shear strength at the concrete–argillaceous sandstone interface; (b) direct shear of the argillaceous sandstone mass.
It can be seen from Figure 8 that the shear stress–shear displacement curves for both types of shear conditions exhibit distinct elastoplastic hysteresis characteristics. In the initial stage of shearing, the shear stress increases rapidly with increasing shear displacement; once the shear displacement reaches the yield stage, the shear stress gradually stabilizes at a plateau, forming a relatively complete hysteresis loop. Since the model does not incorporate fatigue damage or interface wear mechanisms that evolve with the number of shear cycles, this hysteresis curve primarily reflects the steady-state cyclic shear response under different wet–dry cycling degradation conditions.
To further quantify the effect of wet–dry cycling degradation on the cyclic shear response, this study extracted and analyzed the peak shear stress and hysteresis loop area from the hysteresis curves of the final week under different numbers of wet–dry cycles.
For the concrete–rock interface, the peak shear stress decreased from 868.22 kPa at n = 0 to 500.42 kPa at n = 10 and 440.55 kPa at n = 20, representing reductions of 42.36% and 49.26%, respectively, compared to the natural state; The hysteresis loop area decreased from 5028.47 kPa·mm to 3213.27 kPa·mm and 2833.72 kPa·mm, representing reductions of 36.10% and 43.65%, respectively. This indicates that wet–dry cycling degradation significantly weakened the cyclic shear strength and energy dissipation capacity of the concrete–rock interface.
For direct shear on argillaceous sandstone rock mass, the peak shear stress decreased from 1167.36 kPa at n = 0 to 648.00 kPa at n = 10 and 564.57 kPa at n = 20, representing reductions of 44.49% and 51.64%, respectively, compared to the natural state; the hysteresis loop area decreased from 3105.82 kPa·mm to 3004.52 kPa·mm and 2723.25 kPa·mm, representing reductions of 3.26% and 12.32%, respectively. This indicates that the cyclic energy dissipation capacity of the underlying rock mass structural plane is also significantly affected by the deterioration caused by wet–dry cycles.
From a mechanical perspective, the wet–dry cycle causes the expansion of microfractures and the weakening of grain bonding in the rock mass through repeated wetting and drying, leading to a decrease in cohesion and the angle of internal friction. The reduction in cohesion weakens the shear resistance contribution of contact surfaces and structural planes, while the decrease in the angle of internal friction weakens frictional resistance under normal pressure, causing both the peak shear stress and the hysteresis loop area to decrease simultaneously during cyclic shearing. This indicates that wet–dry cycling not only reduces static shear strength but also weakens the energy dissipation capacity during cyclic shearing.
3.3. Characteristics of Cumulative Deformation in Foundations Under Coupled Loading
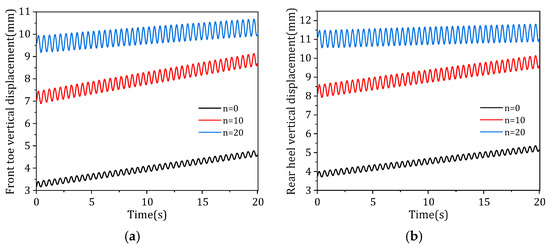
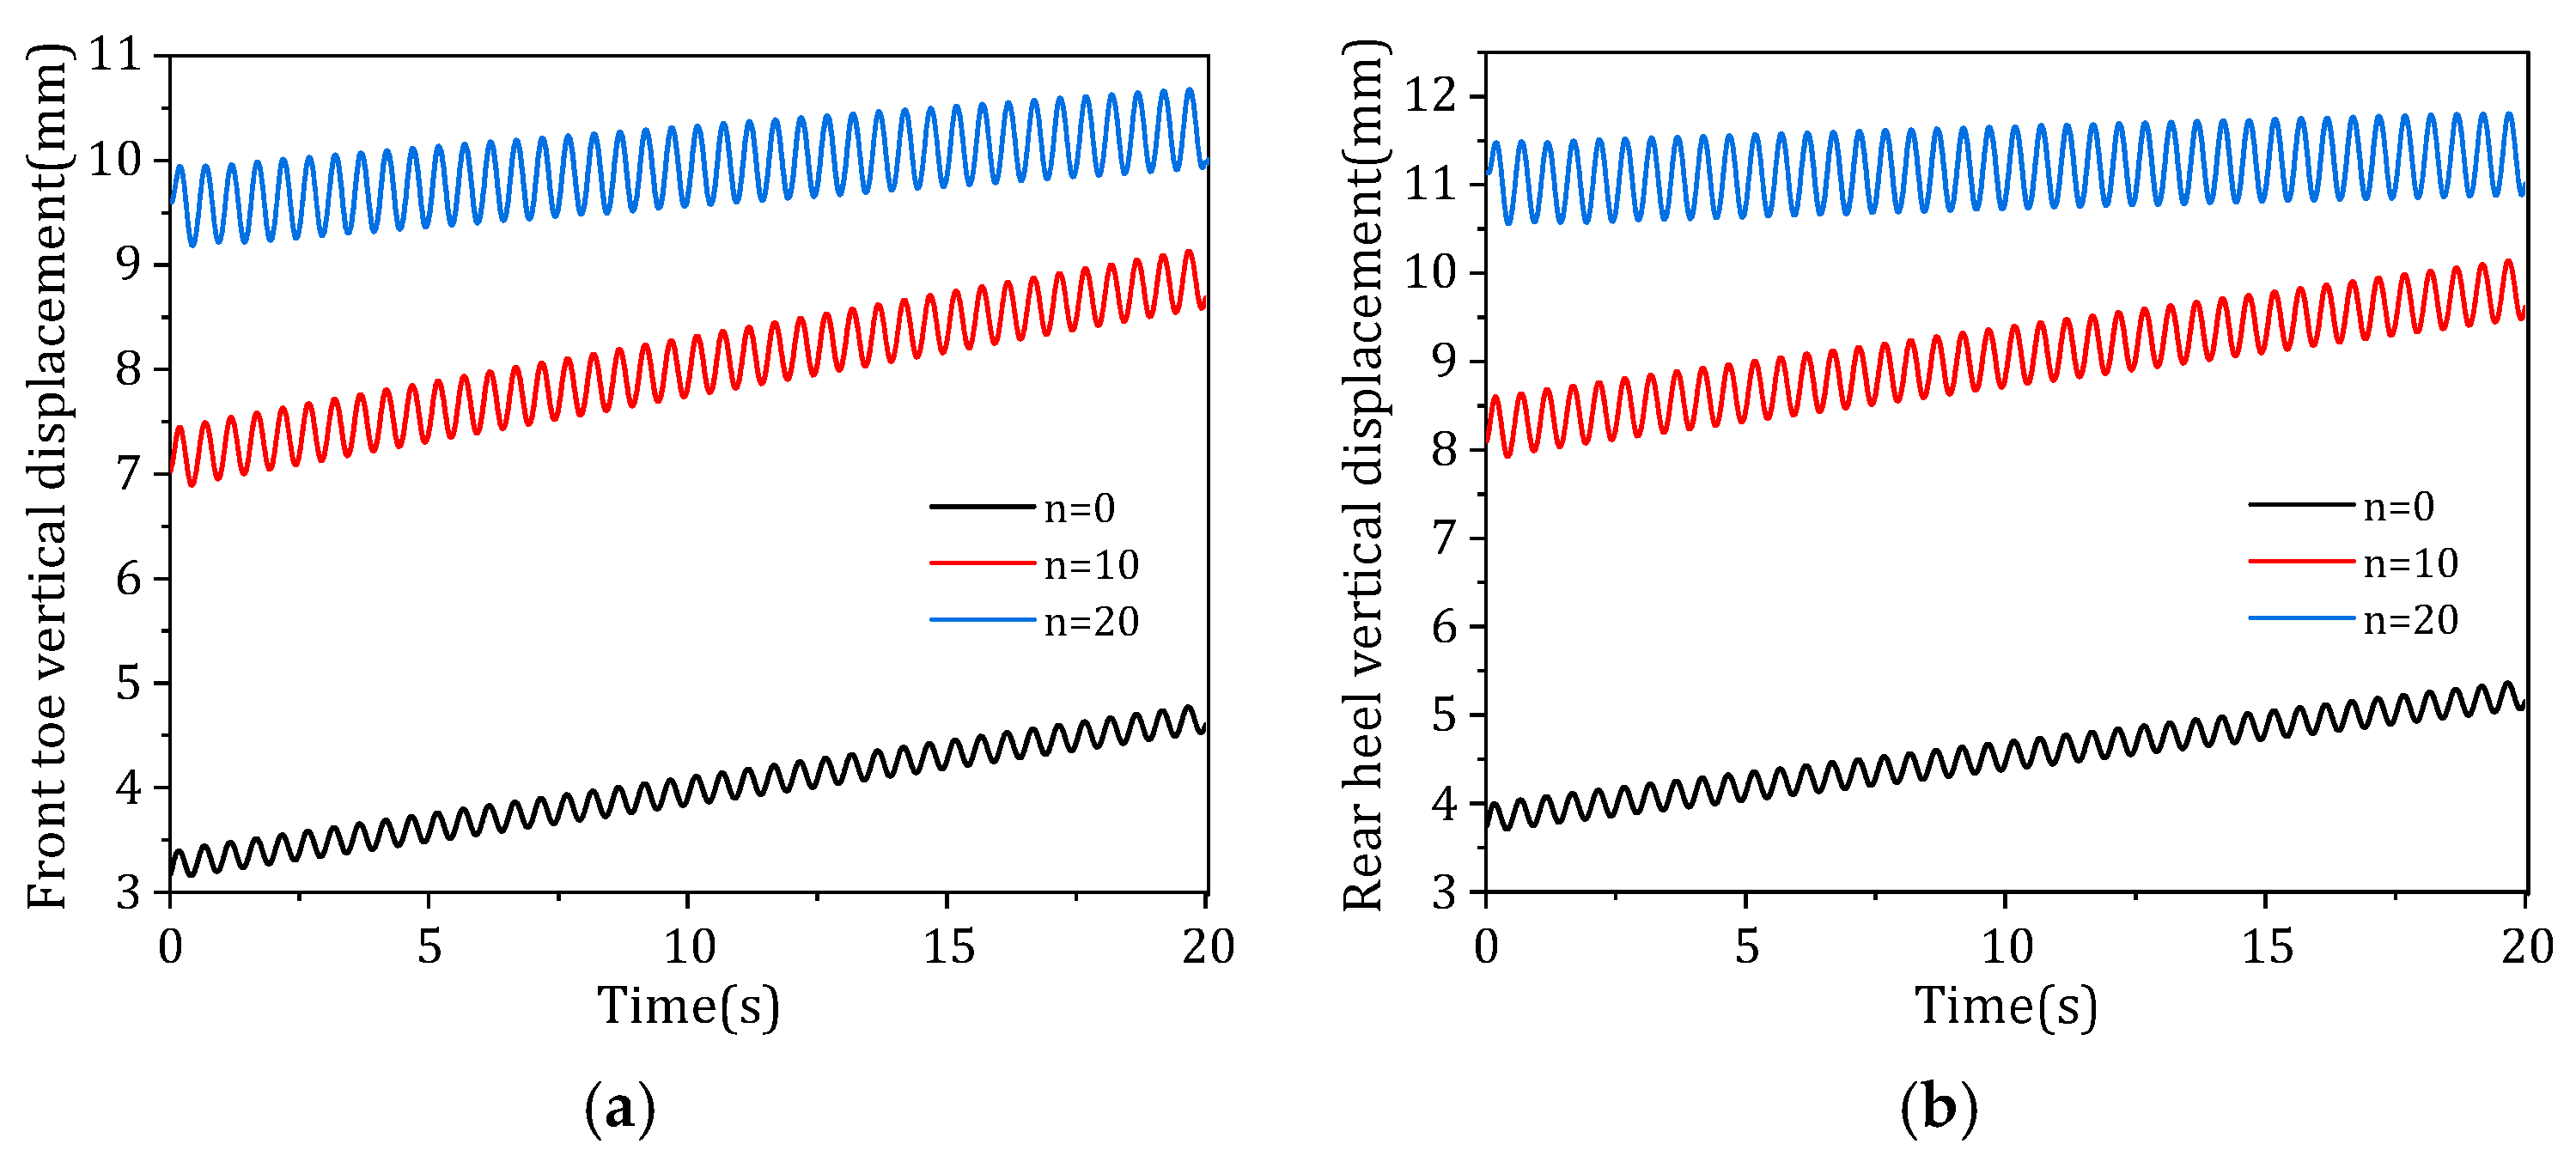
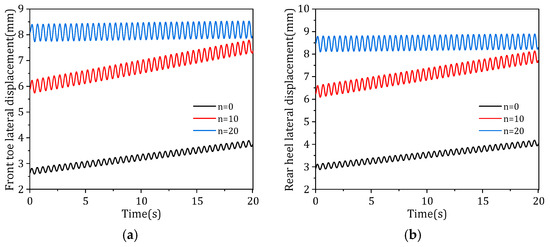
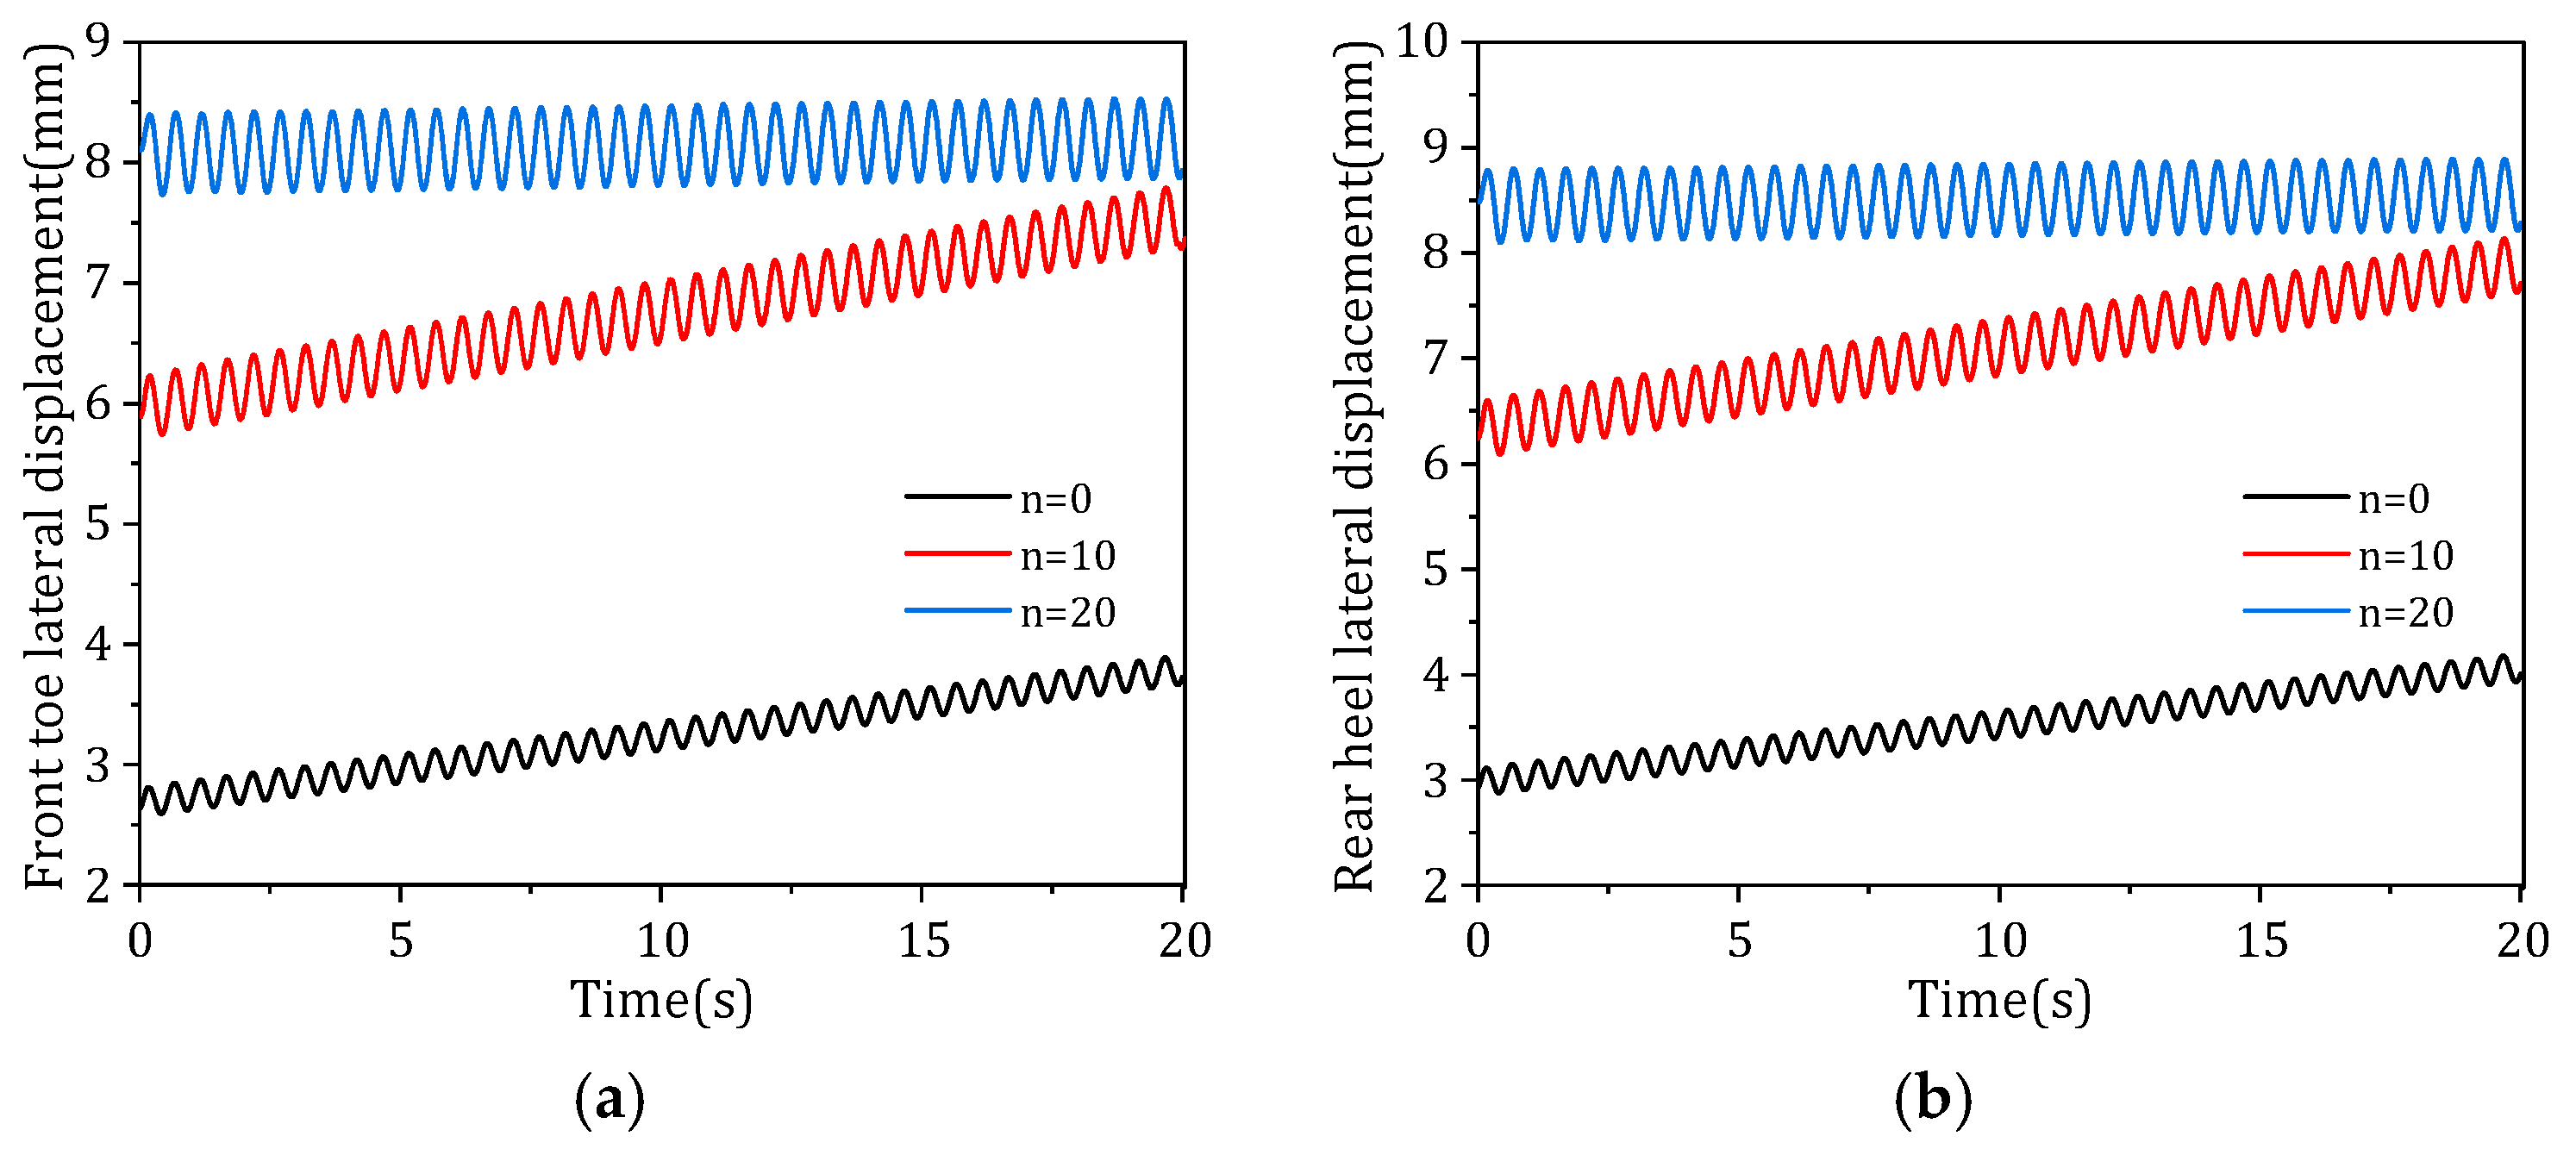
Figure 9 and Figure 10 show the vertical and lateral displacements of the anchorage foundation under the combined effects of cyclic vehicle loads and wet–dry cycles.
Figure 9.
Vertical displacement under different numbers of wet–dry cycles: (a) front toe of the anchor; (b) rear heel of the anchor.
Figure 10.
Lateral displacement under different numbers of wet–dry cycles: (a) front toe of the anchor; (b) rear heel of the anchor.
Figure 9 and Figure 10 show that the number of wet–dry cycles has a significant effect on the displacement response of the anchor foundation. Under cyclic vehicle loads, displacements at all monitoring points exhibit distinct periodic fluctuations, indicating that equivalent cyclic vehicle loads induce repetitive dynamic responses in the anchor–bedrock system. As the number of wet–dry cycles increased from n = 0 to n = 10 and n = 20, the overall levels of vertical and lateral displacement at the toe and heel of the anchor foundation increased significantly. This indicates that wet–dry cycle degradation weakened the stiffness and shear restraint capacity of the foundation, causing the anchor foundation to exhibit greater deformation responses under the same main cable tension and vehicle cyclic loads.
Since the displacements at the monitoring points of the anchor foundation exhibit periodic fluctuations under cyclic vehicle loads, this paper extracts the initial, first-peak, and last-peak vertical and lateral displacements of the front toe and rear heel for quantitative analysis. The initial displacement reflects the pre-deformation level of the foundation before the start of the cycle, the displacement at the first peak reflects the dynamic response at the beginning of the cycle, and the displacement at the last peak reflects the cumulative effect at the end of the cycle.
For the front toe, the initial vertical displacements were 3.74 mm, 8.10 mm, and 11.14 mm, respectively, and the initial lateral displacements were 3.17 mm, 7.03 mm, and 9.61 mm, respectively; the vertical displacement at the first peak was 3.39 mm, 7.45 mm, and 9.94 mm, respectively, and the lateral displacement was 2.81 mm, 6.23 mm, and 8.40 mm, respectively; The vertical displacements at the last wave crest were 4.77 mm, 9.13 mm, and 10.68 mm, respectively, and the lateral displacements were 3.89 mm, 7.79 mm, and 8.14 mm, respectively. Compared to the natural state (n = 0), the initial displacement, first peak displacement, and last peak displacement for n = 10 and n = 20 all increased significantly. Specifically, the vertical displacement of the last peak increased by approximately 91.4–123.9% compared to the natural state, and the lateral displacement increased by approximately 100.3–109.3%. This indicates that wet–dry cycling degradation significantly elevated the displacement response of the forefoot and amplified the peak displacements under cyclic vehicle loads.
For the rear heel, the initial vertical displacements were 2.93 mm, 6.25 mm, and 8.48 mm, respectively, and the initial lateral displacements were 2.64 mm, 5.89 mm, and 8.10 mm, respectively; the vertical displacement at the first peak was 3.99 mm, 8.60 mm, and 11.48 mm, respectively, while the lateral displacement was 3.11 mm, 6.60 mm, and 8.79 mm, respectively. The vertical displacements of the last wave crest were 5.36 mm, 10.14 mm, and 11.81 mm, respectively, and the lateral displacements were 4.18 mm, 8.14 mm, and 8.89 mm, respectively. The vertical displacement of the final peak increased by approximately 89.2–120.3% compared to the natural state, while the lateral displacement increased by approximately 94.7–112.7%, indicating that the rear heel region is more sensitive to wet–dry and vehicle cycle loads, with overall peak responses higher than those of the front toe.
By comparing the first peak with the last peak, the cumulative displacement trend of the foundation during cyclic loading can be observed. In the undamaged state, the vertical and lateral displacements of the forefoot increased by 1.38 mm and 1.08 mm, respectively, while those of the heel increased by 1.37 mm and 1.07 mm, respectively, whereas at n = 10, the increments in vertical and lateral displacement for the front toe and rear heel are larger, indicating that moderate wet–dry cycling degradation enhances the progressive deformation effects of cyclic loading. At n = 20, the cumulative increments for the front toe and rear heel are relatively small, but the overall displacement levels rise significantly; the foundation primarily exhibits high-level periodic fluctuations rather than continuous displacement growth.
A comprehensive analysis reveals that wet–dry cycle degradation primarily affects the deformation response of the anchorage foundation by raising the initial displacement level and amplifying the peak values of cyclic fluctuations. The final peak displacement at the heel is slightly higher than that at the toe, indicating that the heel region is more sensitive to the eccentric tensile force of the main cable and cyclic vehicle loads; therefore, it should be prioritized as a key area for monitoring and local safety assessment during the operational phase.
3.4. Evolution of the Plastic Zone and Evaluation of Local Safety
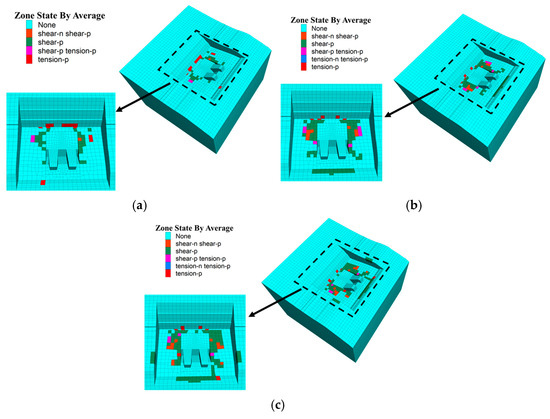
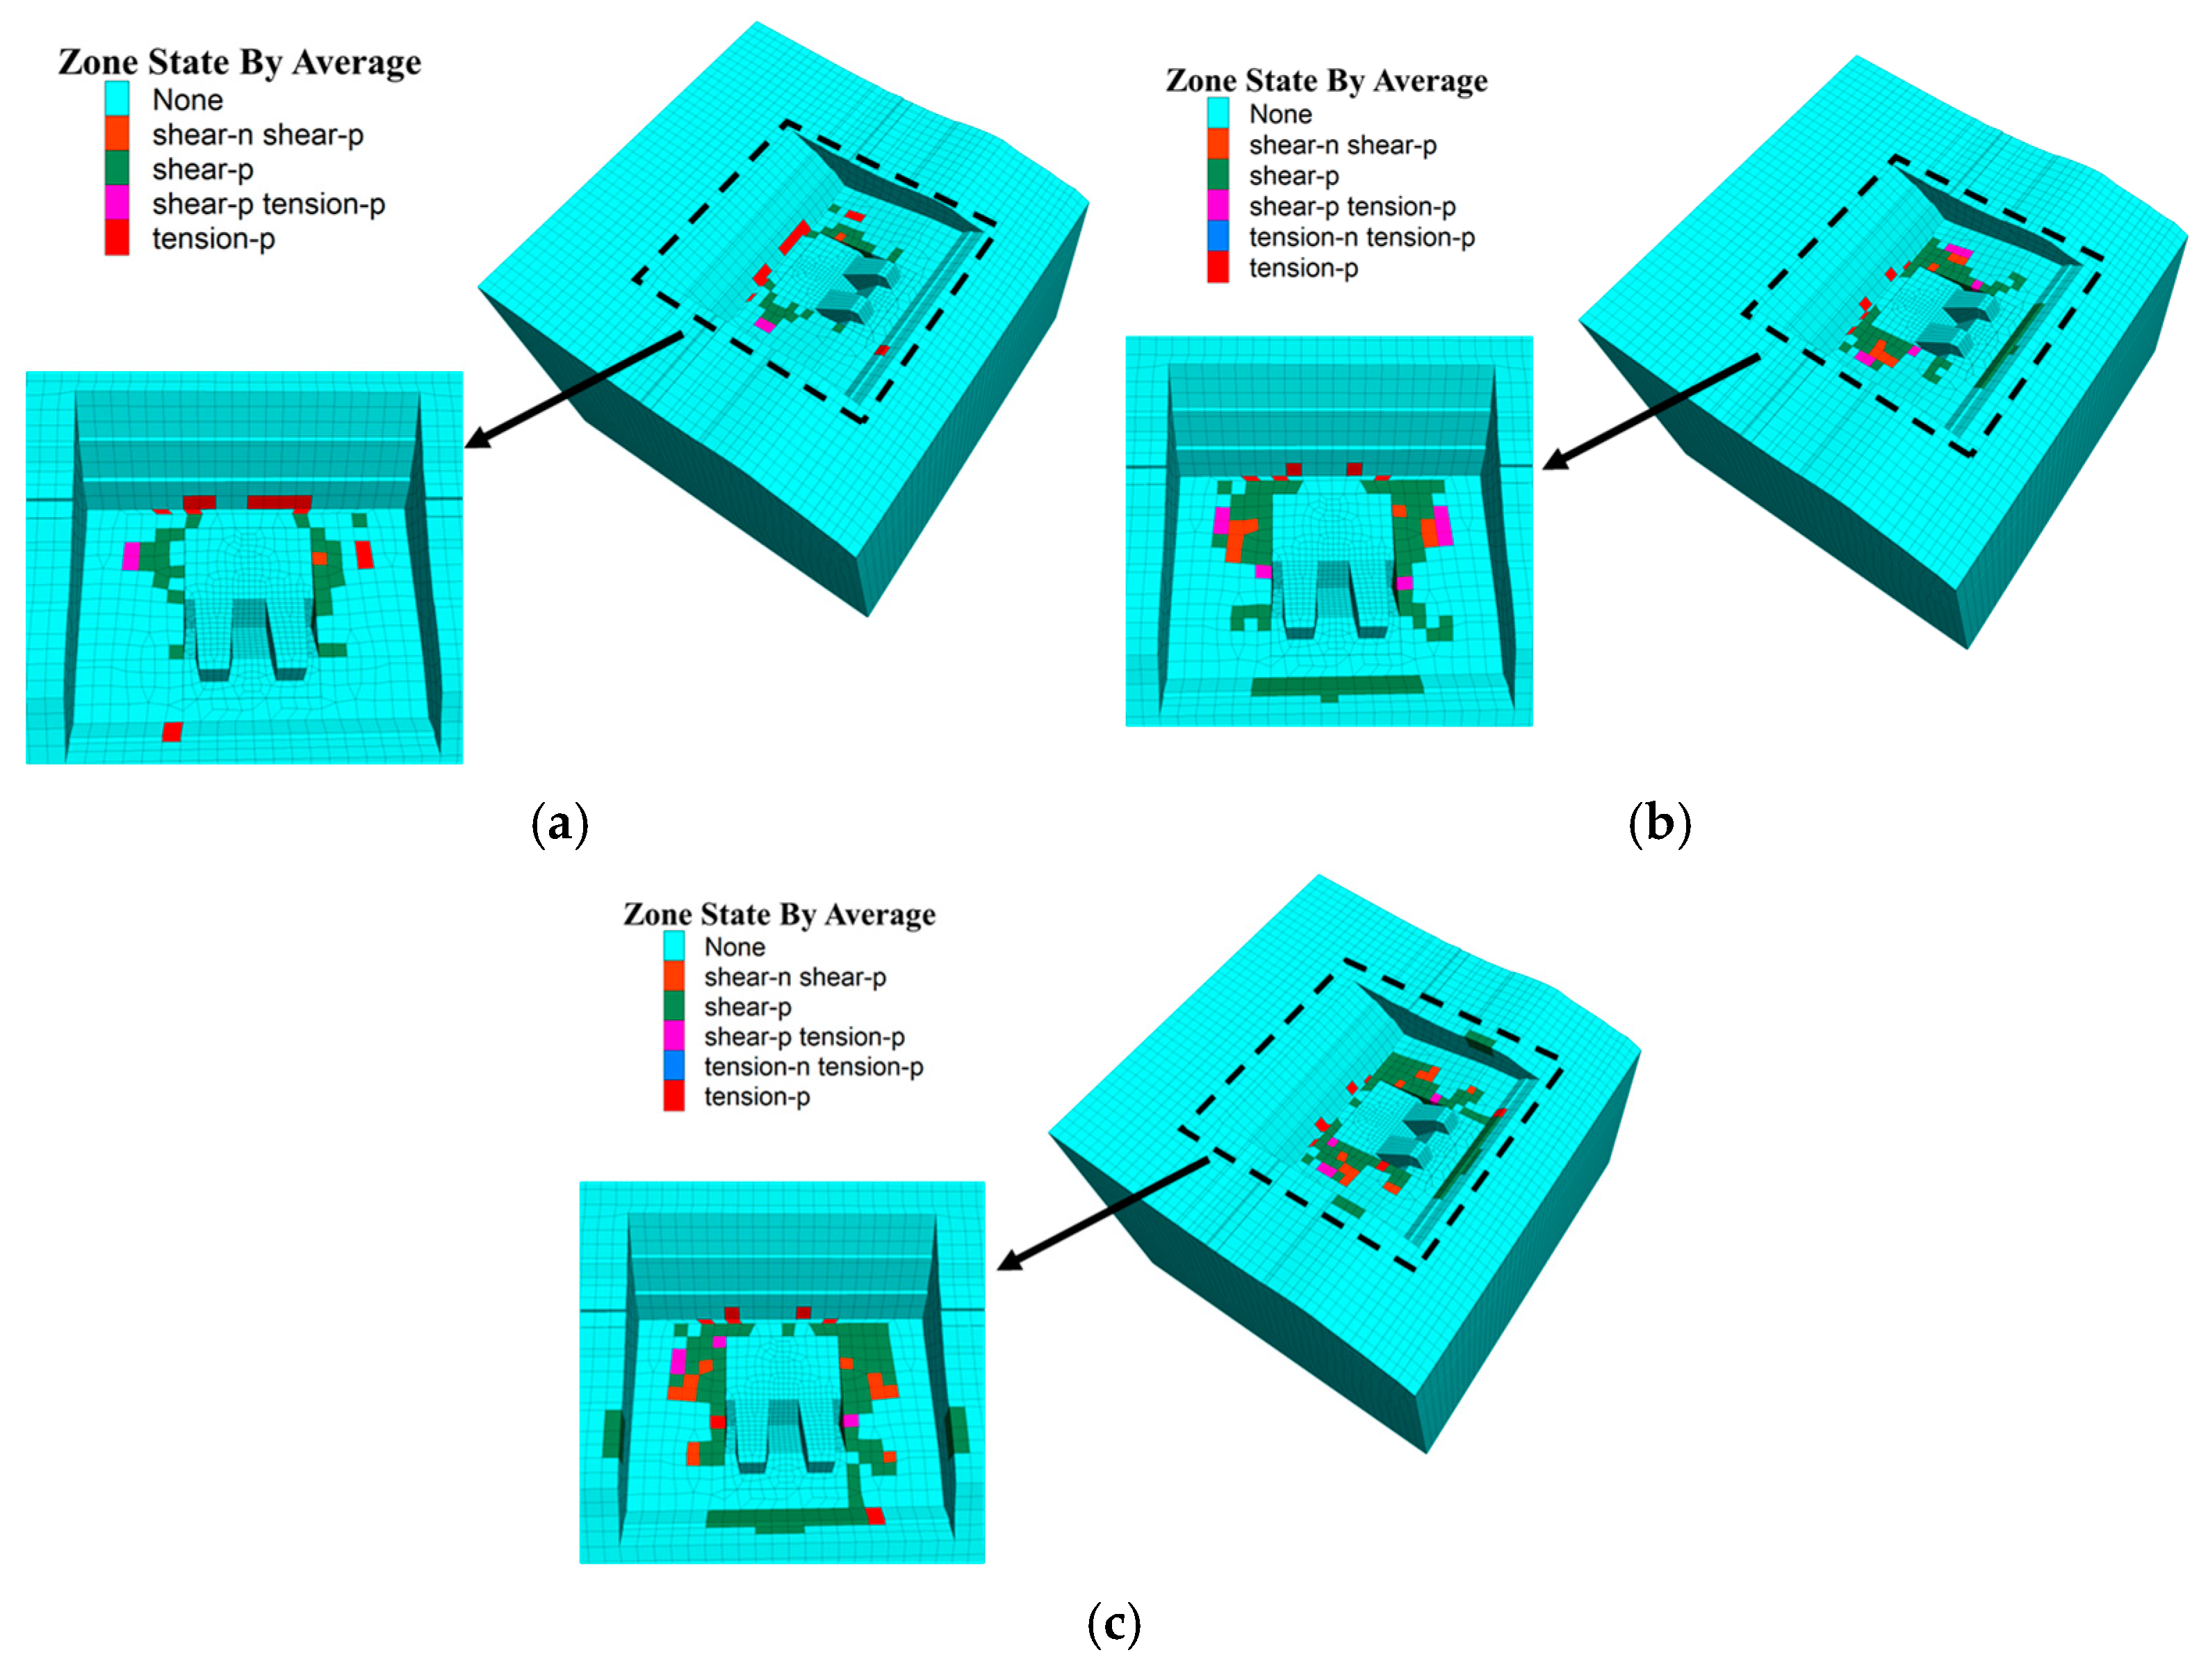
Figure 11 shows the distribution of the final plastic zone in the rock mass surrounding the anchor foundation under different numbers of wet–dry cycles. Here, “shear-n” denotes elements that have undergone shear yield, while “tension-n” denotes elements that have undergone tensile yield. As shown in Figure 11, under natural conditions, the plastic zone is primarily scattered across localized areas around the anchor foundation. Only a small number of shear-yielded or tension-yielded elements appear in the bedrock, and no large-scale continuous plastic zone has yet formed. This indicates that under these conditions, the anchor–bedrock system still possesses a high degree of local stability reserve. As the number of wet–dry cycles increases, the number of plastic elements around the anchor increases, and the distribution range of the plastic zone gradually expands. This indicates that after the strength and stiffness of the rock mass have deteriorated, the rock mass near the toe, heel, and base is more likely to reach the yield state under the combined action of the main cable tension and cyclic vehicle loads. When n = 20, the plastic zone remains primarily concentrated in the local area surrounding the anchor, but the number of shear-yielding and tensile-yielding elements has increased significantly compared to the natural state. This indicates that long-term wet–dry cycling degradation weakens the local stability reserve of the anchor–bedrock system and may increase the risk of local shear slippage. Overall, wet–dry cycling degradation amplifies the adverse effects of vehicle cyclic loads on the development of local plasticity in the rock mass surrounding the anchor foundation.
Figure 11.
Distribution of the final plastic zone in an anchor-and-abutment foundation under different numbers of wet–dry cycles: (a) n = 0; (b) n = 10; (c) n = 20.
To further evaluate the local safety of the rock mass near the front toe and rear heel of the anchor foundation under coupled effects, this paper selects monitoring points within the rock mass units near the front toe and rear heel to perform a safety factor analysis. The formula for calculating the safety factor [30] is as follows:
where K represents the local safety factor at the monitoring point, c represents the rock cohesion, φ represents the rock internal friction angle, σ1 represents the maximum principal stress at the monitoring point, and σ3 represents the minimum principal stress at the monitoring point. It should be noted that, for the calculation, c and φ should be taken as the parameters of the rock material at the monitoring point under the corresponding dry–wet cycling conditions.
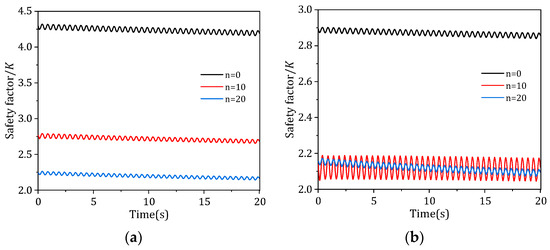
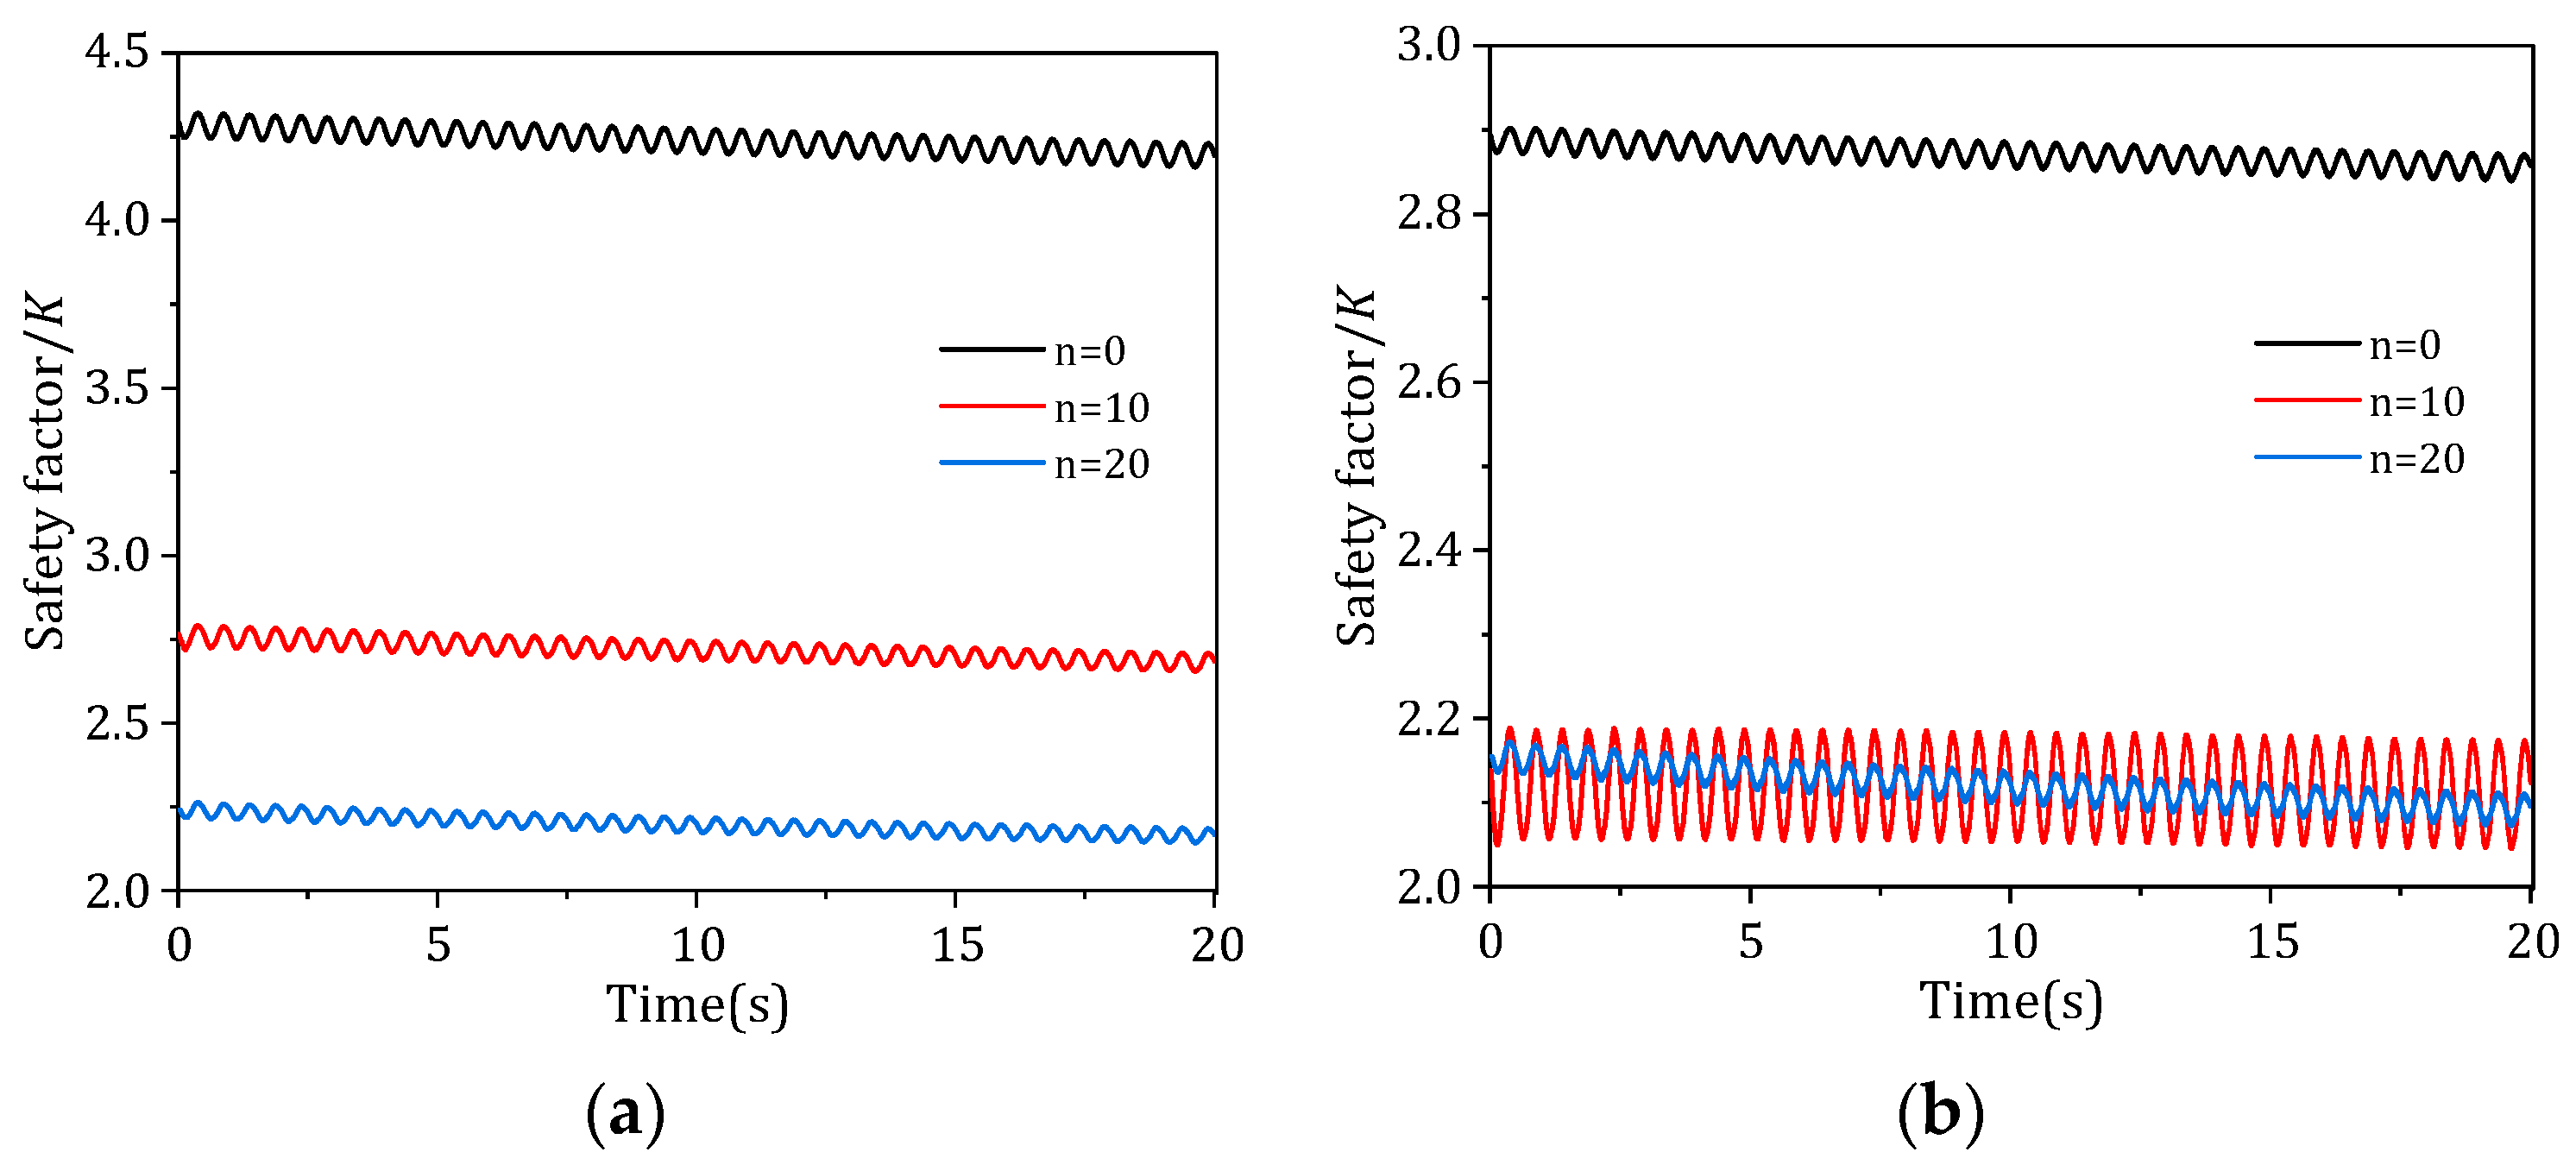
Figure 12 shows the time history of the local safety factor at monitoring points near the front toe and rear heel of the anchor foundation under different numbers of wet–dry cycles. It can be seen that the local safety factors at both monitoring points fluctuate periodically with the cyclic vehicle loads, indicating that cyclic loading causes repeated adjustments in the local stress state of the anchor–bedrock system. As the number of wet–dry cycles increases from n = 0 to n = 10 and n = 20, the local safety factor curves for the rock masses near both the toe and heel shift downward significantly, indicating that the deterioration in rock strength has substantially reduced the local safety margin of the rock masses surrounding the foundation.
Figure 12.
Time history of local safety factors in rock masses near the forefoot and hindfoot under different numbers of wet–dry cycles: (a) rock mass near the forefoot; (b) rock mass near the hindfoot.
To quantitatively evaluate changes in the local safety margin of the rock mass near the toe and heel, this paper extracts the local safety factors at the start and end of the vehicle cyclic loading. For the rock mass near the toe, the initial safety factors under the (n = 0), (n = 10), and (n = 20) loading conditions were 4.292, 2.765, and 2.240, respectively, and decreased to 4.194, 2.685, and 2.168, respectively, after the cyclic loading was completed. Compared to the natural state, the initial and final safety factors under the (n = 20) condition decreased by approximately 47.81% and 48.31%, respectively. For the rock mass near the rear heel, the initial safety factors were 2.893, 2.138, and 2.155, respectively, and after cyclic loading, they were 2.857, 2.124, and 2.096, respectively. Compared to the natural state, the initial and final safety factors under the (n = 20) loading condition decreased by approximately 25.54% and 26.64%, respectively. This indicates that wet–dry cycling degradation leads to an overall decrease in the local safety factors of the rock mass near the toe and heel, with the safety factor at the toe showing a more pronounced decline due to wet–dry cycling degradation.
Looking at the changes before and after cyclic loading, both the safety factors at the front toe and rear heel showed slight decreases under the same wet–dry cycle conditions, indicating that vehicle cyclic loads further erode local safety reserves. A comparison of the two monitoring points reveals that the safety factor of the rock mass near the rear heel is generally lower than that near the front toe, and the fluctuation range of the safety factor at the rear heel is significantly larger under the (n = 10) condition, indicating that the rear heel area is more sensitive to stress disturbances and the eccentric tensile force of the main cable. Overall, wet–dry cycling degradation is the primary cause of the general decrease in local safety factors, while vehicle cyclic loads further induce periodic fluctuations and slight attenuation; the rock mass near the rear heel should be prioritized as a key area for local stability assessment and monitoring during the operational phase of the anchorage foundation.
4. Conclusions
This paper investigates the interface response, foundation deformation, and stability behavior of gravity-type anchorage foundations for suspension bridges in layered argillaceous sandstone soils. Using cyclic direct shear numerical simulations and three-dimensional explicit finite difference dynamic analysis methods, the study examines the combined effects of wet–dry cycling degradation and equivalent vehicle cyclic loads. The main conclusions are as follows:
(1) As the number of wet–dry cycles increased, the peak shear stress and hysteresis loop area at the concrete–rock interface and the rock shear plane decreased significantly, indicating that wet–dry cycle degradation significantly weakened the cyclic shear strength and energy dissipation capacity. Both the vertical and horizontal displacements at the toe and heel increased with the number of wet–dry cycles. The peak displacement at the final wave showed a certain degree of accumulation compared to that at the initial wave, revealing progressive deformation characteristics under cyclic loading. The displacement at the heel was generally slightly higher than that at the toe, indicating that the heel region is more sensitive and should be prioritized for monitoring.
(2) Dry–wet cycling degradation reduces the initial safety factor of the rock mass near the toe and heel; the cyclic loading from vehicles further causes a slight decline and periodic fluctuations in the safety factor. Specifically, the safety factor at the toe exhibits a more pronounced decline due to wet–dry cycling, while the overall safety factor at the heel is lower than that at the toe and exhibits the greatest amplitude of fluctuation under moderate wet–dry cycling cycles (n = 10). This indicates that the heel region is more sensitive to stress disturbances and should be prioritized for local stability assessment and deformation monitoring during the operational period.
(3) The coupled effects of wet–dry cycling degradation and cyclic vehicle loads not only increase the overall displacement of the foundation but also amplify the periodic peak response, leading to the expansion of local plastic zones and a reduction in safety margins. The research findings reveal the dynamic response patterns of anchorage foundations under the combined effects of environmental degradation and operational loads, providing a reference for the local stability assessment and safety monitoring of anchorage foundations for long-span suspension bridges on highly water-sensitive soft rock subgrades.
It is worth noting that this study simplifies traffic loads during the operational period into equivalent sinusoidal dynamic main cable tension increments, primarily to reveal the amplification effect of wet–dry cycling degradation on the dynamic response of the anchor foundation. Actual traffic loads exhibit randomness and multi-frequency characteristics; in future studies, load inputs can be further refined by incorporating measured traffic flow data or vehicle–bridge coupling analysis.
Author Contributions
Conceptualization, Y.G. and W.C.; methodology, Y.G. and W.C.; software, X.W. and J.Z.; validation, X.W. and J.Z.; formal analysis, X.W. and Z.L.; investigation, J.Z., M.Y. and X.L.; resources, J.Z.; data curation, X.W., Z.L. and X.L.; writing—original draft preparation, Y.G. and X.W.; writing—review and editing, W.C.; visualization, Z.L. and M.Y.; supervision, W.C.; project administration, W.C.; funding acquisition, W.C. All authors have read and agreed to the published version of the manuscript.
Funding
This research was funded by the Natural Science Foundation of Hunan Province, grant number 2022JJ30715.
Data Availability Statement
The original contributions presented in this study are included in the article. Further inquiries can be directed to the corresponding authors.
Acknowledgments
The authors are grateful to the editors and reviewers for their constructive comments on this work.
Conflicts of Interest
Author Yupeng Gu was employed by the company China Railway Major Bridge Engineering Group Co., Ltd. The remaining authors declare that the research was conducted in the absence of any commercial or financial relationships that could be construed as a potential conflict of interest.
References
- Li, H.; Yang, M.; Yin, X. Study on safety assessment methods of gravity anchors based on a simplified mechanical model. Front. Earth Sci. 2023, 11, 1178622. [Google Scholar] [CrossRef] [Scilit]
- Xiong, W.; Jiang, C.; Wang, T.; Wang, R.; Zhou, X. Safety-margin design for gravity-type anchorage of suspension bridges over 2000 m long based on target reliability. J. Bridge Eng. 2024, 29, 04024003. [Google Scholar] [CrossRef] [Scilit]
- Wang, C.; Han, H.; Wang, H.; Zhang, X.; Liu, X.; Leng, X.; Qin, W.; Fang, K. Load-bearing behaviors of the composite gravity-type anchorage: Insights from physical model and numerical tests. Eng. Fail. Anal. 2025, 167, 108959. [Google Scholar] [CrossRef] [Scilit]
- Vanjakula, V.K.; Windt, C.; Adam, F.; Goseberg, N. Numerical investigation on the motion dynamics of submerged gravity anchors exposed to wave action. J. Waterw. Port Coast. Ocean Eng. 2025, 151, 04024023. [Google Scholar] [CrossRef] [Scilit]
- Lu, Y.; Chen, H.; Tomac, I.; McCartney, J.S. Analytical and numerical investigation of gravity anchors for floating photovoltaic systems. Ocean Eng. 2024, 313, 119591. [Google Scholar] [CrossRef] [Scilit]
- Zhang, C.; Liu, H. Investigation on comprehensive behaviors of the gravity installed anchor in sand. Ocean Eng. 2025, 329, 121129. [Google Scholar] [CrossRef] [Scilit]
- Torres-Suarez, M.C.; Alarcon-Guzman, A.; Moya, B.D. Effects of loading-unloading and wetting-drying cycles on geomechanical behaviors of mudrocks in the Colombian Andes. J. Rock Mech. Geotech. Eng. 2014, 6, 257–268. [Google Scholar] [CrossRef] [Scilit]
- Liu, X.; Wang, Z.; Fu, Y.; Yuan, W.; Miao, L. Macro/microtesting and damage and degradation of sandstones under dry-wet cycles. Adv. Mater. Sci. Eng. 2016, 2016, 7013032. [Google Scholar] [CrossRef] [Scilit]
- Liu, X.; Jin, M.; Li, D.; Zhang, L. Strength deterioration of a shaly sandstone under dry-wet cycles: A case study from the Three Gorges Reservoir in China. Bull. Eng. Geol. Environ. 2018, 77, 1607–1621. [Google Scholar] [CrossRef] [Scilit]
- Zhao, Y.; Ren, S.; Jiang, D.; Liu, R.; Wu, J.; Jiang, X. Influence of wetting-drying cycles on the pore structure and mechanical properties of mudstone from Simian Mountain. Constr. Build. Mater. 2018, 191, 923–931. [Google Scholar] [CrossRef] [Scilit]
- Wang, C.; Pei, W.; Zhang, M.; Lai, Y.; Dai, J. Multi-scale experimental investigations on the deterioration mechanism of sandstone under wetting-drying cycles. Rock Mech. Rock Eng. 2021, 54, 429–441. [Google Scholar] [CrossRef] [Scilit]
- Che, Y.; Song, Y.; Yang, H.; Chen, J.; Meng, C.; Zhang, J. Damage behaviour of sandstone induced by combination of dry-wet cycles and acidic environment. Environ. Earth Sci. 2022, 82, 19. [Google Scholar] [CrossRef] [Scilit]
- Ma, T.; Liu, H.; Zou, Q.; Kong, F.; Ran, Q.; Wang, P. Damage evolution characteristics and deterioration mechanism of mechanical properties of sandstone subjected to drying-wetting cycles. J. Mater. Res. Technol. 2023, 23, 4591–4605. [Google Scholar] [CrossRef] [Scilit]
- Huang, K.; Dai, Z.; Meng, Y.; Yu, F.; Yao, J.; Zhang, W.; Chi, Z.; Chen, S. Mechanical behavior and fracture mechanism of red-bed mudstone under varied dry-wet cycling and prefabricated fracture planes with different loading angles. Theor. Appl. Fract. Mech. 2023, 127, 104094. [Google Scholar] [CrossRef] [Scilit]
- Huang, S.; He, Y.; Liu, X.; Xin, Z. Experimental investigation of the influence of dry-wet, freeze-thaw and water immersion treatments on the mechanical strength of the clay-bearing green sandstone. Int. J. Rock Mech. Min. Sci. 2021, 138, 104613. [Google Scholar] [CrossRef] [Scilit]
- Tang, S.; Wang, J.; Qiu, Z.; Tan, Y.M. Effects of wet-dry cycle on the shear strength of a sandstone-mudstone particle mixture. Int. J. Civ. Eng. 2019, 17, 921–933. [Google Scholar] [CrossRef] [Scilit]
- Ying, P.; Zhu, Z.; Ren, L.; Deng, S.; Niu, C.; Wan, D.; Wang, F. Deterioration of dynamic fracture characteristics, tensile strength and elastic modulus of tight sandstone under dry-wet cycles. Theor. Appl. Fract. Mech. 2020, 109, 102698. [Google Scholar] [CrossRef] [Scilit]
- Zhang, H.; Lu, K.; Zhang, W.; Li, D.; Yang, G. Quantification and acoustic emission characteristics of sandstone damage evolution under dry-wet cycles. J. Build. Eng. 2022, 48, 103996. [Google Scholar] [CrossRef] [Scilit]
- Liu, X.; Shao, G.; Huang, J.; Su, J.; Xu, H. Stability analysis of gravity anchorage: A case study of Taizhou Yangtze River Bridge. Eur. J. Environ. Civ. Eng. 2019, 25, 1002–1024. [Google Scholar] [CrossRef] [Scilit]
- Wen, L.; Cheng, Q.; Cheng, Q.; Guo, X.; Zhang, B. In situ creep model testing for the tunnel anchor foundation of Xingkang Suspension Bridge in Luding of China. Adv. Civ. Eng. 2020, 2020, 8898777. [Google Scholar] [CrossRef] [Scilit]
- Zhou, Z.; Chen, C.; Wang, L.; Tian, Y.; Feng, H.; Wang, K. Stability analysis of gravity anchorage of a suspension bridge based on large-scale field tests. Civ. Eng. J. 2021, 30, 1. [Google Scholar] [CrossRef] [Scilit]
- Zheng, J.; Chen, W.; Zheng, K.; Zheng, J.C.; Chen, W.; Zheng, K.R.; Gu, Y.P.; Wang, F.; Huang, Z.; Li, Y. Stability analysis of gravity anchor foundation of layered argillaceous sandstone under dry-wet cycles. J. Mt. Sci. 2023, 20, 1118–1130. [Google Scholar] [CrossRef] [Scilit]
- Li, R. Study on Mechanical Responses of Gravity Anchorage Slope of Suspension Bridge Under Highway Traffic Loads. Master’s Thesis, Southwest Jiaotong University, Chengdu, China, 2018. (In Chinese) [Google Scholar]
- Jia, J.; Gao, X.; Bao, X.; Xiang, X.; Zhang, L.; Tu, B. Dynamic stability analysis method of anchored rocky slope considering seismic deterioration effect. Sci. Rep. 2024, 14, 7014. [Google Scholar] [CrossRef] [Scilit] [PubMed]
- Dan, L.; Tian, M.; Du, W.; Du, Y.; Fu, X. Static and dynamic stability analysis of the gravity anchorage slope using the three-dimensional finite element method. IOP Conf. Ser. Earth Environ. Sci. 2019, 304, 042037. [Google Scholar] [CrossRef] [Scilit]
- Xiao, W.; Wang, Z.; Wei, H. Seismic response analysis of self-anchored suspension bridge with multi-tower. Int. J. Steel Struct. 2016, 16, 1329–1338. [Google Scholar] [CrossRef] [Scilit]
- Chen, W.; Luo, S.; Gu, Y.; Zhang, Y.; Zheng, J. Dynamic stability assessment of stratified argillaceous sandstone anchorages under seismic load and dry-wet cycles. Geofluids 2025, 2025, 8854959. [Google Scholar] [CrossRef] [Scilit]
- Zhao, L. Study on Mechanical Responses of Tunnel-Type Anchorage and the Related Slope of Suspension Bridge Under Static and Traffic Load. Master’s Thesis, Southwest Jiaotong University, Chengdu, China, 2017. (In Chinese) [Google Scholar]
- JTG D60–2015; Ministry of Transport of the People’s Republic of China. General Specifications for Design of Highway Bridges and Culverts. China Communications Press: Beijing, China, 2015. (In Chinese)
- Xiao, S. Analysis on Relaxation Zone and Some Stabilizing Structures in High Rock Slope Projects. Master’s Thesis, Southwest Jiaotong University, Chengdu, China, 2003. (In Chinese) [Google Scholar]

Disclaimer/Publisher’s Note: The statements, opinions and data contained in all publications are solely those of the individual author(s) and contributor(s) and not of MDPI and/or the editor(s). MDPI and/or the editor(s) disclaim responsibility for any injury to people or property resulting from any ideas, methods, instructions or products referred to in the content. |
© 2026 by the authors. Licensee MDPI, Basel, Switzerland. This article is an open access article distributed under the terms and conditions of the Creative Commons Attribution (CC BY) license.