


Abstract
This study investigates the probabilistic seismic damage characteristics of a five-span RC simply supported girder bridge with double-column piers designed for a high-speed railway (HSR). The objective is to assess the bridge’s fragility by developing a refined nonlinear numerical model using the OpenSEES (Version 3.3.0) platform. Incremental dynamic analysis (IDA) was conducted with peak ground accelerations (PGA) ranging from 0.05 g to 0.5 g, and fragility curves for pier columns, tie beams, and bearings were developed. Additionally, a series–parallel relationship and a hierarchically iterated pair copula model were established to evaluate system fragility. The results indicate that as PGA increases, the damage probability of all bridge components rises, with bearings being the most vulnerable, followed by pier columns, and tie beams exhibiting the least damage. The models accurately simulate the correlations between members and system fragility, offering valuable insights into the bridge’s performance under seismic conditions.
1. Introduction
High-speed railway (HSR) construction in China has greatly advanced, and the operational HSR is expected to reach 50,000 km by 2025. To avoid line crossings, ensure track regularity, and protect the ecosystem along the line, HSR lines mostly use bridges instead of earthworks. Simply supported beam bridges have the advantages of simple structures, more standardized spans (which are conducive to prefabrication), etc., so they account for 90% of all HSR bridges.
To meet the requirements for bridge stiffness for traffic safety, gravity-type piers with reinforcement rates less than 0.5% are widely used in China’s HSR bridges, and double-column piers are increasingly used to circumvent the shortcomings of regular piers, such as their heavy self-weight, bulky appearance and their high requirements for ground bearing capacity. Common forms of double-column piers include cover beam double-column piers and cross tie beam double-column piers. The former have cover beams at the top of the pier to support the upper structure and transfer all the loads evenly to the lower structure; the latter have cross tie beams between the double-column piers to reduce the calculation height of the column and decrease the length-to-slenderness ratio, thereby improving their transverse stiffness and overall stability.
To understand the damage characteristics of simply supported girder bridges with double-column piers and improve their seismic performance, different scholars have conducted relevant studies. Yuan et al. [1] and Shen et al. [2] found that the top displacement of a double-column pier was smaller than that of a single-column pier and that its displacement ductility was better through comparative analysis of the seismic response of a single-column pier and a double-column pier bridge. Chen et al. [3] noted that the damage probability of single-column bridge piers and bearings is greater than that of double-column piers under the same ground motion intensity. Shi [4] and Wang et al. [5] summarized the earthquake damage performance of double-column pier RC bridges during the Wenchuan earthquake and major earthquakes abroad and reported that the damage to tie beams was mainly caused by the crushing of nearby piers and cracking at pier–beam joints. Through experiments and vulnerability assessments, Xie and Sun [6] and Ye et al. [7] found that an additional shear beam can also effectively reduce the seismic damage of the double-column pier of the cover beam.
In addition, in the study of the vulnerability of double-column pier simply supported girder bridges, Shen et al. [8] conducted a vulnerability analysis of a tie girder double-column pier bridge based on the Nataf transform and found that the damage probability of the pier at the pier base and tie girder were reduced to some extent when considering the structural parameter correlation. Chen et al. [9] noted that the damage probability of a double-column pier increases with the decreasing height of the cross tie beam and that increasing the number and stiffness of the tie beams could reduce the damage probability. Hu et al. [10] reported that under the same ground motion intensity, the bearings of double-column pier simply supported girder bridges are more vulnerable than are the bearings of piers, and the probability of bearing damage increases with increasing pier height. Lu et al. [11] established the vulnerability curve of a highway bridge based on random forest models and found that different types of piers and tie beams lead to changes in the weak area of the column. The root of the tie beam of the double-column pier and the joint area are weak areas, and the bottom of the pier of the bent pier is a weak area. Through seismic vulnerability analysis, Zhang et al. [12] reported that the damage probability of double-column piers decreases with increasing tie beam height, and the damage probability of piers with two tie beams is lower than that with one tie beam.
Previous research has primarily concentrated on the vulnerability analysis of bridge components under seismic actions. Nevertheless, in actual practice, the overall performance of bridges is also influenced by other long-term factors. For instance, corrosion [13,14,15] reduces the strength of concrete and steel, thereby impacting the bridge’s durability; long-term service loads [16,17] affect the load-bearing capacity and fatigue performance of the bridge over time; and material aging [18] can cause degradation, further compromising the safety and functionality of the bridge. Recognizing the presence and potential impact of these factors is essential for a comprehensive assessment of bridge component performance. The above studies involved vulnerability analyses of structural members. It is not sufficient to judge the overall seismic performance of the structure by the vulnerability of the components, and it is necessary to evaluate system vulnerability [19]. At present, the methods for bridge system vulnerability analysis mainly include the first-order boundary method [20], the Monte Carlo sampling method [21], and the copula function method [22]. The Monte Carlo sampling method requires a large number of numerical calculations. The first-order boundary method uses a conservative method to describe the seismic vulnerability of the system, but when there are more members, the upper and lower bounds obtained by this method are wider, and the system susceptibility is significantly overestimated.
Research in the literature shows that the displacement ductility of double-column piers of simply supported girder bridges is generally better than that of single-column piers, but the damage distribution characteristics and energy dissipation mechanisms of double-column piers under different ground motion intensities have yet to be studied. The vulnerability analysis conducted thus far has considered only the vulnerability of piers and the double elements of bearings, has not included the influence of tie beams or cover beams, and has not yet comprehensively analyzed the probabilistic damage characteristics of the whole bridge system; therefore, relevant research urgently needs to be carried out.
In this paper, a tie beam-type two-column pier five-span RC simply supported girder bridge was used, for which a refined nonlinear numerical model was established based on the OpenSEES (Version 3.3.0) platform to carry out an incremental dynamic analysis of the whole bridge structure. A probabilistic seismic demand analysis was conducted to generate the vulnerability curves of piers, tie beams, and bearings at different damage stages, the series–parallel relationships among the members and the pair copula hierarchical iterative model were established, and the copula joint probability distribution function was used to carry out a systemic vulnerability analysis of the whole bridge, which revealed the probabilistic seismic damage characteristics of the bridge.
2. Engineering Background and Finite Element Modeling
2.1. Engineering Background
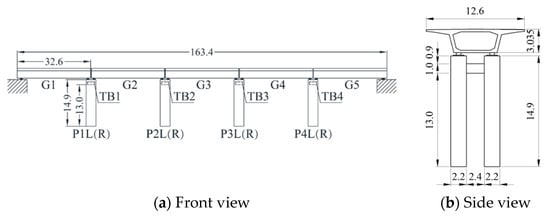
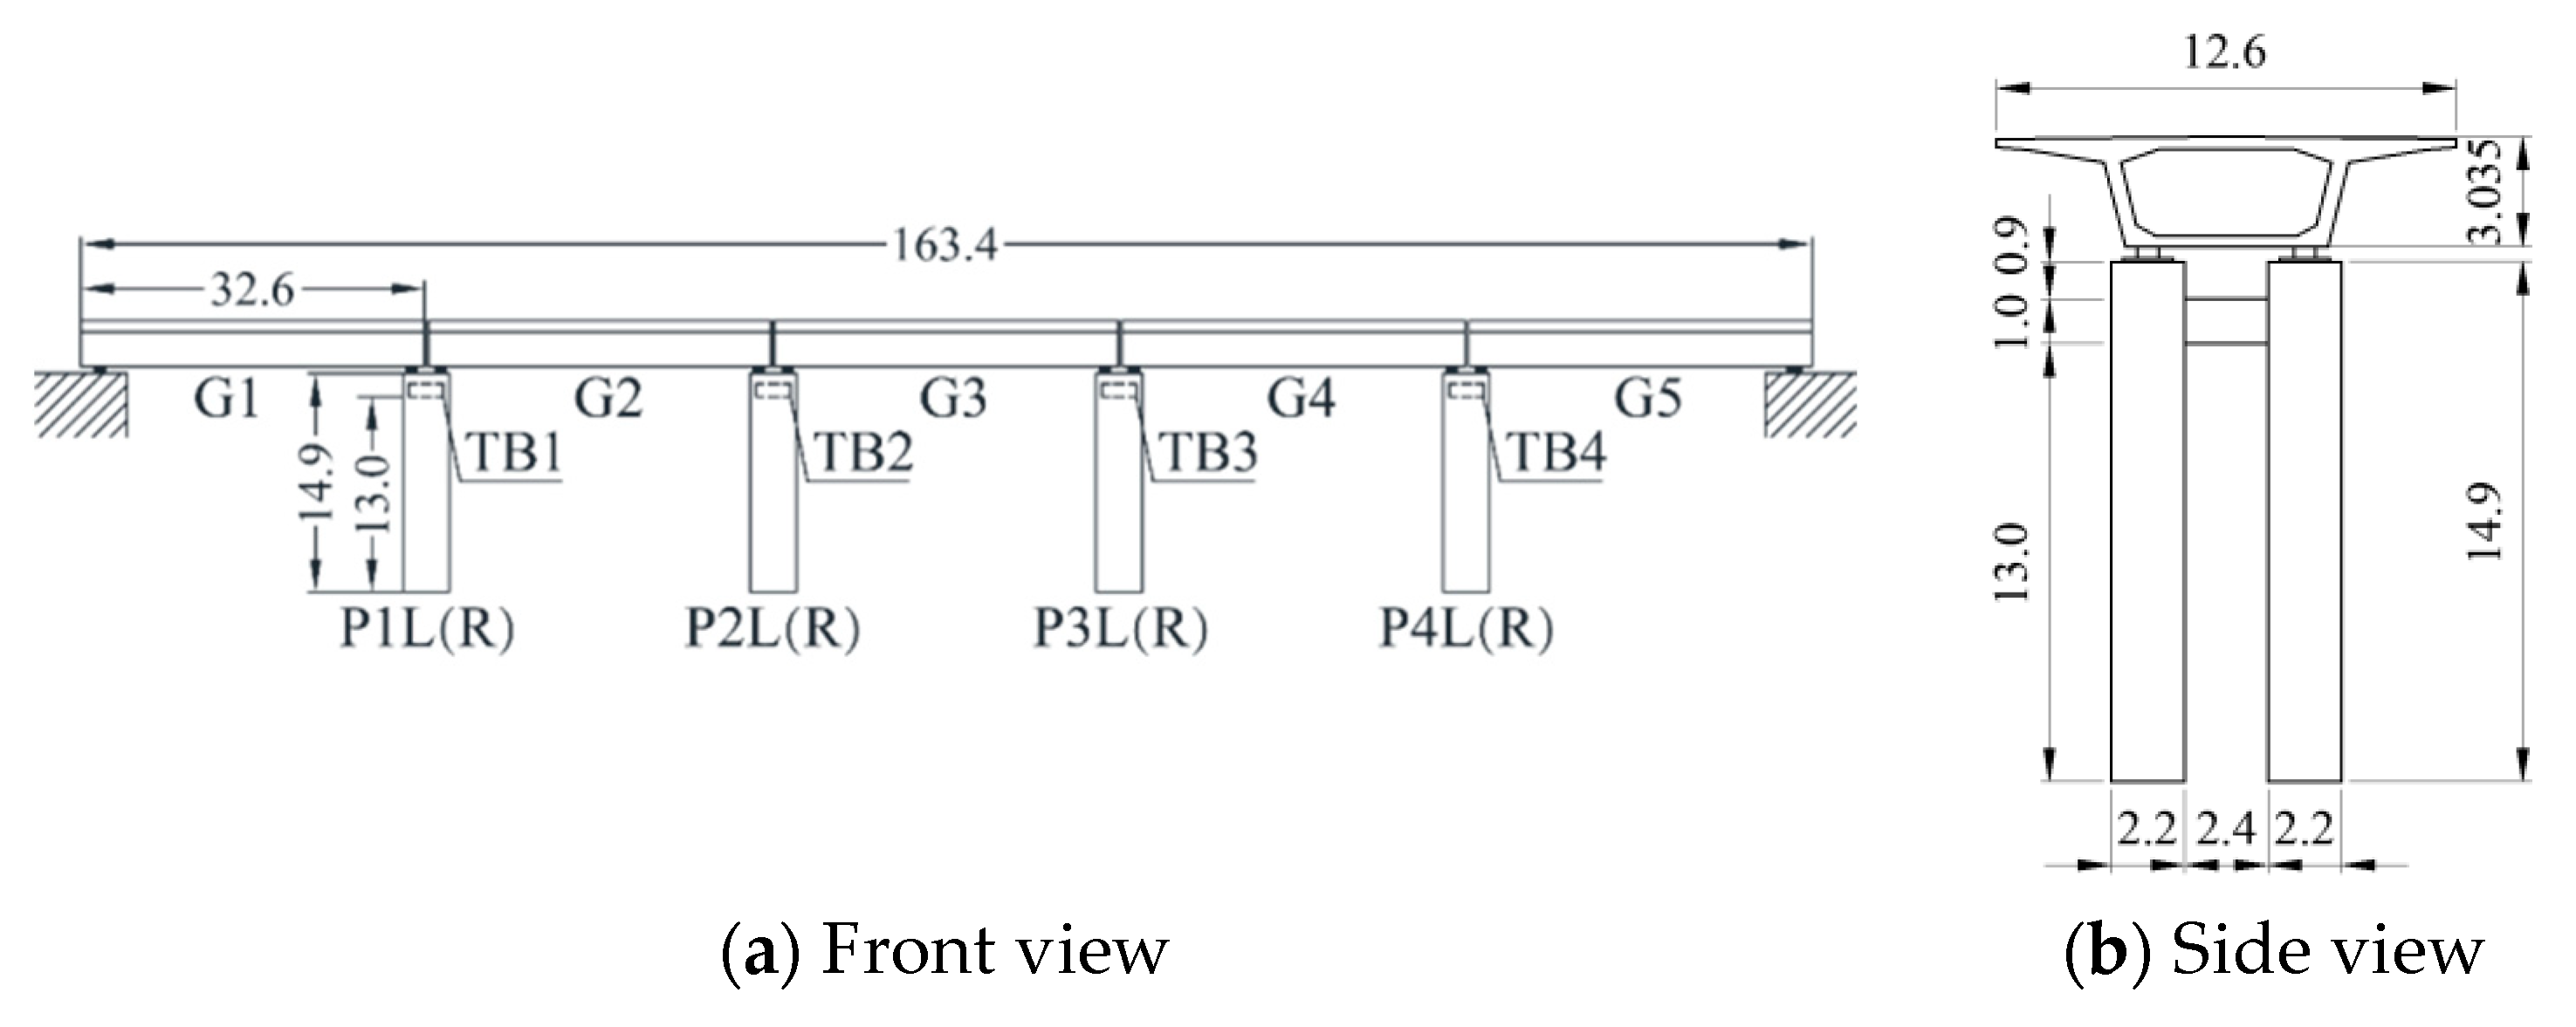
Figure 1 shows the overall layout of 5 span (single span 32 m) HSR double-column pier RC simply supported girder bridge, where the basic earthquake intensity is 7 degrees and the site class is Class II. The main girder is a C50 concrete single-box single-chamber simply supported box girder with a deck width of 12.6 m and a girder height of 3.035 m. The piers and tie beams are made of C35 concrete with 16 mm diameter HRB335 longitudinal reinforcement and 12 mm diameter HPB235 hoop reinforcement. The cross-sectional dimensions of the pier column are 2.2 m × 3.3 m, and the height is 14.9 m. The cross-sectional dimensions of the tie beam are 1.0 m × 2.7 m, and the length is 2.4 m. The bottom of the tie beam is located at a pier height of 13 m. To facilitate the following descriptions, the main girders are numbered G1, G2, G3, G4, and G5, the left (right) side piers are numbered P1L(R), P2L(R), P3L(R), and P4L(R), and the tie beam is numbered TB1, TB2, TB3, and TB4.
Figure 1.
Schematic diagram of the bridge layout (unit: m).
The bearings of the whole bridge are PZ6000 basin-type rubber bearings, with one fixed bearing (GD), one transverse movable bearing (HX), one longitudinal movable bearing (ZX), and one multidirectional movable bearing (DX) under each span of the beam, as shown in Figure 2.
Figure 2.
Schematic diagram of the bearing layout.
2.2. Finite Element Modeling
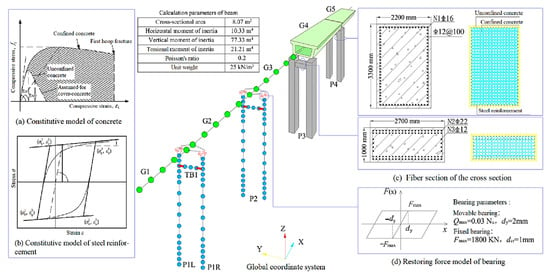
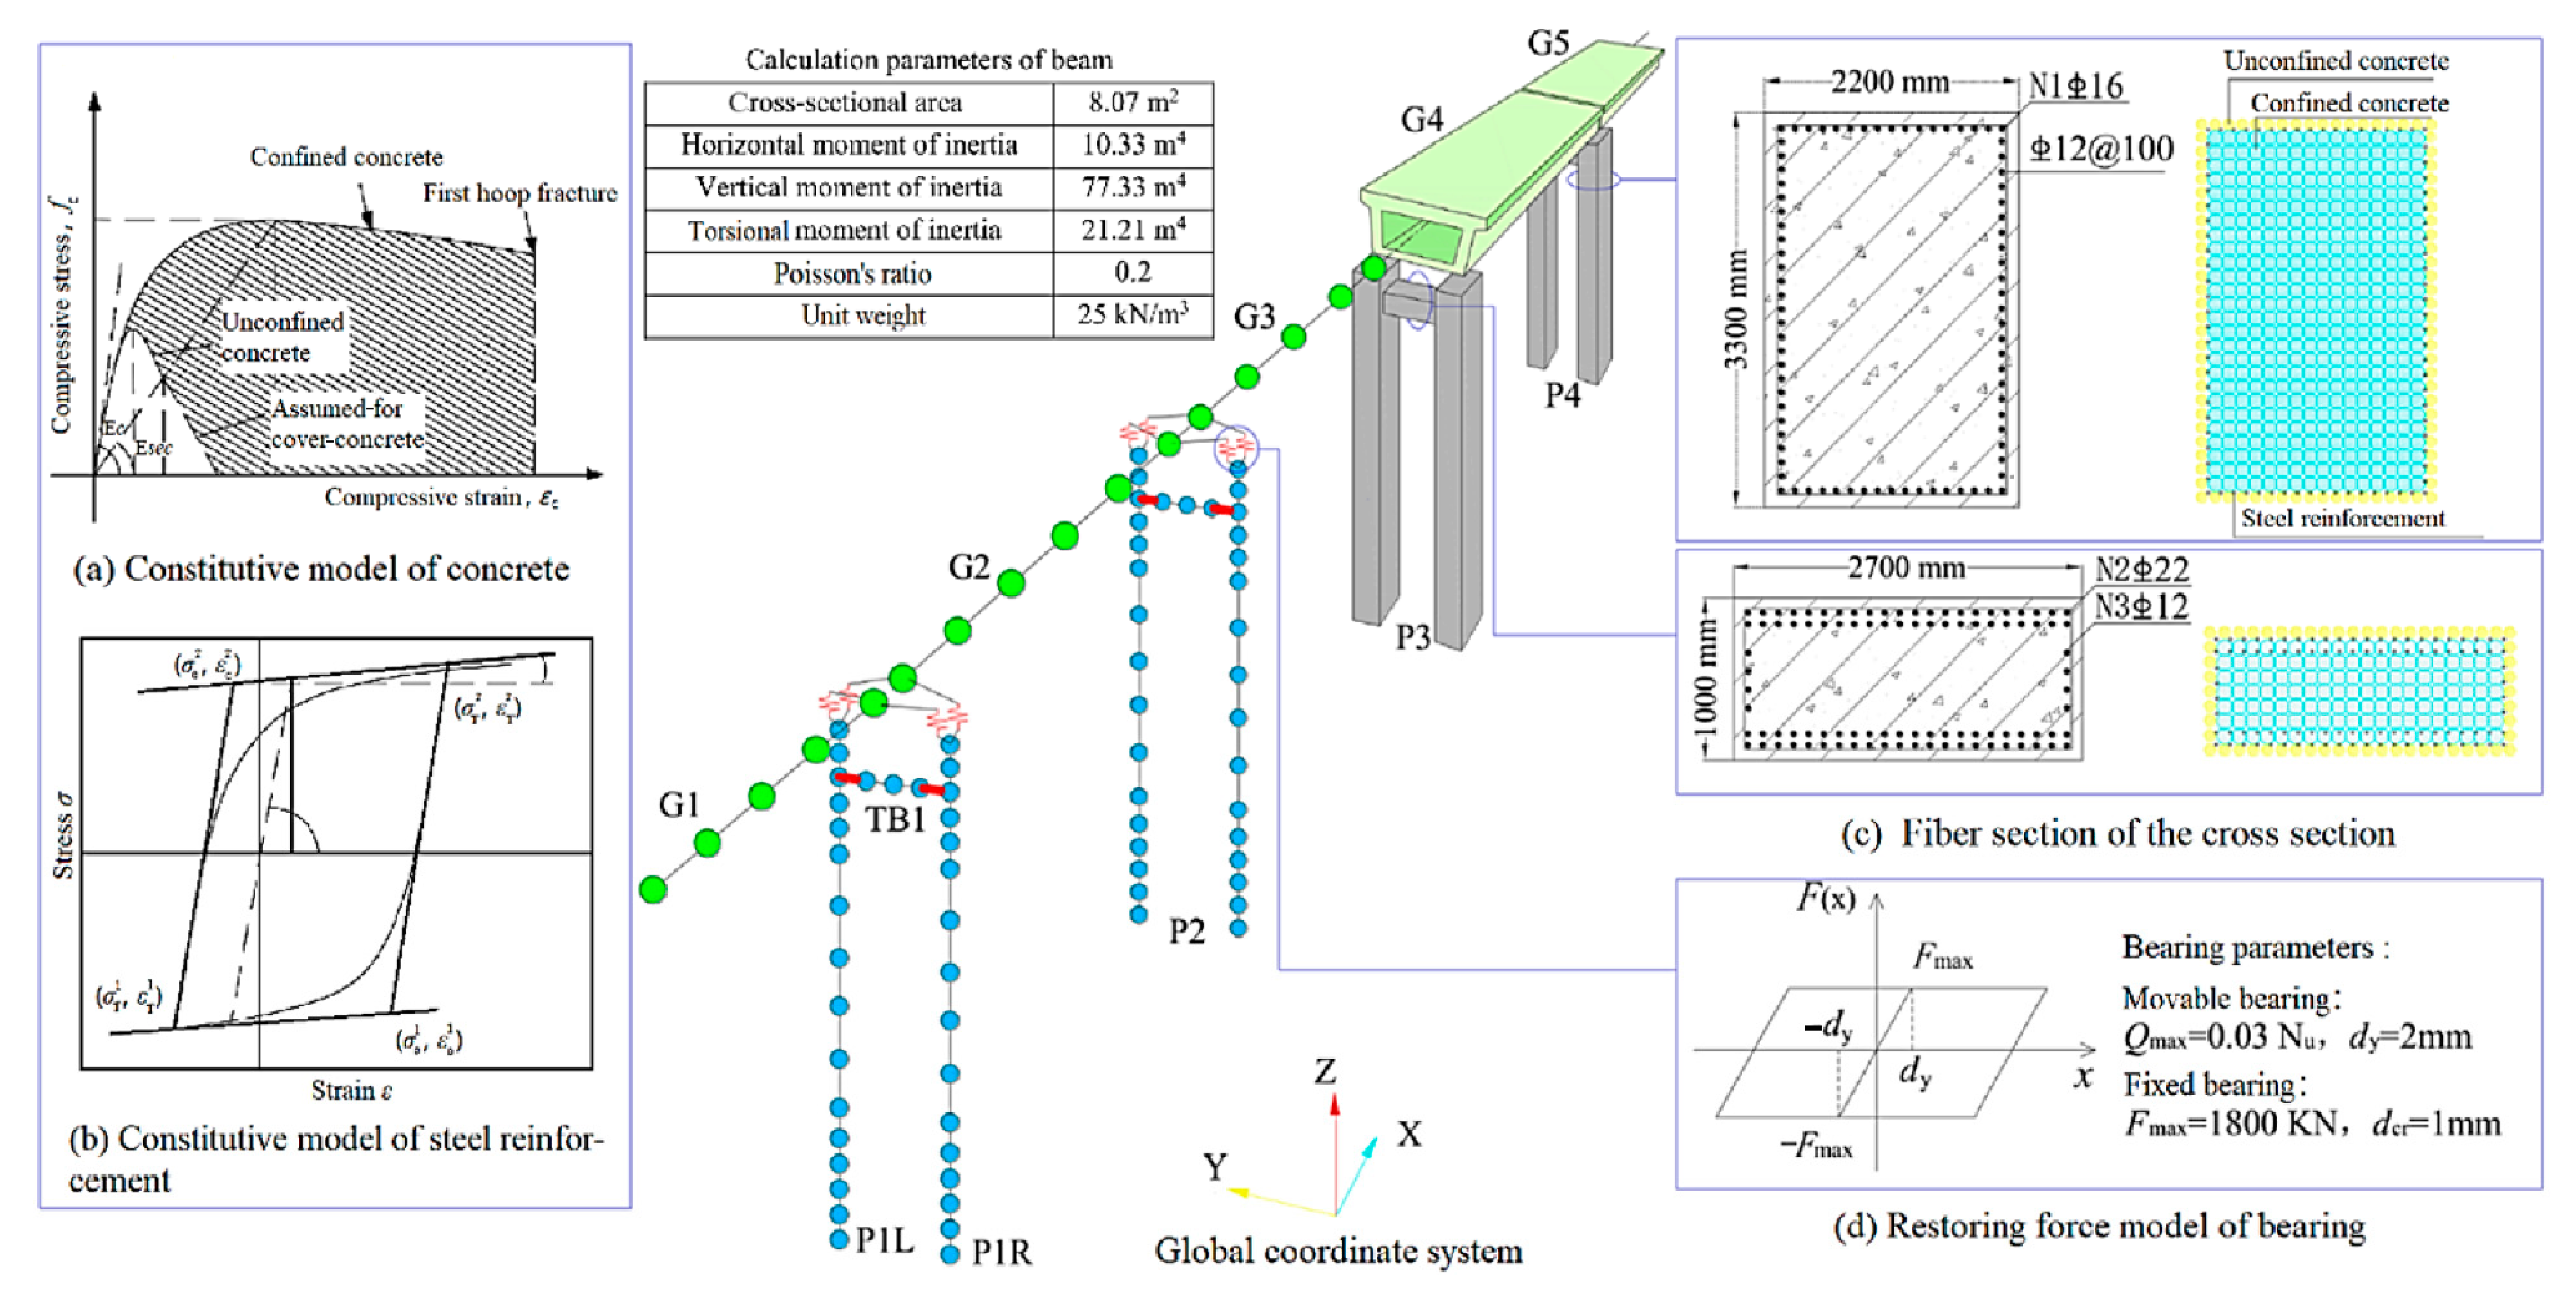
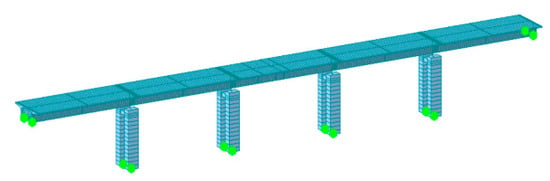
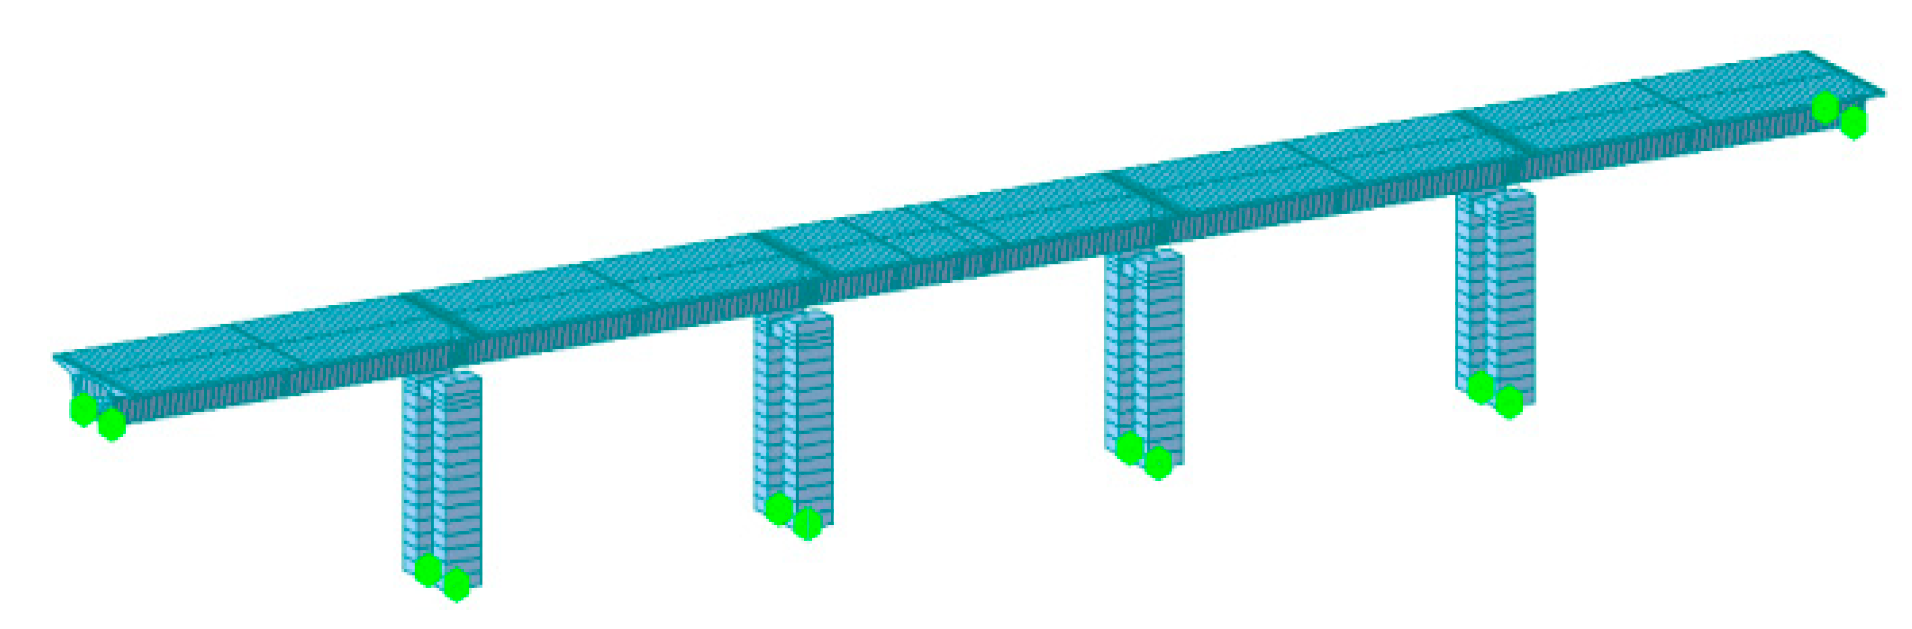
A 3D finite element refined model of the bridge was established based on the OpenSEES platform, as shown in Figure 3. The nonlinear behavior of the piers and tie beams was simulated with fiber beam–column units based on the stiffness method under seismic effects, where the cover and core concrete were simulated with “Concrete 04” based on the Mander model [23], and the steel reinforcement was simulated with “Steel 02” based on the modified Giuffré–Menegotto–Pinto model simulation [24]. The supports were simulated using zero-length units based on ideal elastoplastic materials (details are shown in Figure 3d). Since the main girder of a simply supported beam usually does not suffer severe damage under earthquake action except for the occurrence of a falling beam and can basically maintain a linear elastic state, the main girder was simulated by an elastic beam–column unit. The mass weight of the moving vehicle is relatively small compared with the mass of the bridge, and the randomness is strong. Moreover, when the earthquake occurs, the probability of driving on the bridge is low, and such earthquake damage has not occurred before [25,26], so it is not considered in this paper. The influence of abutment and track constraints on the seismic performance of bridges is ignored. The base of the pier is fixed.
Figure 3.
Finite element model of the bridge.
To validate the above model, a finite element model of the bridge was also established by Midas Civil, as shown in Figure 4. By calculating the self-oscillation characteristics of the structure, it was found that the first-order vibration patterns of the OpenSEES model and Midas model are full bridge longitudinal drifts, and the first-order self-oscillation periods are 0.425 s and 0.413 s, respectively. The first four modes are the same, and the maximum difference rate of the first five self-oscillation periods is 2.81%, as shown in Table 1, which better verifies the model built.
Figure 4.
Schematic diagram of the finite element model in Midas.
Table 1.
Comparison of the first five periods and vibration modes.
3. Selection and Input of Ground Motion
In accordance with the characteristics of the bridge site and the normative acceleration response spectrum under the design earthquake [27], 50 sets of earthquake records were selected in the PEER strong-motion database according to the following criteria: (1) the site class is Class II, and the selected ground motion shear wave velocity is 250~500 m/s; (2) to select strong-motion records, the moment magnitude Mw is 6.5~8.0; and (3) to make the selected earthquake records reflect the ground motion characteristics of the bridge site project as comprehensively as possible; the basic information of the selected seismic records is shown in Table 2.
Table 2.
Basic information of the selected ground motions.
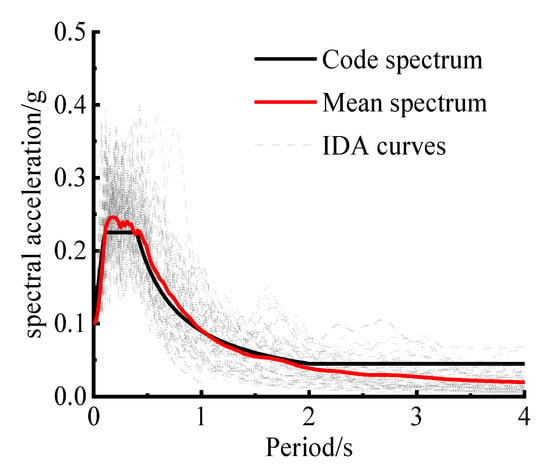
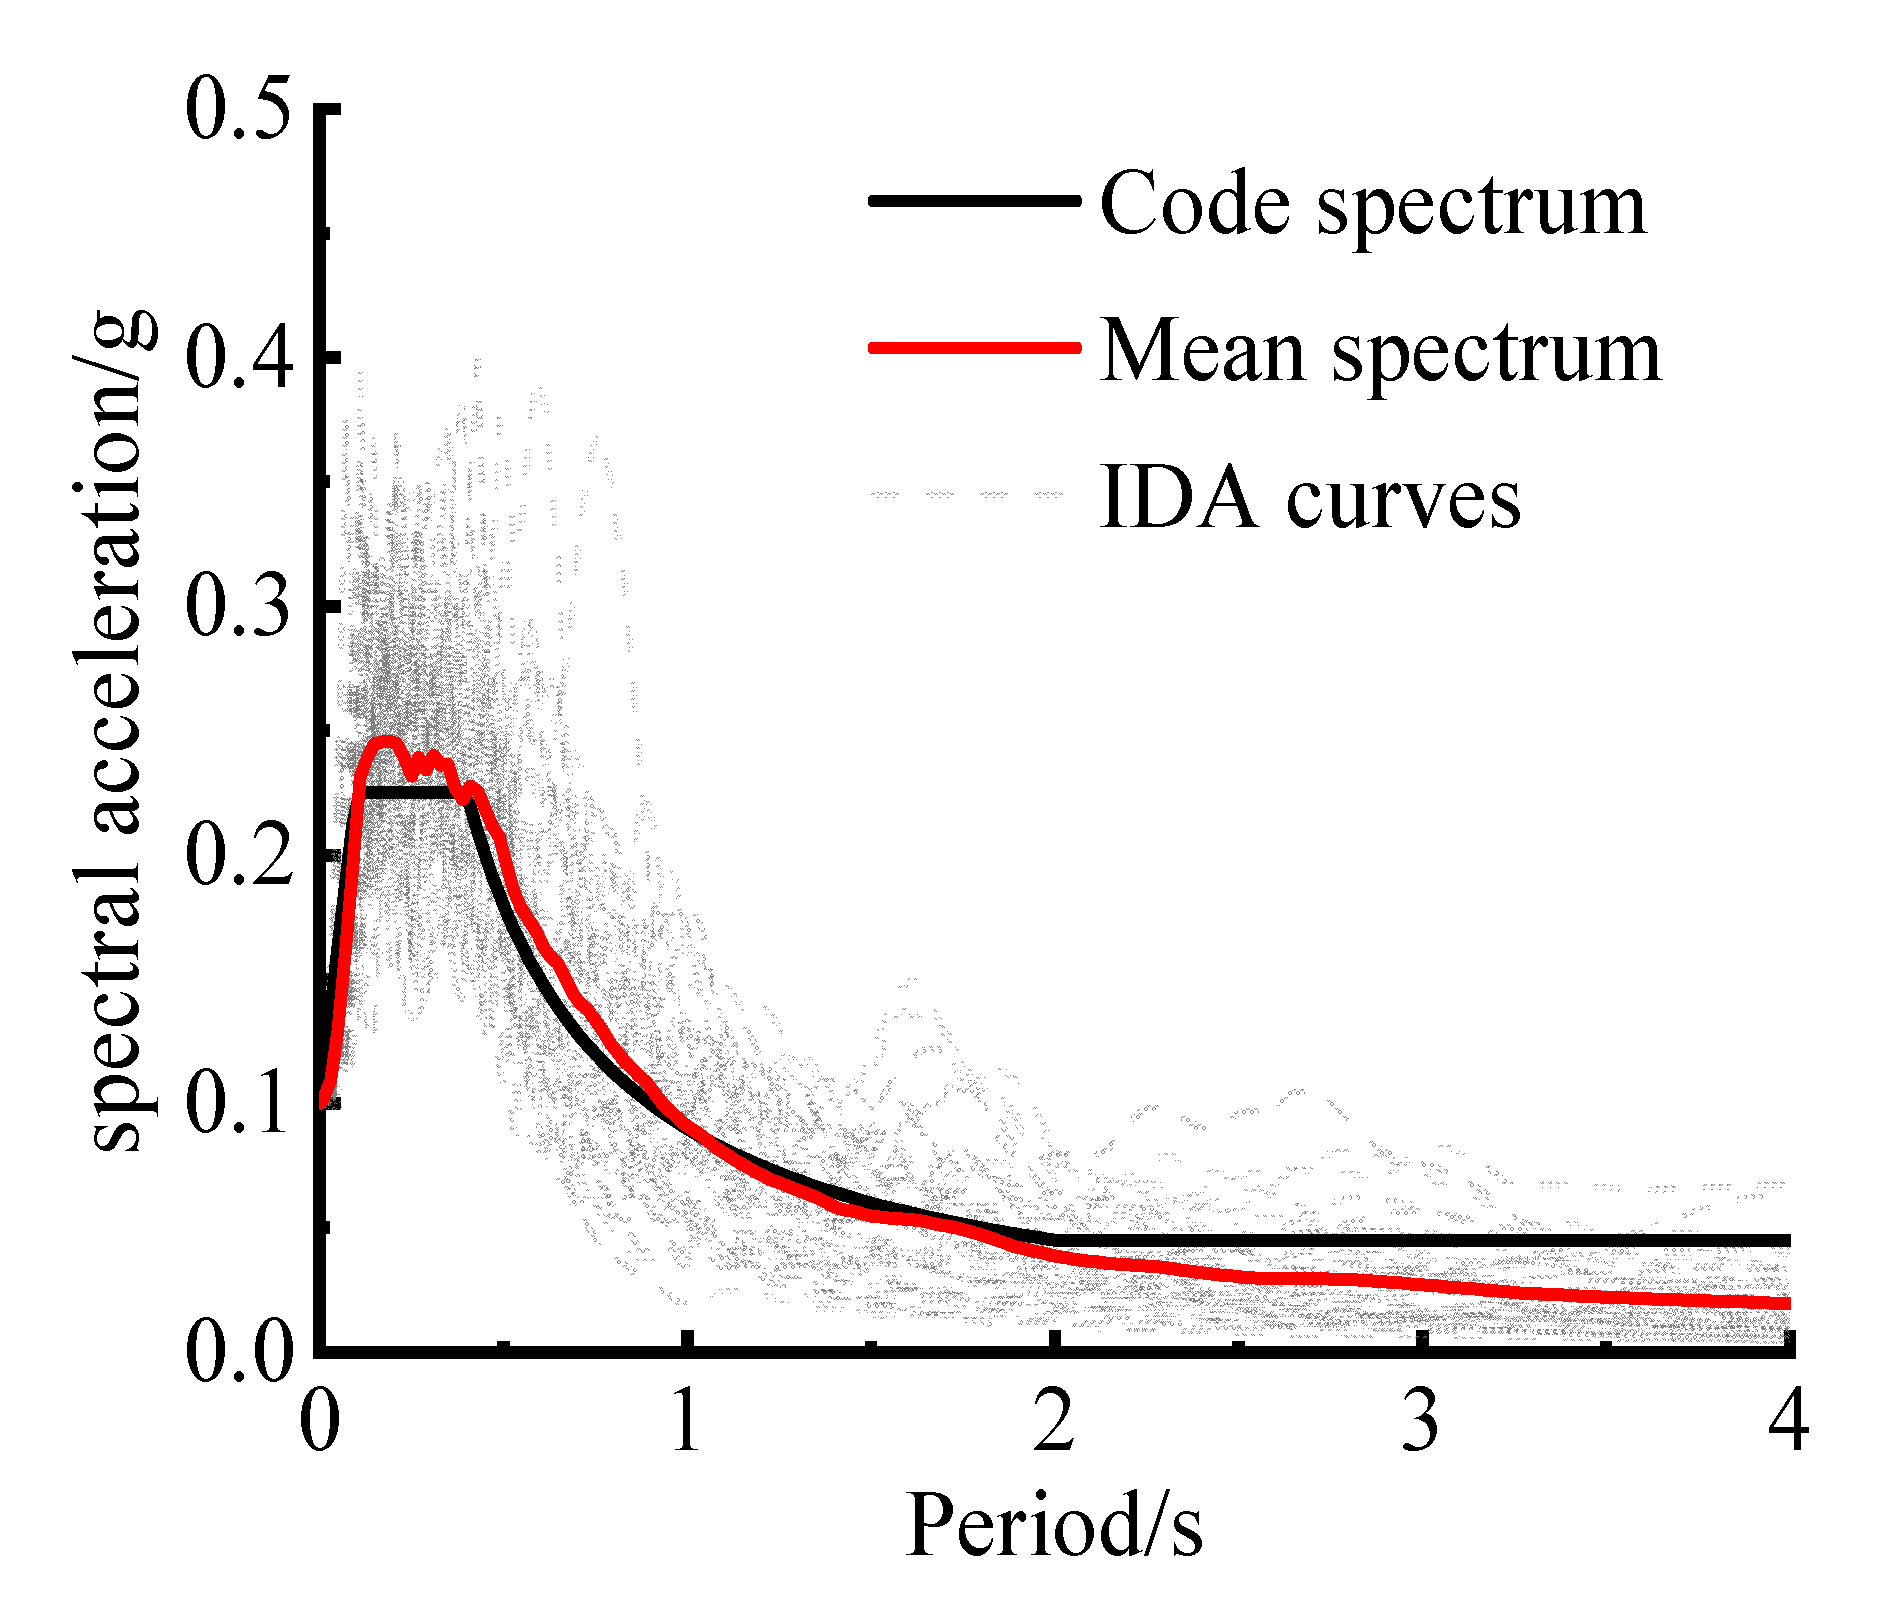
A comparison of the mean spectrum of the selected seismic records with the standard response spectrum is given in Figure 5. The results show that the two are well fitted in the platform section and the basic self-oscillation period section of the structure [28], that the mean difference rates do not exceed the limit of 10% specified by the relevant standard, and the selected seismic records can better reflect the ground motion characteristics at the bridge site.
Figure 5.
Comparison between the acceleration mean spectrum of ground motions and the code spectrum.
4. Member IDA and Fragility Curve
4.1. Member Damage Evaluation Index
According to the actual seismic damage of existing bridges and the mechanical properties of different members, this paper considers piers, tie beams, and bearings as the fragile members of double-column pier simply supported girder bridges [4], and the damage stages are divided into “no damage”, “minor damage”, “moderate damage”, “severe damage”, and “complete damage” [21].
4.1.1. Piers and Tie Beams
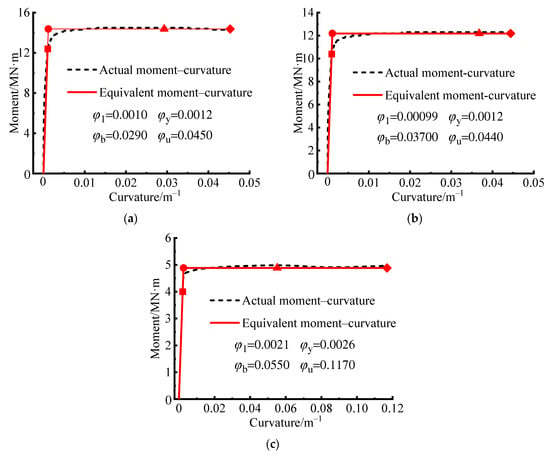
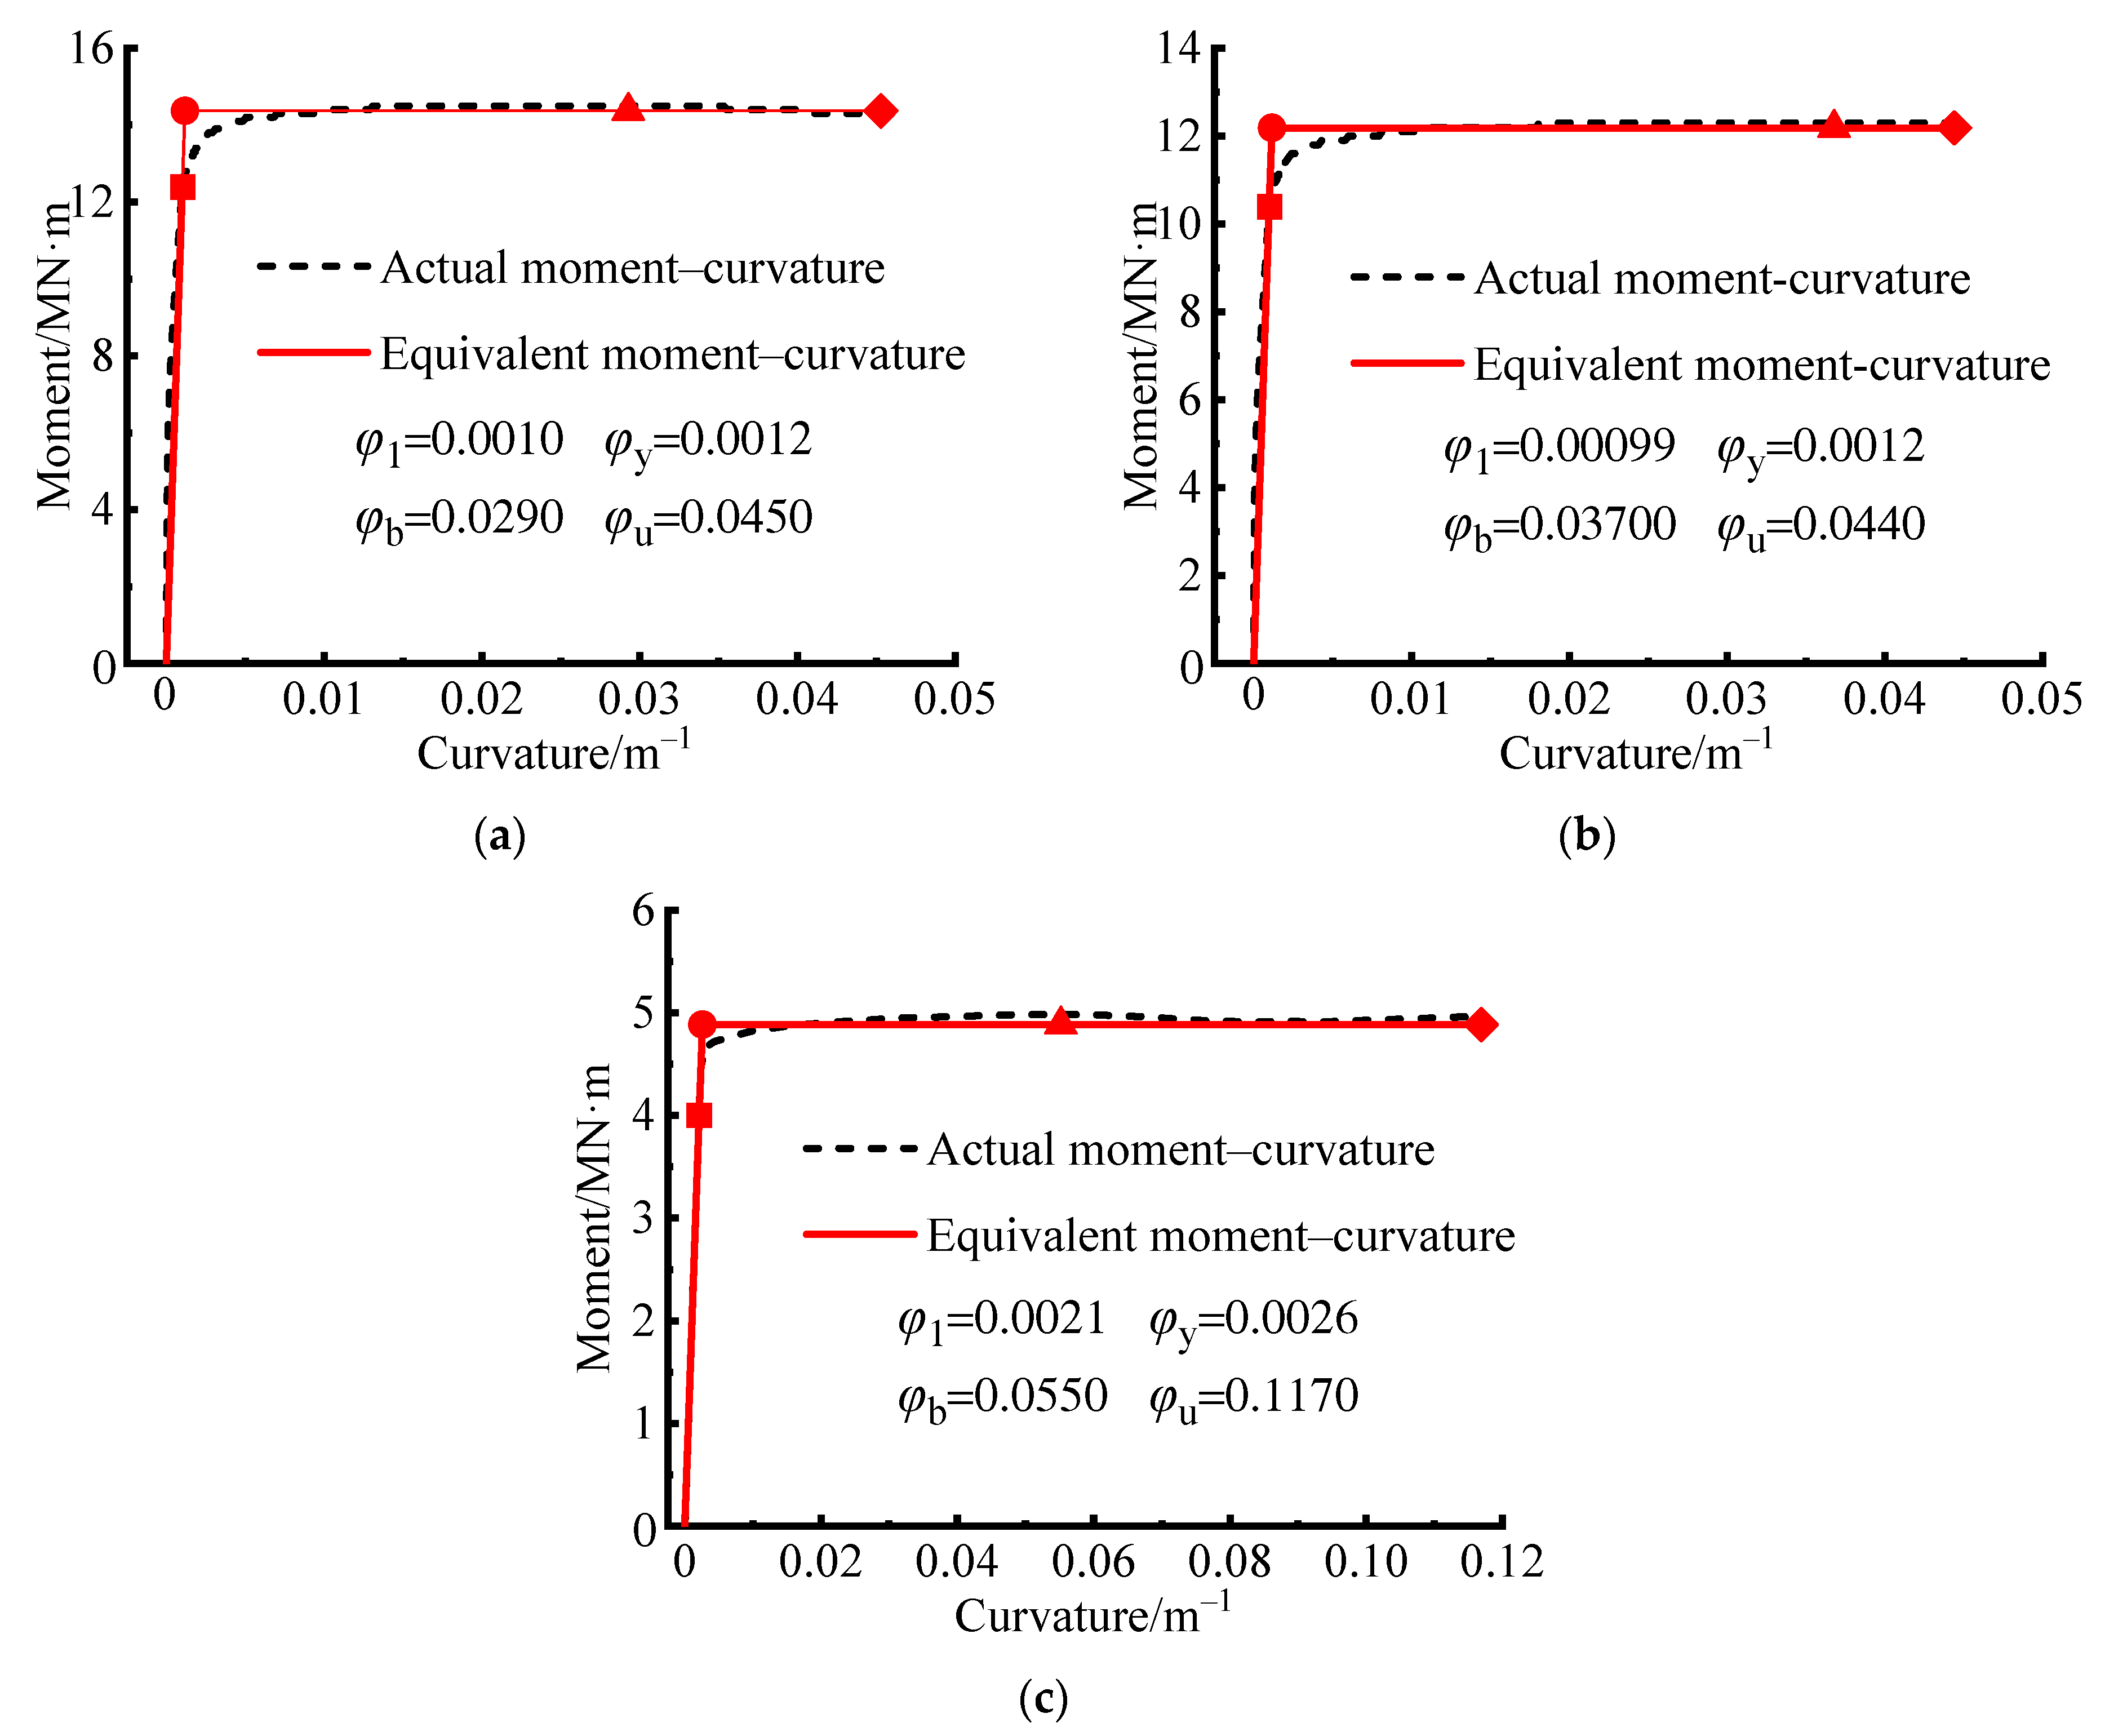
Studies have shown that section curvature, material strain, and member displacement can be used to assess the damage stage of structures and members. In non-seismically isolated bridge structures, piers and tie beams are usually designed as ductile members according to the principle of capacity protection, and their damage modes are mostly bending damage [29]; thus, curvature is chosen as the damage index for both, and the following curvatures obtained from the moment–curvature analysis of the critical section are used as the damage limits, with the damage characteristics and criteria for various damage states detailed in Table 3: the curvature of the first yielding of the longitudinal rebar φ1 is defined as the limit of minor damage, the equivalent yield curvature φy is defined as the moderate damage limit, the curvature of the protective layer concrete spalling φb is defined as the severe damage limit, and the ultimate yield curvature φu is defined as the limit of complete destruction [30].
Table 3.
Damage characteristics and criteria for various damage states.
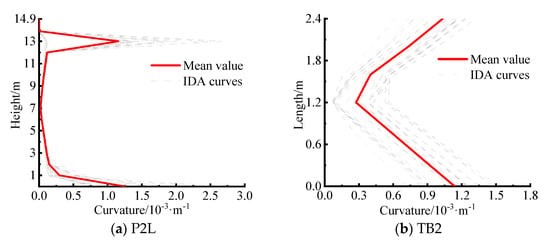
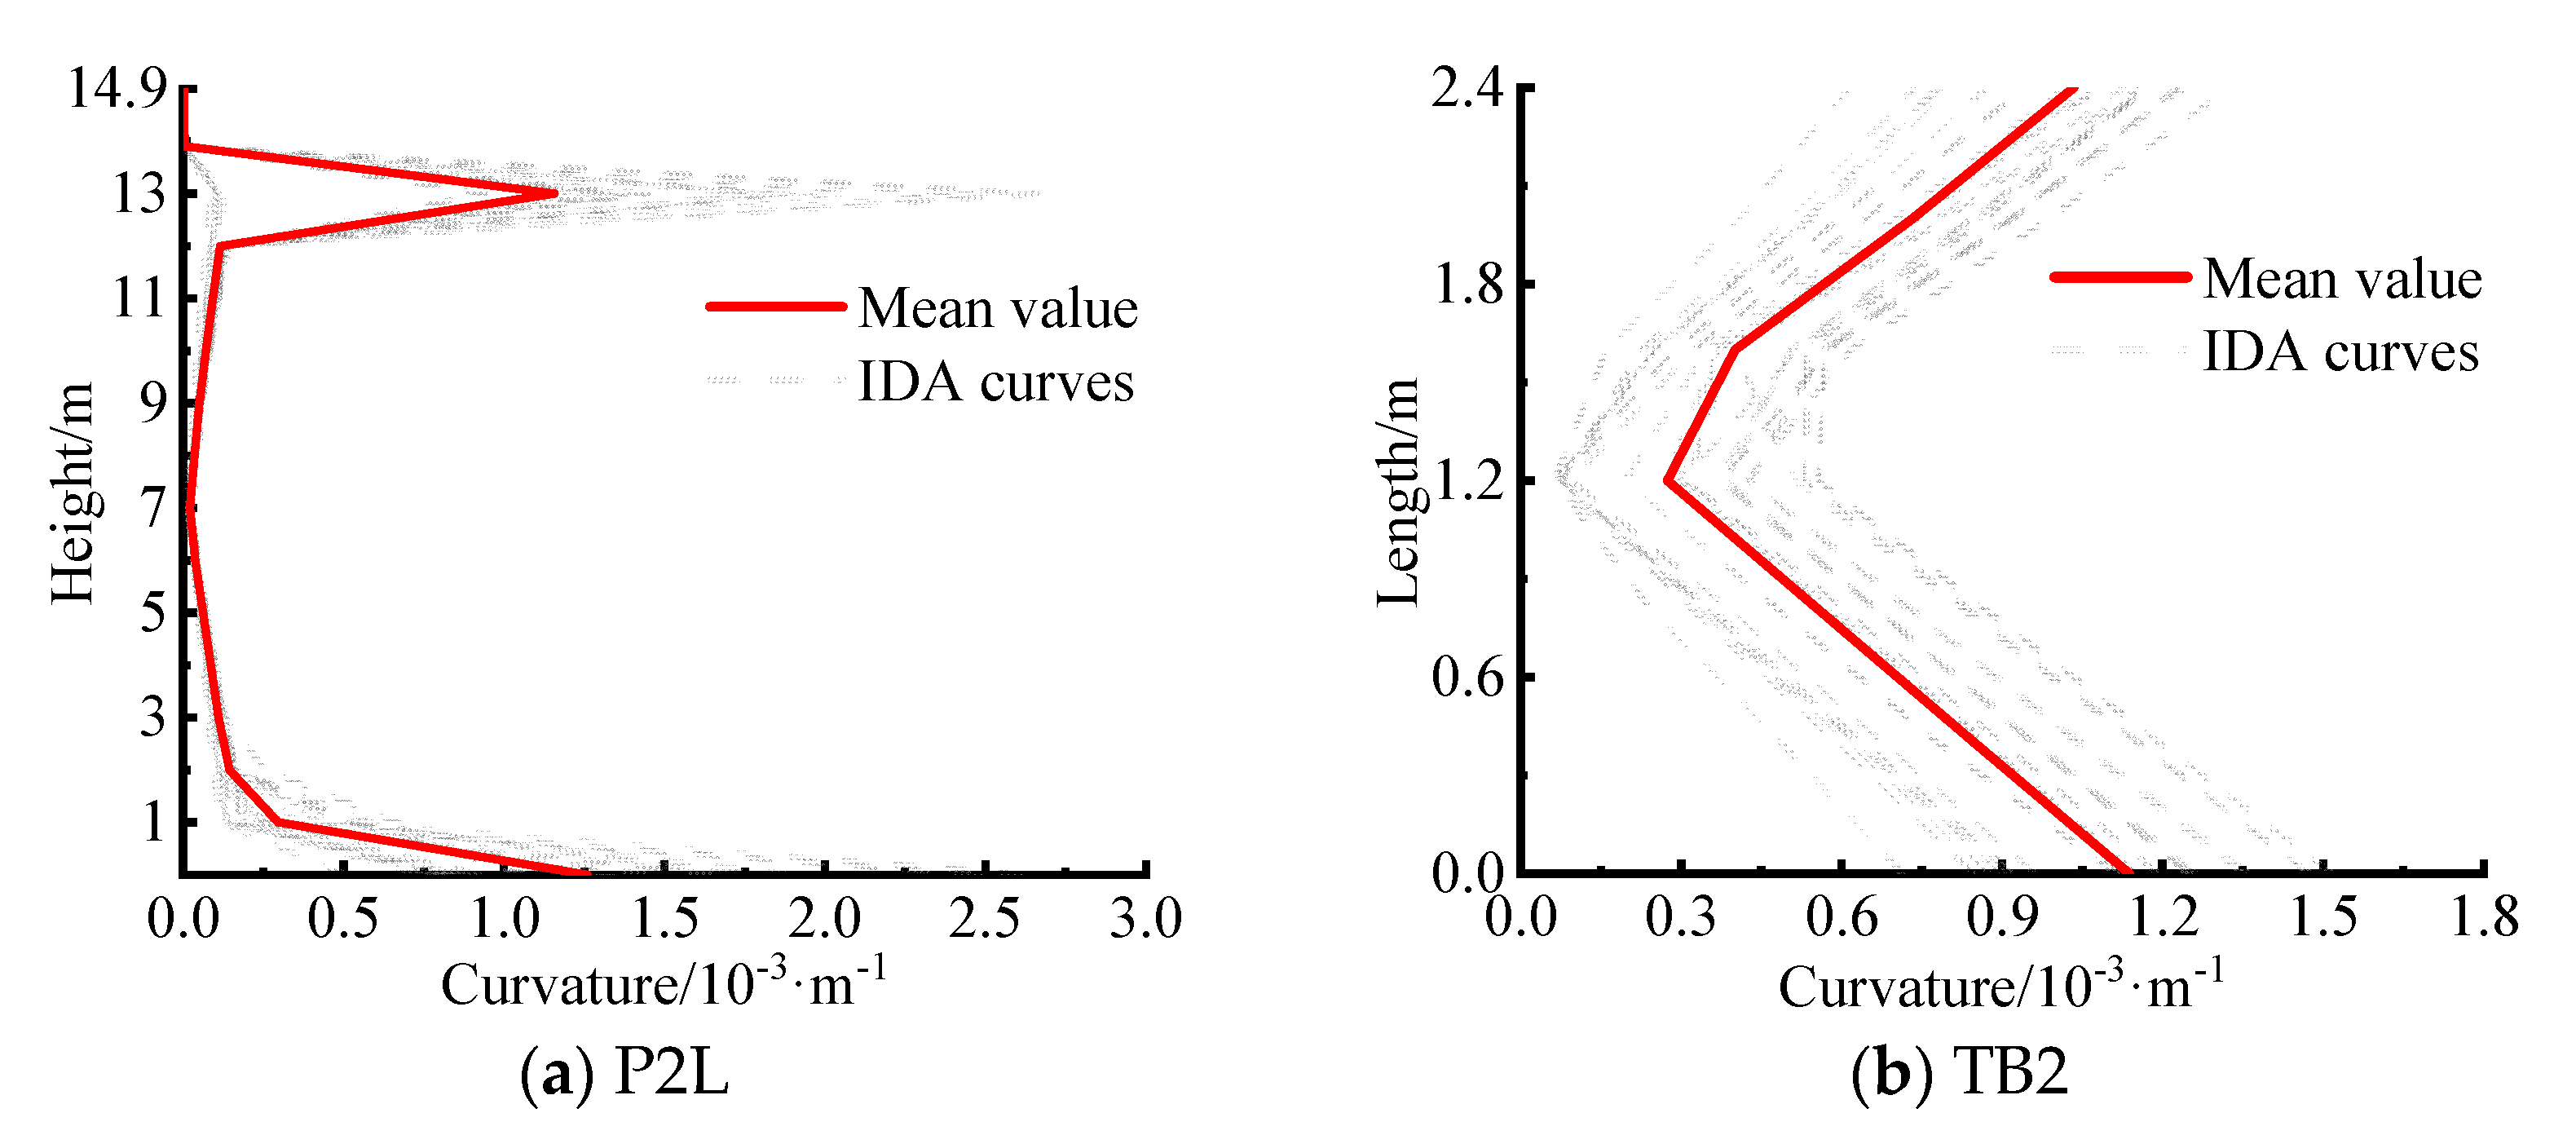
To determine the key control sections of pier and tie beam damage, the ground motion PGA is adjusted to 0.1 g (design earthquake), dynamic time analysis is carried out with transverse, longitudinal, and vertical inputs (as below), and the curvature responses of piers at different heights and tie beams at different lengths are obtained. Since the longitudinal seismic response characteristics of single- and double-column piers are similar and the tie beam mainly affects transverse stiffness and stability [31], this paper focuses on the transverse response and damage characteristics (the same applies below). Taking the P2L pier and TB2 beam as examples, the transverse curvature envelope is given in Figure 6. The curvatures of the bottom section of the pier and the bottom section of the pier and tie beam (pier section at 13 m high) and the two end sections of the tie beam are significantly greater than those of the other locations of the pier and tie beam. The remaining sections of each pier and tie beam also show similar distribution patterns and are consistent with the findings of references [4,32], so the above sections can be identified as the key sections of the pier and tie beam.
Figure 6.
Curvature envelopes of the pier columns and tie beams.
To quantify the damage stage limits at all levels of the critical sections, a moment–curvature analysis is carried out using Xtract software (Version v.3.0.8), and the resulting transverse moment–curvature curves and damage index limits are shown in Figure 7.
Figure 7.
Bending moment–curvature diagrams of key sections for pier columns and tie beams. (a) Pier bottom section. (b) Pier and tie beam bottom section. (c) Section at both ends of tie beam.
4.1.2. Bearings
All the bridge bearings are basin-type rubber bearings, and according to the type of bearing and mechanical properties, the displacement is used as the damage index [33,34]. For the fixed bearing and the inactive direction of the movable bearing, the limit value of “minor damage” is 1 mm (yield displacement); the limit value of moderate damage is 6 mm when the concrete pad stone shows slight cracks; the limit value of severe damage is 20 mm when the body of the bearing is seriously deformed, the pad stone is seriously broken, and the strength of the bearing is reduced; and the limit value of complete damage is 40 mm [34,35]. The limit of the active direction of the movable bearing is determined by the bearing size parameters, the expansion joint width, the allowable displacement of the anti-fall beam devices, the pier beam lap length and other parameters; the specific values are shown in Table 4.
Table 4.
Displacement limits of bearings at different damage stages (unit: m).
4.2. IDA
In IDA, the commonly used ground motion intensity indicators include the peak acceleration (PGA) and spectral acceleration Sa(T1), which correspond to the fundamental period of the structure. Compared with Sa(T1), the PGA is easy to obtain, intuitive and simple to use, and can better reflect the characteristics of ground motion, so the PGA is chosen as the ground motion intensity index in this paper. Considering the case of the bridge at a seismic intensity of 7 degrees and a design earthquake basic acceleration of 0.1 g, this paper carries out IDA by increasing the PGA values of 50 groups of ground motion from 0.05 g step by step (increment 0.05 g) to 0.50 g, with a total of 500 sets of working conditions.
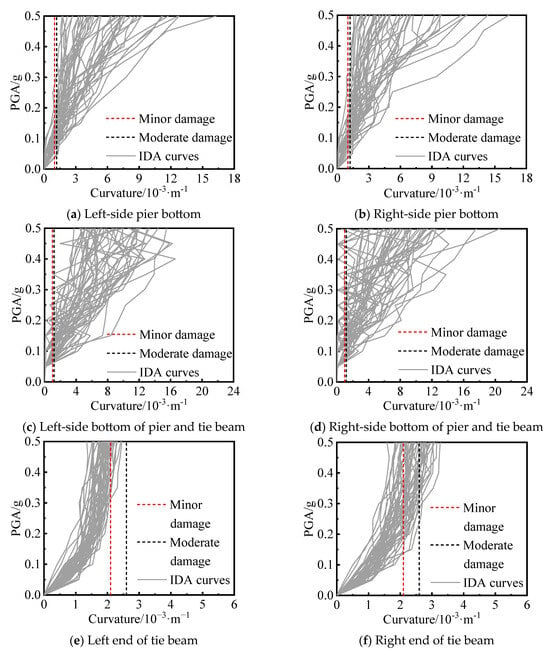
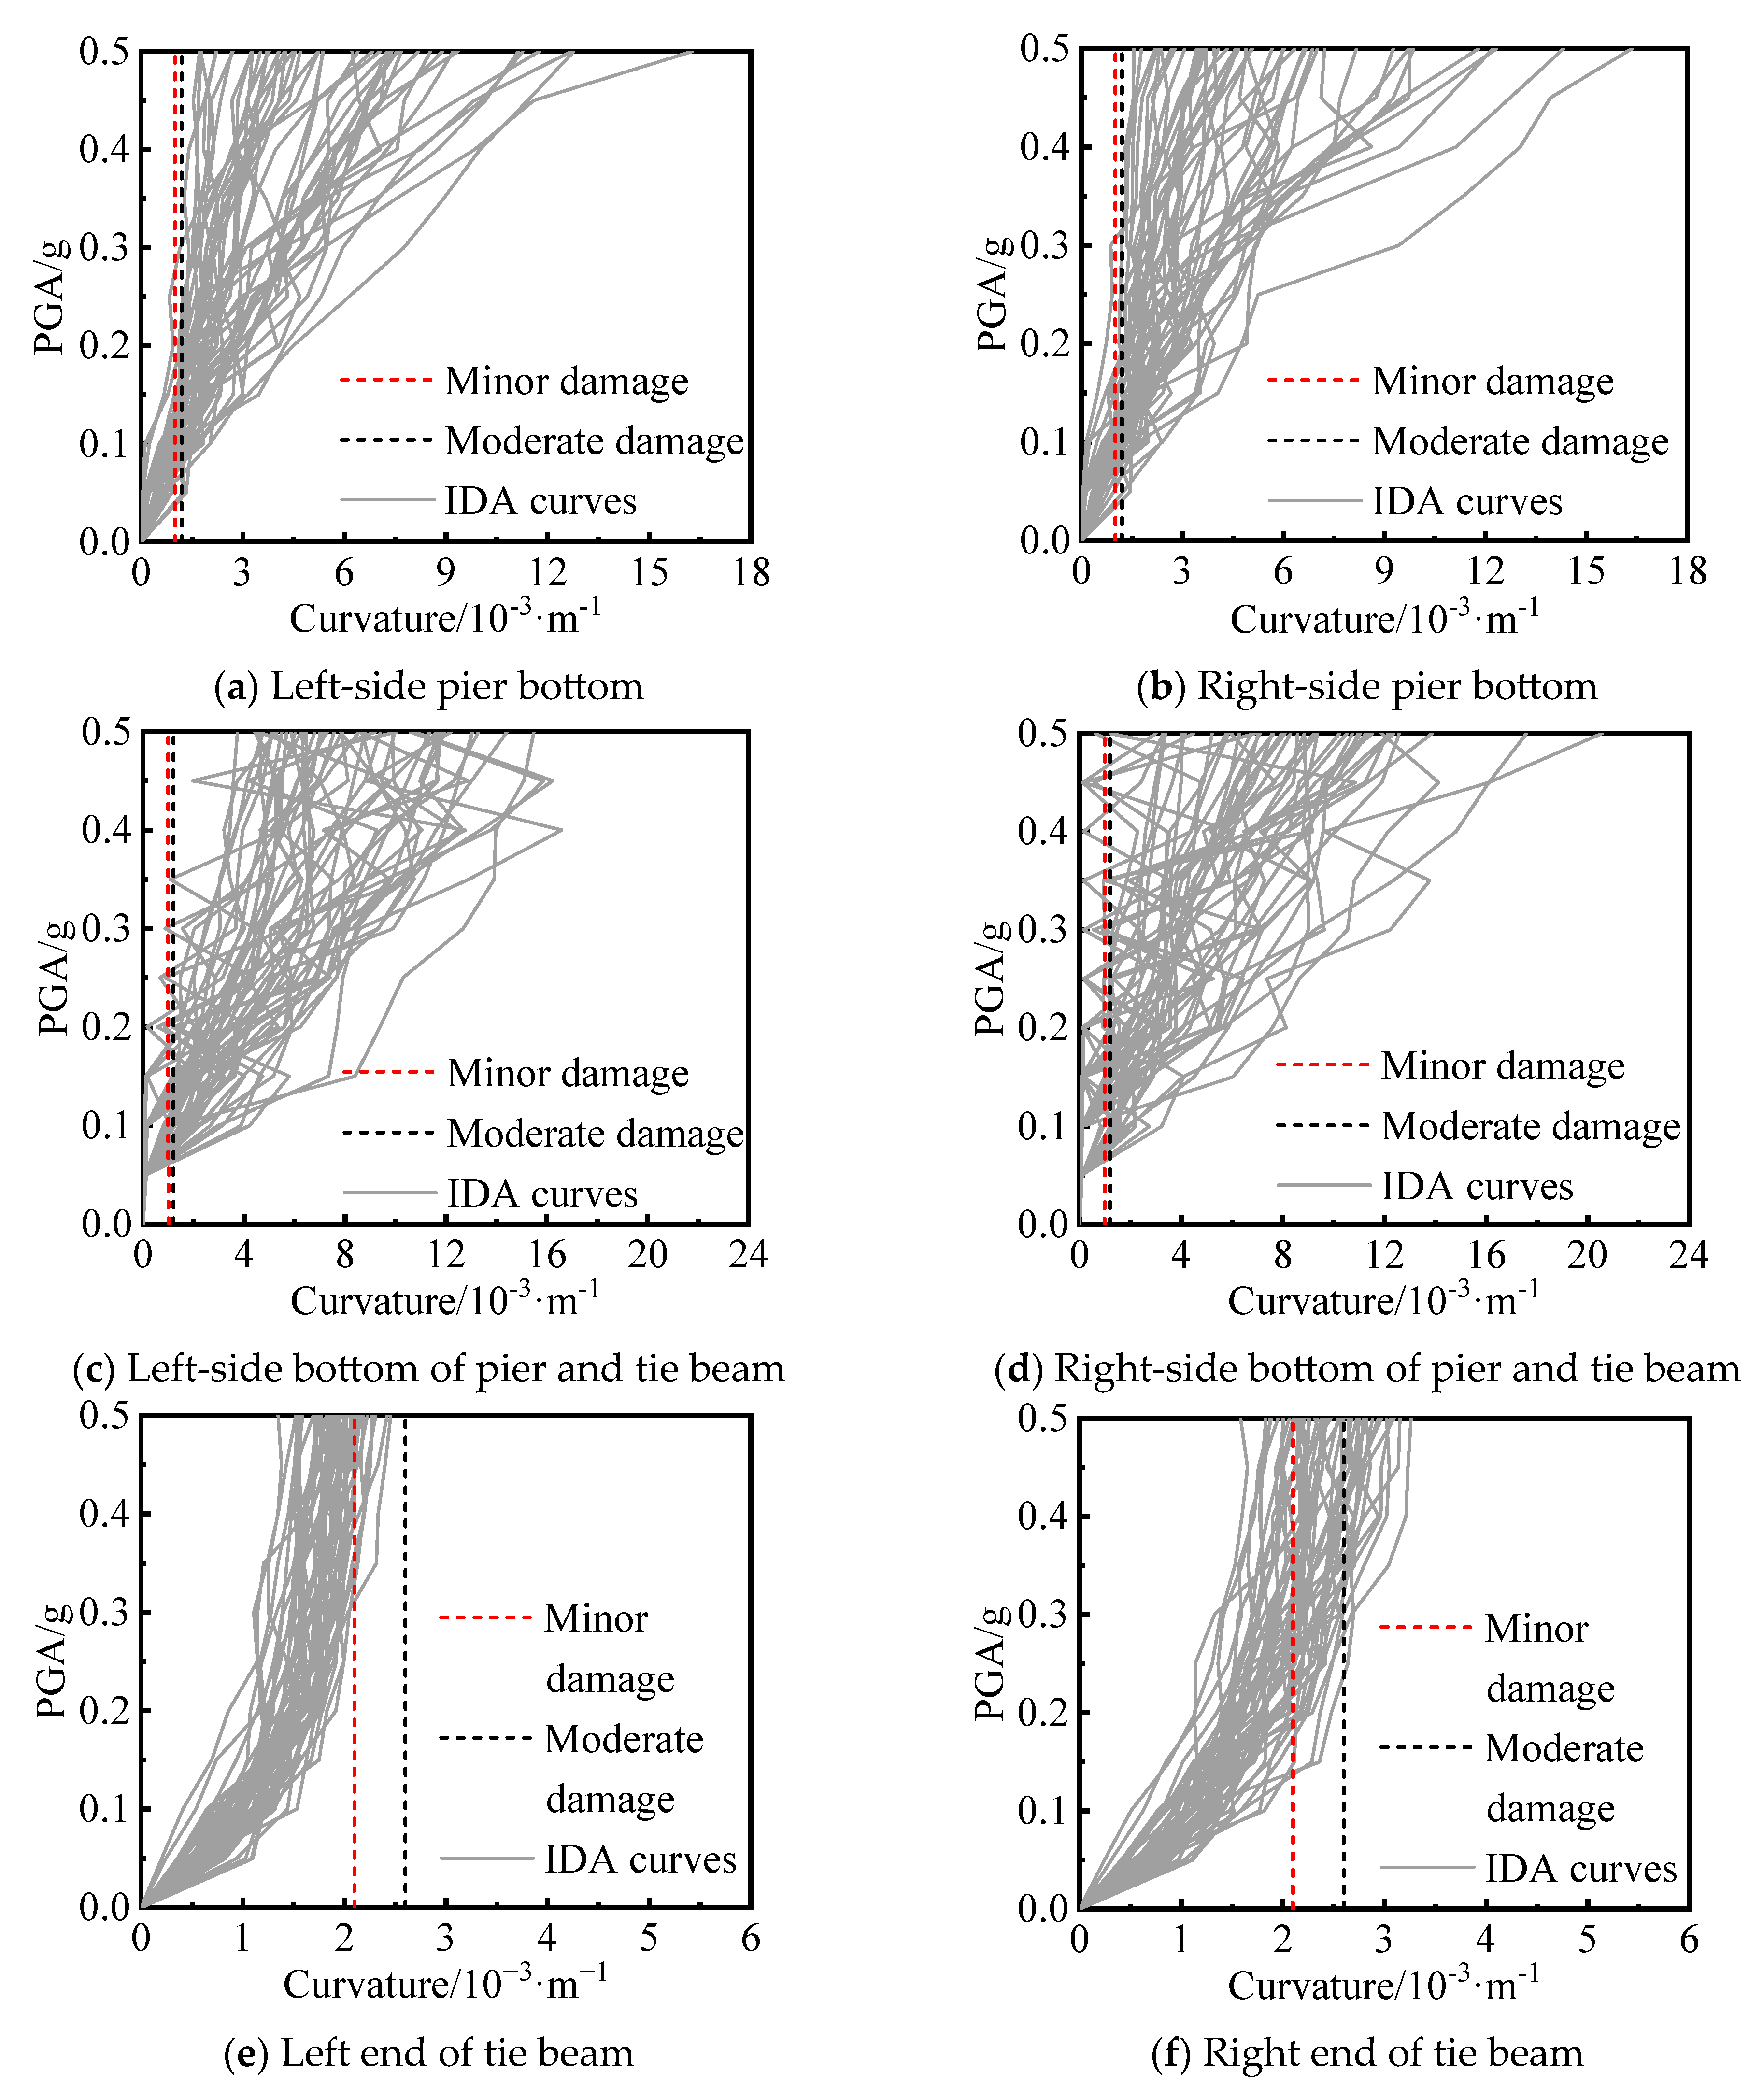
Figure 8 shows the distribution of the transverse curvature of each key section under different PGAs, taking P2 and TB2 as examples. The curvatures of the key sections of the piers and tie beams show an overall increasing trend with increasing PGA. When the PGA is in the range of 0 to 0.05 g, the cross-section of the pier and tie beam is in the elastic stage, with a small dispersion of IDA curves. When the PGA is in the range of 0.05 g to 0.10 g, the pier gradually develops from elastic to plastic, and the dispersion of the curve increases. When the PGA is 0.50 g, the curvatures of the pier bottom and pier and tie beam bottom sections are less than their curvature limits in severe damage; at this time, the longitudinal tendons on the tensile side yield, and the concrete produces cracks, but the concrete in the core area is not crushed. The change in curvature of the key section of the tie beam is not sensitive to the increase in PGA, and the IDA curve does not display an obvious yield point; therefore, the beam is basically in an elastic state. When the PGA > 0.2 g, due to the pier yielding to reduce the damage to the tie beam, the curve displays obvious “hardening” behavior; that is, the curvature with increasing PGA basically remains unchanged.
Figure 8.
IDA curves of key sections for pier columns and tie beams.
4.3. Member Susceptibility Curve
The seismic susceptibility of a bridge structure can be defined as the conditional probability that the seismic demand D of the structure exceeds the capacity limit C of a certain damage stage when the ground motion intensity IM is a specific value, as shown in Equation (1).
Assuming that the seismic demand D and seismic capacity C obey a log-normal distribution, Equation (1) can be expressed as
where
where a and b are the regression parameters of a large number of seismic response results; φ is the standard normal distribution function; and Sd, Sc and βd, βc are the median value and logarithmic standard deviation of the seismic demand and structural seismic capacity, respectively. When the PGA is the seismic strength index, is 0.5.
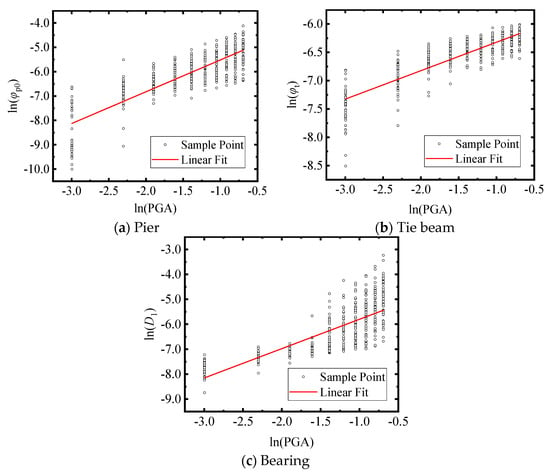
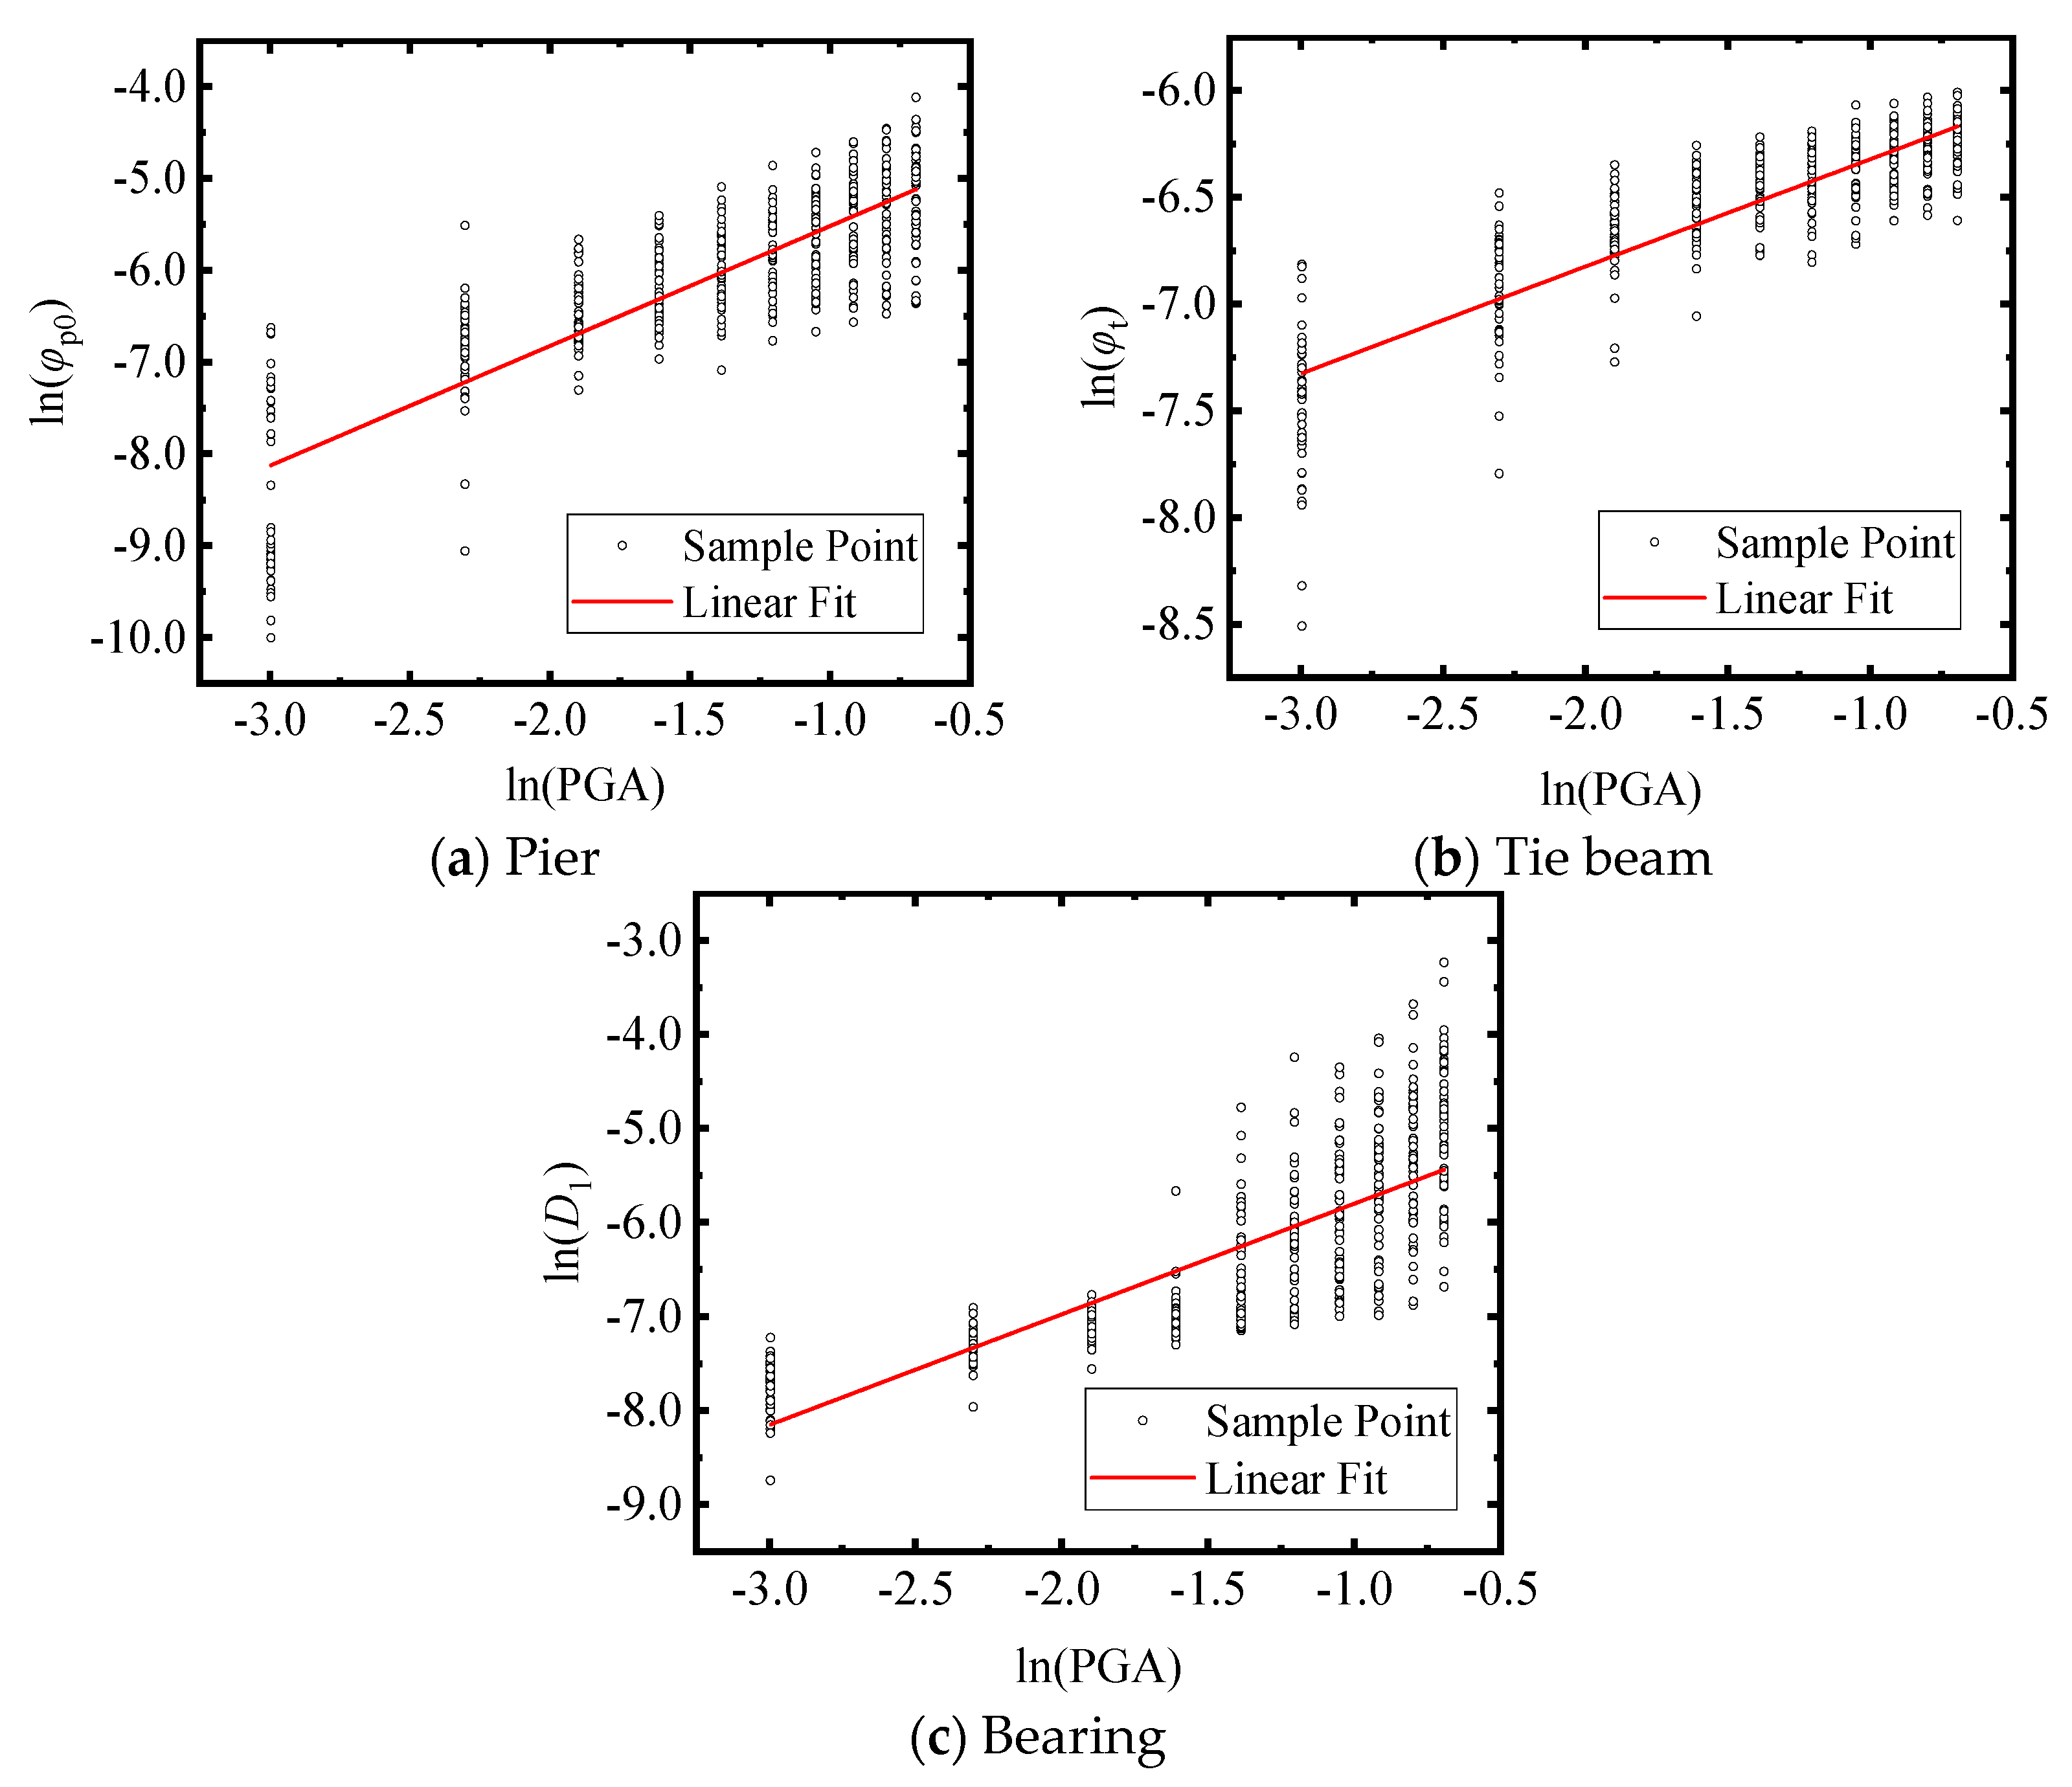
The maximum dynamic response of the component and the corresponding peak ground motion intensity record are extracted, and regression analysis is carried out in logarithmic space. The probabilistic seismic demand model is shown in Figure 9, and the regression parameters are shown in Table 5.
Figure 9.
Probabilistic seismic demand models of the bridge components.
Table 5.
Regression parameters.
4.3.1. Pier Column
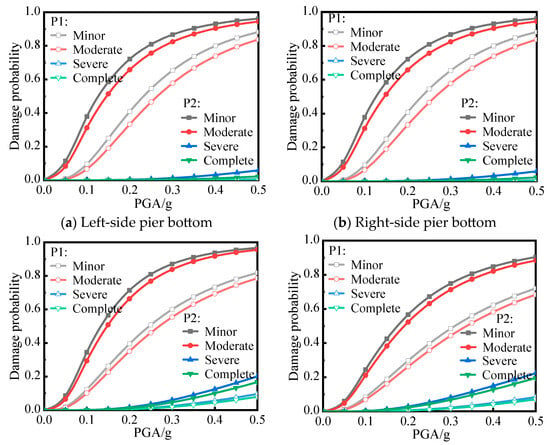
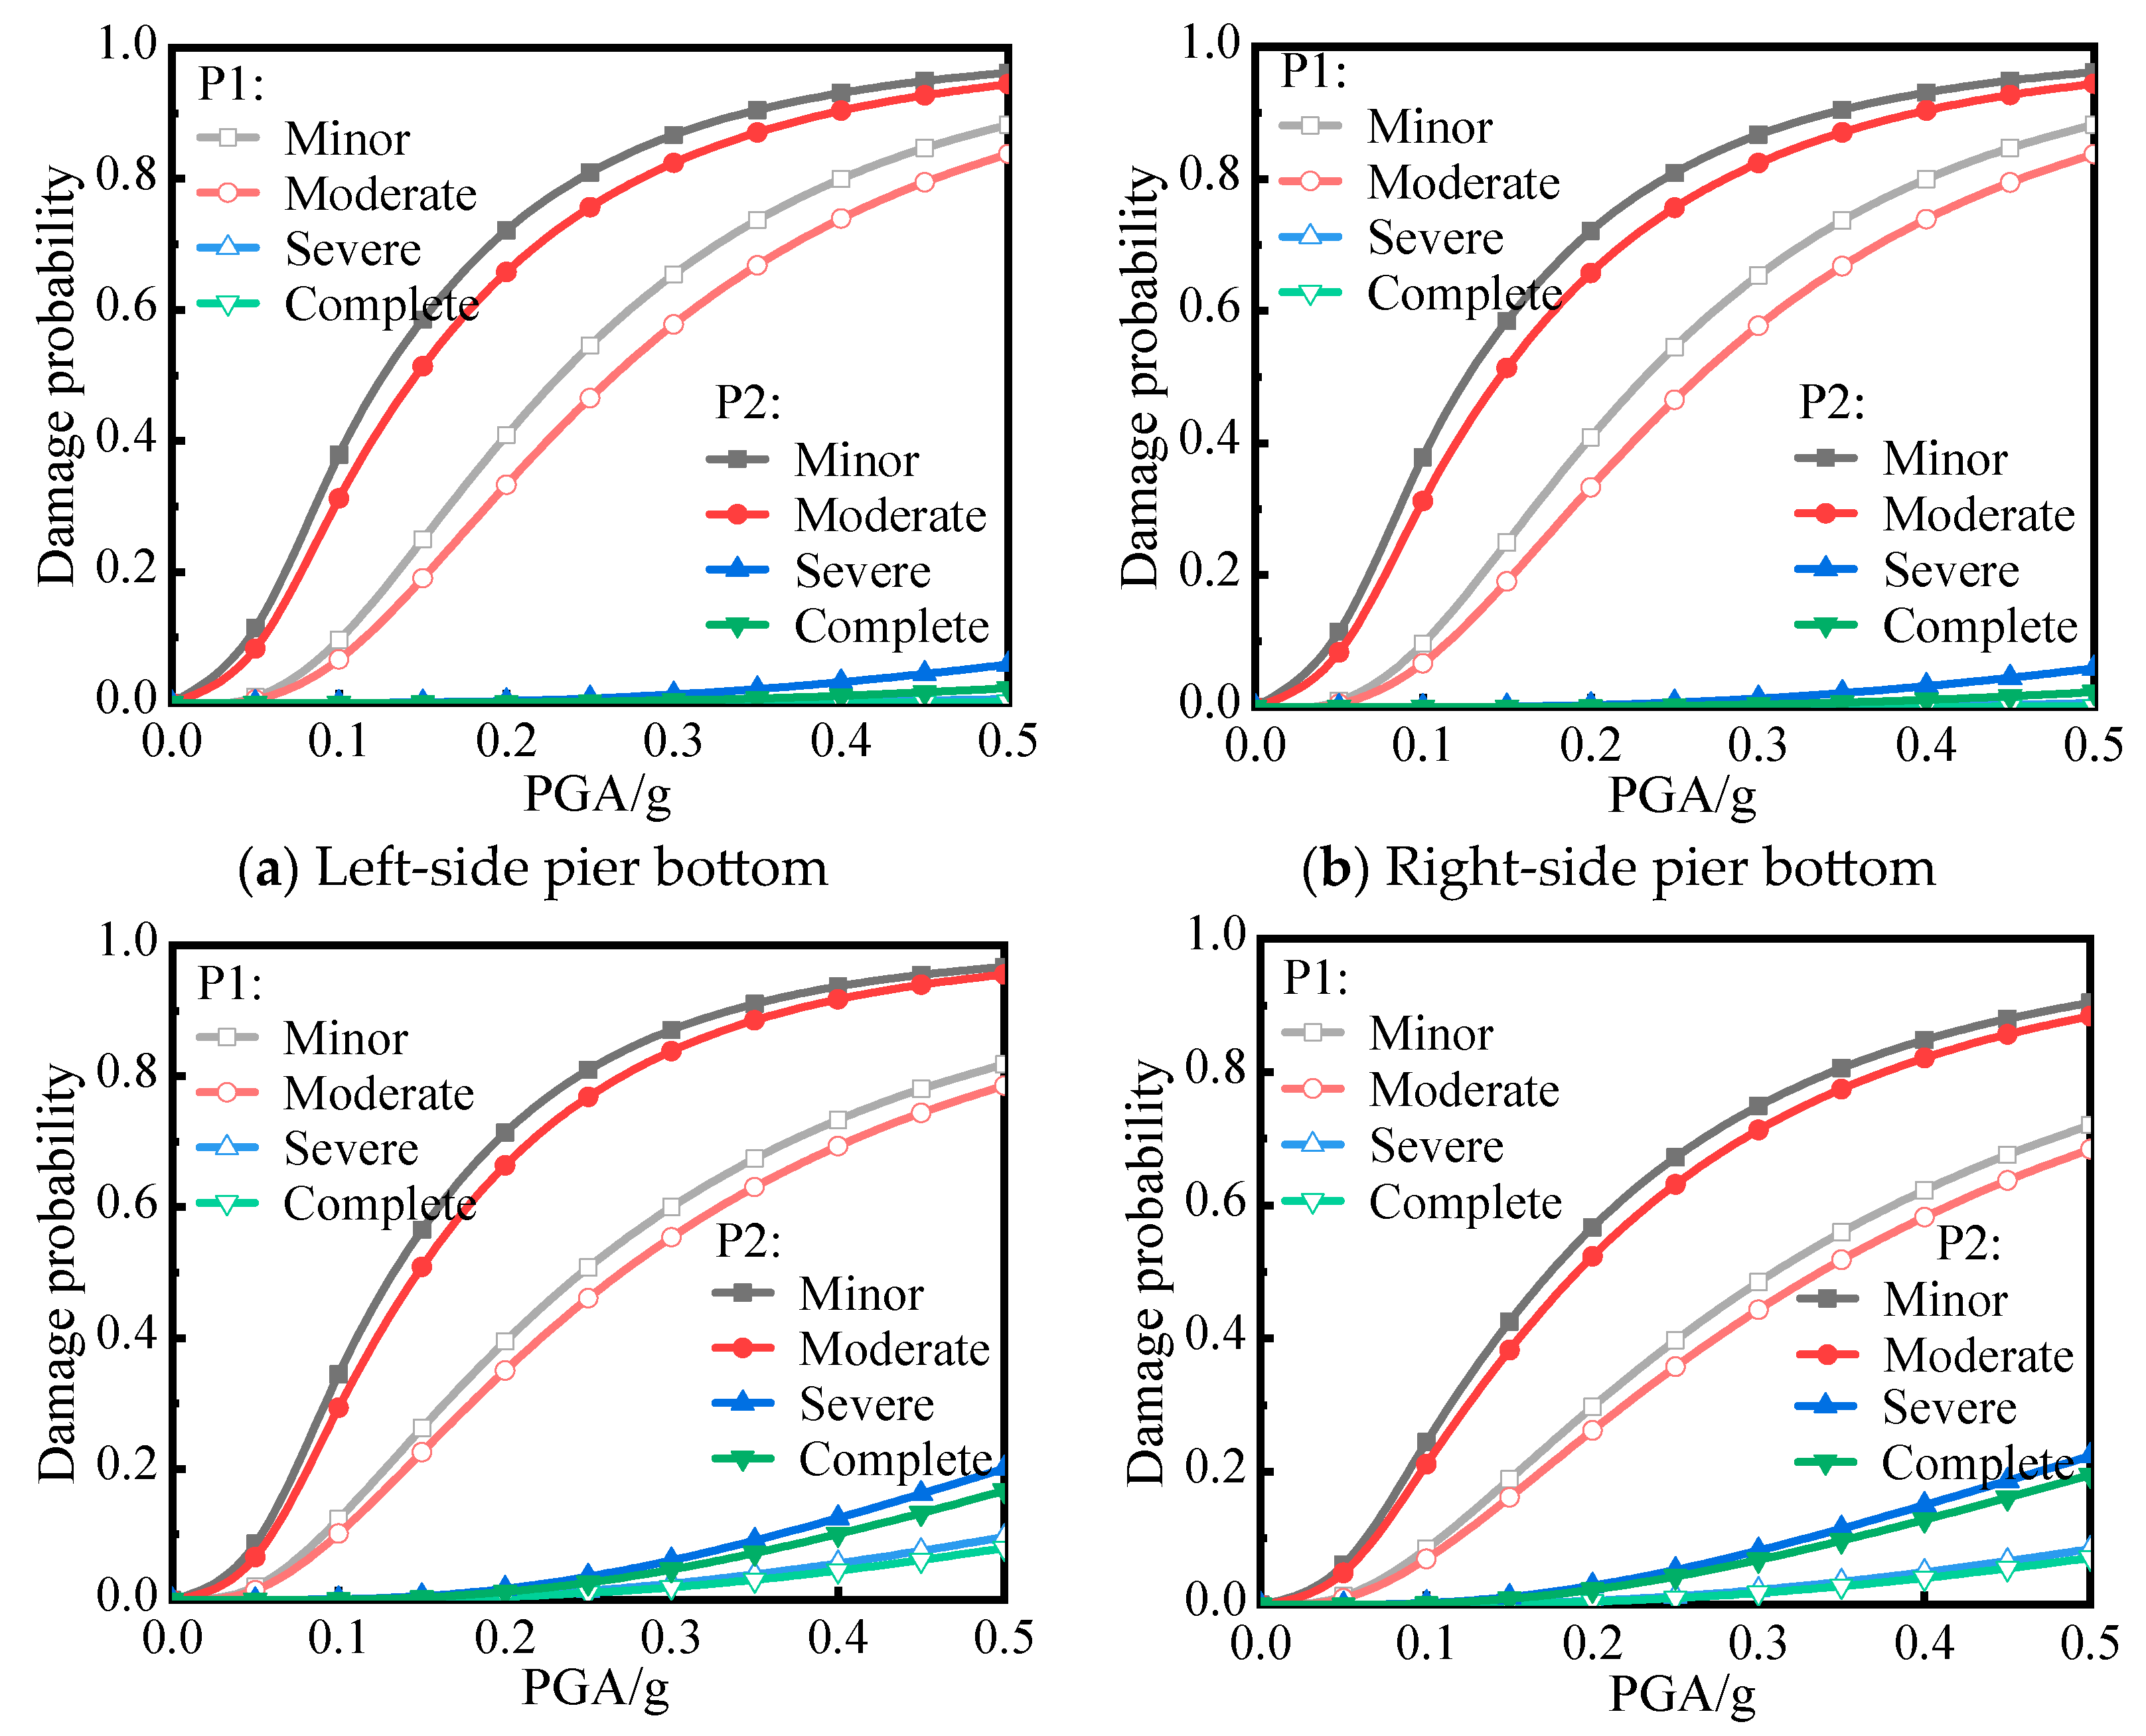
The damage probabilities of P1 and P4 and those of P2 and P3 are close to each other, so only the vulnerability curves of P1 and P2 are given here, as shown in Figure 10. With increasing PGA, the probability of damage to the pier bottom and the pier and tie beam bottom sections gradually increases. Taking P2L as an example, when PGA = 0.5 g, the probabilities of the pier bottom section exceeding the “minor damage”, “moderate damage”, “severe damage”, and “complete damage” stages are 96.18%, 94.42%, 5.86%, and 2.26%, respectively, while the probabilities of the pier bottom section exceeding the damage stage increase to 96.72%, 95.53%, 20.09%, and 16.69%, respectively, mainly because the hoop matching rate is lower than that of the pier bottom section. In addition, Figure 10 shows that the damage probability of P2 is greater than that of P1 due to the greater transverse flexural stiffness at the abutment, which has a stronger restraining effect on the side span and side pier.
Figure 10.
Fragility curves of key sections for pier columns.
4.3.2. Tie Beam
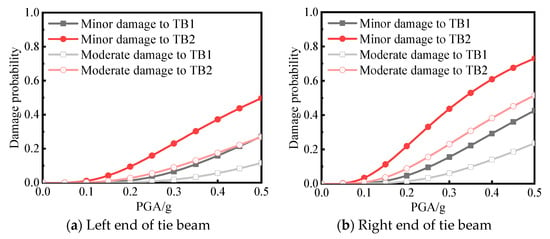
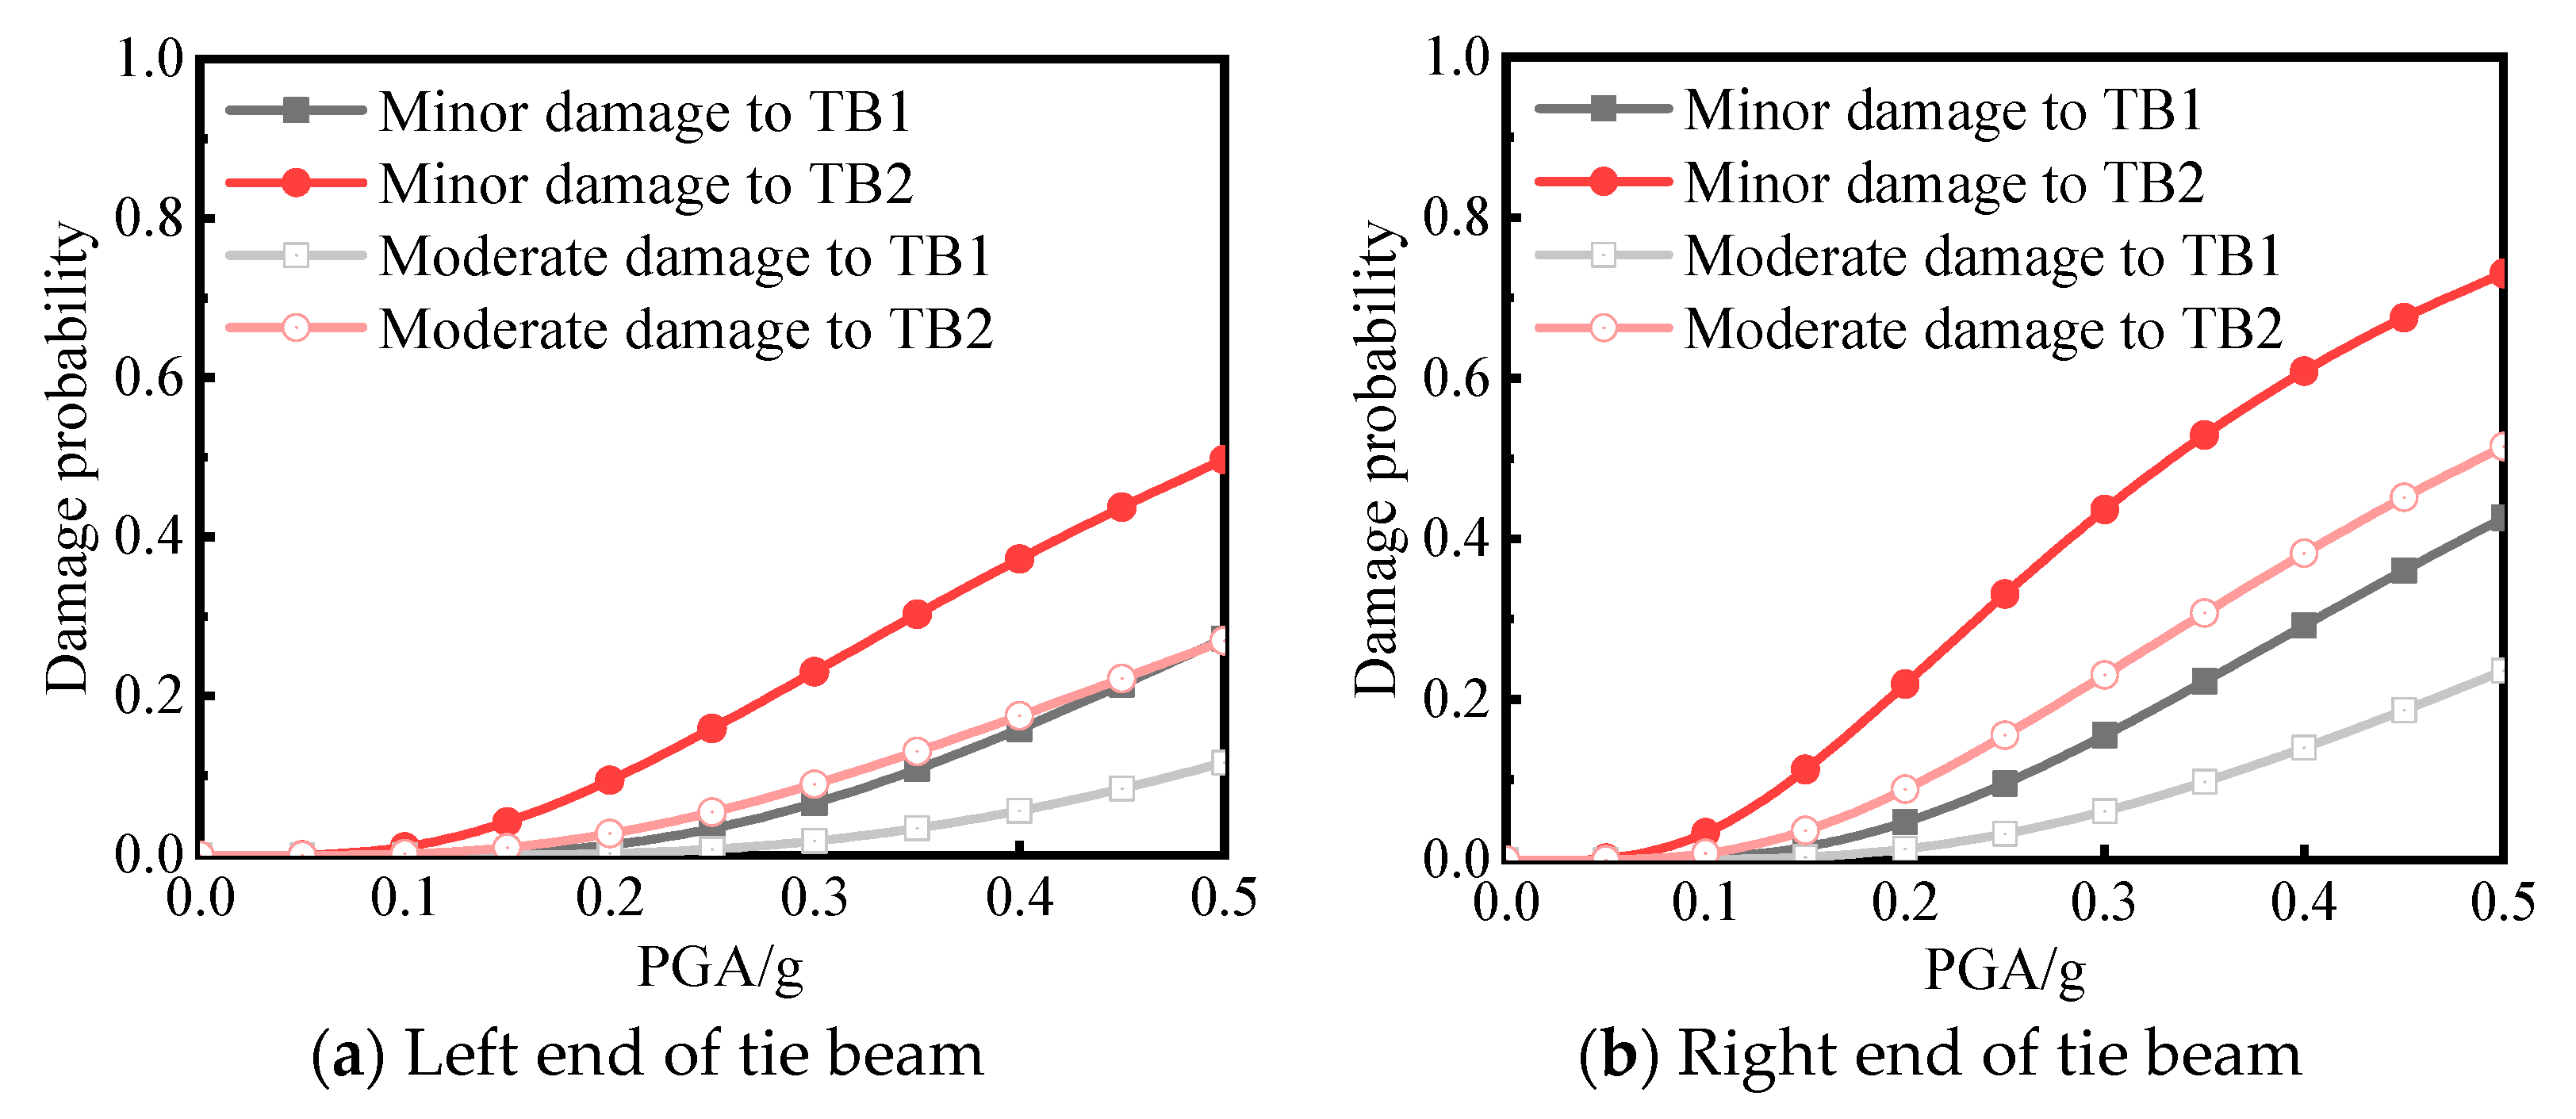
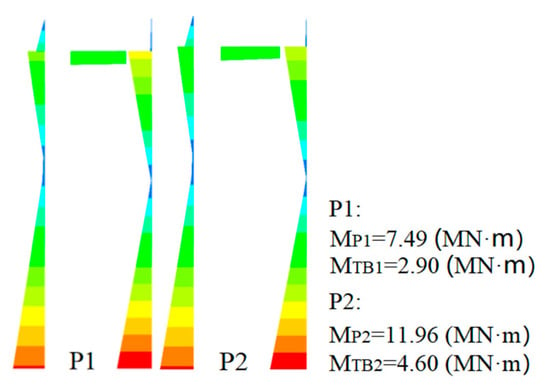
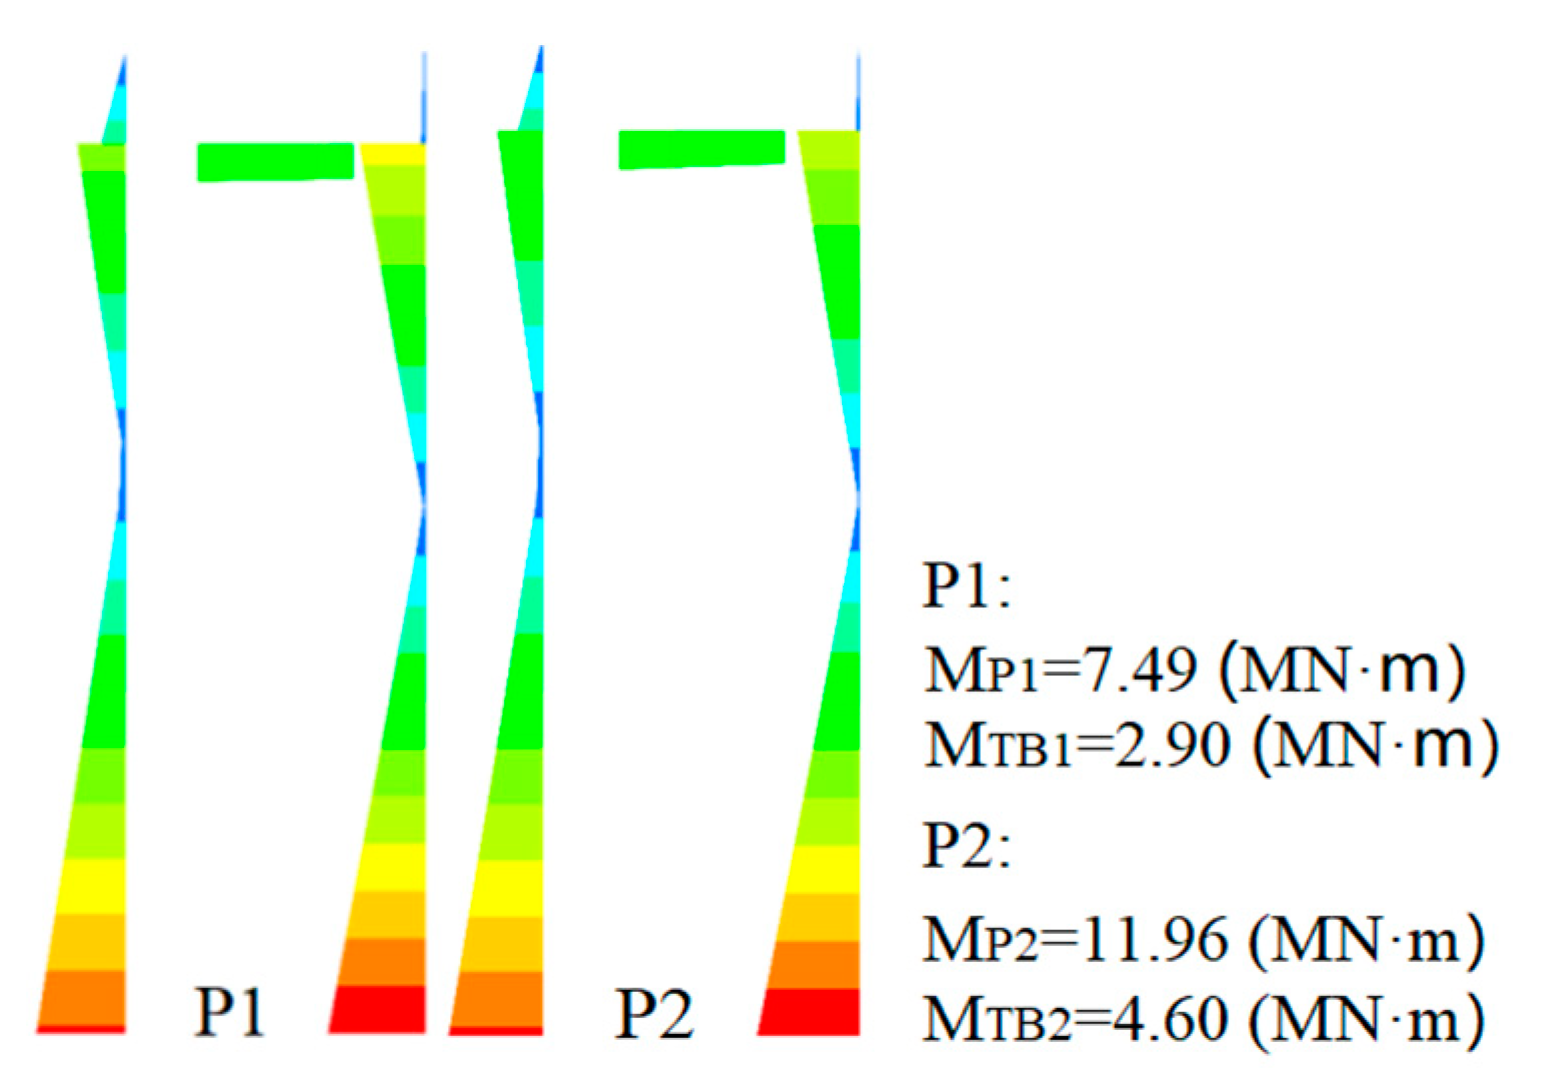
Since the damage of each tie beam is basically symmetric about the span, only the vulnerability curves of TB1 and TB2 are given here, as shown in Figure 11. The calculation results show that only “minor damage” and “moderate damage” occur in the tie beam, and the probability is significantly lower than that of the pier and column, which is mainly because the stiffness ratio between the tie beam and the pier column is 0.102, and the bending moment borne by the tie beam is much smaller than that of the pier column in the internal force distribution (Figure 12), so that the beam does not yield before the pier column for energy dissipation. When the PGA is 0.5 g, the probabilities of “minor damage” and “moderate damage” in the left and right end sections of TB2 are 49.70% and 73.04% and 26.93% and 51.50%, respectively, which are greater than those of TB1 (this is also due to the higher transverse bending stiffness of the bridge abutment, which has a stronger restraining effect on the side piers).
Figure 11.
Fragility curves of key sections for tie beams.
Figure 12.
Moment envelopes of P1 and P2 (excited by the RSN1338 ground motion).
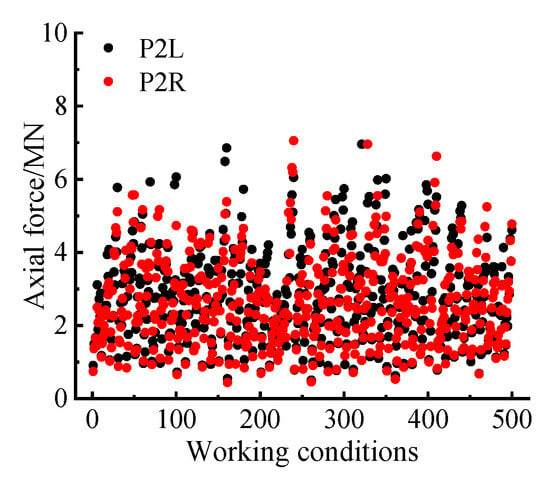
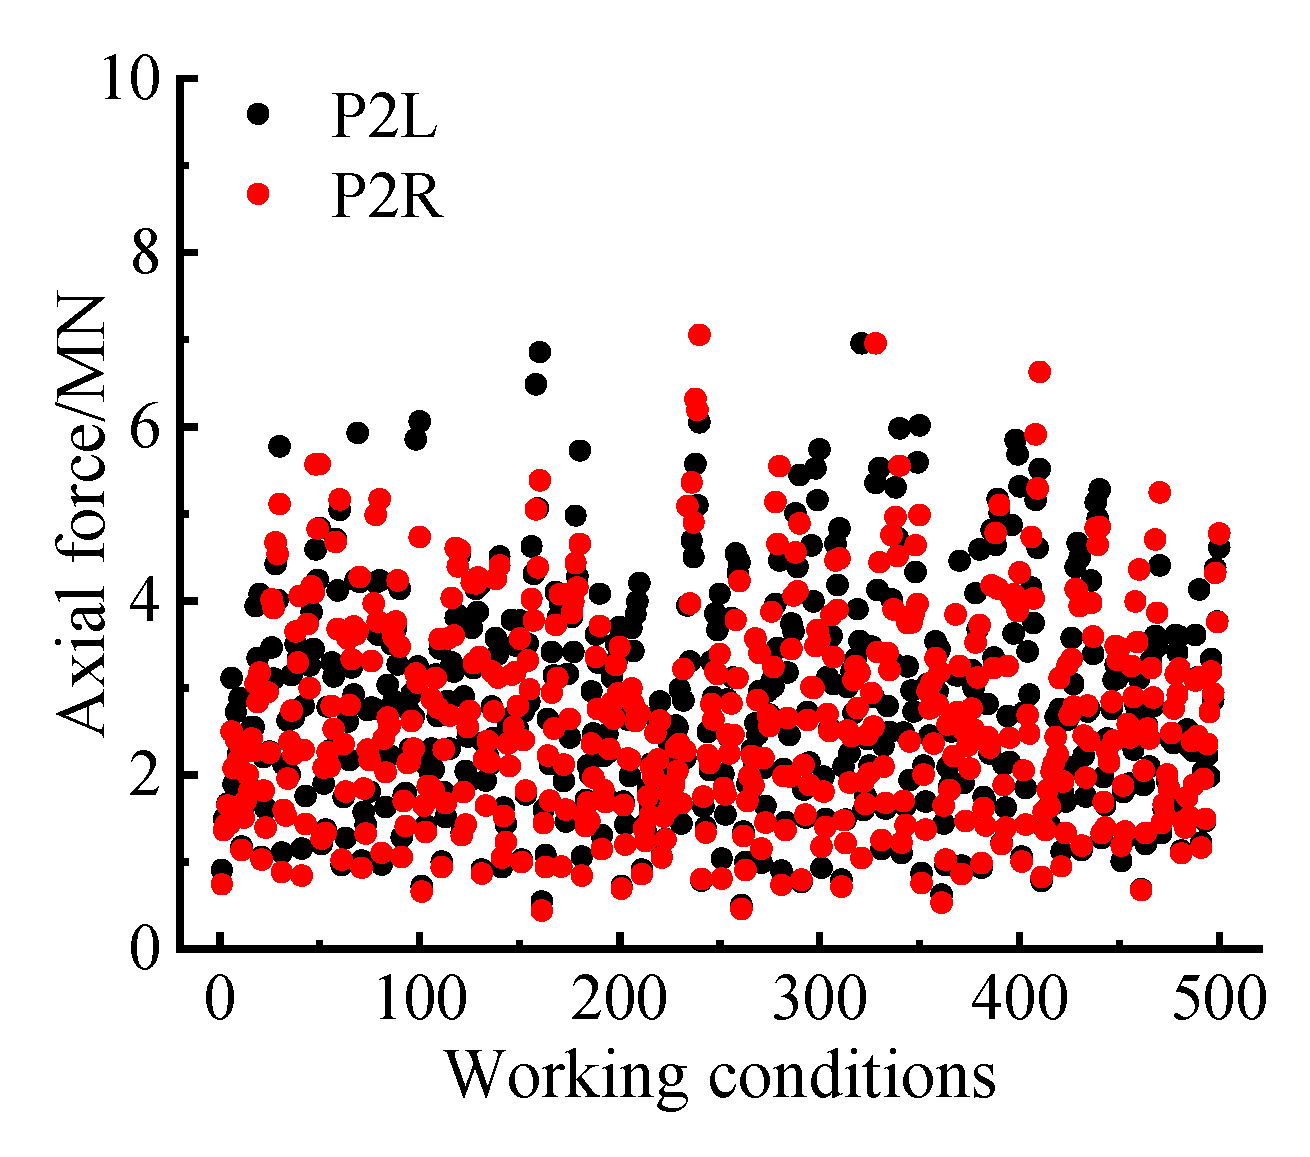
In addition, considering Figure 9, Figure 10 and Figure 11, we can also see that the damage probability of the bottom section of the left pier and tie beam is greater than that of the right side, while the damage probability of the left end section of the tie beam is less than that of the right end, i.e., the vulnerable parts of the pier and tie beam do not appear on the same side. This phenomenon is caused by the redistribution of the internal force due to the local damage of the structure under earthquake action. Figure 13 shows the distribution of axial forces in the bottom sections of the left and right piers and tie beams of P2 under 500 sets of working conditions, among which there are 300 sets in which the axial pressure of the right pier is greater than that of the left pier, at which time the strength and stiffness of the right pier increase under the action of dynamic axial pressure and the tensile strain of the longitudinal reinforcement decreases [36], so its damage probability is lower than that of the left pier column. As the pier and tie beam are rigidly connected, the damage of the pier can consume seismic energy, which in turn alleviates the damage of the tie beam on the same side, so the damage probability of the left end section of the tie beam is less than that of the right end.
Figure 13.
Peak axial force responses of the pier and tie beam bottom sections under different working conditions.
4.3.3. Bearing
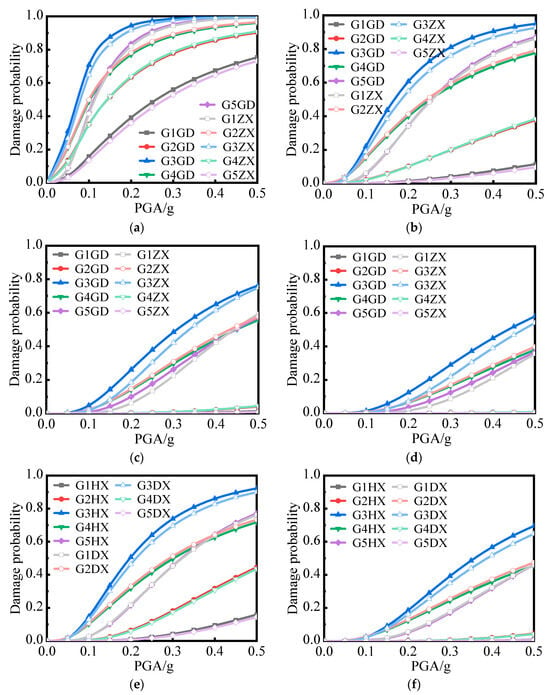
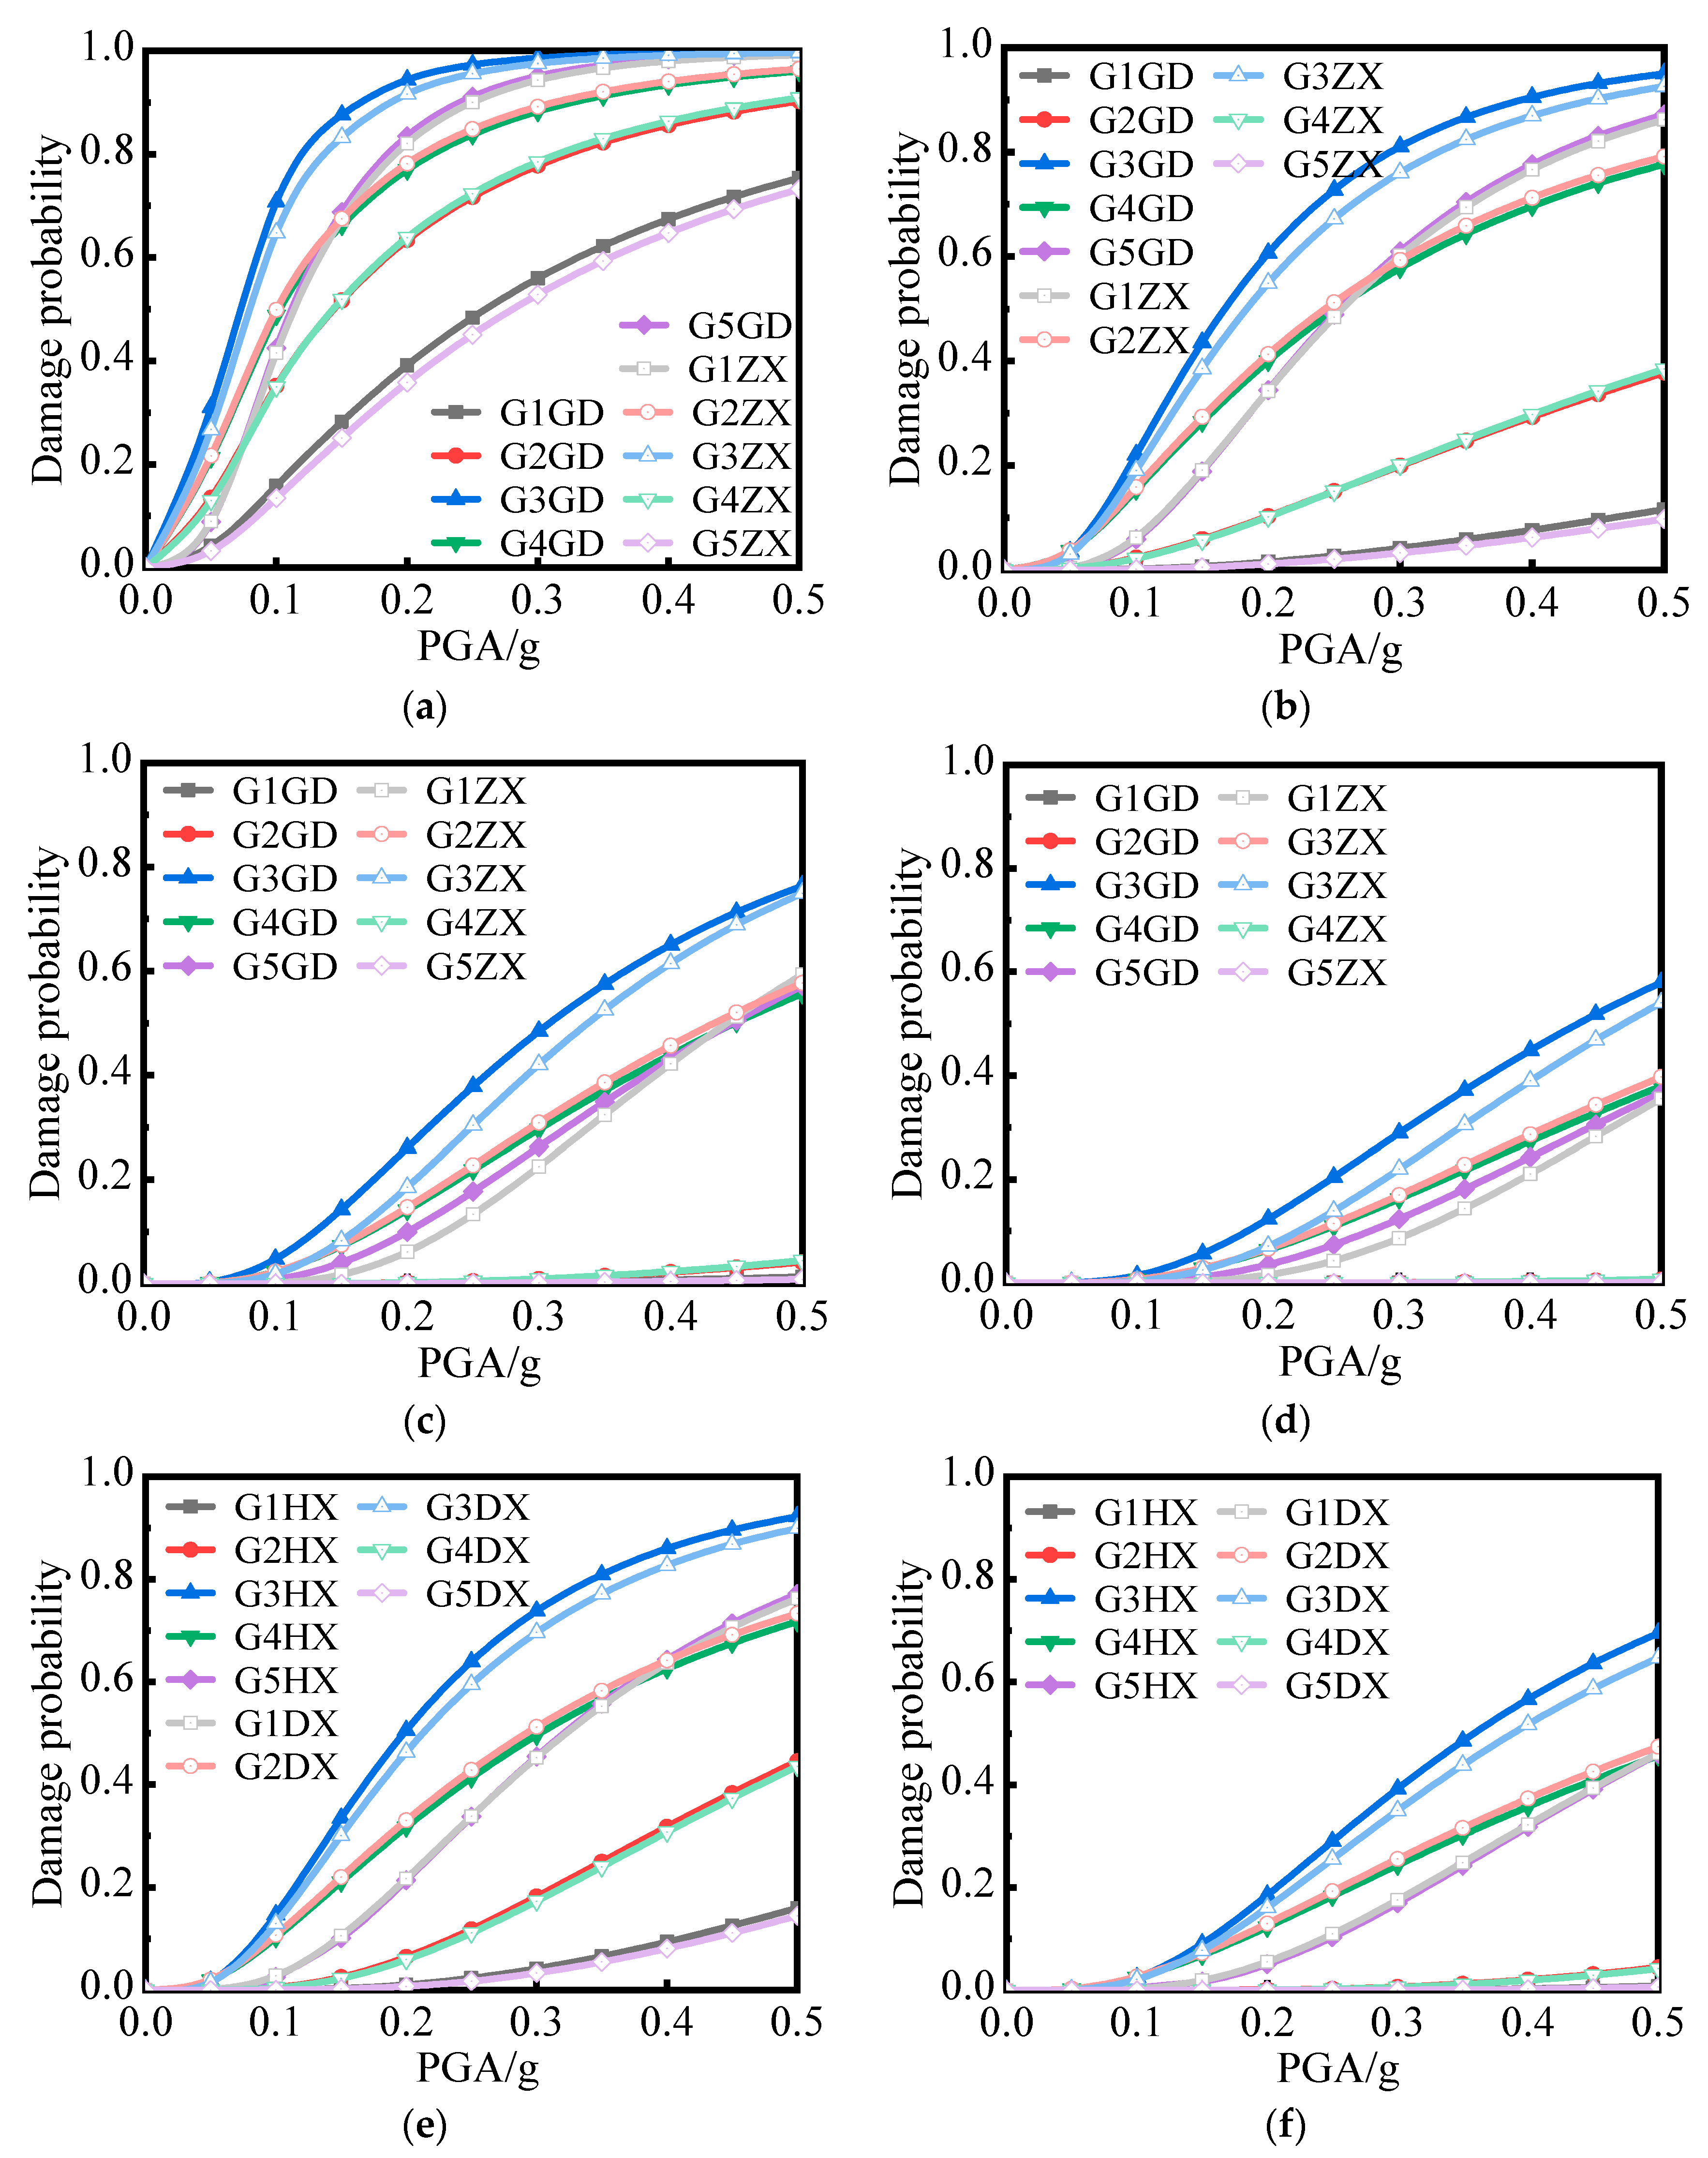
The vulnerability curves of different types of bearings are shown in Figure 14, in which G1GD, G1ZX, G1HX, and G1DX represent the G1 beam fixed bearings, longitudinal movable bearings, transverse movable bearings, and multidirectional movable bearings, respectively, and the rest of the bearings are analogous. The damage probability of each bearing is basically symmetrically distributed about the span, and the damage probability of each bearing of G3 is the highest. For bearings under the same span, the damage probability is significantly greater than that of transverse and multidirectional movable bearings due to the transverse fixation of fixed bearings and longitudinal movable bearings. When the PGA is 0.5 g, the probabilities of “minor damage”, “moderate damage”, “severe damage”, and “complete damage” for the fixed bearing and longitudinal movable bearing of G3 are greater. The exceedance probabilities of “complete damage” are 99.85%, 95.03%, 77.72%, 60.00%, 99.66%, 92.60%, 72.66%, and 54.64%, respectively. The probability of “severe damage” and “complete damage” for transverse and multidirectional movable bearings is low, so only the damage vulnerability curves for the “minor damage” and “moderate damage” stages are given (Figure 14e,f), with exceeding probabilities of 92.24% and 69.52%, and 89.92% and 64.73%, respectively.
Figure 14.
Fragility curves of bearings. (a) Minor damage to fixed bearing and longitudinal movable bearing. (b) Moderate damage to fixed bearing and longitudinal movable bearing. (c) Severe damage to fixed bearing and longitudinal movable bearing. (d) Complete damage to fixed bearing and longitudinal movable bearing. (e) Minor damage to transverse, multidirectional movable bearing. (f) Moderate damage to transverse, multidirectional movable bearing.
5. System Vulnerability Analysis
5.1. Analysis Method
The copula function method can accurately describe the nonlinear correlation between variables by separating the marginal distribution of variables from the correlation between variables, thus simplifying the establishment of the joint probability distribution model, which is more advisable in the process of vulnerability analysis of systems with multimember structures [37].
To describe the complex correlation between members, the copula function is used in this paper to construct the joint probability distribution between members [38]. For any x = (x1, x2), assuming that the edge distributions of the two-dimensional joint distribution function H(x1, x2) are u1 = F1(x1) and u2 = F2(x2), according to Sklar’s theorem [30], there exists a binary copula function:
where C(·) is the distribution function of the binary copula.
5.2. Series–Parallel Relationships between Bridge Members
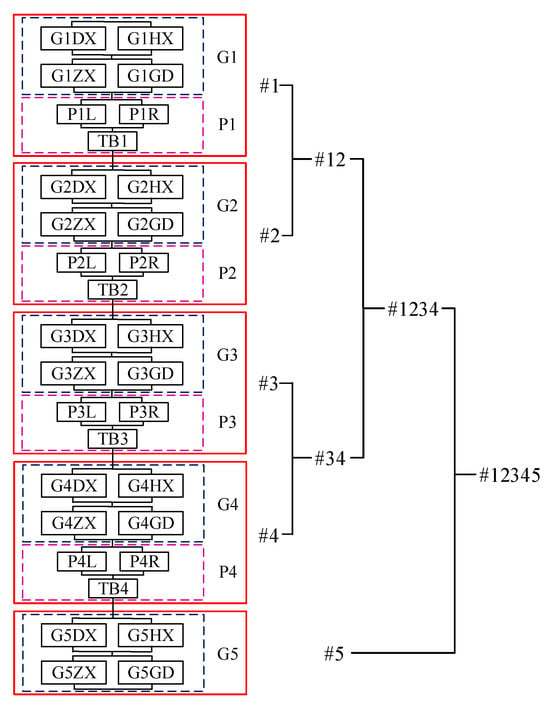
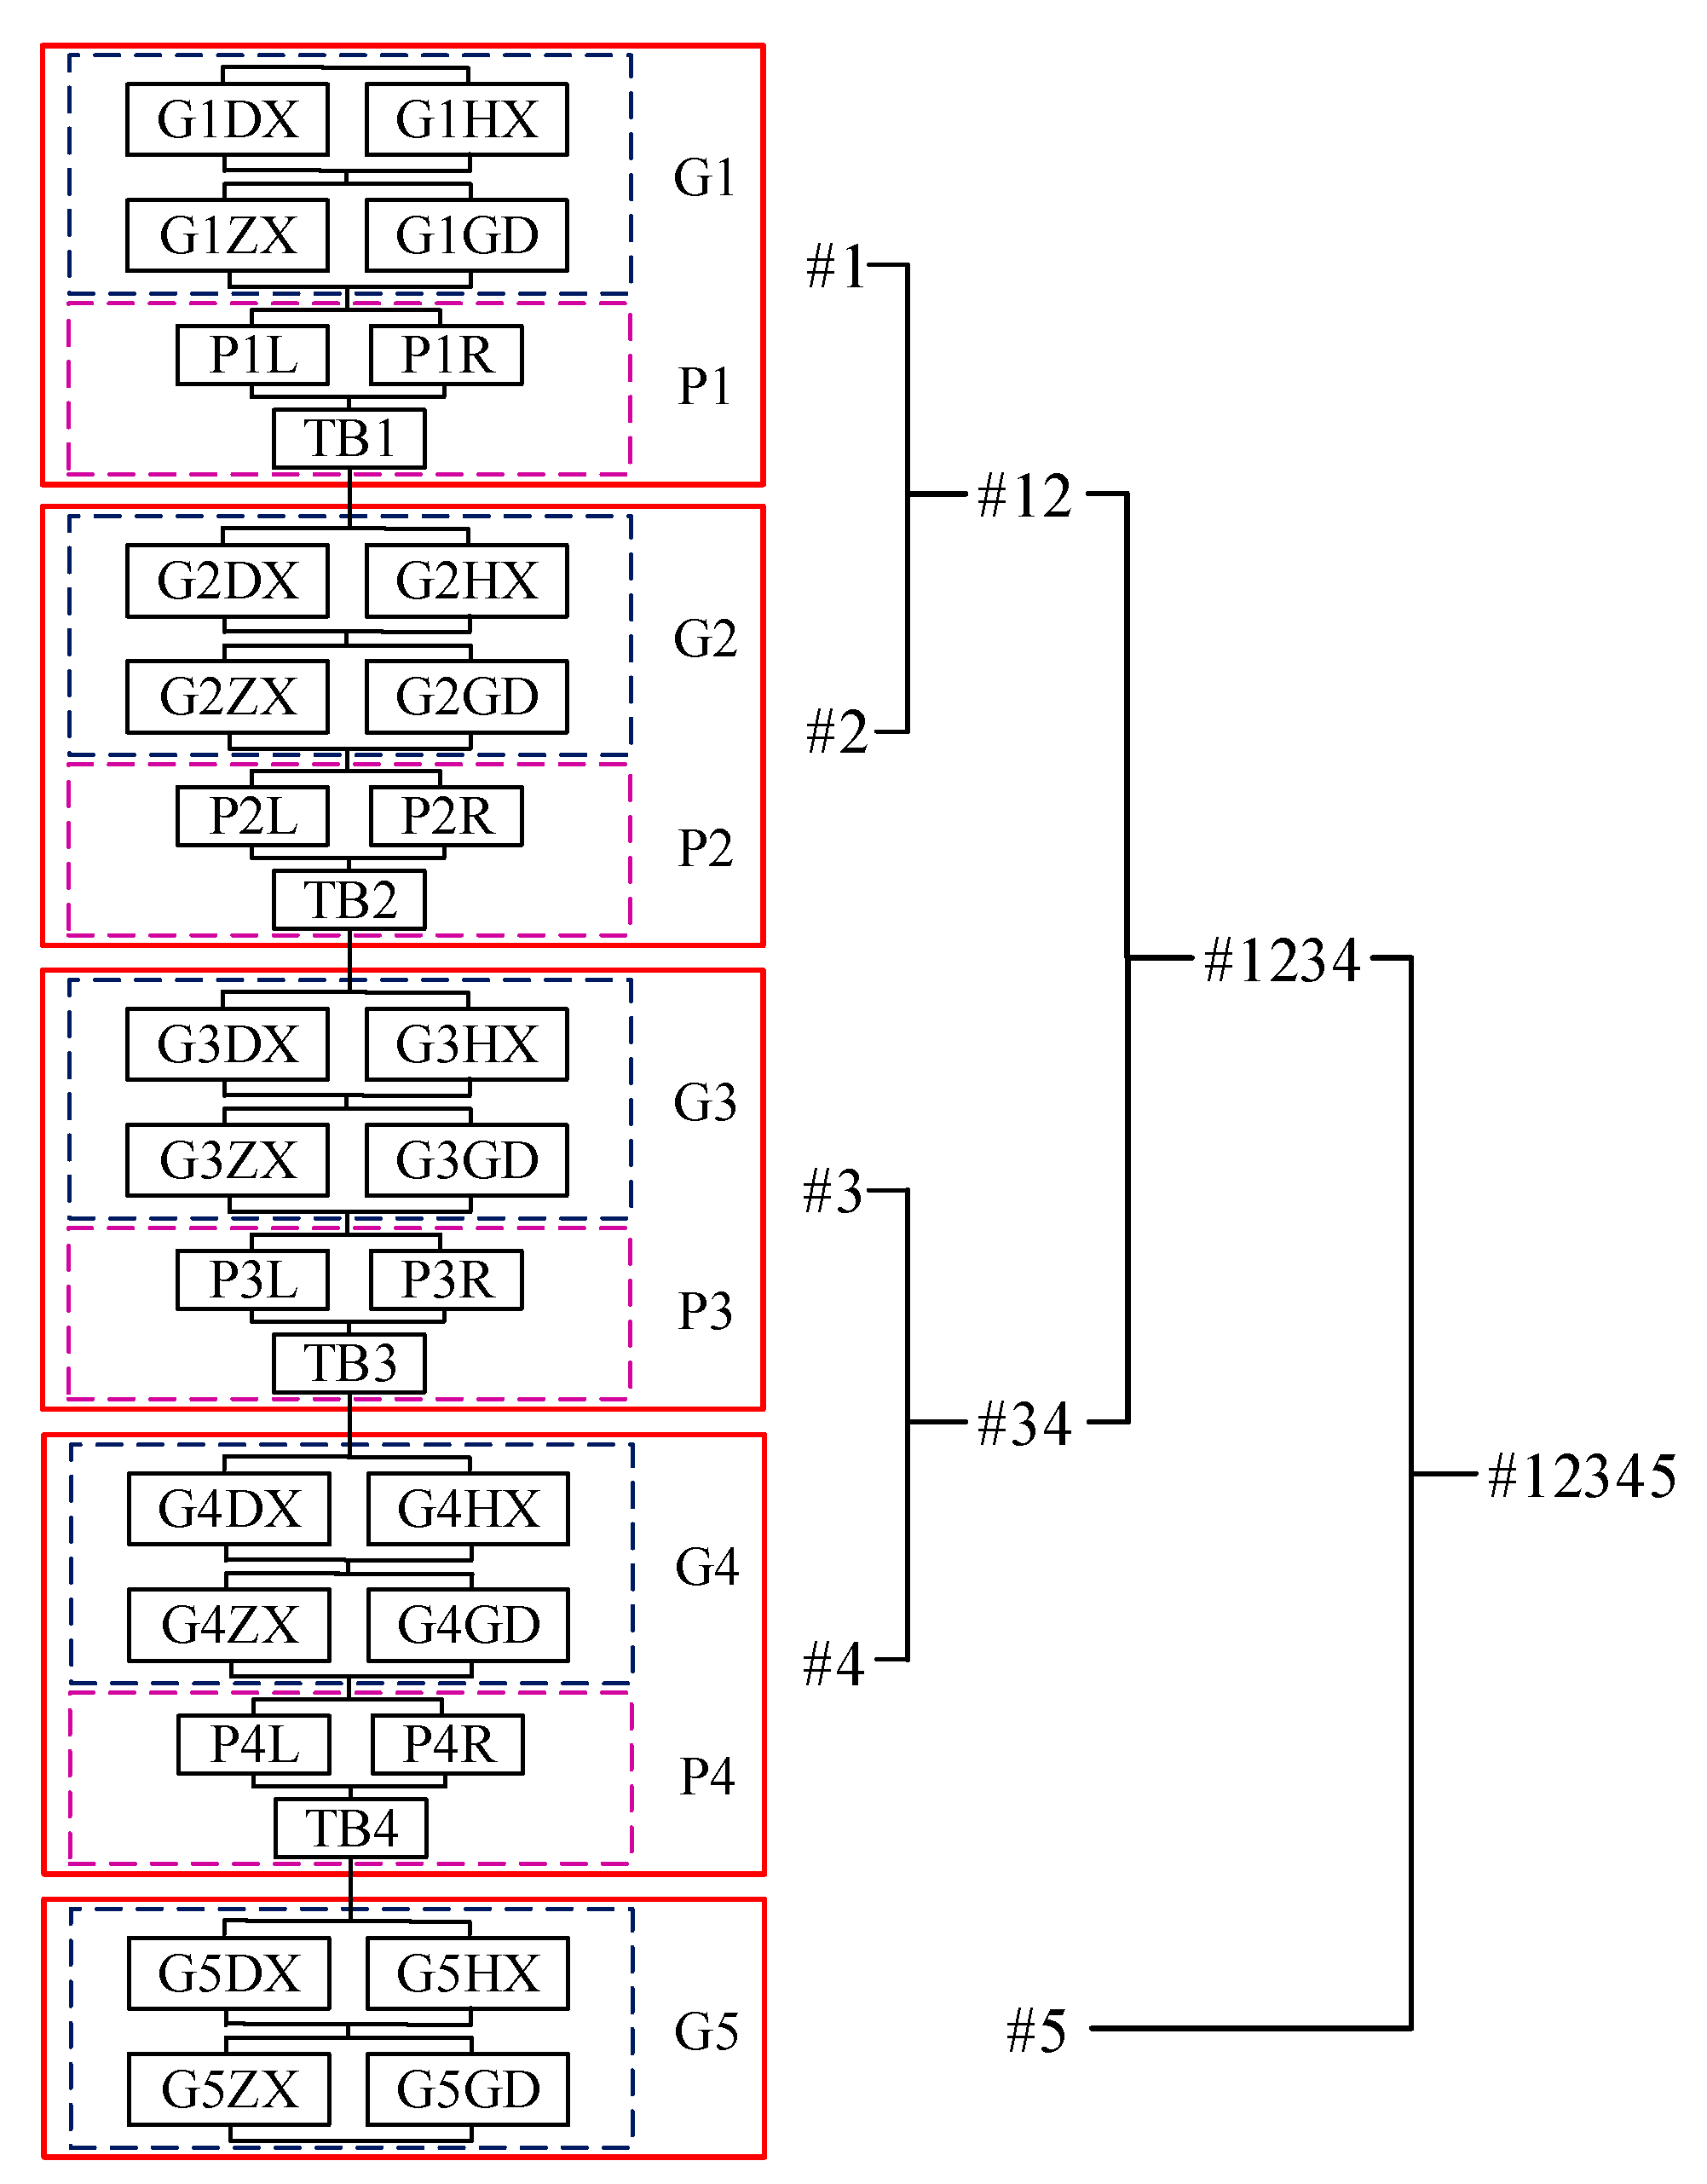
The simply supported girder bridge considered in this paper is a seismic system consisting of piers, tie beams, and bearings. The geometric spatial position relationship and influence after damage of each component are considered. For the bearing subsystem, two bearings with the same function are connected in parallel and then in series to support the upper main girders together; for the pier subsystem, the piers at both sides are connected in parallel and then in series with the tie beam. All subsystems are connected in series to form the series–parallel system of the whole bridge, as shown in Figure 15.
Figure 15.
Schematic diagram of the series–parallel relations between members and the hierarchically iterated pair copula model.
As shown in Figure 15, the series–parallel system of this bridge is complex and contains a large number of members. According to the series–parallel relationship described above, the pair copula is introduced to construct the system vulnerability analysis model of this bridge [31], and the specific construction process is as follows: (1) the bottom layer pair copula model is constructed by combining the adjacent pier and bearing subsystems according to their locations; (2) the second-layer pair copula model is constructed by combining the adjacent pier-bearing subsystems; (3) the third-layer pair copula model is constructed by combining the first four pier-bearing subsystems; and (4) the first four pier-support subsystems are combined with the fifth support subsystem to build the fourth-layer pair copula model; finally, the pair copula hierarchical iterative model of the structural system of the double-column pier simply supported girder bridge is established [39].
Gaussian, Student’s t, Frank, Gumbel, Clayton, and Joe Copulas are selected as alternative copulas to fit the pair copula model for each layer. Based on the Bare pool information criterion, Bayesian information criterion, and maximum likelihood estimation, the R software package (Version 4.4.1) “Vine Copula” is used to optimize the copula function and estimate the parameters in the iterative pair copula model, and the results are shown in Table 6.
Table 6.
Parameter estimation and optimization for the pair copula.
5.3. System Vulnerability Curves
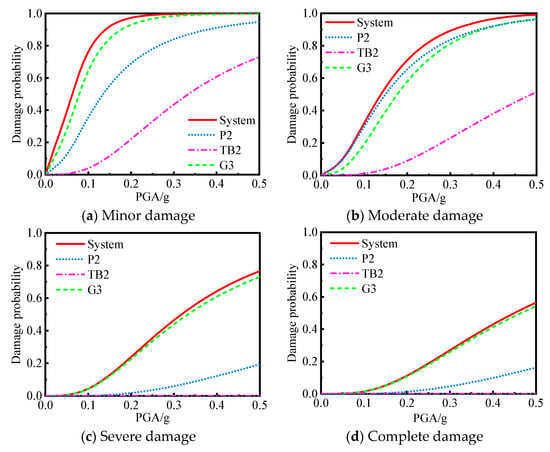
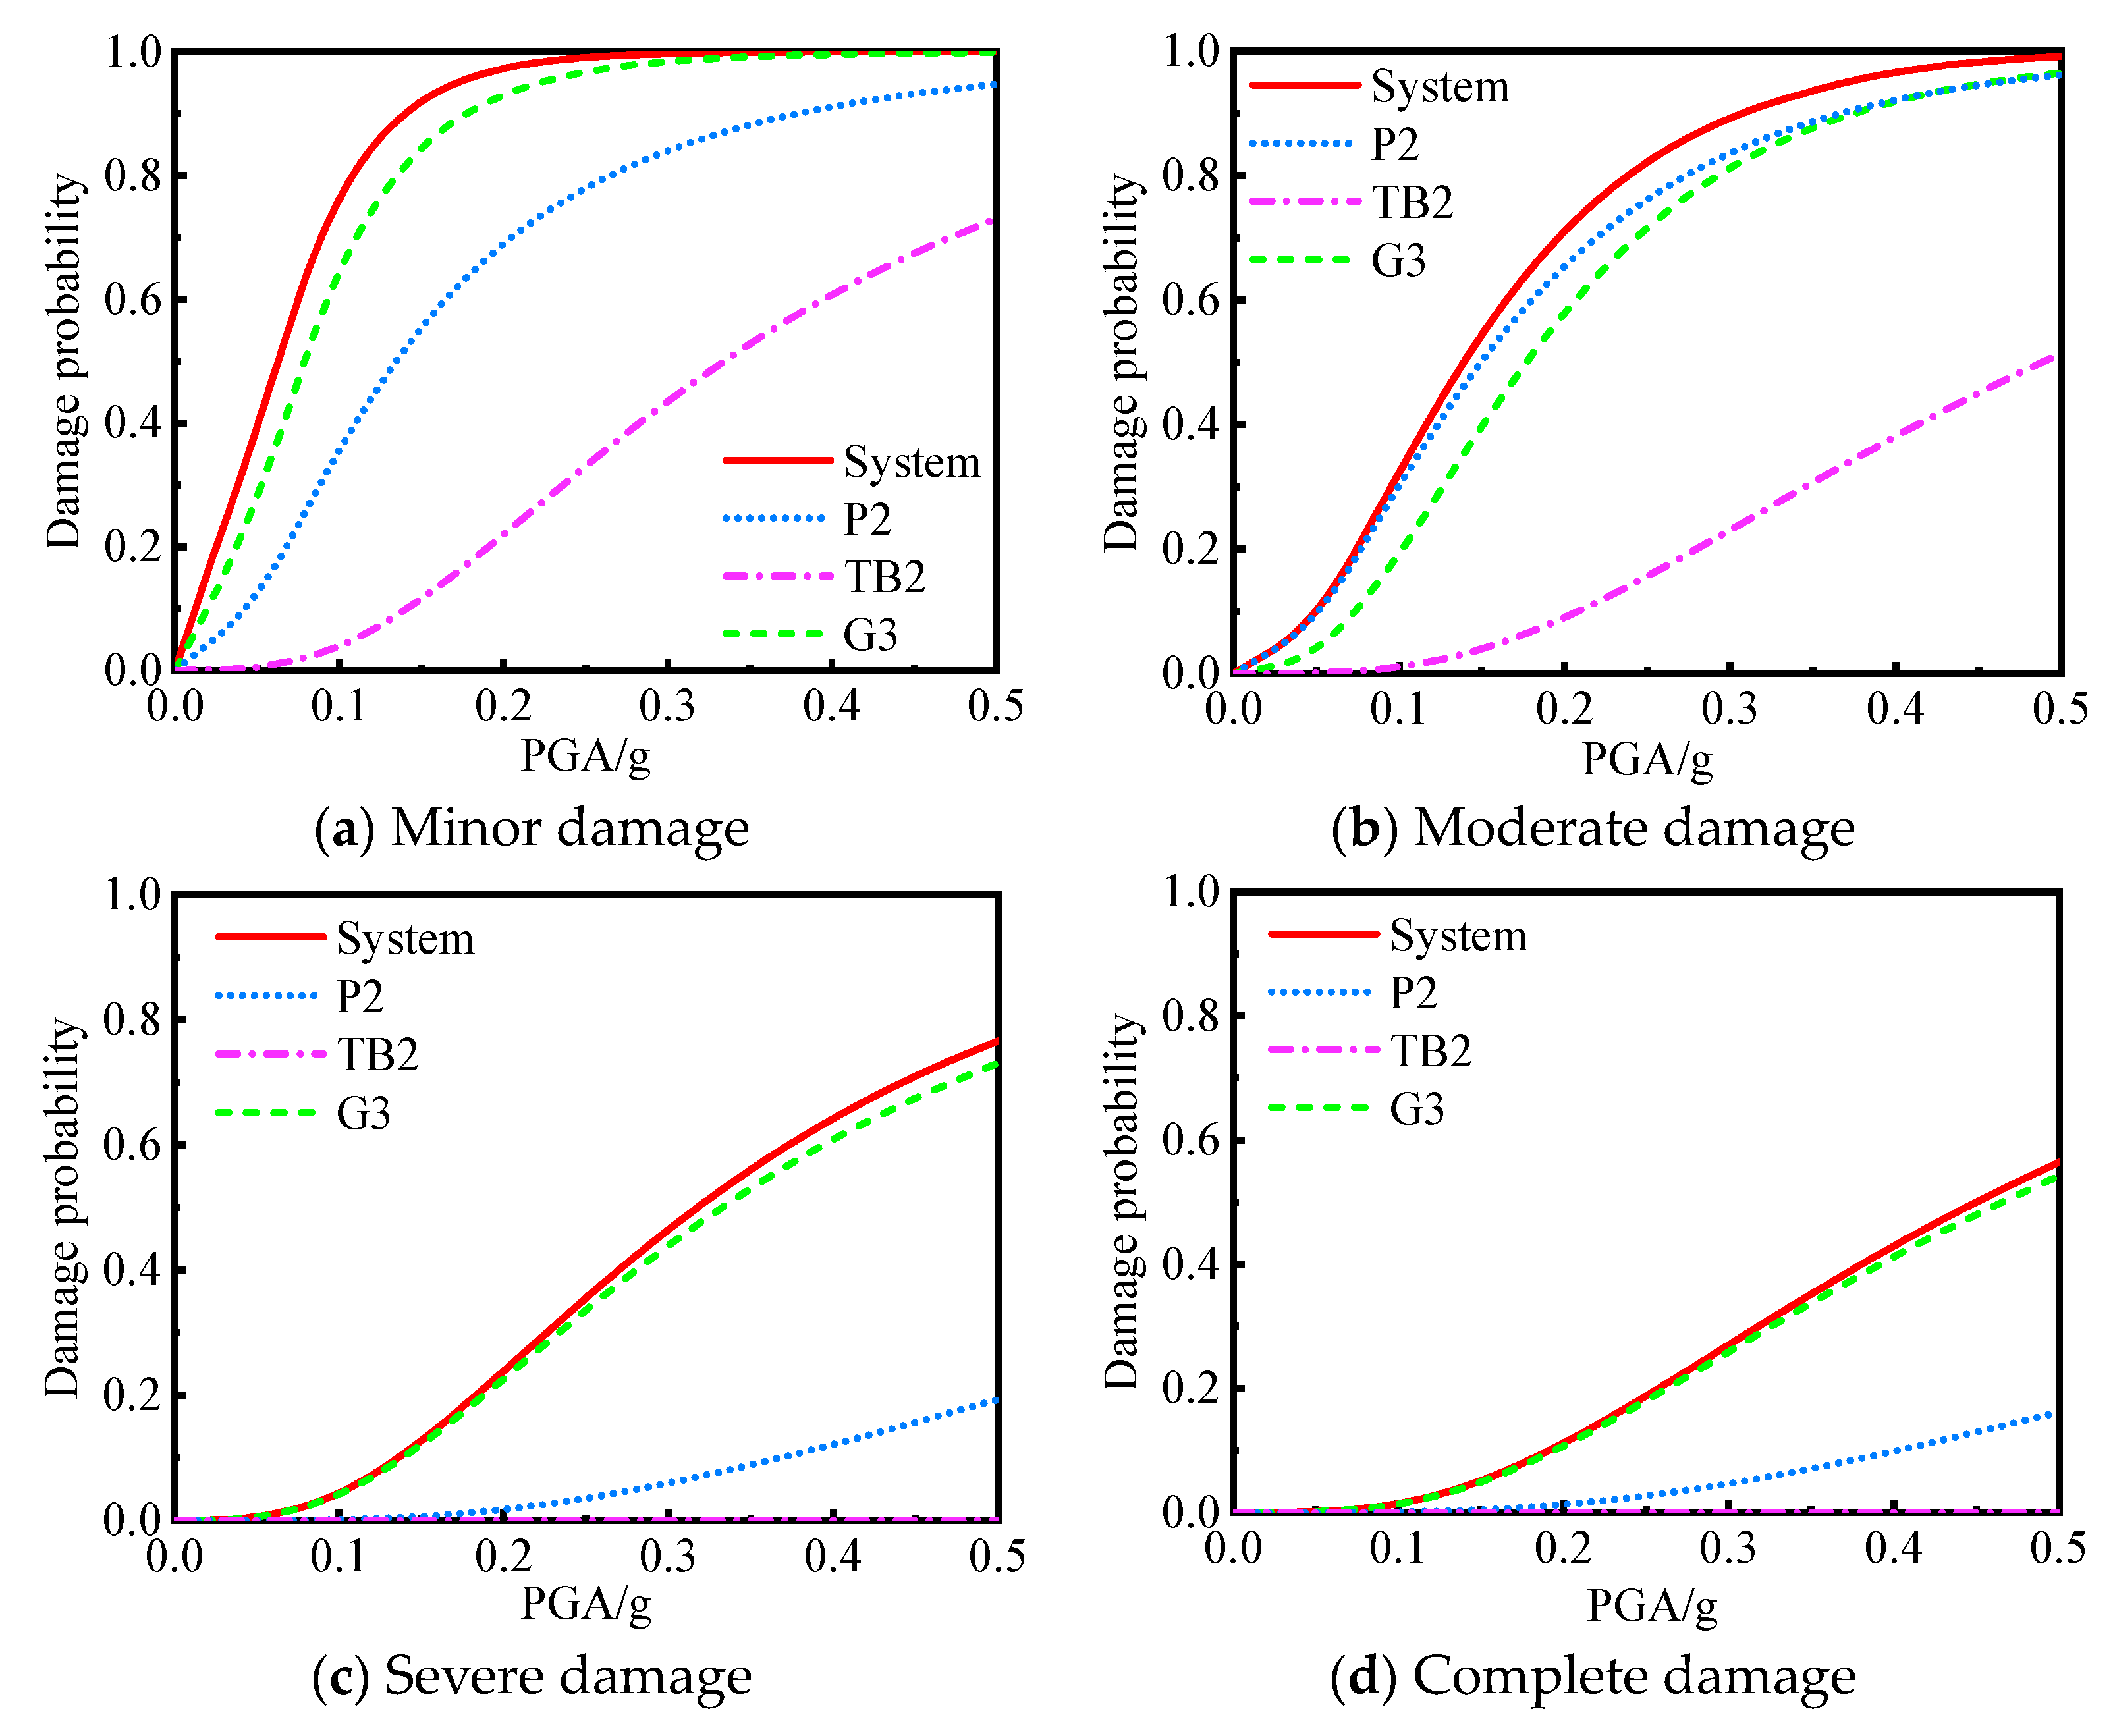
By combining the hierarchically iterated pair copula model and its preferred copula function, the joint damage probability of the members is calculated, and the system vulnerability curve of the double-column pier simple-girder bridge is established, as shown in Figure 16. When PGA = 0.04 g (frequent earthquakes), the probabilities of “minor damage”, “moderate damage”, “severe damage”, and “complete damage” are 30.63%, 6.93%, 0.24%, and 0.07%, respectively; when PGA = 0.10 g (design earthquake), the corresponding probabilities are 76.96%, 32.98%, 4.61%, and 1.53%; and when PGA = 0.21 g (rare earthquake), the corresponding probabilities are 97.82%, 73.92%, 26.46%, and 12.76%, respectively. The probability of “severe damage” and “complete damage” of the double column pier simply supported beam bridge system is small, which indicates that the system has good seismic performance.
Figure 16.
Fragility curves of the system.
To study the influence of each member on the system susceptibility, the susceptibility curves of P2, TB2, and G3 are also shown in Figure 16, indicating that the susceptibility of the simply supported beam bridge system is greater than that of a single member. In the “minor damage”, “severe damage”, and “complete damage” stages, the difference between the system fragility curve and the bearing fragility curve is very small, which means that the contribution of the bearing to the system fragility at this time is dominant. In the “moderate damage” stage, the system vulnerability depends mainly on the probability of damage to the pier. The damage probability of tie beams is lower than that of bearings and piers, so tie beams have a limited impact on the system vulnerability of simply supported girder bridges.
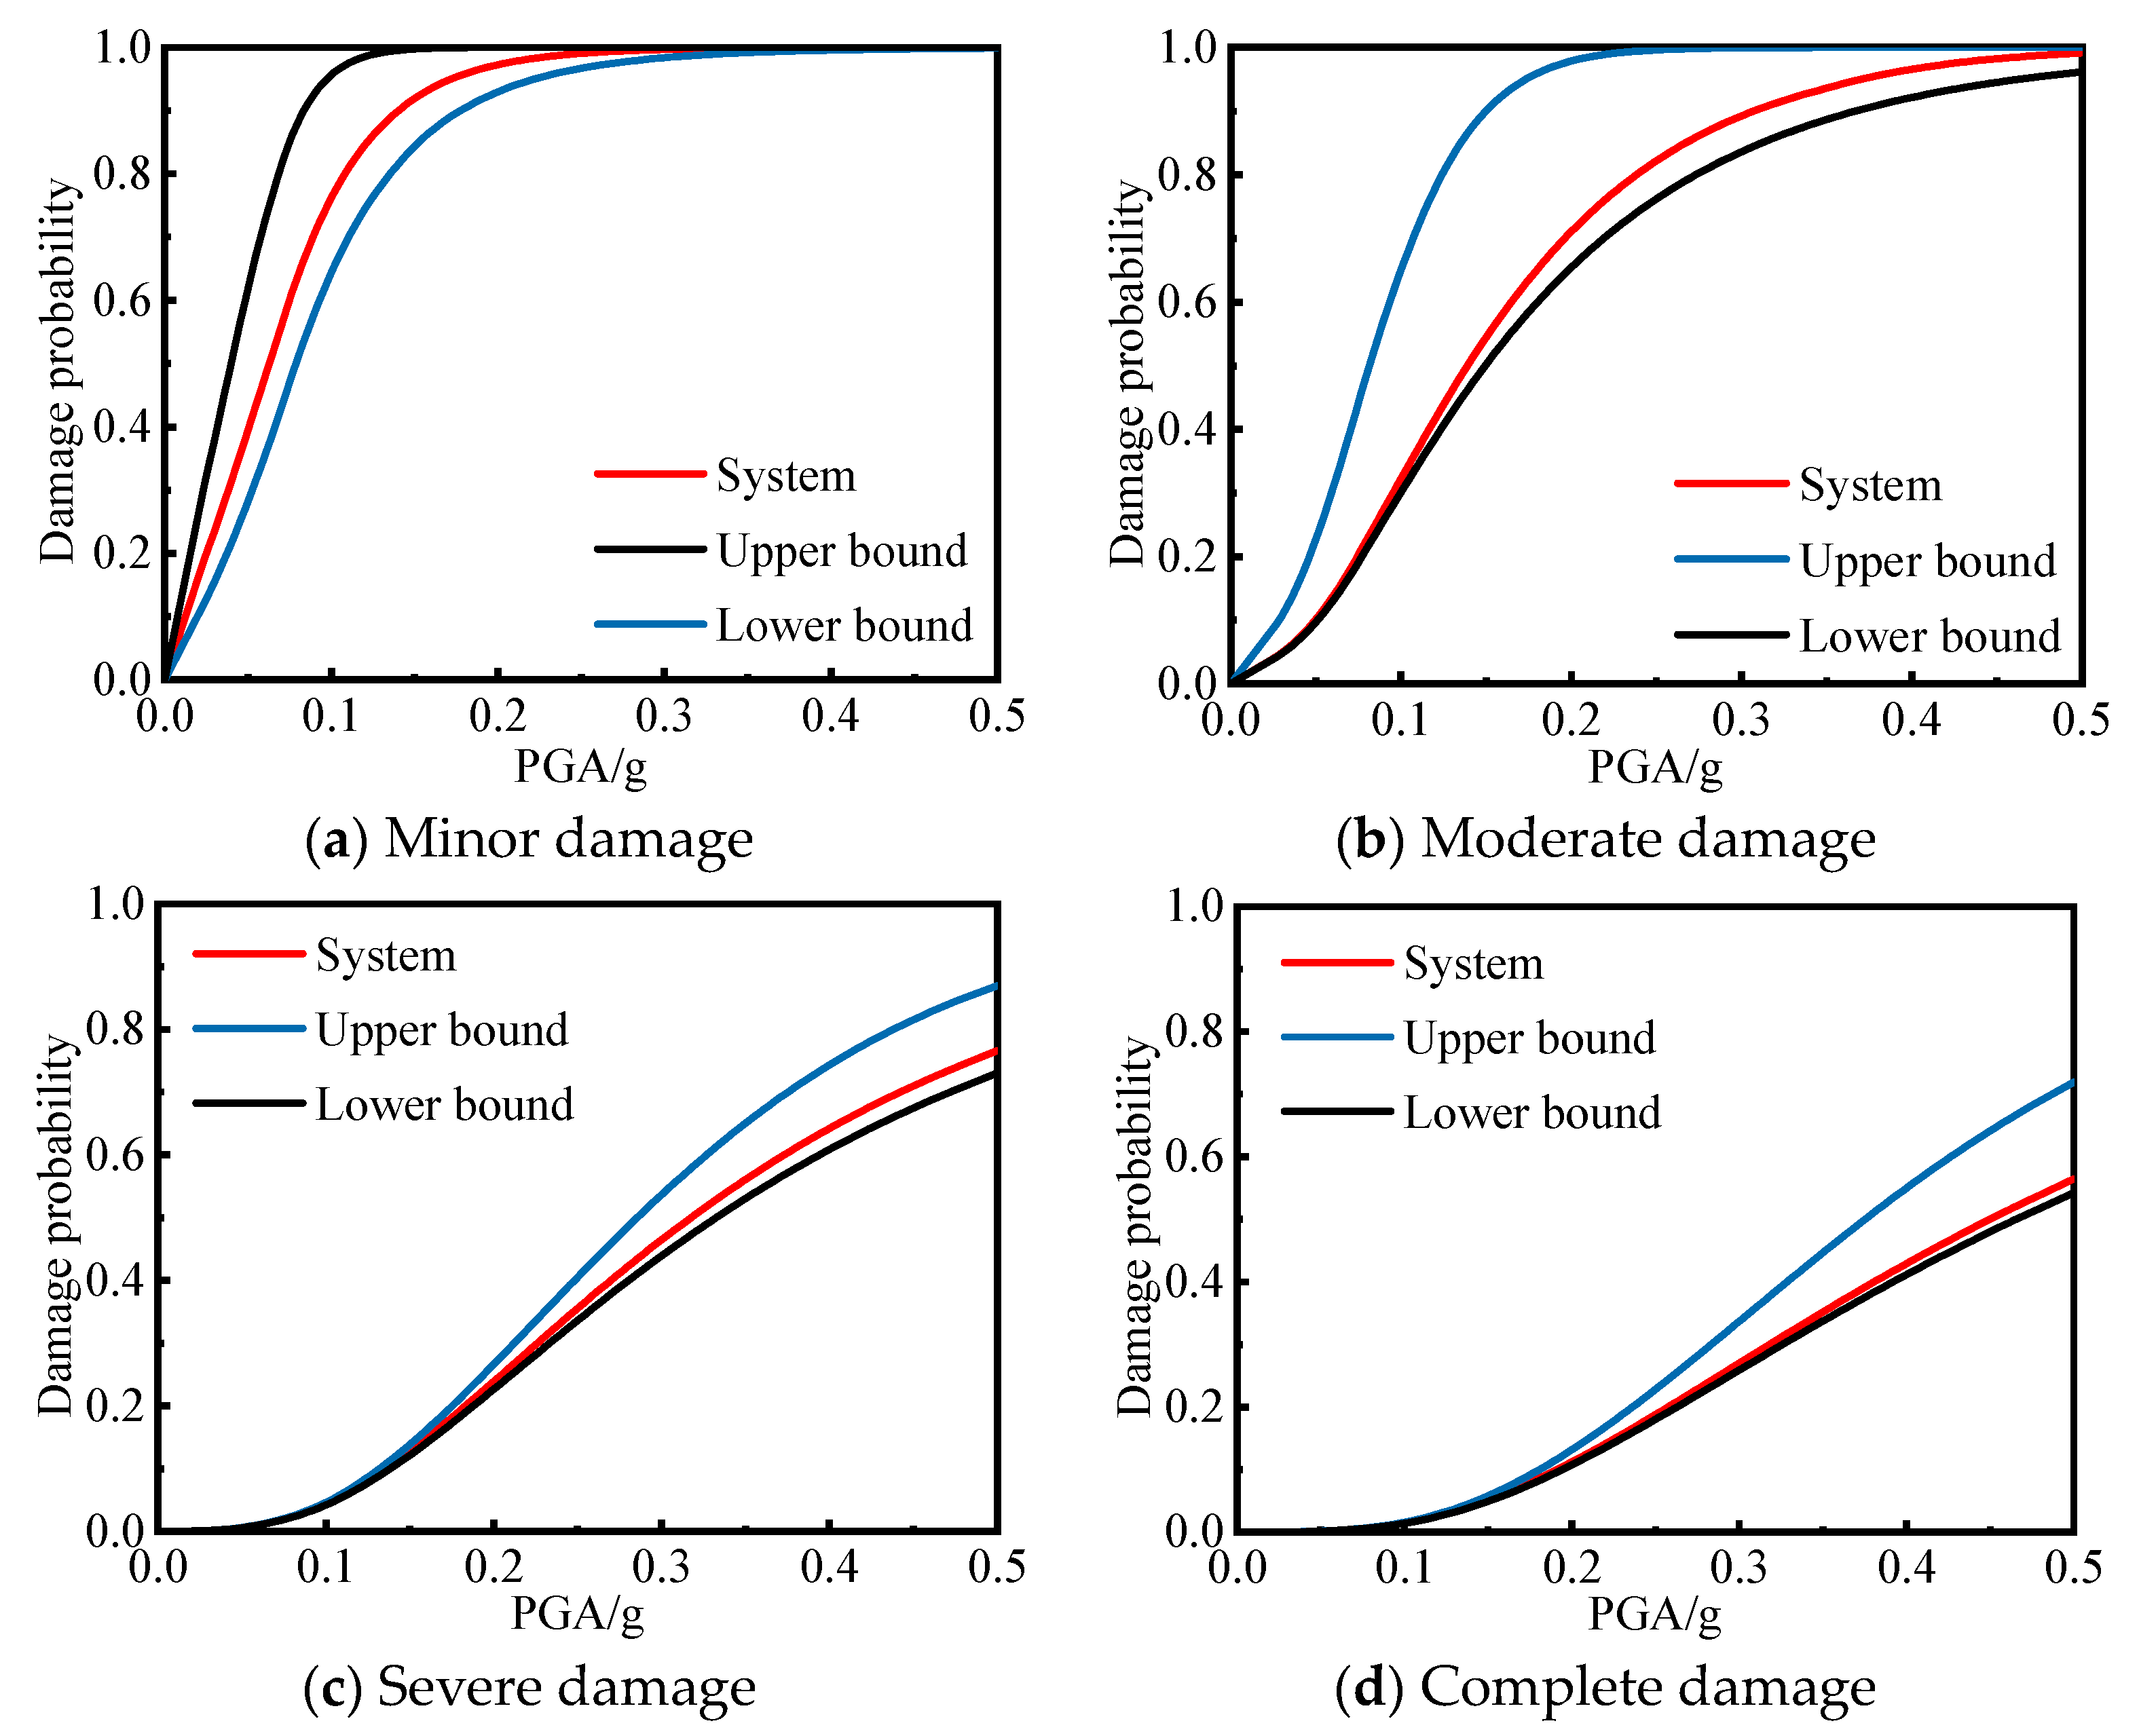
In addition, to analyze the difference between the bridge system vulnerability based on the copula function, considering the complex correlation between the members and the system vulnerability curves and assuming that the members are completely correlated and completely uncorrelated, this paper also uses the first-order bounds method to carry out the system vulnerability analysis of the whole bridge structure, at which time the range of the system failure probability Psf is
where Pi is the probability of failure of the ith subsystem and is the number of failed subsystems. The first-order lower bound treats the members as fully correlated and is determined by the member with the highest failure probability; the upper bound treats the members as fully uncorrelated and is the probability when all members fail, which is a conservative estimate of the failure of the whole bridge system.
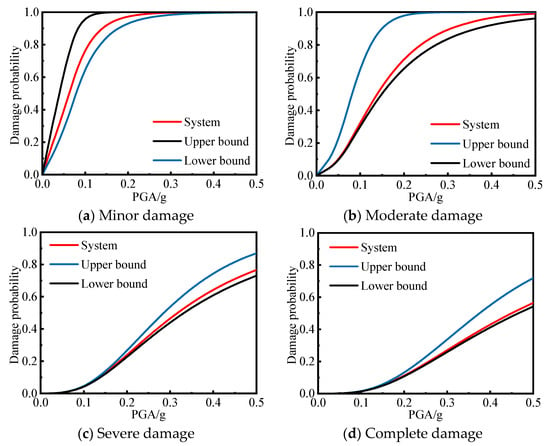
As shown in Figure 17, the vulnerability curve of the system based on the copula function is located between the upper and lower bounds of the first-order boundary method, and it is closer to the lower bound of the failure probability because of the strong correlation among the members. In the “minor damage”, “moderate damage”, “severe damage”, and “complete damage” stages, the maximum differences between the system fragility curves and the lower bounds are 13.40%, 6.00%, 3.55%, and 2.19%, respectively. Because there is a strong correlation between the component systems, the system vulnerability calculated based on the copula function is similar to the results when the component systems are completely correlated, and the results are quite different from the results when the component systems are completely unrelated. This indicates that the series–parallel model of the double-column pier simply supported girder bridge established in this paper considers the complex correlations among the members well, and the system fragility curves obtained by introducing the copula function on this basis are justifiable.
Figure 17.
Comparison of fragility curves between the copula function method and first-order bound method.
This paper only considers the seismic performance of high-speed railway bridges under the same design parameters. It can be affected by various geometrical properties (i.e., span length, pier column height, tie beam length, and so on), as well as different mechanical properties (i.e., bending rigidities of beams and columns). It needs to be further studied based on effective machine learning (ML), artificial intelligence (AI), and artificial neural network (ANN) algorithms [40,41,42,43,44].
6. Conclusions
This study investigated the probabilistic seismic damage characteristics of a double-column pier simply supported girder bridge. Through the development of a refined nonlinear numerical model and the execution of incremental dynamic analysis (IDA), the damage probabilities of individual bridge components as well as the overall system vulnerability were comprehensively assessed. Utilizing the OpenSEES platform allowed for the precise simulation of the complex responses of the bridge under seismic loads. Furthermore, integrating component interactions via a series–parallel relationship and a hierarchically iterated pair copula model facilitated a more thorough vulnerability assessment at the system level. Conducting IDA with varying peak ground acceleration (PGA) values enabled the simulation of the bridge’s behavior under different seismic intensities, thereby establishing a solid foundation for evaluating its seismic performance. The main conclusions of the study are as follows:
- (1)
- The curvature distribution of the pier and tie beam shows that the bottom of the pier, the bottom of the pier and tie beam, and the end of the tie beam are the key sections for damage control, which require special attention in the vulnerability analysis of a simply supported beam of a double-column pier.
- (2)
- With increasing PGA, the damage probability of each member increases, among which the damage probability of the support is the highest, followed by that of the pier column, and that of the tie beam is the smallest. When the PGA is 0.5 g, the probabilities of “minor damage”, “moderate damage”, “severe damage”, and “complete damage” for the G3 fixed bearing are 99.85%, 95.03%, 77.72%, and 60.00%, respectively, which means that the G3 fixed bearings are the most vulnerable members of the whole bridge.
- (3)
- The probabilities of RC tie beams displaying only “minor damage” and “moderate damage” under different ground motion levels are 73.04% and 51.50%, respectively, when PGA = 0.50 g, which are significantly lower than those of piers and columns. If a strong earthquake requires the tie beam to yield before the pier and the column to play the role of a “fuse”, it is necessary to opt .imize the arrangement of the tie beam so that it can better dissipate seismic energy.
- (4)
- Due to the redistribution of internal forces caused by local structural damage during an earthquake, the damage probability of the bottom section of the left pier and tie beam is greater than that of the right side at the same location, while the damage probability of the left-end section of the tie beam is less than that of the right end, and the vulnerable parts of the pier and tie beam do not appear on the same side.
- (5)
- When the PGA is 0.21 g (rare earthquake), the probabilities of “minor damage”, “moderate damage”, “severe damage”, and “complete damage” of the simply supported girder bridge system are 97.82%, 73.92%, 26.46%, and 12.76%, respectively. The contribution of bearings and piers to system vulnerability is dominant, while the vulnerability of tie beams is low.
- (6)
- The system vulnerability curves obtained based on the copula function method are located between the upper and lower bounds of the first-order boundary method and are closer to the lower bound, indicating that the series–parallel relationship between the members and the hierarchically iterative pair copula model established in this paper can reflect the correlation between the members more comprehensively.
It should be noted that this paper mainly focuses on the vulnerability of double-column pier simply supported girder bridges (when a single RC tie beam is set up) at the member level and the system level; since the type, number, and location of tie beams are bound to affect the damage distribution characteristics and seismic performance of the bridge, further study is needed.
Author Contributions
Conceptualization, Y.Z. and C.G.; methodology, Y.Z.; software, C.G. and S.Y.; validation, S.Y., W.G. and L.J.; formal analysis, C.G.; investigation, Y.Z.; resources, Y.Z.; data curation, W.G.; writing—original draft preparation, W.G.; writing—review and editing, L.J.; visualization, W.G.; supervision, Y.Z.; project administration, Y.Z.; funding acquisition, Y.Z. All authors have read and agreed to the published version of the manuscript.
Funding
The research described in this paper was financially supported by the Science and Technology Research Plan of the China National Railway Group Co., Ltd. (K2022G014).
Data Availability Statement
The data provided in this study could be released upon reasonable request.
Conflicts of Interest
Authors Yongzheng Zhou, Ce Gao and Sibo Yang were employed by the company China Railway Economic and Planning Research Institute Co., Ltd. The remaining authors declare that the research was conducted in the absence of any commercial or financial relationships that could be construed as a potential conflict of interest.
References
- Yuan, W.; Hu, B.; Fan, L. Aseismic capacity and assessment of column piers. J. Tongji Univ. (Nat. Sci.) 1996, 6, 60+602–605. [Google Scholar]
- Shen, X.; Ye, A.; Wang, X. Simplified calculation method of elastic–plastic displacement capacity for double-column bent. J. Tongji Univ. (Nat. Sci.) 2004, 42, 513–519. [Google Scholar] [CrossRef]
- Chen, L.; Huang, C.; Huang, Y.; Li, H. Seismic vulnerability models and simplified calculation method for regular highway girder bridges. J. Southwest Jiaotong Univ. 2018, 53, 146–155. [Google Scholar] [CrossRef]
- Shi, Y.; Li, J.; Qin, G.; Wang, S.; Wang, W.; Sun, Z. Review on seismic performance of bridge double-column bents. China J. Highw. Transp. 2021, 34, 134–154. [Google Scholar] [CrossRef]
- Wang, L. Influence of collar beam of double column high-rise pier bridge with short span on seismic performance. J. Highw. Transp. Res. Dev. 2011, 28, 92–97. [Google Scholar] [CrossRef]
- Xie, W.; Sun, L. Experimental and computational assessment of shear beams as earthquake resilient measure for double-column piers supported by pile-group. Eng. Struct. 2021, 242, 112509. [Google Scholar] [CrossRef] [Scilit]
- Ye, L.; Wang, Y.; Xie, W. Seismic fragility and loss assessment on earthquake-resilient double-column tall piers with shear links subjected to far-field and near-fault ground motions. Structures 2022, 45, 1774–1787. [Google Scholar] [CrossRef] [Scilit]
- Shen, G.; Yuan, W.; Pang, Y. Beige seismic fragility analysis based on Nataf transformation. Eng. Mech. 2014, 31, 93–100. [Google Scholar] [CrossRef]
- Chen, J.; Zhang, Y.; Geng, B. Seismic vulnerability analyses of double column bridge piers with straining beams. J. Civ. Eng. Manag. 2018, 35, 158–163. [Google Scholar] [CrossRef]
- Hu, M. Seismic fragility of typical simply supported bridge using kernel density estimation in high seismicity region. J. Railw. Sci. Eng. 2022, 19, 198–207. [Google Scholar] [CrossRef]
- Lu, G.; Wang, K.; Qiu, W.; Zhang, B. Seismic fragility models of double-column piers of small-and medium-span bridges in highway based on random forest. Earthq. Eng. Eng. Dyn. 2022, 42, 94–103. [Google Scholar] [CrossRef]
- Zhang, Y.; Xiao, F.; Badar, J. Influence of straining beams of the seismic fragility of double-column bridge piers. Stavební Obz.-Civ. Eng. J. 2019, 1, 32–44. [Google Scholar] [CrossRef] [Scilit]
- Nettis, A.; Ruggieri, S.; Uva, G. Corrosion-induced fragility of existing prestressed concrete girder bridges under traffic loads. Eng Struct. 2024, 314, 118302. [Google Scholar] [CrossRef] [Scilit]
- Zucca, M.; Reccia, E.; Longarini, N.; Eremeyev, V.; Crespi, P. On the structural behaviour of existing RC bridges subjected to corrosion effects: Numerical insight. Eng. Fail. Anal. 2023, 152, 107500. [Google Scholar] [CrossRef] [Scilit]
- Crespi, P.; Zucca, M.; Valente, M.; Longarini, N. Influence of corrosion effects on the seismic capacity of existing RC bridges. Eng. Fail. Anal. 2022, 140, 106546. [Google Scholar] [CrossRef] [Scilit]
- Fiorillo, G.; Ghosn, M. Fragility analysis of bridges due to overweight traffic load. Struct. Infrastruct. Eng. 2018, 14, 619–633. [Google Scholar] [CrossRef] [Scilit]
- Miluccio, G.; Losanno, D.; Parisi, F.; Cosenza, E. Traffic-load fragility models for prestressed concrete girder decks of existing Italian highway bridges. Eng. Struct. 2021, 249, 113367. [Google Scholar] [CrossRef] [Scilit]
- Zhou, H.; Fan, X.; Liu, Y.; Lu, D. Time-variant reliability analysis of simply supported PC girder bridges considering shrinkage, creep, resistance degradation and vehicle load flows. Structures 2023, 56, 104885. [Google Scholar] [CrossRef] [Scilit]
- Cornell, C.; Jalayer, F.; Hamburger, O.; Foutch, D. Probabilistic basis for 2000 SAC federal emergency management agency steel moment frame guidelines. J. Struct. Eng. 2002, 128, 526–533. [Google Scholar] [CrossRef] [Scilit]
- Tavares, D.; Padgett, J.; Paultre, P. Fragility curves of typical as-built highway bridges in eastern Canada. Eng. Struct. 2012, 40, 107–118. [Google Scholar] [CrossRef] [Scilit]
- Nielson, B. Analytical Fragility Curves for Highway Bridges in Moderate Seismic Zones; Georgia Institute of Technology: Atlanta, GA, USA, 2005. [Google Scholar]
- Song, S.; Wang, S.; Wu, G.; Xu, B. Seismic vulnerability analysis of small and medium span girder bridges. J. Vib. Shock 2020, 39, 118–125. [Google Scholar] [CrossRef]
- Mander, J.; Priestley, M.; Park, R. Theoretical stress–strain model for confined concrete. J. Struct. Eng. 1988, 114, 1804–1826. [Google Scholar] [CrossRef] [Scilit]
- Menegotto, M.; Pinto, P. Method of analysis for cyclically loaded RC plane frames including changes in geometry and nonelastic behavior of elements under combined normal force and bending. In Proceedings of the IABSE Symposium on Resistance and Ultimate Deformability of Structures Acted on by Well Defined Repeated Loads, Lisbon, Portugal, September 1973; pp. 15–22. [Google Scholar]
- Liu, Y.; Ren, Y.; Wang, D. Research on co-seismic displacement of ground surface at Liuhuanggou bridge of Lanzhou-Xinjiang high-speed railway caused by the 2022 Menyuan earthquake in Qinghai province. China Railw. Sci. 2022, 43, 42–50. [Google Scholar]
- Scawthorn, C.; Yanev, P. Hyogo-ken Nambu, Japanese earthquake. Eng. Struct. 1995, 17, 146–157. [Google Scholar] [CrossRef] [Scilit]
- GB 50111-2006; Code for Seismic Design of Railway Engineering (The 2009 Edition). Ministry of Construction of PRC: Beijing, China, 2009.
- Yang, P.; Li, L.; Lai, M. A new method for selecting inputting waves for time-history analysis. China Civ. Eng. J. 2000, 33, 33–37. [Google Scholar] [CrossRef]
- Wei, B.; Wang, W.; Wang, T.; Jiang, L.; Wang, T. Seismic responses of an HSR bridge and track simulation under longitudinal earthquakes. J. Earthq. Eng. 2020, 26, 4449–4470. [Google Scholar] [CrossRef] [Scilit]
- JTG/T 2231-01-2020; Specifications for Seismic Design of Highway Design. Ministry of Transport of the People’s Republic of China: Beijing, China, 2020.
- Jiang, H.; Jin, J.; Wang, Z.; Bai, X.; Wang, M. Probabilistic seismic damage characteristics for piers of deep-water continuous rigid frame bridge based on IDA method. China J. Highw. Transp. 2017, 30, 89–100. [Google Scholar] [CrossRef]
- Li, Y.; Zhu, X.; Yang, Q. Application of capacity spectrum method considering soil-structure interaction effects in railway bridge engineering. J. China Railw. Soc. 2011, 33, 109–114. [Google Scholar] [CrossRef]
- Choi, E.; DesRoches, R.; Nielson, B. Seismic fragility of typical bridges in moderate seismic zones. Eng. Struct. 2004, 26, 187–199. [Google Scholar] [CrossRef] [Scilit]
- Mander, J.; Kim, D.; Chen, S.; Premus, G. Response of Steel Bridge Bearings to Reversed Cyclic Loading: NCEER-96-0014; National Center for Earthquake Engineering Research, State University of New York: Buffalo, NY, USA, 1996. [Google Scholar]
- Li, L.; Wu, W.; Huang, M.; Wang, L. Study on system vulnerability of medium span reinforced concrete continuous girder bridge under earthquake excitation. China Civ. Eng. J. 2012, 45, 152–160. [Google Scholar] [CrossRef]
- Shen, X.; Ye, A.; Wang, X. Seismic behavior analysis for link beam of double-column bent. J. Tongji Univ. (Nat. Sci.) 2013, 41, 342–347. [Google Scholar] [CrossRef]
- Song, S.; Qian, Y.; Wu, G. Research on seismic fragility method of bridge system based on Copula function. Eng. Mech. 2016, 33, 193–200+207. [Google Scholar] [CrossRef]
- Jaworski, P.; Durante, F.; Hardle, W.; Rychlik, T. Copula Theory and Its Applications; Springer: Berlin, Germany, 2010. [Google Scholar]
- Song, S.; Wu, Y.; Xu, B.; Wu, G.; Zhang, J. Pair Copula technique of seismic vulnerability assessment of cable-stayed bridge system. Eng. Mech. 2021, 38, 110–123. [Google Scholar] [CrossRef]
- Wan, S.; Guan, S.; Tang, Y. Advancing bridge structural health monitoring: Insights into knowledge-driven and data-driven approaches. J. Data Sci. Intell. Syst. 2023, 2, 129–140. [Google Scholar] [CrossRef] [Scilit]
- Himanshu, G.; Khidhir, B.; Manchiryal, R. Solution of Structural Mechanic’s Problems by Machine Learning. Int. J. Hydromechatronics 2022, 2, 22–43. [Google Scholar] [CrossRef] [Scilit]
- Peng, B.; Gao, D.; Wang, M.; Zhang, Y. 3D-STCNN: Spatiotemporal Convolutional Neural Network Based on EEG 3D Features for Detecting Driving Fatigue. J. Data Sci. Intell. Syst. 2023, 2, 1–13. [Google Scholar] [CrossRef] [Scilit]
- Liu, B.; Lu, W. Surrogate Models in Machine Learning for Computational Stochastic Multi-Scale Modelling in Composite Materials Design. Int. J. Hydromechatron. 2022, 5, 336–365. [Google Scholar] [CrossRef] [Scilit]
- Simani, S.; Yat, P.; Saverio, F.; Castaldi, P. Dynamic Neural Network Architecture Design for Predicting Remaining Useful Life of Dynamic Processes. J. Data Sci. Intell. Syst. 2023, 2, 141–152. [Google Scholar] [CrossRef] [Scilit]



Disclaimer/Publisher’s Note: The statements, opinions and data contained in all publications are solely those of the individual author(s) and contributor(s) and not of MDPI and/or the editor(s). MDPI and/or the editor(s) disclaim responsibility for any injury to people or property resulting from any ideas, methods, instructions or products referred to in the content. |
© 2024 by the authors. Licensee MDPI, Basel, Switzerland. This article is an open access article distributed under the terms and conditions of the Creative Commons Attribution (CC BY) license (https://creativecommons.org/licenses/by/4.0/).