


Abstract
During vacuum induction melting (VIM) of superalloys, oxygen and nitrogen control involves interfacial processes at both the melt free surface and the crucible–melt interface, where melt flow is an important factor affecting reaction kinetics. A coupled electromagnetic and fluid flow model with a deformable free surface was developed and validated for a 3 t industrial VIM furnace with two electromagnetic excitation modes. The melt flow under the Heating and Stirring modes is compared, with particular attention to the role of free-surface deformation, and the effects of input power and filling ratio are further examined. The results show that at an input power of 190 kW and a filling ratio of 85%, the Heating mode produces two counter-rotating vortices separated by a low-velocity mid-region, while the Stirring mode generates a dominant upper vortex covering most of the melt volume with a smaller counter-rotating vortex at the bottom. The Stirring mode achieves approximately 1.3 times the surface velocity, 1.7 times the wall friction velocity, and half the mixing time of the Heating mode. Free-surface deformation significantly affects the predicted flow structure, particularly under the Heating mode. Parametric results further show that input power mainly changes the flow intensity without altering the flow structure under either mode. By contrast, the filling ratio strongly affects the flow structure under the Heating mode, while that under the Stirring mode is largely preserved. These findings provide insight into the melt flow conditions relevant to oxygen and nitrogen removal during VIM processing.
1. Introduction
Vacuum induction melting (VIM) is widely employed as a primary melting process for nickel-based superalloys. The control of dissolved gases, particularly oxygen and nitrogen, is a key metallurgical objective during VIM processing. This involves reactions at two distinct interfaces: the free surface, where nitrogen removal and carbon–oxygen reactions take place, and the crucible–melt interface, where crucible decomposition releases oxygen into the melt. The rates of these interfacial reactions are generally considered to be limited by mass transfer, which is dependent on the melt flow conditions [1,2,3].
The melt flow in a VIM furnace is largely driven by the electromagnetic force produced by the induction coils. Conventional induction furnaces employ a fixed excitation configuration, using either a single coil or multiple coil sections, resulting in prescribed flow conditions. Some industrial furnaces, however, are equipped with multiple coil groups whose excitation mode can be switched during processing, producing different flow conditions [4,5]. Understanding how operating parameters influence melt flow behavior and the associated mass-transfer conditions in induction furnaces with switchable excitation modes is essential for optimizing oxygen and nitrogen removal.
Owing to the difficulty of direct melt flow measurements under high-temperature vacuum conditions, the electromagnetically driven flow in induction furnaces has been extensively investigated using numerical simulations. Tarapore and Evans [6] developed a coupled electromagnetic and fluid flow model and validated the predictions against surface velocity measurements. El-Kaddah et al. [7] examined the effect of operating frequency on the flow pattern and turbulence characteristics over a range of 50 to 5000 Hz. Various turbulence modeling approaches have been applied to describe the turbulent recirculating flow [8,9,10,11]. These flow calculations have also been used to investigate related phenomena, including inclusion motion [12,13,14,15] and nitrogen removal [16,17]. Beyond single-mode excitation, a few works have examined different electromagnetic configurations [18,19]. Stiller et al. [20] reviewed experimental and numerical studies of flow driven by rotating and traveling magnetic fields, characterizing the distinct flow structures under each field type. Frizen et al. [21] studied a multi-section induction crucible furnace with phase-shifted excitation between inductor sections, reporting a transition from double-vortex to single-vortex flow. In addition to the bulk flow, melt free-surface deformation induced by electromagnetic forcing has been investigated [22,23,24,25]. Spitans et al. [26] simulated free surface dynamics in induction furnaces by coupling electromagnetic and fluid flow calculations with a volume of fluid (VOF) two phase flow model. Garcia-Michelena et al. [27] examined heat transfer in a laboratory-scale VIM furnace, with the free-surface deformation using an arbitrary Lagrangian–Eulerian (ALE) moving mesh approach. The same group subsequently compared the ALE and level set methods for free-surface tracking during induction melting [28]. However, the effects of different excitation modes and operating parameters, such as input power and filling ratio, on melt flow behavior and free-surface deformation in industrial induction furnaces require further systematic examination.
The present study focuses on an industrial VIM furnace with two excitation modes, referred to as Heating mode and Stirring mode. A coupled electromagnetic and fluid flow model with a deformable free surface is developed and validated to investigate the melt flow. The flow behavior under the two modes is compared, and the effect of free surface deformation on the predicted flow behavior is assessed. Since the input power is adjusted and the melt mass varies as charging proceeds, parametric calculations are further performed over a range of input powers and filling ratios. The surface velocity, wall friction velocity, and mixing time are used to characterize the flow conditions relevant to oxygen and nitrogen removal.
2. Numerical Model
2.1. Physical Model and Assumptions
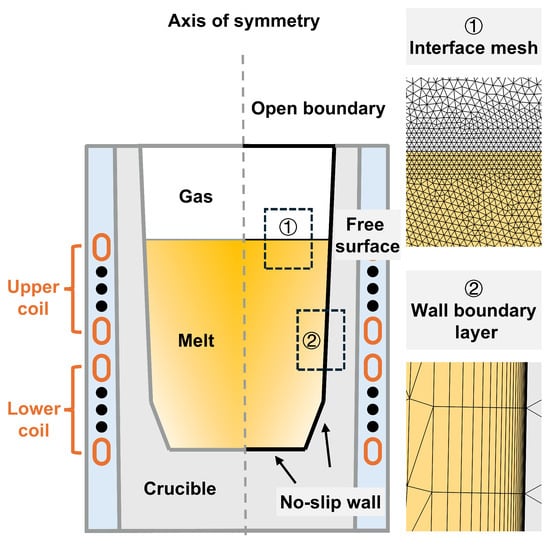
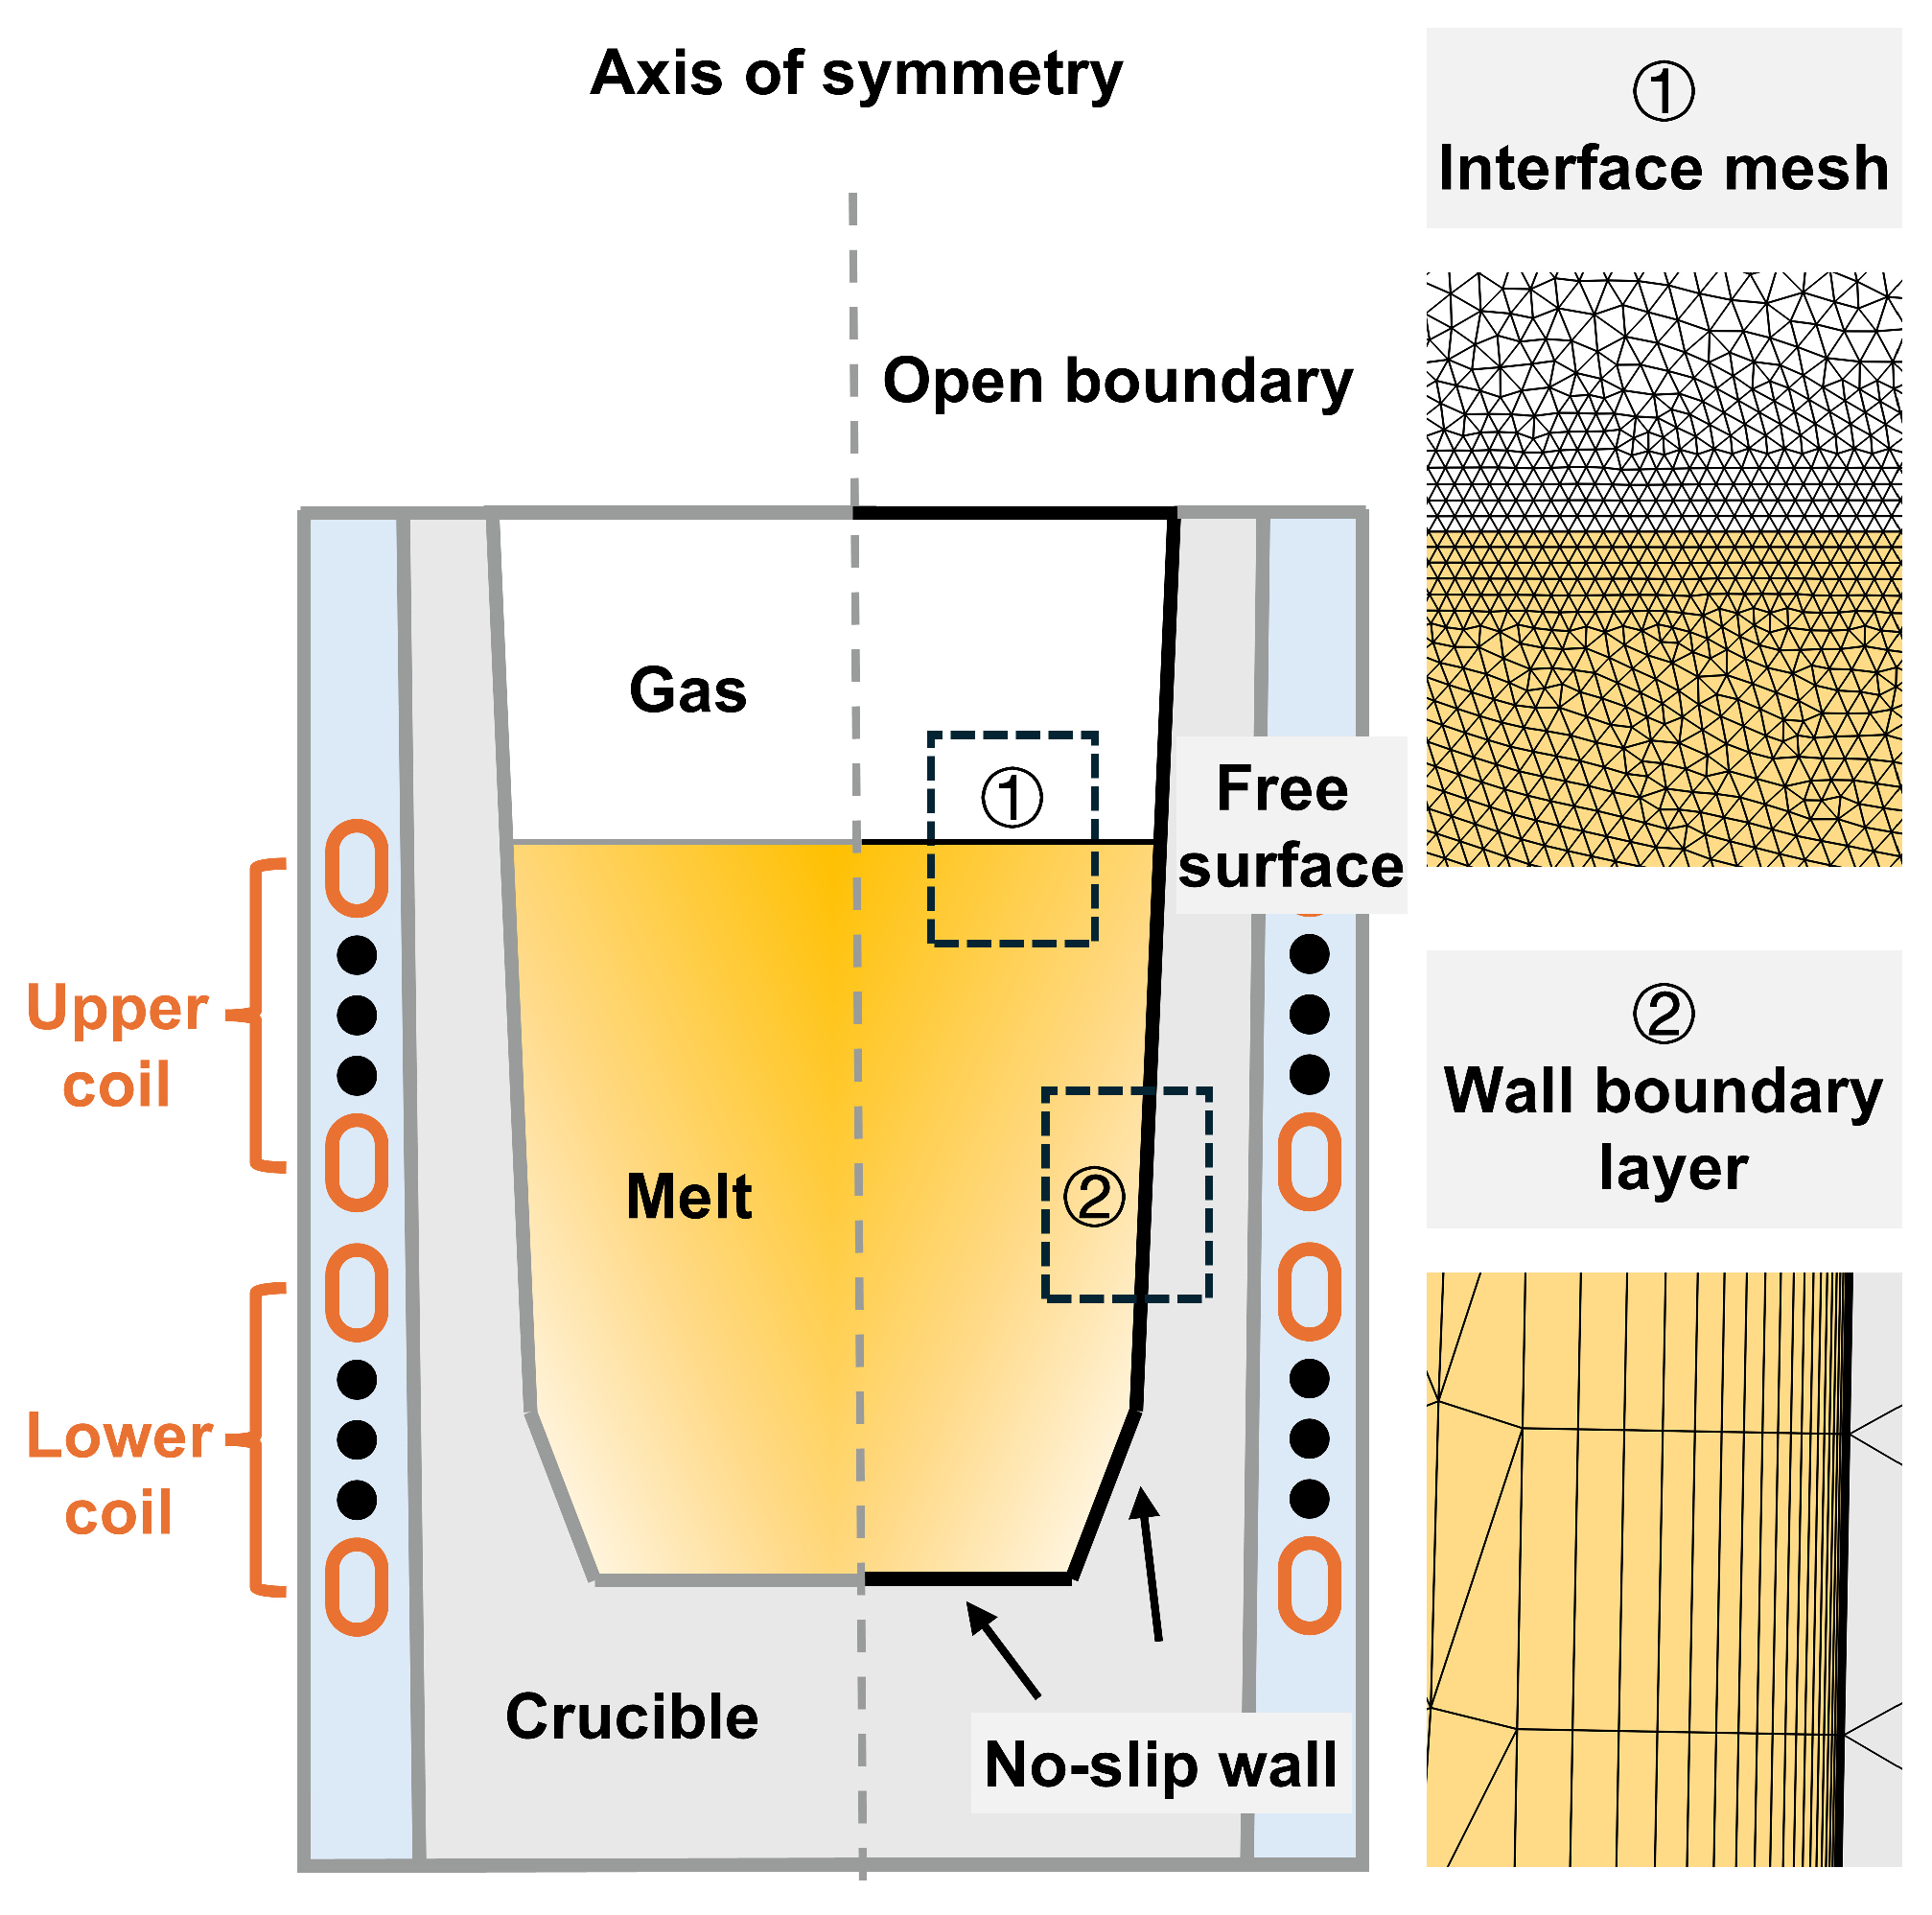
This work considers a 3 t industrial VIM furnace equipped with two coaxial coil groups, each consisting of six turns, which can be operated in two excitation modes. For VIM processing of the nickel-based superalloy GH4169, equivalent to Inconel 718, the simulation focuses on the stage between complete melting and tapping. As shown in Figure 1, the computational domain consists of the upper and lower coils, the crucible with a chamfered bottom corner, the melt, and the gas region. At 85% filling ratio, the melt pool has a diameter of approximately 0.74 m and a height of approximately 0.91 m.
Figure 1.
Schematic of the geometry and boundary conditions, and local mesh details.
The following assumptions are adopted:
- (1)
- The furnace geometry and electromagnetic field are axisymmetric, and a two-dimensional axisymmetric model is employed.
- (2)
- The melt is treated as an incompressible Newtonian fluid with constant physical properties.
- (3)
- Slag on the melt surface is limited under vacuum operation, and its effect on the melt flow is neglected.
2.2. Mathematical Model
2.2.1. Electromagnetic Model
The electromagnetic field in the induction furnace is described by Maxwell’s equations:
The constitutive relations are:
where is the magnetic field intensity, is the current density, is the electric field intensity, is the magnetic flux density, is the time, is the vacuum permeability, is the relative permeability, is the electrical conductivity, and is the melt velocity.
The magnetic vector potential , defined by , is introduced to solve the above equations. Since the coil current is time-harmonic, the electromagnetic field is solved in the frequency domain. The electric field is expressed as , where is the angular frequency and is the imaginary unit.
The time-averaged Lorentz force, which drives the melt flow, is calculated as:
where is the complex conjugate of and denotes the real part.
The time-averaged volumetric Joule heat generation rate, , is given by:
2.2.2. Fluid Flow and Turbulence Model
The flow of the melt and the gas phase is governed by a single set of incompressible continuity and Navier–Stokes equations:
where is the pressure, is the turbulent viscosity, is the gravitational acceleration, and is the surface tension force. The fluid density ρ and dynamic viscosity μ are calculated as phase-weighted averages using the level set function φ, as defined in Section 2.2.3.
The low-Reynolds-number k–ε model in the Abe–Kondoh–Nagano (AKN) formulation [29] is employed to describe the turbulent flow. This model resolves the viscous sublayer without relying on wall functions, enabling accurate prediction of the wall friction velocity. The transport equations and the turbulent viscosity are given by:
where is the production term of turbulent kinetic energy, , , , , and are model constants, and are damping functions.
2.2.3. Free-Surface Model
Two treatments of the melt surface are considered. For the deformable surface case, the melt–gas interface is tracked using the level set method, and the electromagnetic and fluid flow models are bidirectionally coupled. The level set function is defined as 1 in the melt and 0 in the gas, with the interface located at = 0.5. The transport of is governed by:
where is the reinitialization parameter, and is the interface thickness parameter.
The fluid density and dynamic viscosity are interpolated between the two phases as and . The surface tension force is modeled using the continuum surface force (CSF) method as:
where is the surface tension coefficient, is the interface curvature, is the interface unit normal, and is the Dirac delta function.
For the non-deformable surface case, the melt surface is prescribed as a free-slip boundary, reducing the model to a single phase flow without the level set equation.
2.2.4. Thermal Model
A transient energy equation is solved within the melt domain to compare the thermal behavior of the two excitation modes:
where is the specific heat capacity, is the thermal conductivity, and is the turbulent Prandtl number.
2.3. Computational Conditions
For the electromagnetic model, an infinite element domain is applied at the outer boundary of the model. The two coil groups serve as excitation sources at a specified input power. For the fluid flow model, as shown in Figure 1, the crucible inner surface is treated as a no-slip wall. For the deformable surface case, an open boundary condition is imposed at the top of the gas domain, and a contact angle of 120° is prescribed at the melt–wall boundary. The flow field is initialized from a quiescent state. For the heat transfer model, a radiation boundary condition is applied at the melt free surface. At the crucible wall, a convective boundary condition is imposed with heat transfer coefficients of 18 W·m−2·K−1 at the sidewall and 5 W·m−2·K−1 at the bottom. The melt is initialized at a uniform temperature of 1450 °C.
The physical properties used in the simulations are listed in Table 1.
Table 1.
Physical properties used in the simulations [27,30]. Data form [27,30].
The computational domain is discretized using an unstructured mesh. As shown in Figure 1, the mesh is locally refined near the melt–gas interface to accurately capture the free-surface deformation. At the crucible wall, a boundary layer mesh is applied with a first layer thickness of 0.01 mm, ensuring y+ < 1 for all simulations, consistent with the requirement of the adopted low-Reynolds-number turbulence model. Boundary layers are also applied at the coil surfaces to resolve the electromagnetic skin effect. A grid independence study is conducted under the Stirring mode at 190 kW and 85% filling ratio using four meshes of 48,000, 80,000, 114,000, and 154,000 elements. The 114,000-element mesh is adopted, as deviations in surface-averaged velocity and wall-averaged friction velocity remain below 1% relative to the finest mesh. For all deformable-surface simulations, the mass conservation of the level set field is monitored; the maximum deviation remains below 0.1%.
2.4. Simulation Cases and Flow Indicators
Three process parameters are varied in this study: the excitation mode, the input power, and the filling ratio. The two excitation modes differ in the relative phase of the two coil groups and the operating frequency. In the Heating mode, the two coil groups operate in phase at 170 Hz. In the Stirring mode, the two coil groups operate with a 90° phase shift at 80 Hz. The input power refers to the combined power supplied to the two coil groups. The filling ratio, defined as the ratio of the charged mass to the rated furnace capacity (3 t), determines the melt height in the crucible.
The two excitation modes are first compared at an input power of 190 kW and a filling ratio of 85%. Parametric calculations are then performed under both modes by independently varying one parameter while holding the other fixed. All simulations are run until a quasi-steady state is reached.
To characterize the flow conditions relevant to free-surface and crucible–melt interface reactions, three flow indicators are evaluated: the mixing time, the surface-averaged velocity, and the wall-averaged friction velocity. The mixing time is evaluated using the volume method [31], which assesses homogenization over the entire melt volume. The mixing degree is the fraction of the melt volume where the tracer concentration is within ±3% of the fully mixed value, and the mixing time is the instant this fraction reaches 99.9%. The tracer is released from a point source located near the axis at the bottom of the crucible. The surface-averaged velocity is defined as the area-weighted average of the velocity magnitude over the free surface. The wall-averaged friction velocity is obtained as the area-weighted average of the local friction velocity over the crucible wall in contact with the melt. For comparisons across operating conditions, the three flow indicators are normalized by their respective values under the Stirring mode at 190 kW and 85% filling ratio.
3. Model Validation
The model is validated in terms of the electromagnetically driven flow and the free-surface deformation. Avatar and Mazumdar [32] simulate the melt flow driven by a traveling magnetic field in a cylindrical ladle using a three-dimensional model. The ladle is stirred by three phase helical coils excited with a 120° phase shift. This stirring mechanism is analogous to that induced by the two phase excitation with a 90° phase shift employed in the Stirring mode of the present study. This case is reproduced using a two-dimensional axisymmetric formulation. In particular, the melt surface is treated as a non-deformable surface, following their setup.
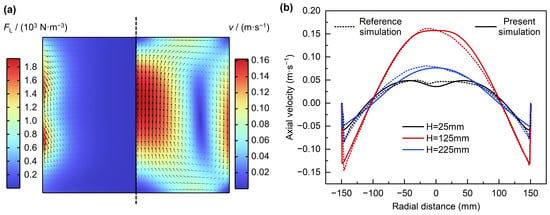
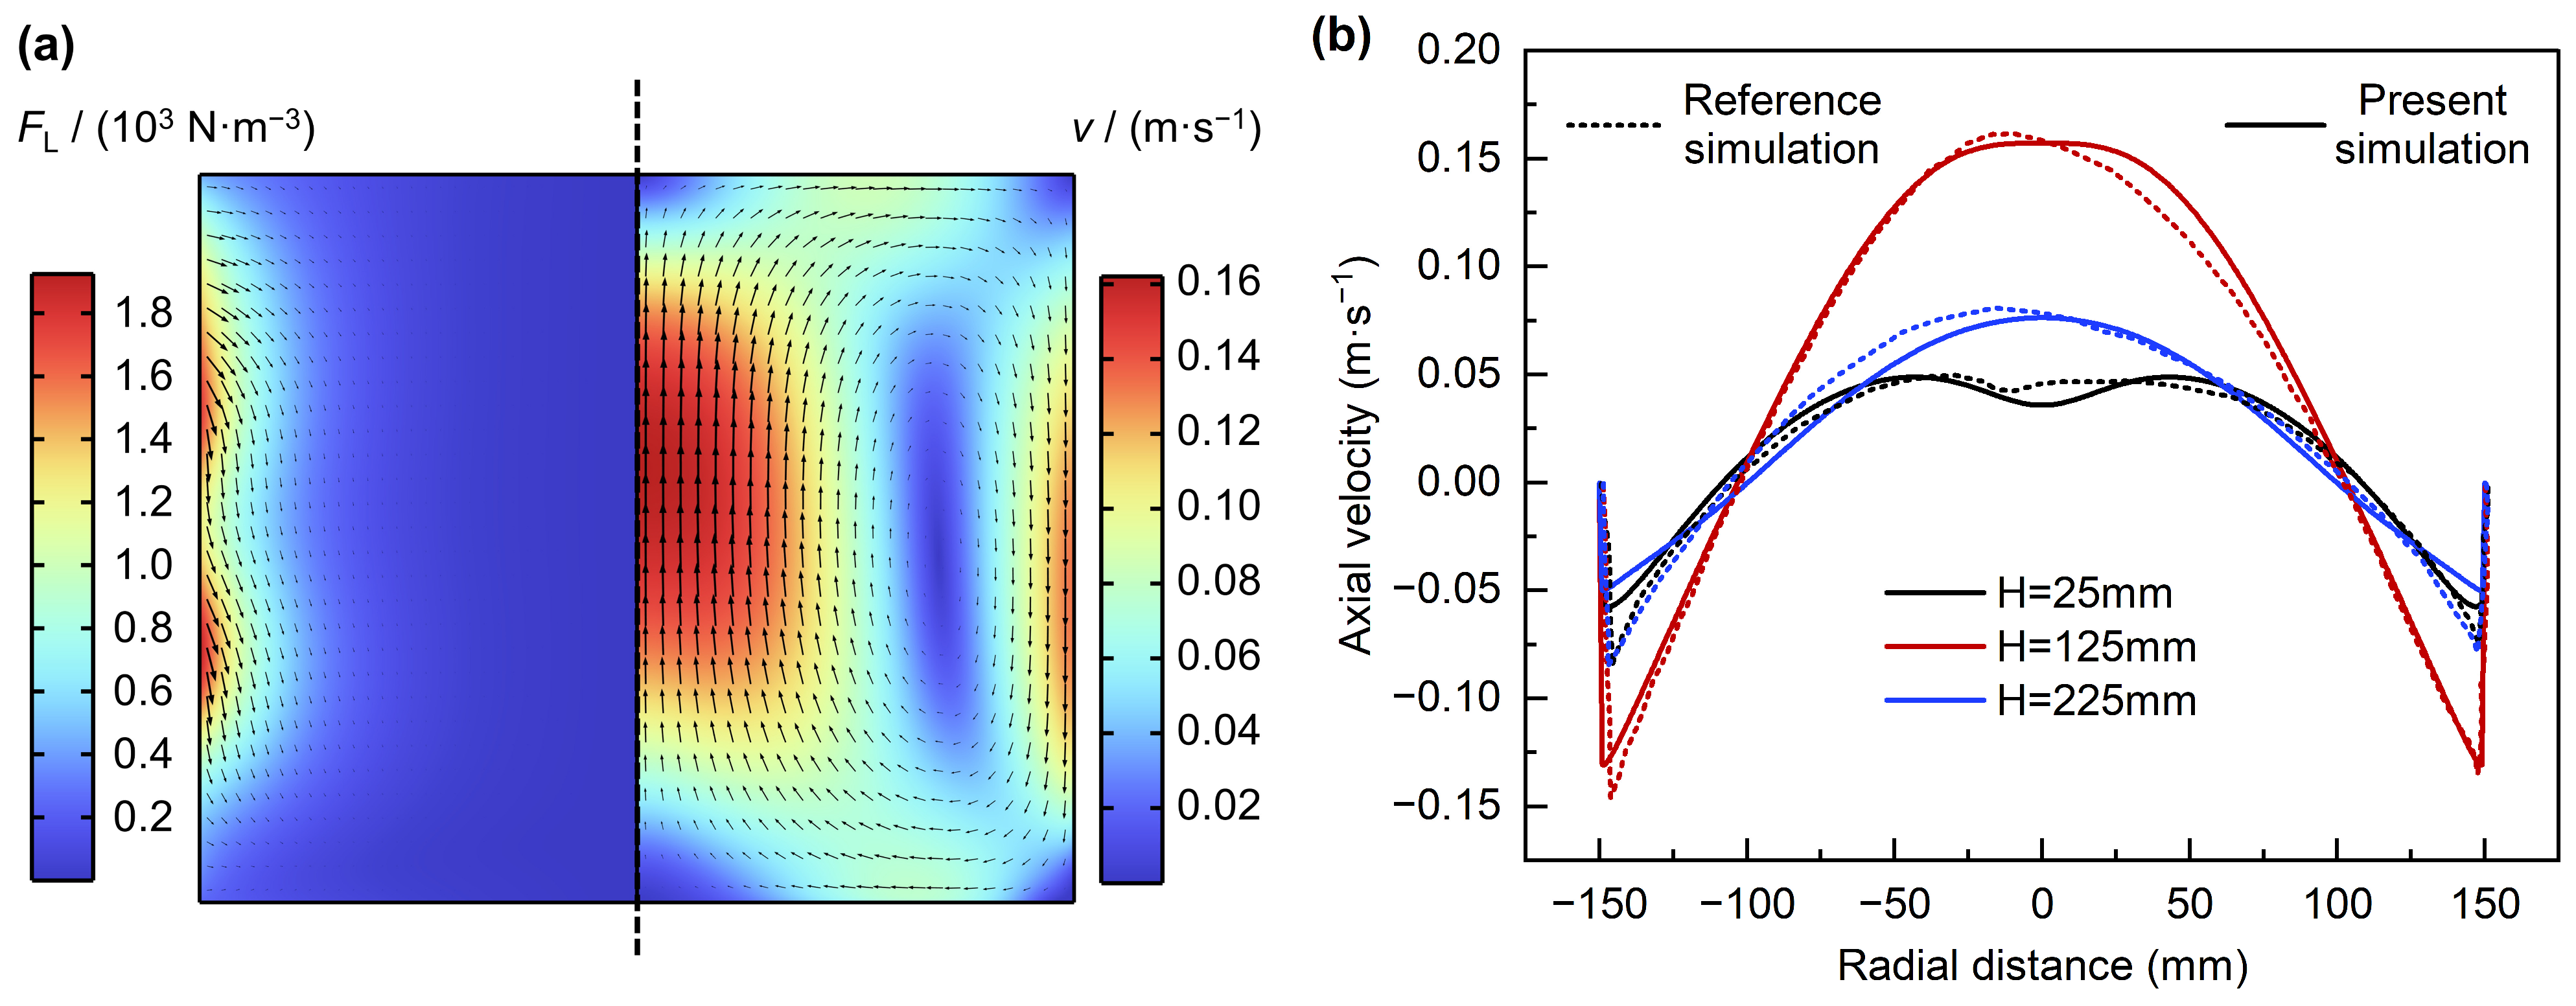
Figure 2a compares the predicted Lorentz force density and velocity field on the r–z plane with the reference. The distributions and magnitudes agree well with the reference, with predicted maximum values of 1925 N·m−3 and 0.16 m·s−1. The radial profiles of the axial velocity at three bath depths, shown in Figure 2b, also show good agreement. Owing to the two-dimensional axisymmetric formulation, the present model cannot capture the asymmetric features reported in the reference; nevertheless, the overall agreement confirms that it reliably predicts the electromagnetically driven flow.
Figure 2.
Comparison with the numerical results of Avatar and Mazumdar [32]. (a) Lorentz force density (left) and velocity field (right) on the r–z plane. (b) Radial profiles of axial velocity at three bath depths. Reprinted with permission from ref. [32]. 2025, John Wiley and Sons.
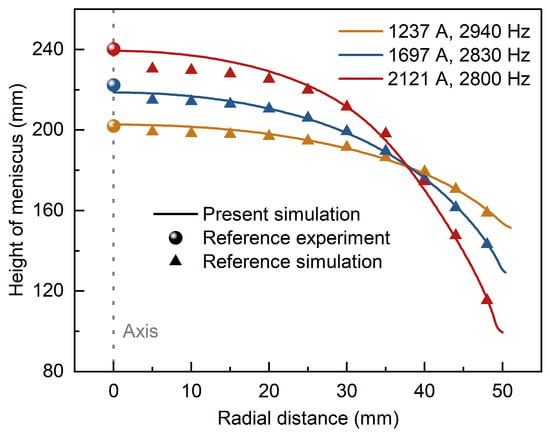
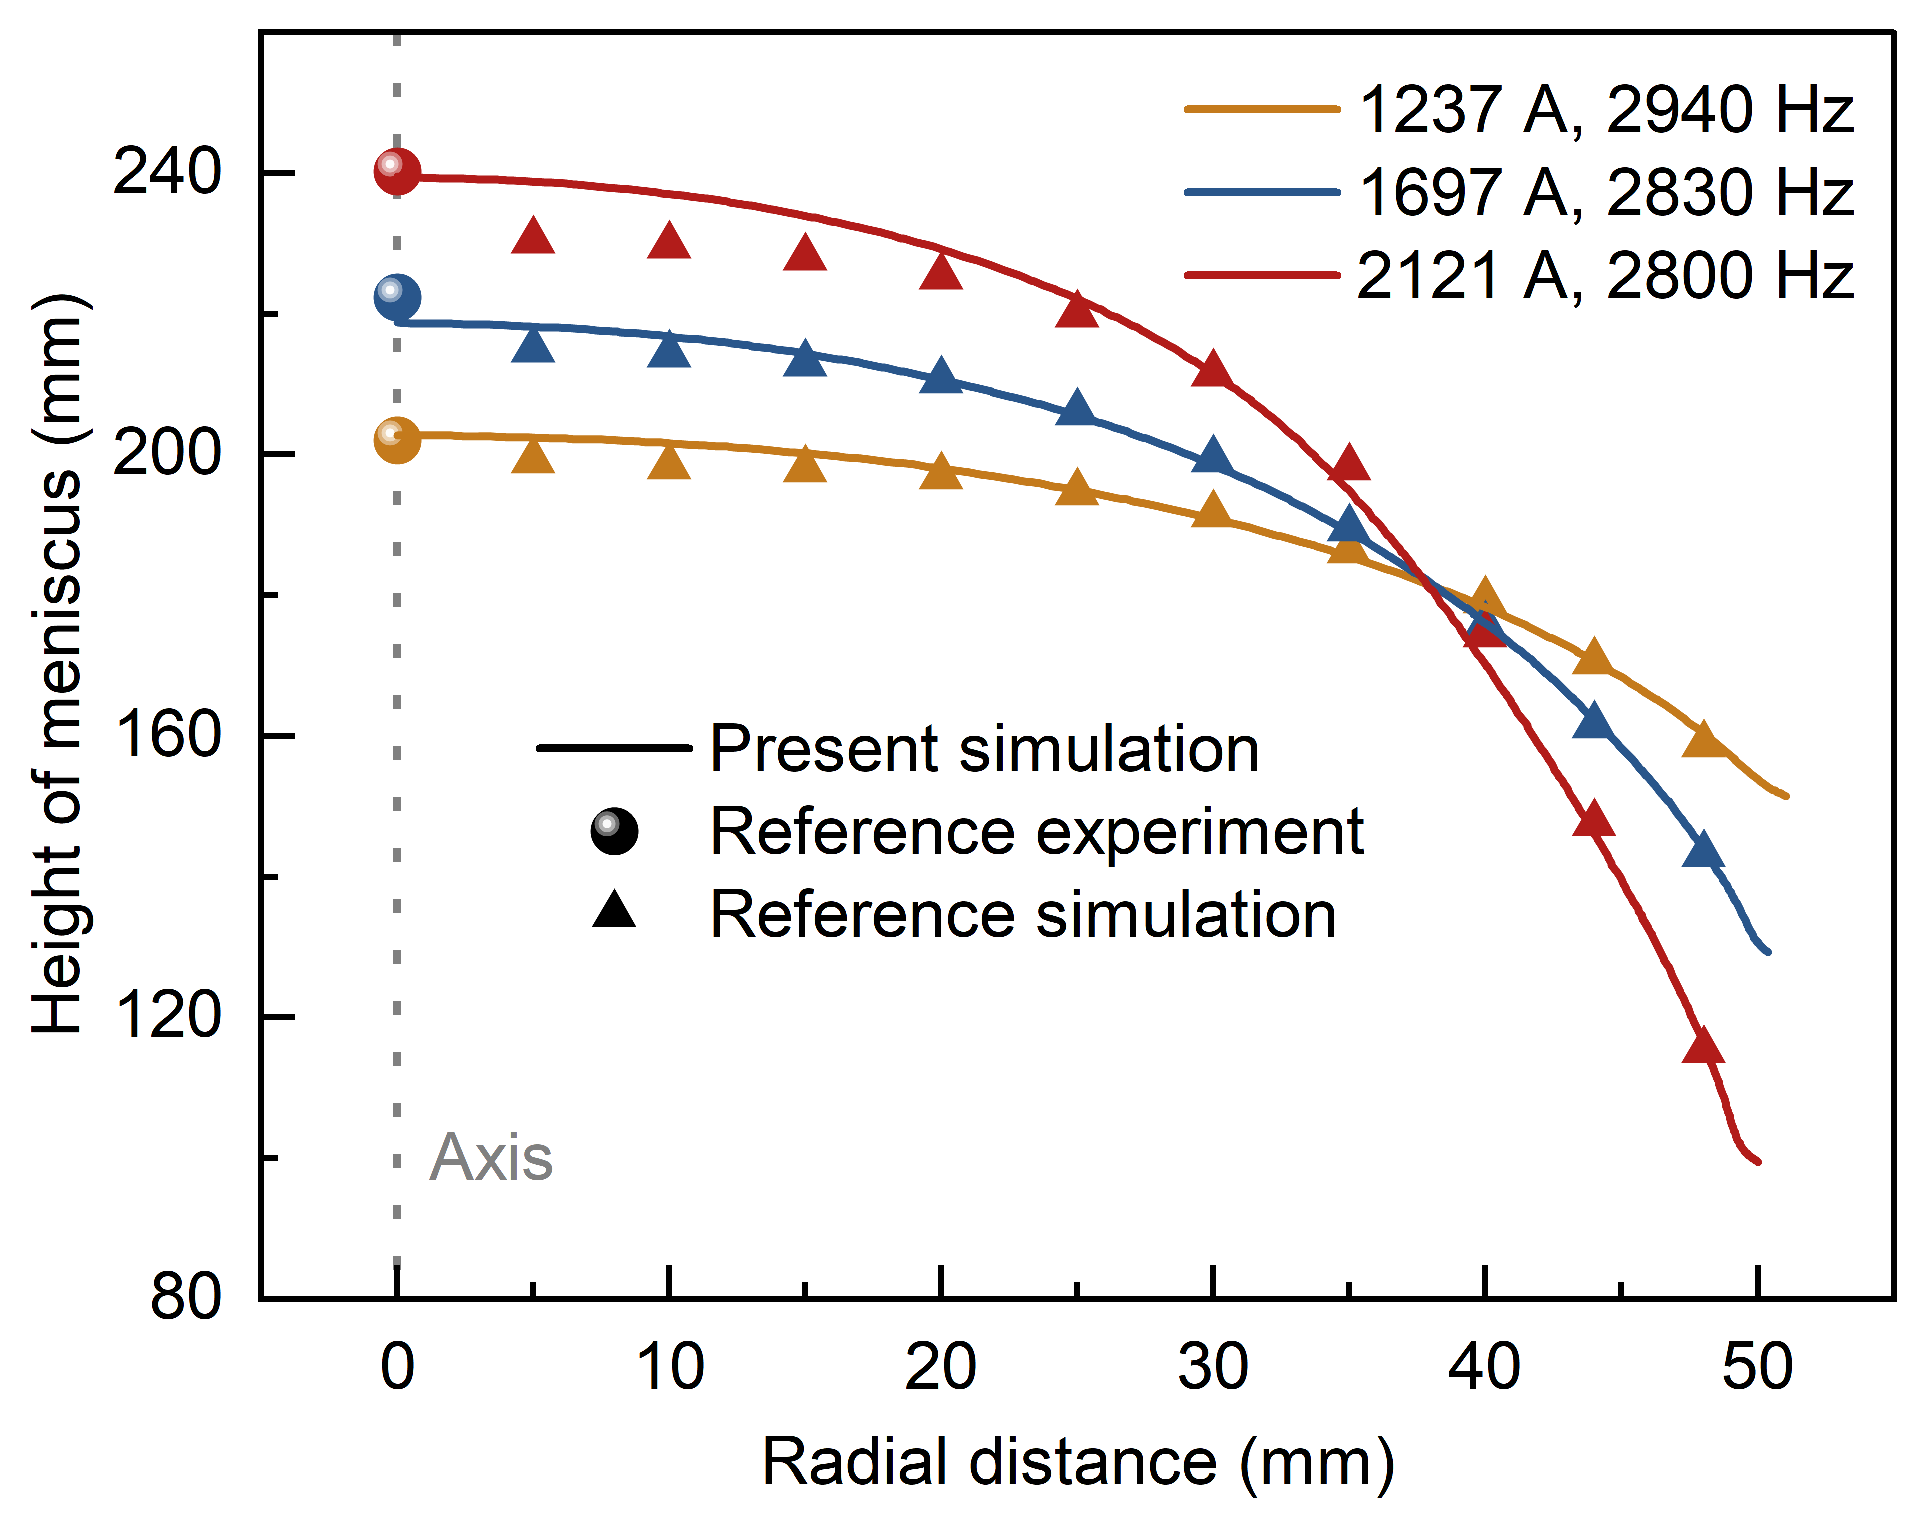
To further validate the free-surface deformation model, the experimental and numerical study of Buliński et al. [33] is considered. Their work investigates melt flow in a vacuum induction furnace operating without phase shifted excitation, corresponding to the Heating mode of the present study. The simulation is performed for all three input power levels reported in the reference. The melt surface is treated as a deformable interface tracked by the level set method, while the reference uses the VOF approach.
Figure 3 compares the computed meniscus profiles with the numerical and experimental results of the reference. The predicted profiles are in good agreement with the reference simulation, with a maximum deviation from the experimental measurements below 2% for all three combinations of coil RMS current and frequency. These results validate the deformable-surface model for free-surface deformation prediction.
Figure 3.
Comparison with the numerical and experimental results of Buliński et al. [33] for three combinations of coil RMS current and frequency. Data from [33].
4. Results and Discussion
4.1. Electromagnetic and Flow Characteristics of the Two Excitation Modes
- (1)
- Electromagnetic field and Lorentz force
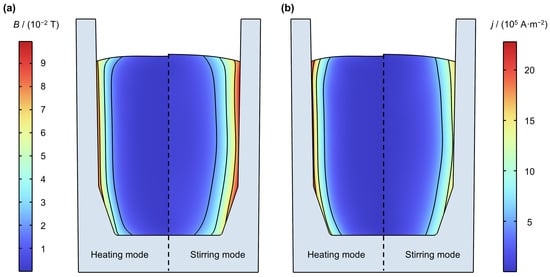
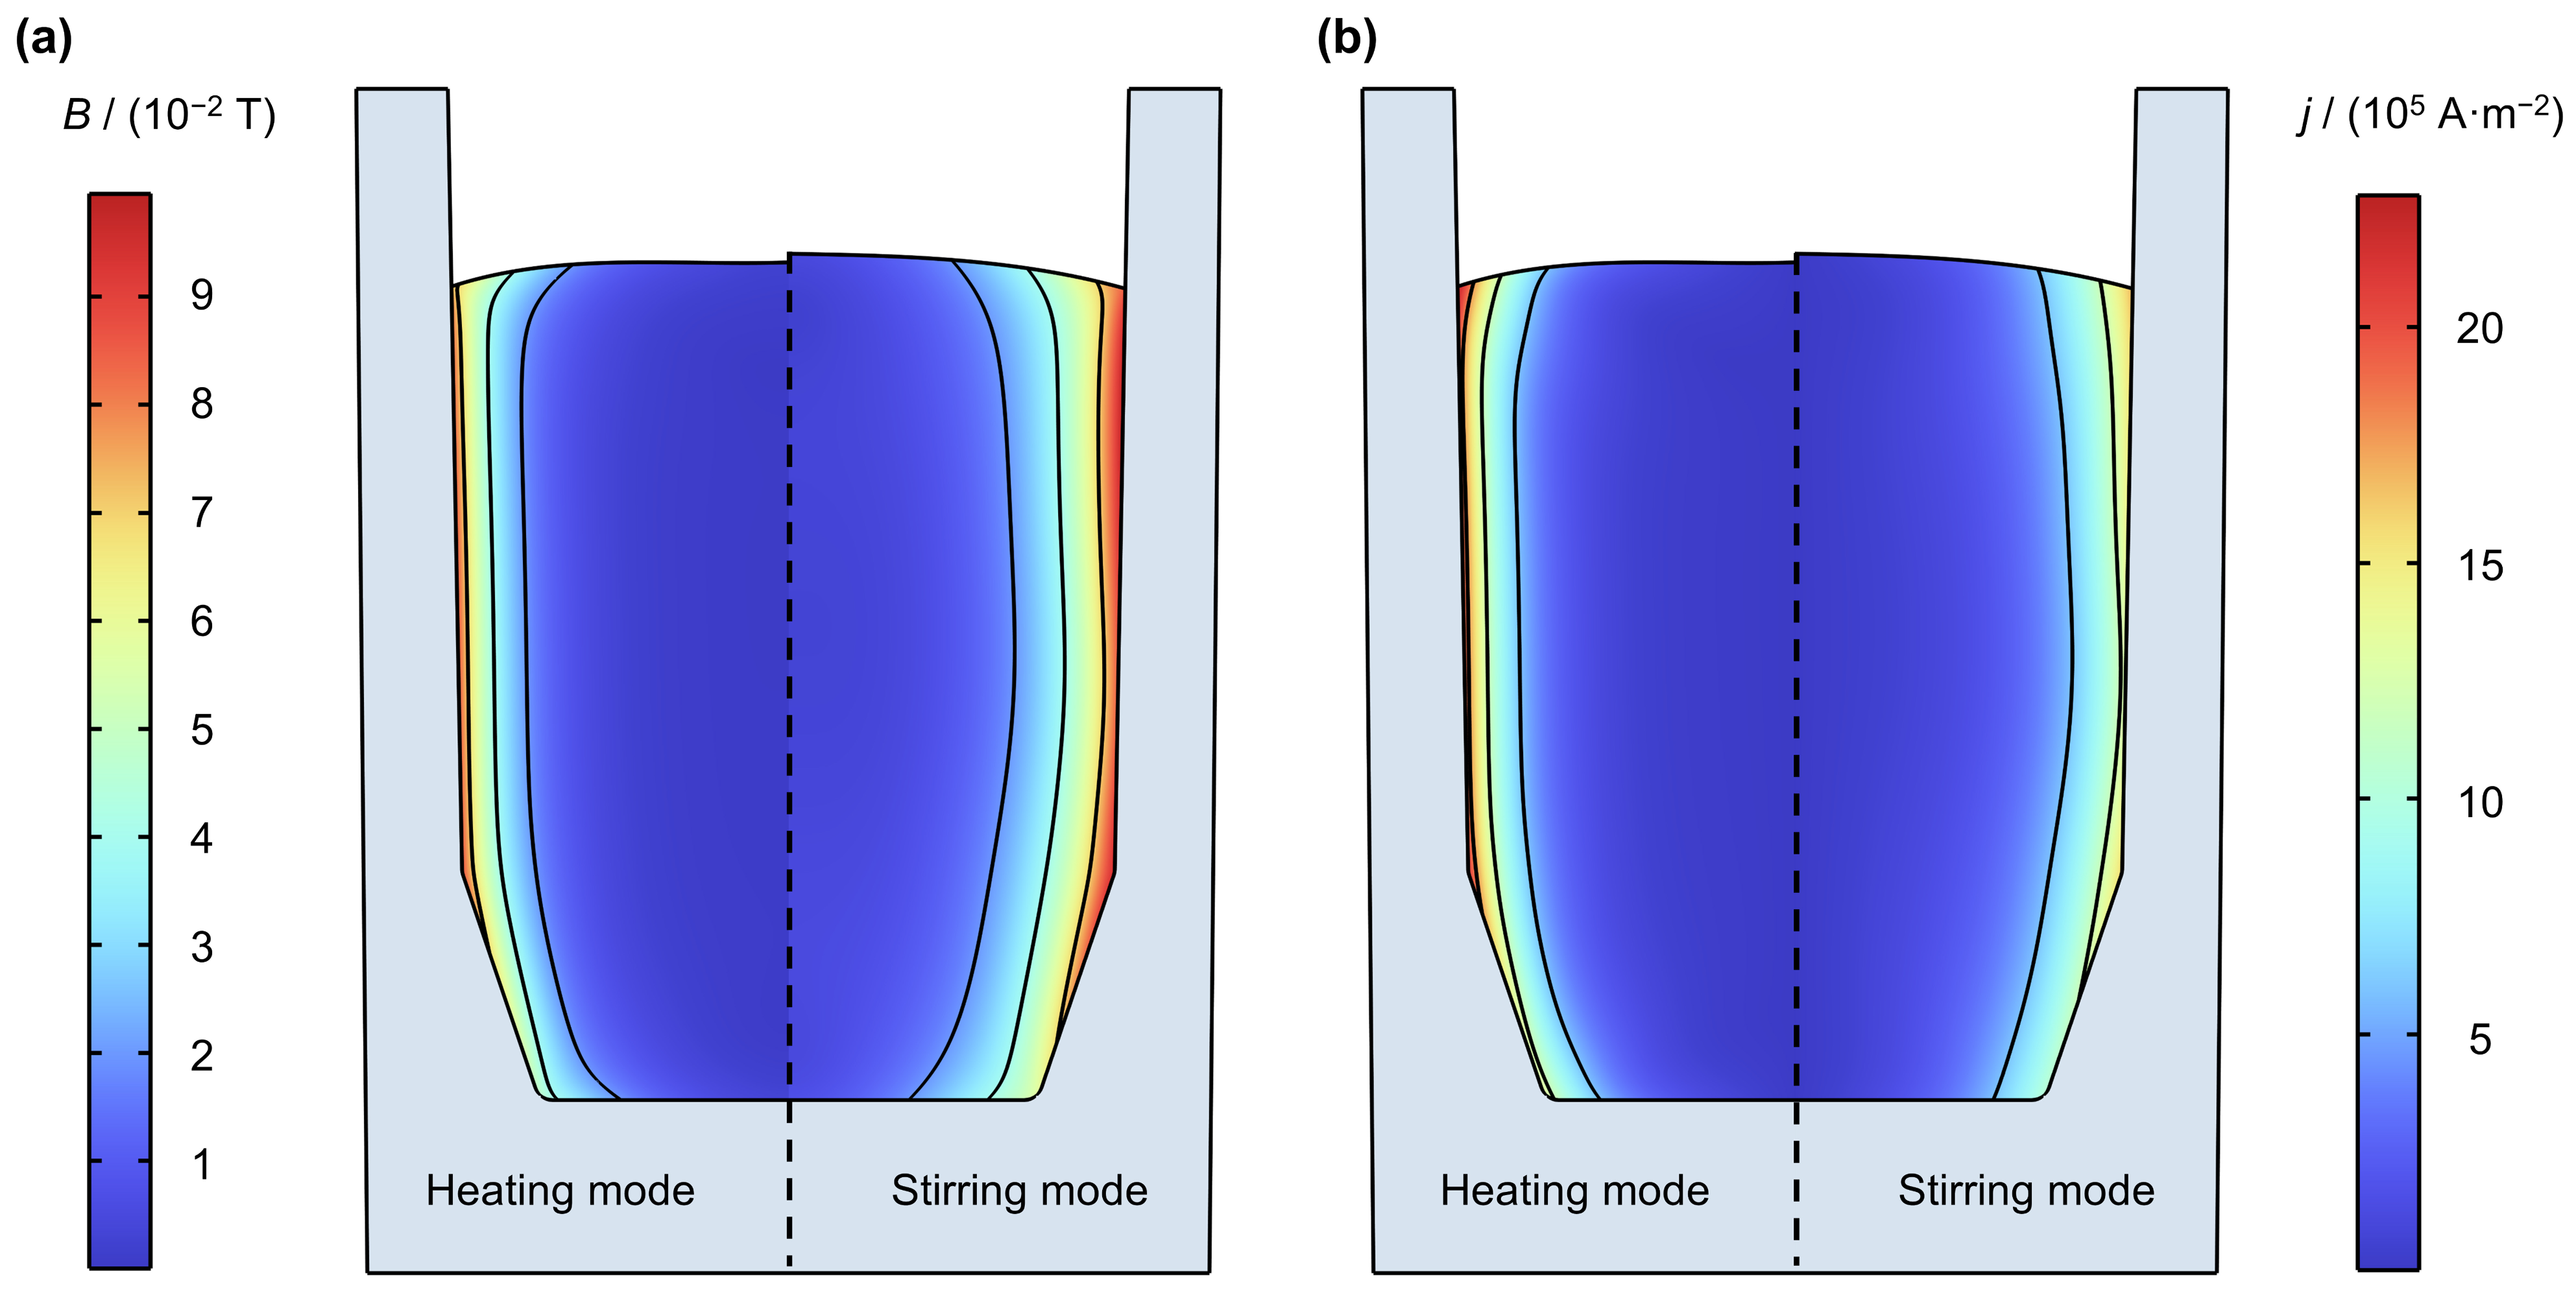
Figure 4 presents the distributions of magnetic flux density and current density under the two modes. Under both modes, B and j are concentrated in the near-wall region due to the skin effect. The 90° phase shift in the Stirring mode produces a pronounced axial non-uniformity in B and j, whereas the in-phase excitation in the Heating mode results in a relatively uniform distribution. In addition, j is higher but confined to a narrower region under the Heating mode, owing to the higher operating frequency.
Figure 4.
(a) Magnetic flux density B and (b) current density j distributions. In each subfigure, the left half corresponds to the Heating mode and the right half to the Stirring mode.
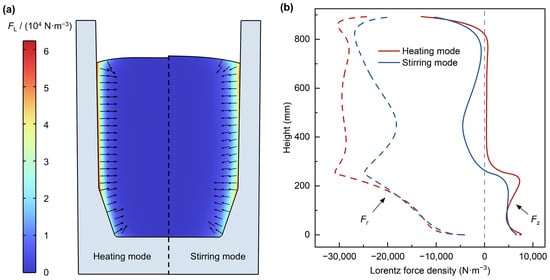
Figure 5a illustrates the distribution of the time-averaged Lorentz force in the melt under both modes. The force is concentrated near the wall under both modes. The Heating mode shows a higher peak (6.2 × 10⁴ N·m−3, compared to 5.4 × 10⁴ N·m−3 under the Stirring mode) and a thinner near-wall layer, both due to its higher operating frequency.
Figure 5.
(a) Time-averaged Lorentz force density distribution and direction, and (b) radial (Fr) and axial (Fz) components of the Lorentz force density along the crucible wall, under the Heating and Stirring modes.
Figure 5b plots the radial (Fr) and axial (Fz) components of the Lorentz force density along the crucible wall. Since the force is concentrated in a thin near-wall layer, these profiles represent the driving force on the melt.
In the mid-height region, the Heating mode exhibits a relatively uniform electromagnetic force distribution, with Fr directed inward and Fz remaining close to zero. In contrast, the Stirring mode produces a less uniform force field, in which Fz remains negative in the central part. Near the top and bottom ends, both modes show a sharp weakening of Fr, while Fz is directed downward near the top and upward near the bottom. This end-region feature is mainly associated with the end effect of the finite-length coils, with the chamfered corner also contributing at the bottom end. Although Fr is larger in magnitude, the flow-driving effect is more closely related to Fz and the axial gradient of Fr. Overall, both modes show downward Fz near the top and upward Fz near the bottom, while the Stirring mode additionally exhibits a downward Fz region in the central part.
- (2)
- Flow structure
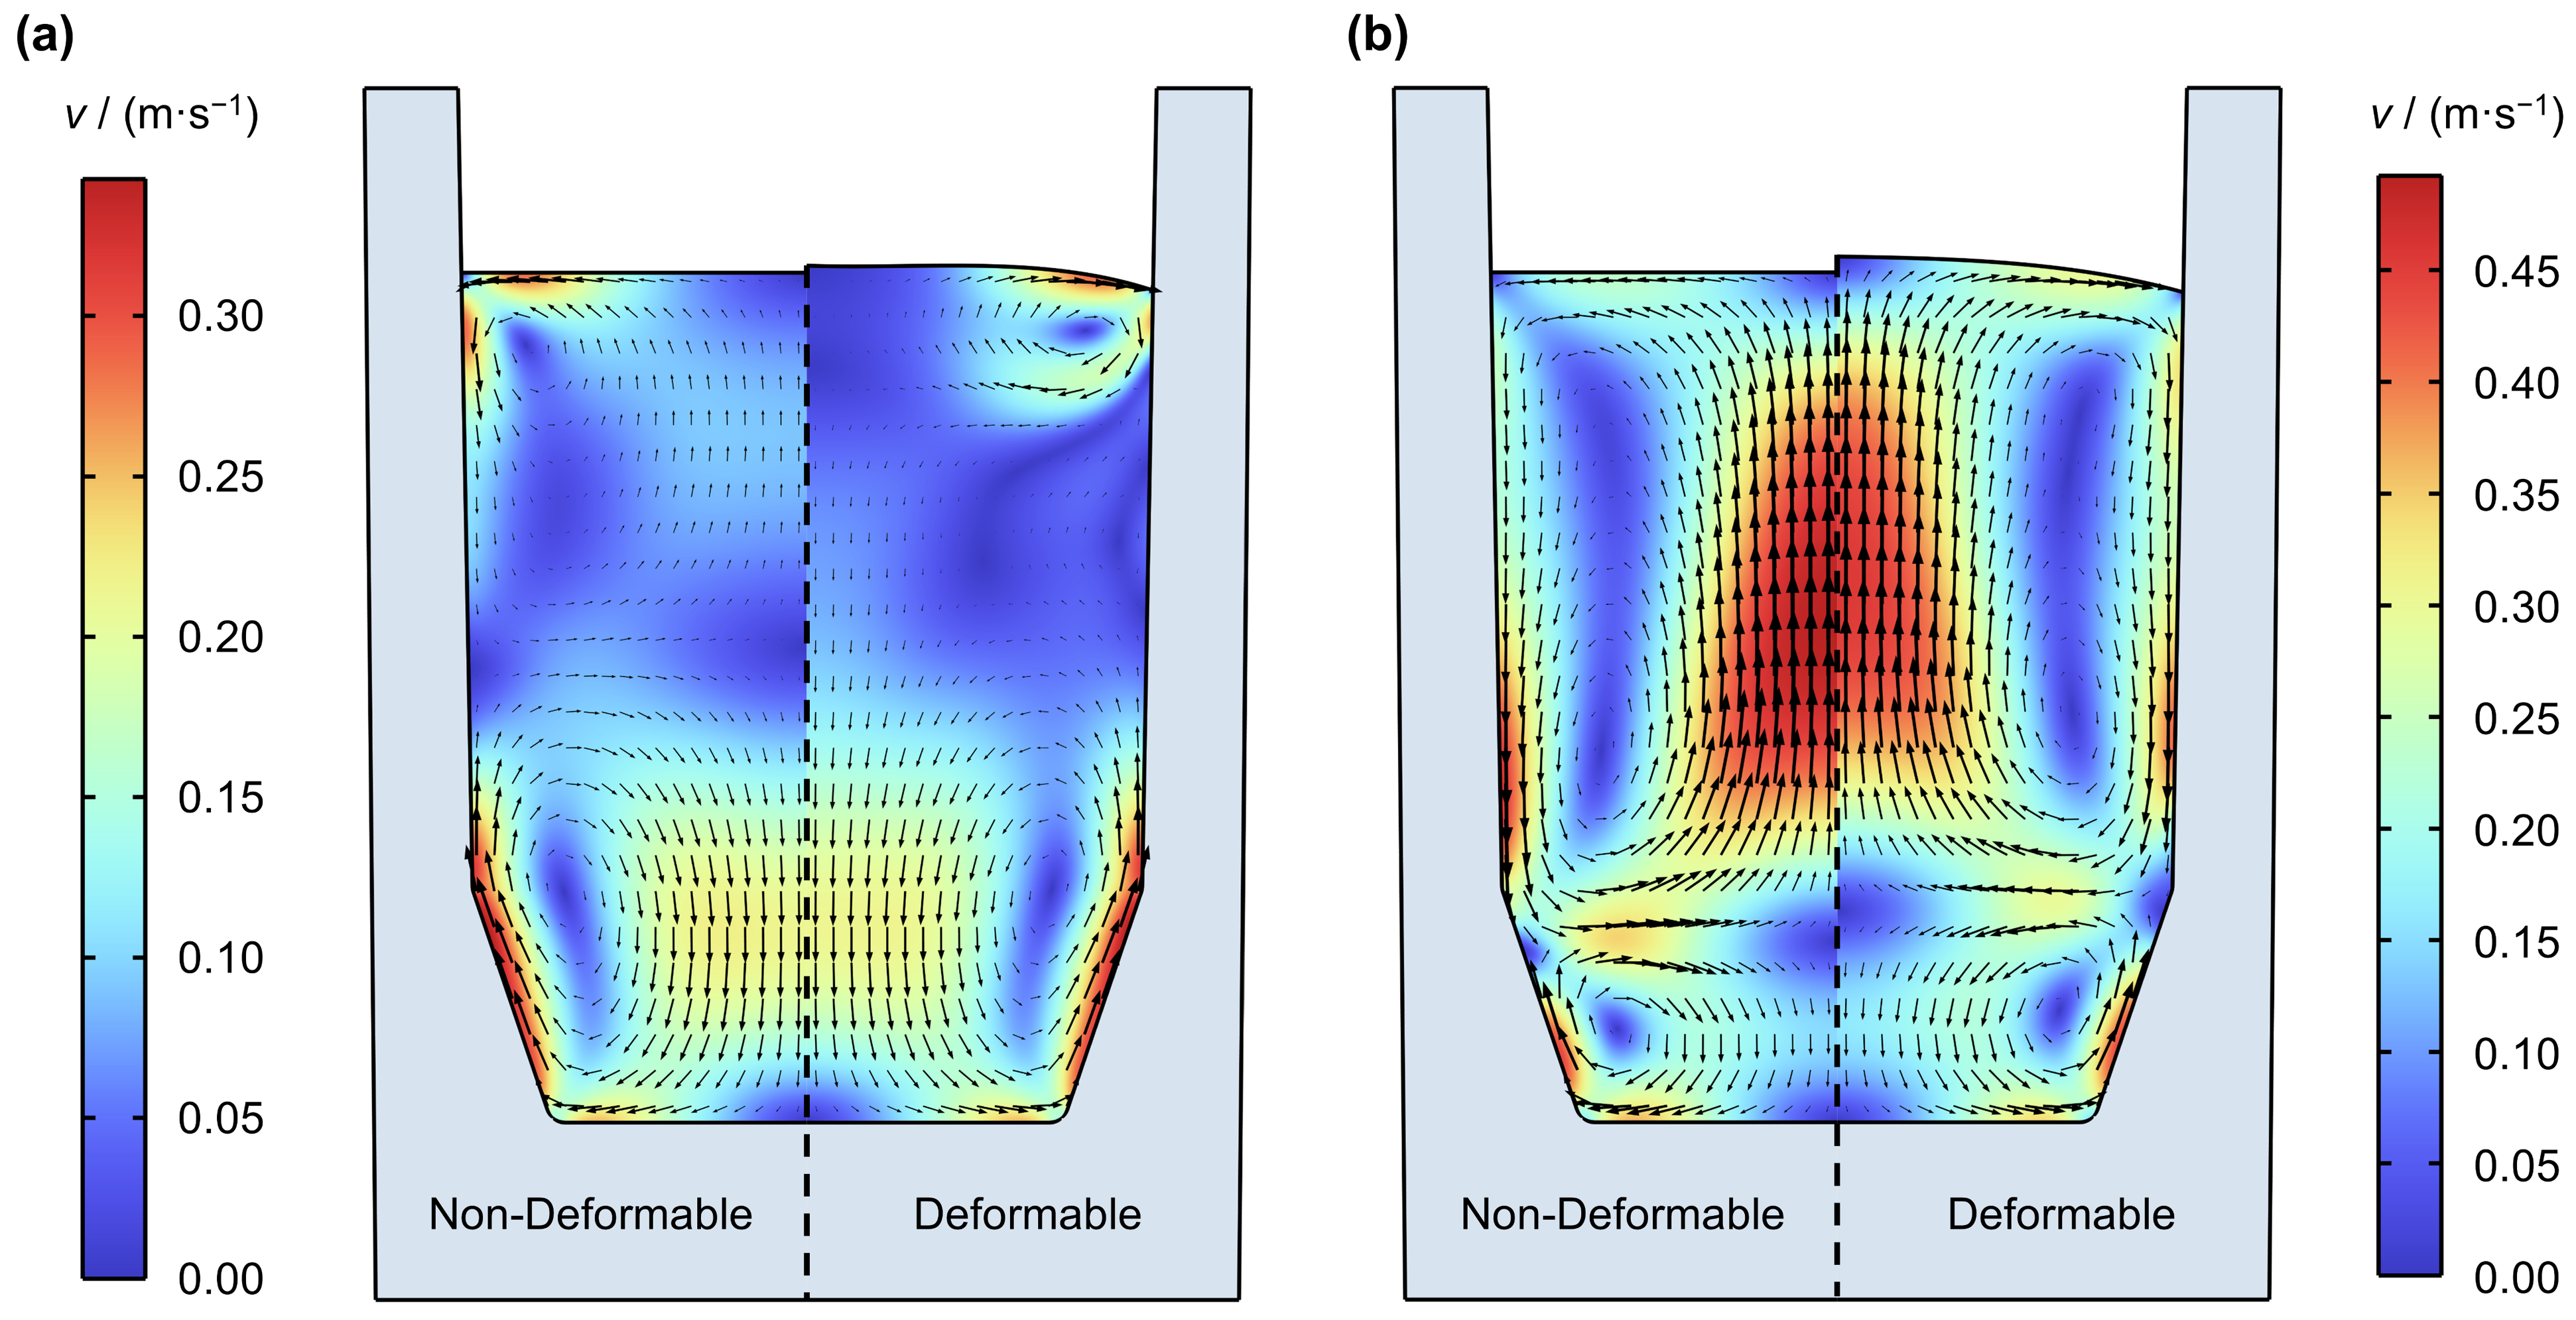
Figure 6 compares the velocity field for both modes under the deformable surface treatment (right half of each subfigure). Under the Heating mode, as shown in Figure 6a, the Lorentz force near the top and bottom ends drives two counter-rotating vortices. A small upper vortex, with the melt flowing downward along the wall, is confined to the upper near-wall region. The lower vortex, with the melt flowing upward along the wall, occupies a larger portion of the melt volume. The peak velocity of 0.34 m·s−1 occurs at the corner. The two vortices do not fill the entire melt volume, leaving a low velocity zone in the mid-region.
Figure 6.
Velocity field under (a) the Heating mode and (b) the Stirring mode. In each subfigure, the left half corresponds to the non-deformable and the right half to the deformable surface treatment.
Under the Stirring mode, as shown in Figure 6b, the flow field also consists of two vortices. The downward Fz in the mid-region, together with that near the top, drives the melt downward along the wall, producing a dominant upper vortex. The upward Lorentz force near the bottom drives a small counter-rotating vortex, with the melt ascending along the wall. The two vortices fill the entire melt volume. The peak velocity of 0.46 m·s−1 occurs along the axis near the melt surface.
In addition to the flow within the melt, the deformable-surface model also predicts the shape of the free surface. Under both modes, the free surface deforms into a hump profile. The maximum surface deformation is 8 mm under the Heating mode and 17 mm under the Stirring mode.
- (3)
- Flow indicators for free-surface and crucible–melt interface
Based on the computed flow field, three flow indicators relevant to free-surface and crucible–melt interface reactions are examined: the mixing time, the surface velocity, and the wall friction velocity.
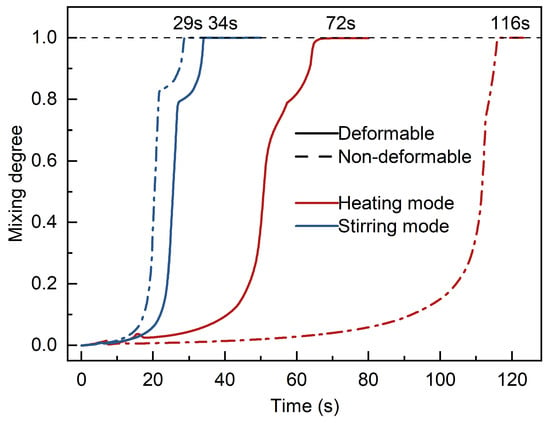
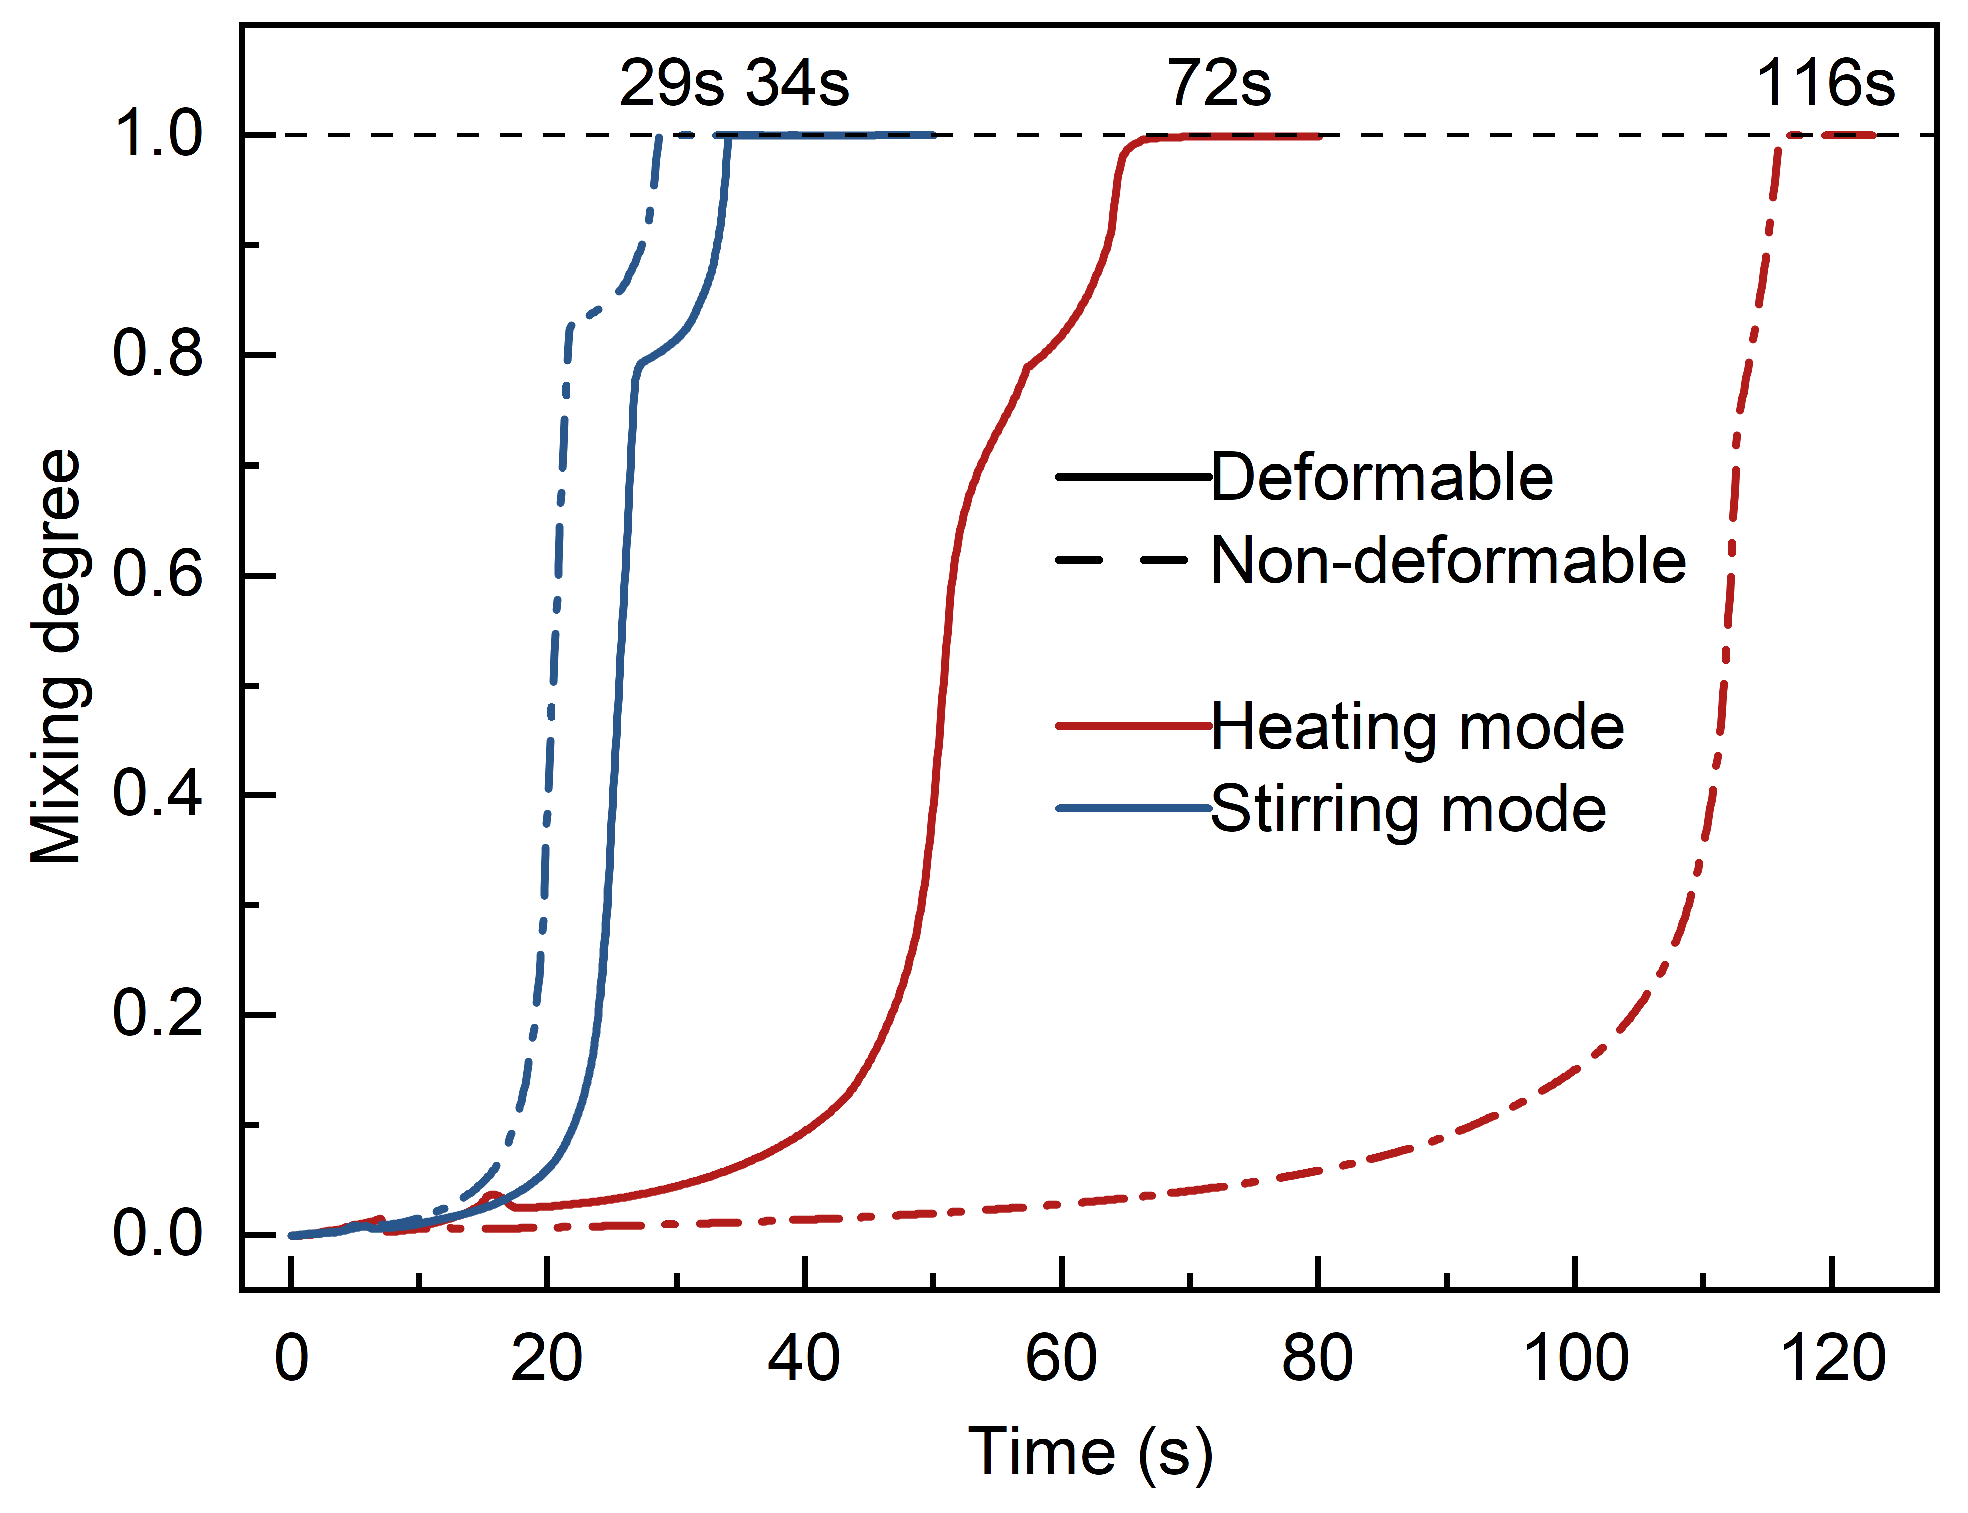
Figure 7 plots the evolution of the mixing degree with time for both modes (solid lines: deformable surface). Under the Heating mode, the mixing degree rises more slowly, as the low-velocity zone between the two vortices hinders the exchange of melt across the mid-region. Under the Stirring mode, the mixing degree rises rapidly, as the two vortices fill the entire melt volume. The mixing time is 72 s under the Heating mode and 34 s under the Stirring mode.
Figure 7.
Mixing degree as a function of time under the Heating and Stirring modes. Solid and dashed lines: deformable and non-deformable, respectively.
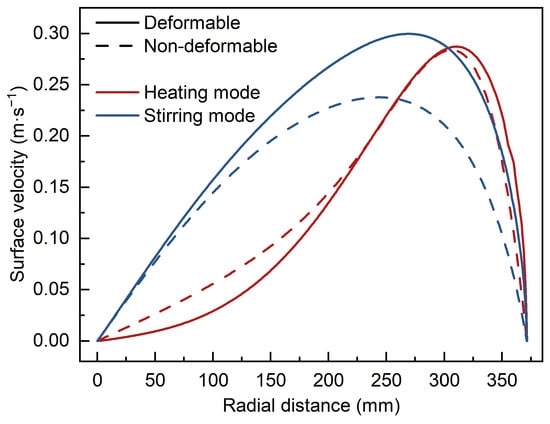
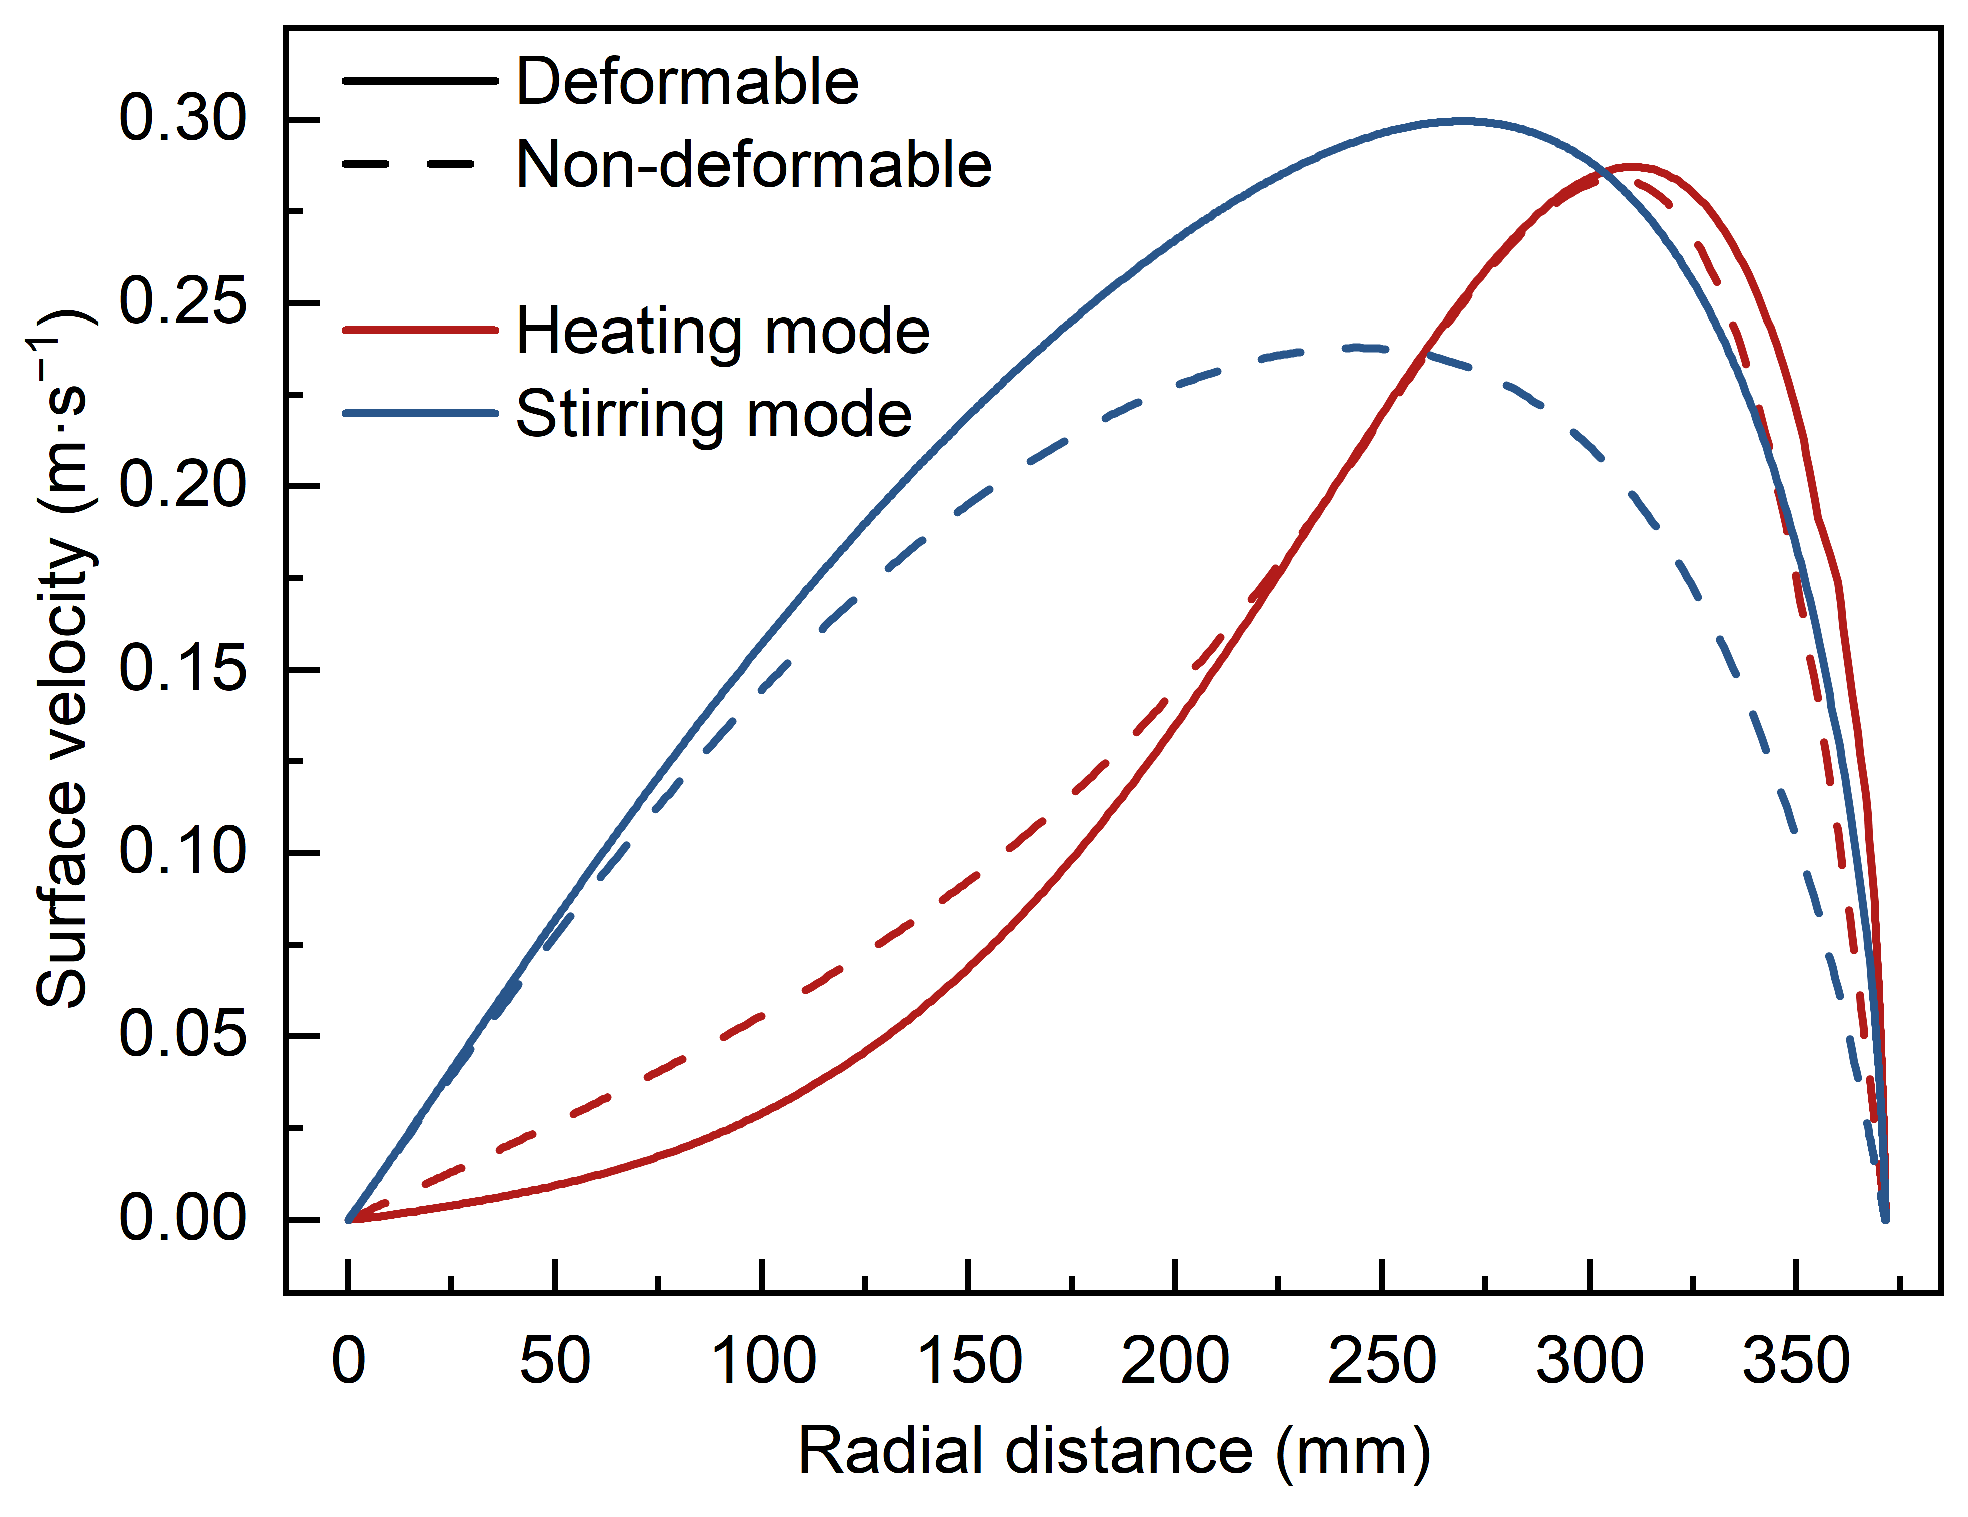
Figure 8 presents the surface velocity distribution along the radius for both modes. Under the Heating mode, the small upper vortex is confined to the near-wall region, resulting in a surface velocity concentrated near the wall. Under the Stirring mode, the large upper vortex drives flow across the full surface, resulting in a relatively uniform distribution. The surface-averaged velocity is 0.18 m·s−1 under the Heating mode and 0.23 m·s−1 under the Stirring mode.
Figure 8.
Surface velocity along the radius under the Heating and Stirring modes. Solid and dashed lines: deformable and non-deformable, respectively.
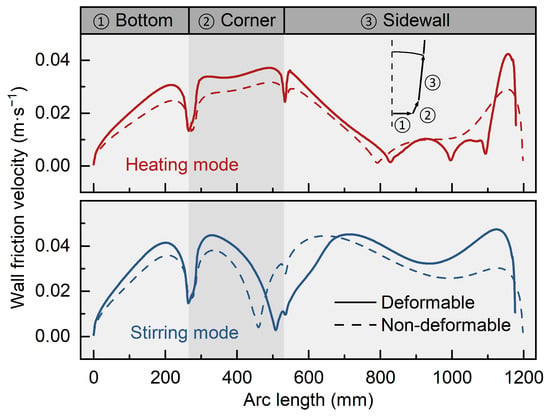
Figure 9 shows the wall friction velocity distribution along the crucible wall for both modes. The crucible wall is divided into three regions: the bottom, the corner, and the sidewall. Over the bottom and corner regions, the wall friction velocity is similar between the two modes. Under the Heating mode, it is high near the top of the sidewall but drops to low values in the middle of the sidewall, owing to the low-velocity zone between the two vortices. Under the Stirring mode, the continuous downward flow along the wall sustains high friction velocity throughout the sidewall. The wall-averaged friction velocity is 0.021 m·s−1 under the Heating mode and 0.035 m·s−1 under the Stirring mode.
Figure 9.
Wall friction velocity along the crucible wall under the Heating mode (top) and Stirring mode (bottom). Solid and dashed lines: deformable and non-deformable, respectively.
Compared with the Heating mode, the Stirring mode reduces the mixing time by approximately half, achieves 1.3 times the surface-averaged velocity, and 1.7 times the wall-averaged friction velocity. These results suggest that the Stirring mode generates stronger melt flow and mixing, thereby promoting surface renewal and enhancing transport near the crucible–melt interface.
- (4)
- Temperature distribution
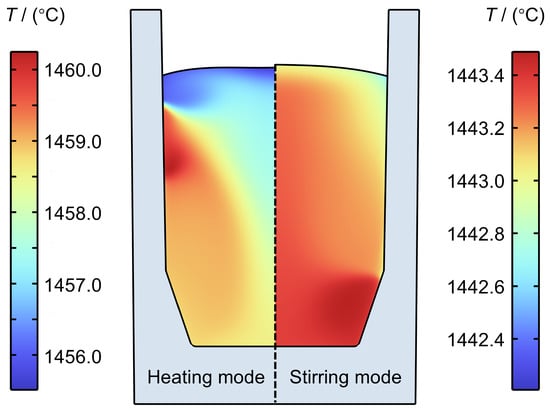
While the Stirring mode produces more intense flow, the two modes exhibit different thermal behaviors. Figure 10 shows the melt temperature distribution after 20 min from a uniform initial temperature of 1450 °C. The average melt temperature is 1459 °C under the Heating mode and 1443 °C under the Stirring mode. The Stirring mode produces a more uniform temperature distribution, consistent with its stronger melt circulation. The higher average temperature under the Heating mode results from the greater electromagnetic power absorbed by the melt.
Figure 10.
Melt temperature distribution under the Heating and Stirring modes after 20 min.
4.2. Effect of Free-Surface Deformation on the Flow
To assess the effect of free-surface deformation on the bulk flow, the deformable and non-deformable surface treatments are compared at 190 kW and 85% filling ratio, as shown in Figure 6. Under the Heating mode, the non-deformable treatment predicts two nearly symmetric vortices spanning the entire melt volume, whereas under the deformable treatment, the upper vortex is confined to the upper near-wall region. Under the Stirring mode, the non-deformable treatment preserves the two-vortex structure, with the upper vortex expanded and the lower vortex contracted.
These differences in flow structure result from the coupling between melt flow and free-surface deformation. Under both modes, the melt in the upper region flows downward along the wall, while the return flow moves upward toward the surface in the interior. The deformable surface rises to accommodate this upward flow. In contrast, the non-deformable surface constrains the upward flow and redirects the melt toward the sidewall and then downward. Under the Heating mode, this redirected flow expands the originally near-wall upper vortex into the upper half of the melt, leading to a nearly symmetric flow pattern. Under the Stirring mode, where the upper vortex already occupies most of the melt volume, the redirected flow mainly changes the relative vortex sizes without altering the overall flow structure.
These differences in flow structure are reflected in the three flow indicators, as shown in Figure 7, Figure 8 and Figure 9. Under the Heating mode, the non-deformable treatment alters the distributions of the surface velocity and wall friction velocity. More importantly, the nearly symmetric flow structure impedes mass transport between the vortices; consequently, the non-deformable treatment predicts a mixing time of 116 s, approximately 60% higher than the deformable case. Under the Stirring mode, the wall friction velocity and mixing time remain close between the two treatments. The non-deformable treatment, however, underestimates the surface velocity by about 23%, predicting a surface-averaged value of 0.18 m·s−1.
These results indicate that free-surface deformation notably affects the predicted flow structure and flow indicators, particularly under the Heating mode.
4.3. Effect of Input Power
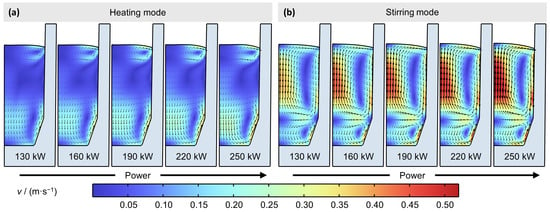
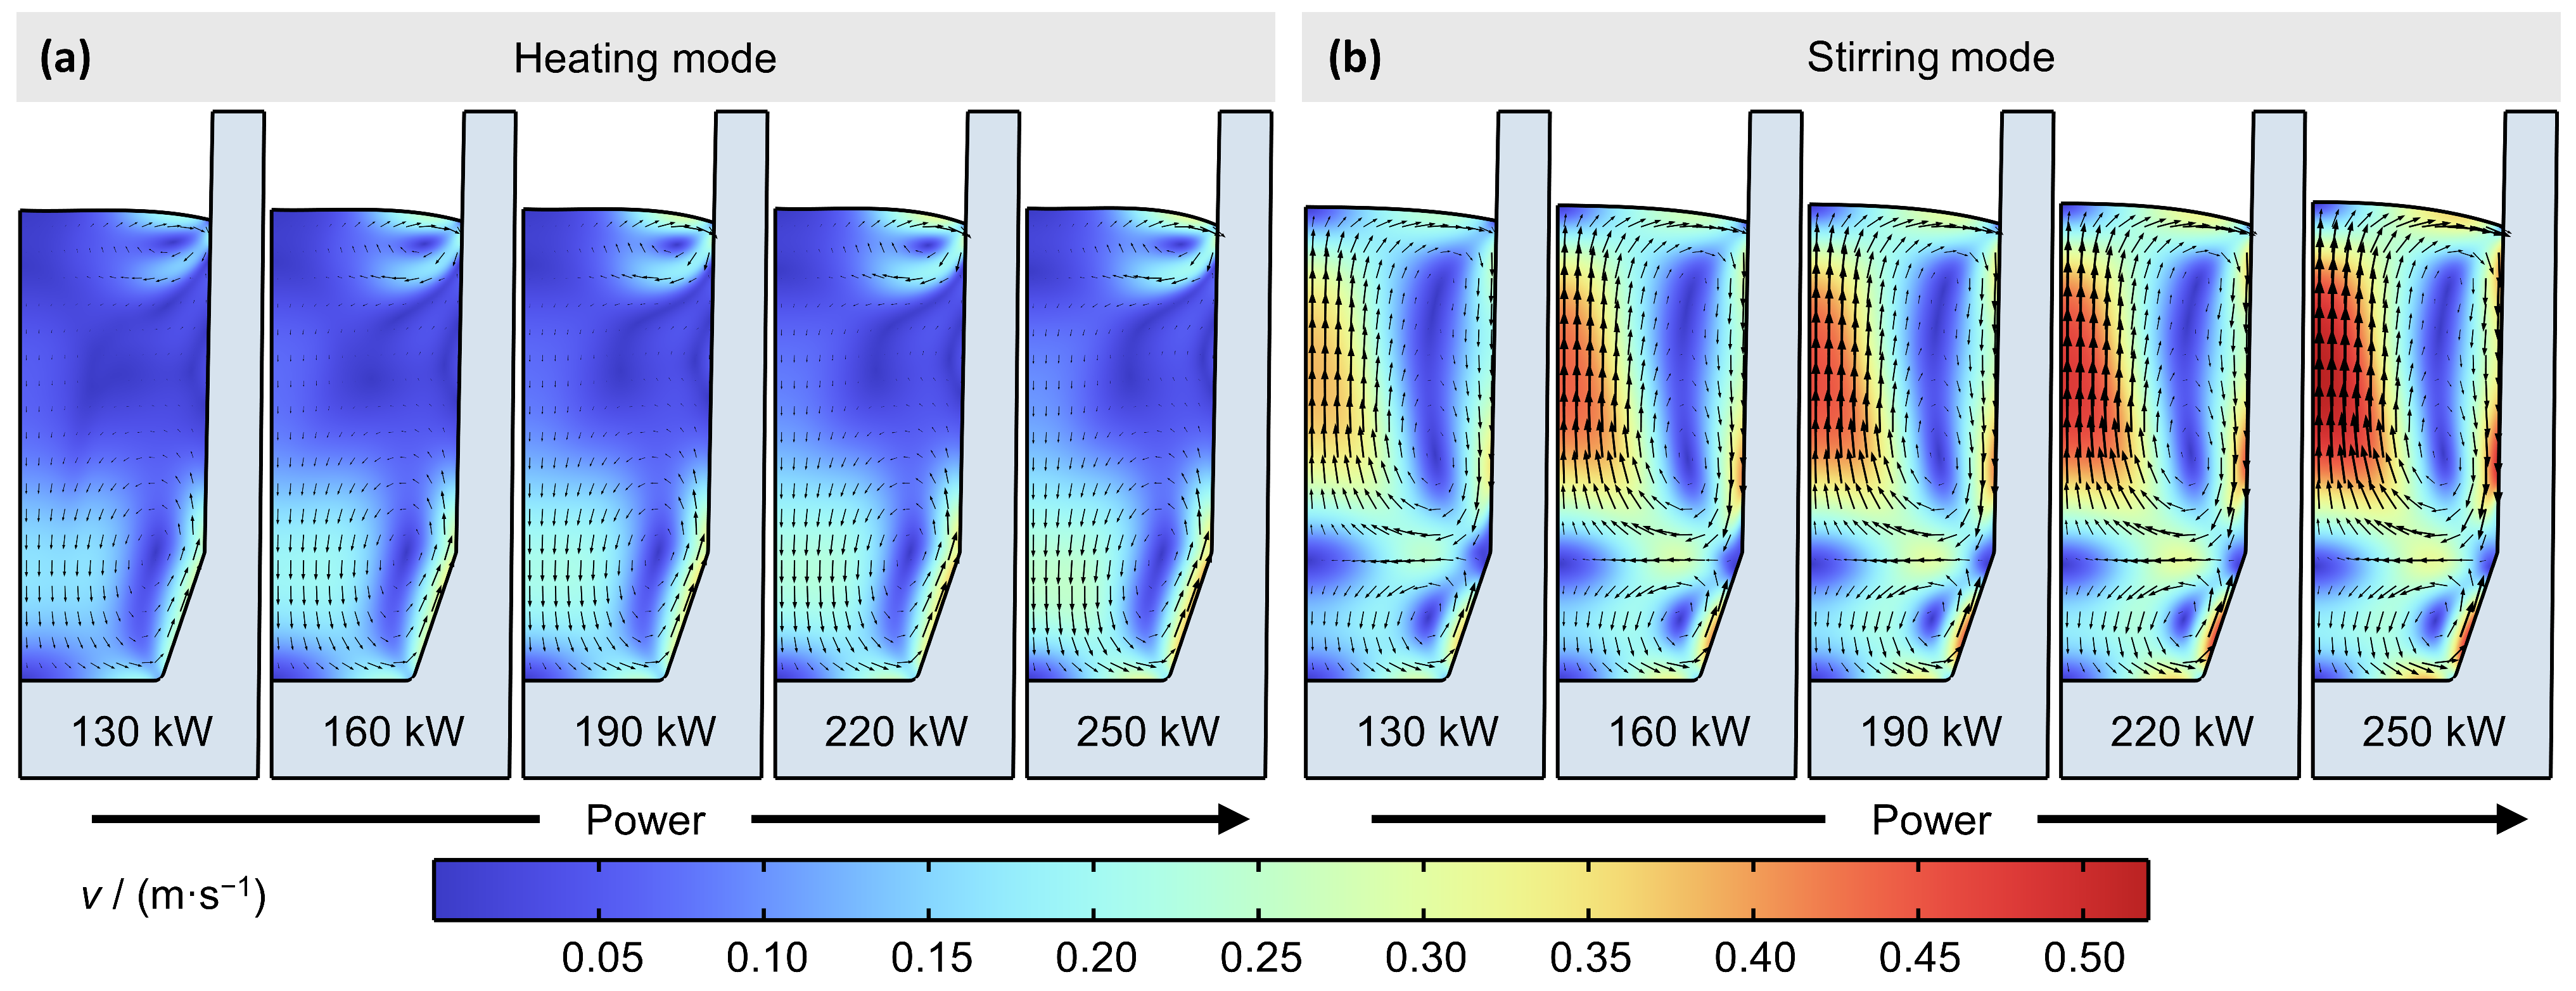
The input power is varied from 130 to 250 kW in steps of 30 kW at a fixed filling ratio of 85% to examine its effect on the flow. Figure 11 depicts the velocity field at five input power levels for both modes. Under each mode, the flow structure is preserved across the power range, while the velocity magnitude increases with power. As the input power increases from 130 to 250 kW, the average melt velocity increases from 0.08 to 0.11 m·s−1 under the Heating mode and from 0.16 to 0.23 m·s−1 under the Stirring mode. The maximum surface deformation also increases with power, reaching 10 mm under the Heating mode and 21 mm under the Stirring mode at 250 kW.
Figure 11.
Velocity field at input powers of 130–250 kW under (a) the Heating mode and (b) the Stirring mode.
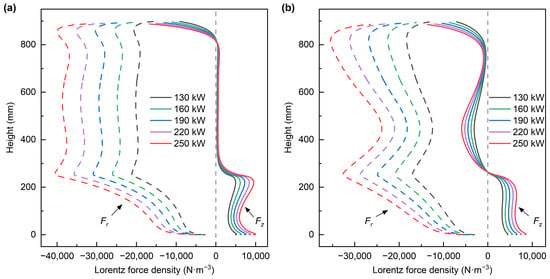
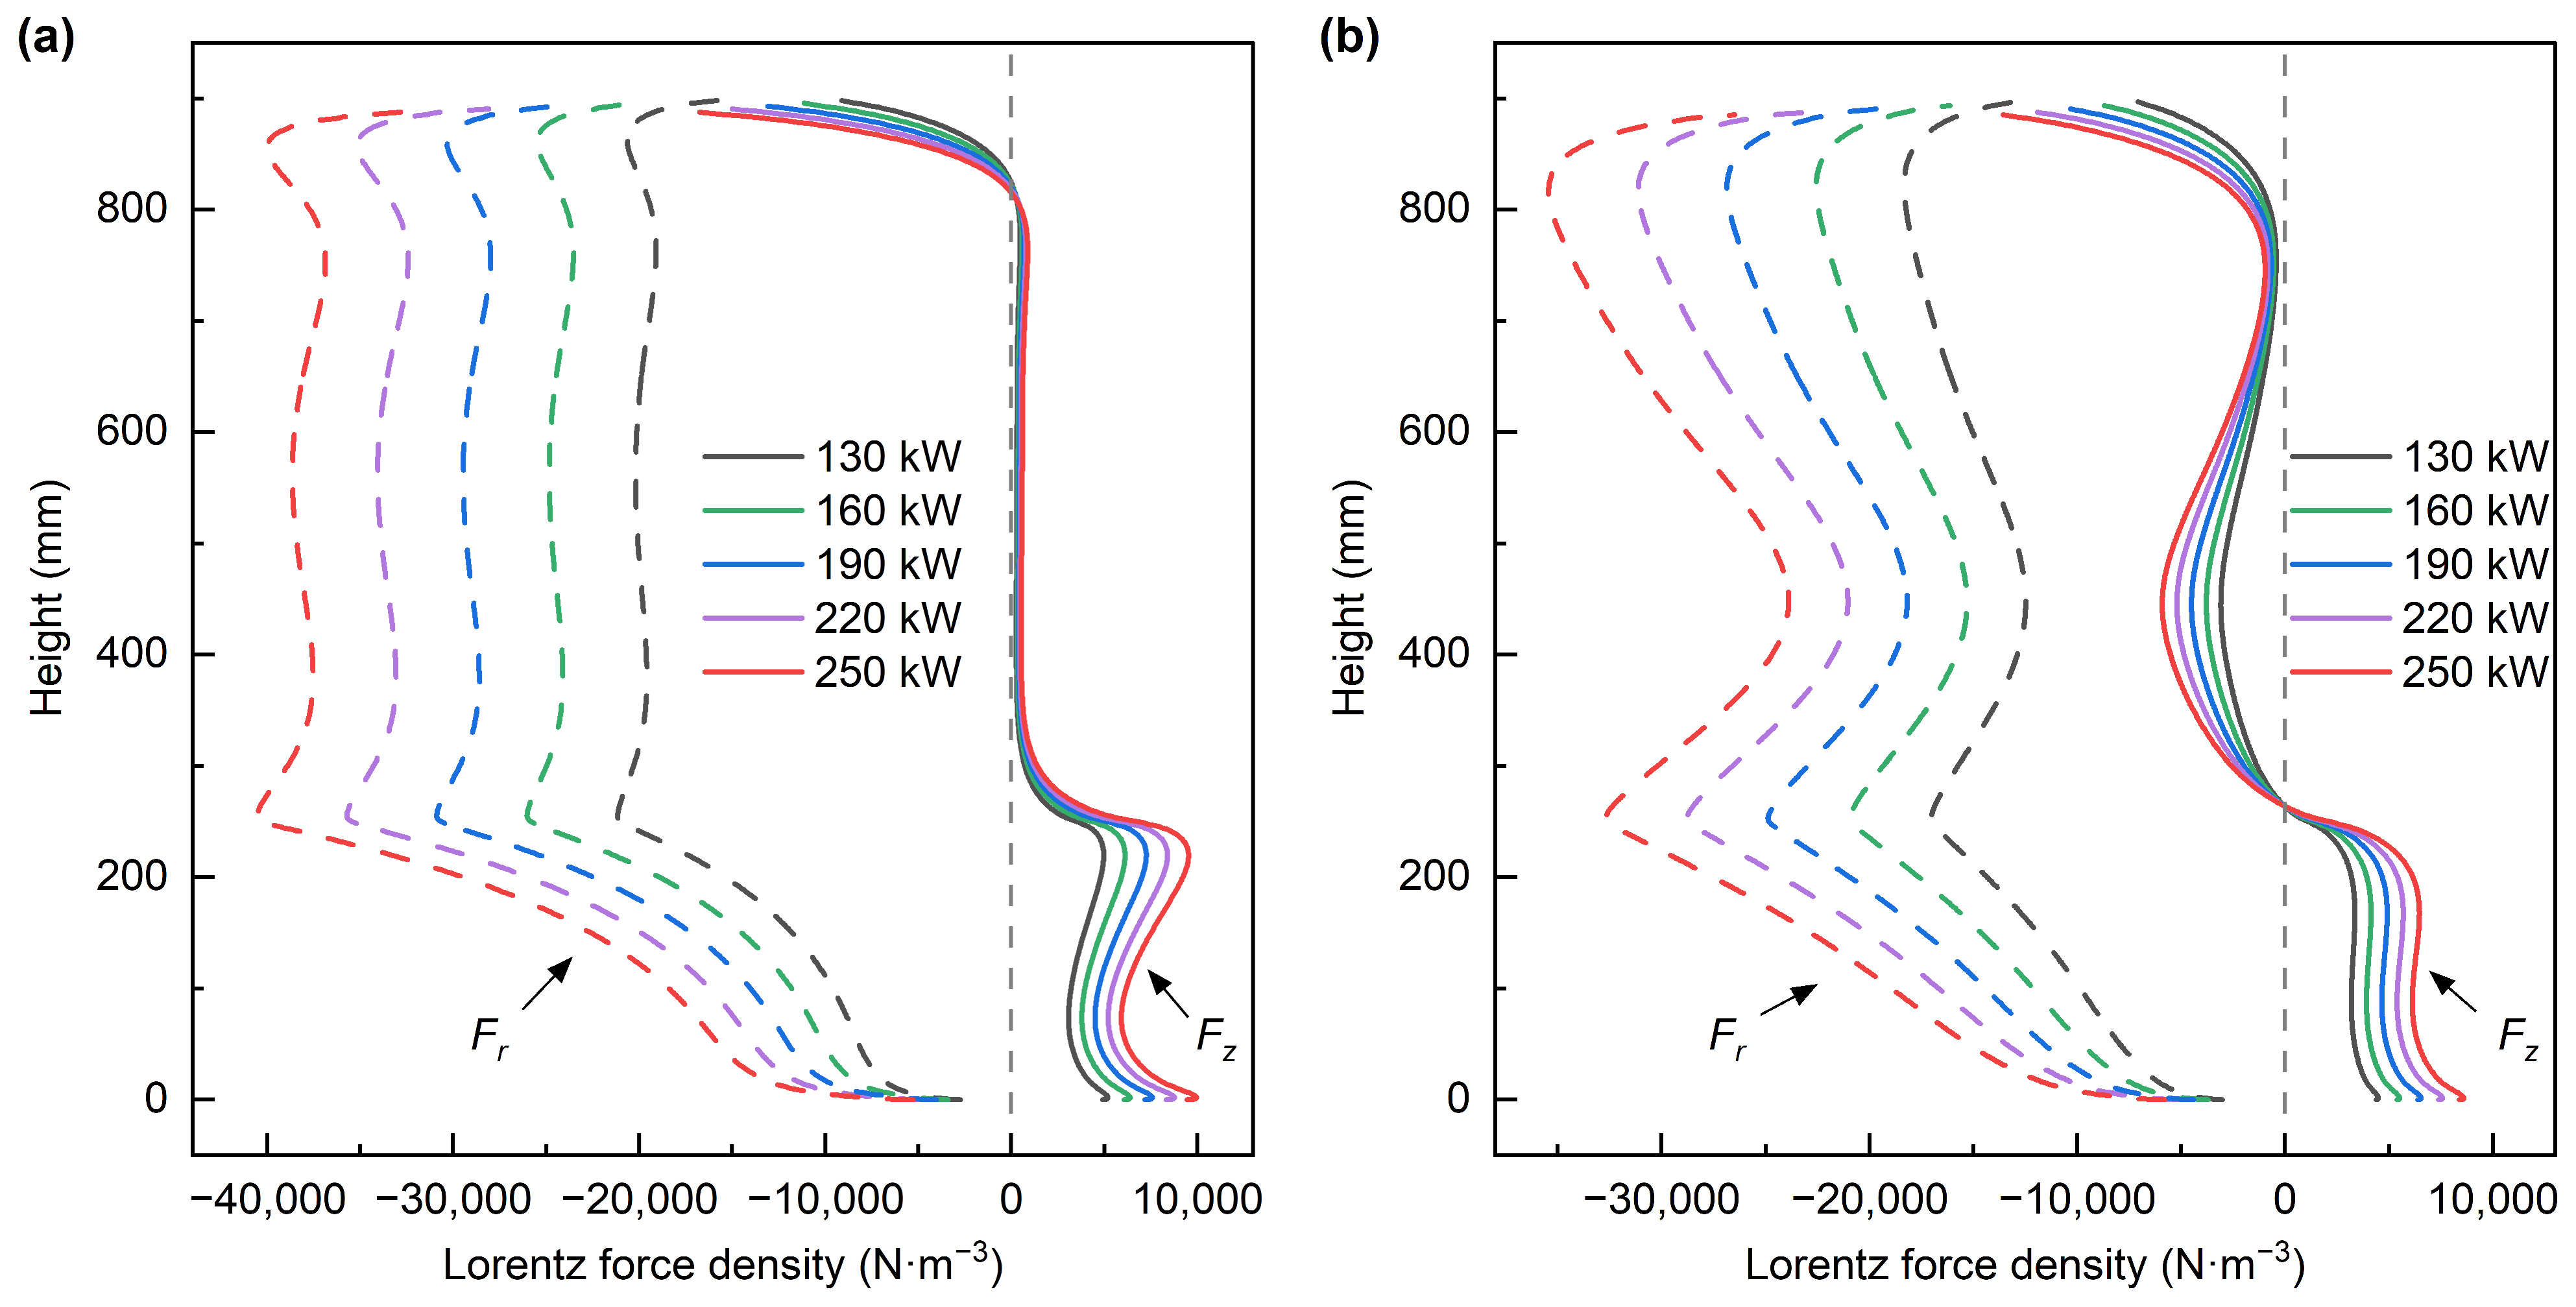
The preservation of the flow structure can be traced back to the distribution of the Lorentz force. Figure 12 presents Fr and Fz profiles along the crucible wall at the five power levels for both modes. Under both modes, the distributions are essentially preserved across the power range, with the magnitudes increasing nearly in proportion to power.
Figure 12.
Radial (Fr) and axial (Fz) components of the Lorentz force density along the crucible wall under (a) Heating mode and (b) Stirring mode at input powers of 130–250 kW.
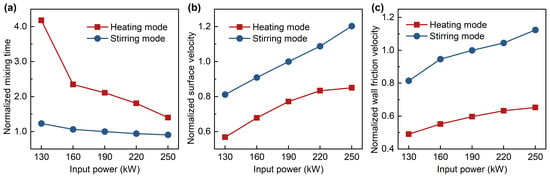
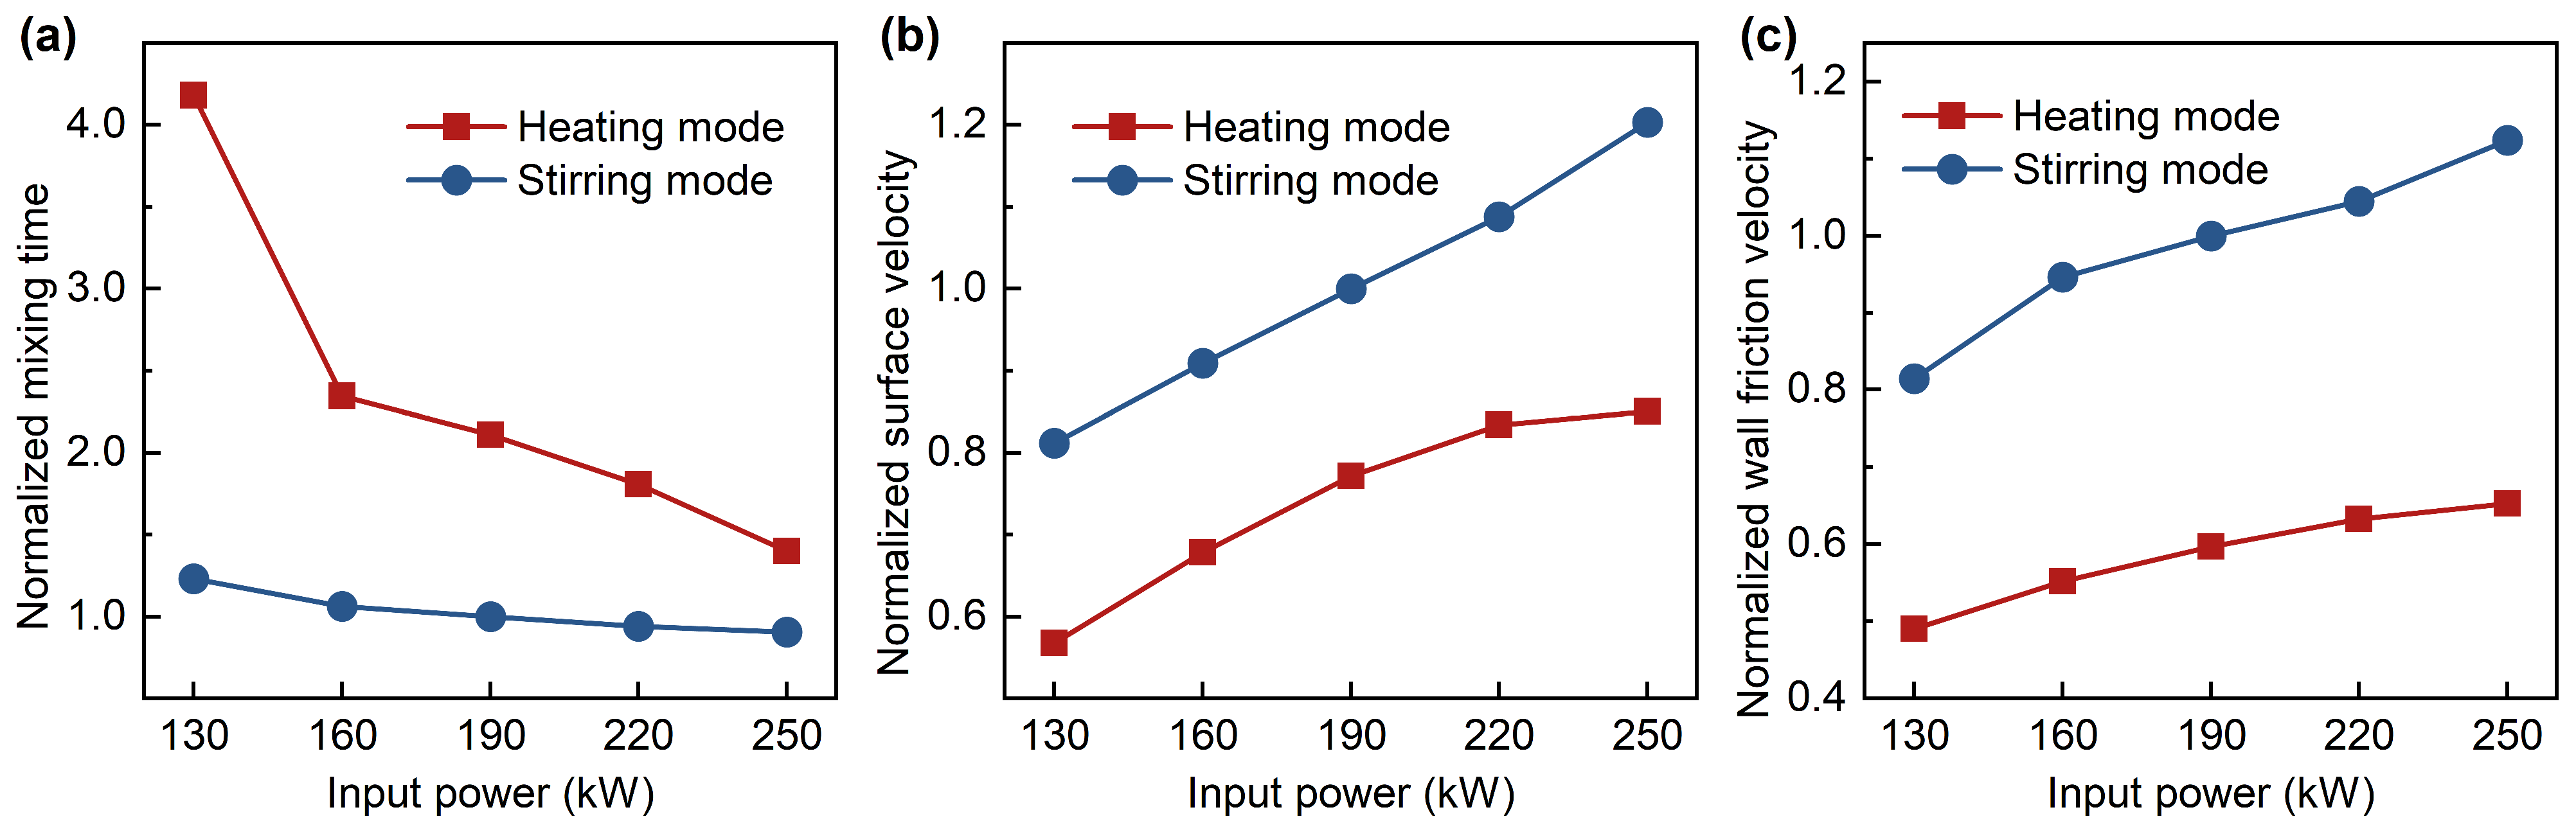
Figure 13 plots the normalized mixing time, surface velocity, and wall friction velocity as a function of input power for both modes. As the input power increases from 130 to 250 kW, the surface velocity and wall friction velocity increase monotonically under both modes, while the mixing time decreases monotonically. The three flow indicators are normalized by their respective values under the Stirring mode at 190 kW and 85% filling ratio. The normalized mixing time decreases from 4.18 to 1.39 under the Heating mode and from 1.23 to 0.90 under the Stirring mode. The normalized surface velocity increases from 0.57 to 0.85 under the Heating mode and from 0.81 to 1.20 under the Stirring mode, while the normalized wall friction velocity increases from 0.49 to 0.65 and from 0.81 to 1.12.
Figure 13.
(a) Normalized mixing time, (b) normalized surface velocity, and (c) normalized wall friction velocity as a function of input power under the Heating and Stirring modes.
4.4. Effect of Filling Ratio
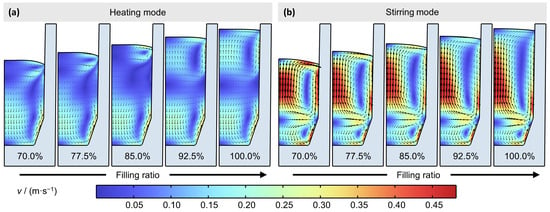
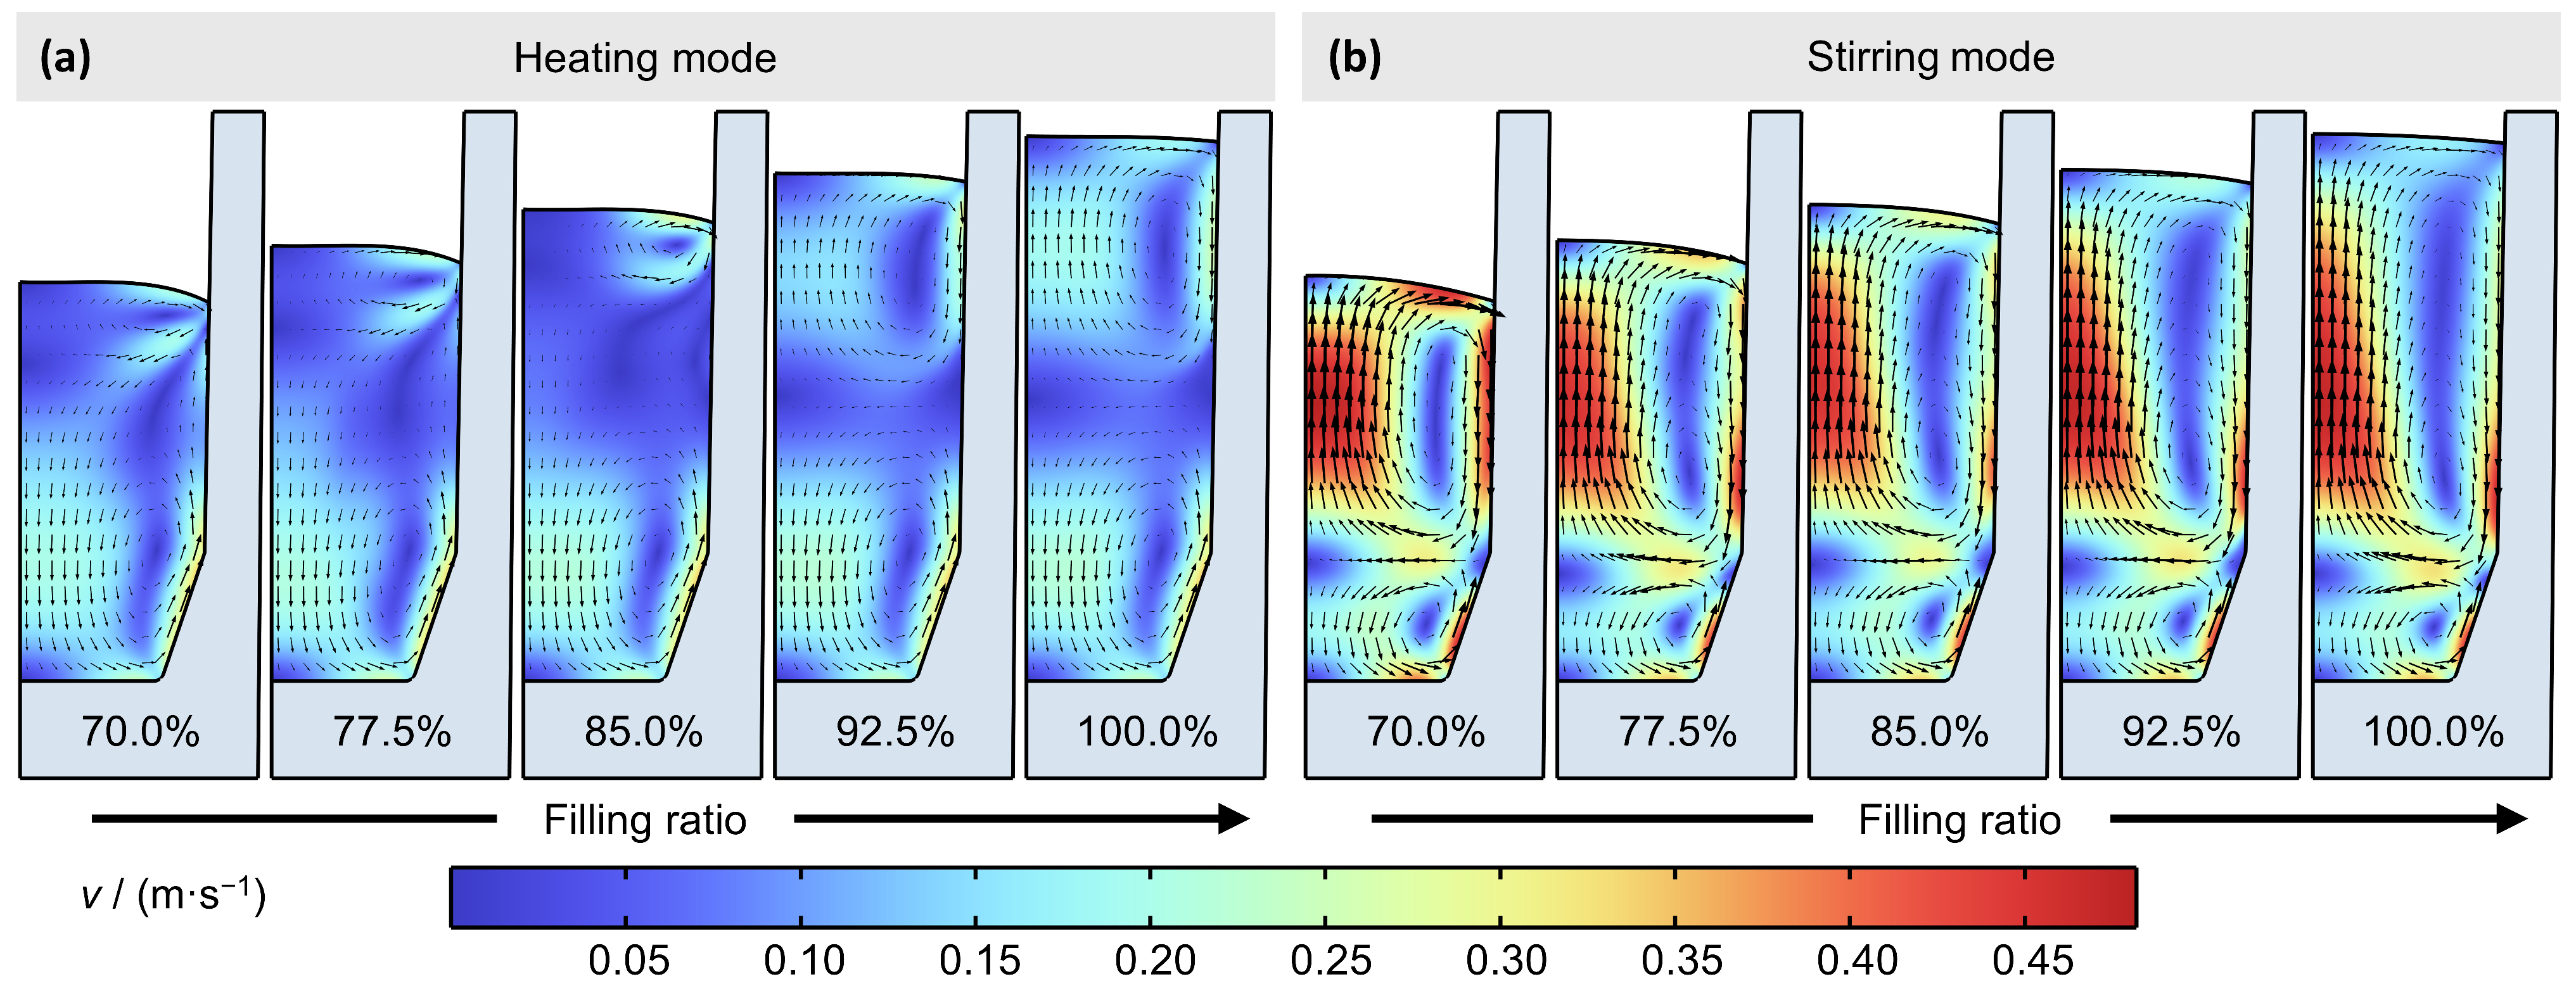
The filling ratio is varied from 70% to 100% in steps of 7.5% at a fixed input power of 190 kW to examine its effect on the flow. Increasing the filling ratio raises the melt height and alters the position of the melt top relative to the coils. Figure 14 depicts the velocity field at the five filling ratios for both modes. The flow structure under the Heating mode varies markedly with the filling ratio, whereas it remains essentially unchanged under the Stirring mode.
Figure 14.
Velocity field at filling ratios of 70–100% under (a) the Heating mode and (b) the Stirring mode.
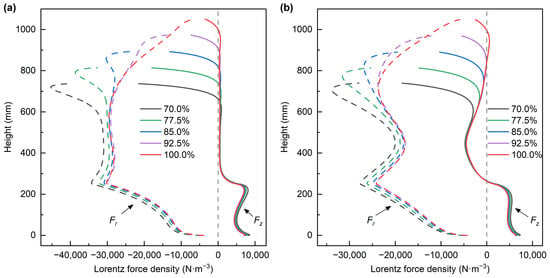
Figure 15 presents Fr and Fz profiles along the crucible wall at the five filling ratio levels for both modes. Under both modes, Fr and Fz in the lower and middle regions of the melt show little variation across all filling ratios. The variation with the filling ratio mainly occurs in the upper region of the melt. As the filling ratio decreases, the peaks of Fr and Fz at the upper end increase. At 85% filling ratio, the melt top is approximately level with the top of the upper coils. Above this ratio, the melt extends beyond the coils, and Fr and Fz in the upper region weaken sharply. These features are common to both modes, but the resulting flow responses differ.
Figure 15.
Radial (Fr) and axial (Fz) components of the Lorentz force density along the crucible wall under (a) Heating mode and (b) Stirring mode at filling ratios of 70–100%.
Under the Heating mode, at 85% filling ratio, a small upper vortex coexists with a larger lower vortex, separated by a low-velocity region in the middle of the melt. At filling ratios below 85%, the melt height decreases, reducing the separation between the two vortices and promoting flow exchange, which is also enhanced by the strengthened Lorentz force near the upper end. At filling ratios above 85%, the Lorentz force on the upper melt layer drops sharply, suppressing the free-surface deformation; the maximum deformation decreases from 8 mm at 85% to 4 mm at 100%. As the deformation is suppressed, the upper vortex expands into the middle of the melt, producing two vortices of comparable size. This resembles the flow predicted by the non-deformable surface treatment, although here it arises from the weakened Lorentz force rather than from an imposed boundary condition.
Under the Stirring mode, the flow is driven by the persistent downward Lorentz force in the middle of the melt, which remains nearly constant across all filling ratios. Although the free-surface deformation is also suppressed above 85%, the flow under this mode is insensitive to it. The two-vortex structure is therefore preserved at all filling ratios, consisting of a dominant upper vortex and a smaller lower vortex with only minor variations in their relative sizes. As the filling ratio decreases from 100% to 70%, however, the region with a downward Lorentz force occupies a larger fraction of the total melt volume, thereby increasing the average melt velocity from 0.19 m·s−1 to 0.24 m·s−1.
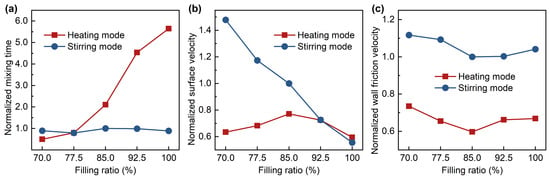
Figure 16 plots the normalized mixing time, surface velocity, and wall friction velocity as a function of filling ratio for both modes. The Stirring mode maintains a mixing time close to the reference value over the entire filling ratio range, whereas under the Heating mode, the mixing time varies markedly from 0.50 at 70% to 5.65 at 100%. This contrast is associated with the vortex structure: flow exchange at low filling ratios accelerates mixing, while the nearly symmetric two-vortex structure at high filling ratios strongly impedes it. The surface velocity decreases monotonically with filling ratio under the Stirring mode but peaks at a filling ratio of 85% under the Heating mode, and the surface velocity becomes comparable between the two modes at filling ratios of 92.5% and 100%. The wall friction velocity varies only weakly with filling ratio in both modes and remains consistently higher in the Stirring mode.
Figure 16.
(a) Normalized mixing time, (b) normalized surface velocity, and (c) normalized wall friction velocity as a function of filling ratio under the Heating and Stirring modes.
4.5. Practical Implications for VIM
The computed flow results provide insight into two reaction types during VIM processing: free-surface reactions and crucible–melt interfacial reactions. It is desirable to promote the former, such as the free-surface removal of nitrogen and oxygen, while suppressing the latter, such as crucible decomposition. The surface velocity and mixing time are used to characterize the flow conditions relevant to nitrogen and oxygen removal at the free surface. Within the investigated input power range of 130–250 kW and filling ratio range of 70–100%, the effect of free-surface area variation is neglected because the variation remains below 2% in all simulated cases. The flow conditions at the crucible–melt interface are characterized by the wall friction velocity. The wetted wall area, defined as the melt–crucible contact area, is also relevant and decreases with the filling ratio.
At 190 kW and 85% filling ratio, the Stirring mode shows more intense flow conditions at both the free-surface and the crucible–melt interface than the Heating mode, owing to its higher surface velocity, higher wall friction velocity, and shorter mixing time. Increasing input power strengthens the flow at both interfaces under either mode. Thus, simultaneously enhancing the flow at the free surface and limiting that at the crucible–melt interface is difficult to achieve by mode switching or power adjustment alone.
The filling ratio, however, affects the flow conditions at the two interfaces in different ways. Under the Stirring mode, lowering the filling ratio increases the surface velocity and reduces the wetted wall area, while the mixing time and wall friction velocity remain essentially unchanged. This combination may provide favorable flow conditions at the free surface without significantly intensifying those at the crucible–melt interface. The Stirring mode may therefore be advantageous during the early melting stage, when the filling ratio is lower. Under the Heating mode, the mixing time becomes substantially longer at high filling ratios, potentially limiting the effectiveness of free-surface reactions.
It should be pointed out that the above discussion is based on flow analysis; prediction of the oxygen and nitrogen evolution requires coupling with detailed heat transfer and reaction kinetics. The computed flow field also provides insight into other phenomena in VIM, such as element evaporation at the free surface, refractory erosion at the crucible wall, and alloy homogenization and inclusion motion in the bulk melt.
5. Conclusions
A coupled electromagnetic and fluid flow model with a deformable free surface was developed and validated for a 3 t industrial dual-mode VIM furnace. The effects of excitation mode, input power, and filling ratio on flow indicators relevant to reactions at the free surface and the crucible–melt interface were examined. The main conclusions are as follows:
- (1)
- Under the Stirring mode, a persistent downward Lorentz force in the mid-region drives a dominant upper vortex covering most of the melt, with a smaller counter-rotating vortex at the bottom. Under the Heating mode, the force acts mainly near the top and bottom ends, producing a small upper vortex confined to the near-wall region and a larger lower vortex. At 190 kW and 85% filling ratio, the Stirring mode achieves approximately 1.3 times the surface-averaged velocity, 1.7 times the wall-averaged friction velocity, and half the mixing time of the Heating mode.
- (2)
- The deformable surface treatment accounts for the coupling between flow and free-surface deformation. At 190 kW and 85% filling ratio, neglecting this coupling notably affects the predicted flow structure and flow indicators, particularly under the Heating mode.
- (3)
- Within the input power range of 130–250 kW, the flow structure is preserved under both excitation modes, and the three flow indicators vary monotonically as the input power increases.
- (4)
- The Heating mode flow structure is highly sensitive to the filling ratio over the range of 70–100%. At low filling ratios, the reduced separation between the two vortices promotes flow exchange, whereas at high filling ratios, the suppressed surface deformation expands the upper vortex. The Stirring mode maintains its flow structure over the range of 70–100%, owing to the persistent downward Lorentz force in the mid-region.
- (5)
- Under the Stirring mode, lowering the filling ratio within the range of 70–100% increases the surface velocity and reduces the wetted wall area, which may provide favorable flow conditions for free-surface reactions without significantly intensifying those at the crucible–melt interface.
Author Contributions
Conceptualization, H.L.; methodology, Z.H. and H.L.; software, Z.H.; validation, Z.H. and D.W.; formal analysis, Z.H. and Q.Z.; investigation, Z.H.; resources, D.W. and Q.Z.; data curation, Z.H. and D.W.; writing—original draft preparation, Z.H.; writing—review and editing, Z.H., Q.Z., H.Q. and H.L.; visualization, Z.H. and H.Q.; supervision, H.L.; project administration, H.L. All authors have read and agreed to the published version of the manuscript.
Funding
This research received no external funding.
Data Availability Statement
The original contributions presented in this study are included in the article. Further inquiries can be directed to the corresponding author.
Conflicts of Interest
Zhenchao Han and Heping Liu were employed by the Central Iron and Steel Research Institute Co., Ltd. Zhenchao Han, Di Wang, Qintian Zhu, Hao Qiu and Heping Liu were employed by the Research Institute of Advanced Materials (Shenzhen) Co., Ltd. The remaining authors declare that the research was conducted in the absence of any commercial or financial relationships that could be construed as a potential conflict of interest.
References
- Qian, K.; Chen, B.; Zhang, L.; Du, Z.; Liu, K. Kinetics study of nitrogen removal from liquid IN718 alloy during vacuum induction melting. Vacuum 2020, 179, 109521. [Google Scholar] [CrossRef] [Scilit]
- Feng, H.; Li, H.-B.; Liu, Z.-Z.; Jiang, Z.-H.; Lu, P.-C.; He, T. Cleanliness Control of High Nitrogen Stainless Bearing Steel by Vacuum Carbon Deoxidation in a PVIM Furnace. Metall. Mater. Trans. B 2021, 52, 3777–3787. [Google Scholar] [CrossRef] [Scilit]
- Li, X.-Z.; Feng, H.; Li, H.-B.; Yang, S.-X.; Zhang, S.-C.; Zhu, H.-C.; Pak, J.-J.; Jiang, Z.-H. Deoxidation of Nickel-based Superalloy Using Carbon under High Vacuum Degree. Metall. Mater. Trans. B 2024, 55, 4503–4517. [Google Scholar] [CrossRef] [Scilit]
- Fireteanu, V.; Gheysens, R. Numerical modeling of traveling field diffusion-induction heating and electromagnetic stirring. IEEE Trans. Magn. 1992, 28, 1489–1492. [Google Scholar] [CrossRef]
- Nikolaev, D.A.; Frizen, V.E. The Effect of the Power Focusing Mode on the Flow of Molten Metal in a Two-Section Induction Crucible Furnace. In Proceedings of the 2024 International Ural Conference on Electrical Power Engineering (UralCon), Magnitogorsk, Russia, 27–29 September 2024; pp. 310–314. [Google Scholar]
- Tarapore, E.D.; Evans, J.W. Fluid velocities in induction melting furnaces: Part I. Theory and laboratory experiments. Metall. Trans. B 1976, 7, 343–351. [Google Scholar] [CrossRef] [Scilit]
- El-Kaddah, N.; Szekely, J.; Taberlet, E.; Fautrelle, Y. Turbulent recirculating flow in induction furnaces: A comparison of measurements with predictions over a range of operating conditions. Metall. Trans. B 1986, 17, 687–693. [Google Scholar] [CrossRef] [Scilit]
- El-Kaddah, N.; Szekely, J. The turbulent recirculating flow field in a coreless induction furnace, a comparison of theoretical predictions with measurements. J. Fluid Mech. 1983, 133, 37–46. [Google Scholar] [CrossRef] [Scilit]
- Baake, E.; Mühlbauer, A.; Jakowitsch, A.; Andree, W. Extension of the k-ε model for the numerical simulation of the melt flow in induction crucible furnaces. Metall. Mater. Trans. B 1995, 26, 529–536. [Google Scholar] [CrossRef] [Scilit]
- Umbrashko, A.; Baake, E.; Nacke, B.; Jakovics, A. Modeling of the turbulent flow in induction furnaces. Metall. Mater. Trans. B 2006, 37, 831–838. [Google Scholar] [CrossRef] [Scilit]
- Kirpo, M.; Jakovičs, A.; Nacke, B.; Baake, E. Particle transport in recirculated liquid metal flows. COMPEL-Int. J. Comput. Math. Electr. Electron. Eng. 2008, 27, 377–386. [Google Scholar] [CrossRef] [Scilit]
- Ščepanskis, M.; Jakovičs, A.; Baake, E.; Nacke, B. Solid inclusions in an electromagnetically induced recirculated turbulent flow: Simulation and experiment. Int. J. Multiph. Flow 2014, 64, 19–27. [Google Scholar] [CrossRef] [Scilit]
- Asad, A.; Kratzsch, C.; Dudczig, S.; Aneziris, C.G.; Schwarze, R. Numerical study of particle filtration in an induction crucible furnace. Int. J. Heat Fluid Flow 2016, 62, 299–312. [Google Scholar] [CrossRef] [Scilit]
- Singh, R.K.; Corbey, J.F.; Deshmukh, N.S.; Howard, A.A.; Frazier, W.E.; Hu, S.; Abrecht, D.G. Computational studies of impurity migration during induction stirring of molten uranium. Comput. Mater. Sci. 2023, 229, 112386. [Google Scholar] [CrossRef] [Scilit]
- Zhao, L.; Liu, Z.; Zhang, Y.; Liang, T.; Ma, Y.; Li, B. Numerical simulation of inclusion transport behavior in vacuum induction melting process of nickel-based superalloy. J. Iron Steel Res. Int. 2025, 32, 4052–4067. [Google Scholar] [CrossRef] [Scilit]
- Zhao, P.; Gao, J.; Yang, S.; Liu, W.; Li, J.; Zhao, M. Effect of Revert Addition on the Nitrogen Removal From Liquid Superalloy During Vacuum Induction Melting Process: Experimental and Simulation Studies. Metall. Mater. Trans. B 2024, 55, 431–445. [Google Scholar] [CrossRef] [Scilit]
- Wang, N.; Gao, J.; Yang, S.; Yang, S.; Liu, M.; Liu, W.; Qu, J. Numerical Simulation of the Denitrification Reaction of INCONEL 718 Superalloy During Vacuum Induction Melting. Metall. Mater. Trans. B 2022, 53, 1474–1483. [Google Scholar] [CrossRef] [Scilit]
- Szekely, J.; Nakanishi, K. Stirring and its effects on aluminum deoxidation in the ASEA-SKF furnace: Part II. Mathematical representation of the turbulent flow field and of tracer dispersion. Metall. Trans. B 1975, 6, 245–256. [Google Scholar] [CrossRef] [Scilit]
- Tarapore, E.D.; Evans, J.W.; Langfeldt, J. Fluid velocities in induction melting furnaces: Part II. large scale measurements and predictions. Metall. Trans. B 1977, 8, 179–184. [Google Scholar] [CrossRef] [Scilit]
- Stiller, J.; Koal, K.; Nagel, W.E.; Pal, J.; Cramer, A. Liquid metal flows driven by rotating and traveling magnetic fields. Eur. Phys. J. Spec. Top. 2013, 220, 111–122. [Google Scholar] [CrossRef] [Scilit]
- Frizen, V.E.; Smolianov, I.A.; Sarapulov, S.F. Induction crucible furnace with reactive power nonsymmetrical compensation of inductor sections. In Proceedings of the 2018 20th International Symposium on Electrical Apparatus and Technologies (SIELA), Bourgas, Bulgaria, 3–6 June 2018; pp. 1–4. [Google Scholar]
- Zhang, C.; Cao, F.; Zhang, L.; Jin, Z.; Cao, G.; Qiu, Z.; Shen, H.; Huang, Y.; Jiang, S.; Sun, J. Break the superheat temperature limitation of induction skull melting technology. Appl. Therm. Eng. 2023, 220, 119780. [Google Scholar] [CrossRef] [Scilit]
- Buliński, P.; Smolka, J.; Siwiec, G.; Blacha, L.; Golak, S.; Przyłucki, R.; Palacz, M.; Melka, B. Numerical examination of the evaporation process within a vacuum induction furnace with a comparison to experimental results. Appl. Therm. Eng. 2019, 150, 348–358. [Google Scholar] [CrossRef] [Scilit]
- Bansal, A.; Chapelle, P.; Delannoy, Y.; Waz, E.; Le Brun, P.; Bellot, J.P. Experimental and Numerical Analysis of the Deformation of a Liquid Aluminum Free Surface Covered by an Oxide Layer During Induction Melting. Metall. Mater. Trans. B 2015, 46, 2096–2109. [Google Scholar] [CrossRef] [Scilit]
- Peşteanu, O.; Baake, E. The Multicell Volume of Fluid (MC-VOF) Method for the Free Surface Simulation of MFD Flows. Part I: Mathematical Model. ISIJ Int. 2011, 51, 707–713. [Google Scholar] [CrossRef] [Scilit][Green Version]
- Spitans, S.; Jakovics, A.; Baake, E.; Nacke, B. Numerical Modeling of Free Surface Dynamics of Melt in an Alternate Electromagnetic Field: Part I. Implementation and Verification of Model. Metall. Mater. Trans. B 2013, 44, 593–605. [Google Scholar] [CrossRef] [Scilit]
- Garcia-Michelena, P.; Ruiz-Reina, E.; Herrero-Dorca, N.; Chamorro, X. Multiphysics modeling and experimental validation of heat and mass transfer for the vacuum induction melting process. Appl. Therm. Eng. 2024, 243, 122562. [Google Scholar] [CrossRef] [Scilit]
- Garcia-Michelena, P.; Ruiz-Reina, E.; Gordo-Burgoa, O.; Herrero-Dorca, N.; Chamorro, X. Numerical Simulation of Free Surface Deformation and Melt Stirring in Induction Melting Using ALE and Level Set Methods. Materials 2025, 18, 199. [Google Scholar] [CrossRef] [Scilit] [PubMed]
- Abe, K.; Kondoh, T.; Nagano, Y. A new turbulence model for predicting fluid flow and heat transfer in separating and reattaching flows—I. Flow field calculations. Int. J. Heat Mass Transf. 1994, 37, 139–151. [Google Scholar] [CrossRef] [Scilit]
- Mills, K.C. Recommended Values of Thermophysical Properties for Selected Commercial Alloys; Woodhead Publishing: Cambridge, UK, 2002. [Google Scholar]
- Zhou, X.; Zhang, Y.; He, Q.; Ni, P.; Yue, Q.; Ersson, M. Novel Evaluation Method to Determine the Mixing Time in a Ladle Refining Process. Metall. Mater. Trans. B 2022, 53, 4114–4123. [Google Scholar] [CrossRef] [Scilit]
- Avatar, K.; Mazumdar, D. Numerical Modeling of Melt Flow and Mixing in an Inductively Stirred Ladle and Comparison with Gas and Mechanical Stirring. Steel Res. Int. 2025, 96, 2300711. [Google Scholar] [CrossRef] [Scilit]
- Buliński, P.; Smolka, J.; Golak, S.; Przyłucki, R.; Palacz, M.; Siwiec, G.; Lipart, J.; Białecki, R.; Blacha, L. Numerical and experimental investigation of heat transfer process in electromagnetically driven flow within a vacuum induction furnace. Appl. Therm. Eng. 2017, 124, 1003–1013. [Google Scholar] [CrossRef] [Scilit]

Disclaimer/Publisher’s Note: The statements, opinions and data contained in all publications are solely those of the individual author(s) and contributor(s) and not of MDPI and/or the editor(s). MDPI and/or the editor(s) disclaim responsibility for any injury to people or property resulting from any ideas, methods, instructions or products referred to in the content. |
© 2026 by the authors. Licensee MDPI, Basel, Switzerland. This article is an open access article distributed under the terms and conditions of the Creative Commons Attribution (CC BY) license.