


Abstract
Laser powder bed fusion (LPBF)-fabricated TA15 titanium alloy commonly exhibits a fine acicular lath morphology, which has frequently been interpreted as martensitic in previous studies and is generally associated with high strength and limited plastic accommodation. In this study, LPBF-TA15 specimens were annealed at 800, 900, and 950 °C for 2 h, followed by furnace cooling, and subsequently subjected to secondary annealing at 550 °C for 4 h. Each sequentially annealed condition was compared with its corresponding single-step condition to distinguish retained microstructural differences from the tensile-property changes associated with the subsequent treatment. Microstructural evolution and monotonic tensile properties at room temperature and 300–600 °C were investigated. Annealing at 800 °C retained a relatively fine lamellar morphology. Increasing the initial annealing temperature to 900 and 950 °C produced progressively larger apparent lath and colony scales, with the most pronounced coarsening observed at 950 °C. Tensile results are reported as mean ± standard deviation. After secondary annealing, A800-S550 exhibited the highest mean room-temperature strength among the three secondary-annealed conditions, with a yield strength of 1045.0 ± 2.6 MPa, an ultimate tensile strength of 1116.7 ± 2.3 MPa, and an elongation of 14.3 ± 0.7%. From 300 to 600 °C, its yield strength decreased from 701.0 ± 3.2 to 493.6 ± 9.8 MPa, while its ultimate tensile strength decreased from 823.5 ± 3.8 to 585.6 ± 7.1 MPa; the elongation at 600 °C was 19.0 ± 1.8%. In this study, microstructural inheritance refers to the persistence, after the common 550 °C treatment, of differences in lath and lamellar-colony scales and EBSD boundary characteristics established during initial annealing. The secondary-annealed conditions retained distinct microstructural scales and exhibited different tensile responses; however, a unique causal relationship between the retained morphology and the magnitude of the property changes was not established. Residual stress, post-heat-treatment oxygen variation, and quantitative texture evolution were not independently evaluated. The conclusions are limited to the heat-treatment schedules and monotonic tensile conditions examined in this study.
1. Introduction
TA15 titanium alloy, nominally Ti-6.5Al-2Zr-1Mo-1V, is a representative near-α titanium alloy used in aerospace structural applications because of its high specific strength, weldability, fracture resistance, and intermediate-temperature stability [1,2,3,4]. The increasing geometric complexity of aerospace components presents challenges for conventional forging, machining, and welding, particularly for structures containing thin walls, internal channels, and local overhangs. Laser powder bed fusion (LPBF) provides a near-net-shape manufacturing route with high geometric freedom and material utilization [5,6]. Previous studies have established feasible processing windows for LPBF TA15 and demonstrated that appropriate control of laser energy input and scanning parameters can produce material with good metallurgical quality [7,8,9].
Rapid solidification and repeated thermal cycling during LPBF commonly produce elongated prior-β grains containing hierarchical acicular α′ martensite [7,8,9,10,11]. Fine martensitic laths, internal boundaries, dislocations, and twins are generally associated with high strength but may restrict plastic accommodation. The processing thermal history can also affect prior-β grain morphology, lath-variant distribution, crystallographic texture, residual stress, and mechanical anisotropy [12,13,14,15,16,17,18]. Our previous study further showed that wall-thickness-dependent cyclic reheating altered the as-built lath scale, orientation-domain characteristics, and room-temperature tensile response of LPBF-fabricated TA15 [19]. Post-heat treatment can further modify the observable microstructure and initial thermo-mechanical state [20].
Single-step annealing is widely used to promote α′ decomposition and regulate the α/β microstructure of LPBF TA15 [8,9,10,11]. Depending on temperature, holding time, and cooling route, α′ martensite may partially decompose, develop into a lamellar α + β structure, or evolve into coarser α/β morphologies. Martensite decomposition generally improves plastic accommodation, whereas increasing lath and colony scales is commonly accompanied by reduced strength. Solution treatment followed by aging and hot isostatic pressing has also been used to produce different combinations of equiaxed and lamellar microstructures [21,22].
Recent studies have clarified the response of LPBF TA15 to sub-transus annealing. Yang et al. reported progressive α′ decomposition and α/β coarsening during annealing at 650–950 °C, accompanied by decreasing strength and increasing ductility [23]. Liu et al. observed the preferential formation of fine β ligaments at α′-lath and twin boundaries during short-time annealing at 750 °C [24]. Shi et al. showed that competition between α′ decomposition and thermal coarsening at 800–850 °C could retain a relatively fine lamellar structure [25]. Zhang et al. further demonstrated that increasing annealing temperature or holding time within 800–950 °C produced pronounced lamellar coarsening and strength loss [26]. These studies show that the tensile response depends on both the degree of α′ decomposition and the resulting α/β scale.
Multistep heat treatments provide additional routes for regulating α morphology and transformed β. Wang et al. obtained a trimodal microstructure containing lamellar, short-rod, and equiaxed α through low-to-high-temperature treatment [27]. Zhang et al. developed trimodal structures through multiple annealing and further adjusted the phase morphology using a triple heat-treatment route [28,29]. Qin et al. reported that cyclic heating promoted α globularization and improved ductility while retaining relatively high strength [30]. Previous studies therefore establish that the pre-existing microstructure and the complete thermal sequence affect the final microstructure and mechanical properties. Most of these studies, however, focused on the final state produced by a specific multistep treatment route [27,28,29,30].
Elevated-temperature tensile behavior has also been investigated for LPBF TA15. Liu et al. reported that heat treatment near the β-transus altered the strength-ductility response at 500 °C through changes in grain-boundary and secondary α morphologies [31]. Zhang et al. used in-situ tensile testing at 500 °C to relate strain localization and slip activation to α-lamellar morphology [32]. Recent studies have evaluated tensile behavior over 500–750 °C and discussed possible thermally activated deformation and microstructural changes [33,34]. Tensile and fatigue properties from room temperature to 600 °C have also been reported [35].
The present study addresses a narrower question: whether three quantitatively different pre-annealed states remain distinguishable after the same 550 °C treatment and how their tensile properties change relative to the corresponding single-step states. Specimens initially annealed at 800, 900, and 950 °C were characterized before and after a common treatment at 550 °C for 4 h. This paired comparison separates the final property ranking from the property changes within each heat-treatment series and covers monotonic tensile behavior from room temperature to 600 °C. It also differs from our previous study [19], which examined wall-thickness-dependent cyclic reheating during LPBF and the resulting as-built room-temperature response rather than post-build sequential annealing.
In the present study, microstructural inheritance is defined as the persistence, after a common 550 °C secondary-annealing treatment, of differences established during the initial annealing step. These differences are evaluated using apparent lath thickness, packet or lamellar-colony size, orientation-domain characteristics, misorientation-angle distributions, and low-angle and high-angle boundary fractions. The term does not imply that the microstructure remains unchanged or that individual phase-transformation variants or prior-β topology are directly reconstructed. Coarsening and recovery describe changes within an individual condition, whereas inheritance refers to whether relative differences among initially distinct conditions remain observable after the same subsequent treatment. The present SEM and EBSD datasets do not independently distinguish martensitic α′ from equilibrium α or provide a reliable β-phase fraction. Phase-transformation interpretations are therefore discussed only with reference to previous studies.
To perform this paired comparison, LPBF TA15 specimens were annealed at 800, 900, and 950 °C for 2 h to establish different observable lath and colony scales, followed by the same secondary annealing at 550 °C for 4 h. Each sequentially annealed condition was compared with its corresponding single-step annealed state. The experimental question was therefore limited to whether the differences established by the three initial annealing treatments remained observable after the common 550 °C exposure and how the tensile properties changed within each paired condition. A direct 550 °C treatment of the as-built material was not included; consequently, the independent response of the as-built microstructure to this treatment and the separate contributions of the two thermal steps could not be determined. The lath and colony dimensions are treated as image-based semi-quantitative descriptors. Quantitative phase fractions and interface densities were not determined. Residual stress, post-heat-treatment oxygen content, and quantitative texture evolution were also not independently measured; therefore, the tensile-property differences are interpreted as being consistent with the observed microstructures rather than being caused exclusively by them. The conclusions are limited to the investigated heat-treatment schedules and monotonic tensile conditions. Fatigue, creep, dwell sensitivity, long-term thermal exposure, environmental degradation, and service-life behavior were not evaluated.
2. Experiments
2.1. Materials
TA15 titanium alloy powder was used as the LPBF feedstock, and an annealed TC4 titanium alloy plate with dimensions of 250 mm × 250 mm × 20 mm was used as the substrate. Before fabrication, the substrate surface was ground and sequentially cleaned with acetone and absolute ethanol.
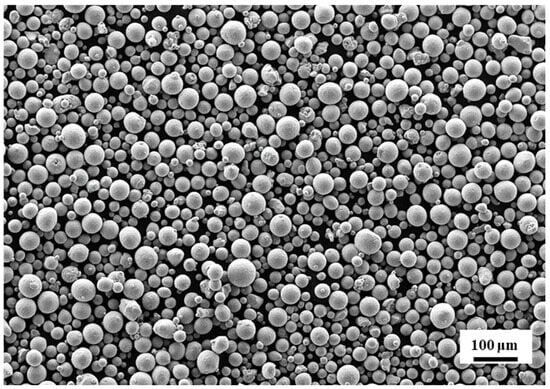
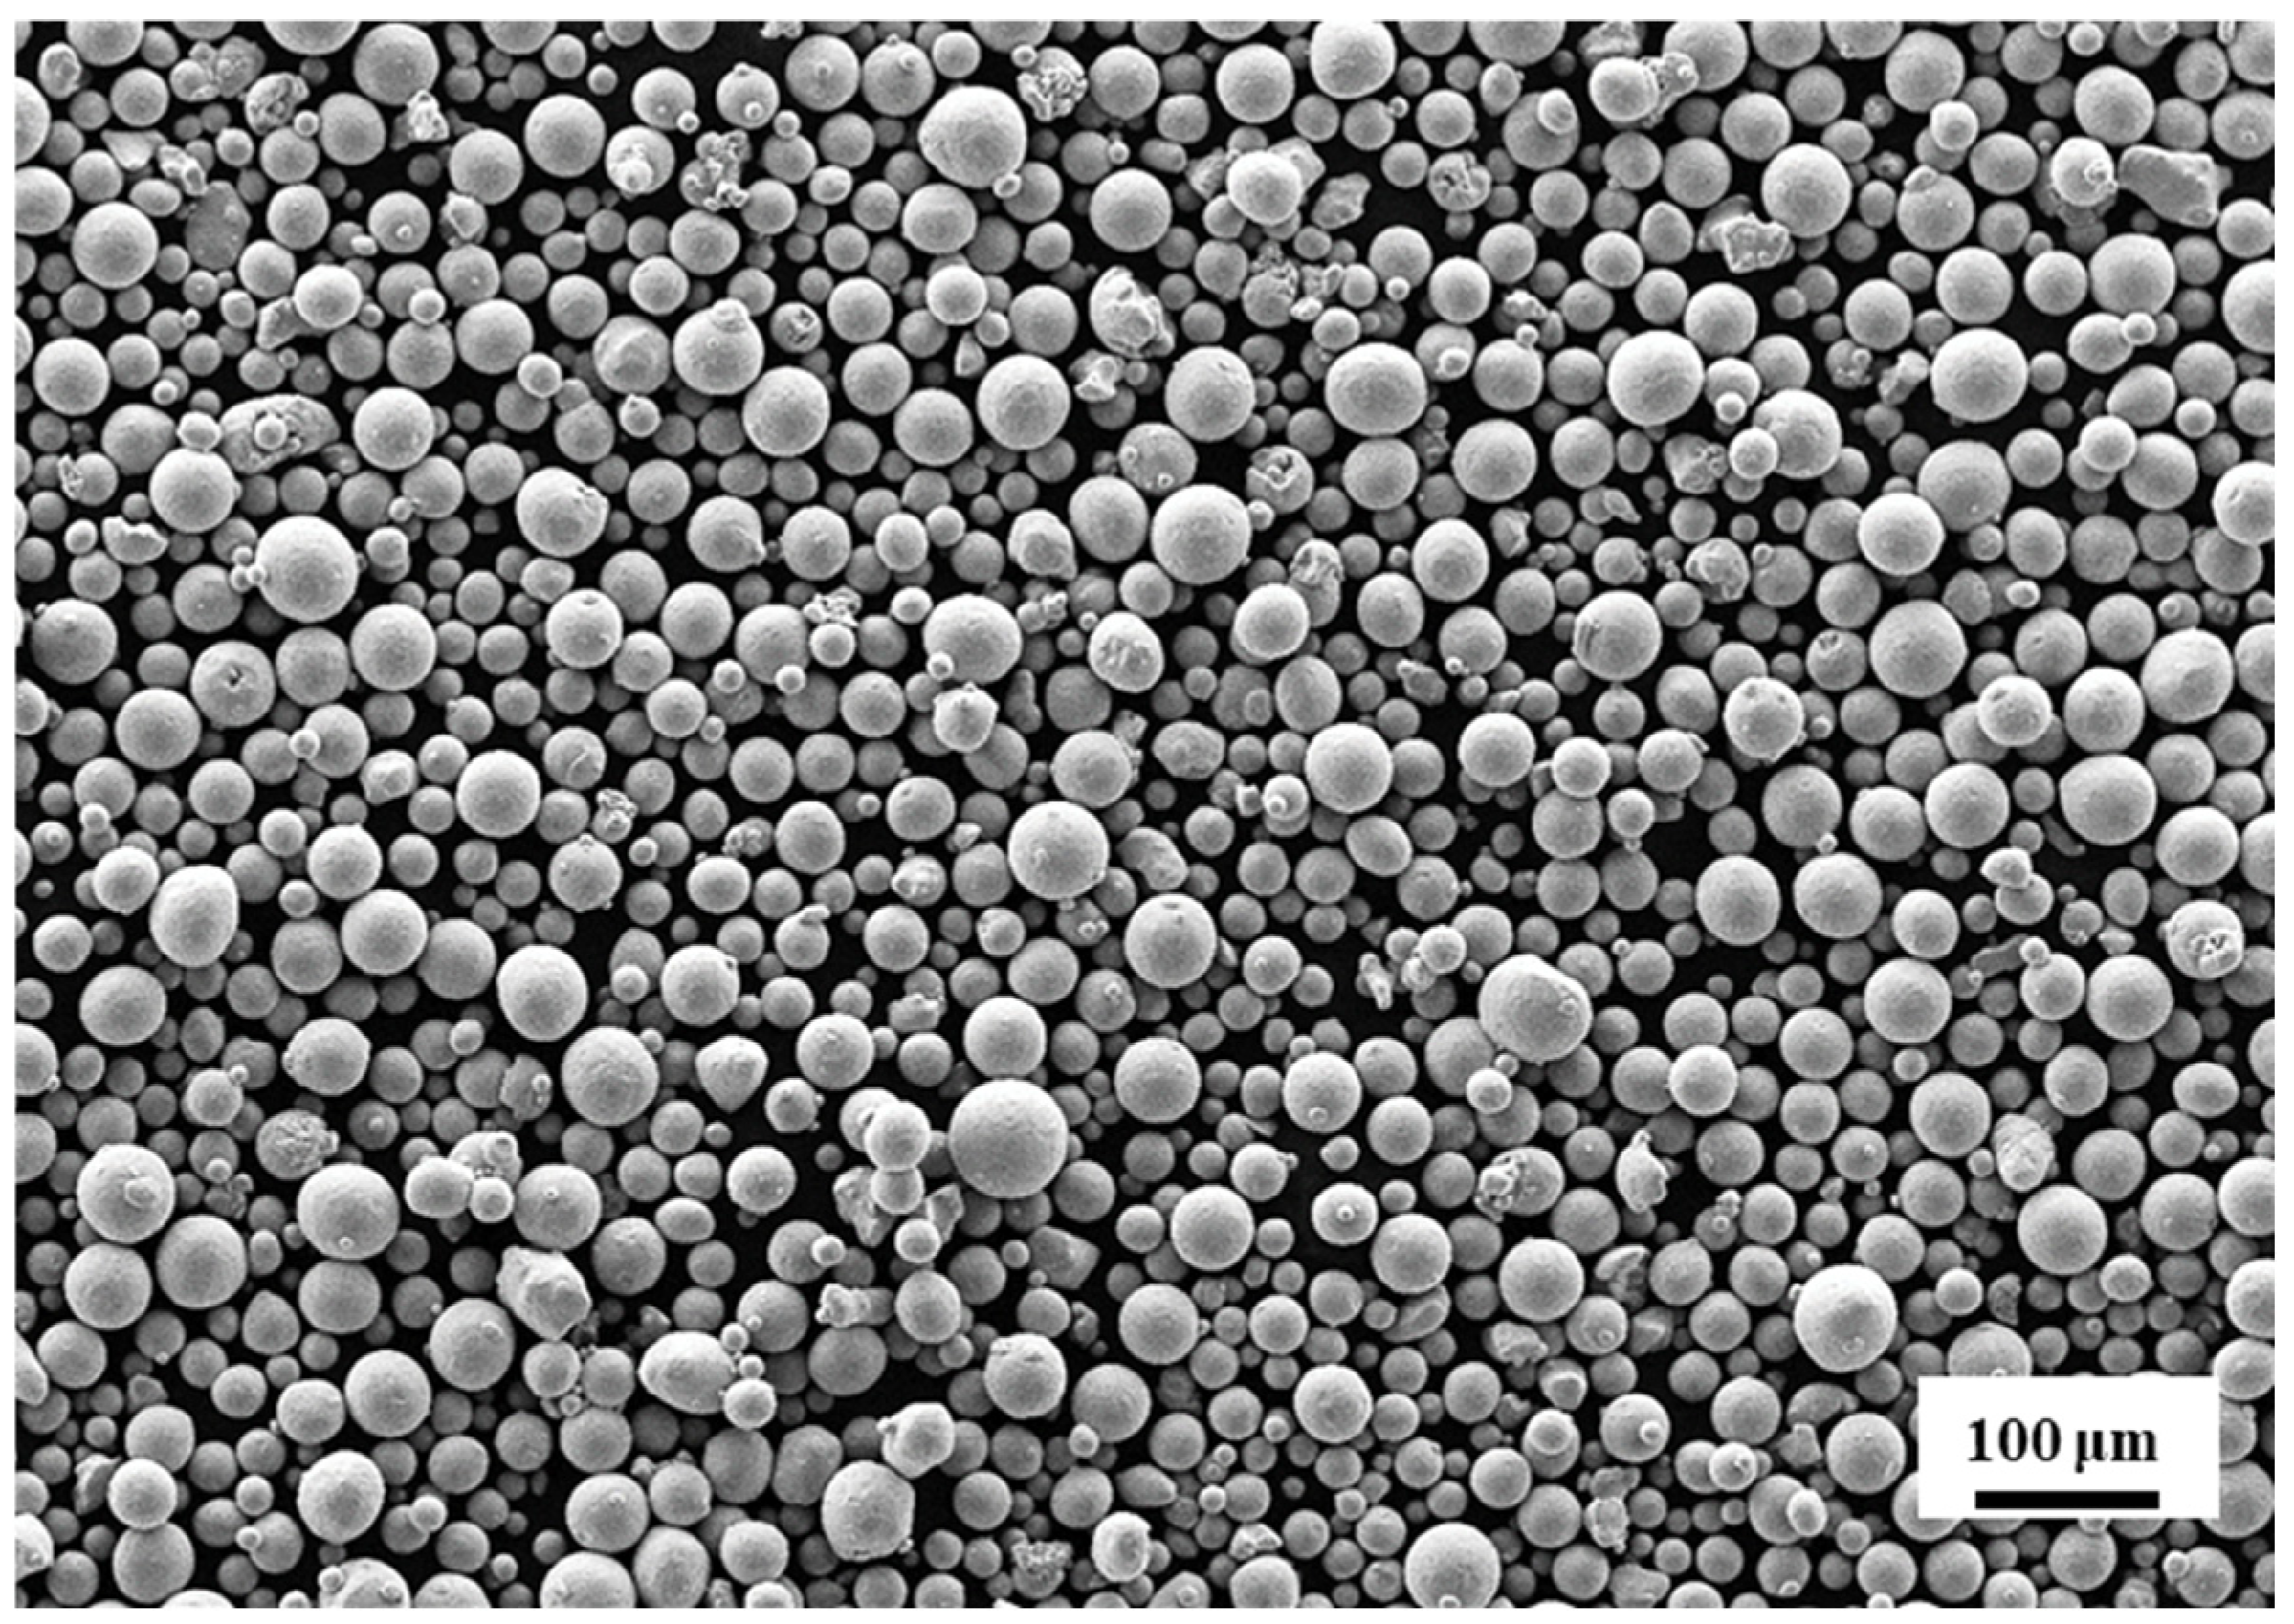
The TA15 powder was produced by electrode induction melting gas atomization and had a nominal particle-size range of 15–53 μm. According to the powder batch inspection certificate, the D10, D50, and D90 values were 19.15, 35.26, and 58.57 μm, respectively. Particles smaller than 15 μm, within 15–53 μm, and larger than 53 μm accounted for 3.51%, 94.38%, and 2.11%, respectively. The measured distribution therefore contained small fine- and coarse-particle tails outside the nominal range. As shown in Figure 1, the particles were predominantly near-spherical, with relatively smooth surfaces and a small number of satellite particles. Quantitative particle-shape descriptors were not measured.
Figure 1.
SEM morphology of the TA15 powder used for LPBF.
All specimens were fabricated using virgin powder from the same production batch, without the use of recycled powder. Before each LPBF build, the powder was vacuum-dried at 125 °C for 2 h. The same powder batch, drying procedure, processing parameters, and atmosphere-control requirements were used throughout the study. Storage humidity was not continuously monitored, and the oxygen and nitrogen contents were not remeasured after powder handling, LPBF fabrication, or heat treatment.
The supplier-reported powder flowability, apparent density, and tap density were 34.4 s/50 g, 2.42 g/cm3, and 2.81 g/cm3, respectively. Because the batch inspection certificate did not specify the instrument models, measurement standards, or number of repetitions, these values are reported as supplier-provided batch-characterization data.
The measured powder composition and the corresponding limits specified in GB/T 3620.1-2016 [36] are listed in Table 1. The measured contents of Al, V, Zr, Mo, Si, C, Fe, O, and N were 6.09, 1.25, 2.16, 0.81, 0.023, <0.01, 0.024, 0.073, and 0.0092 wt.%, respectively, with Ti as the balance. All values were within the specified ranges or upper limits. Because all specimens were produced from the same virgin powder batch, variations in the initial feedstock composition were minimized. However, the reported oxygen and nitrogen contents refer only to the virgin powder. These elements were not remeasured after LPBF fabrication or after heat treatment. Consequently, possible interstitial pickup and its contribution to the absolute tensile-property levels or the differences among the heat-treated conditions could not be quantified.
Table 1.
Chemical composition of the TA15 powder and the corresponding limits specified in GB/T 3620.1-2016 (wt.%).
2.2. LPBF Processing and Specimen Preparation
All specimens were fabricated using a BLT-A320 LPBF system (Xi’an Bright Laser Technologies, Xi’an, China) equipped with a Yb-fiber laser with a maximum power of 500 W and a wavelength of 1060–1080 nm. Fabrication was conducted under high-purity argon, with the chamber oxygen concentration maintained below 100 ppm. No substrate preheating was applied. The selected parameter set had previously been used for stable fabrication of TA15 alloy. The dimensions of 250 mm × 250 mm × 20 mm refer to the substrate plate rather than the deposited blocks.
The specimens were fabricated using a laser power of 280 W, a scan speed of 1250 mm/s, a layer thickness of 60 μm, a hatch distance of 100 μm, and a nominal laser-beam diameter of 100 μm. A stripe-based zigzag scan strategy was adopted, with a stripe width of 10 mm, an overlap of 0.02 mm between adjacent stripes, and a 67° rotation between successive layers. No separate contour or border scan was used, and no dedicated up-skin, down-skin, or other boundary-specific parameters were applied. The entire block was fabricated using the same bulk-infill parameter set, as summarized in Table 2.
Table 2.
LPBF processing parameters used in this study.
All specimens were produced using the same LPBF system, virgin powder batch, substrate preparation procedure, and processing-parameter file. The equipment-integrated monitoring system was used to monitor chamber oxygen concentration, recoating status, and general build operation. No process alarms, abnormal recoating events, build interruptions, visible cracking, delamination, or obvious warping were recorded. Independent melt-pool monitoring, layerwise thermal imaging, and in-situ temperature measurement were not performed. Residual stress was not independently measured.
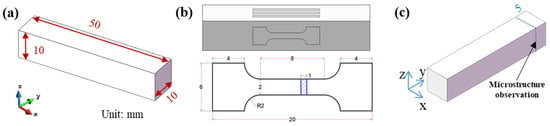
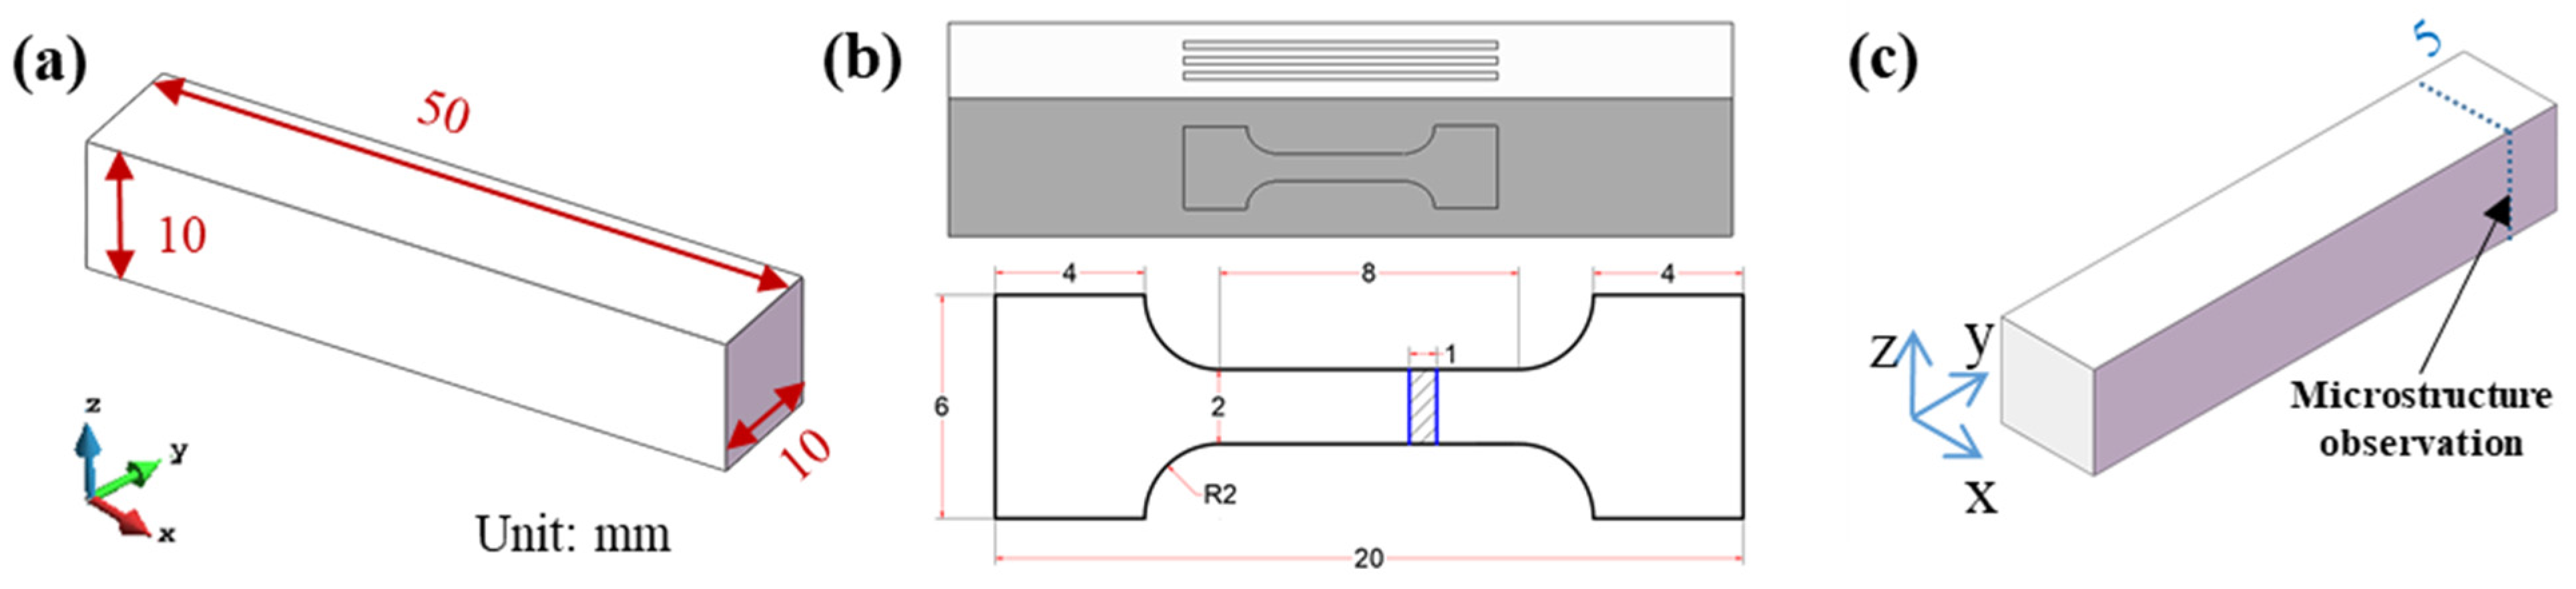
Blocks measuring 50 mm × 10 mm × 10 mm were fabricated for heat treatment, microstructural characterization, and tensile-specimen preparation. Tensile specimens were extracted by wire electrical discharge machining, with their longitudinal loading axes parallel to the build direction. The same nominal extraction region and orientation were used for all conditions. The specimen arrangement, dimensions, and microstructural observation plane are shown in Figure 2. The tensile-specimen gauge length was 8 mm, and the extensometer gauge length was 7 mm. Specimens from different block positions, including the center and edge or different build heights, were not separately evaluated.
Figure 2.
Specimen geometries and extraction locations used in this study: (a) dimensions of the LPBF-fabricated block specimen; (b) tensile-specimen extraction arrangement and specimen dimensions, with the tensile loading axis parallel to the build direction; and (c) location and plane used for microstructural observation. All dimensions are in millimeters.
Relative density and the three-dimensional defect population were not measured by the Archimedes method, X-ray computed tomography, or quantitative metallographic image analysis. Isolated pores were observed in the examined optical and SEM sections, while no obvious lack-of-fusion regions or cracks were identified in those fields. These observations are qualitative and restricted to the sampled two-dimensional sections; they do not establish the relative density, pore-volume fraction, defect-size distribution, or spatial uniformity of the fabricated blocks. Internal defects outside the examined planes may therefore have contributed to the tensile-data scatter and fracture behavior.
2.3. Heat-Treatment Schedules
The as-built condition was used as the untreated reference. Six post-heat-treatment schedules were designed, comprising three single-step annealing treatments and three sequential annealing treatments. The β-transus temperature was not measured for the powder batch used in this study. Published values for TA15 vary with composition and manufacturing route but are generally close to 1000 °C. Accordingly, initial annealing temperatures of 800, 900, and 950 °C were selected below the reported β-transus to establish progressively different observable lath and colony scales.
Based on previous studies, the treatment at 800 °C was expected to retain a relatively fine lamellar morphology, whereas treatments at 900 and 950 °C were expected to produce progressively larger lamellar scales. These temperatures were selected to generate distinguishable initial morphologies rather than to quantify a specific phase-transformation extent. A common holding time of 2 h was applied to maintain comparable thermal exposure among the three conditions.
Specimens initially annealed at 800, 900, and 950 °C were subsequently treated at 550 °C for 4 h. This common low-temperature treatment was used to determine whether the differences established during initial annealing remained observable while limiting additional coarsening at the scale resolved by SEM. It was not used to identify a specific phase-transformation process.
A direct 550 °C treatment of the as-built material was not included in the experimental matrix. Consequently, the present design cannot determine the independent effect of the 550 °C treatment on the as-built condition or fully separate the contributions of the initial and subsequent thermal steps. The paired comparisons are restricted to A800/A800-S550, A900/A900-S550, and A950/A950-S550 and therefore evaluate the net response to the 550 °C treatment only after the corresponding initial annealing condition.
All heat treatments were conducted in a laboratory resistance furnace with an effective chamber size of approximately 100 mm × 100 mm × 100 mm. Furnace-temperature uniformity was verified through routine calibration before the experiments. Specimens were heated at 10 °C/min, and the holding time was counted after the furnace reached and stabilized at the target temperature. After each treatment step, the specimens were cooled inside the closed furnace.
No thermocouples were attached directly to the specimens; therefore, specimen-level temperature histories and furnace-cooling curves were not recorded. All conditions were processed using the same furnace, loading arrangement, heating rate, and cooling procedure. However, because the specimens were cooled from different initial annealing temperatures, identical specimen-level cooling histories cannot be assumed, and their contribution to the final morphology could not be quantified. The detailed schedules are summarized in Table 3.
Table 3.
Heat-treatment schedules for LPBF-fabricated TA15 specimens.
2.4. Microstructural Characterization and Tensile Testing
Microstructural specimens were sectioned from the LPBF-fabricated blocks by wire electrical discharge machining. The specimens were mounted, ground using SiC papers from 240# to 2000#, and polished with colloidal silica. For metallographic observation, the polished surfaces were etched in a freshly prepared HF:HNO3:H2O solution with a volume ratio of 1:3:6 for 5–8 s, followed immediately by rinsing and drying. The same specimen-preparation and etching procedures were used for all conditions. Because small variations in etching may affect the apparent phase contrast, the lamellar morphology was evaluated jointly using optical microscopy, SEM, and EBSD rather than from etched contrast alone.
Microstructural characterization was performed using a Tescan Clara GMH field-emission scanning electron microscope (TESCAN GROUP, a.s., Brno, Czech Republic). SEM observations were conducted at an accelerating voltage of 15 kV. The apparent lath thickness was measured normal to the local long axis of the laths using the line-intercept method on calibrated SEM images. The characteristic packet or lamellar-colony size was estimated from calibrated optical and SEM images. At least 30 lath-width measurements and 15 packet- or colony-size measurements were obtained from non-overlapping image regions for each condition. The results are reported as mean ± standard deviation. Because the measurements were obtained from the available two-dimensional image fields rather than from a dedicated stereological sampling programme, they are treated as image-based semi-quantitative estimates.
EBSD data were acquired at an accelerating voltage of 20 kV, a specimen tilt of 70°, a working distance of 15 mm, and a step size of 0.1 μm. The selected step size was smaller than the apparent lath width observed by SEM and provided multiple measurement points across most laths. The EBSD data were used to compare hcp orientation domains and boundary distributions. Because α′ and α share the same hcp crystal structure, they were not distinguished using the present EBSD data. A second bcc phase was not indexed with sufficient consistency for reliable phase-fraction analysis; therefore, quantitative phase fractions were not determined.
EBSD data were processed using Channel5 software. The exact mean angular deviation threshold and detailed clean-up sequence could not be confirmed from the archived processing records and are therefore not reported. Misorientation angles below 2° were excluded from the boundary analysis. Boundaries with misorientation angles of 2–15° were classified as low-angle boundaries, whereas those above 15° were classified as high-angle boundaries. Their fractions were calculated relative to the total measured boundary length. Because the complete post-processing procedure could not be reconstructed, these fractions are used as comparative descriptors rather than absolute stereological measurements.
Room-temperature tensile tests were performed using an AGS-X universal testing machine equipped with a video extensometer (Shimadzu Corporation, Kyoto, Japan), with reference to ASTM E8/E8M. The tensile specimens had a gauge length of 8 mm, and strain was measured directly over a 7-mm gauge length using the video extensometer. The nominal strain rate was 1 × 10⁻³ s−1. Yield strength was determined as the 0.2% proof stress using the conventional offset method. The reported elongation represents the total engineering elongation to fracture. Uniform elongation was not evaluated separately. Direct optical strain measurement reduced the contribution of machine and grip compliance to the measured elongation. No separate machine-compliance correction or full-field digital image correlation analysis was performed. The stress–strain curves and fracture locations were examined to exclude tests showing abnormal gripping, slippage, or failure outside the gauge section.
Elevated-temperature tensile tests were conducted at 300, 500, and 600 °C using the resistance furnace integrated with the tensile-testing system. Temperature was controlled using the calibrated furnace thermocouple positioned close to the specimen gauge section. After the target temperature was reached, each specimen was held for 5 min to allow the furnace temperature to stabilize before loading. The temperature was maintained within ±5 °C during soaking and tensile testing. No thermocouple was attached directly to the specimen; therefore, the local temperature distribution along the gauge section was not independently measured. To ensure comparability, specimens with the same geometry were placed at the same position within the furnace and tested using identical heating, soaking, temperature-control, and loading procedures.
For each material condition and testing temperature, three independent tensile specimens were tested. Yield strength, ultimate tensile strength, and elongation are reported as mean values with standard deviations, and the error bars in the corresponding figures represent one standard deviation. Because only three specimens were available for each condition, formal statistical significance testing was not performed. Comparisons among conditions are therefore based on the mean values, associated scatter, and corresponding microstructural observations rather than claims of statistical significance.
3. Results and Discussion
3.1. Microstructural Evolution After Single-Step Annealing
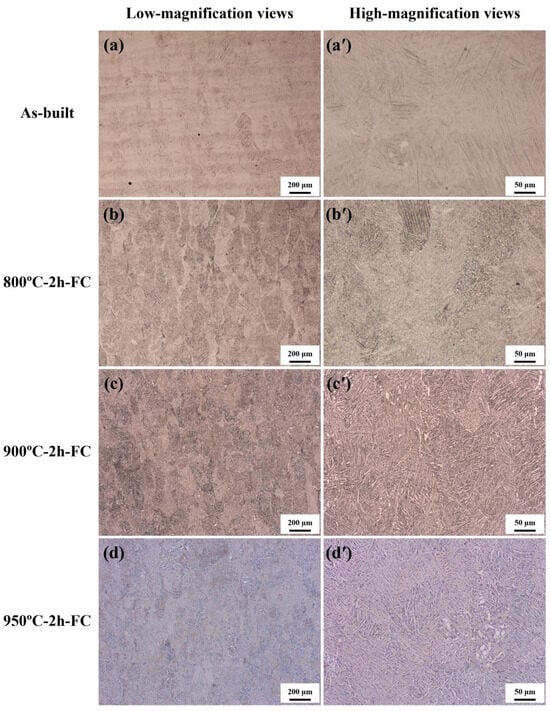
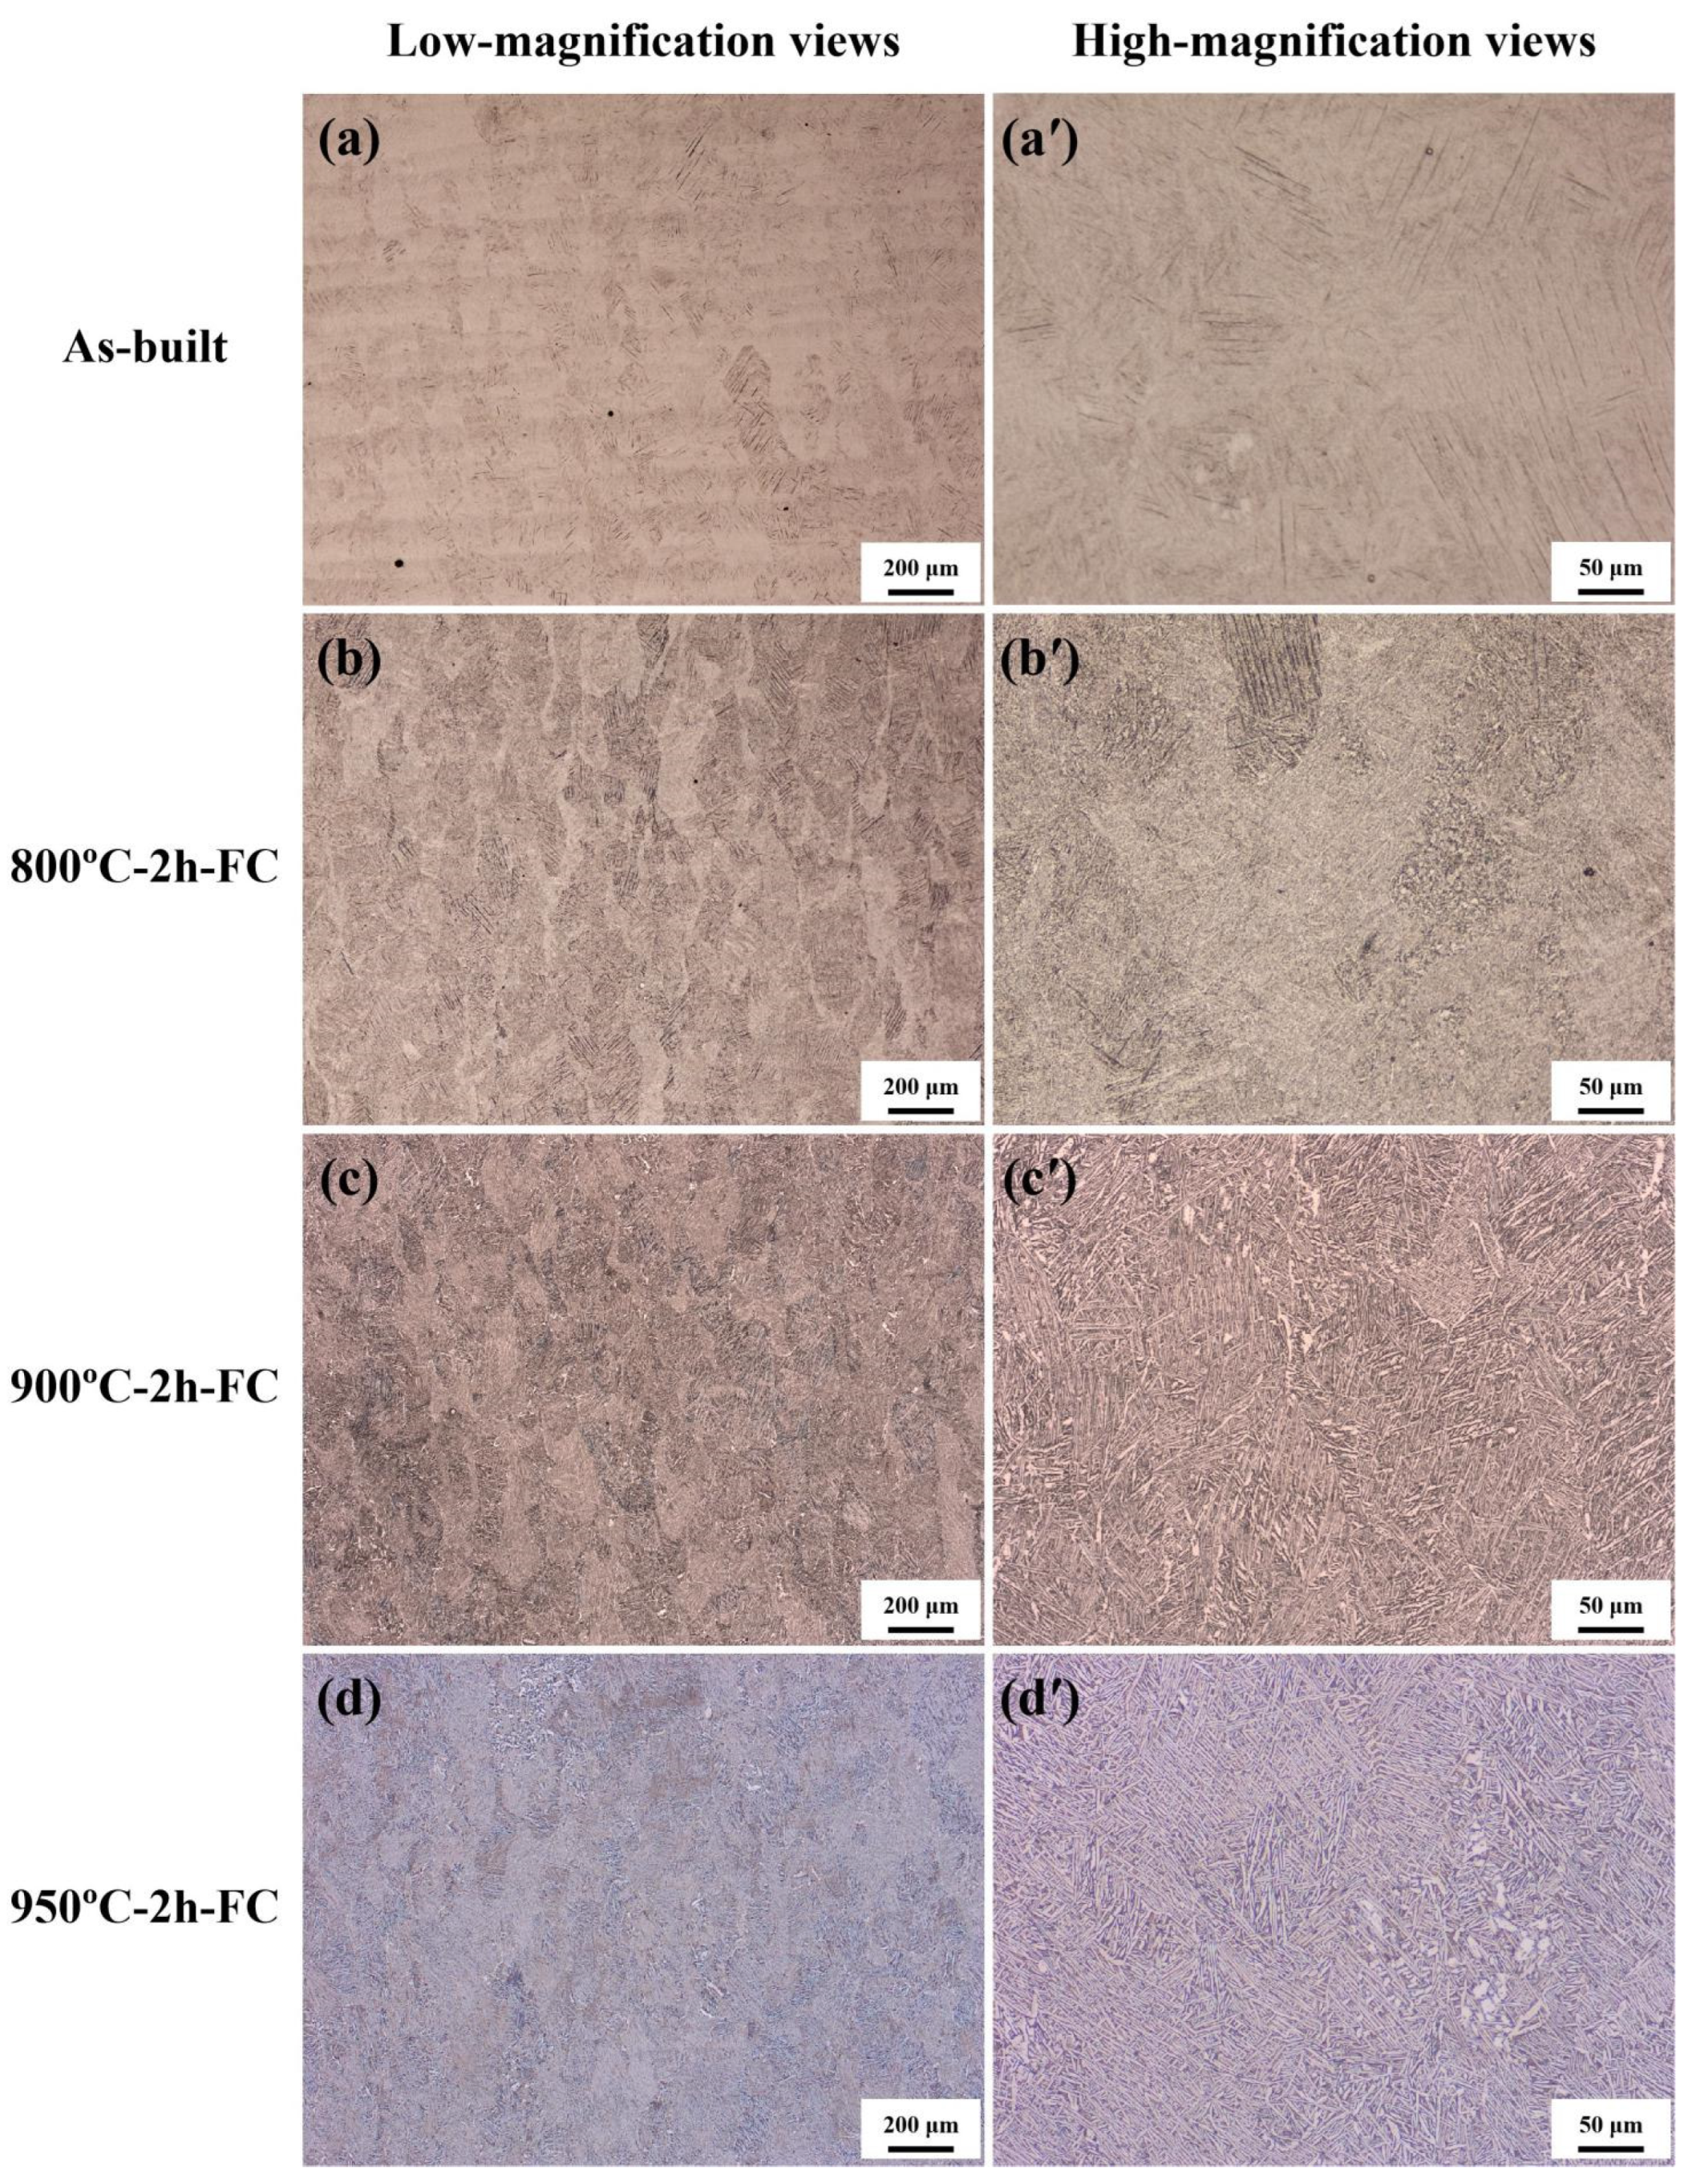
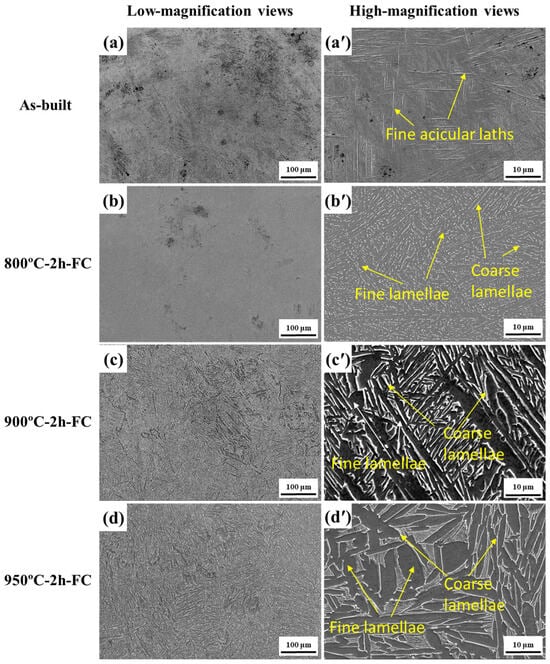
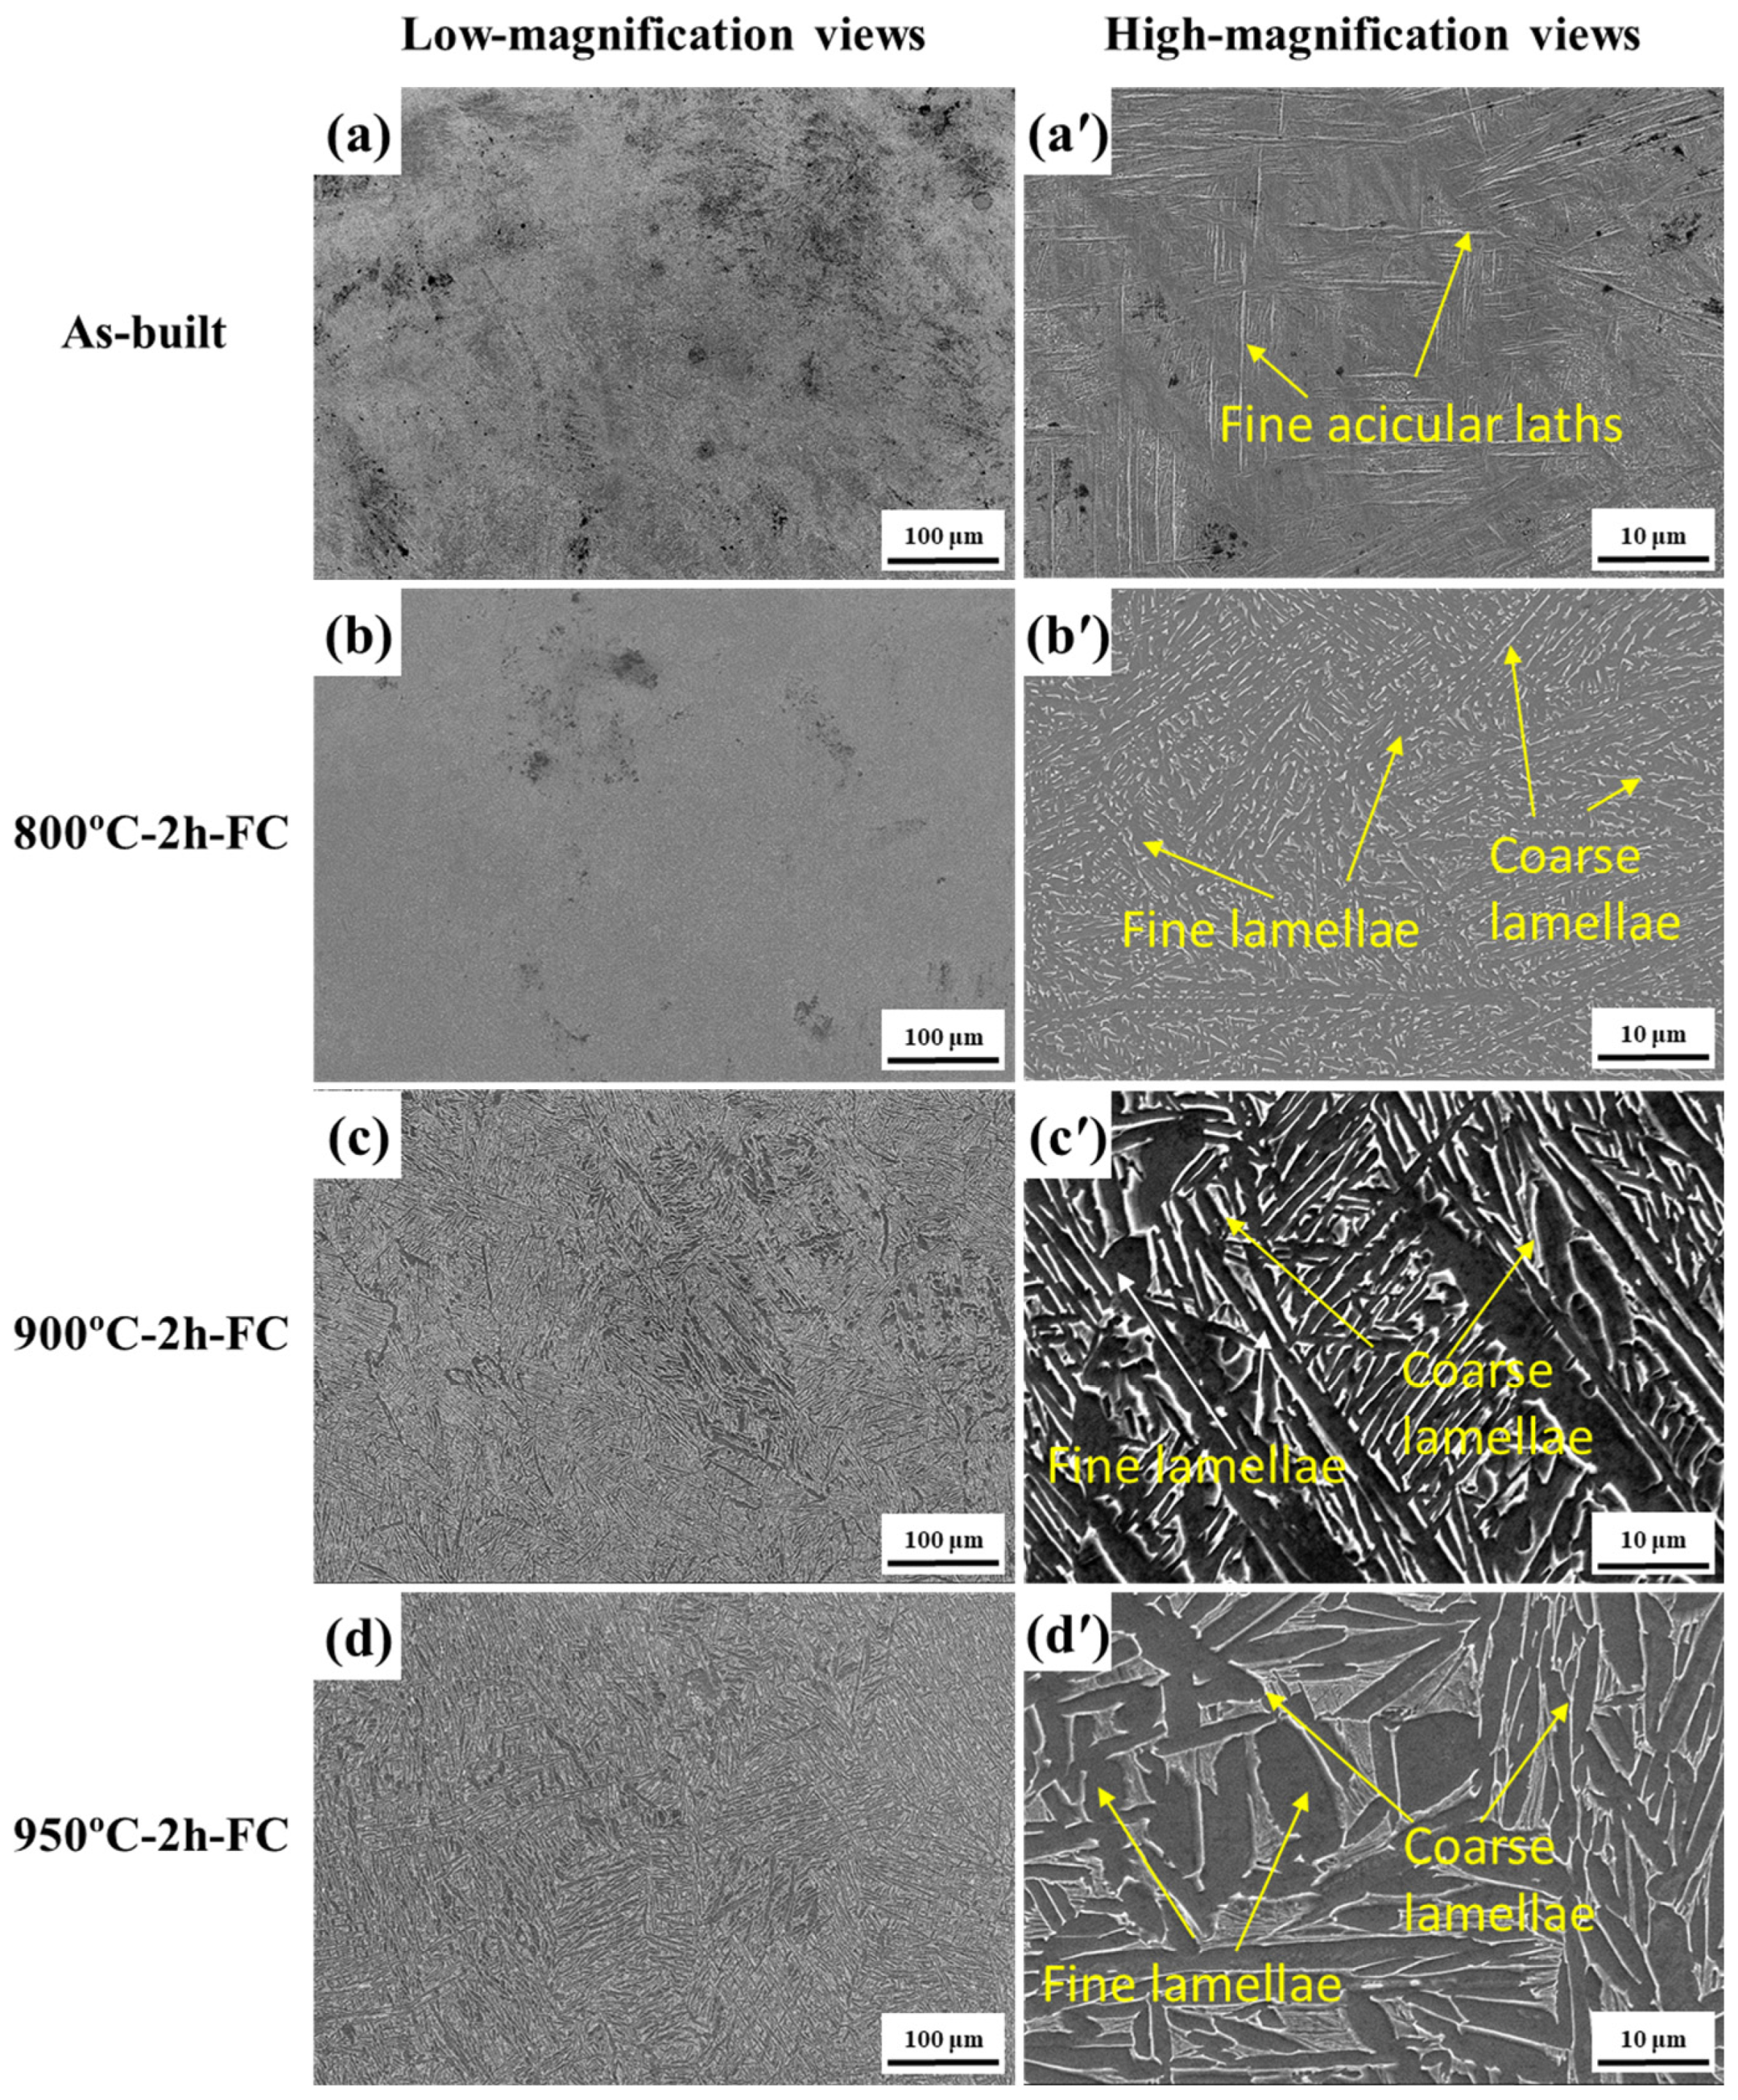
The as-built LPBF TA15 alloy exhibited elongated prior-β grain outlines containing a fine acicular lath morphology, as shown in Figure 3 and Figure 4. Such morphology is commonly interpreted as martensitic α′ in LPBF TA15 because of the rapid cooling conditions reported in previous studies [9,10]. However, α′ and equilibrium α were not distinguished directly by the present SEM and EBSD measurements. The prior-β grains were approximately aligned with the build direction, consistent with directional solidification during LPBF [9,10]. Their apparent transverse width was approximately 150 ± 50 μm, whereas the longitudinal dimensions of several grains exceeded the observation field.
Figure 3.
Optical microstructures of LPBF-fabricated TA15 alloy under different conditions: (a,a′) as-built; (b,b′) 800 °C × 2 h; (c,c′) 900 °C × 2 h; and (d,d′) 950 °C × 2 h. Images (a–d) show low-magnification views, and images (a′–d′) show corresponding high-magnification views.
Figure 4.
SEM microstructures of LPBF-fabricated TA15 alloy under different conditions: (a,a′) as-built; (b,b′) 800 °C × 2 h; (c,c′) 900 °C × 2 h; and (d,d′) 950 °C × 2 h. Images (a–d) show low-magnification views, and images (a′–d′) show corresponding high-magnification views.
The apparent lath thickness in the as-built condition was 0.6 ± 0.2 μm, and the characteristic packet size was 15 ± 6 μm. This fine hierarchical structure is consistent with the relatively high strength of the as-built material. Residual stress, dislocation density, twins, and other substructural features may also have contributed to its tensile response [9,10,12,13].
After annealing at 800 °C for 2 h followed by furnace cooling, the visible prior-β grain framework was broadly retained, while the acicular lath features became less distinct. A relatively fine lamellar morphology was observed, with an apparent lath thickness of 0.9 ± 0.3 μm and a colony size of 25 ± 9 μm. Similar morphological changes have been associated with annealing-induced martensite decomposition in previous studies [24,25,37,38], but the phase-transformation extent was not determined directly in the present work.
At 900 °C, a more clearly developed lamellar morphology was observed. The apparent lath thickness increased to 1.6 ± 0.5 μm, and the colony size increased to 45 ± 16 μm. Compared with A800, these measurements demonstrate an increase in the observable lath and colony scales, but do not independently establish the extent of α′ decomposition or the phase constitution. Annealing at 950 °C produced the largest observable microstructural scale among the investigated conditions. Coarse plate-like regions and widened lamellae were observed. The apparent lath thickness and colony size increased to 2.8 ± 1.0 μm and 75 ± 25 μm, respectively. These measurements confirm that A950 had the largest observable lath and colony scales among the single-step annealed conditions.
The reported dimensions were estimated from calibrated optical and SEM images. For the as-built material, the reported characteristic size refers to martensitic packets rather than fully developed lamellar colonies. These values provide a semi-quantitative comparison among the investigated conditions but should not be interpreted as complete stereological measurements. Quantitative phase fractions were not determined because a second phase was not resolved or indexed consistently by the present SEM and EBSD analyses.
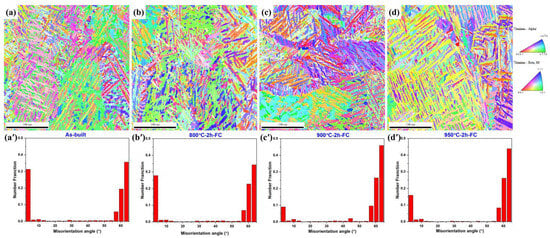
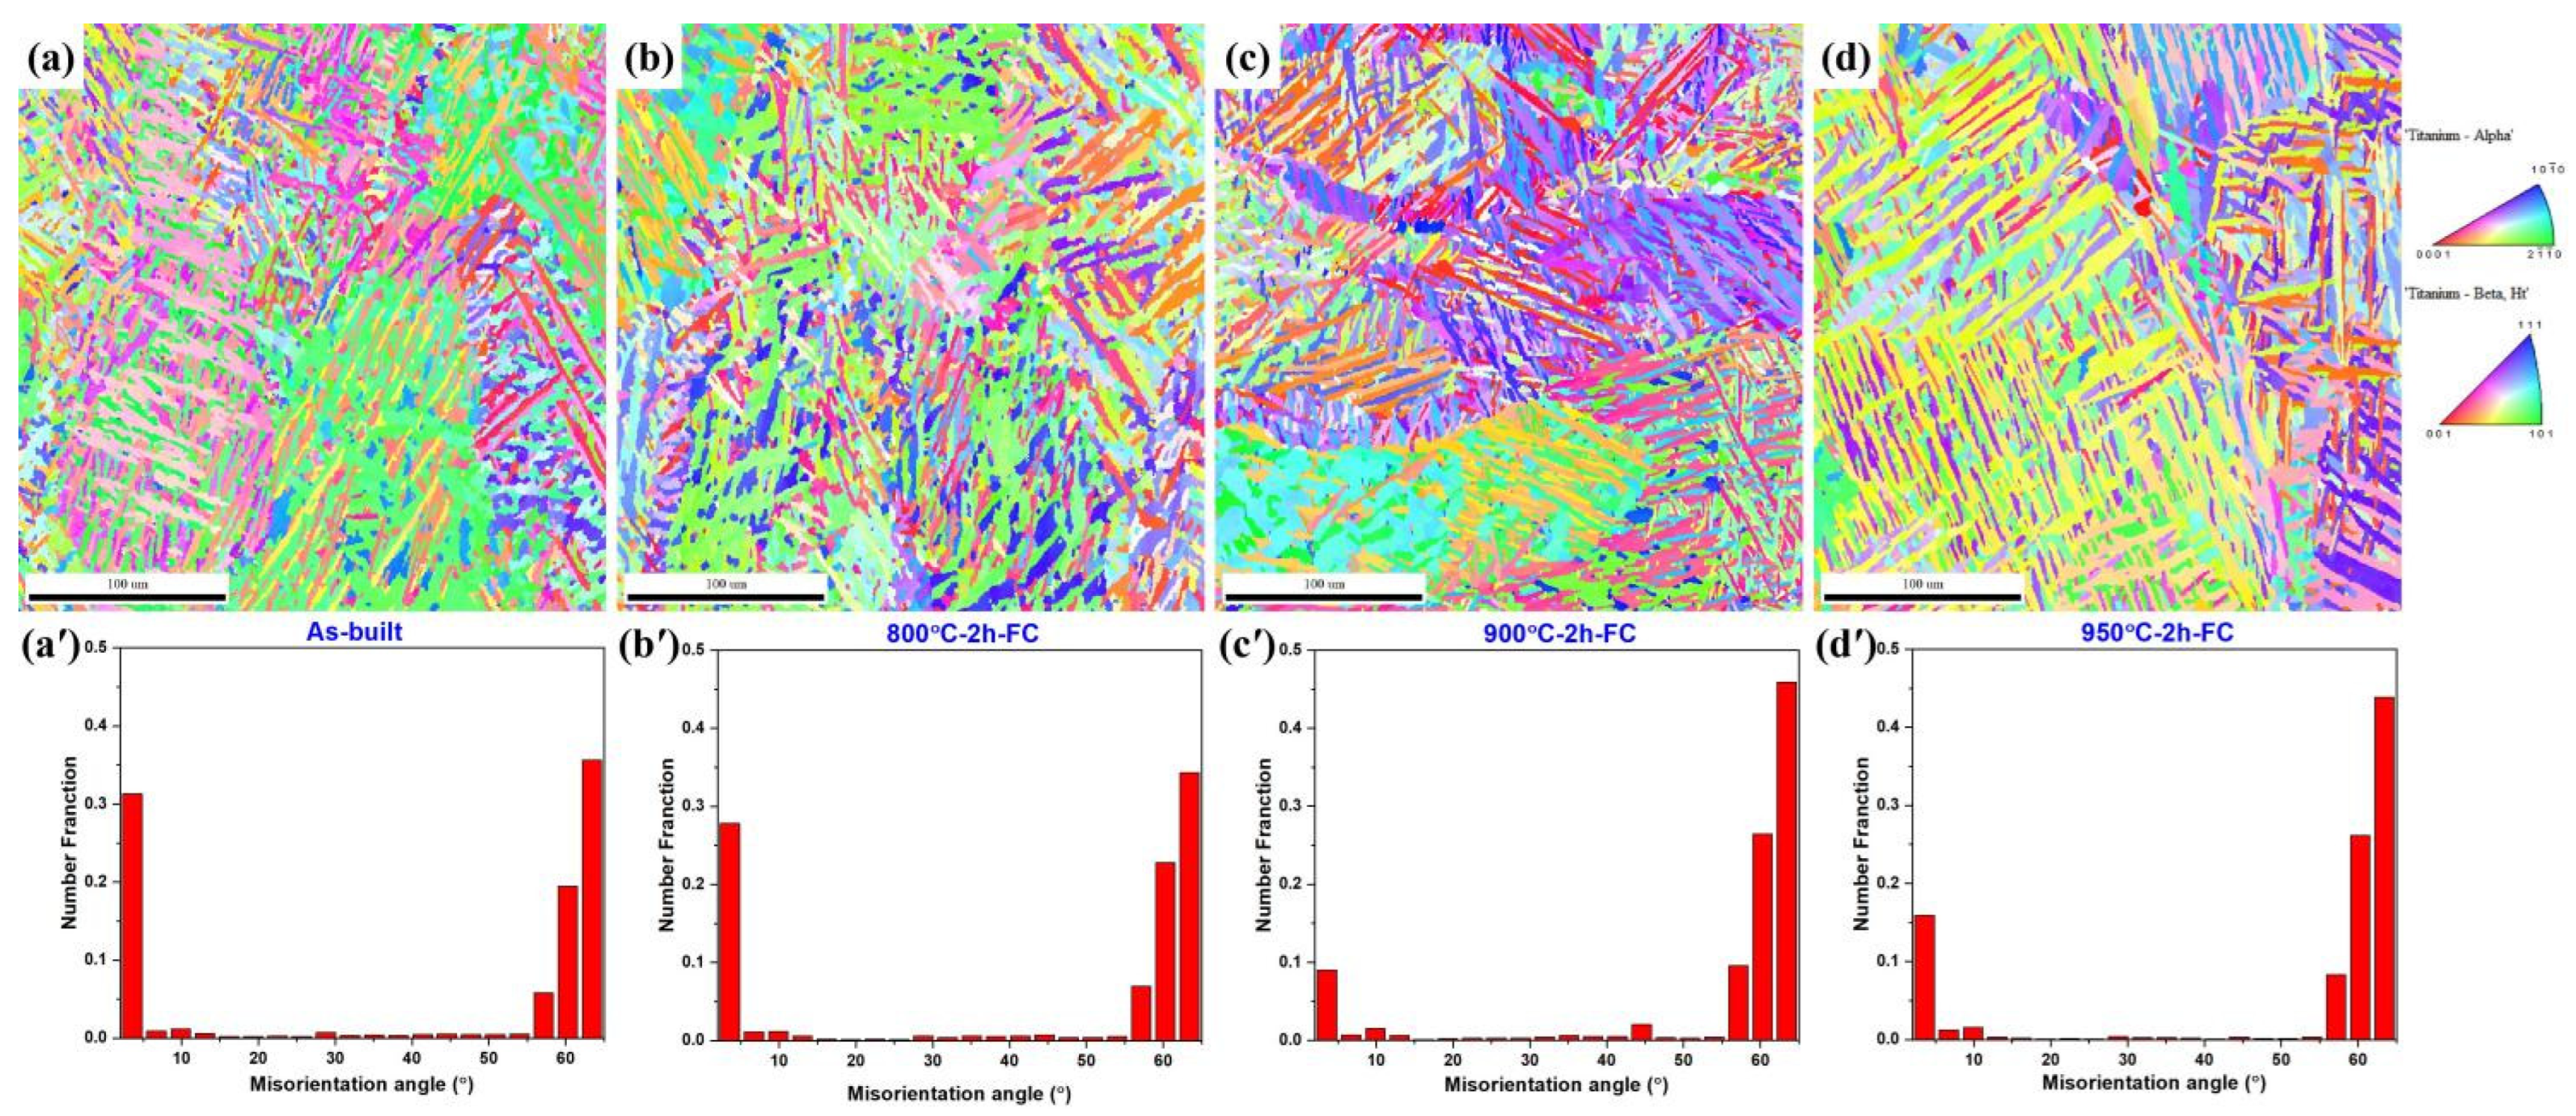
The EBSD results in Figure 5 further illustrate the evolution of the hcp orientation domains. The as-built specimen contained numerous small domains with frequent local orientation changes. The processed EBSD dataset contained 34.0% low-angle boundaries and 66.0% high-angle boundaries.
Figure 5.
EBSD characterization of LPBF-fabricated TA15 alloy in different conditions: (a,a′) as-built; (b,b′) 800 °C × 2 h; (c,c′) 900 °C × 2 h; and (d,d′) 950 °C × 2 h. Images (a–d) show hcp IPF maps, and images (a′–d′) show the corresponding misorientation-angle distributions.
After annealing at 800 °C, fine orientation domains remained visible, although some adjacent regions became more spatially continuous. The corresponding low-angle and high-angle boundary fractions were 30.6% and 69.4%, respectively. These observations were consistent with the retention of relatively fine orientation-domain and lamellar scales after the 800 °C treatment.
At 900 °C, larger similarly oriented domains were observed, in agreement with the increase in colony size measured from the SEM images. The low-angle and high-angle boundary fractions were 11.8% and 88.2%, respectively. After annealing at 950 °C, the IPF map showed larger and more continuous orientation domains corresponding to the coarser lamellar morphology observed in Figure 4. The corresponding fractions were 19.0% and 81.0%.
Misorientation populations near 60° and 90° may be related to orientation relationships among α variants transformed from the prior-β phase [32]. However, individual variants and reconstructed prior-β grains were not analyzed in the present study. The EBSD results are therefore used to compare orientation-domain scale and boundary distributions rather than to quantify variant selection or local strain. Because the complete EBSD post-processing sequence could not be reconstructed, the reported boundary fractions should be interpreted as comparative values among the processed datasets.
3.2. Tensile Properties of LPBF-TA15 After Single-Step Annealing
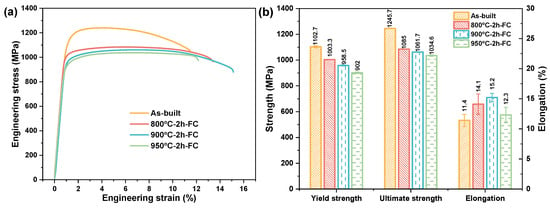
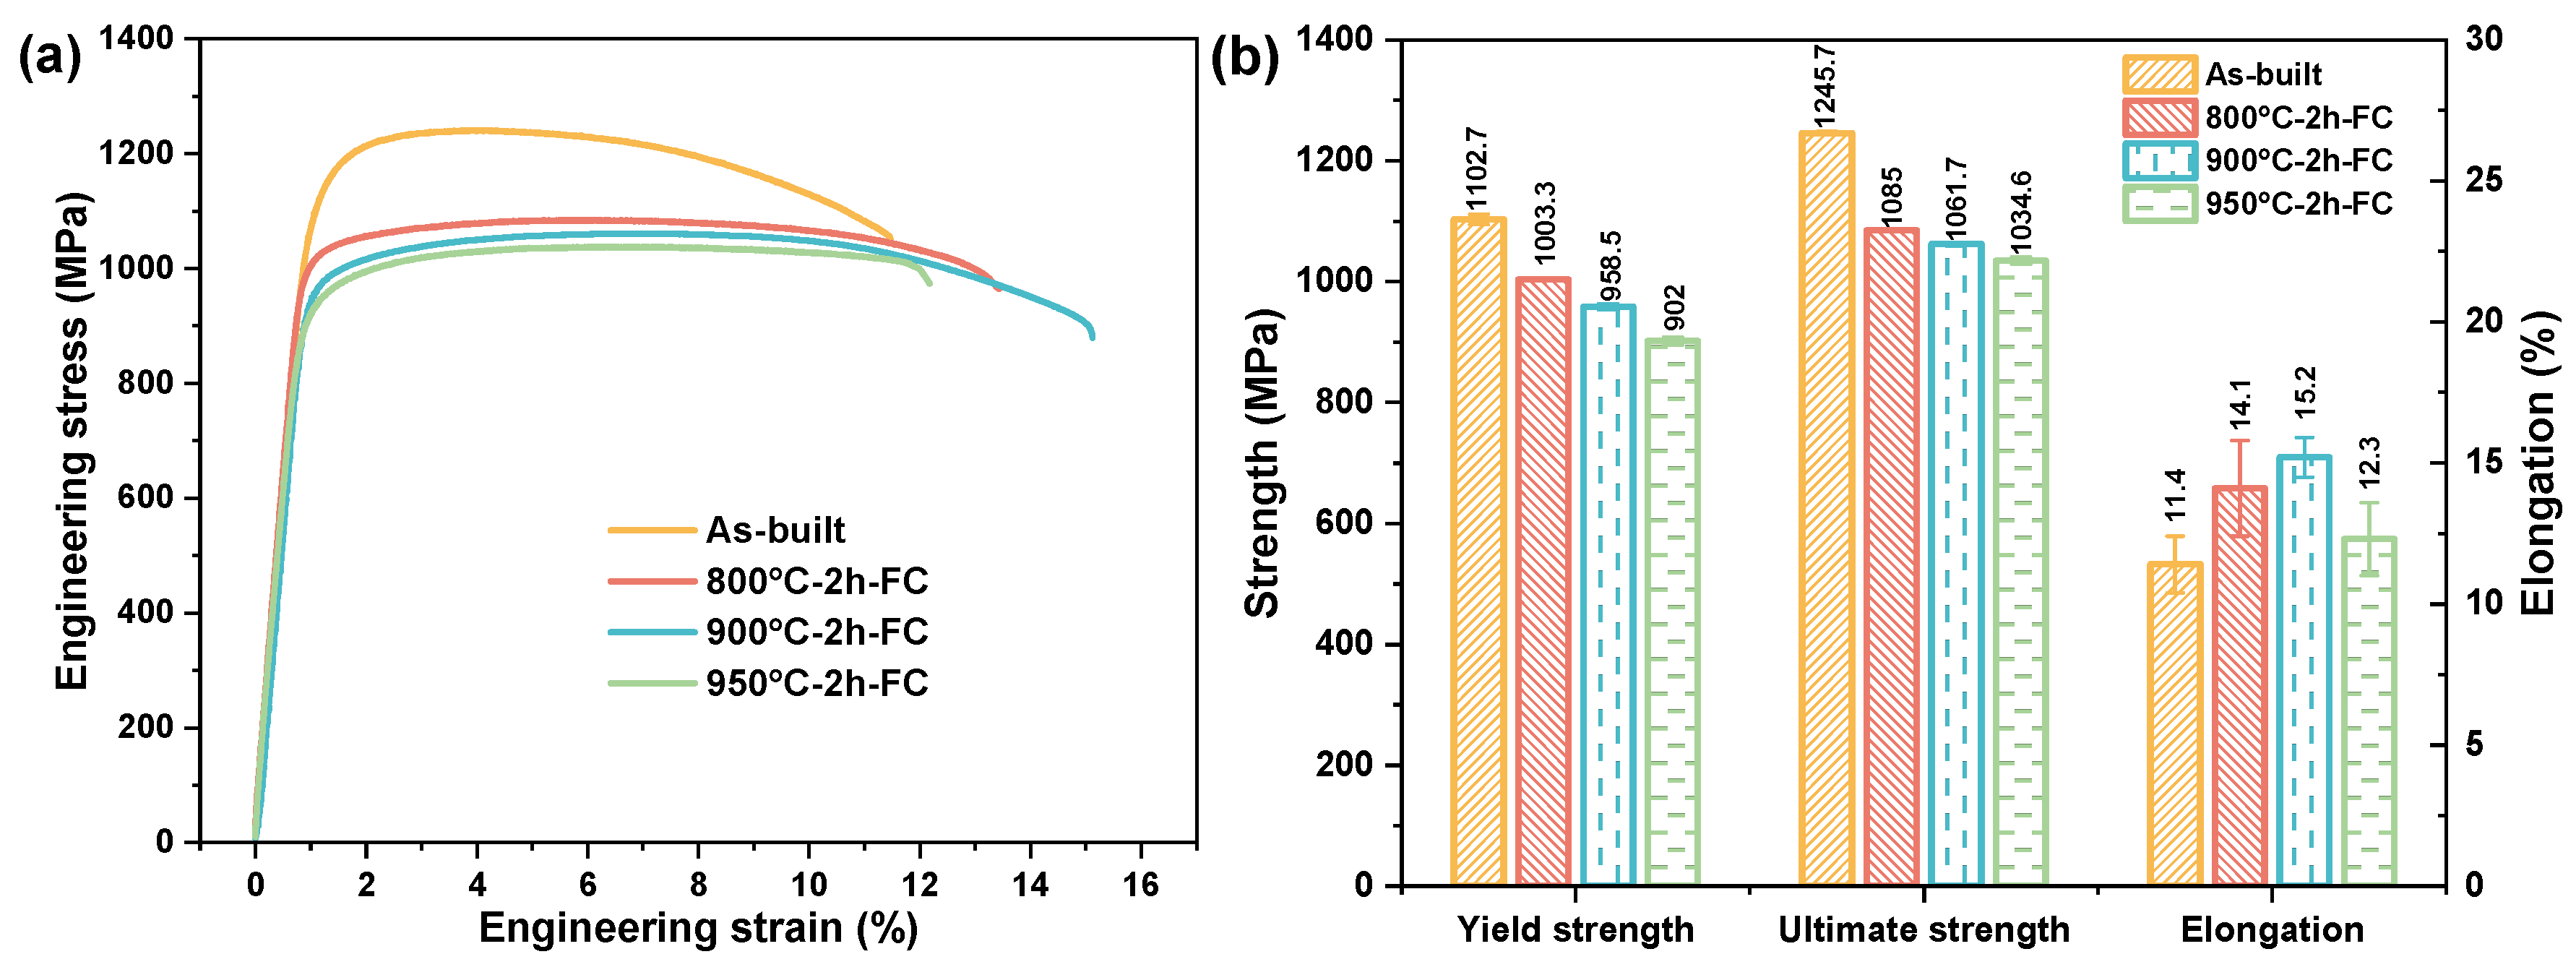
The room-temperature tensile properties of the as-built and single-step annealed specimens are shown in Figure 6. The as-built condition exhibited the highest mean strength, with a yield strength of 1102.7 ± 8.5 MPa and an ultimate tensile strength of 1245.7 ± 3.2 MPa, while the elongation was 11.4 ± 1.0%. The high mean strength accompanied the fine acicular lath morphology observed in the as-built condition. Residual stress, dislocation density, twins, and other substructural features may also have contributed 39.
Figure 6.
Room-temperature tensile properties of LPBF-fabricated TA15 alloy after single-step annealing: (a) engineering stress–strain curves; (b) yield strength, ultimate tensile strength, and elongation. Error bars represent one standard deviation from three independent specimens.
After annealing at 800 °C, the yield strength and ultimate tensile strength decreased to 1003.3 ± 0.6 and 1085.0 ± 1.0 MPa, respectively, while the elongation increased to 14.1 ± 1.7%. The tensile response accompanied the transition from the fine acicular as-built morphology to a relatively fine annealed lamellar morphology. The phase-transformation process responsible for this change was not identified directly. The reduction in strength may also involve residual-stress relaxation and recovery of the defect-rich as-built substructure.
After annealing at 900 °C, the mean yield strength and ultimate tensile strength decreased further to 958.5 ± 5.0 and 1061.7 ± 2.9 MPa, respectively, while the mean elongation increased to 15.2 ± 0.7%. Compared with A800, this condition exhibited larger lath and colony scales and a more developed lamellar morphology. The larger lath and colony scales accompanied the lower mean strength and higher mean elongation. Texture, residual stress, and dislocation recovery were not quantified.
The A950 condition exhibited the lowest mean strength among the annealed specimens, with a yield strength of 902.0 ± 6.7 MPa and an ultimate tensile strength of 1034.6 ± 5.7 MPa. Its elongation decreased to 12.3 ± 1.3%. Thus, the increase in annealing temperature did not produce a continuous increase in elongation. The coarser and locally heterogeneous lamellar morphology may have affected deformation compatibility, but this interpretation cannot be separated from other unmeasured microstructural and surface-related factors.
The mean yield and ultimate tensile strengths decreased progressively with increasing annealing temperature. In contrast, the mean elongation increased from the as-built condition to A900 and then decreased for A950. Because only three specimens were tested per condition, these differences are interpreted from the mean values and associated standard deviations rather than as statistically significant differences. Among the annealed conditions, A800 retained a higher mean strength than A900 and A950 while exhibiting a higher mean elongation than the as-built material.
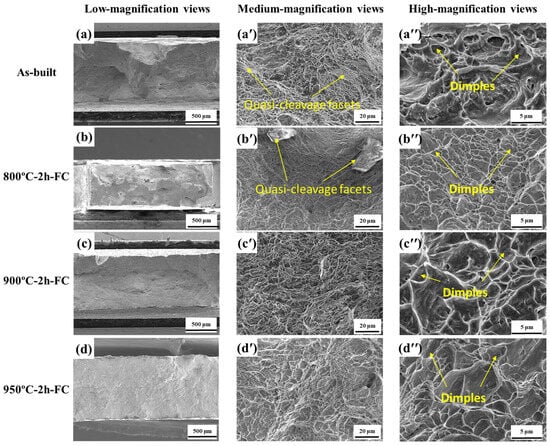
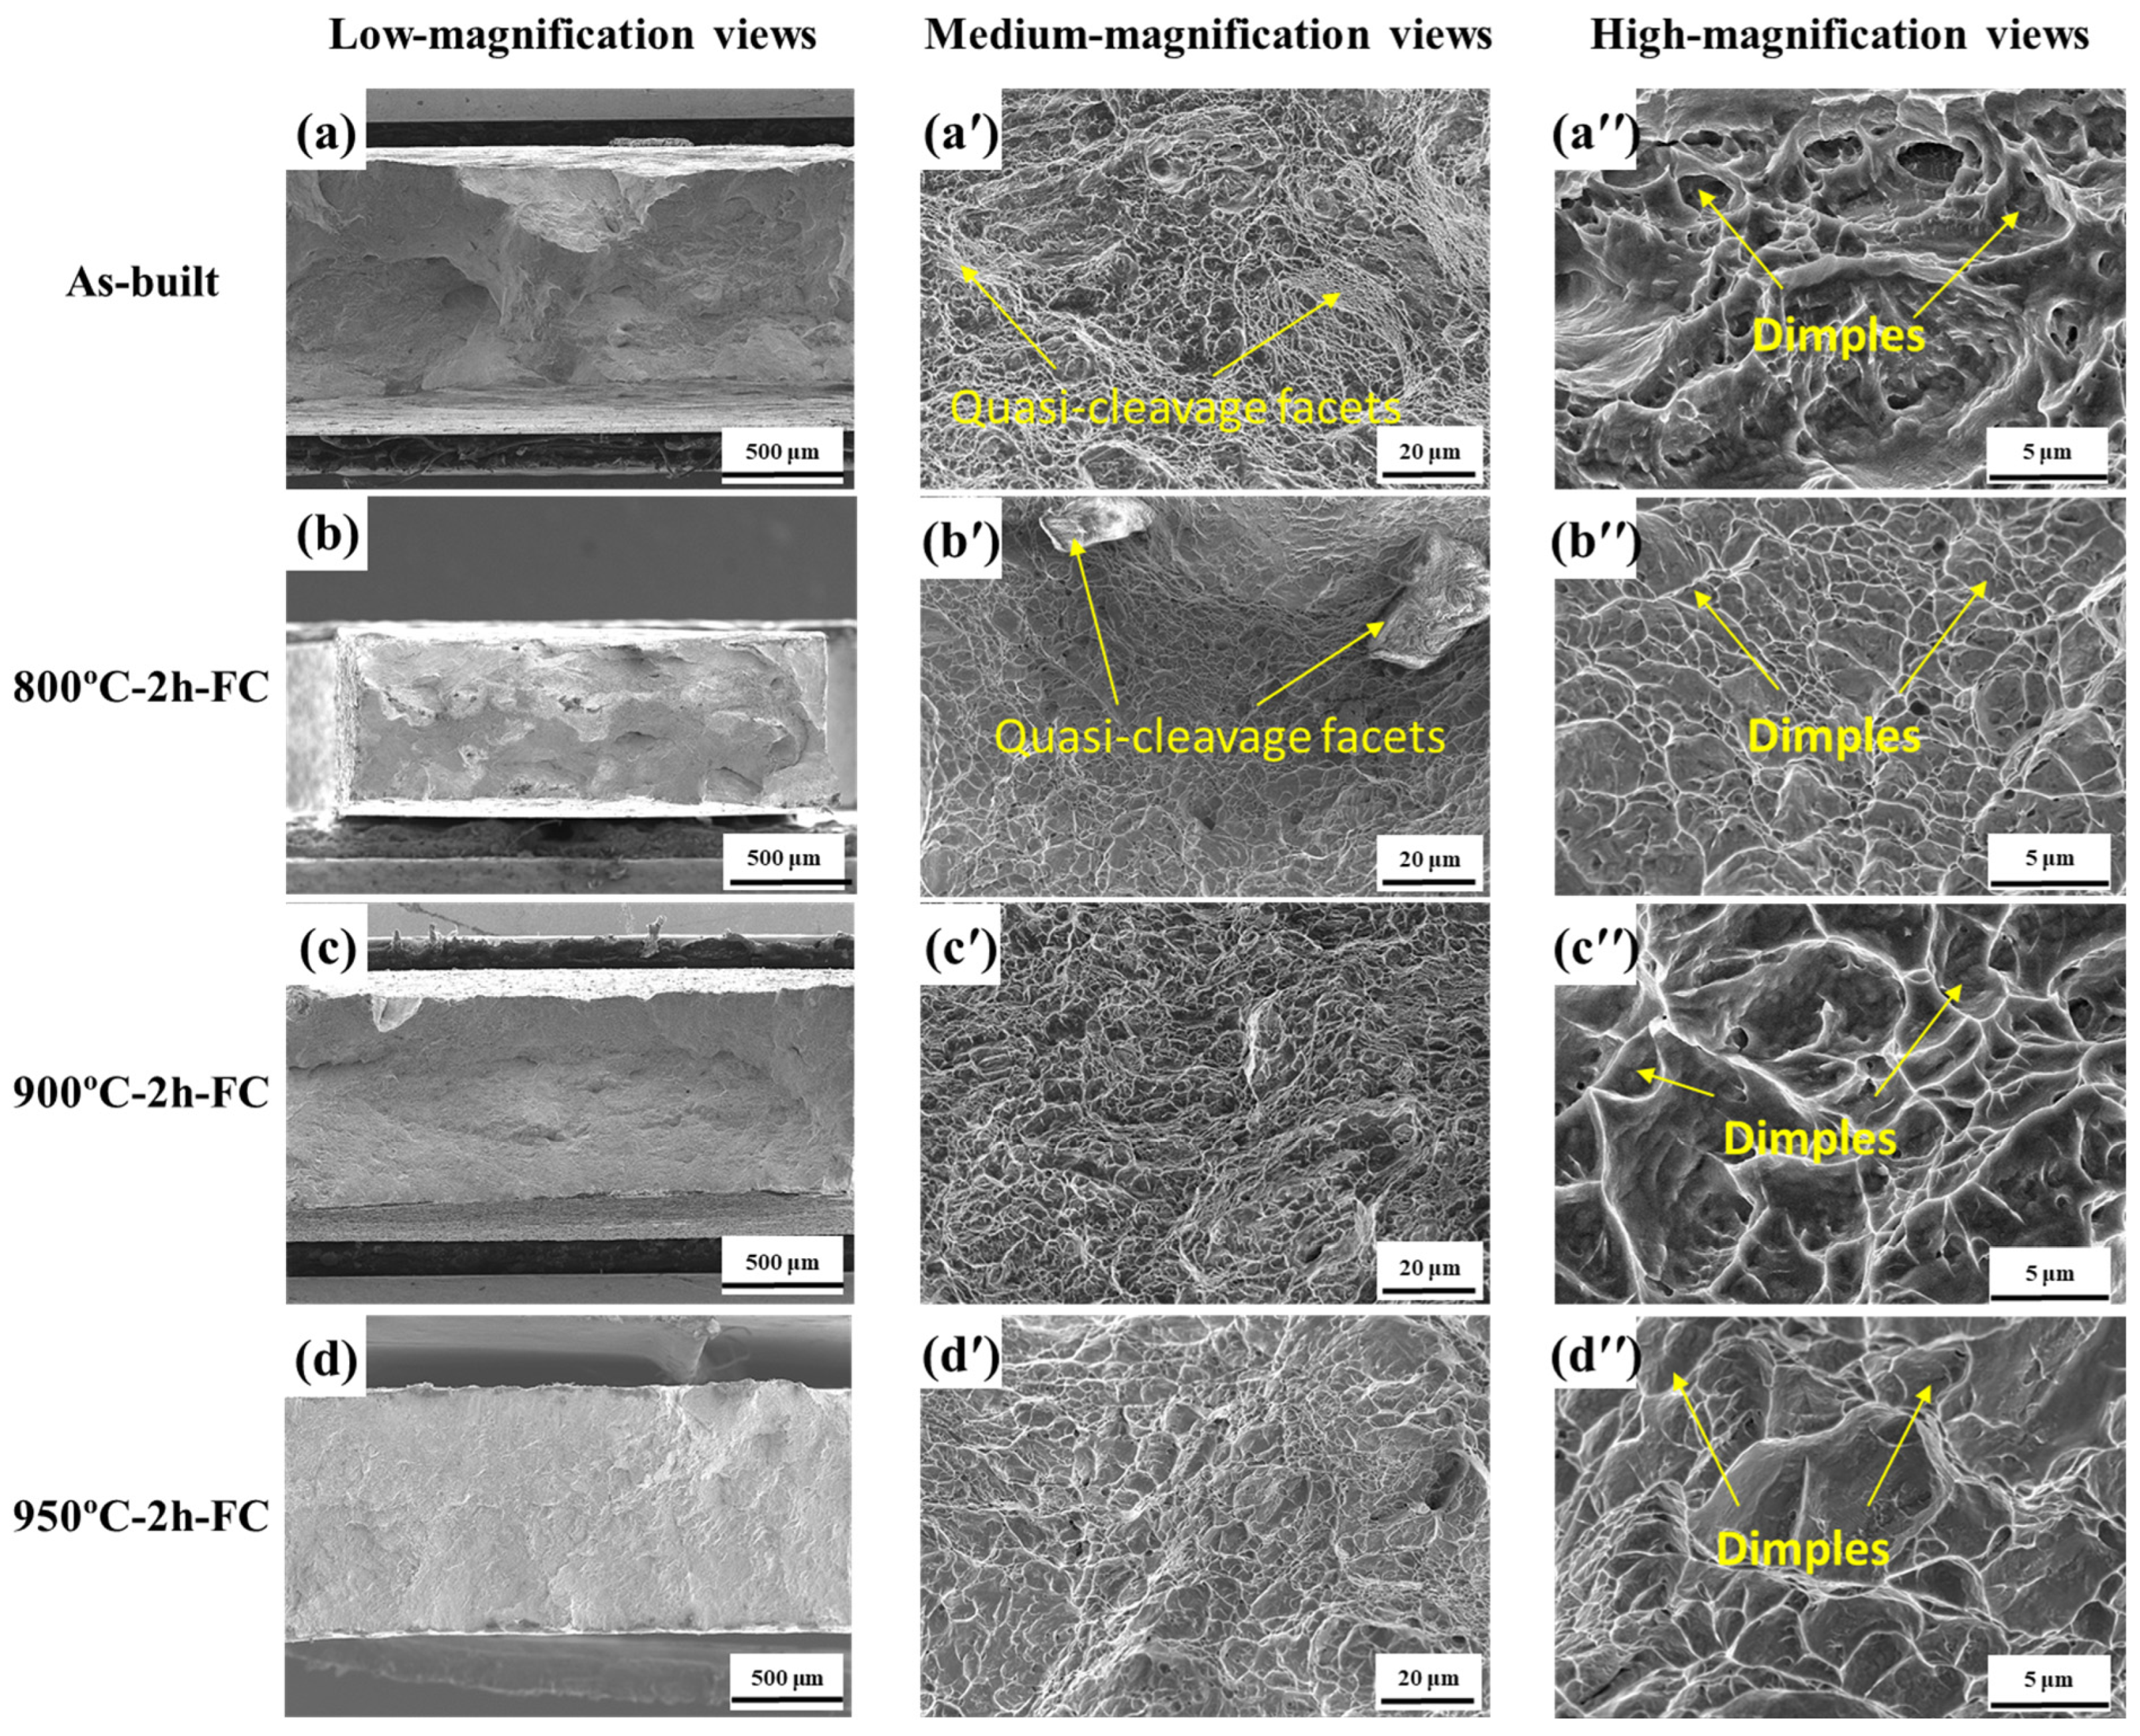
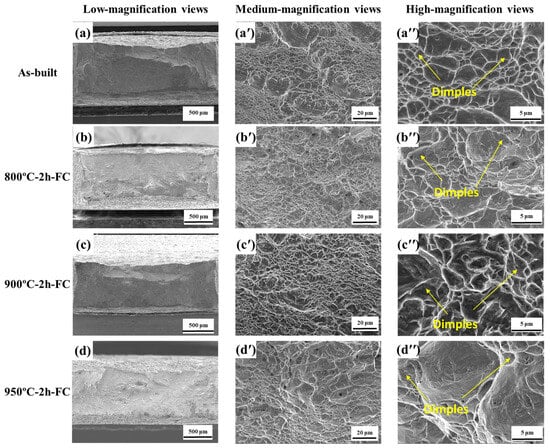
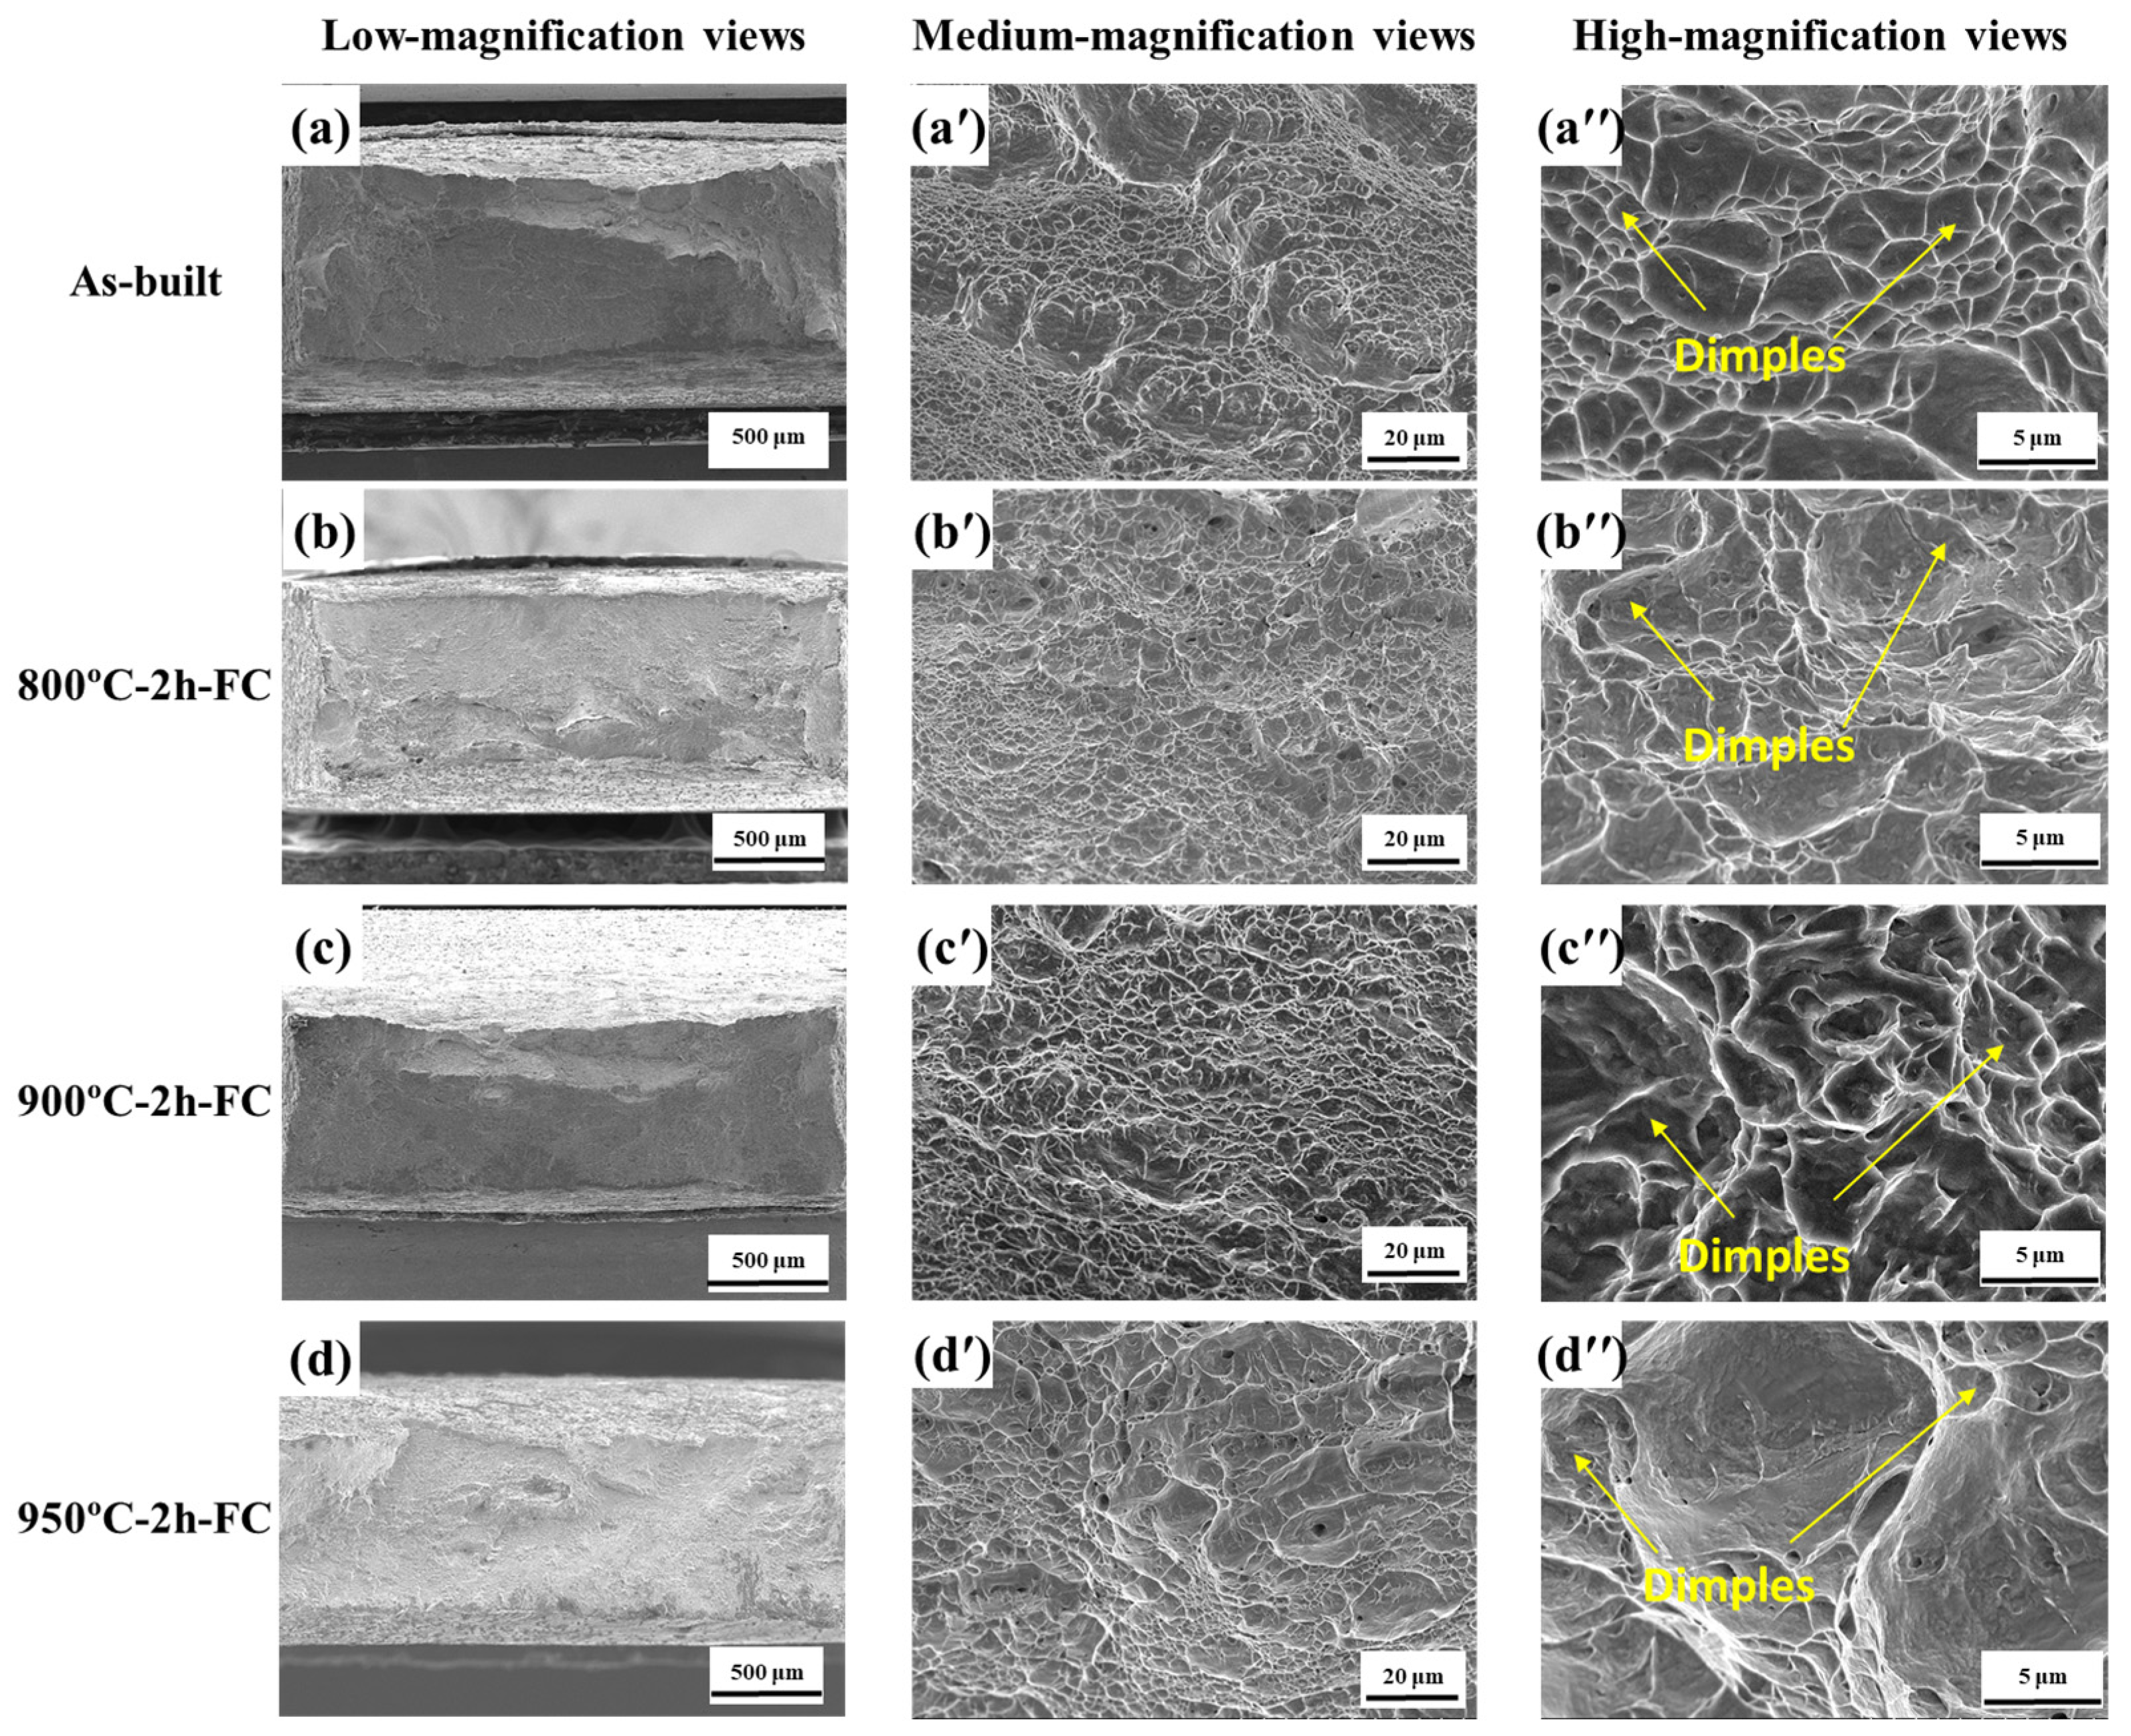
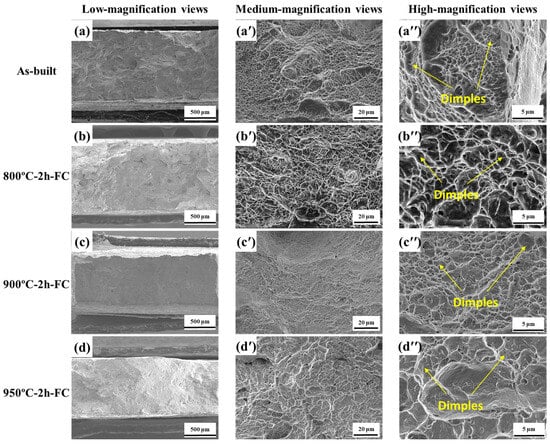
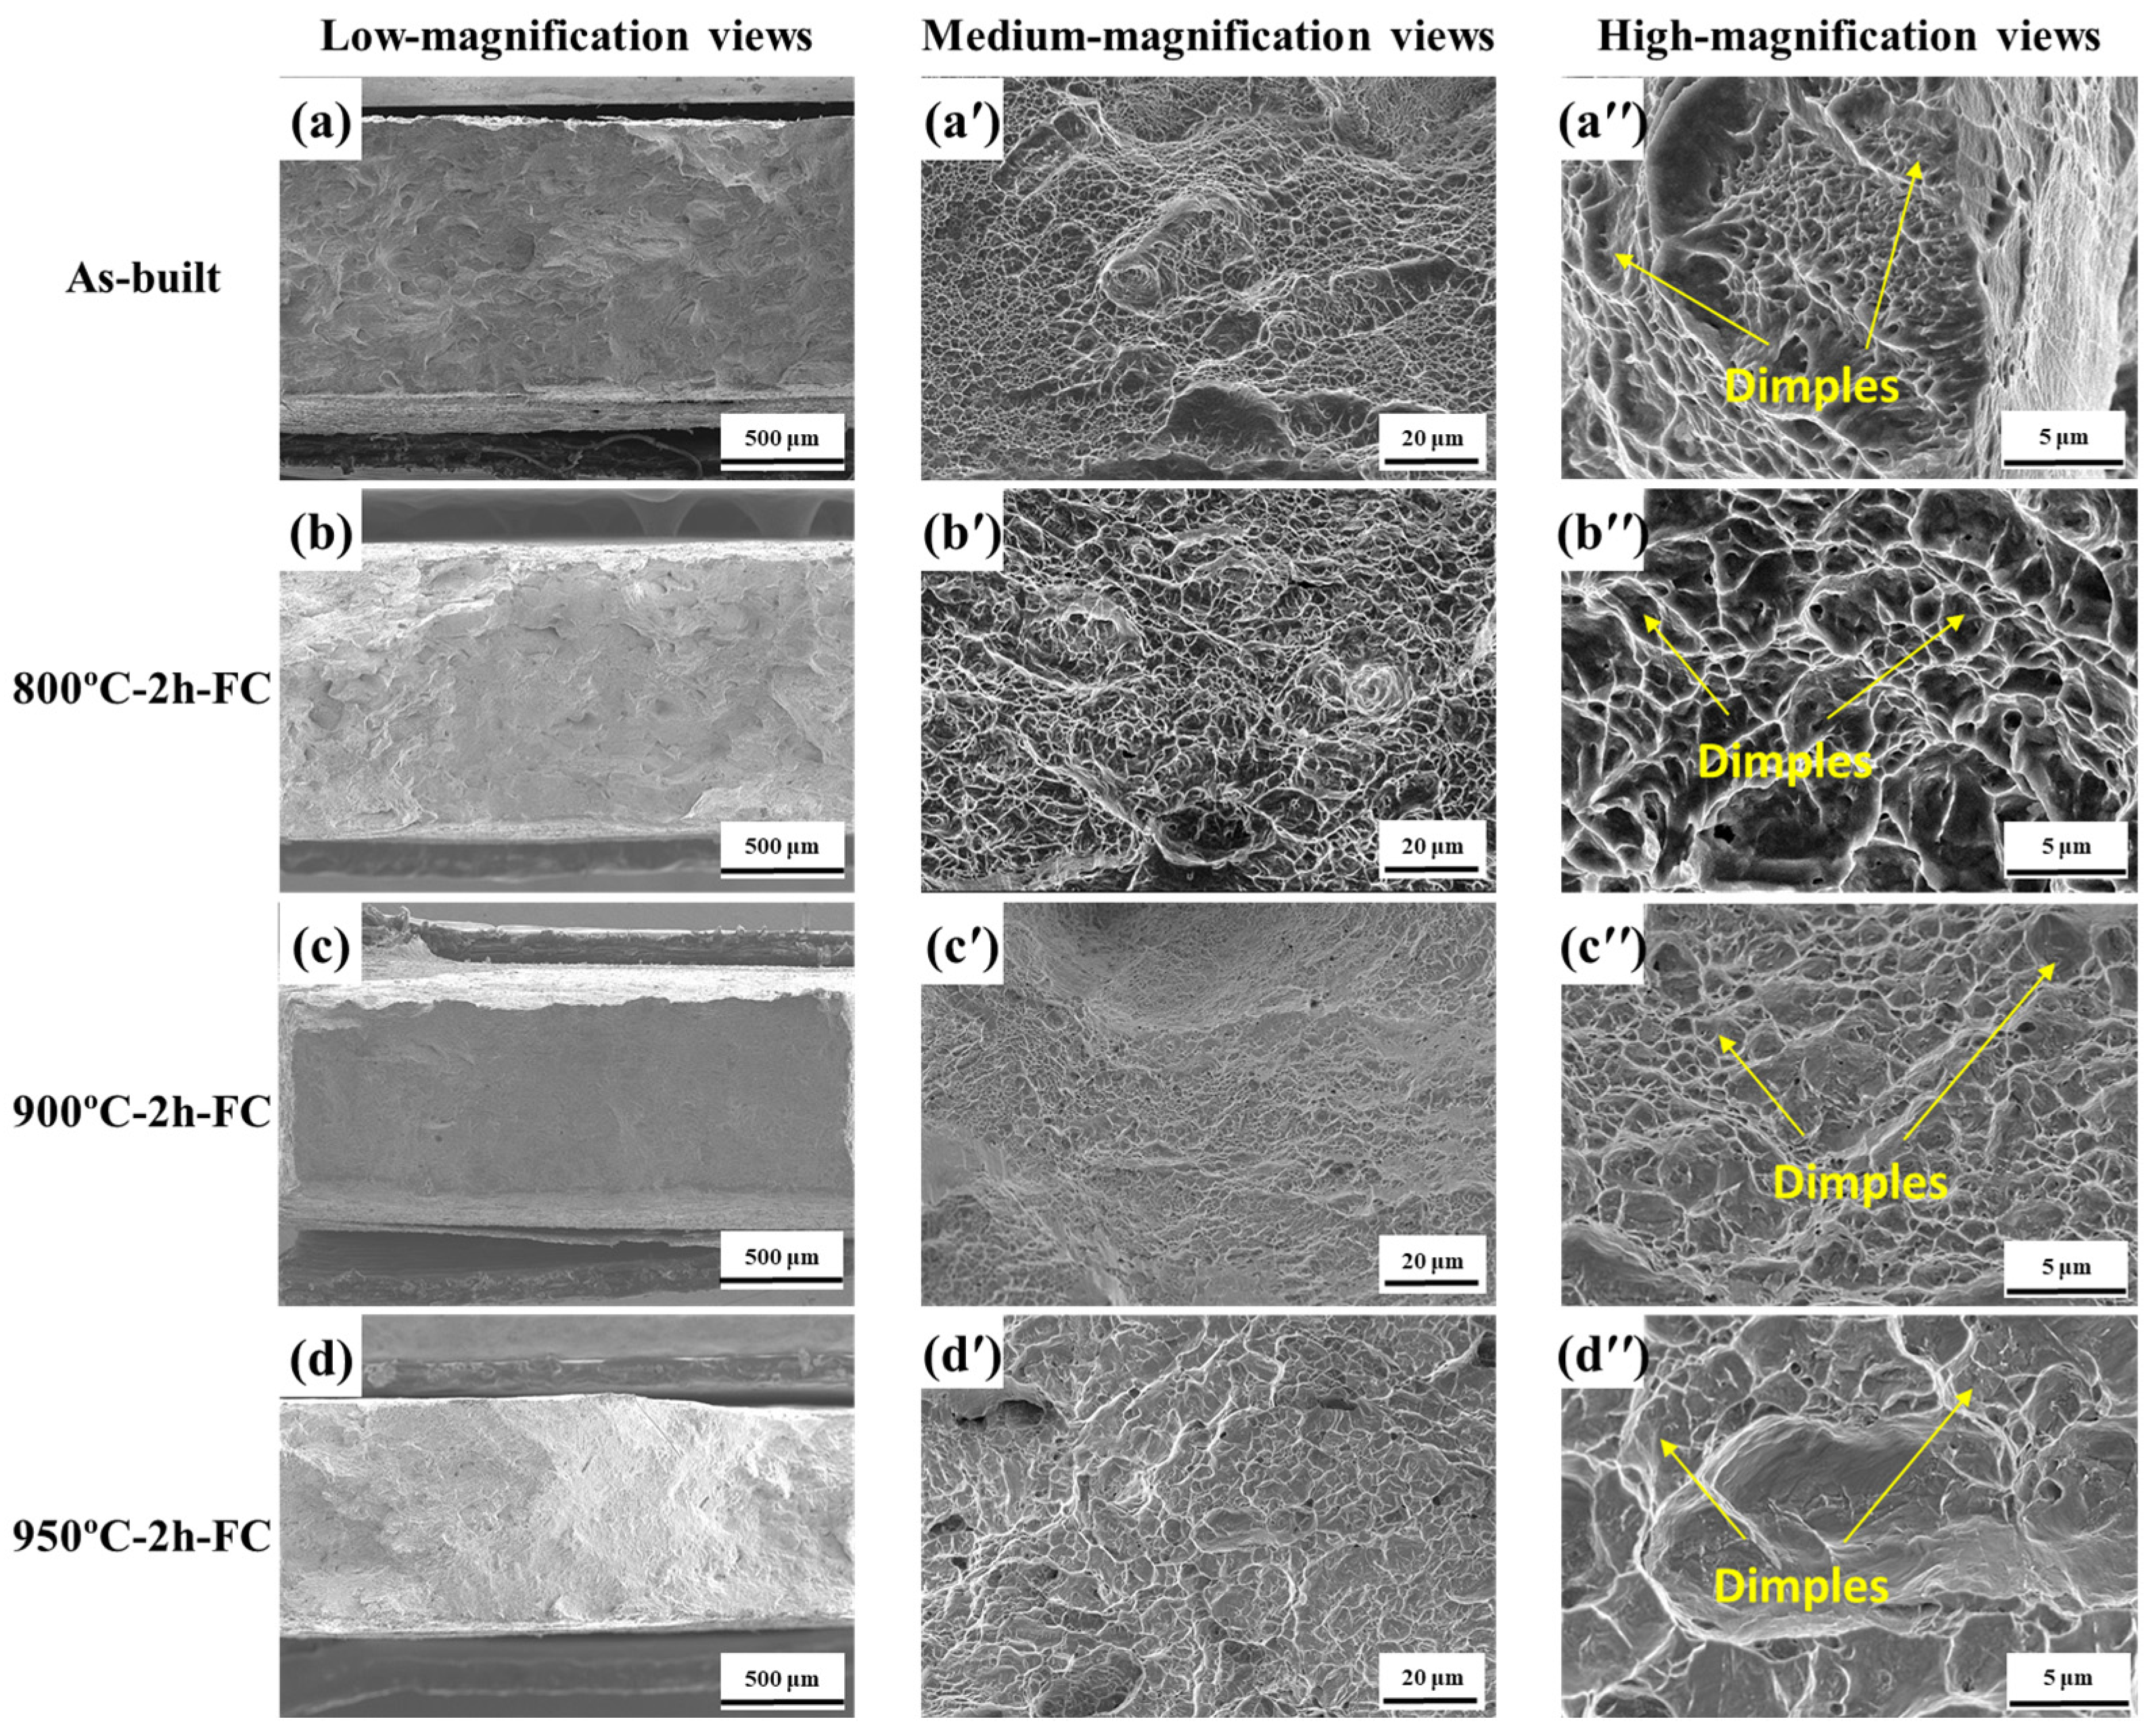
Fracture morphologies after room-temperature tensile testing are shown in Figure 7. All conditions exhibited predominantly dimpled fracture surfaces with tearing ridges. The as-built specimen showed relatively fine dimples and local tearing features. After annealing at 800 and 900 °C, the dimpled regions appeared more developed, consistent with their higher mean elongations. The A950 specimen contained coarser and less uniformly distributed dimples.
Figure 7.
Room-temperature fracture morphologies of LPBF-fabricated TA15 alloy after single-step annealing: (a–d) low-magnification views; (a′–d′) medium-magnification views; and (a″–d″) high-magnification views.
No obvious fracture initiation associated with wire-EDM surface defects was identified in the examined regions. However, the internal defect population, consolidated-part oxygen and nitrogen contents, EDM recast-layer thickness, surface roughness, and near-surface residual stress were not quantified. The observed fracture morphologies and ductility differences therefore cannot be attributed exclusively to the annealing-generated lamellar morphology.
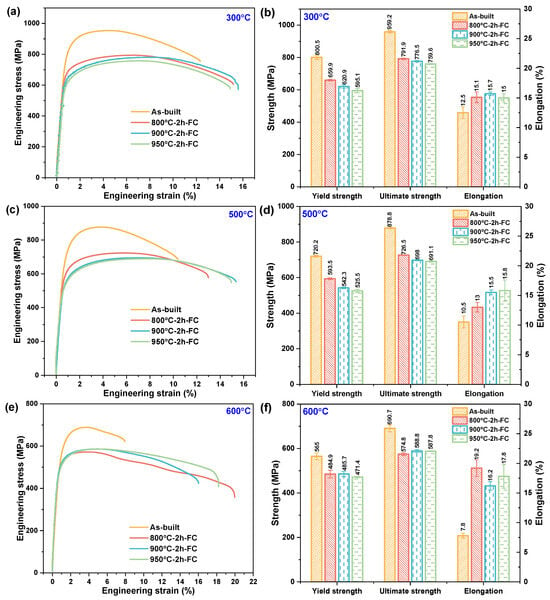
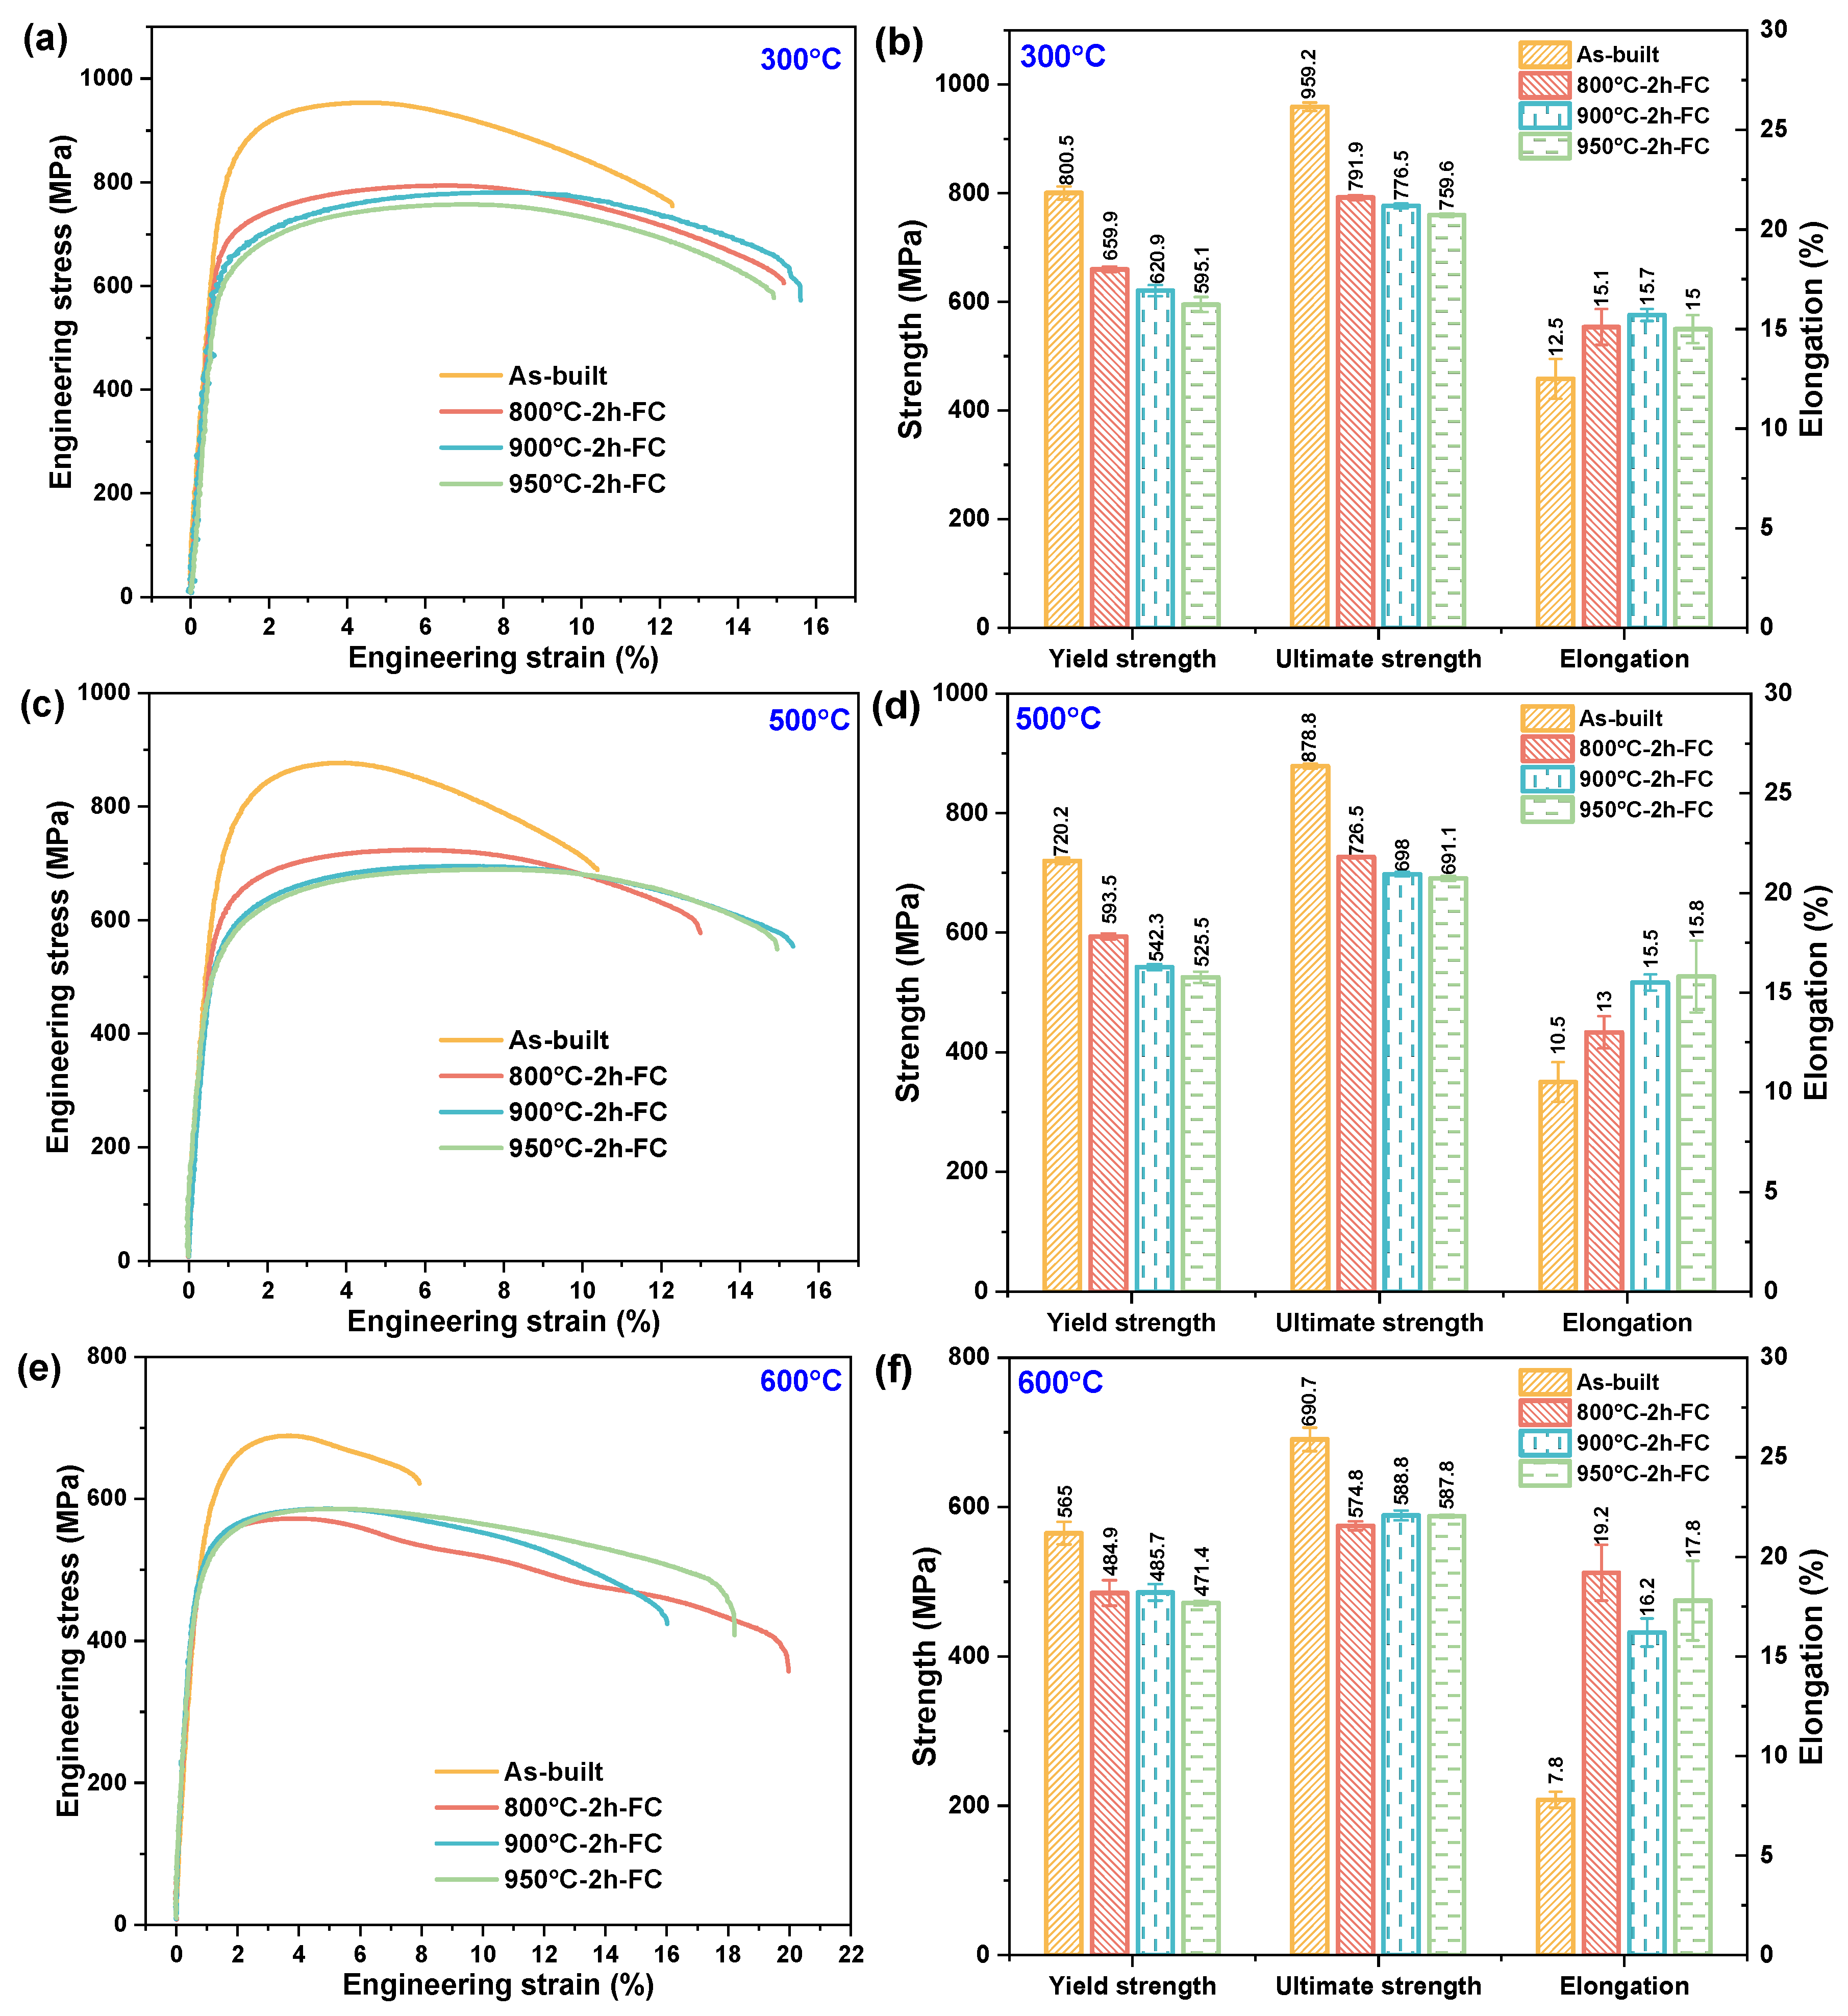
With increasing testing temperature, the mean strength decreased for all conditions, whereas the elongation showed condition-dependent trends, as shown in Figure 8. For the as-built material, the mean total elongation was 11.4 ± 1.0% at room temperature, 12.5 ± 1.0% at 300 °C, 10.5 ± 1.0% at 500 °C, and 7.8 ± 0.4% at 600 °C. The single-step annealed conditions exhibited higher mean elongation at 600 °C than at room temperature, but their changes were not strictly monotonic over the complete temperature range. The strength reduction at elevated temperature is consistent with thermally activated deformation and possible recovery reported for near-α titanium alloys [31,32,33,34,35], although these mechanisms were not measured directly in the present study.
Figure 8.
Elevated-temperature tensile properties of LPBF-fabricated TA15 alloy after single-step annealing: (a,b) 300 °C; (c,d) 500 °C; and (e,f) 600 °C. Error bars represent one standard deviation from three independent specimens.
The as-built material retained relatively high mean strength at 300 and 500 °C, while its elongation remained lower than those of several annealed conditions. The relatively high mean strength of the as-built condition accompanied its fine acicular lath morphology, although residual stress and other substructural features may also have contributed.
Among the single-step annealed conditions, A800 exhibited the highest mean strength at 300 and 500 °C. At 500 °C, its yield strength and ultimate tensile strength were 593.5 ± 5.1 and 726.5 ± 2.4 MPa, respectively. This condition also retained a finer lamellar scale than A900 and A950, although residual stress and substructural recovery were not quantified.
At 600 °C, the mean ultimate tensile strengths of A800, A900, and A950 were 574.8 ± 5.9, 588.8 ± 6.5, and 587.8 ± 2.1 MPa, respectively, while their mean yield strengths were 484.9 ± 17.1, 485.7 ± 11.1, and 471.4 ± 3.1 MPa. The differences among these mean values were small relative to the measured scatter and the limited sample size. They are therefore reported descriptively and are not used to establish a statistically supported strength ranking or a condition-specific deformation mechanism at 600 °C.
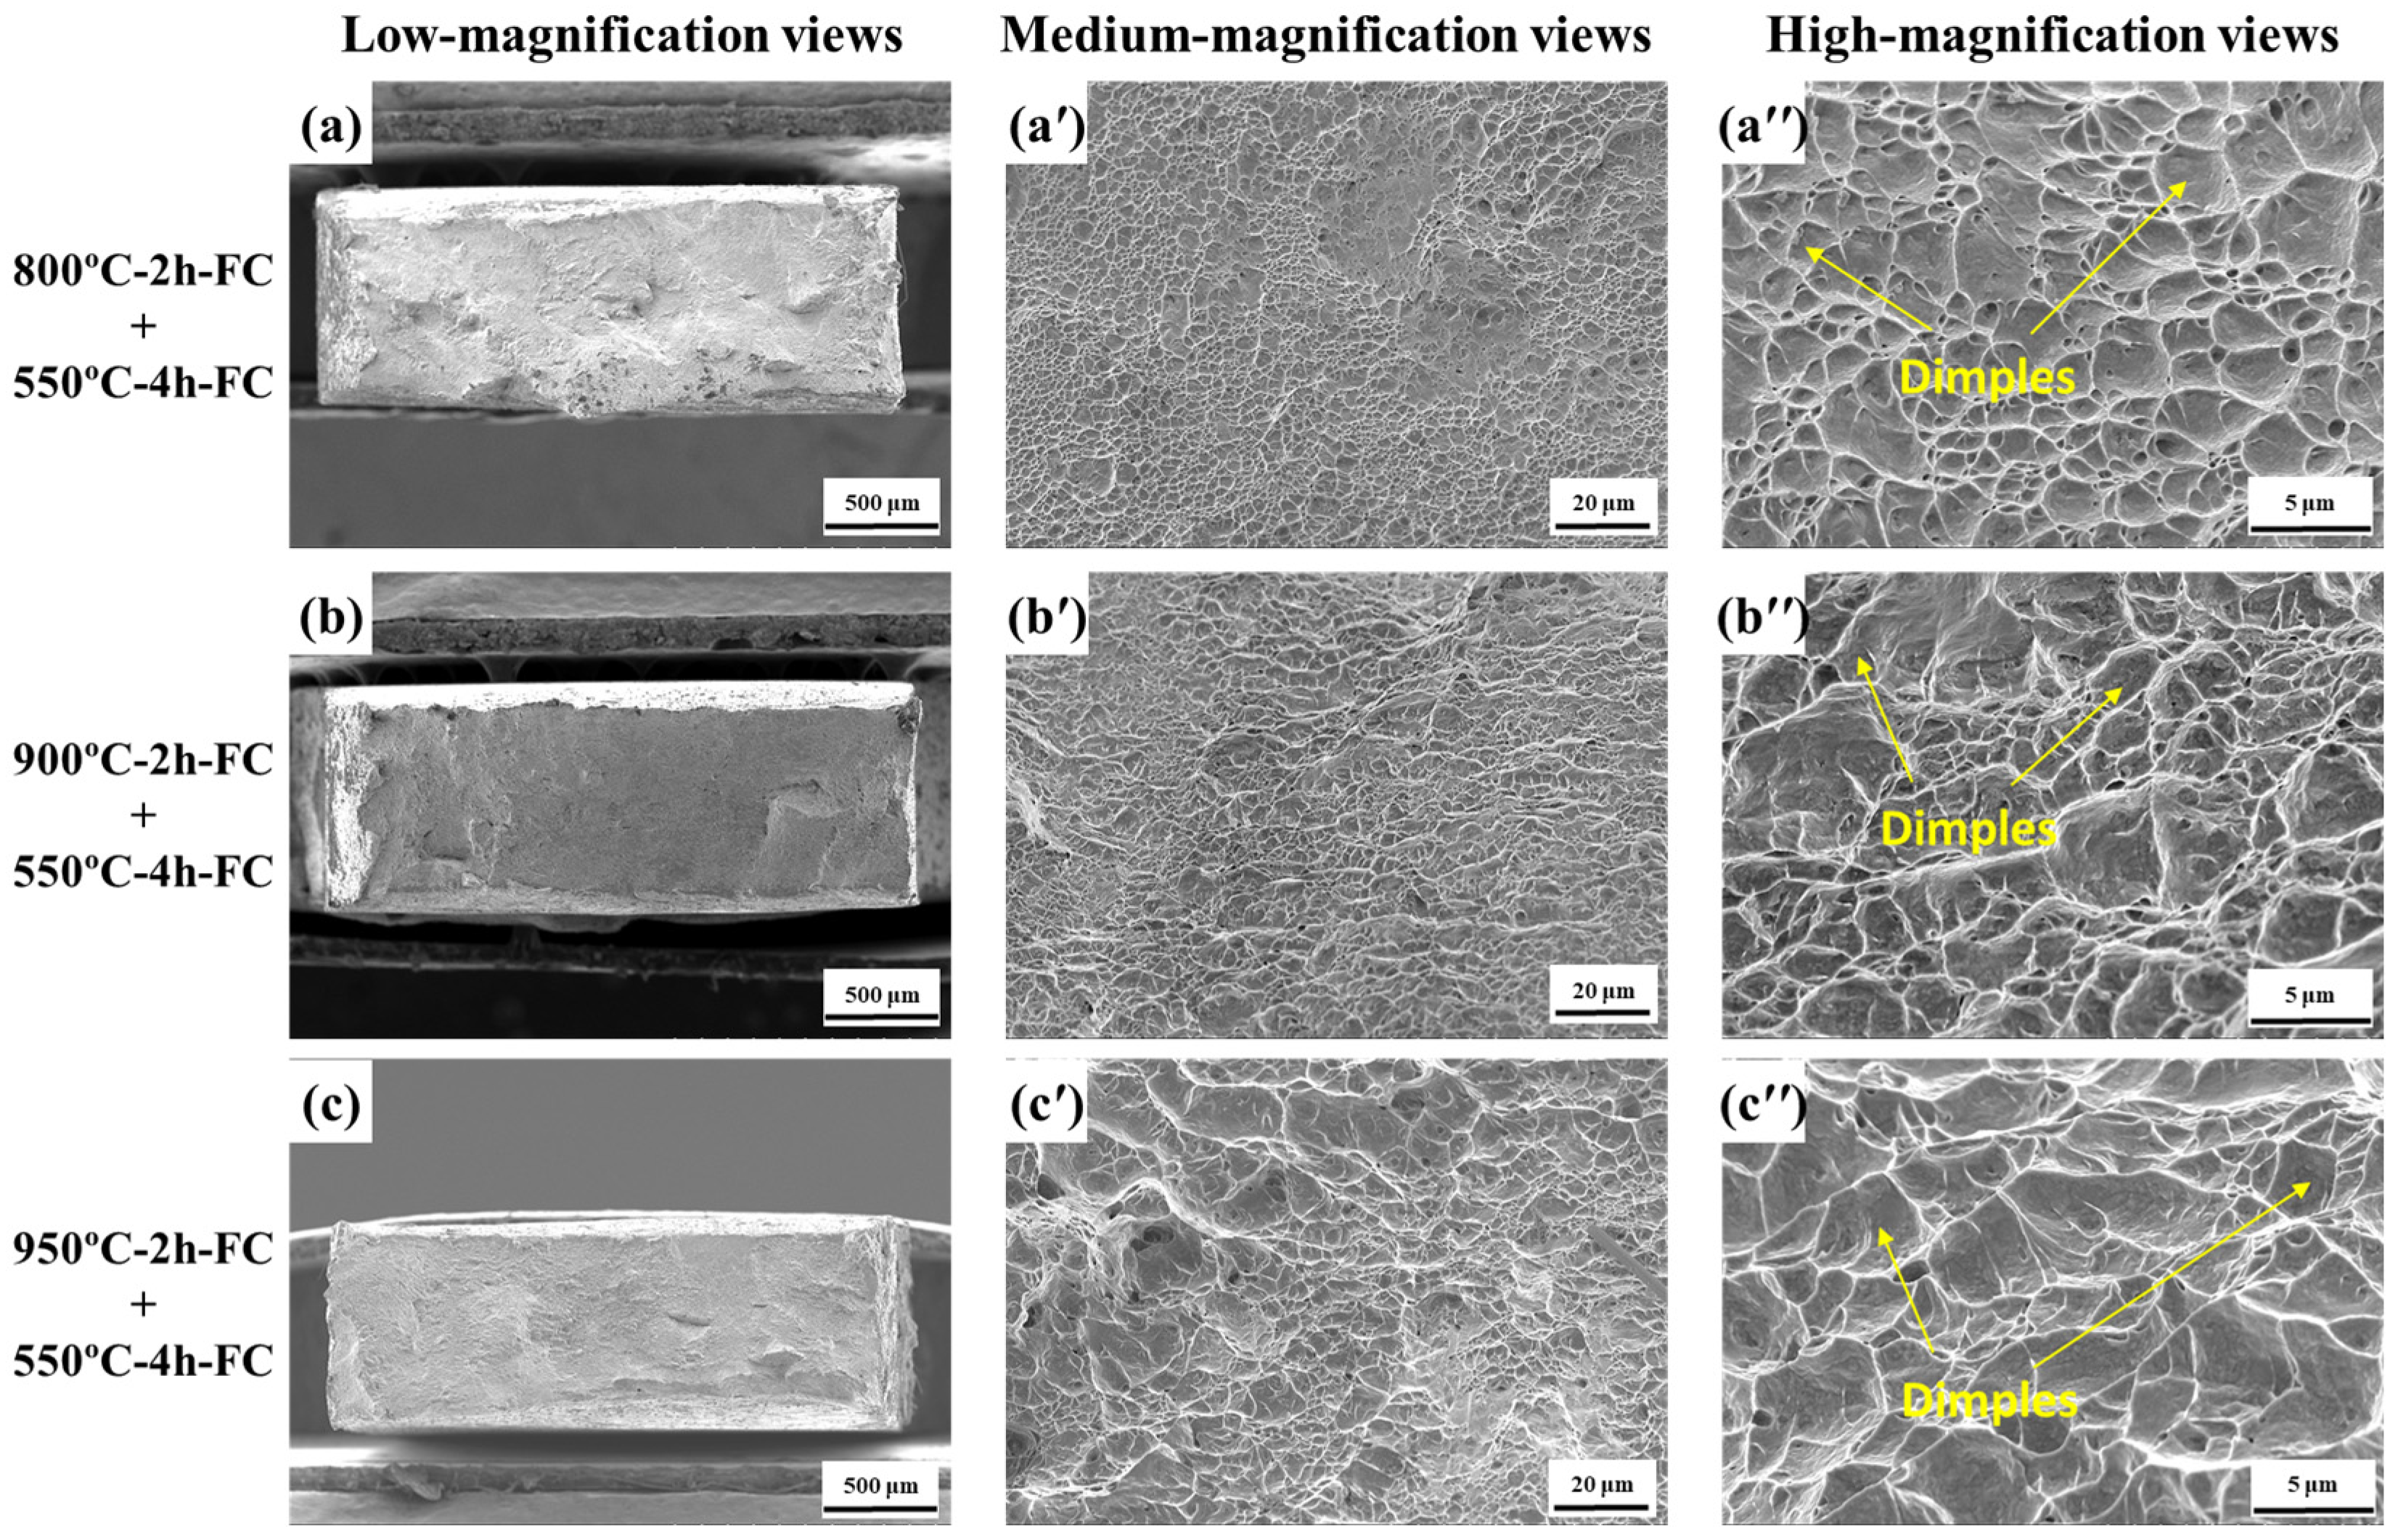
The elevated-temperature fracture surfaces are shown in Figure 9, Figure 10 and Figure 11. The elevated-temperature fracture surfaces were predominantly characterized by dimples and tearing ridges, although their size and distribution varied with testing temperature and heat-treatment condition. These observations are descriptive only. Because the internal defect population and post-processing interstitial contents were not measured, their possible contributions cannot be separated from those of the annealing-generated morphology. The fracture surfaces are therefore not used to determine the governing deformation mechanism or to rank the intrinsic fracture resistance of the different conditions.
Figure 9.
Fracture morphologies of LPBF-fabricated TA15 alloy tensile-tested at 300 °C after single-step annealing: (a–d) low-magnification views; (a′–d′) medium-magnification views; and (a″–d″) high-magnification views.
Figure 10.
Fracture morphologies of LPBF-fabricated TA15 alloy tensile-tested at 500 °C after single-step annealing: (a–d) low-magnification views; (a′–d′) medium-magnification views; and (a″–d″) high-magnification views.
Figure 11.
Fracture morphologies of LPBF-fabricated TA15 alloy tensile-tested at 600 °C after single-step annealing: (a–d) low-magnification views; (a′–d′) medium-magnification views; and (a″–d″) high-magnification views.
No obvious brittle-fracture features or systematic fracture initiation from the wire-EDM surfaces were identified in the examined regions. Nevertheless, machining-induced surface condition and other unmeasured factors cannot be fully excluded.
3.3. Microstructural Inheritance During Secondary Annealing
A common 550 °C treatment was applied to specimens previously annealed at 800, 900, and 950 °C. The analysis in this section is restricted to paired comparisons between each pre-annealed state and its corresponding sequentially annealed state. It therefore evaluates whether the relative differences in observable lath, colony, and orientation-domain characteristics remained after the common low-temperature exposure. It does not determine the response of the as-built material to a direct 550 °C treatment or the independent contribution of this thermal step.
The image-based measurements are compared quantitatively in Table 4. The values represent mean ± standard deviation based on at least 30 lath-width measurements and 15 colony-size measurements for each condition. After secondary annealing, the mean values differed by approximately 0.1 μm in apparent lath thickness and by 2–3 μm in colony size for each paired condition. These differences were small relative to the differences among the three pre-annealed states and to the scatter of the image-based measurements. Microstructural inheritance is therefore used here to describe the persistence of the relative differences established during initial annealing, rather than an unchanged microstructure.
Table 4.
Image-based comparison of the microstructural scales before and after secondary annealing.
Values are reported as mean ± standard deviation from image-based measurements obtained from calibrated micrographs. At least 30 lath-width measurements and 15 colony-size measurements were obtained for each condition. These values are semi-quantitative two-dimensional estimates rather than specimen-level stereological statistics.
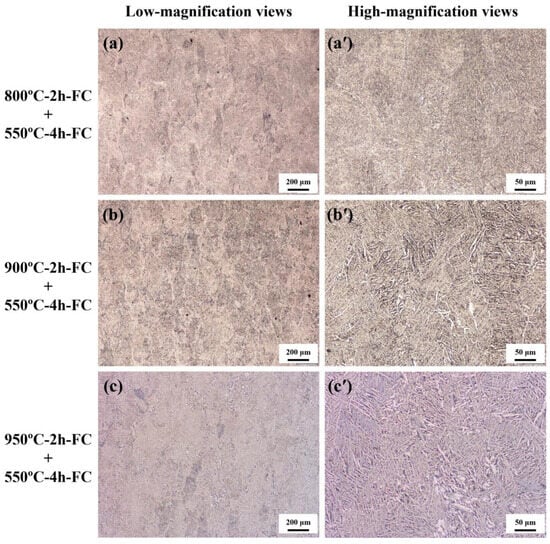
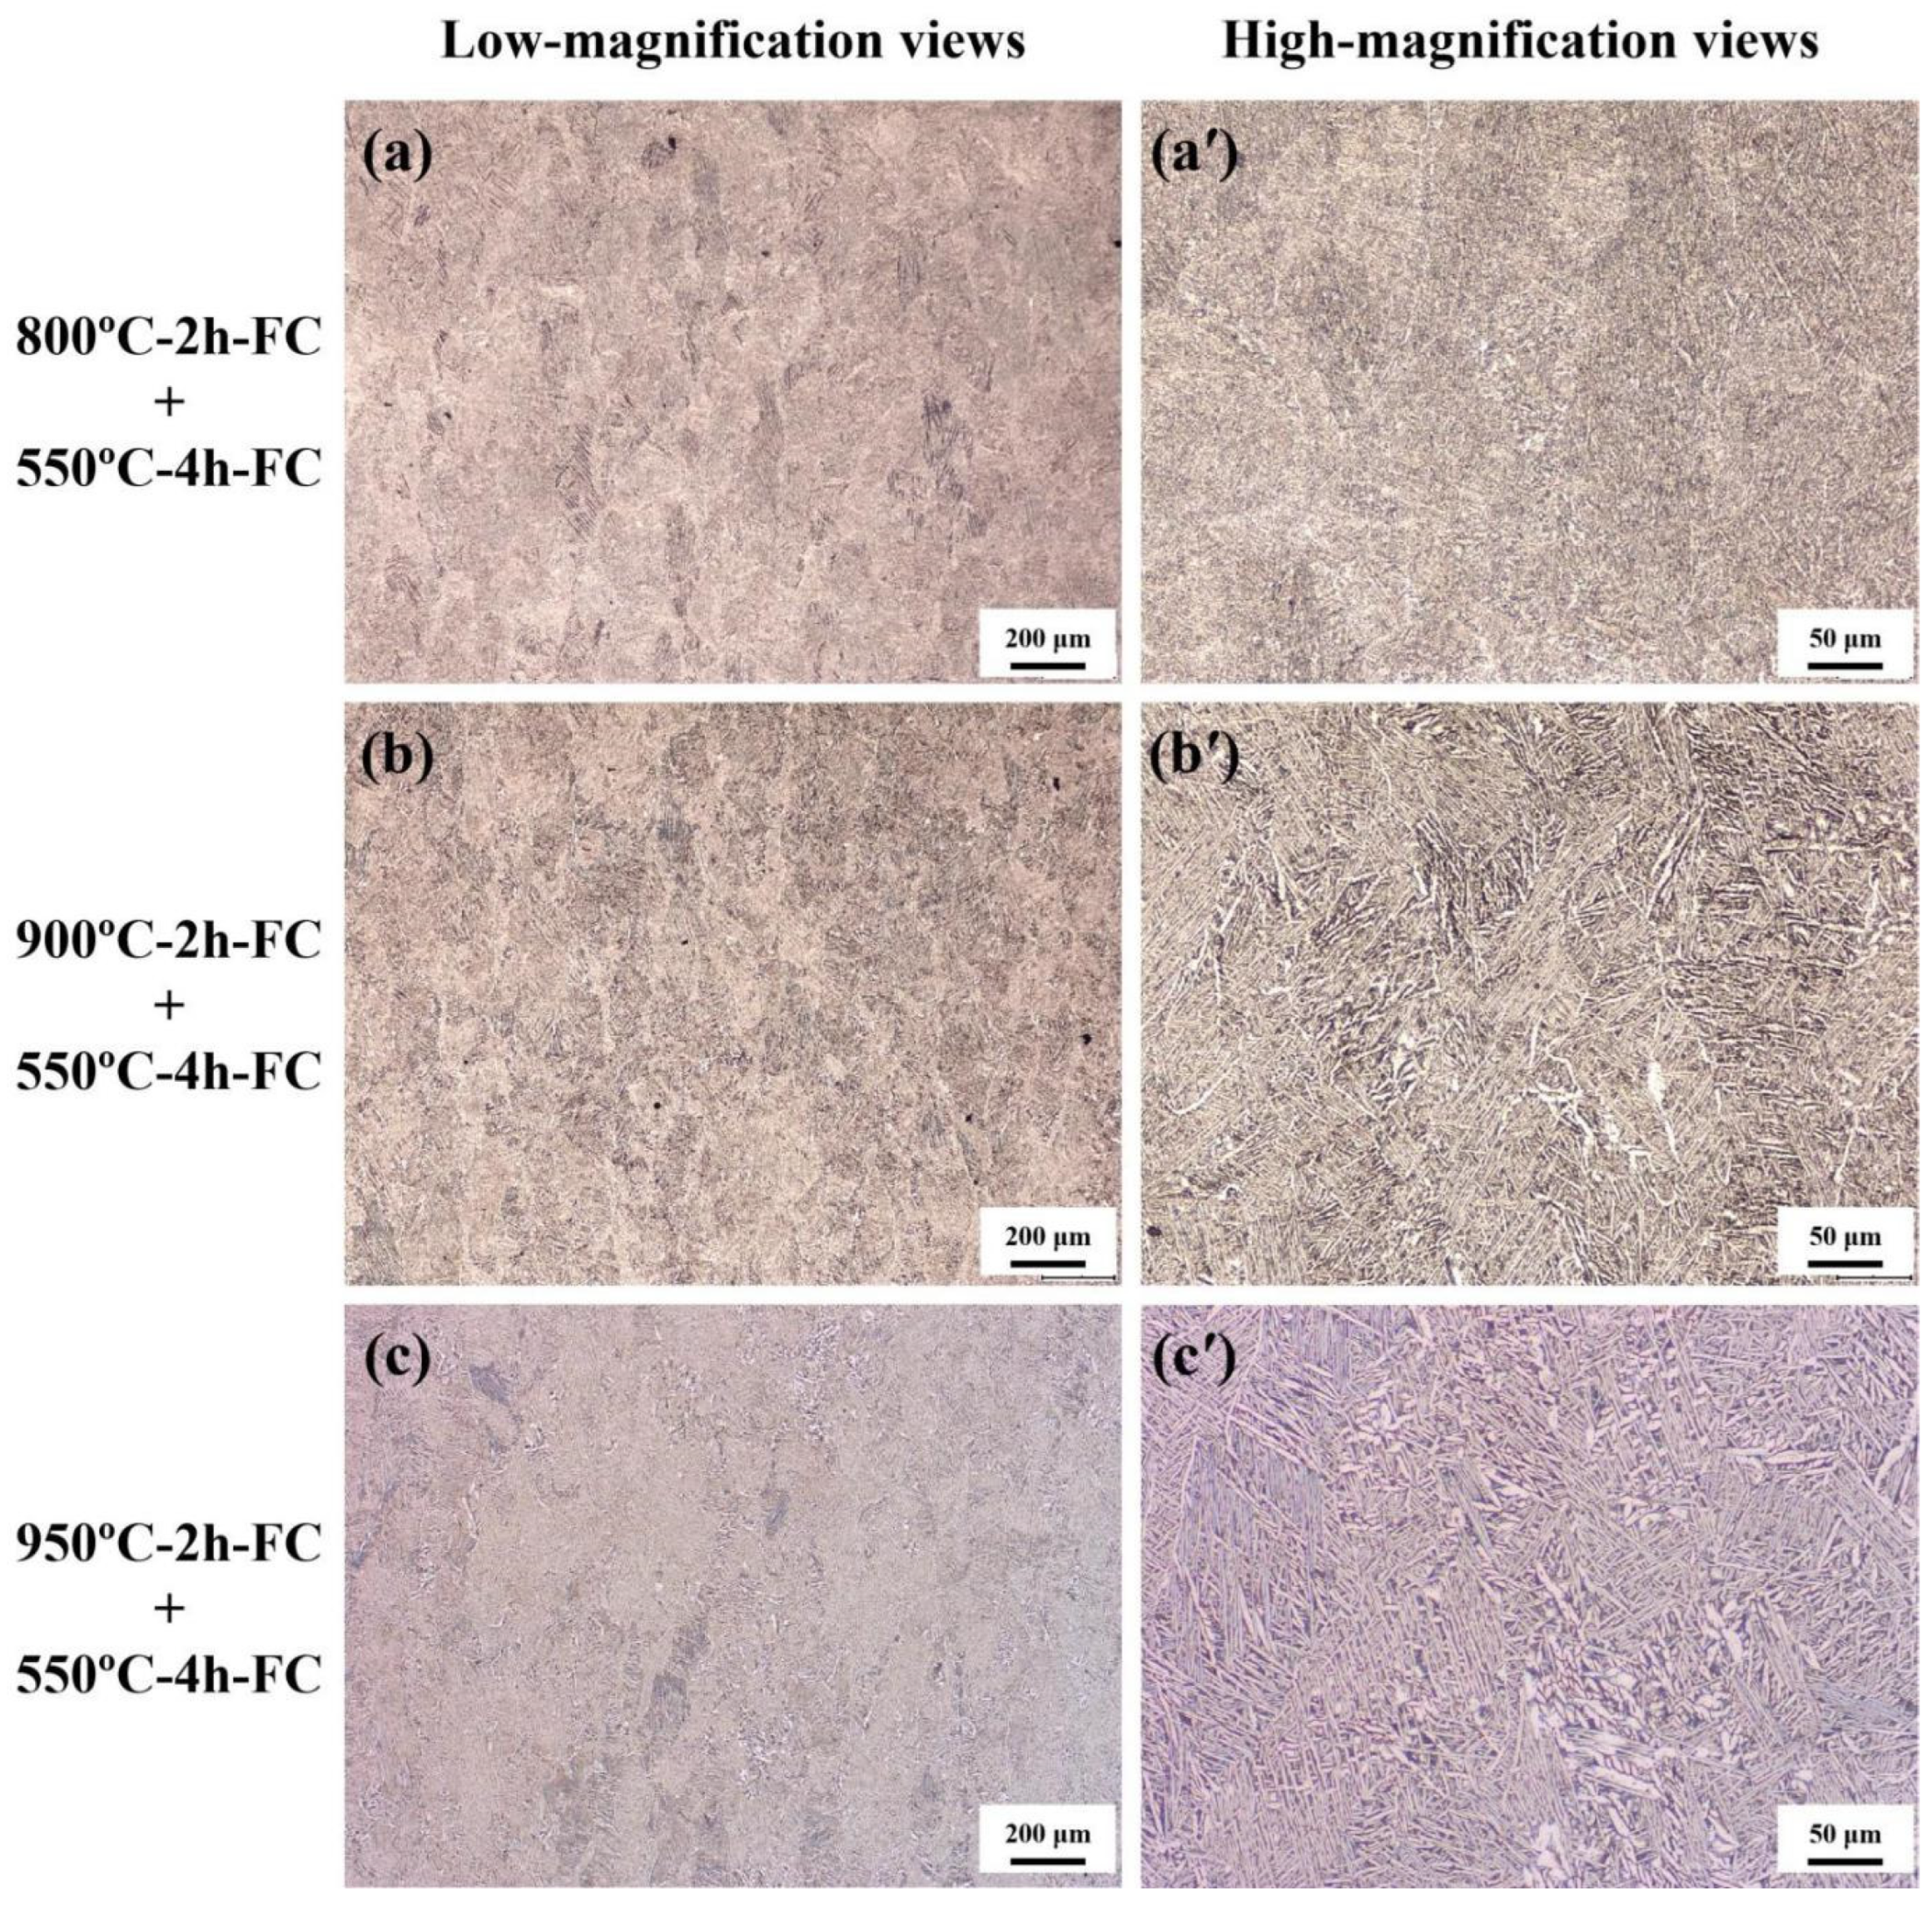
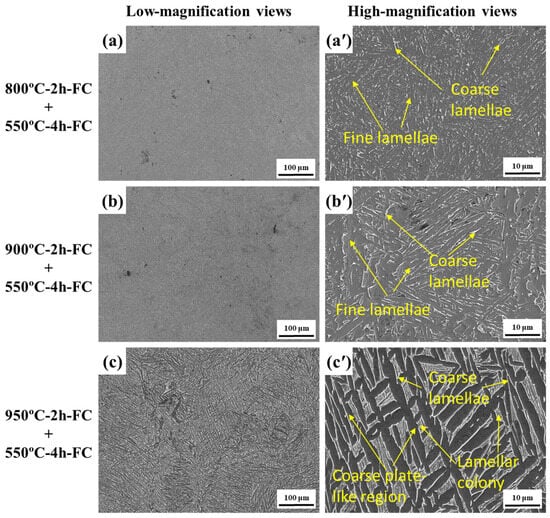
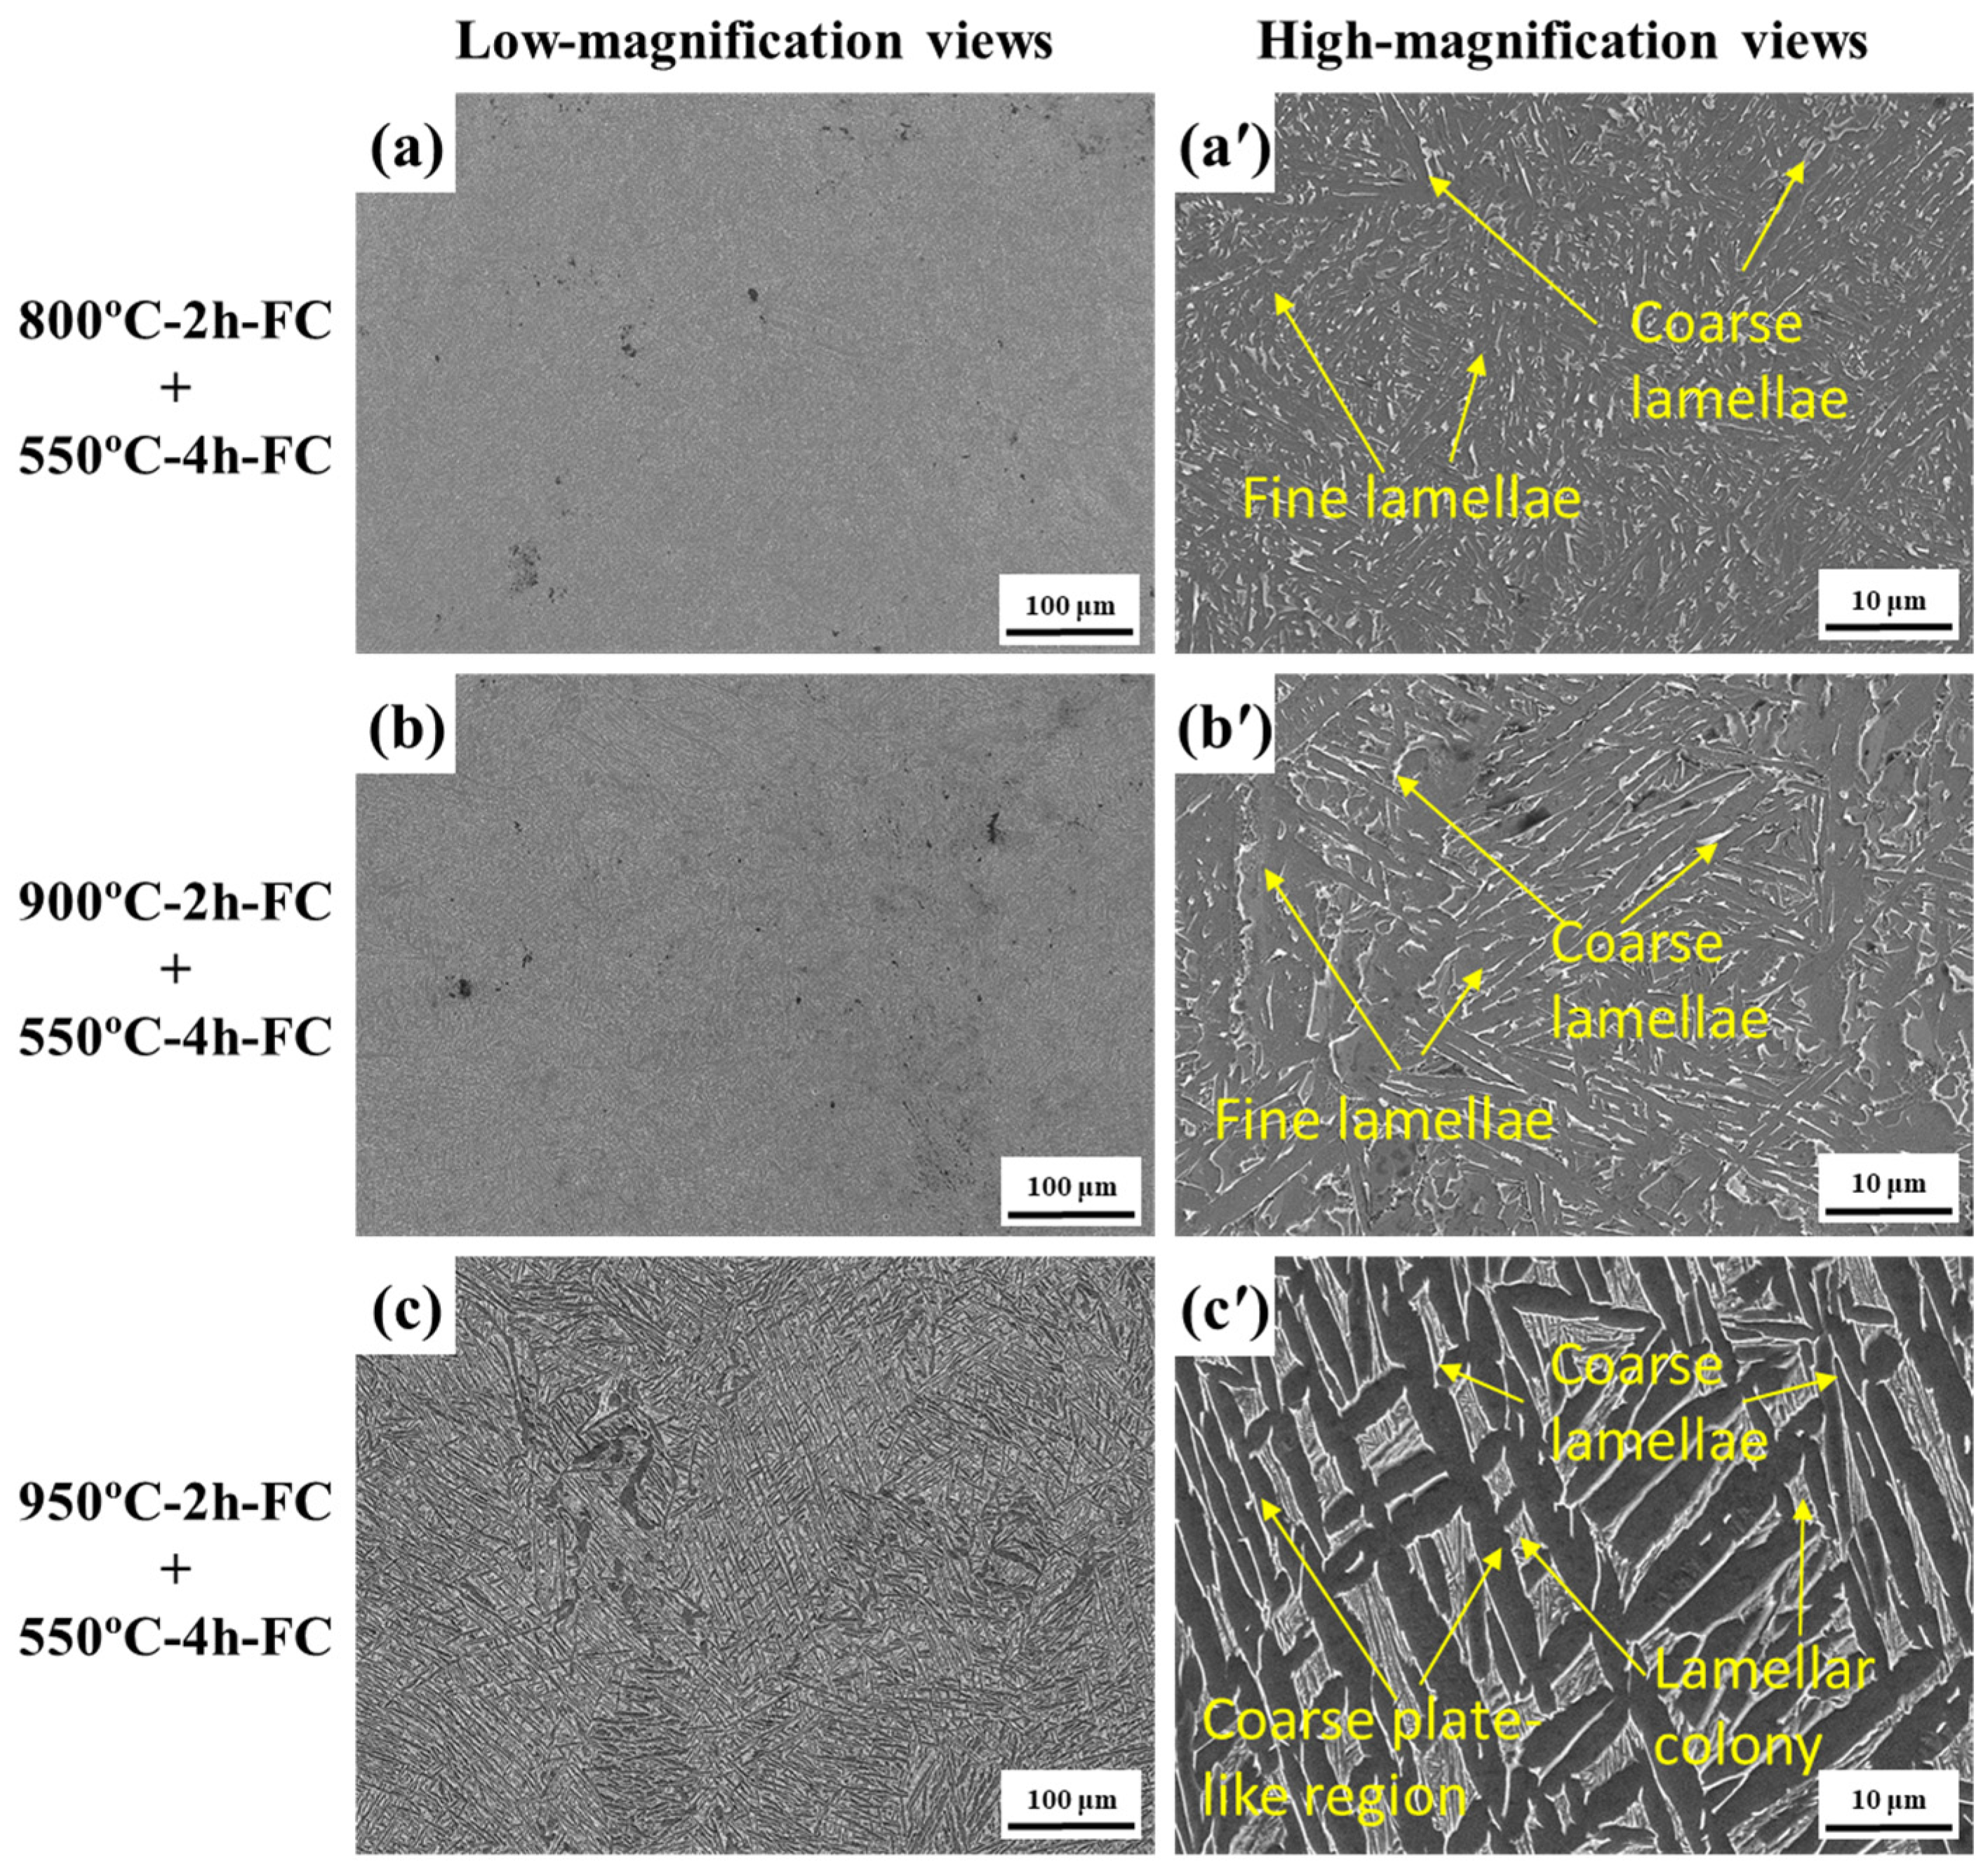
The optical and SEM images in Figure 12 and Figure 13 show that A800-S550 retained the relatively fine lamellar morphology established during the initial 800 °C treatment. Its apparent lath thickness and colony size were 1.0 ± 0.3 μm and 27 ± 10 μm, respectively, close to the corresponding A800 values of 0.9 ± 0.3 μm and 25 ± 9 μm.
Figure 12.
Optical microstructures of LPBF-fabricated TA15 alloy after secondary annealing: (a,a′) A800-S550; (b,b′) A900-S550; and (c,c′) A950-S550. Images (a–c) show low-magnification views, and images (a′–c′) show corresponding high-magnification views.
Figure 13.
SEM microstructures of LPBF-fabricated TA15 alloy after secondary annealing: (a,a′) A800-S550; (b,b′) A900-S550; and (c,c′) A950-S550. Images (a–c) show low-magnification views, and images (a′–c′) show corresponding high-magnification views.
A900-S550 retained the larger lamellar-colony structure formed during the initial 900 °C treatment. Its apparent lath thickness and colony size were 1.7 ± 0.6 μm and 48 ± 17 μm, respectively, compared with 1.6 ± 0.5 μm and 45 ± 16 μm for A900. The 550 °C treatment therefore did not generate a new fine-lamellar morphology at the scale resolved by SEM.
A950-S550 remained characterized by coarse plate-like regions and widened lamellae. Its apparent lath thickness and colony size were 2.9 ± 1.0 μm and 78 ± 27 μm, respectively, close to the A950 values of 2.8 ± 1.0 μm and 75 ± 25 μm. No clear change in the observable lath or colony scale was detected beyond the scatter of the image-based measurements. The secondary treatment therefore did not restore the fine lamellar morphology after the initial 950 °C annealing.
Possible nanoscale ordering or precipitation, solute redistribution, and dislocation-substructure evolution could not be resolved by the present SEM and EBSD analyses. Because a second bcc phase was not indexed consistently, the occurrence of secondary α precipitation could not be evaluated. The present comparison is therefore limited to the observable lath and colony scales and EBSD orientation characteristics.
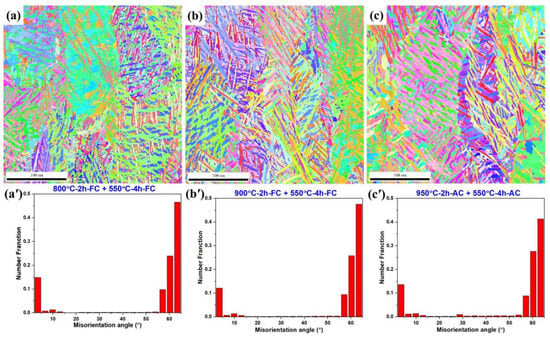
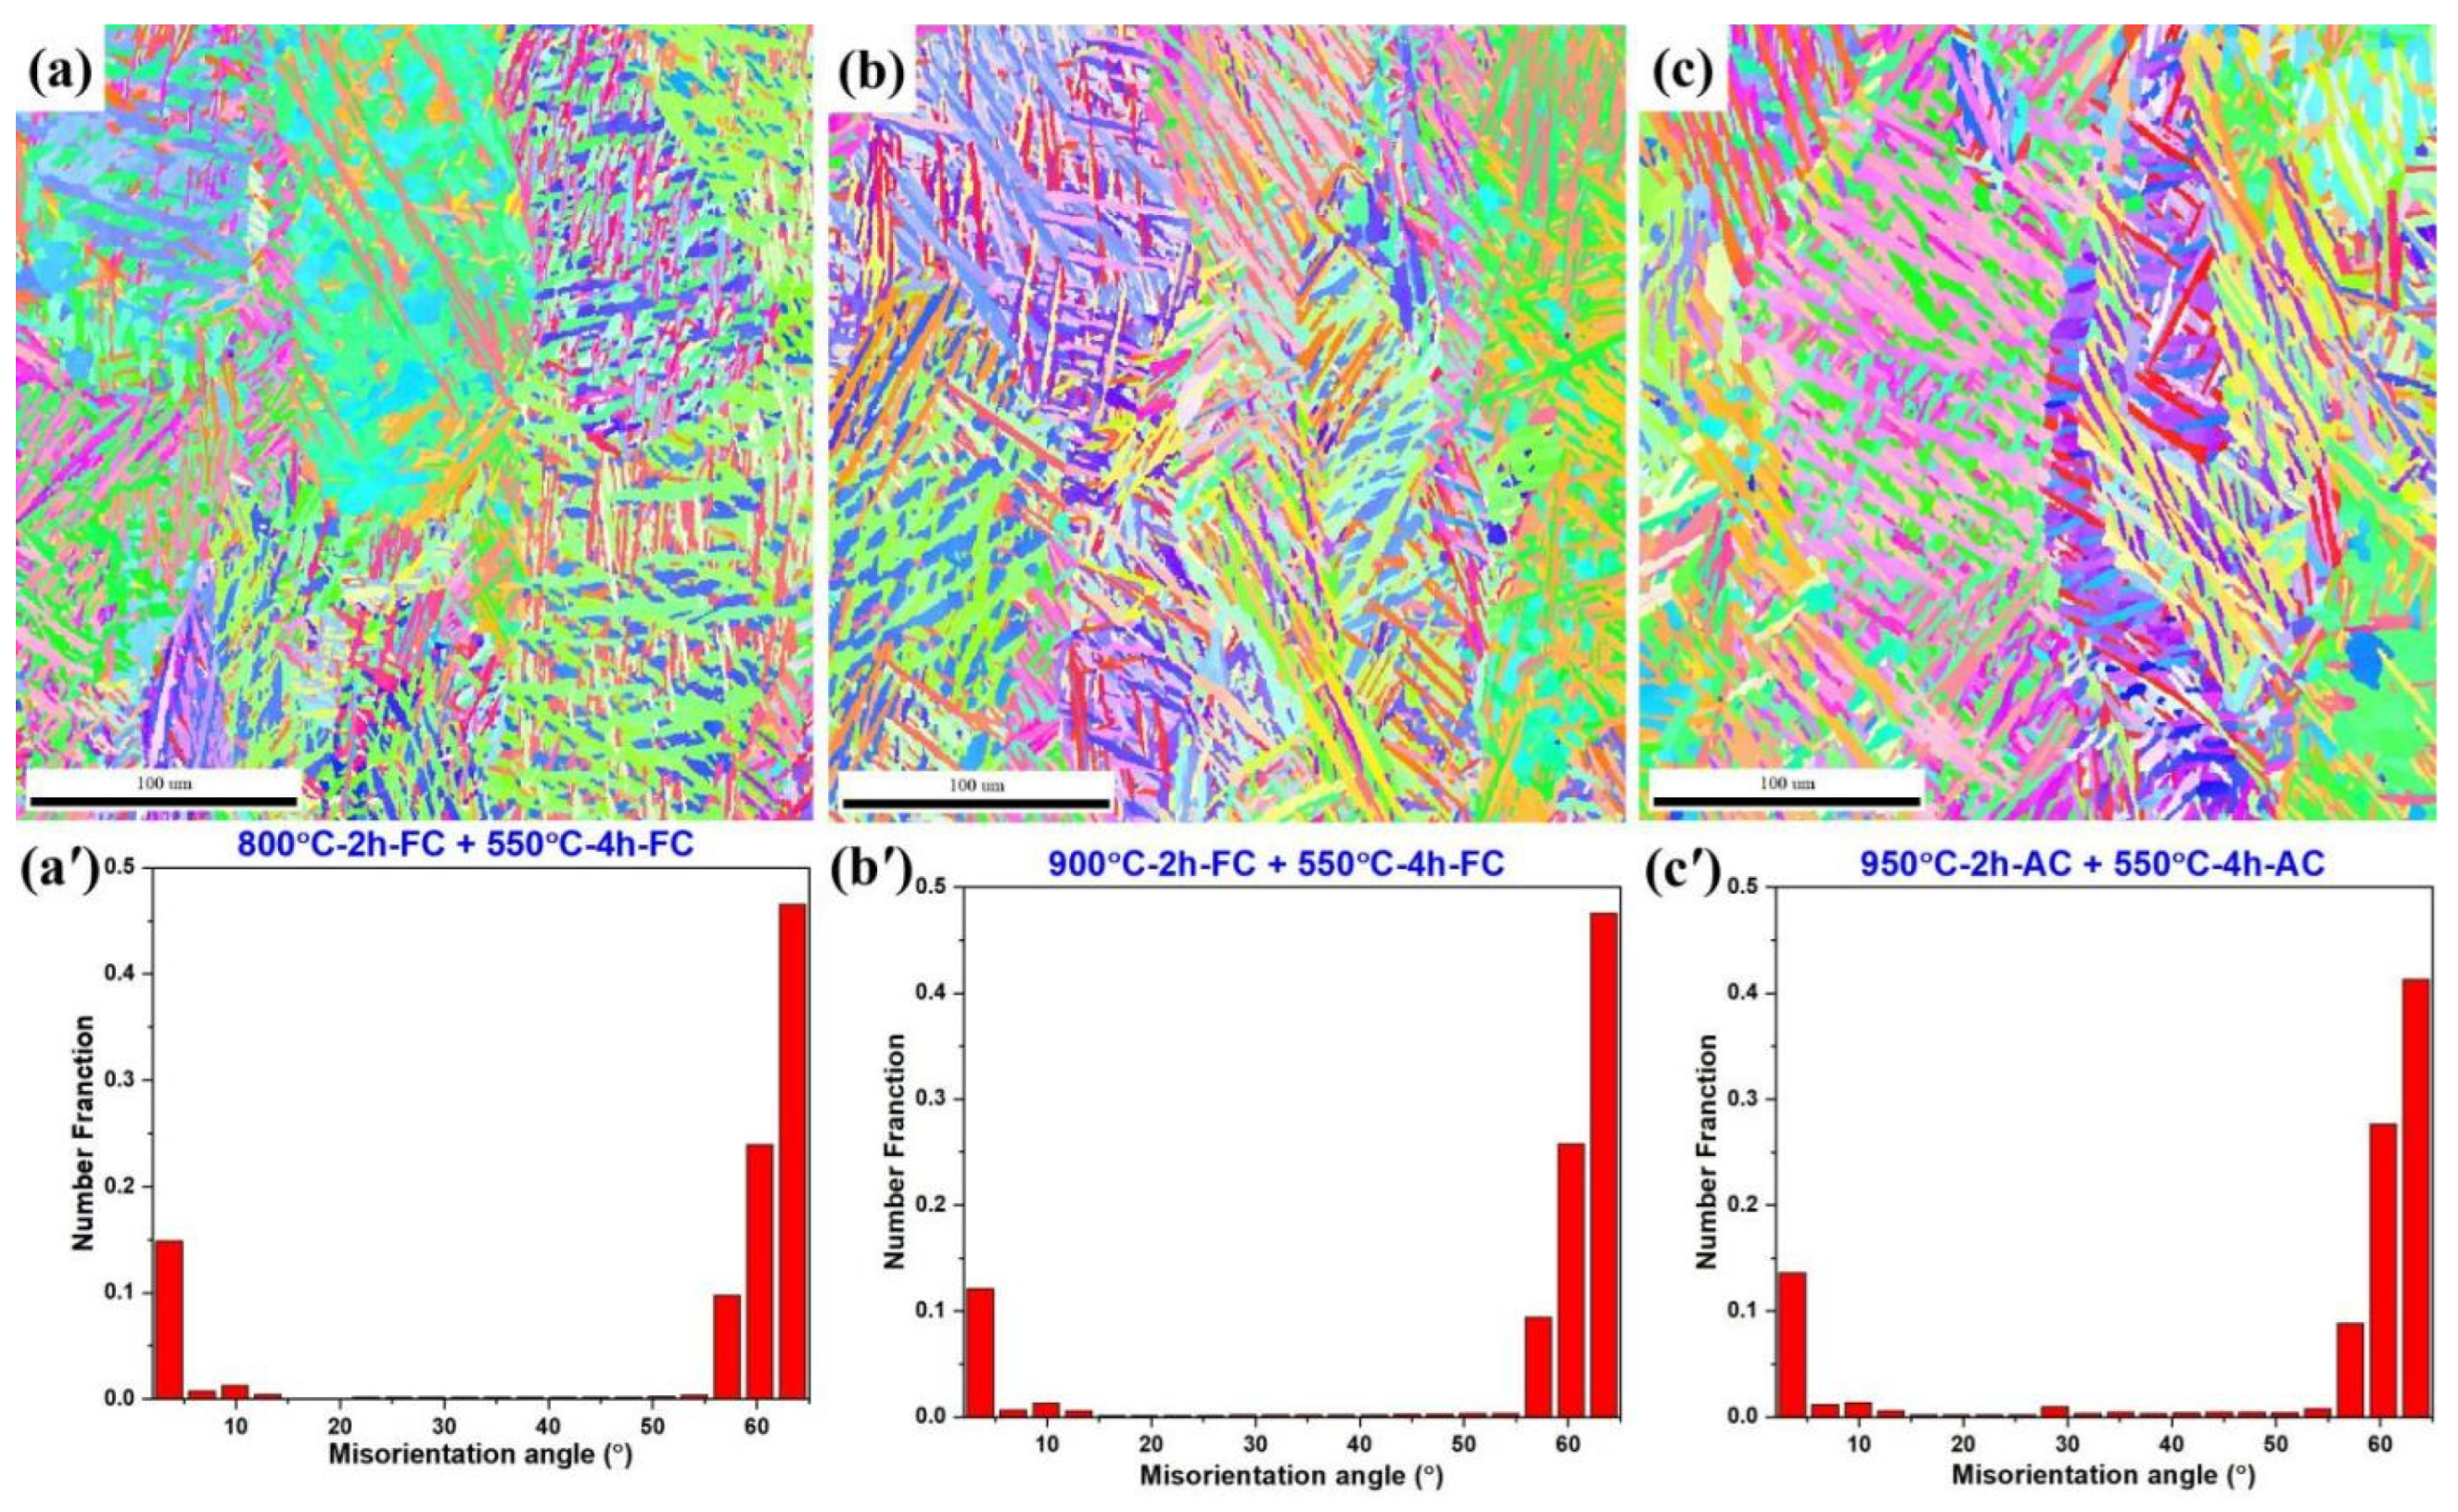
The EBSD results in Figure 14 further show that the orientation characteristics established during initial annealing remained distinguishable after secondary annealing. A800-S550 retained relatively fine orientation domains, with low-angle and high-angle boundary fractions of 17.3% and 82.7%, respectively. A900-S550 contained larger similarly oriented regions and more clearly developed lamellar colonies; its low-angle and high-angle boundary fractions were 14.7% and 85.3%, respectively. A950-S550 exhibited the largest continuous similarly oriented regions among the secondary-annealed conditions, with corresponding boundary fractions of 16.7% and 83.3%.
Figure 14.
EBSD characterization of LPBF-fabricated TA15 alloy after secondary annealing: (a,a′) A800-S550; (b,b′) A900-S550; and (c,c′) A950-S550. Images (a–c) show hcp IPF maps, and images (a′–c′) show the corresponding misorientation-angle distributions.
The three conditions therefore remained distinguishable in both lamellar scale and orientation-domain morphology after the common 550 °C treatment. The boundary fractions did not vary monotonically with the initial annealing temperature and should not be used alone to rank the degree of microstructural coarsening. Instead, they provide complementary information to the IPF maps, misorientation distributions, and image-based lath and colony measurements.
Individual α-variant fractions, twin fractions, KAM distributions, and reconstructed prior-β grains were not evaluated. In addition, the exact MAD threshold and detailed Channel5 clean-up sequence could not be reconstructed from the archived records. The reported boundary fractions are therefore interpreted as comparative descriptors of the processed datasets rather than as absolute stereological quantities.
3.4. Tensile Response After Secondary Annealing
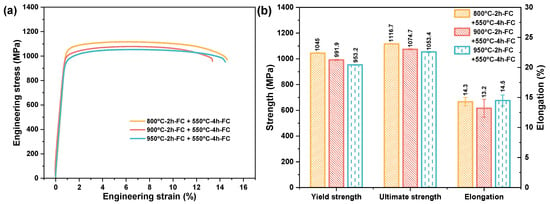
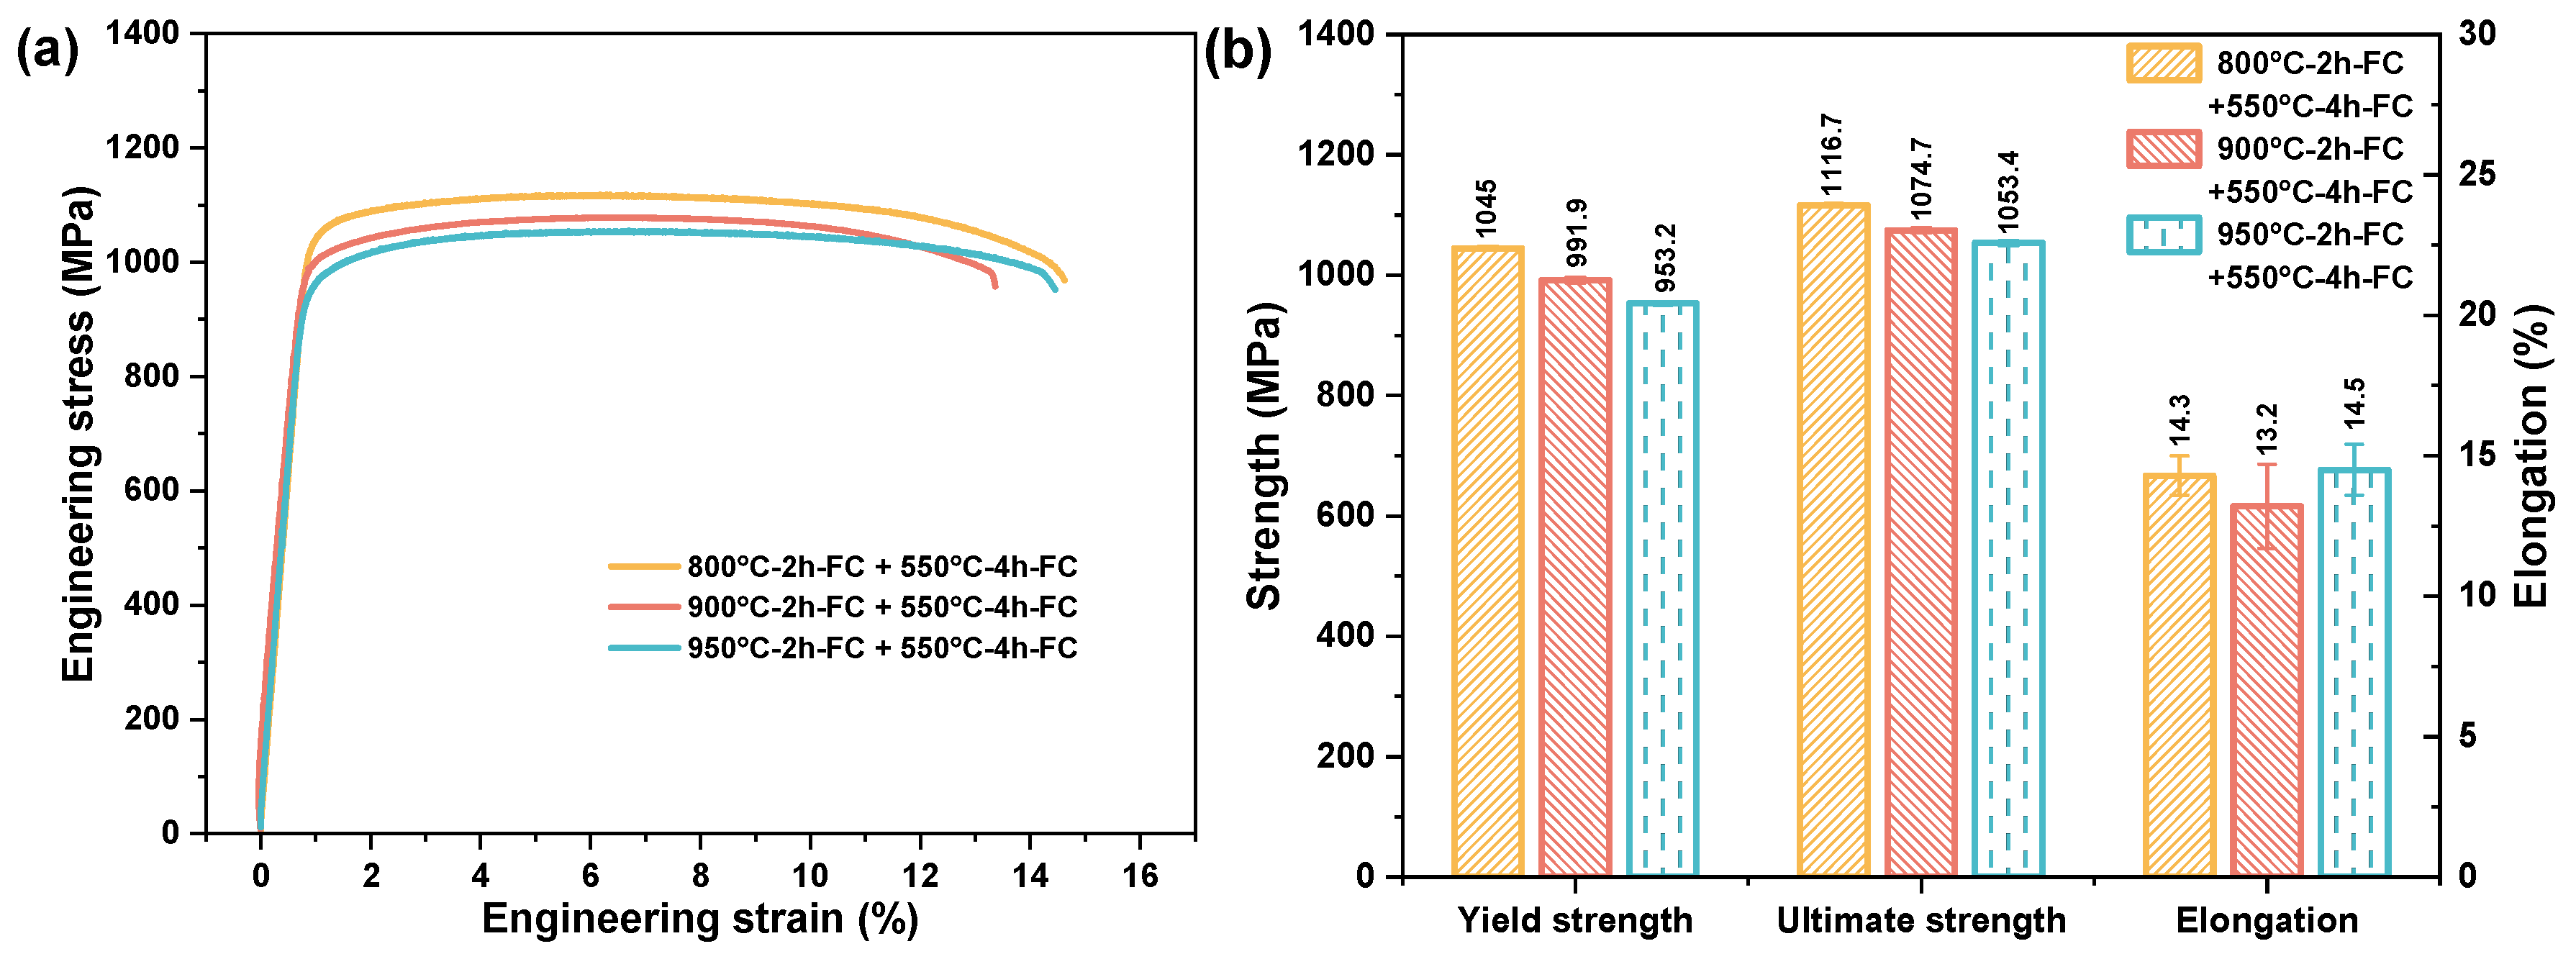
The room-temperature tensile properties after secondary annealing are shown in Figure 15. Three independent specimens were tested for each condition, and the error bars represent one standard deviation. The tensile-property changes produced by the 550 °C treatment differed among the three pre-annealed conditions.
Figure 15.
Room-temperature tensile properties of LPBF-TA15 alloy after different initial and secondary annealing treatments: (a) representative engineering stress–strain curves; and (b) mean yield strength, ultimate tensile strength, and total elongation. Error bars represent one standard deviation from three independent specimens.
The comparisons in this section represent the net tensile-property changes produced by adding the 550 °C treatment to each pre-annealed condition. They should not be interpreted as the independent effect of a 550 °C treatment on LPBF TA15 because a direct as-built-plus-550 °C control was not included. A800-S550 exhibited the highest mean room-temperature strength among the three secondary-annealed conditions. Its yield strength, ultimate tensile strength, and total elongation were 1045.0 ± 2.6 MPa, 1116.7 ± 2.3 MPa, and 14.3 ± 0.7%, respectively. The corresponding values for A900-S550 were 991.9 ± 4.3 MPa, 1074.7 ± 4.3 MPa, and 13.2 ± 1.5%, while those for A950-S550 were 953.2 ± 2.9 MPa, 1053.4 ± 3.9 MPa, and 14.5 ± 0.9%, respectively.
Relative to the corresponding single-step annealed conditions, the mean yield strength increased by 41.7 MPa for the A800 series, 33.4 MPa for the A900 series, and 51.2 MPa for the A950 series. The corresponding increases in mean ultimate tensile strength were 31.7, 13.0, and 18.8 MPa, respectively. The mean total elongation changed by +0.2, −2.0, and +2.2 percentage points for the A800, A900, and A950 series, respectively.
The paired comparison shows that the final property ranking was not the same as the ranking of changes relative to the corresponding single-step states. A800-S550 exhibited the highest absolute mean strength, whereas the A950 series showed the largest mean increase in yield strength and total elongation. Thus, the magnitude and direction of the property changes were not explained solely by the retained hierarchy of the observable lath and colony scales.
Within the three paired comparisons, adding the 550 °C treatment was accompanied by increased mean room-temperature strength without a resolvable refinement of the apparent lath or colony scale. The strength increments therefore cannot be explained by changes in the lamellar dimensions measured by SEM.
Given the measured Al content of 6.09 wt.%, α2 ordering or Ti3Al-based nanoscale precipitation represents a possible contribution. Previous TEM and atom-probe studies have identified α2 precipitation during ageing at 550 °C [40,41], although the ageing durations examined in those studies were substantially longer than the 4 h treatment used here. Fine secondary α precipitation from a metastable bcc constituent is another possible contribution, but a second bcc phase was not indexed consistently by EBSD. Because no TEM, atom-probe, superlattice-diffraction, or small-angle scattering analysis was performed, these mechanisms could not be verified. Residual-stress relaxation, solute redistribution, and dislocation-substructure evolution may also have contributed.
The final mean-strength ranking, A800-S550 > A900-S550 > A950-S550, followed the ranking of the apparent lath and colony scales. This correspondence describes the differences among the final states but does not explain the different strength increments within the three paired conditions.
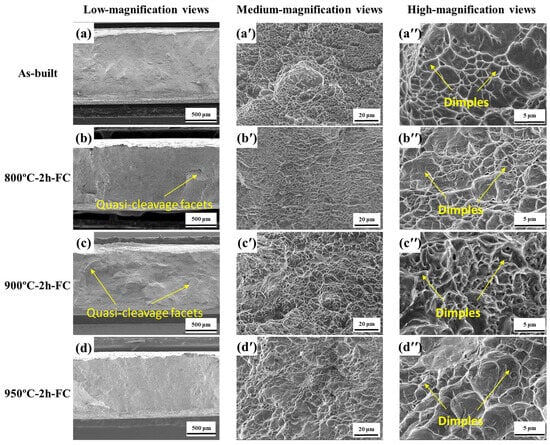
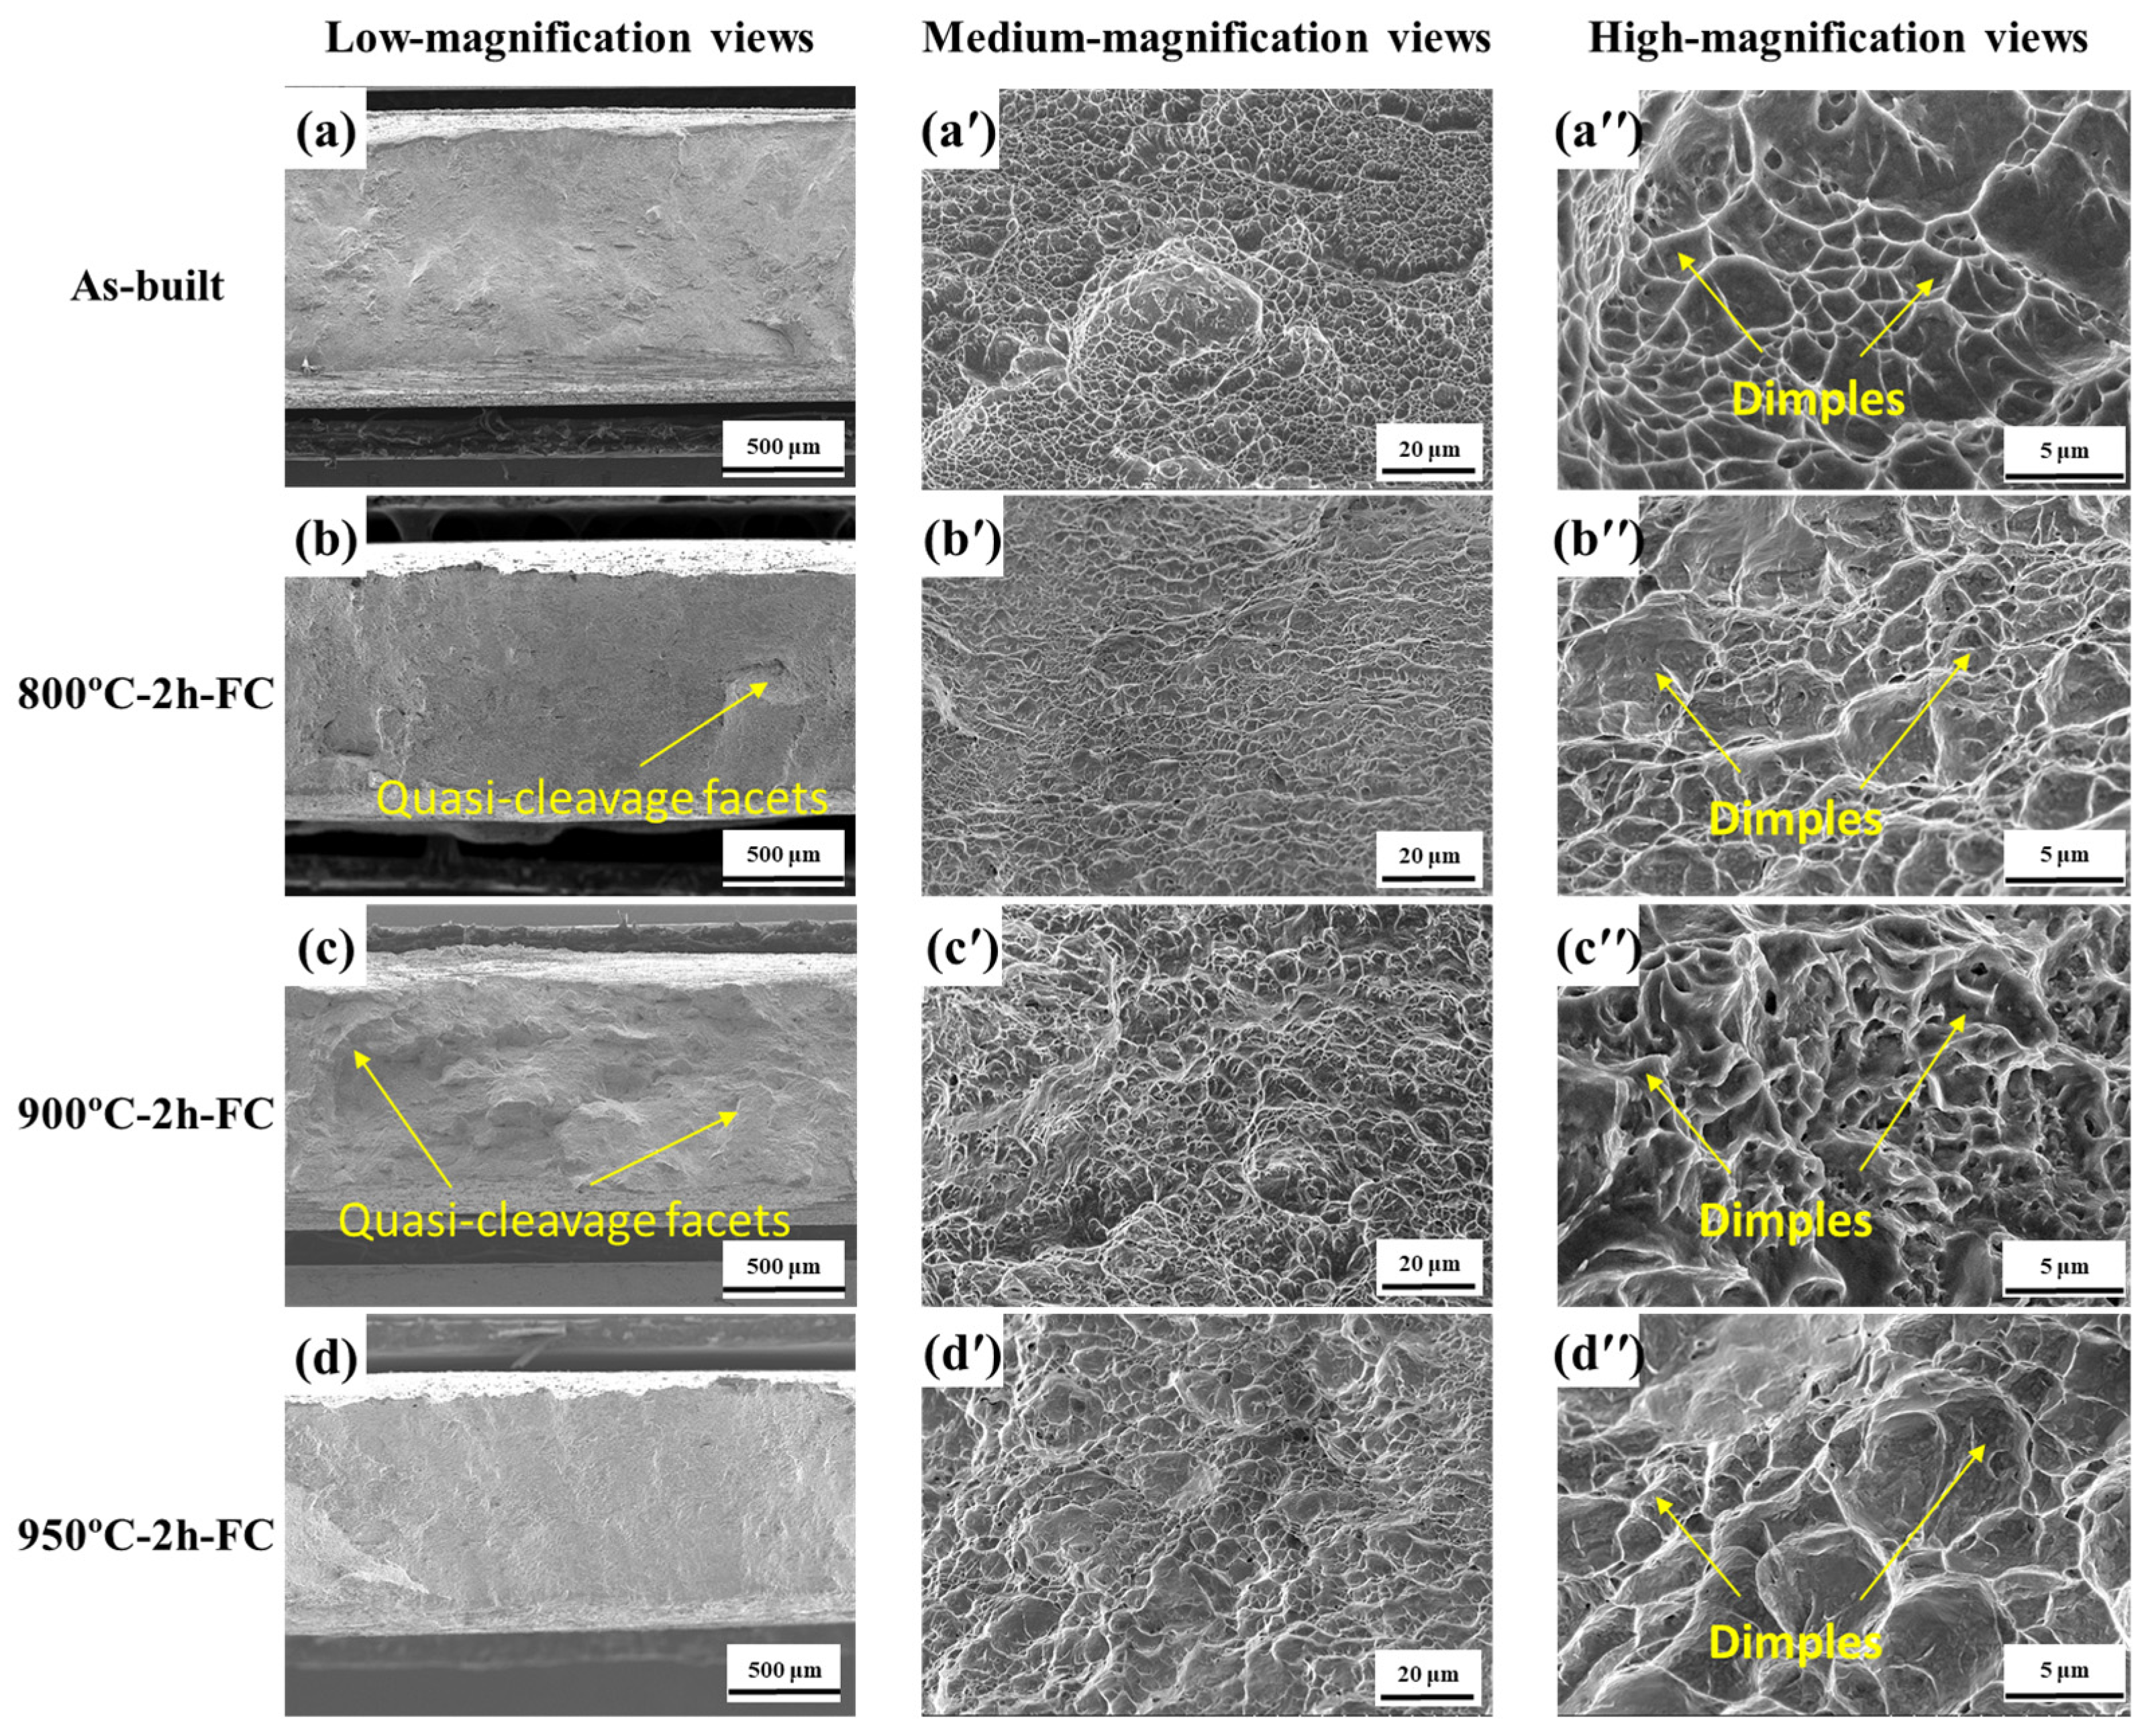
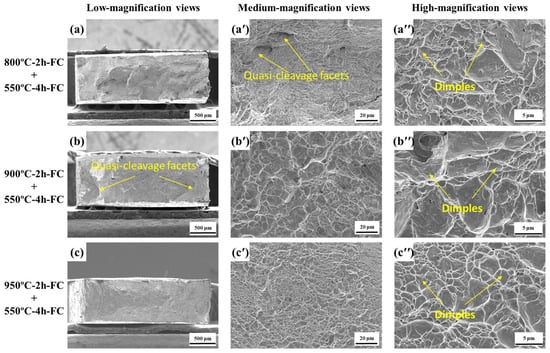
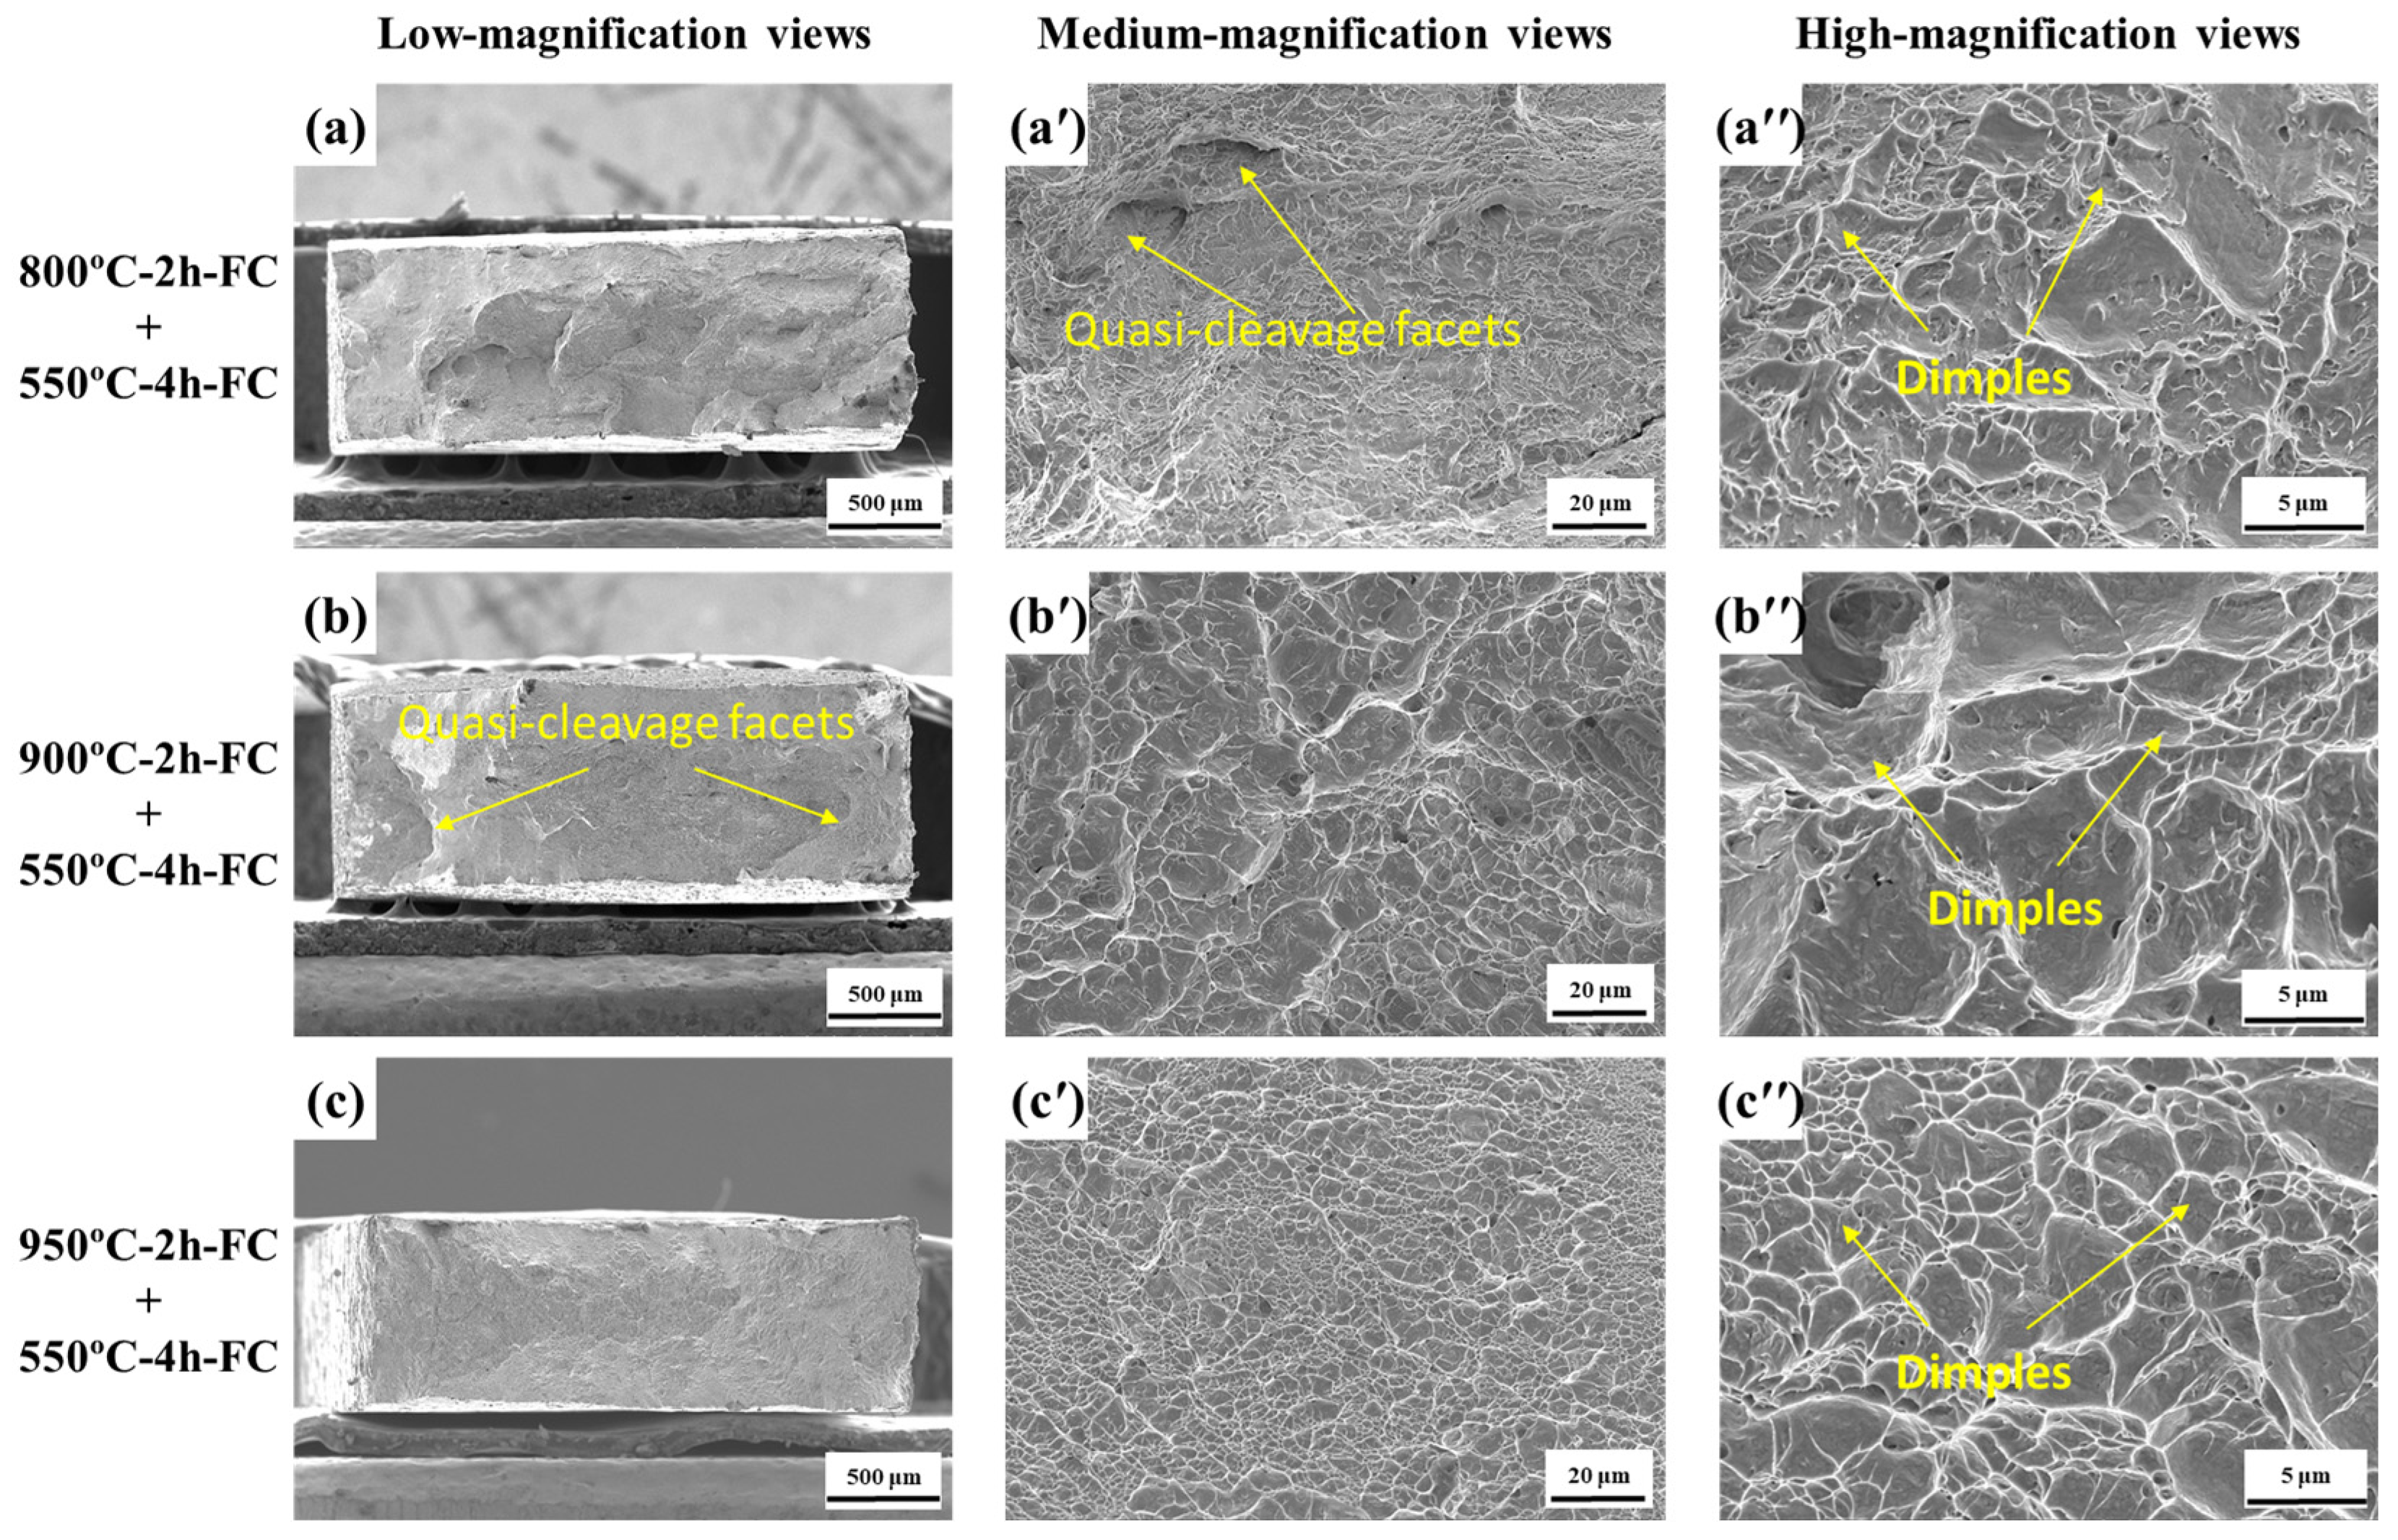
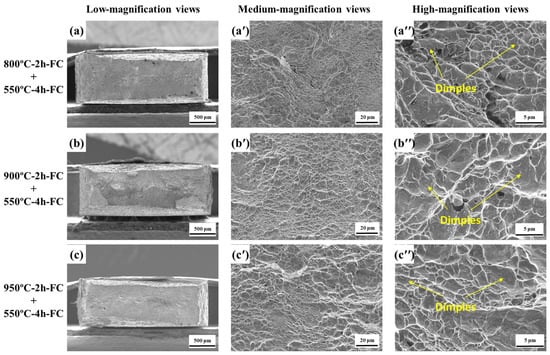
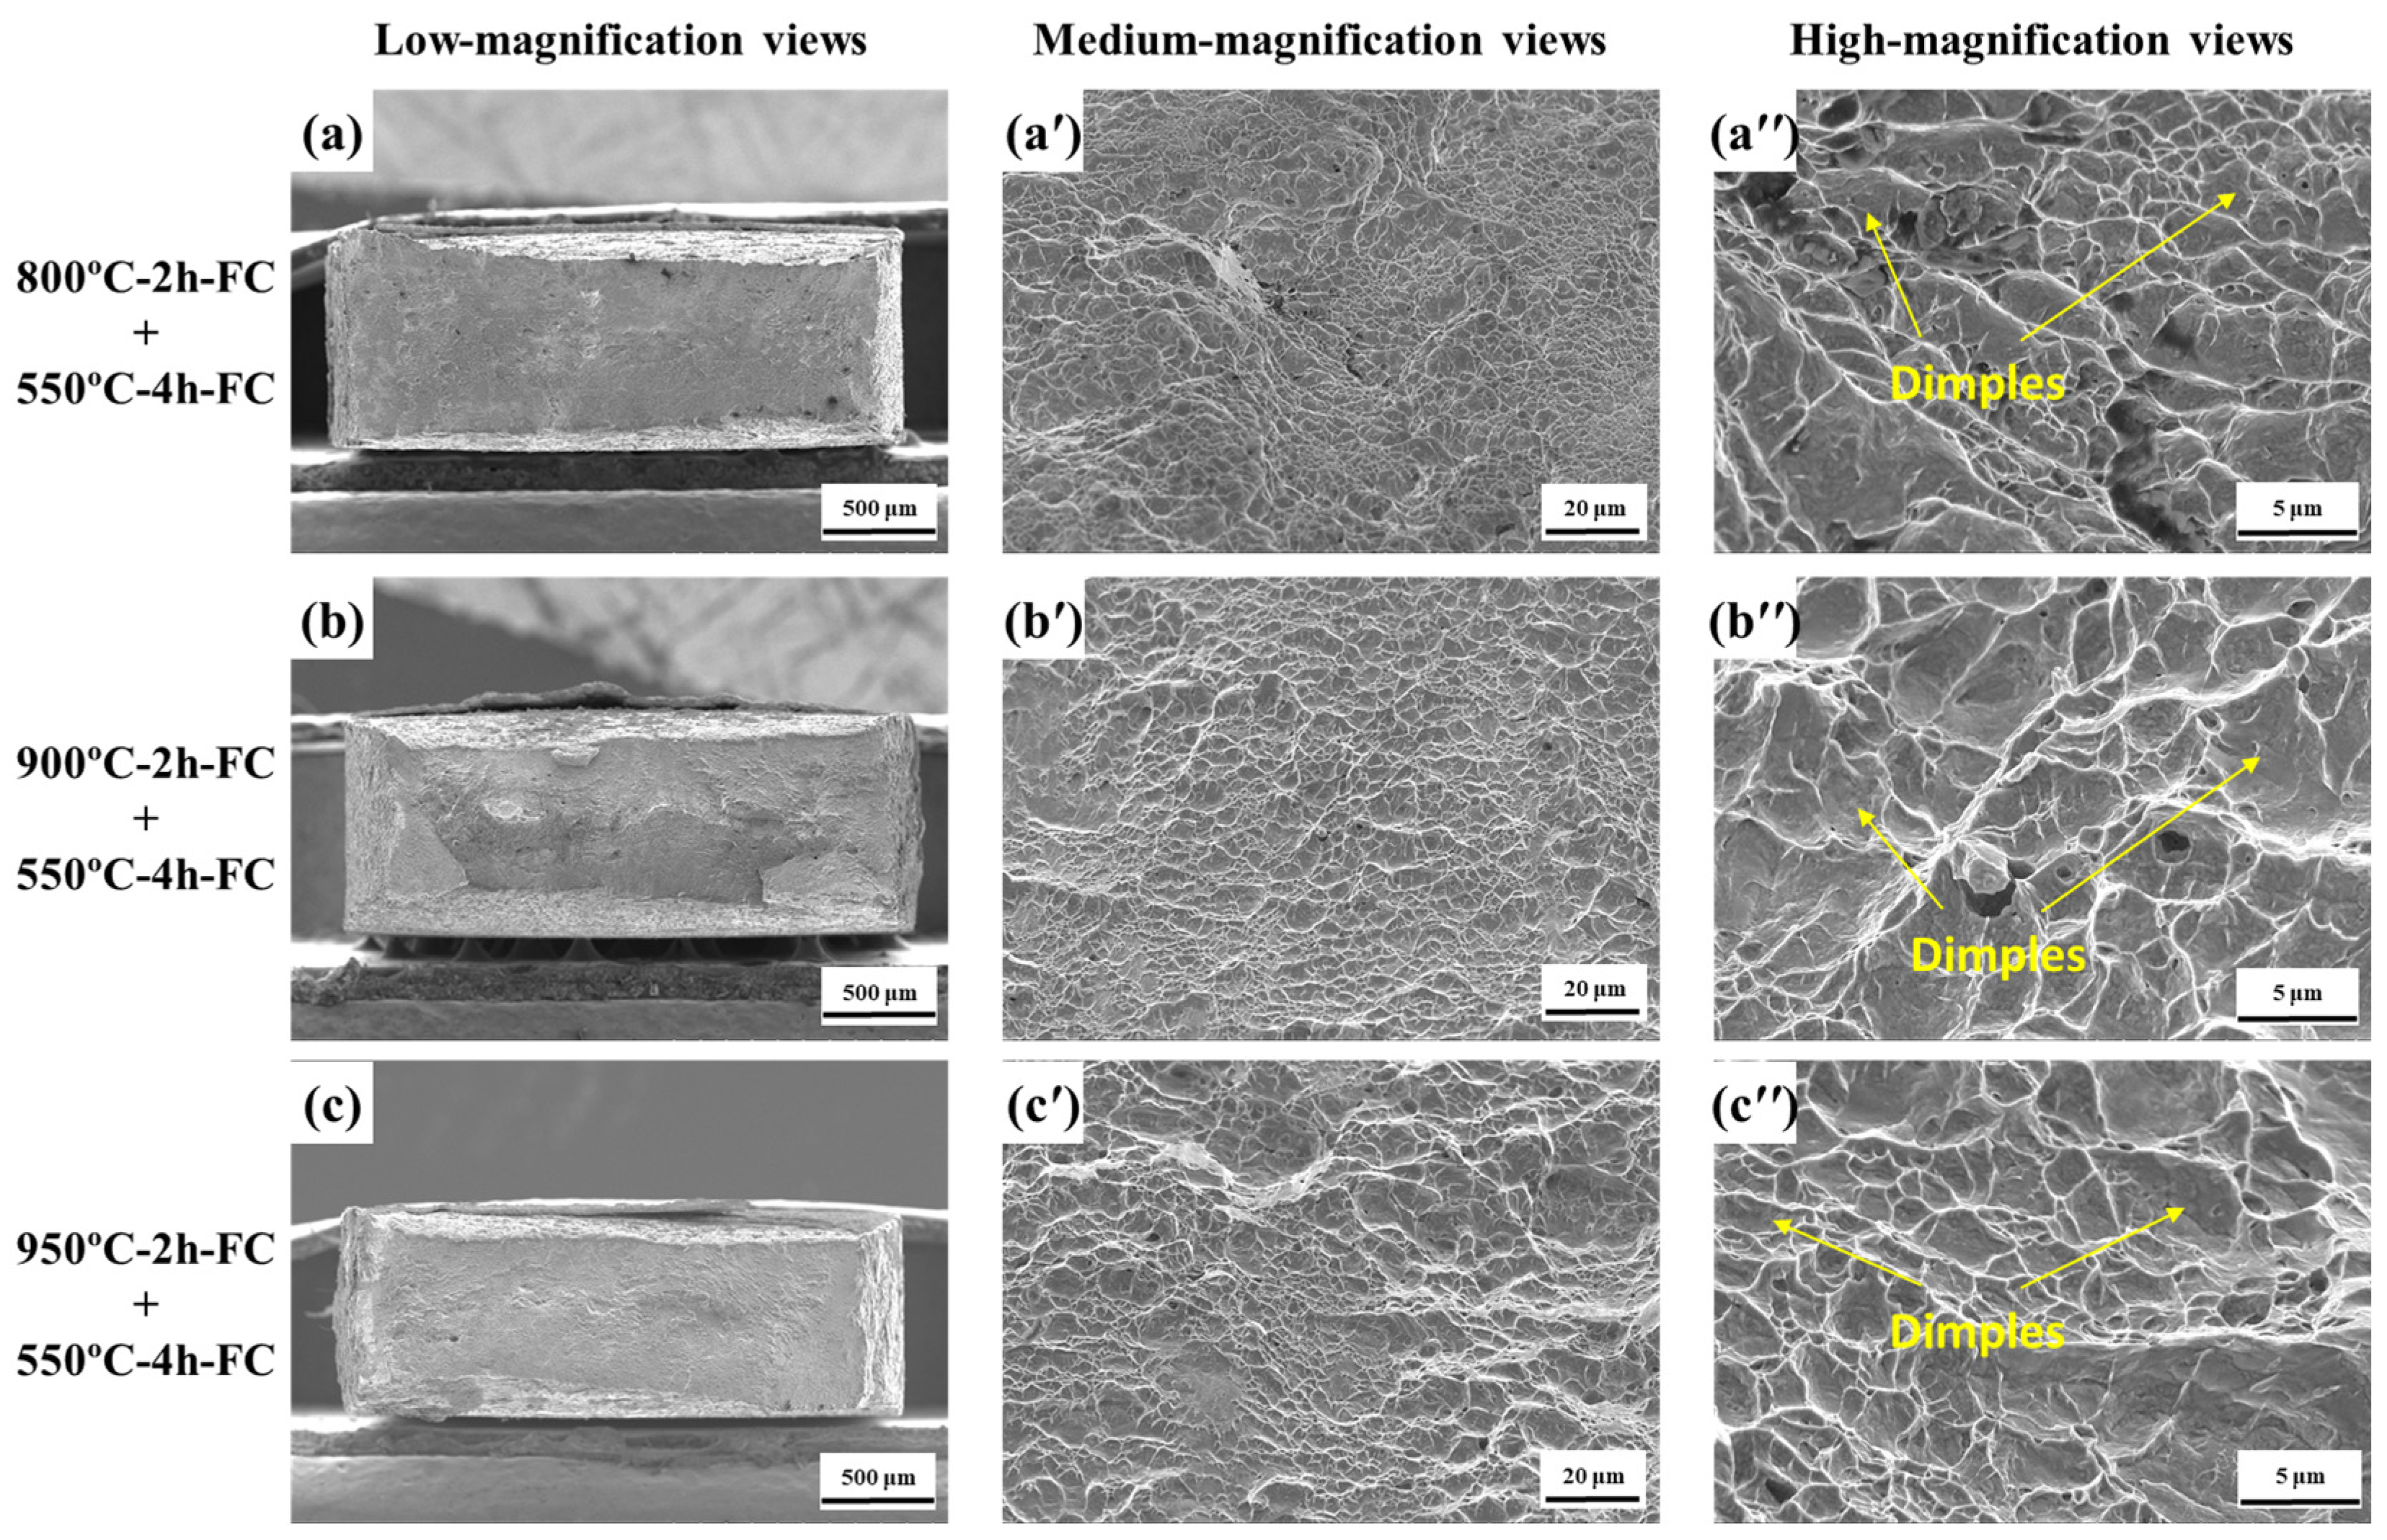
The room-temperature fracture surfaces are shown in Figure 16. All three secondary-annealed conditions exhibited dimples and tearing ridges, together with localized facet-like features in some examined regions. The size and distribution of these features varied among the conditions.
Figure 16.
Room-temperature fracture morphologies of the secondary-annealed specimens: (a–c) low-magnification views; (a′–c′) medium-magnification views; and (a″–c″) high-magnification views. Images (a–a″), (b–b″), and (c–c″) correspond to A800-S550, A900-S550, and A950-S550, respectively. Representative facet-like features and dimples are indicated by arrows.
These observations are descriptive only. Cross-sectional fracture-path analysis, quantitative internal-defect characterization, post-deformation EBSD or TEM, and chemical analysis of potential cavity-nucleation sites were not performed. In addition, the oxygen and nitrogen contents of the consolidated and heat-treated specimens were not measured. The fracture-surface features are therefore not used to classify the overall fracture mode or establish a condition-specific fracture mechanism.
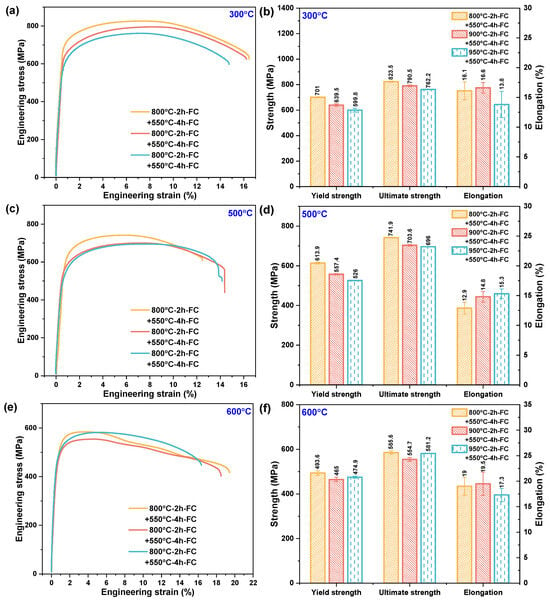
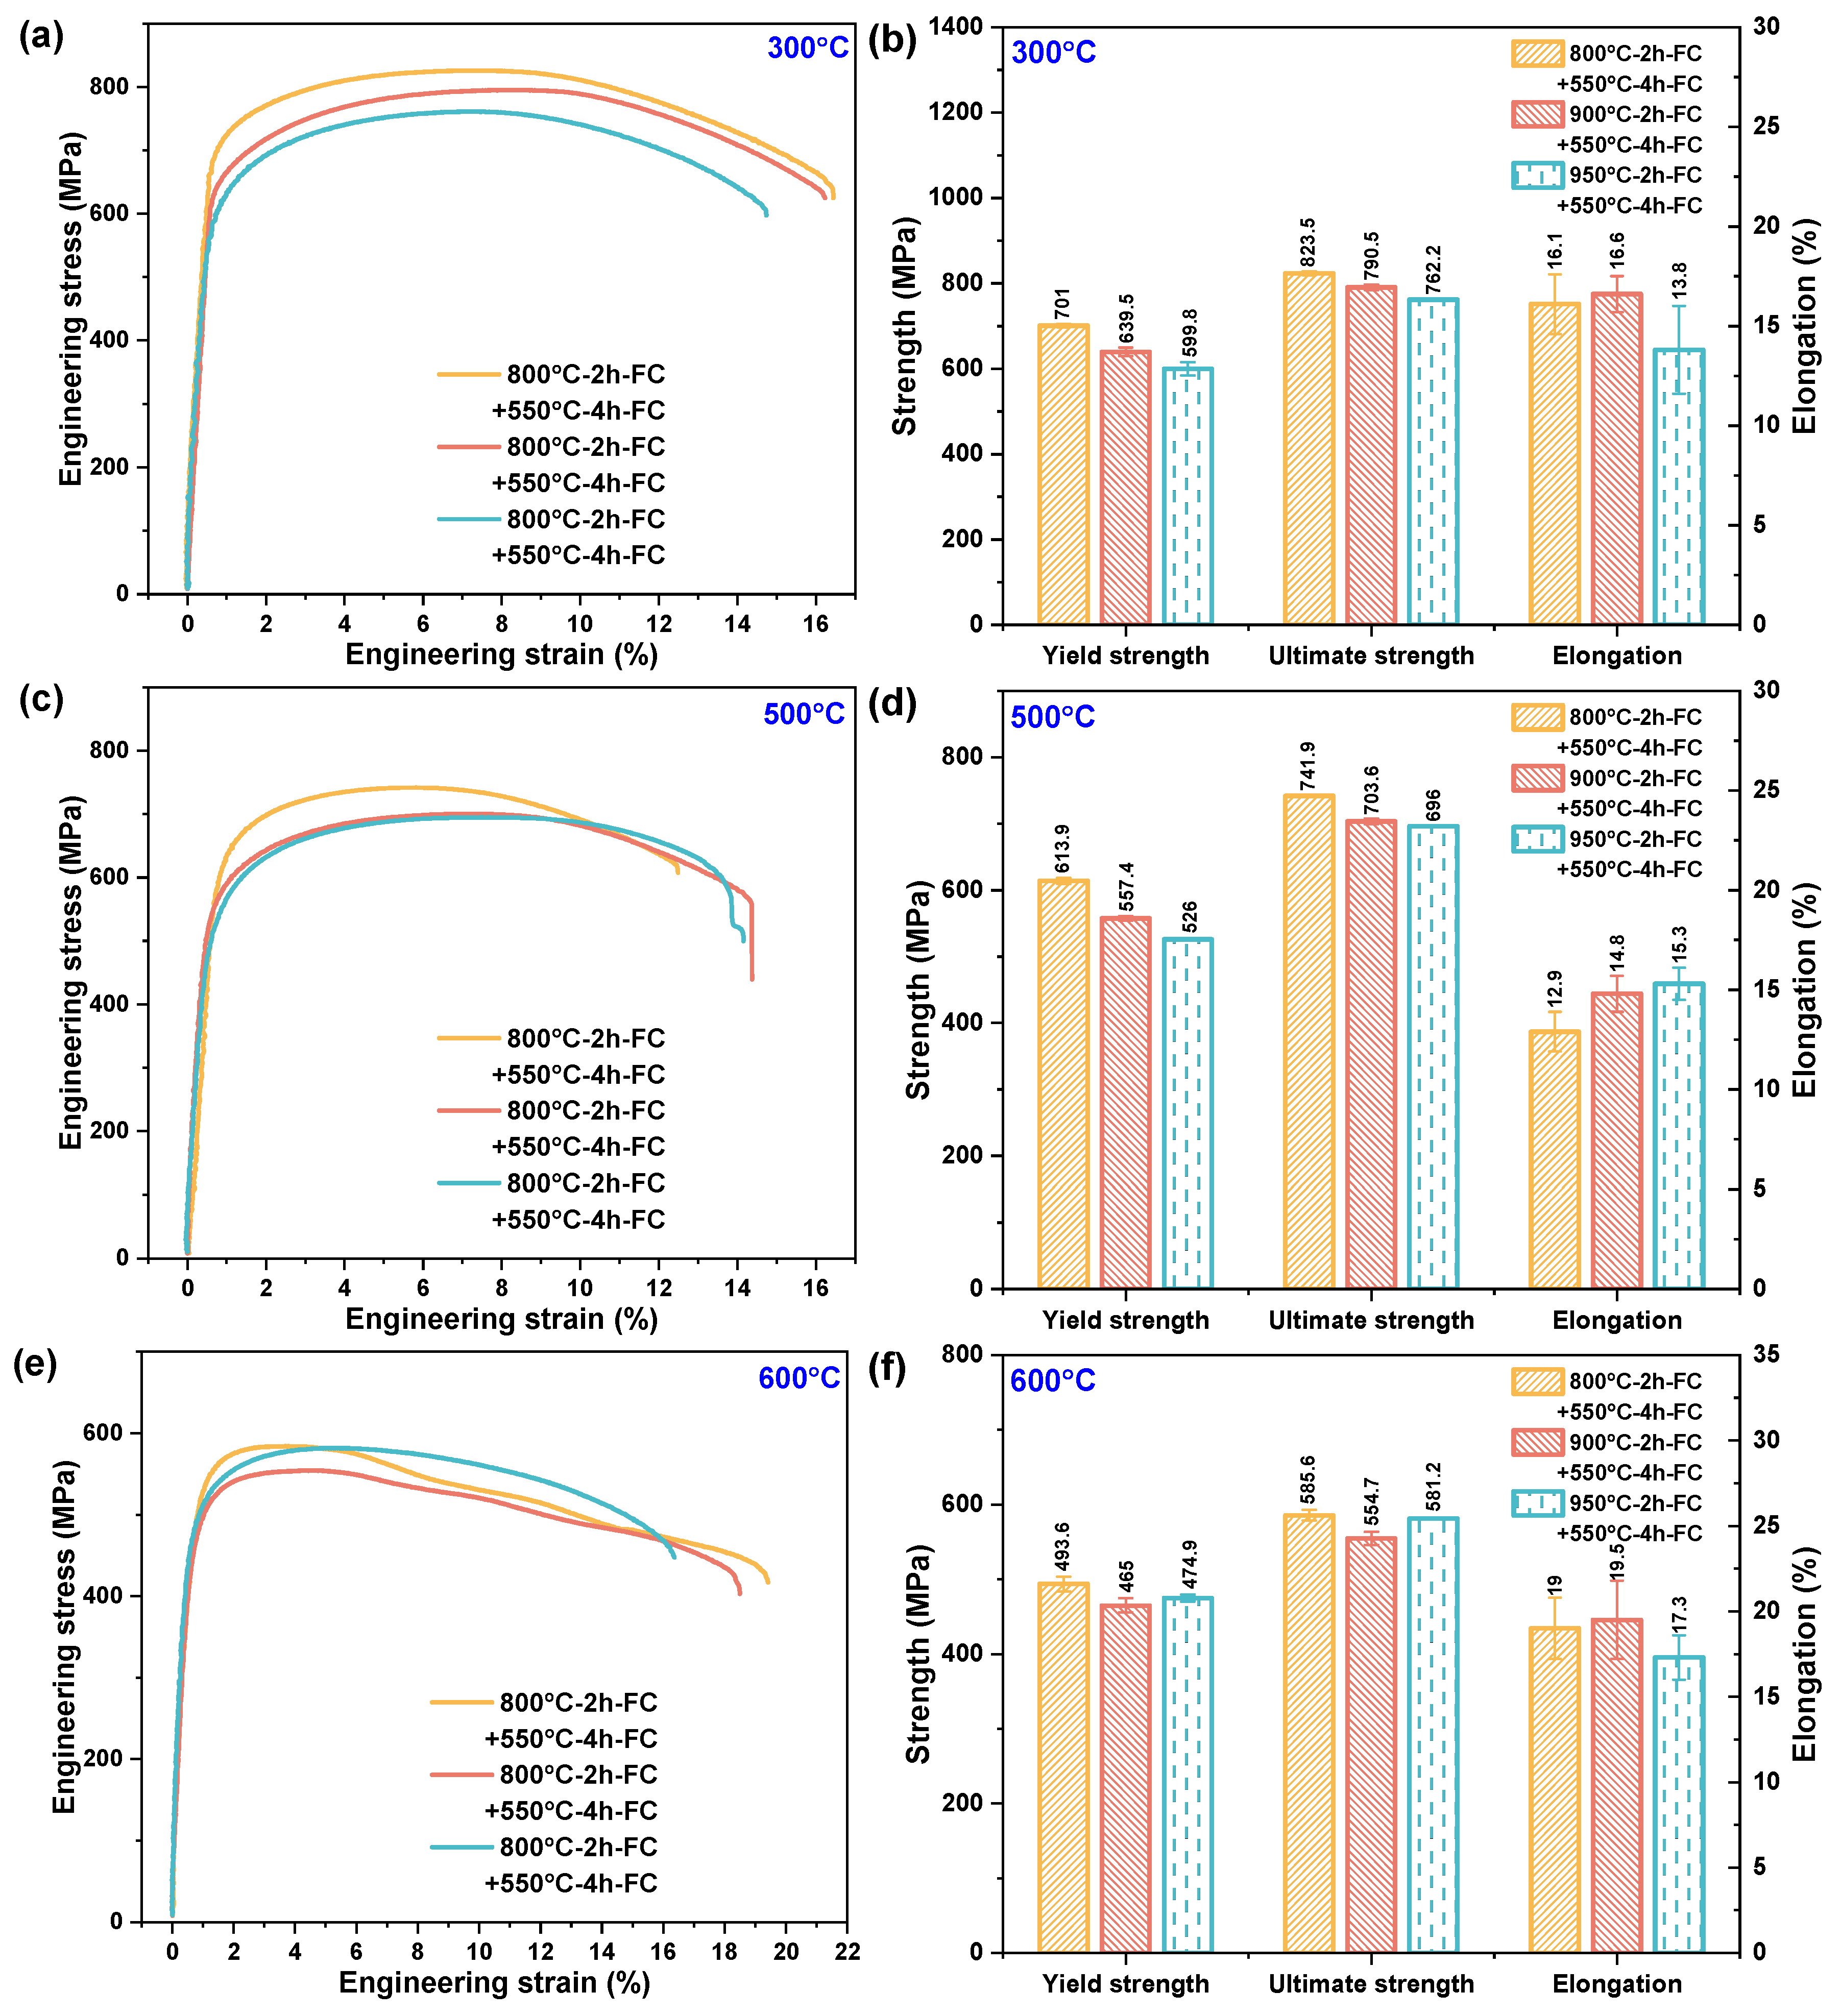
The elevated-temperature tensile properties are presented in Figure 17. At 300 °C, the mean yield strengths of A800-S550, A900-S550, and A950-S550 were 701.0, 639.5, and 599.8 MPa, respectively, while their mean ultimate tensile strengths were 823.5, 790.5, and 762.2 MPa. The corresponding mean elongations were 16.1%, 16.6%, and 13.8%.
Figure 17.
Elevated-temperature tensile properties of LPBF-TA15 after different initial and secondary annealing treatments: (a,b) 300 °C; (c,d) 500 °C; and (e,f) 600 °C. Error bars represent one standard deviation from three independent specimens.
At 500 °C, the mean yield strengths were 613.9, 557.4, and 526.0 MPa for A800-S550, A900-S550, and A950-S550, respectively. Their mean ultimate tensile strengths were 741.9, 703.6, and 696.0 MPa, while the mean elongations were 12.9%, 14.8%, and 15.3%. For the A800 series, secondary annealing increased the mean yield strength from 593.5 ± 5.1 to 613.9 ± 4.6 MPa and the mean ultimate tensile strength from 726.5 ± 2.4 to 741.9 ± 1.1 MPa.
At 600 °C, the mean yield strengths of A800-S550, A900-S550, and A950-S550 were 493.6, 465.0, and 474.9 MPa, respectively. Their mean ultimate tensile strengths were 585.6, 564.7, and 581.2 MPa, and their mean total elongations were 19.0%, 19.5%, and 17.3%, respectively. For A800-S550, the yield strength, ultimate tensile strength, and total elongation were 493.6 ± 9.8 MPa, 585.6 ± 7.1 MPa, and 19.0 ± 1.8%, respectively. The differences between A800 and A800-S550 at this temperature were small relative to the measured scatter.
The results at 600 °C are therefore treated as descriptive mean values. No statistically supported ranking among the secondary-annealed conditions or direct relationship between the remaining strength differences and microstructural scale is claimed.
The relationship between mean yield strength and image-based lath scale was also examined. At room temperature, 300 °C, and 500 °C, the mean yield strength decreased as the apparent lath thickness increased from A800-S550 to A950-S550. At 600 °C, the relationship was no longer monotonic. Because only three microstructural conditions were available, this comparison is treated as descriptive and does not establish a quantitative Hall–Petch-type relationship.
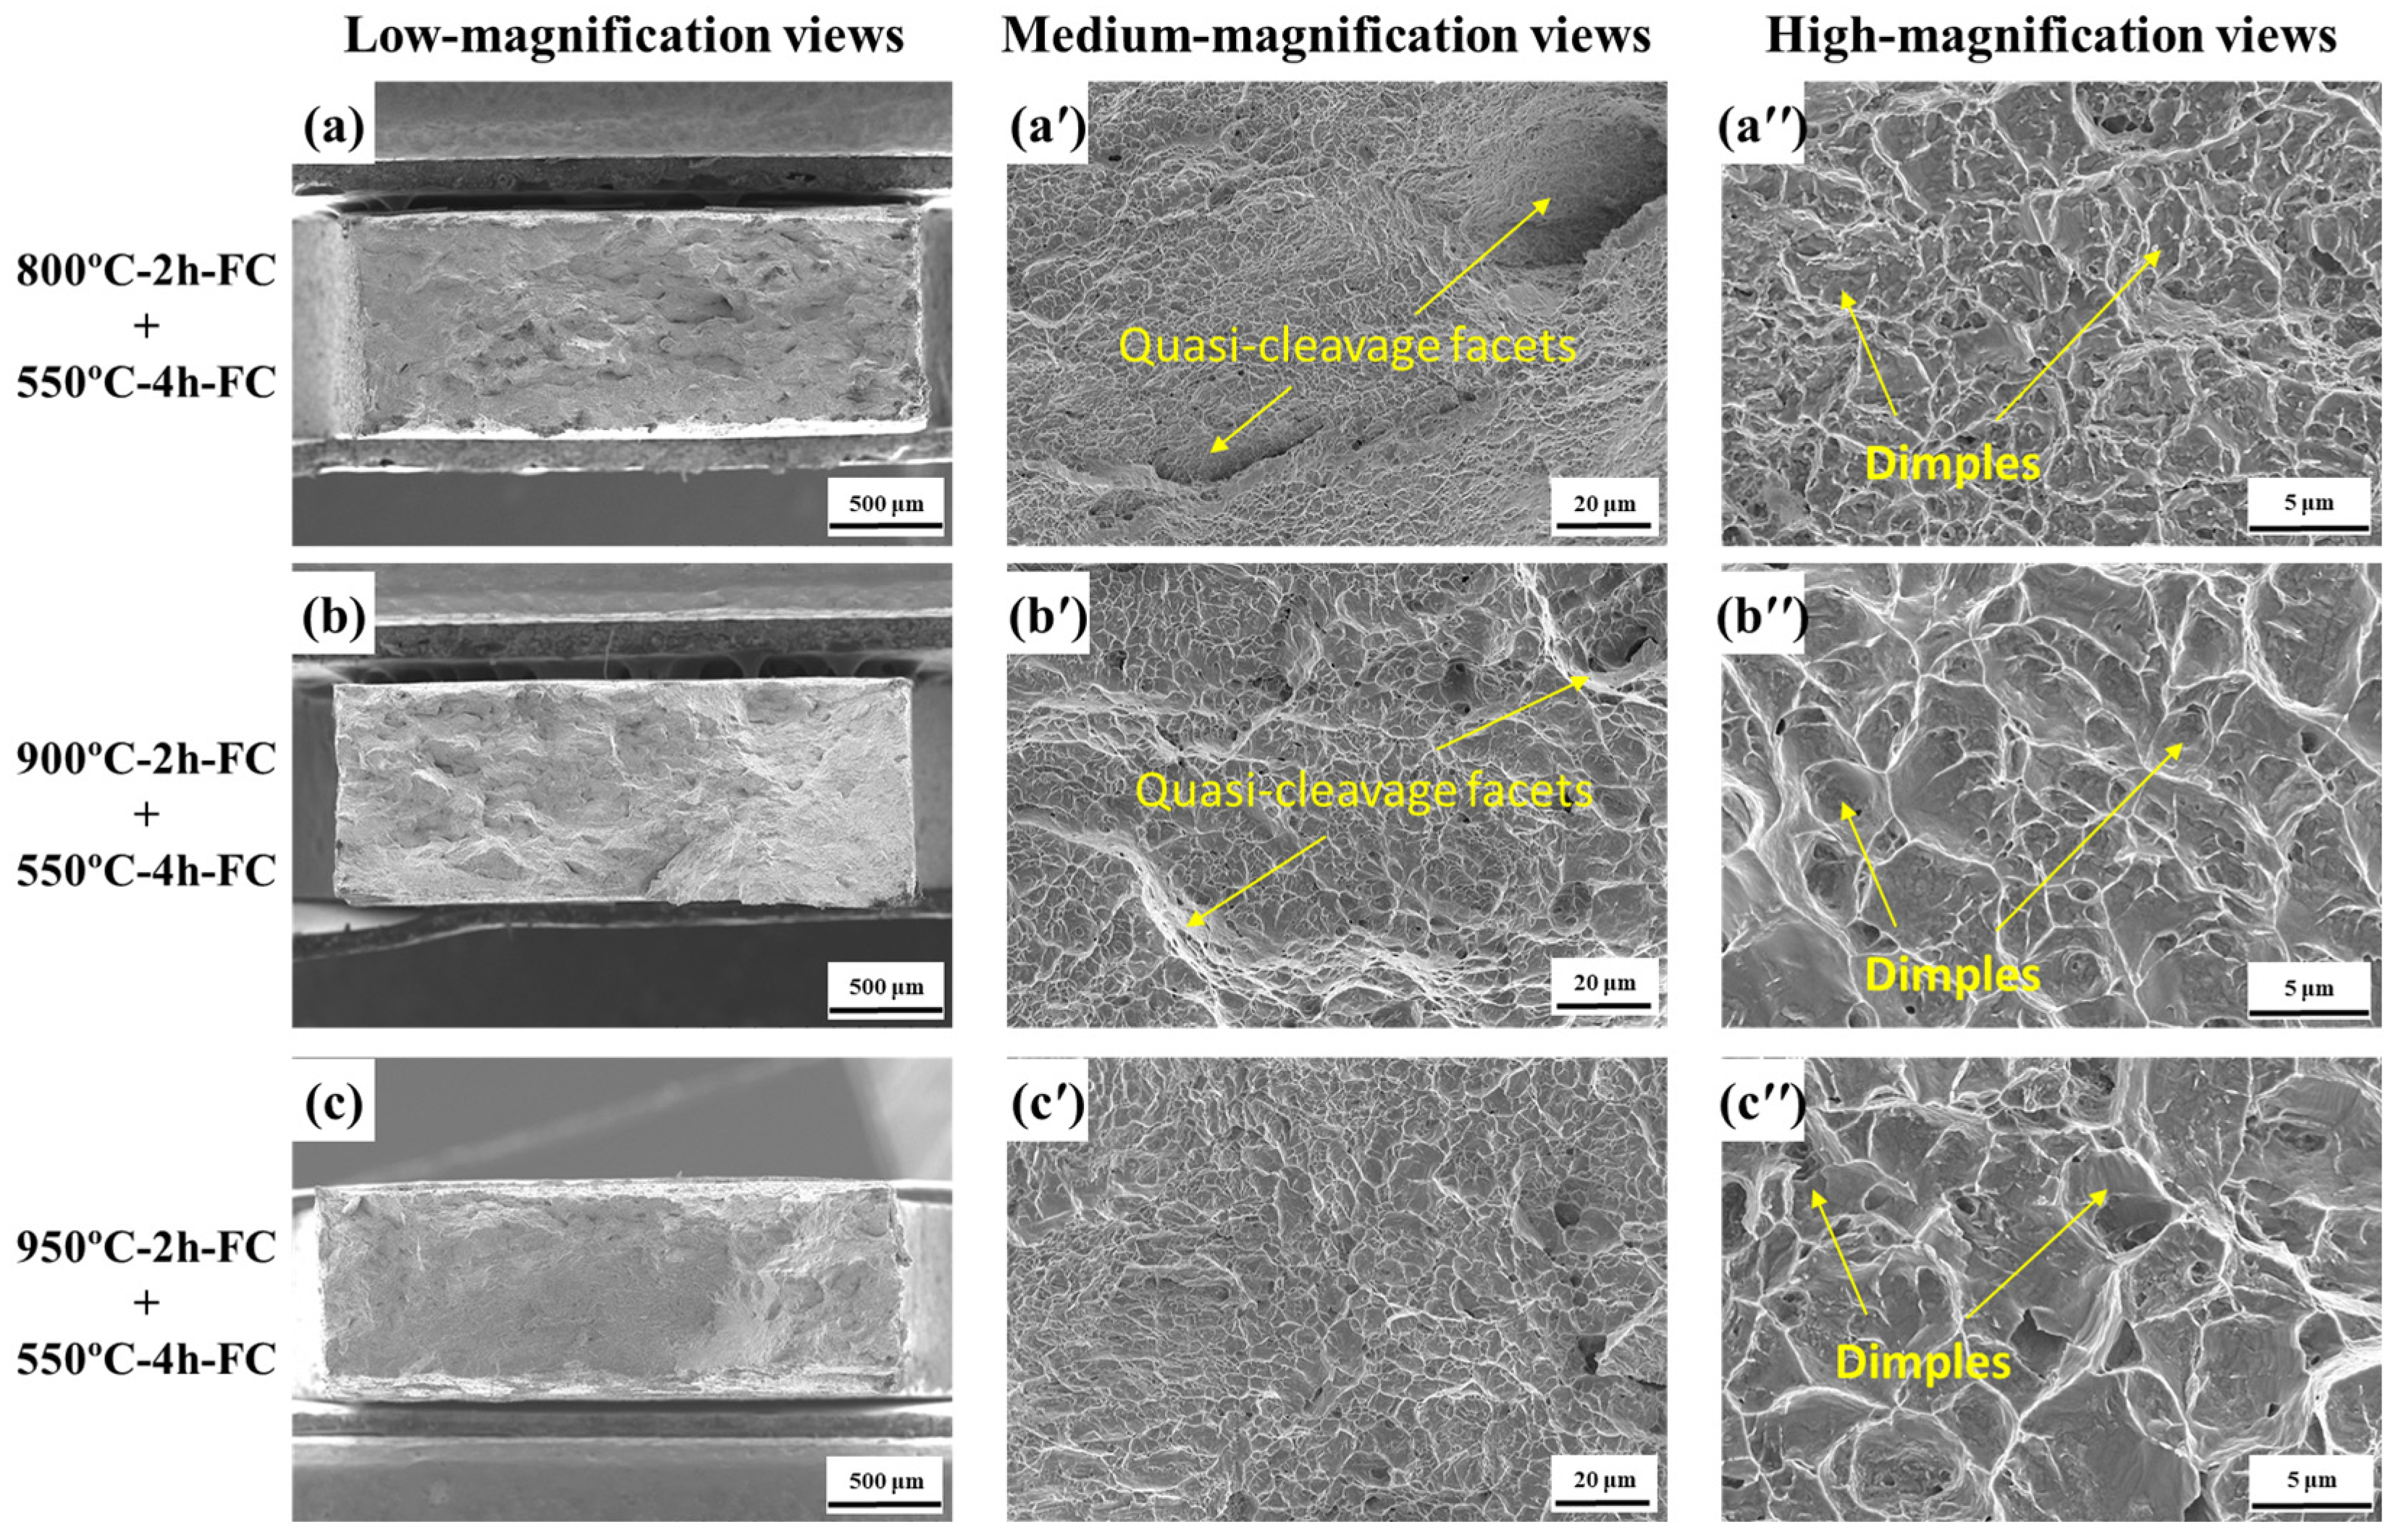
The elevated-temperature fracture surfaces are shown in Figure 18, Figure 19 and Figure 20. Dimples, tearing ridges, and localized facet-like features were observed, but their size and distribution varied with testing temperature and heat-treatment condition without a uniform trend.
Figure 18.
Fracture morphologies of LPBF-TA15 specimens tensile-tested at 300 °C after initial and secondary annealing. Images (a–a″), (b–b″), and (c–c″) correspond to A800-S550, A900-S550, and A950-S550, respectively; (a–c), (a′–c′), and (a″–c″) show low-, medium-, and high-magnification views, respectively.
Figure 19.
Fracture morphologies of LPBF-TA15 specimens tensile-tested at 500 °C after initial and secondary annealing. Images (a–a″), (b–b″), and (c–c″) correspond to A800-S550, A900-S550, and A950-S550, respectively; (a–c), (a′–c′), and (a″–c″) show low-, medium-, and high-magnification views, respectively.
Figure 20.
Fracture morphologies of LPBF-TA15 specimens tensile-tested at 600 °C after initial and secondary annealing. Images (a–a″), (b–b″), and (c–c″) correspond to A800-S550, A900-S550, and A950-S550, respectively; (a–c), (a′–c′), and (a″–c″) show low-, medium-, and high-magnification views, respectively. Representative facet-like features and dimples are indicated by arrows.
Because the internal defect population, post-heat-treatment interstitial contents, and cross-sectional fracture paths were not characterized, the observed features cannot be assigned uniquely to the annealing-generated morphology. They are therefore presented as qualitative descriptions of the examined surfaces and are not used to establish grain-boundary sliding, cavity nucleation at specific interfaces, or other detailed temperature-dependent fracture mechanisms.
Among the three secondary-annealed conditions, A800-S550 exhibited the highest mean strength at room temperature, 300 °C, and 500 °C. At 600 °C, the differences among the mean values were smaller relative to the measured scatter; consequently, no statistically supported performance ranking is assigned at this temperature. These comparisons are limited to the investigated heat-treatment schedules and monotonic tensile tests conducted at a nominal strain rate of 1 × 10⁻³ s−1.
4. Conclusions
LPBF-fabricated TA15 alloy was initially annealed at 800, 900, and 950 °C and subsequently subjected to a common secondary treatment at 550 °C. Its microstructural evolution and monotonic tensile response at room temperature and 300–600 °C were examined. The main conclusions are as follows:
(1) The as-built alloy exhibited a fine acicular lath morphology with an apparent lath thickness of 0.6 ± 0.2 μm. After annealing at 800, 900, and 950 °C, the apparent lath thickness increased to 0.9 ± 0.3, 1.6 ± 0.5, and 2.8 ± 1.0 μm, respectively, together with progressive growth of the lamellar colonies. The present SEM and EBSD data did not independently distinguish α′ from α or provide reliable phase fractions.
(2) The mean yield and ultimate tensile strengths decreased with increasing initial annealing temperature, accompanied by increases in the observable lath and colony scales. In contrast, the mean elongation increased from the as-built condition to A900 and subsequently decreased for A950. This non-monotonic elongation response was not explained by the measured morphological scales alone; residual-stress relaxation, dislocation recovery, texture evolution, and other unmeasured substructural changes may also have contributed.
(3) After secondary annealing, the relative microstructural differences established during initial annealing remained observable. The apparent lath thickness changed from 0.9 ± 0.3 to 1.0 ± 0.3 μm for A800/A800-S550, from 1.6 ± 0.5 to 1.7 ± 0.6 μm for A900/A900-S550, and from 2.8 ± 1.0 to 2.9 ± 1.0 μm for A950/A950-S550. The differences within each pair were small relative to the measurement scatter. The low-angle boundary fractions of A800-S550, A900-S550, and A950-S550 were 17.3%, 14.7%, and 16.7%, respectively. Microstructural inheritance therefore denotes the persistence of differences in lamellar scale and orientation characteristics rather than the absence of microstructural evolution. This definition does not prescribe the direction or magnitude of the tensile-property changes.
(4) Among the secondary-annealed conditions, A800-S550 exhibited the highest mean strength at room temperature, 300 °C, and 500 °C. Its room-temperature yield strength, ultimate tensile strength, and total elongation were 1045.0 ± 2.6 MPa, 1116.7 ± 2.3 MPa, and 14.3 ± 0.7%, respectively. Relative to the corresponding single-step conditions, the mean yield-strength changes were +41.7, +33.4, and +51.2 MPa for the A800, A900, and A950 series, respectively, while the mean total elongation changed by +0.2, −2.0, and +2.2 percentage points. Thus, the final strength ranking and the paired property changes were not equivalent. The strength increments occurred without a resolvable refinement of the apparent lath or colony scale, and their mechanism was not resolved by the present characterization. At 600 °C, the differences among the mean values were small relative to the measured scatter, and no performance ranking was assigned.
These findings are limited to the investigated specimen geometry, build orientation, heat-treatment schedules, temperatures, and monotonic tensile tests conducted at a nominal strain rate of 1 × 10⁻³ s−1. Because a direct as-built-plus-550 °C condition was not included, the independent effect of the 550 °C treatment and the separate contributions of the two thermal steps were not determined. The results describe only the paired responses of the three pre-annealed conditions to the common subsequent treatment. Quantitative relative density, three-dimensional defect distributions, and the oxygen and nitrogen contents of the consolidated and heat-treated specimens were not measured. Their contributions to the absolute tensile-property levels, experimental scatter, and fracture behavior therefore remain unresolved.
Author Contributions
Conceptualization, X.L. (Xufei Lu); methodology, Y.Z.; formal analysis, S.C.; investigation, Y.Z.; resources, Y.Z.; data curation, S.C.; writing—original draft preparation, Y.Z.; writing—review and editing, X.L. (Xin Lin); visualization, Y.Z.; supervision, X.L. (Xin Lin); project administration, X.L. (Xufei Lu); funding acquisition, X.L. (Xin Lin). All authors have read and agreed to the published version of the manuscript.
Funding
This research was funded by the National Key Research and Development Program of China, grant numbers 2024YFB4608701 and 2023YFB4606401. The funders had no role in the study design; data collection, analysis, or interpretation; preparation of the manuscript; or the decision to publish the results.
Data Availability Statement
The specimen-level tensile data, engineering stress–strain curves, image-based microstructural measurements, and processed EBSD misorientation and boundary-fraction data supporting the findings of this study are available from the corresponding author upon reasonable request. No proprietary restrictions apply to the sharing of these data.
Conflicts of Interest
The original contributions presented in this study are included in the article material. Further inquiries can be directed to the corresponding author.
References
- Donachie, M.J. Titanium: A Technical Guide; ASM International: Almere, The Netherlands, 2000. [Google Scholar]
- Lütjering, G.; Williams, J.C. Titanium, 2nd ed.; Springer: Berlin/Heidelberg, Germany, 2007. [Google Scholar]
- Li, J.; Wang, H.M. Aging response of laser melting deposited Ti-6Al-2Zr-1Mo-1V alloy. Mater. Sci. Eng. A 2013, 560, 193–199. [Google Scholar] [CrossRef] [Scilit]
- Zhu, S.; Yang, H.; Guo, L.G.; Fan, X.G. Effect of cooling rate on microstructure evolution during α/β heat treatment of TA15 titanium alloy. Mater. Charact. 2012, 70, 101–110. [Google Scholar] [CrossRef] [Scilit]
- DebRoy, T.; Wei, H.L.; Zuback, J.S.; Mukherjee, T.; Elmer, J.W.; Milewski, J.O.; Beese, A.M.; Wilson-Heid, A.; De, A.; Zhang, W. Additive manufacturing of metallic components—Process, structure and properties. Prog. Mater. Sci. 2018, 92, 112–224. [Google Scholar] [CrossRef] [Scilit]
- Herzog, D.; Seyda, V.; Wycisk, E.; Emmelmann, C. Additive manufacturing of metals. Acta Mater. 2016, 117, 371–392. [Google Scholar] [CrossRef] [Scilit]
- Cai, C.; Wu, X.; Liu, W.; Zhu, W.; Chen, H.; Qiu, J.C.D.; Sun, C.-N.; Liu, J.; Wei, Q.; Shi, Y. Selective laser melting of near-α titanium alloy Ti-6Al-2Zr-1Mo-1V: Parameter optimization, heat treatment and mechanical performance. J. Mater. Sci. Technol. 2020, 57, 51–64. [Google Scholar] [CrossRef] [Scilit]
- Jiang, J.; Ren, Z.; Ma, Z.; Zhang, T.; Zhang, P.; Zhang, D.Z.; Mao, Z. Mechanical properties and microstructural evolution of TA15 Ti alloy processed by selective laser melting before and after annealing. Mater. Sci. Eng. A 2020, 772, 138742. [Google Scholar] [CrossRef] [Scilit]
- Wu, X.; Zhang, D.; Guo, Y.; Zhang, T.; Liu, Z. Microstructure and mechanical evolution behavior of LPBF-fabricated TA15 alloy. J. Alloys Compd. 2021, 873, 159639. [Google Scholar] [CrossRef] [Scilit]
- Li, S.; Lan, X.; Wang, Z.; Mei, S. Microstructure and mechanical properties of Ti-6.5Al-2Zr-Mo-V alloy processed by laser powder bed fusion and subsequent heat treatments. Addit. Manuf. 2021, 48, 102382. [Google Scholar] [CrossRef] [Scilit]
- Huang, S.; Sun, B.; Guo, S. Microstructure and property evaluation of TA15 titanium alloy fabricated by selective laser melting after heat treatment. Opt. Laser Technol. 2021, 144, 107422. [Google Scholar] [CrossRef] [Scilit]
- Chen, Z.; Shen, S.; Yang, L.; Dai, J.; Li, S.; Xie, Q.; Xie, G. A novel laser continuous powder bed fusion of TA15 titanium alloy: Microstructure and properties. J. Mater. Res. Technol. 2024, 28, 3676–3686. [Google Scholar] [CrossRef] [Scilit]
- Lu, S.; Li, Y.; Zhen, S.; Yu, D.; Zhang, L.; Chen, R.; Wang, Y.; Li, S. Influence of process parameters on the microstructures, residual stresses and mechanical properties of TA15 titanium alloy fabricated by L-PBF. Mater. Sci. Eng. A 2025, 927, 147990. [Google Scholar] [CrossRef] [Scilit]
- Zhang, G.; Lu, X.; Li, J.; Chen, J.; Lin, X.; Wang, M.; Tan, H.; Huang, W. In-situ grain structure control in directed energy deposition of Ti6Al4V. Addit. Manuf. 2022, 55, 102865. [Google Scholar] [CrossRef] [Scilit]
- Ali, H.; Ghadbeigi, H.; Mumtaz, K. Effect of scanning strategies on residual stress and mechanical properties of selective laser melted Ti6Al4V. Mater. Sci. Eng. A 2018, 712, 175–187. [Google Scholar] [CrossRef] [Scilit]
- Denlinger, E.R.; Heigel, J.C.; Michaleris, P.; Palmer, T.A. Effect of inter-layer dwell time on distortion and residual stress in additive manufacturing of titanium and nickel alloys. J. Mater. Process. Technol. 2015, 215, 123–131. [Google Scholar] [CrossRef] [Scilit]
- Lu, X.; Lin, X.; Chiumenti, M.; Cervera, M.; Hu, Y.; Ji, X.; Ma, L.; Yang, H.; Huang, W. Residual stress and distortion of rectangular and S-shaped Ti-6Al-4V parts by directed energy deposition: Modelling and experimental calibration. Addit. Manuf. 2019, 26, 166–179. [Google Scholar] [CrossRef] [Scilit]
- Lu, X.; Zhang, W.; Chiumenti, M.; Cervera, M.; Gillham, B.; Yu, P.; Yin, S.; Lin, X.; Babu, R.P.; Lupoi, R. Crack-free laser powder bed fusion by substrate design. Addit. Manuf. 2022, 59, 103149. [Google Scholar] [CrossRef] [Scilit]
- Zhang, Y.; Li, Z.; Che, S.; Lin, X.; Lu, X. Wall-thickness-dependent microstructural evolution and mechanical response of LPBF-fabricated TA15 titanium alloy: The role of post-solidification cyclic reheating. Materials 2026, 19, 2341. [Google Scholar] [CrossRef] [Scilit] [PubMed]
- Zhang, Y.; Lu, X.; Che, S.; He, J.; Lin, X. Residual stress evolution and post-annealing relaxation in LPBF-fabricated TA15 titanium alloy. Addit. Manuf. Front. 2026, 200354. [Google Scholar] [CrossRef] [Scilit]
- Wang, Q.; Jin, B.; Zhao, L.; Liu, X.; Pan, A.; Ding, X.; Gao, W.; Song, Y.; Zhang, X. Microstructural evolution and mechanical behavior of TA15 titanium alloy fabricated by selective laser melting: Influence of solution treatment and aging. Metals 2023, 13, 1514. [Google Scholar] [CrossRef] [Scilit]
- Ci, S.; Hu, J.; Cheng, Z.; Liu, Q.; Xie, S.; Cai, X.; Dong, D.; Wang, Q. Impact of hot isostatic pressing temperature on tensile properties of TA15 titanium alloy produced via laser powder bed fusion. Coatings 2023, 13, 1742. [Google Scholar] [CrossRef] [Scilit]
- Yang, S.; Sun, Q.; Zhou, S.; Li, W.; Wang, X.; Luo, J.; Zhang, J.; Chen, C.; Qi, J.; Tao, R. Mechanical properties and microstructural evolution of near α titanium alloy TA15 manufactured via laser powder bed fusion before and after heat treatment. Mater. Today Commun. 2025, 46, 112616. [Google Scholar] [CrossRef] [Scilit]
- Liu, Y.; Liu, J.; Zhang, H.; Yang, Y.; Zhu, Y.; Huang, A.; Zhang, K. Martensite decomposition and its effect on mechanical performance in laser powder bed fusion Ti-6.5Al-2Zr-1Mo-1V alloy. Mater. Sci. Eng. A 2025, 937, 148449. [Google Scholar] [CrossRef] [Scilit]
- Shi, R.; Tian, J.; Zheng, D.; Hou, L.; Wang, M.; Wang, J.; Lin, X.; He, F. Microstructure refinement via single-step heat treatment in LPBF-fabricated TA15 alloy for high strength and ductility. J. Mater. Res. Technol. 2026, 42, 8120–8131. [Google Scholar] [CrossRef] [Scilit]
- Zhang, Z.; Lu, S.; Yin, J.; Gao, P.; Zhang, L.; Li, R.; Li, S. Effect of post-heat treatment process on the microstructure and mechanical properties of TA15 titanium alloy fabricated by L-PBF. Metals 2026, 16, 708. [Google Scholar] [CrossRef] [Scilit]
- Wang, C.S.; Li, C.L.; Chen, R.; Qin, H.Z.; Ma, L.; Mei, Q.S.; Zhang, G.D. Multistep low-to-high-temperature heating as a suitable alternative to hot isostatic pressing for improving laser powder-bed fusion-fabricated Ti-6Al-2Zr-1Mo-1V microstructural and mechanical properties. Mater. Sci. Eng. A 2022, 841, 143022. [Google Scholar] [CrossRef] [Scilit]
- Zhang, S.; Zhang, Y.; Zou, Z.; Shi, Y.; Zang, Y. The microstructure and tensile properties of additively manufactured Ti-6Al-2Zr-1Mo-1V with a trimodal microstructure obtained by multiple annealing heat treatment. Mater. Sci. Eng. A 2022, 831, 142241. [Google Scholar] [CrossRef] [Scilit]
- Zhang, Y.; Zhang, S.; Zou, Z.; Shi, Y. Achieving an ideal combination of strength and plasticity in additive manufactured Ti-6.5Al-2Zr-1Mo-1V alloy through the development of tri-modal microstructure. Mater. Sci. Eng. A 2022, 840, 142944. [Google Scholar] [CrossRef] [Scilit]
- Qin, H.Z.; Wang, C.S.; Lei, Y.; Li, C.L. Effect of cyclic heat treatment on microstructure and tensile property of a laser powder-bed fusion-manufactured Ti-6Al-2Zr-1Mo-1V alloy. J. Mater. Res. Technol. 2023, 27, 4032–4042. [Google Scholar] [CrossRef] [Scilit]
- Liu, J.; Li, Y.; Zhu, Y.; Yang, Y.; Zhang, R.; Zhang, Z.; Huang, A.; Zhang, K. Enhancing high-temperature strength and ductility in laser powder bed fusion Ti-6.5Al-2Zr-1Mo-1V alloy via heat treatment optimization. Mater. Sci. Eng. A 2022, 859, 144201. [Google Scholar] [CrossRef] [Scilit]
- Zhang, Y.; Zhai, Z.; Wu, Z.; Lin, W.; Yang, R.; Zhang, Z. Tailoring high-temperature mechanical properties of laser powder bed fusion Ti-6.5Al-2Zr-1Mo-1V alloy via microstructure design. Mater. Des. 2023, 236, 112488. [Google Scholar] [CrossRef] [Scilit]
- Wang, C.; Qin, H.; Ma, L.; Chen, Y.; Li, C. Enhanced tensile properties of laser powder-bed fusion-manufactured TA15 alloy across a wide temperature range. Mater. Sci. Eng. A 2025, 926, 147950. [Google Scholar] [CrossRef] [Scilit]
- Zhou, J.; Su, B.; Zhu, G.; Jin, Y.; Wang, B.; Luo, L.; Chen, R.; Wang, L.; Yang, Q.; Yu, Y.; et al. High-temperature tensile properties of laser powder bed fusion Ti-6.5Al-2Zr-1Mo-1V alloy after annealing. Mater. Sci. Eng. A 2025, 923, 147700. [Google Scholar] [CrossRef] [Scilit]
- Zhou, L.; Xu, P.; Chen, J.; Huang, W.; Li, Z.; Chen, W.; Li, C. Microstructure evolution and high temperature mechanical properties of TA15 alloy fabricated with laser powder bed fusion. J. Alloys Compd. 2025, 1035, 181521. [Google Scholar] [CrossRef] [Scilit]
- Junning, F.; Chen, X.; Zhongxian, M. Analysis of standard GB/T 3620.1-2016: Designation and composition of titanium and titanium alloys. Iron Steel Vanadium Titan. 2022, 43, 192–196. [Google Scholar]
- Wang, M.; Wang, J.; Xian, S.; Zhou, J.; Xu, W.; Guo, J.; Wang, Q.; Lin, X.; Huang, W. Accelerated martensite decomposition in additively manufactured TA15 titanium alloy under thermal cycling. J. Mater. Sci. Technol. 2026, 247, 312–324. [Google Scholar] [CrossRef] [Scilit]
- Xu, W.; Brandt, M.; Sun, S.; Elambasseril, J.; Liu, Q.; Latham, K.; Xia, K.; Qian, M. Additive manufacturing of strong and ductile Ti-6Al-4V by selective laser melting via in-situ martensite decomposition. Acta Mater. 2015, 85, 74–84. [Google Scholar] [CrossRef] [Scilit]
- Aversa, A.; Carrozza, A.; Mercurio, V.; Calignano, F.; Sereda, O.; Pejchal, V.; Lombardi, M. A comparison between the residual stresses of Ti6Al4V and Ti-6Al-2Sn-4Zr-6Mo processed by laser powder bed fusion. Materials 2025, 18, 689. [Google Scholar] [CrossRef] [Scilit] [PubMed]
- Radecka, A.; Coakley, J.; Vorontsov, V.A.; Martin, T.L.; Bagot, P.A.J.; Moody, M.P.; Rugg, D.; Dye, D. Precipitation of the ordered α2 phase in a near-α titanium alloy. Scr. Mater. 2016, 117, 81–85. [Google Scholar] [CrossRef] [Scilit]
- Dear, F.F.; Kontis, P.; Gault, B.; Ilavsky, J.; Rugg, D.; Dye, D. Mechanisms of Ti3Al precipitation in hcp α-Ti. Acta Mater. 2021, 212, 116811. [Google Scholar]

Disclaimer/Publisher’s Note: The statements, opinions and data contained in all publications are solely those of the individual author(s) and contributor(s) and not of MDPI and/or the editor(s). MDPI and/or the editor(s) disclaim responsibility for any injury to people or property resulting from any ideas, methods, instructions or products referred to in the content. |
© 2026 by the authors. Licensee MDPI, Basel, Switzerland. This article is an open access article distributed under the terms and conditions of the Creative Commons Attribution (CC BY) license.