


Abstract
This study investigated how acid concentration affects leaching from pyrolyzed LIBs’ (lithium-ion batteries’) black mass (BM) by stepwise acidification with eight acids at 70 °C under identical starting conditions. A citric-acid control without BM matched the calculated pH, whereas BM buffered solutions to ∼pH 9.5 and increased the measured pH. Stabilized pH provided a consistent reference within each experiment, but similar pH values across acids produced very different leaching efficiencies. At pH ≈ 3, lithium leaching was ∼pH 85% for formic acid and ∼pH 60% for citric acid. The maximum lithium leaching ranged from 49% (ascorbic acid) to 92% (sulfuric acid), while organic acids often showed limited cobalt and nickel dissolution. For formic acid, speciation and metal-formate solubility calculations showed that higher acid concentration does not necessarily increase transition-metal leaching and may suppress cobalt and nickel. Thus, pH is stable within each acid system but not transferable across acids, and high solid loading (250 g L−1) further requires acid-specific evaluation. The results indicate that acid-dependent speciation and complexation, rather than proton concentration alone, control extraction and can decouple acid dosage from leaching performance.
1. Introduction
The extraction of lithium from the black mass (BM) of lithium-ion batteries (LIBs) is currently a critical issue in battery recycling. This challenge arises from the rapidly expanding market for LIBs across various applications, particularly in the mobility sector [1,2]. In recent years, it has become clear that precise predictions of the lithium market are difficult due to price fluctuations closely tied to geopolitical factors [3]. Major lithium resources are concentrated in South America, China, and Australia, where production facilities for lithium salts are primarily located [4,5].
For the European Union, which lacks domestic lithium resources, recycling remains the only sustainable option to secure lithium supplies. While some companies within the EU are actively involved in LIB recycling, large-scale recycling facilities are mainly established in Asia. In Europe, significant challenges include the limited availability of recyclable LIB volumes and the diverse and evolving cell chemistries. These factors make it difficult to develop economically viable recycling processes within Europe [6,7].
An essential parameter for a sustainable hydrometallurgical process is the solid-to-liquid ratio (s/L). The goal is to minimize this ratio to reduce wastewater production [8]. Several studies have investigated different black mass (BM) samples from LIBs, achieving high leaching yields for lithium and cobalt, but often with low s/L ratios. Furthermore, comparing these studies is challenging, as the BM samples originate from different sources, and varying leaching parameters (such as temperature and acid concentration) are used [9]. Additionally, in most studies, 2–4 acids are compared with the same BM, but not eight in the same conditions [7,9,10,11,12,13,14].
In this study, a novel approach was tested to gain a deeper understanding of the behavior of different acids on the same BM system. A total of eight different acids were evaluated on the same BM sample. In each case, the initial conditions were identical, and acid was gradually added in controlled increments. Throughout the experiment, temperature, redox potential, and pH were monitored continuously, with measurements taken every second.
2. Materials and Methods
2.1. Black Mass
The BM used in parts of this study was obtained from an industrial recycler processing end-of-life LIBs from electronic waste. The batch primarily consisted mainly of different types of lithium nickel manganese oxide (NMC) batteries that were pyrolyzed under an inert nitrogen atmosphere, reaching a core temperature of approximately 550 °C and held for 30 min. Mechanical processing included a cutting mill, flip-flop sieve, and overband magnet to separate cell housings. The BM was subsequently sieved to a particle size of less than 1 mm, and a riffle sample divider was used to produce 10–15 kg batches for laboratory use. Before each experiment, the sample container was thoroughly shaken to ensure homogeneity. The BM was characterized using X-ray diffraction (XRD), measured with a MiniFlex 300/600, Rigaku Europe SE, Neu-Isenburg, Germany (150 with K-alpha, analyzed via Match! software, version 3), and by inductively coupled plasma optical emission spectroscopy (ICP-OES) using a Spectro CIROS Vision (Spectro Analytical Instruments GmbH, Kleve, Germany). Sample preparation for ICP-OES was conducted via microwave digestion (Anton Paar GmbH, Ostfildern-Scharnhausen Germany). Here, two samples of around 0.05 g were completely dissolved in 9 ml of reverse aqua regia. The relative error was below 10% of the mean values. The results of the ICP-OES measurements are presented in Table 1. Furthermore, the XRD results are shown in Appendix A (Figure A1). Both indicate that the BM contains more than one cell chemistry, and that the decomposition of the NMC phases was not completed.
Table 1.
ICP-OES results of input BM in mass %.
2.2. Reagents
In this study, a total of eight different acids were tested, as listed in Table 2, along with some of their physical properties [15]. The acids were chosen to demonstrate a wide field of organic and inorganic acids with different protonation states.
Table 2.
Acids used for leaching experiments, with their physical properties of purity, molar mass, density, and pKa values [15].
2.3. Experimental Procedure
Each experiment was performed in the same setup: a four-necked round-bottom flask equipped with a reflux condenser; a mechanical stirrer (IKA-Werke GmbH & Co. KG, 79219 Staufen, Germany, type EUROSTAR 20 digital) with a crescent blade; one electrode for measuring pH, temperature, and redox potential (Mettler Toledo, Greifensee, Switzerland, pH Sensor InPro4260i/SG/425); and an opening for acid addition or sample collection.
At the beginning of each experiment, 280 mL of deionized water and 70.0 g of BM (s/L 1:4) were heated to 70 °C, and the system was stabilized at 70 °C for at least 30 min. First, an initial sample was taken, and then acid was added. Depending on the system, a pre-determined weight or volume of acid was added; these amounts were selected at random. The selection was randomized on the reaction in flask. Especially at the high pH values at the beginning of the experiment, strong reactions happened. Next, the pH curve was monitored in real-time; when the pH value stabilized for at least 30 min, the next sample was taken; then, acid was added again. This procedure was repeated multiple times.
The experiment duration ranged from 4 to 14 h. In a few cases, the experiments ended because of time reasons, but in general the endpoint was when adding acid resulted in a minor change in the pH value. Due to the fact that the experiments were conducted via randomized addition of acid concentration and checking of pH behavior, the solid-to-liquid-ratio was slightly different in each experiment. To reduce the influence of leaching time, the sampling was always delayed after stabilization for at least 30 min, with the stabilization time of the pH value generally being more than one hour between adding new acid and taking a sample. Several studies have demonstrated that a leaching time of around 1 h is long enough [11,16,17,18].
For each sample, 5 mL of the mixture was withdrawn from the flask and transferred to a centrifuge tube. The samples were centrifuged (Hettich Rotina 380, Andreas Hettich GmbH, Tuttlingen, Germany) at 8000 rpm for 5 min. Subsequently, 3 mL of the supernatant was pipetted into a new sample tube and then diluted with 1.5 mL of nitric acid (Merck p.a.) and 25.5 mL of deionized water. These samples were then analyzed using ICP-OES with a Spectro CIROS Vision (Spectro Analytical Instruments GmbH, Kleve, Germany).
To monitor real-time analytical consistency, a control experiment was conducted using citric acid without BM. Initially, citric acid was used, and to become more familiar with the setup here, we performed four experiments. For the other acids, two experiments were preformed, except for succinic acid with one experiment.
2.4. Calculation of pH Value and Leaching Efficiency
The theoretical pH values were calculated with the general formula for weak acids. For the first value of citric acid with a concentration of 0.05 mol/L, the calculation was as follows:
For each pKa value, the pH is calculated with the known acid concentration. Here, for 0.05 mol/L and of citric acid, the value was 2.22, for the it was 3.49, and for it was 4.95. Afterwards, from each pH value, the concentration of hydronium ions was calculated with the following formula:
The results was three hydronium ion concentrations: pH 2.22 = 0.0060 mol/L, pH 3.49 = 0.00032 mol/L, and pH 4.95 = 0.000011 mol/L. These were summed to 0.0063 mol/L, which was calculated with Formula (2) to a theoretical pH value of 2.20. For the other weak acids, the calculation was similar, while for the strong acids only Formula (2) was used. The leaching yield of each metal was calculated by Formula (3) from token samples:
The volume was always corrected when sample volume was taken out or liquid acids were added; represents the mass percentage of each metal from Table 1.
3. Results and Discussion
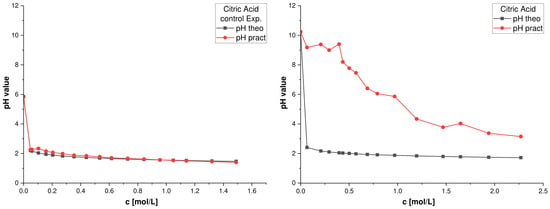
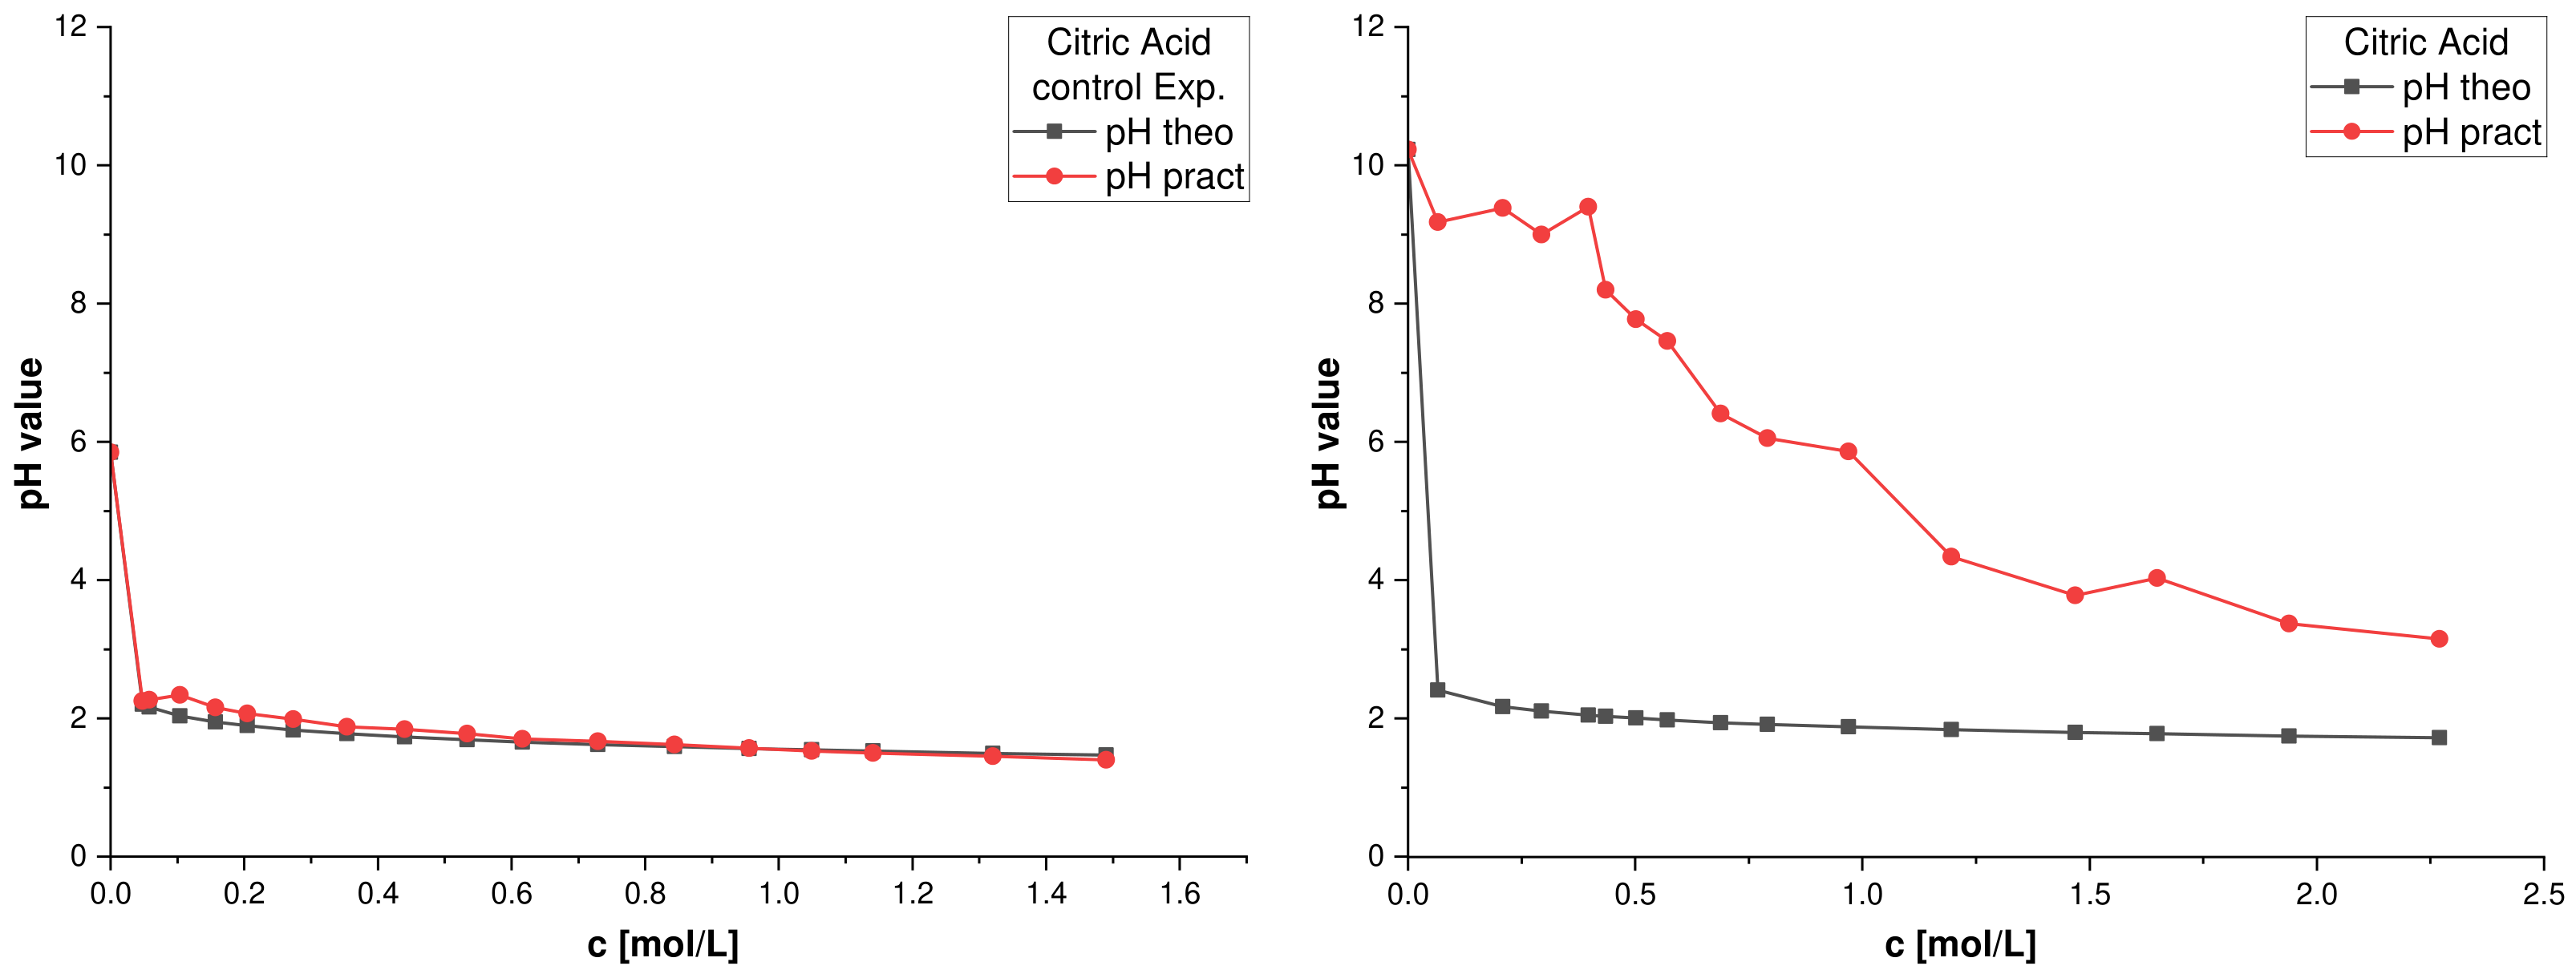
Initially, a control experiment was conducted to assess the similarity between the calculated pH values and the measured pH values. The results of this comparison are presented in Figure 1 on the left-hand side. The largest discrepancy observed was 0.3 at a concentration of 0.1 mol/L. Notably, for higher acid concentrations, the differences were less than 0.05. It is hypothesized that, at lower concentrations, rounding errors in calculations have a more significant impact. However, for the purposes of this study, higher acid concentrations are of primary interest. Consequently, both the experimental setup and calculations have been validated for further experiments.
Figure 1.
The red lines with spherical points show measured pH values, and black lines with square points are the calculated pH values, based on Formulae (1) and (2) and pKa values from Table 2. An example calculation is presented in Section 2.4. (Left) Control experiment with citric acid and without BM. (Right) One experiment with citric acid and BM. The control experiment shows that the calculations and the measured pH values fit with each other. In comparing both experiments, it is clear to see that BM reacted strongly basic with water and consumed some acid.
On the right-hand side of Figure 1, an experiment with citric acid and BM is shown. Here, it is clear to see that BM reacts strongly basic with water up to a pH value of 9.5. Although the thermal treatment did not eliminate all of the NMC material, some portions were disposed of. The lithium species were not detected through XRD analysis; however, various nickel, cobalt, and manganese oxides were identified. Therefore, the presence of lithium oxide can be inferred [19,20,21,22]. Furthermore, lithium oxide reacts with water to form lithium hydroxide [23], which explains the increase in the pH value to 9.5.
In all experiments, these reactions between water and BM took place. In Figure A2, the comparison between theoretical and measured pH values from all other experiments is shown. Furthermore, measured pH values and the difference between theoretical and measured pH values are shown in Figure A5; here, a difference between inorganic acids and organic acids is visible, but there are no other systematic differences. The measured pH value is always higher than the calculated one. This is expected, because the oxides inside the NMC material can be leached with acid. Several studies have researched the kinetics and thermodynamics of reactions with different acids and NMC111 [24,25,26]. Furthermore, one general reaction can be assumed:
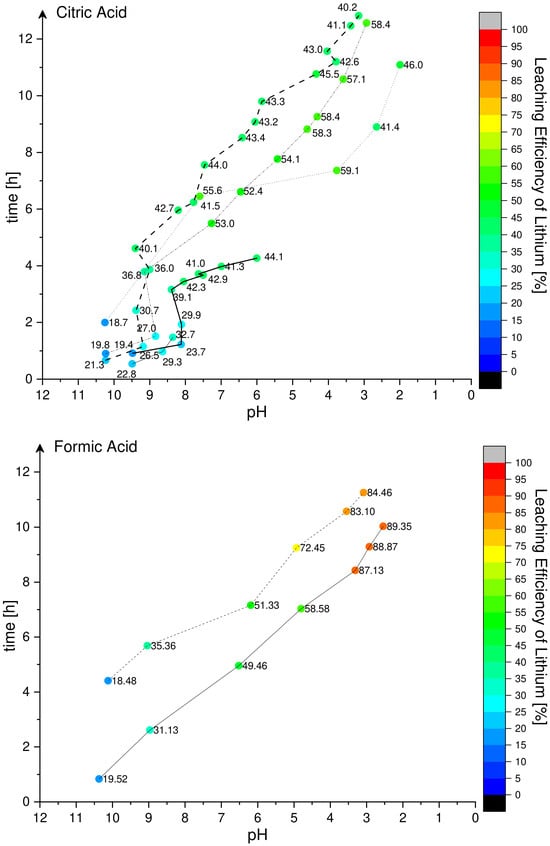
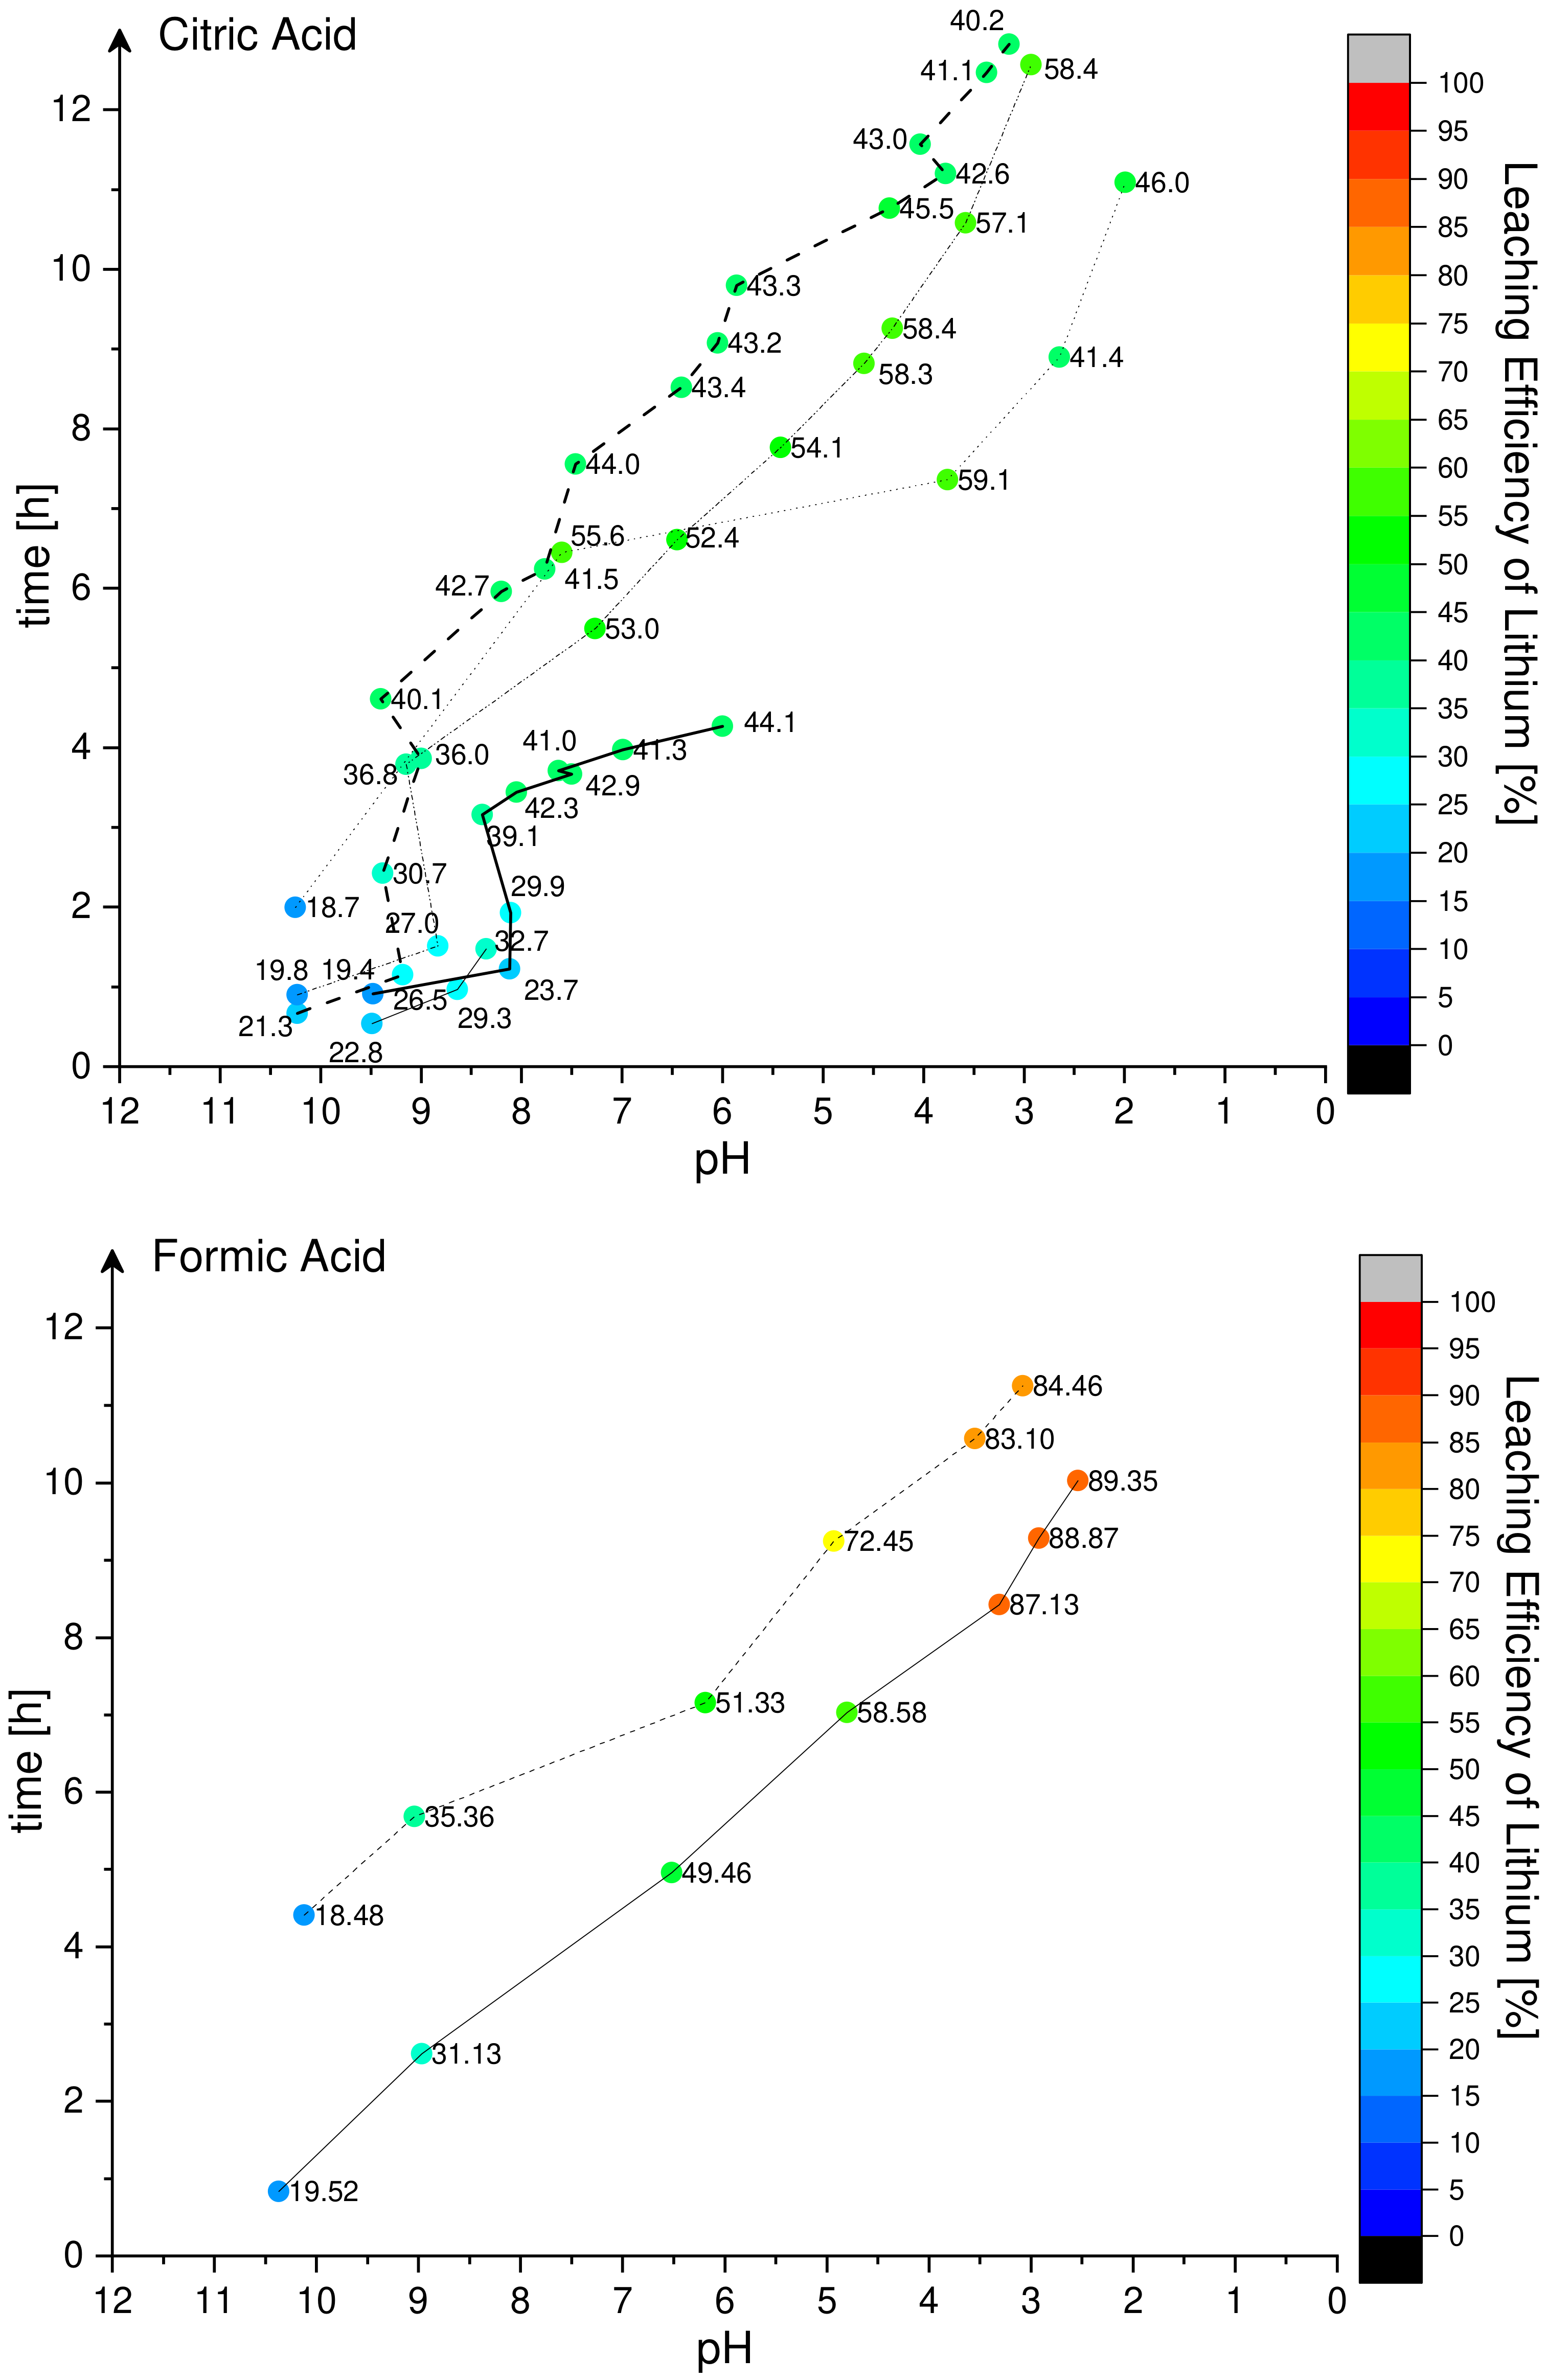
In this system, several different species are detected; however, this general reaction aims to illustrate that acids are consumed through metal ion leaching. Additionally, given that organic acids create equilibrium systems for each metal ion, it becomes challenging to describe every individual chemical reaction. This study focuses on the experimental observation of the overall system by adding various acids to the BM system. One aspect that was investigated was whether, for every pH value, the same leaching efficiency of lithium could be detected. For citric acid (n = 4, Figure 2), leaching remained limited under alkaline conditions (pH ≈ 9–10), with efficiencies not exceeding ∼23%. As the trajectories moved towards neutral and mildly acidic conditions, efficiencies increased markedly, clustering predominantly around ∼50–60% at pH ≥ 6. A limitation of these experiments is that 5 mL of leachate was withdrawn from the system for each sample; consequently, some non-leached BM was taken out, which could not be leached at higher acid concentrations. Therefore, a bit less material was available for leaching, and this could explain the lower leaching rates. The experiments represented by the solid and the dashed trajectories did not exceed ∼45% efficiency, which could be explained by this effect. Notably, at pH ∼3.6, two experiments showed a leaching efficiency of ∼58%, although the leaching times differed by ∼3 h. At the lowest pH values reached, a slight decrease in efficiency was observed in a few instances. This aspect is discussed together with the equilibrium situation in the section addressing the calculation of free anion concentrations.
Figure 2.
Evolution of lithium leaching efficiency during stepwise acidification of LIB material. Citric acid (n = 4 independent experiments). Formic acid (n = 2 independent experiments). All experiments started from identical initial conditions. Acid was added in random steps; after each addition, the slurry was allowed to equilibrate until the pH stabilized, and a sample was then collected for lithium analysis. Markers denote individual sampling points and are colored by lithium leaching efficiency (0–100%; color bar) and annotated with the corresponding efficiency value (%). Grey lines connect consecutive sampling points within the same experiment. Axes show stabilized pH (displayed in decreasing direction from left to right) and elapsed time since the start of the experiment.
Formic acid (n = 2, Figure 2) exhibited the same qualitative behavior—higher efficiencies at lower stabilized pH—but achieved substantially higher absolute leaching performance over the investigated range. In the most acidic regime assessed, efficiencies approached ∼80–90%, exceeding those observed for citric acid at comparable pH values. One noteworthy observation is that, at a pH of approximately 5, longer leaching times led to higher lithium extraction efficiencies, whereas the opposite trend was observed in the pH range 3.5–2.5. Although the overall leaching extent increases with decreasing pH, the influence of leaching duration depends strongly on the pH condition; a longer residence time does not necessarily translate into higher efficiency at more acidic pH values.
For the other acids, these kinds of graph are shown in Appendix A (Figure A3). The correlation between redox potential and leaching efficiency is shown in Appendix A (Figure A4). Here, no clear trend could be detected. The summary of leaching results in correlation to the pH value is presented in Table 3. This table lists, for each acid, the samples that achieved the highest lithium leaching efficiencies. In this study, the effect of leaching time turned out to be less important than the effect of the solution pH; therefore, the time-dependent aspect is not discussed further. The reason for this omission is a gap in the experimental data: the leaching experiments were not performed under comparable time conditions, precluding a reliable assessment of the influence of time. A correlation between pH value and leaching efficiency was not detected by comparing the different acids with each other. When using similar pH values and the same acid, the difference in the leaching efficiency was not significant. Because the addition of acid in each experiment was random, not all samples are comparable to one another, but some points with similar pH value from different experiments were detected and are compared in Table A1. Here, mostly differences lower than 5% were detected, while at some points the difference was higher. Nevertheless, between experiments with the same acid used, the same leaching tendencies were detected. Acetic acid shows a higher leaching efficiency than citric acid for lithium, cobalt, and manganese, even though the pH of the acetic-acid solution is 4.3 and that of the citric-acid solution is 3.73. Succinic acid and lactic acid have very similar pH values (≈3.8) and comparable lithium leaching efficiencies (≈71%), but their cobalt and manganese leaching efficiencies differ by more than 15 percentage points. Ascorbic acid yielded the lowest leaching results for lithium, yet it showed relatively high results for cobalt compared with the other acids. Although the ascorbic-acid solution has a comparatively high pH, its solubility at 70 °C is limited to a theoretical maximum of 4.1 mol L−1, and a concentration of 3.36 mol L−1 was already reached [27].
Table 3.
Highest reached lithium leaching efficiency for the different acids.
Hydrochloric acid and sulfuric acid were used as inorganic acids. Sulfuric acid, which has been investigated in several publications, shows the expected behavior when no additional redox agent (e.g., hydrogen peroxide) is present [17]. Under these conditions, high leaching efficiencies were obtained for lithium and manganese, whereas the efficiencies for nickel and cobalt were comparatively lower. A similar gap between lithium and manganese compared to cobalt and nickel was detected by formic acid. The difference was quite high, and for formic acid the effects of anion concentration and equilibrium situation will be discussed and calculated in detail.
Consequently, some initial data is available. The pH was measured and the acid concentration was known. Moreover, the pKa of formic acid is 3.75. Data points from one of the formic-acid experiments are now compared. The experimental conditions and the leaching results are listed in Table 4.
Table 4.
Data points from one experiment with formic acid.
First, the Henderson–Hasselbalch equation was applied to calculate the ratio of dissociated to undissociated formic acid. To illustrate this calculation, the values from a single experimental point were inserted into the equation:
Then, the total balances were used:
Thus, the concentration of undissociated formic acid at equilibrium was determined, and by applying Equation (5), the concentration of formate was calculated, yielding 1.29 mol L−1 for this particular case. For each metal ion, the solubility product (Ksp) of its formate salt is reported in the literature. Table 5 presents these Ksp values for the metal ions of interest [15]. By combining the reported Ksp values with the corresponding molar masses and the relevant dissolution reactions, the equilibrium constant for each species can be calculated. An example for an alkali-metal ion is presented in Equation (7), and an example for a transition-metal ion is presented in Equation (8):
Table 5.
Literature data and calculated solubility data for Li, Co, Mn, and Ni species [15].
Table 5 summarizes the results for the investigated species. In cases where solubility data for the anhydrous formate were unavailable, the values for the corresponding hydrated formate were employed in the calculations.
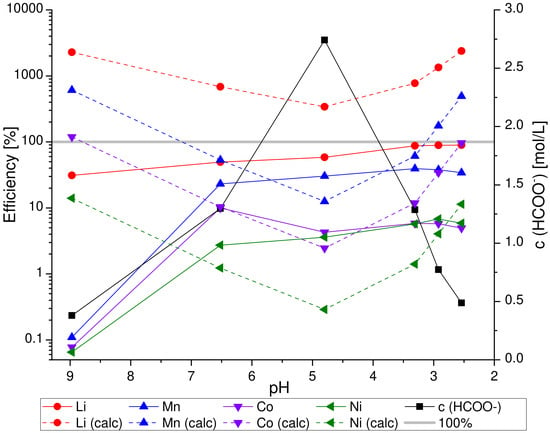
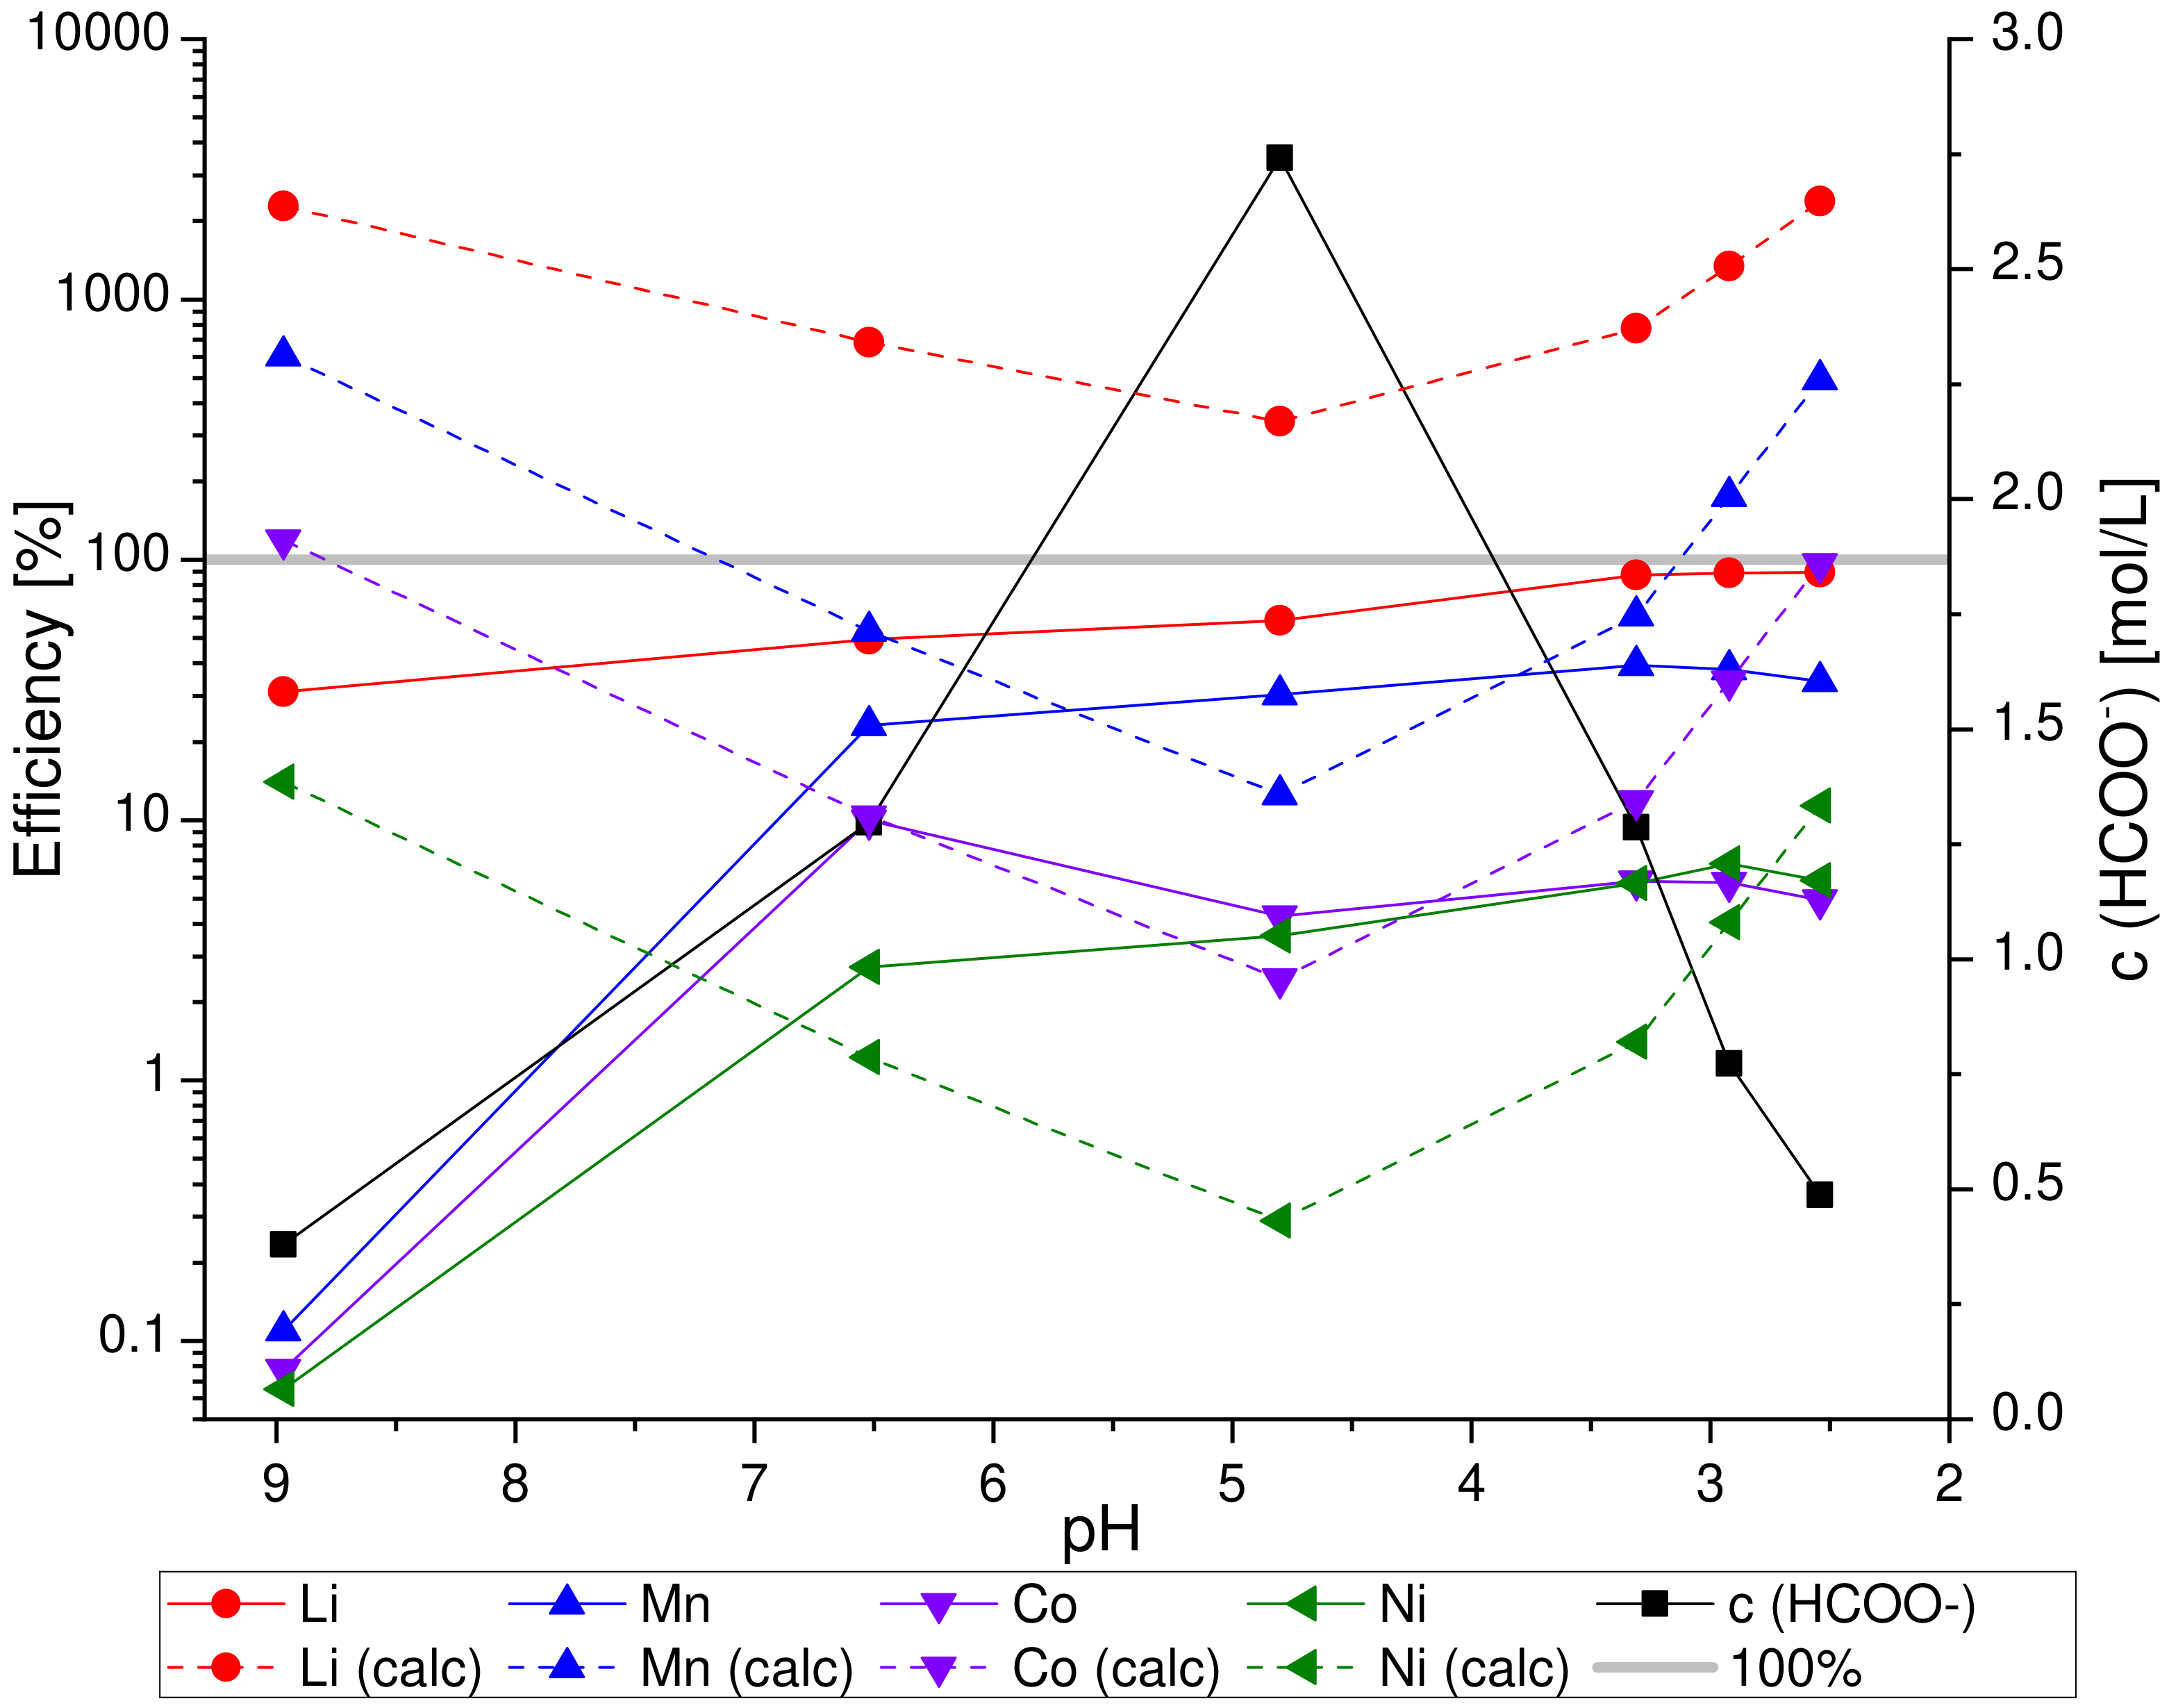
Using the concentration of formate determined from Equation (5), the maximum concentration of metal ions that can remain in solution before precipitation begins can be calculated. In addition, the experimental measurements of mass, volume, and elemental composition of the black-mass sample enable the determination of the theoretical maximum leaching efficiency through Equation (3). Figure 3 compares the experimental results with the theoretical predictions for the experiment. The theoretical values exceed 100%, which should be interpreted as indicating that the entire amount of the target species remains in solution and no precipitation occurs. In the calculations, solubility data for 25 °C were used, but the experiments were performed at 70 °C. Normally, the solubility increases with temperature; therefore, the calculated data have a gap, and it is expected that they should be higher. We were unable to find any solubility data for 70 °C in the literature. Nevertheless, the correlation between formate concentration and solubility is demonstrated in Figure 3.
Figure 3.
First, the concentration of formate in equilibrium was calculated with Formulae (5) and (6). Using the formate concentration and the solubility products from Table 5 via Formula (7) for lithium and Formula (8) for the other metals, the theoretical maximum efficiencies were calculated. The calculated and measured efficiencies are plotted on the left-hand y axis. The calculated theoretical maximum efficiencies are shown with dotted lines, whereas the measured efficiencies are shown with solid lines. Because the calculated values exceed 100%—which should be interpreted as indicating that the entire amount of the target species remains in solution and no precipitation occurs—the scale is logarithmic. On the right-hand y axis, the calculated concentration of formate is displayed as a black solid line with cubic markers. Both plots share the pH value on the horizontal (x) axis; the experimental scale runs in reverse, from higher to lower pH values.
Figure 3 compares the calculated data (calc) with the measured results and reveals three distinct regions: The first region has a low acid concentration and a high pH. Only one data point is available, at pH 9. The measured efficiency is much lower than the calculated value. The calculation assumes a pure system, but the benchmark material contains oxidized metal ions (see the XRD data Figure A1). Consequently, an acidic matrix is required to dissolve the metal oxides, which explains the discrepancy. In the second region, between pH 6.5 and 3, all measured efficiencies continue to increase, while the calculated efficiencies decline as the formate concentration rises. In the third region, from pH 3 down to 2.5, the measured efficiencies for cobalt, nickel, and manganese ions drop, although the calculated efficiencies increase again in this interval. Here, the trends of the measured and calculated values are similar in the two regions, but they are shifted relative to each other. The shift can be explained by an inaccurate calculation of the formate equilibrium. Several simplifications were made, such as neglecting precipitation of species and considering only the main components of the system. In an actual industrial benchmark material, additional contaminants are present that were not detected. The main conclusion is that, beyond a certain point, increasing the acid concentration does not lead to higher leaching efficiency. Some of the literature reports opposite effects—that with formic acid and without the addition of hydrogen peroxide, at least lithium, manganese, and cobalt could be leached near to 100% [28], and with the use of oxidation agents cobalt was leached as well [28,29]. Other studies have employed formic acid for selective leaching [30,31]. The observed behavior is strongly dependent on the experimental parameters. In addition to acid concentration, the s/L strongly influences the outcome. In the present work, a relatively high solid loading (250 g L−1) was used; although the s/L changed during the experiment, the ratio did not exceed 1:5. Here, we compare the results for acetic acid, where a volume of 344 ml was achieved; by simplifying the amount of BM to 70 g, the s/L was still 1:4.9, (see Table A1). In the literature, s/L values from 1:20 (14 g to 280 mL) up to 1:50 (5.6 g to 280 mL) were primarily used; compared with this study, the solid loading was still high [18,32], which affects the system dynamics and explains the differences with the cited studies. This high solid concentration also brings the experimental results closer to the theoretical predictions discussed earlier. For the other organic acids, the calculations become too complex when more than one protonation level (i.e., citric acid) is involved or when insufficient experimental data is available. For inorganic acids, pKa values and solubilities are not relevant because they dissociate completely and their salts are highly soluble.
4. Conclusions
The leaching behavior is strongly governed by the nature of the acid. In every case, the black-mass matrix initially buffers the acid solution, causing the measured pH to differ from the theoretical value of the pure acid. Even under comparable experimental conditions and at similar pH values, the efficiencies of different acids diverge markedly: at pH ≈ 3, the lithium-leaching efficiency is ≈85% with formic acid but only ≈60% with citric acid (Figure 2). This pronounced gap shows that acid speciation and complexation effects—beyond simple proton concentration—play a decisive role. Using formic acid as an example, calculations based on the Henderson–Hasselbalch equation and solubility constants, together with the experimental data, demonstrate that adding more acid does not necessarily increase leaching efficiencies, especially for transition metals when organic acids are employed. These effects are highly correlated with the solid-to-liquid ratio; for formic acid, a parameter window exists in which cobalt and nickel are not leached, whereas other conditions allow for the leaching of all metal ions. Consequently, each acid system must be investigated individually, because the leaching behavior can change drastically with variations in the solid-to-liquid ratio.
Author Contributions
Conceptualization, M.K.; Methodology, M.K.; Validation, M.K. and K.S.; Formal Analysis, M.K. and K.S.; Investigation, M.K.; Resources, K.S.; Data Curation, M.K.; Writing—Original Draft Preparation, M.K.; Writing—Review and Editing, M.K., K.S. and B.F.; Visualization, M.K. and K.S.; Supervision, B.F.; Project Administration, B.F. All authors have read and agreed to the published version of the manuscript.
Funding
This research received no external funding.
Data Availability Statement
The original contributions presented in the study are included in the article. Further inquiries can be directed to the corresponding author.
Acknowledgments
We thank Wei Song for designing the digitalization setup.
Conflicts of Interest
The authors declare no conflicts of interest.
Abbreviations
The following abbreviations are used in this manuscript:
| BM | Black Mass |
| LIBs | Lithium-Ion Batteries |
| XRD | X-Ray Diffraction |
| ICP-OES | Inductively Coupled Plasma Optical Emission Spectroscopy |
| s/L | Solid-to-Liquid Ratio |
Appendix A
Figure A1.
XRD results of input BM.
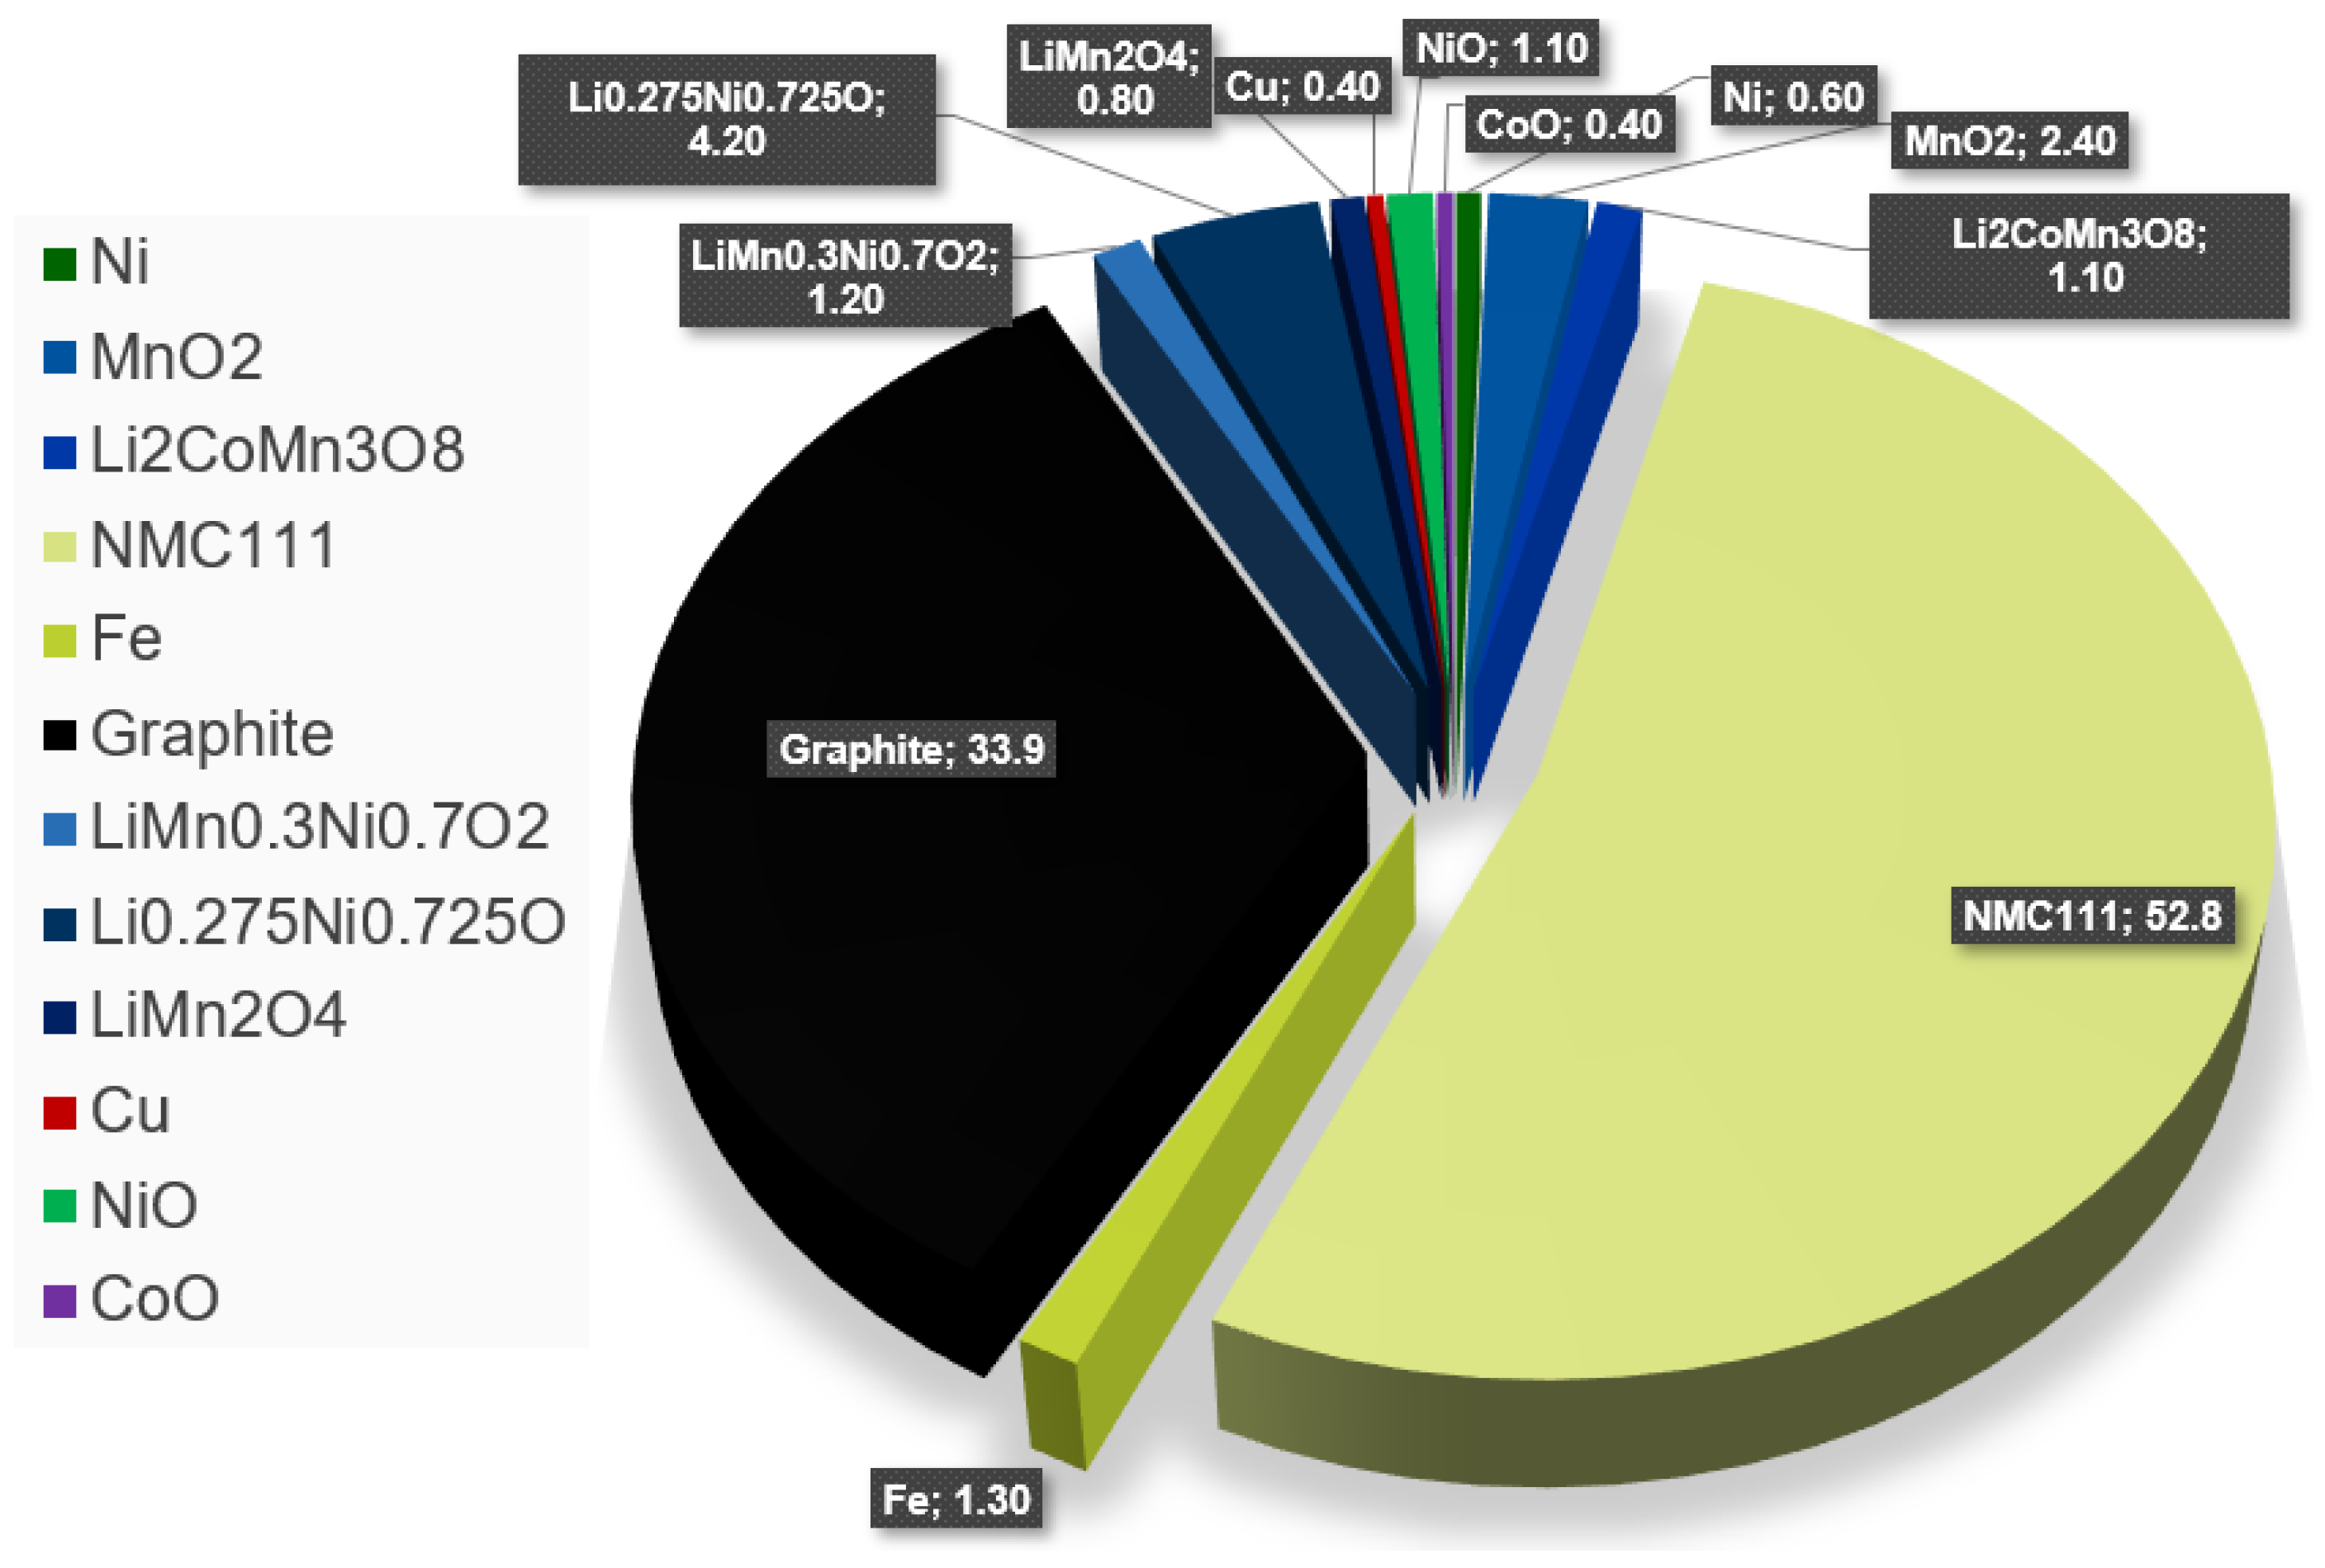
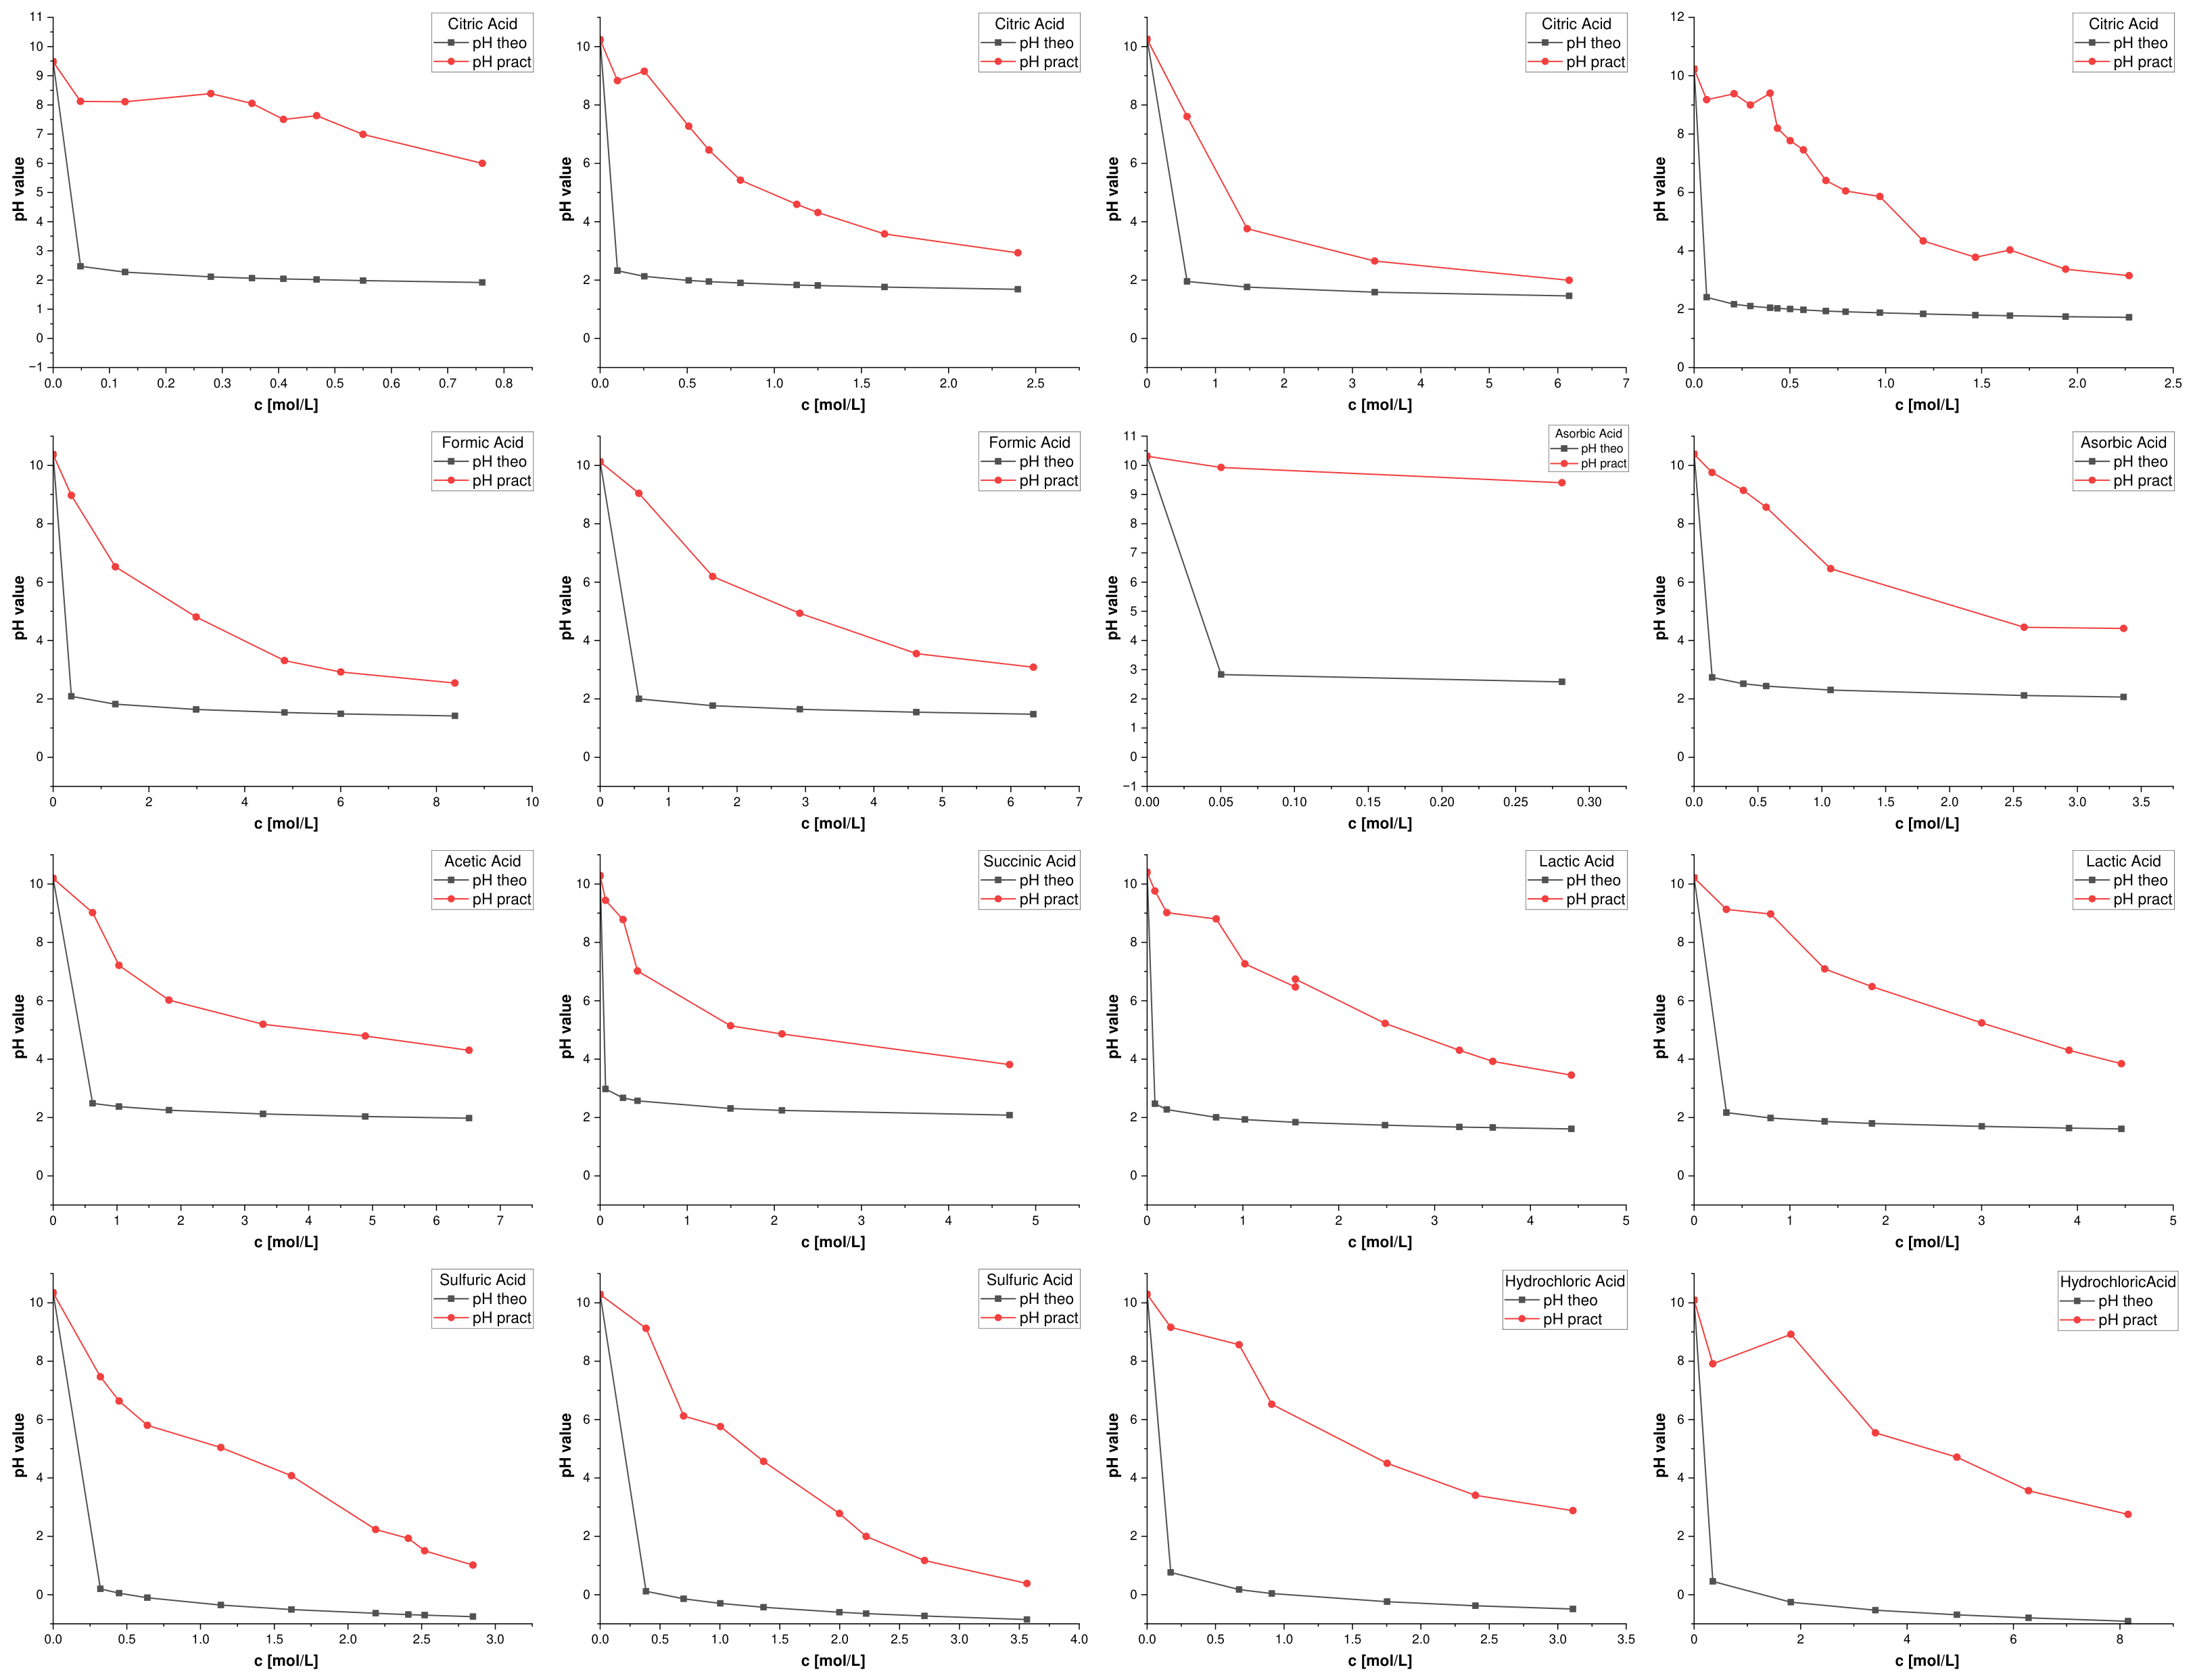
Figure A3.
Evolution of lithium leaching efficiency during stepwise acidification of LIB material. All experiments started from identical initial conditions. Acid was added in random steps; after each addition, the slurry was allowed to equilibrate until the pH stabilized, and a sample was then collected for lithium analysis. Markers denote individual sampling points and are colored by lithium leaching efficiency (0–100%; color bar) and annotated with the corresponding efficiency value (%). Gray lines connect consecutive sampling points within the same experiment. Axes show stabilized pH (displayed in decreasing direction from left to right) and elapsed time since the start of the experiment.
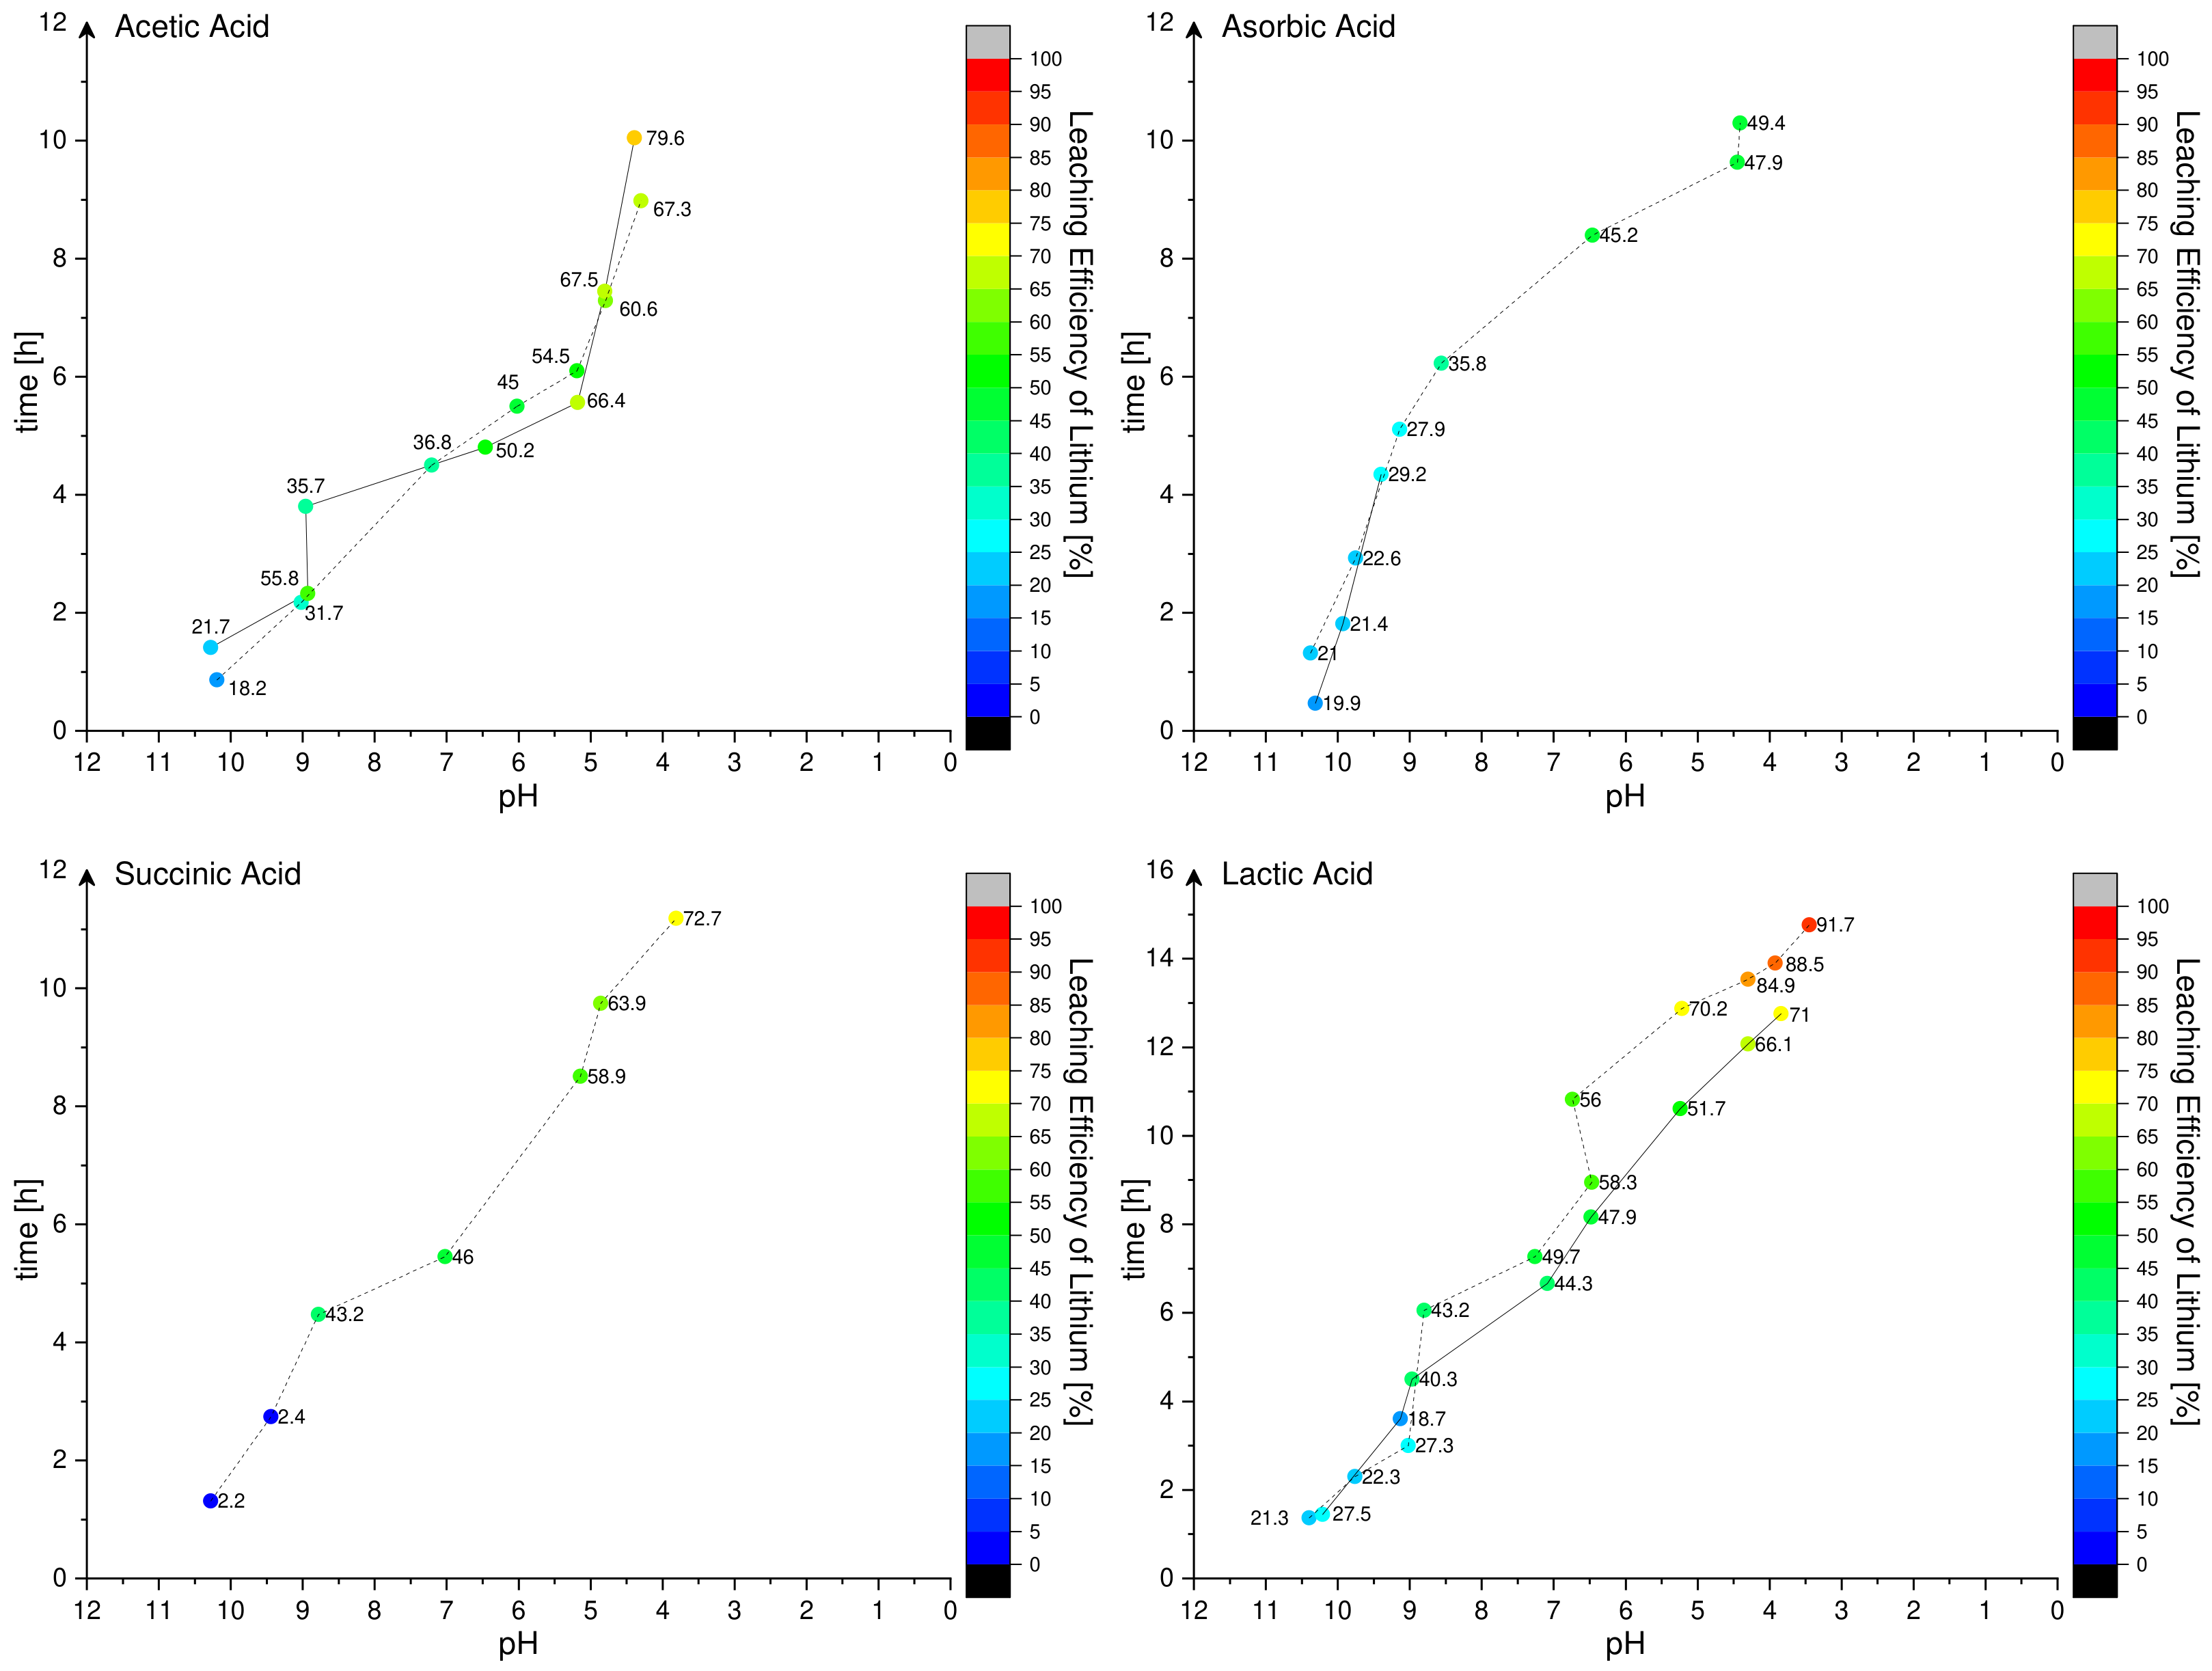
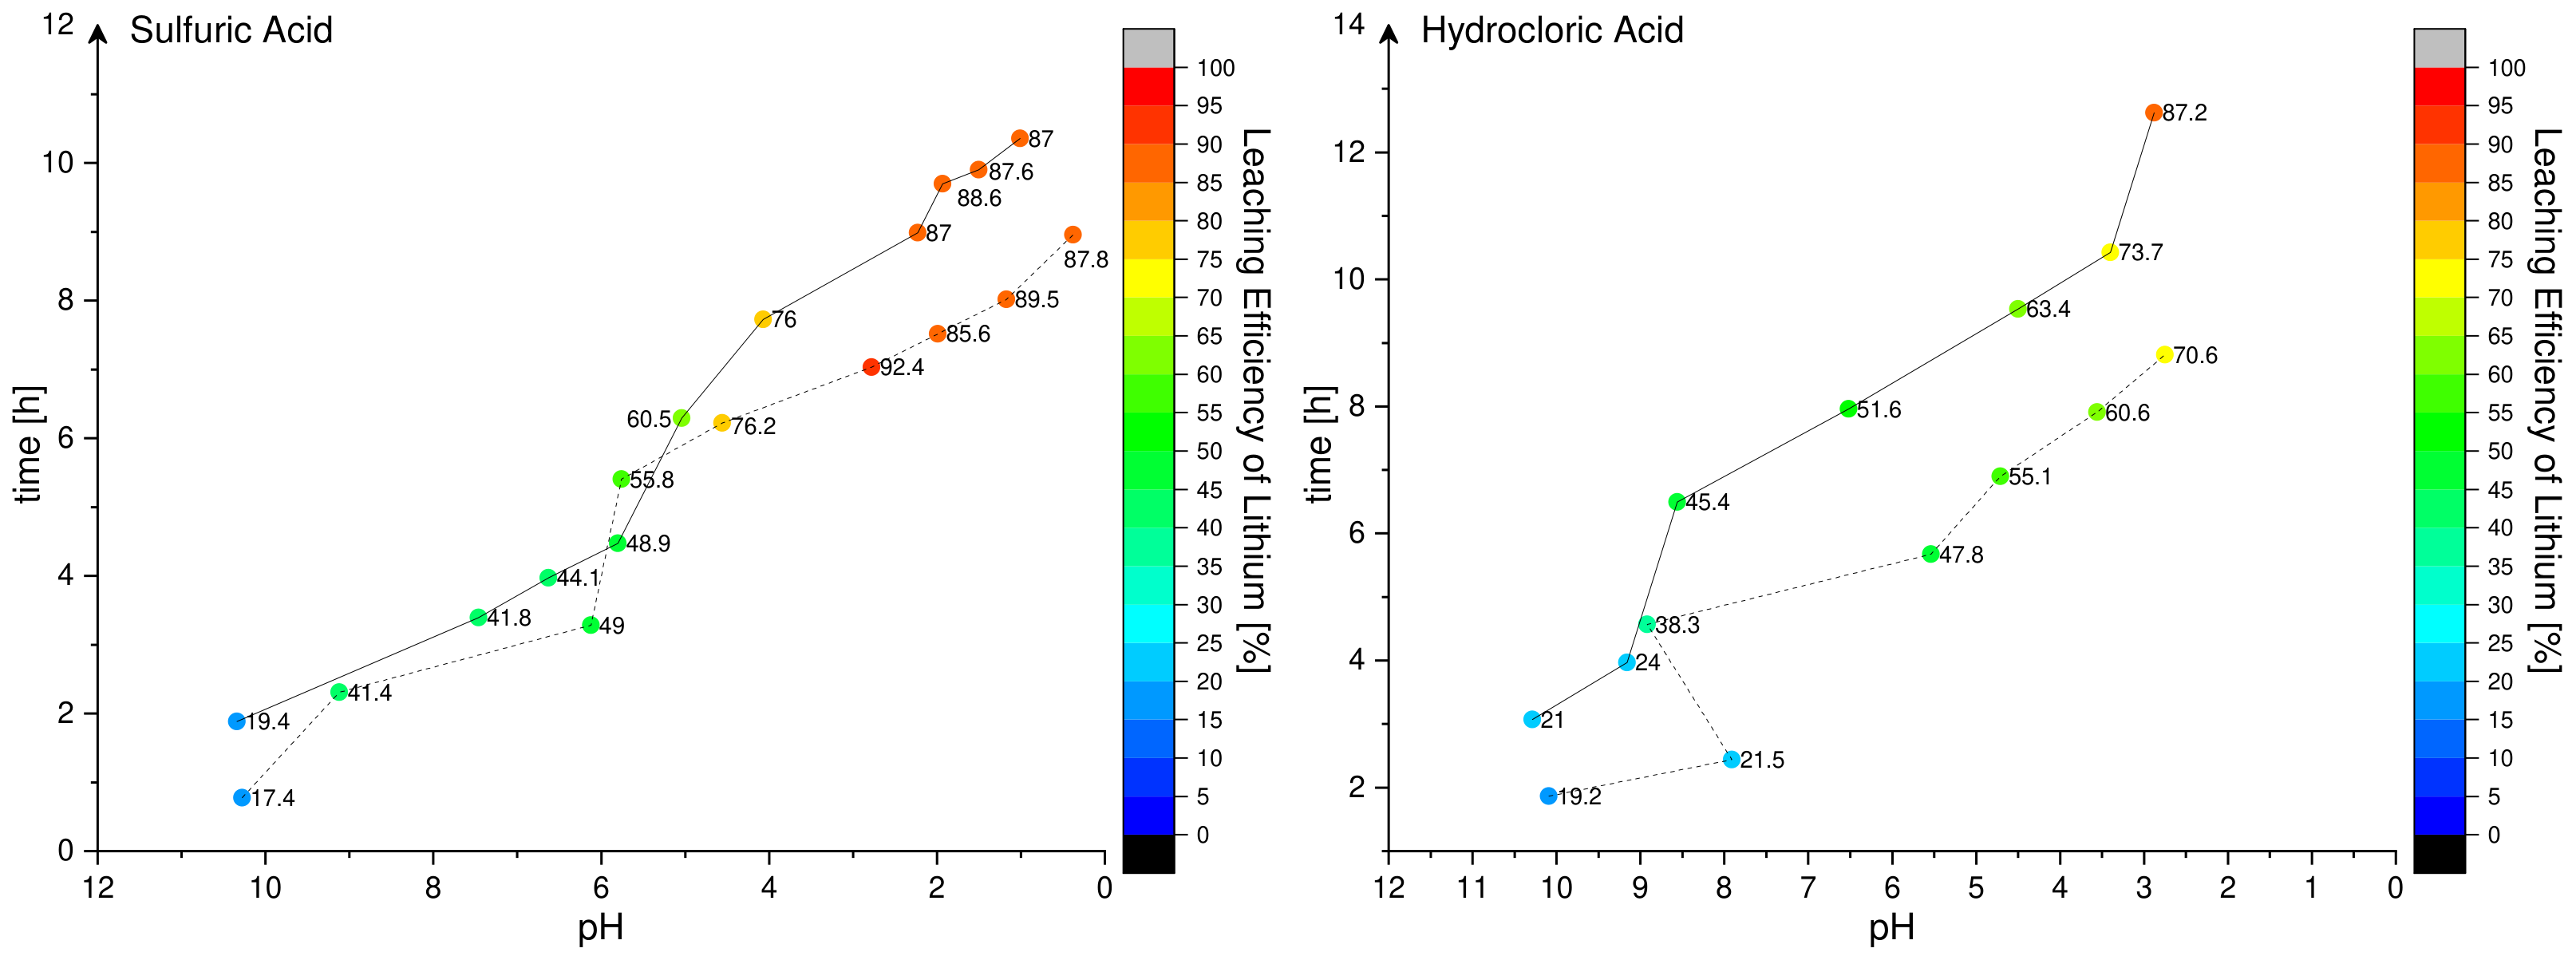
Figure A4.
For each acid, redox potential (ORP) is plotted against the leaching efficiency of each sample. Clear tendencies are neither detectable inside one acid system nor by comparing all acid systems with each other.
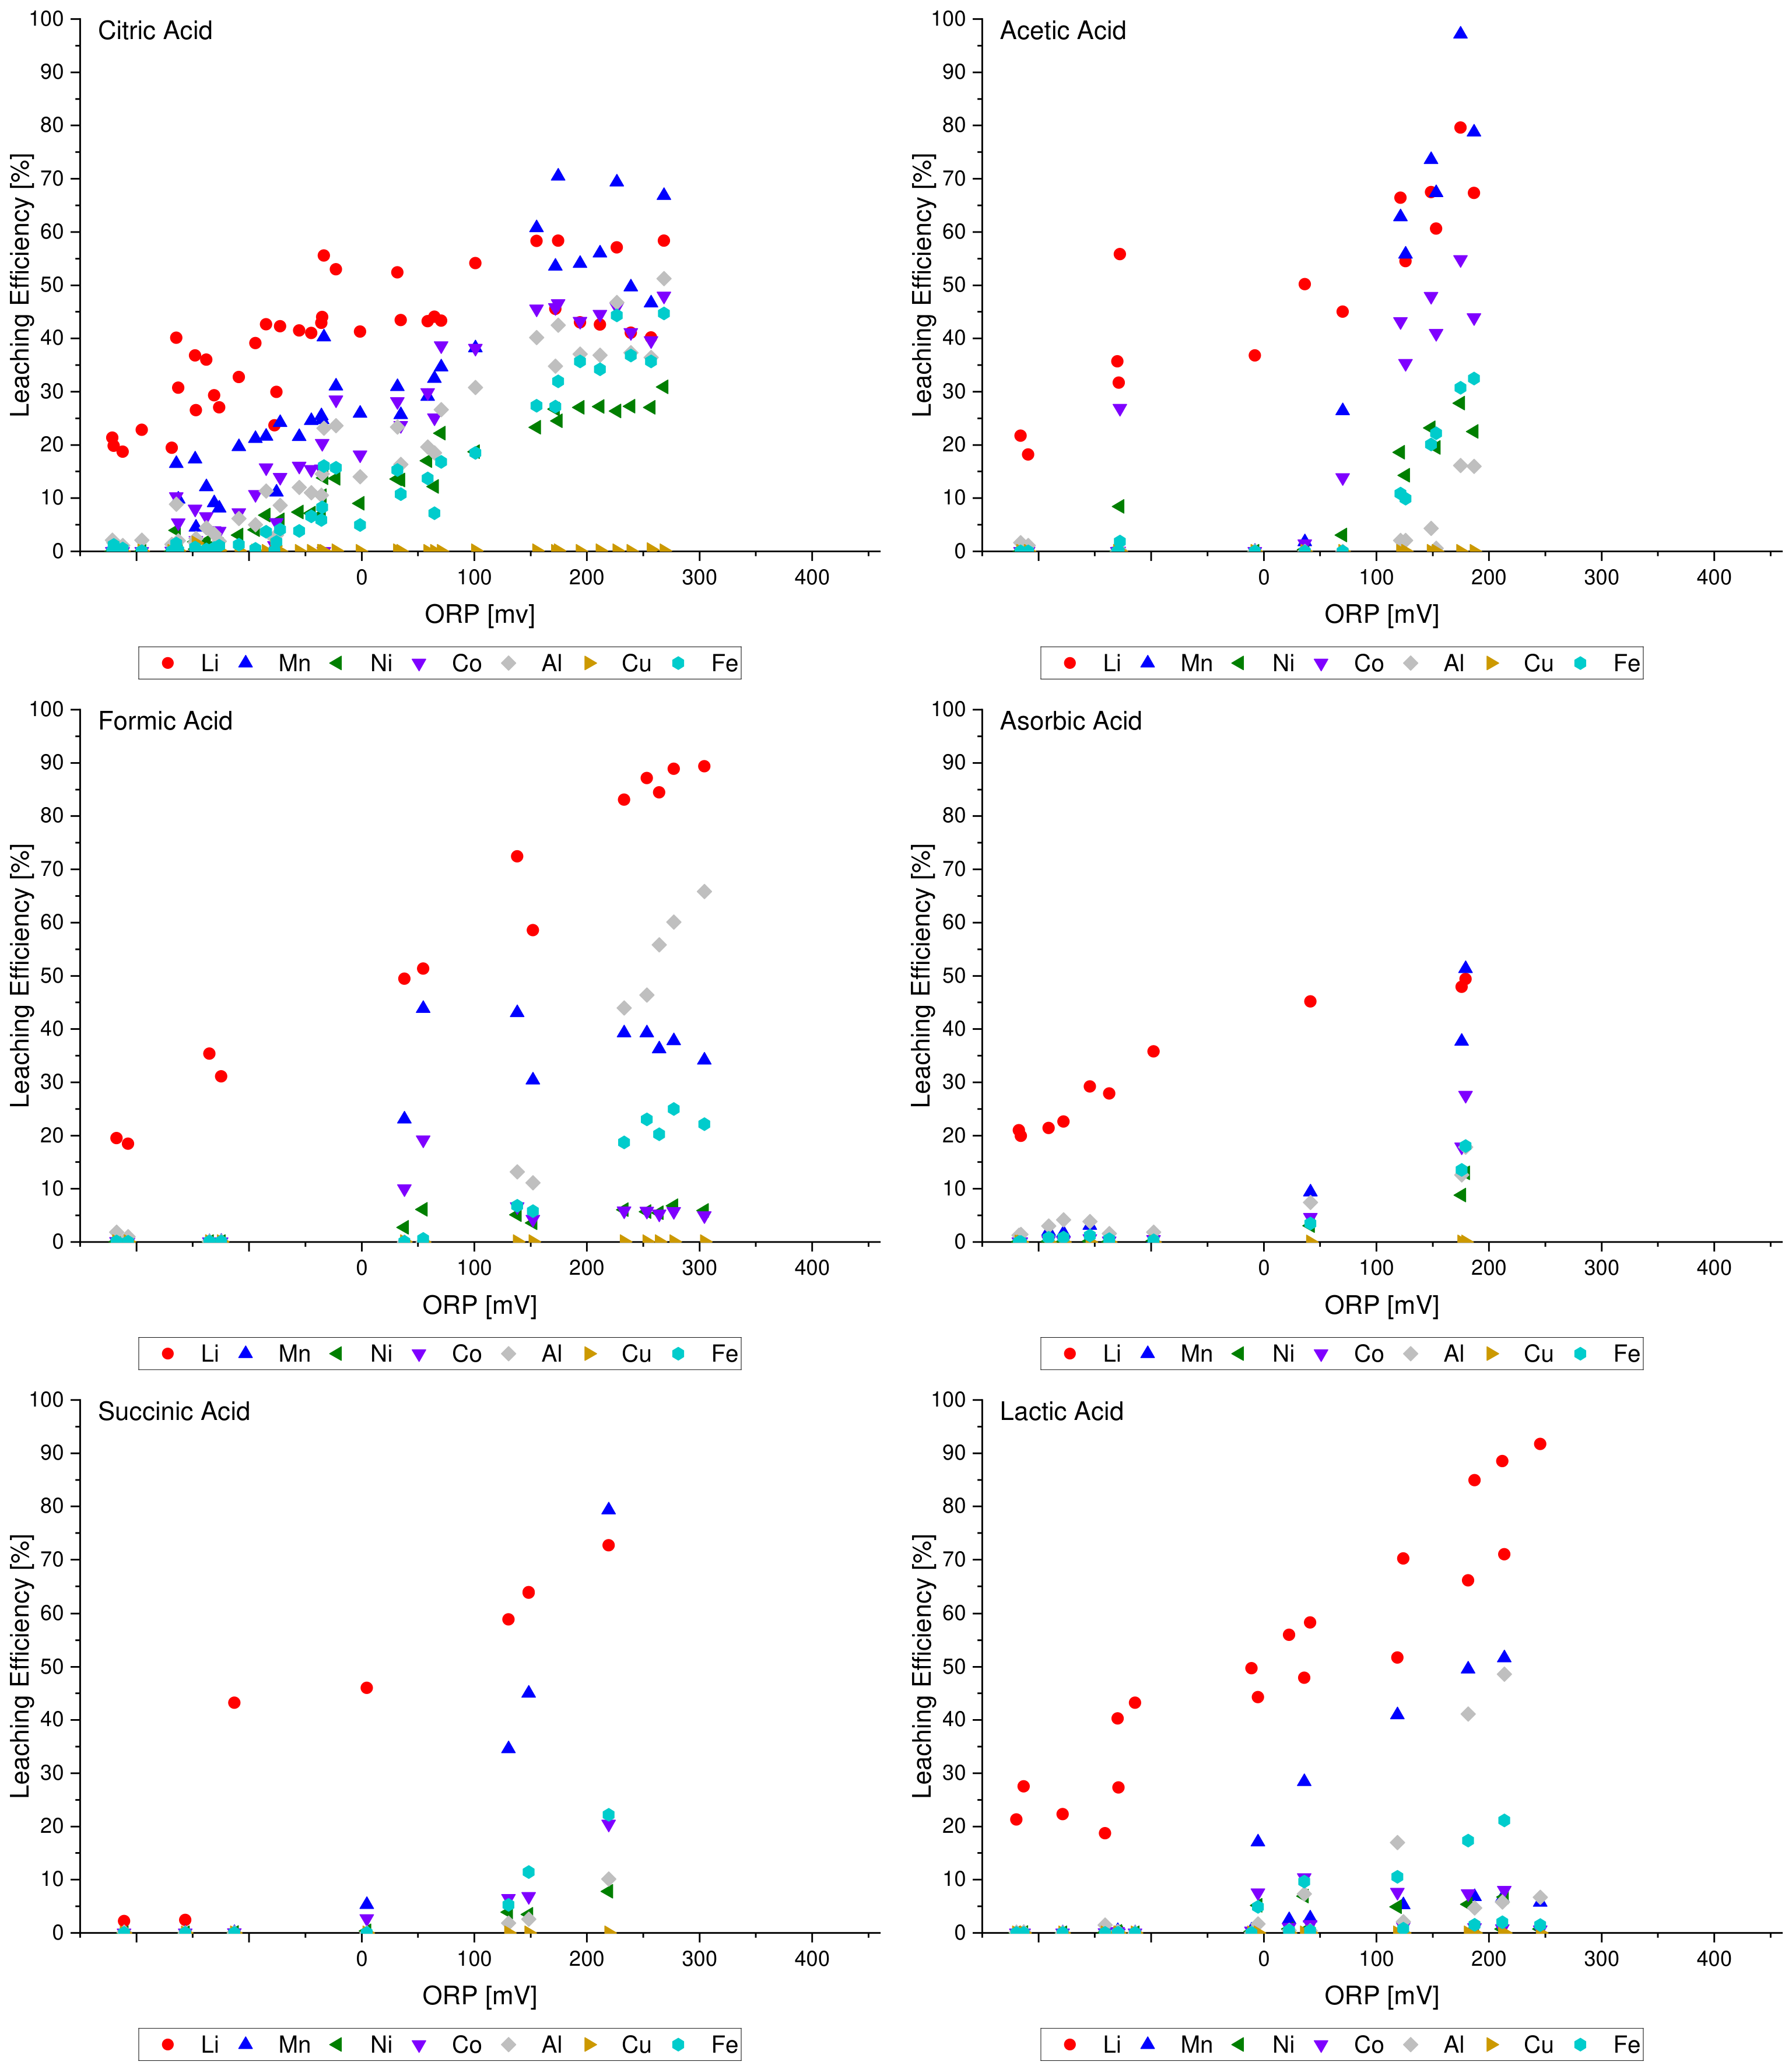
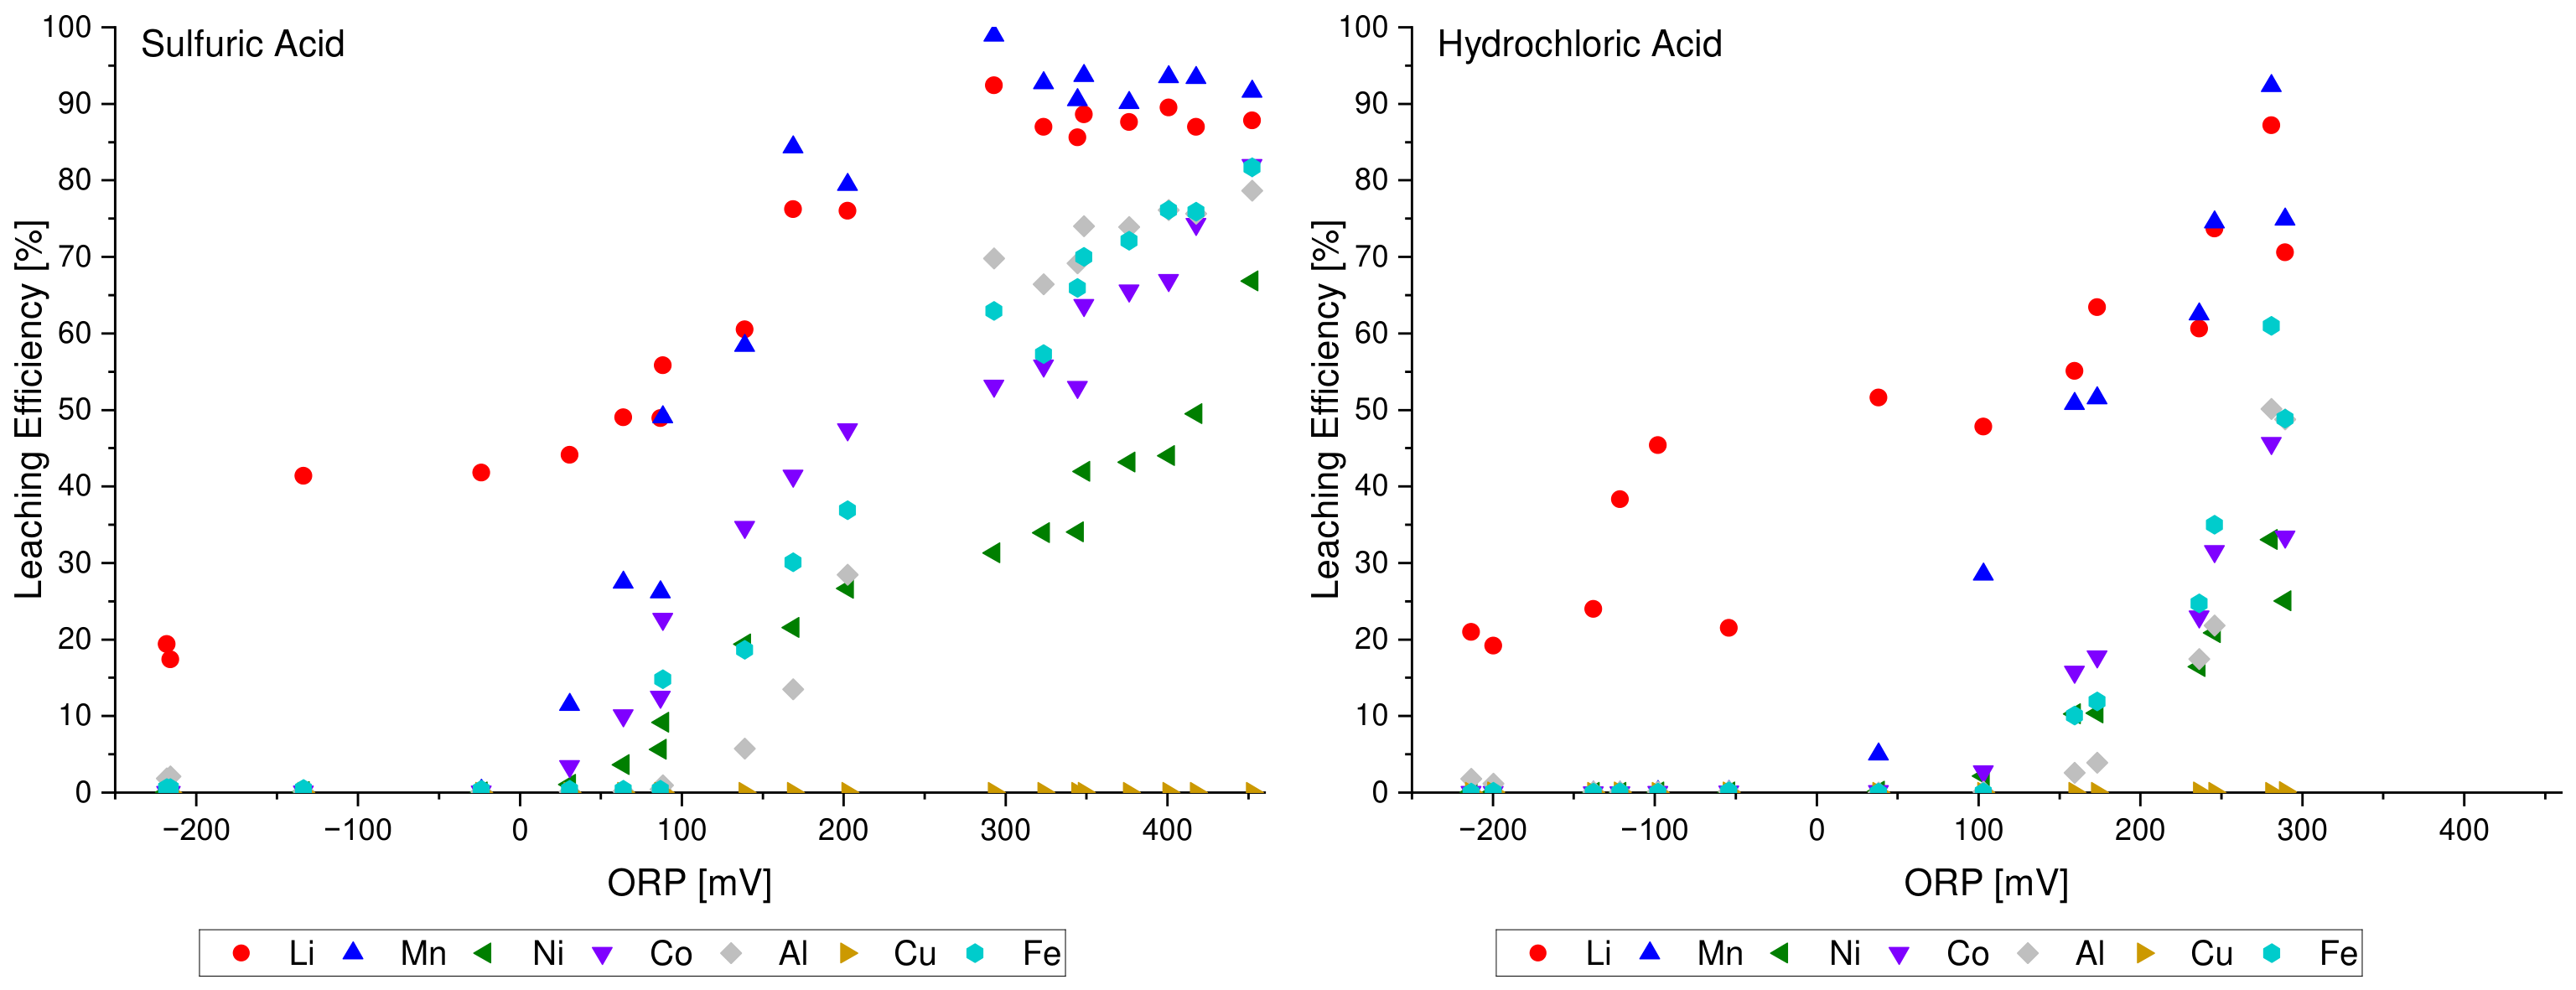
Figure A5.
For each acid the measured pH value is plotted together with the deviation between the measured and the theoretical pH. This deviation is larger for inorganic acids than for organic acids. At high pH values, the data points do not follow a systematic trend. Below pH 9, however, the points for each acid display an approximately linear correlation.
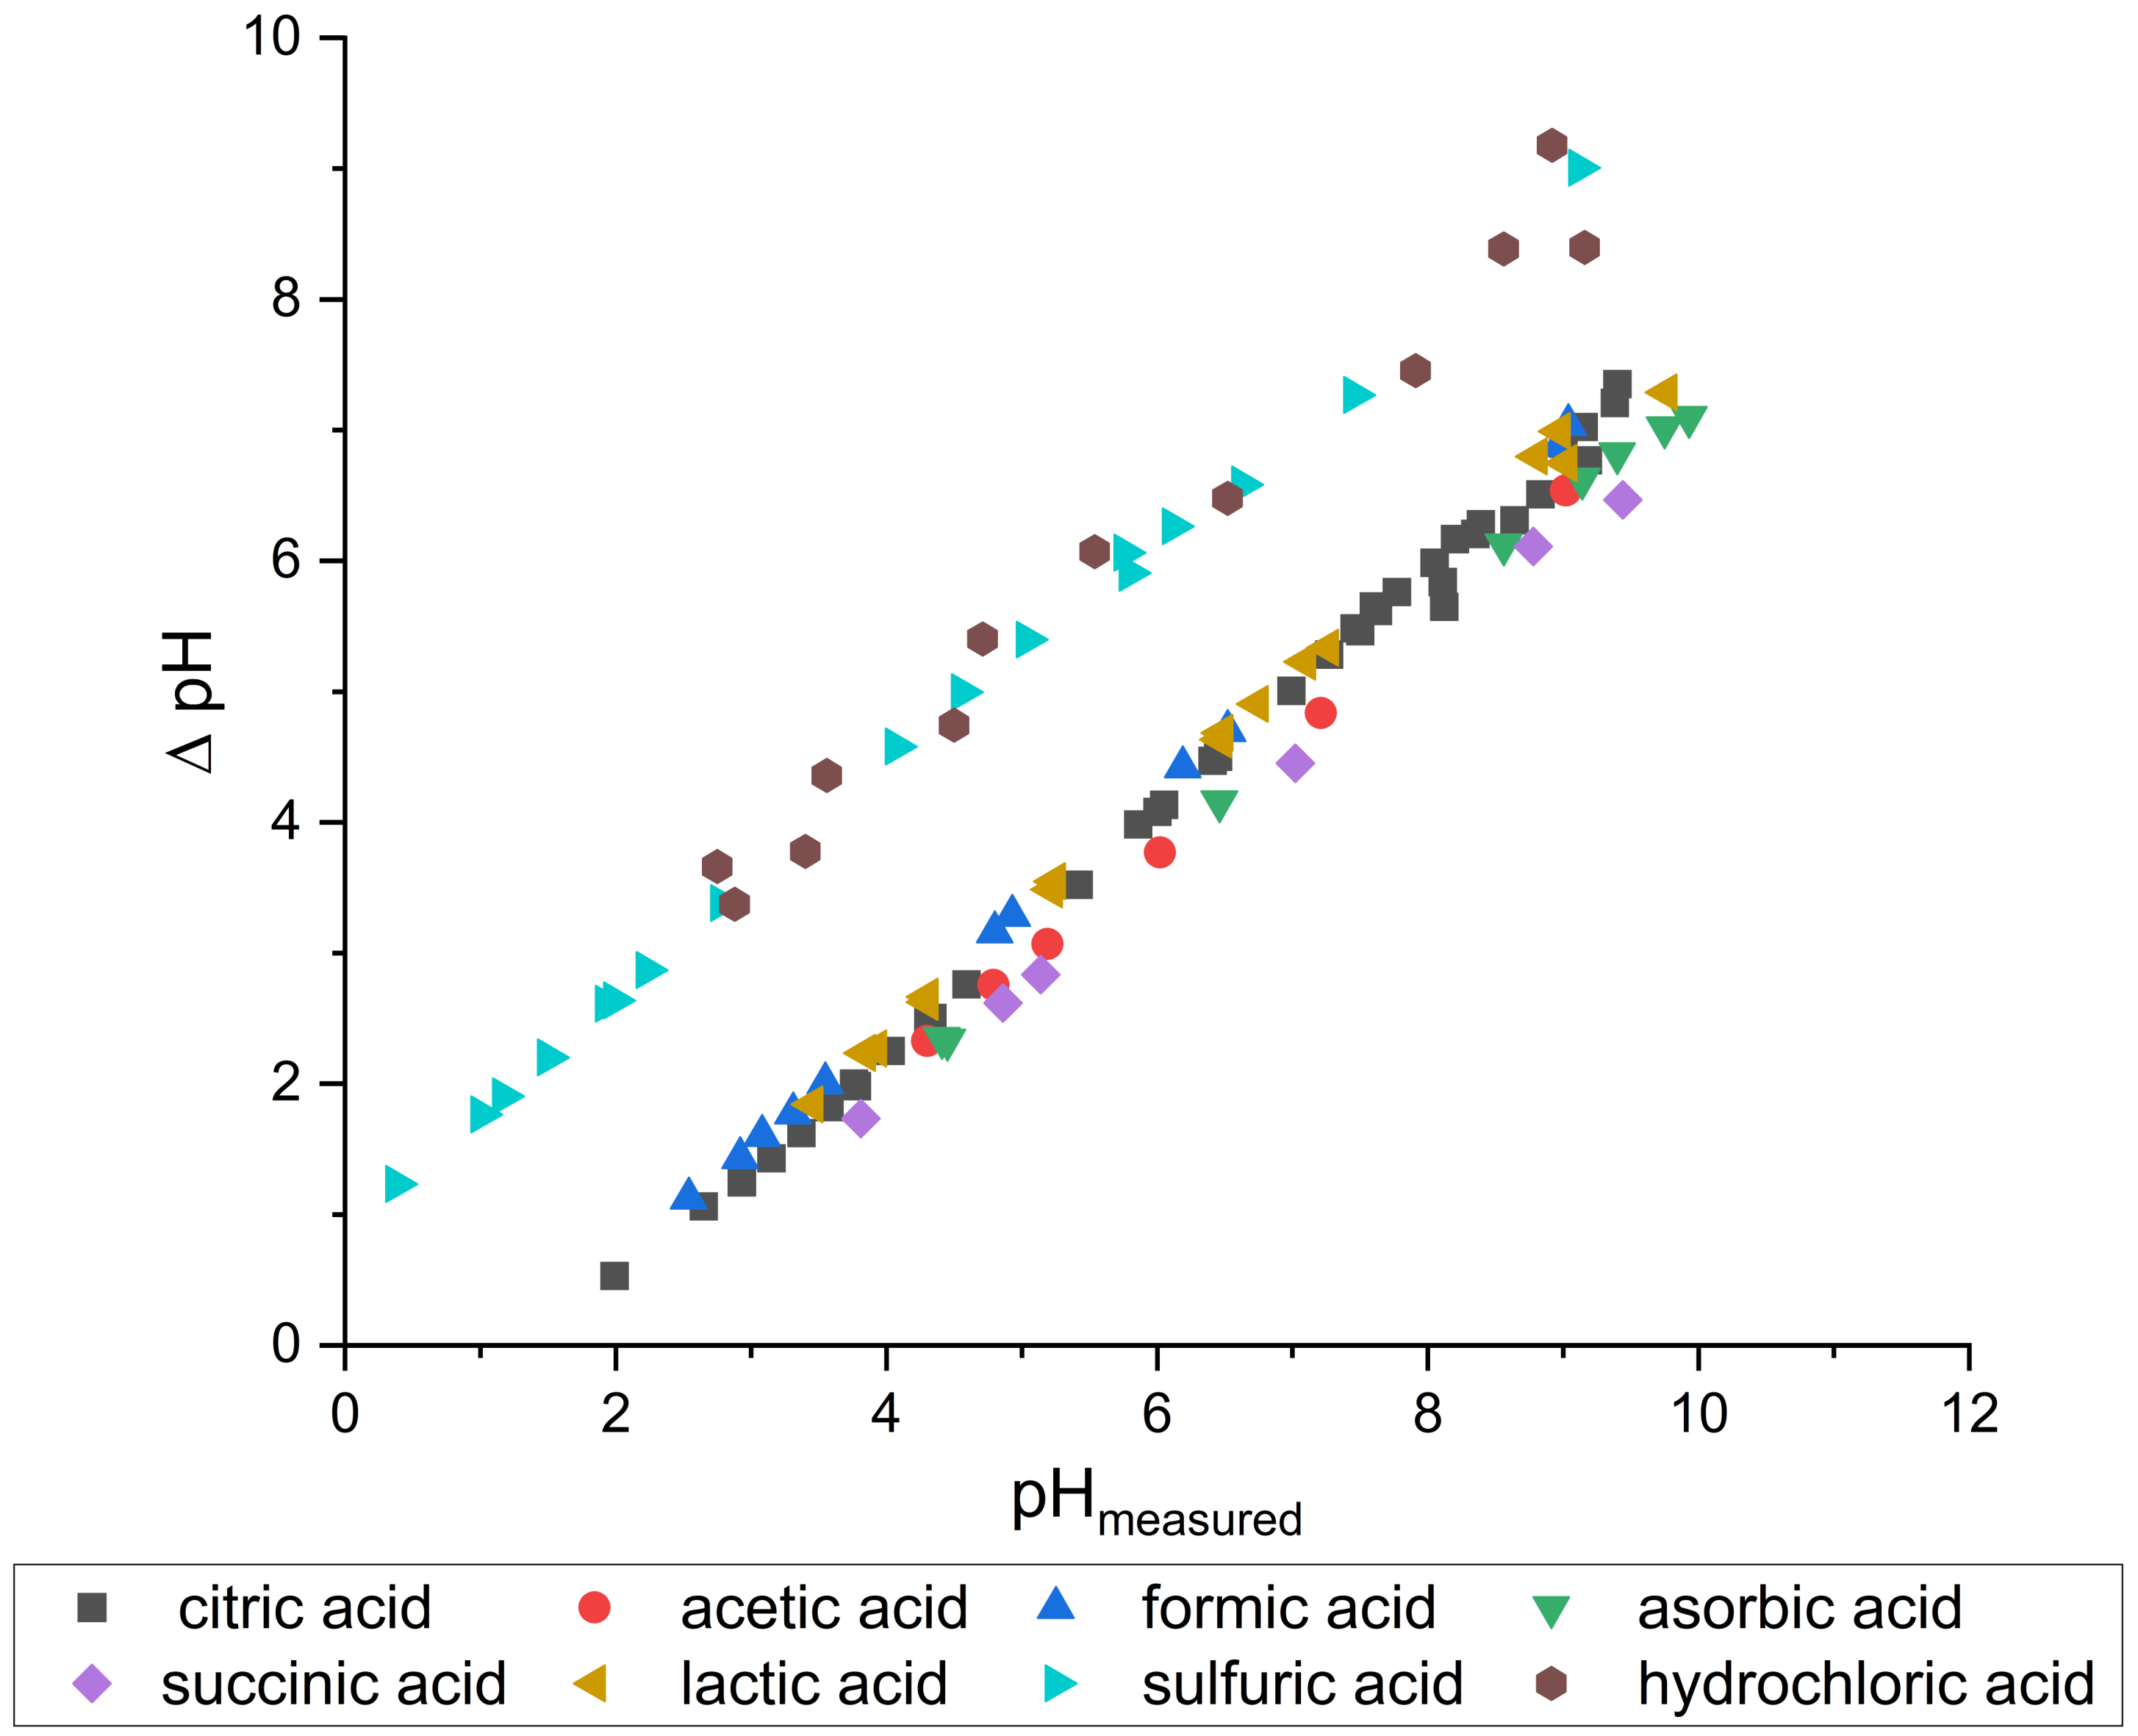
Table A1.
Comparison of data points with similar pH value from different experiments sorted by acid. Because the acid addition was randomized, not all data points are comparable to those from other experiments with the same acid system.
References
- Fleischmann, J.; Hanicke, M.; Horetsky, E.; Ibrahim, D.; Jautelat, S.; Linder, M.; Schaufuss, P.; Torscht, L.; van de Rijt, A. Battery 2030: Resilient, Sustainable, and Circular; McKinsey & Company: New York, NY, USA, 2023. [Google Scholar]
- Ghasemi Yeklangi, A.; Ghafari, A.; Asgari Sima, F.; Akbari, S. Advancing lithium-ion battery manufacturing: Novel technologies and emerging trends. J. Appl. Electrochem. 2024, 54, 2653–2682. [Google Scholar] [CrossRef] [Scilit]
- Zhang, X.; Chang, H.L.; Su, C.W.; Qin, M.; Umar, M. Exploring the dynamic interaction between geopolitical risks and lithium prices: A time-varying analysis. Resour. Policy 2024, 90, 104840. [Google Scholar] [CrossRef] [Scilit]
- Balaram, V.; Santosh, M.; Satyanarayanan, M.; Srinivas, N.; Gupta, H. Lithium: A review of applications, occurrence, exploration, extraction, recycling, analysis, and environmental impact. Geosci. Front. 2024, 15, 101868. [Google Scholar] [CrossRef] [Scilit]
- Knutson, C.Y. Lithium. In U.S. Geological Survey, Mineral Commodity Summaries; U.S. Geological Survey: Reston, VA, USA, 2023. [Google Scholar]
- Bajolle, H.; Lagadic, M.; Louvet, N. The future of lithium-ion batteries: Exploring expert conceptions, market trends, and price scenarios. Energy Res. Soc. Sci. 2022, 93, 102850. [Google Scholar] [CrossRef] [Scilit]
- He, B.; Zheng, H.; Tang, K.; Xi, P.; Li, M.; Wei, L.; Guan, Q. A Comprehensive Review of Lithium-Ion Battery (LiB) Recycling Technologies and Industrial Market Trend Insights. Recycling 2024, 9, 9. [Google Scholar] [CrossRef] [Scilit]
- Davis, B.R. Extraction 2018: Proceedings of the First Global Conference on Extractive Metallurgy; The Minerals, Metals and Materials Series; Springer International Publishing AG: Cham, Switzerland, 2018. [Google Scholar]
- Mishra, G.; Jha, R.; Meshram, A.; Singh, K.K. A review on recycling of lithium-ion batteries to recover critical metals. J. Environ. Chem. Eng. 2022, 10, 108534. [Google Scholar] [CrossRef] [Scilit]
- Aaltonen, M.; Peng, C.; Wilson, B.; Lundström, M. Leaching of Metals from Spent Lithium-Ion Batteries. Recycling 2017, 2, 20. [Google Scholar] [CrossRef] [Scilit]
- Li, L.; Bian, Y.; Zhang, X.; Guan, Y.; Fan, E.; Wu, F.; Chen, R. Process for recycling mixed-cathode materials from spent lithium-ion batteries and kinetics of leaching. Waste Manag. 2018, 71, 362–371. [Google Scholar] [CrossRef] [Scilit] [PubMed]
- Pinna, E.G.; Toro, N.; Gallegos, S.; Rodriguez, M.H. A Novel Recycling Route for Spent Li-Ion Batteries. Materials 2021, 15, 44. [Google Scholar] [CrossRef] [Scilit] [PubMed]
- Xuan, W.; Chagnes, A.; Xiao, X.; Olsson, R.T.; Forsberg, K. Antisolvent Precipitation for Metal Recovery from Citric Acid Solution in Recycling of NMC Cathode Materials. Metals 2022, 12, 607. [Google Scholar] [CrossRef] [Scilit]
- Punt, T.; van Wyk, A.P.; Bradshaw, S.M.; Akdogan, G. Citric Acid Leaching Performance at High Solid-to-Liquid Ratios for Lithium-Ion Battery Recycling. Min. Metall. Explor. 2024, 41, 3463–3474. [Google Scholar] [CrossRef] [Scilit]
- Lide, D.R. (Ed.) CRC Handbook of Chemistry and Physics: A Ready-Reference Book of Chemical and Physical Data, 84th ed.; CRC Press: Boca Raton, FL, USA, 2003. [Google Scholar]
- He, L.P.; Sun, S.Y.; Song, X.F.; Yu, J.G. Leaching process for recovering valuable metals from the LiNi1/3Co1/3Mn1/3O2 cathode of lithium-ion batteries. Waste Manag. 2017, 64, 171–181. [Google Scholar] [CrossRef] [Scilit] [PubMed]
- Vieceli, N.; Benjamasutin, P.; Promphan, R.; Hellström, P.; Paulsson, M.; Petranikova, M. Recycling of Lithium-Ion Batteries: Effect of Hydrogen Peroxide and a Dosing Method on the Leaching of LCO, NMC Oxides, and Industrial Black Mass. ACS Sustain. Chem. Eng. 2023, 11, 9662–9673. [Google Scholar] [CrossRef] [Scilit]
- de Oliveira Demarco, J.; Stefanello Cadore, J.; Da Silveira de Oliveira, F.; Hiromitsu Tanabe, E.; Assumpção Bertuol, D. Recovery of metals from spent lithium-ion batteries using organic acids. Hydrometallurgy 2019, 190, 105169. [Google Scholar] [CrossRef] [Scilit]
- Lombardo, G.; Ebin, B.; St. J. Foreman, M.R.; Steenari, B.M.; Petranikova, M. Chemical Transformations in Li-Ion Battery Electrode Materials by Carbothermic Reduction. ACS Sustain. Chem. Eng. 2019, 7, 13668–13679. [Google Scholar] [CrossRef] [Scilit]
- Stallmeister, C.; Friedrich, B. Holistic Investigation of the Inert Thermal Treatment of Industrially Shredded NMC 622 Lithium-Ion Batteries and Its Influence on Selective Lithium Recovery by Water Leaching. Metals 2023, 13, 2000. [Google Scholar] [CrossRef] [Scilit]
- Lombardo, G.; Ebin, B.; Steenari, B.M.; Alemrajabi, M.; Karlsson, I.; Petranikova, M. Comparison of the effects of incineration, vacuum pyrolysis and dynamic pyrolysis on the composition of NMC-lithium battery cathode-material production scraps and separation of the current collector. Resour. Conserv. Recycl. 2021, 164, 105142. [Google Scholar] [CrossRef] [Scilit]
- Li, J.; Lai, Y.; Zhu, X.; Liao, Q.; Xia, A.; Huang, Y.; Zhu, X. Pyrolysis kinetics and reaction mechanism of the electrode materials during the spent LiCoO2 batteries recovery process. J. Hazard. Mater. 2020, 398, 122955. [Google Scholar] [CrossRef] [Scilit]
- Klanchar, M.; Wintrode, B.D.; Phillips, J.A. Lithium−Water Reaction Chemistry at Elevated Temperature. Energy Fuels 1997, 11, 931–935. [Google Scholar] [CrossRef] [Scilit]
- Takacova, Z.; Havlik, T.; Kukurugya, F.; Orac, D. Cobalt and lithium recovery from active mass of spent Li-ion batteries: Theoretical and experimental approach. Hydrometallurgy 2016, 163, 9–17. [Google Scholar] [CrossRef] [Scilit]
- Tanriverdi Terzioğlu, S.; Ilhan, S. Investigation of Leaching Kinetics of Spent Lithium-Ion Battery Cathode Material in Oxalic Acid Solution and Production of NMC 111 Cathode Powder. J. Sustain. Metall. 2025, 11, 4049–4067. [Google Scholar] [CrossRef] [Scilit]
- Xuan, W.; de Souza Braga, A.; Korbel, C.; Chagnes, A. New insights in the leaching kinetics of cathodic materials in acidic chloride media for lithium-ion battery recycling. Hydrometallurgy 2021, 204, 105705. [Google Scholar] [CrossRef] [Scilit]
- Shalmashi, A.; Eliassi, A. Solubility of l-(+)-Ascorbic Acid in Water, Ethanol, Methanol, Propan-2-ol, Acetone, Acetonitrile, Ethyl Acetate, and Tetrahydrofuran from (293 to 323) K. J. Chem. Eng. Data 2008, 53, 1332–1334. [Google Scholar] [CrossRef] [Scilit]
- Zeba, G.T.C.; Paulino, J.F.; Afonso, J.C. Recovery of metals from electroactive components of spent Li-ion batteries after leaching with formic acid. Braz. J. Chem. Eng. 2022, 39, 147–158. [Google Scholar] [CrossRef] [Scilit]
- Meshram, P.; Mishra, A.; Abhilash; Sahu, R. Environmental impact of spent lithium ion batteries and green recycling perspectives by organic acids—A review. Chemosphere 2020, 242, 125291. [Google Scholar] [CrossRef] [Scilit] [PubMed]
- Hou, J.; Ma, X.; Fu, J.; Vanaphuti, P.; Yao, Z.; Liu, Y.; Yang, Z.; Wang, Y. A green closed-loop process for selective recycling of lithium from spent lithium-ion batteries. Green Chem. 2022, 24, 7049–7060. [Google Scholar] [CrossRef] [Scilit]
- Zhao, T.; Mahandra, H.; Choi, Y.; Li, W.; Zhang, Z.; Zhao, Z.; Chen, A. A clean and sustainable method for recycling of lithium from spent lithium iron phosphate battery powder by using formic acid and oxygen. Sci. Total Environ. 2024, 920, 170930. [Google Scholar] [CrossRef] [Scilit] [PubMed]
- Marchese, D.; Giosuè, C.; Staffolani, A.; Conti, M.; Orcioni, S.; Soavi, F.; Cavalletti, M.; Stipa, P. An Overview of the Sustainable Recycling Processes Used for Lithium-Ion Batteries. Batteries 2024, 10, 27. [Google Scholar] [CrossRef] [Scilit]

Disclaimer/Publisher’s Note: The statements, opinions and data contained in all publications are solely those of the individual author(s) and contributor(s) and not of MDPI and/or the editor(s). MDPI and/or the editor(s) disclaim responsibility for any injury to people or property resulting from any ideas, methods, instructions or products referred to in the content. |
© 2026 by the authors. Licensee MDPI, Basel, Switzerland. This article is an open access article distributed under the terms and conditions of the Creative Commons Attribution (CC BY) license.