


Abstract
Aluminum volatilization during laser deposition manufacturing severely deteriorates the microstructure and service performance of TiAl alloys, causing aggravated brittleness, elevated crack sensitivity and structural degradation. To tackle this issue, this work proposes an aluminum composition compensation strategy based on Ti-48Al-2Cr-2Nb pre-alloyed powder, with three mass fractions of elemental Al (15 wt.%, 20 wt.% and 25 wt.%) added to systematically investigate their influences on the macroscopic cracking behavior, microstructure evolution, phase constitution and mechanical properties of the deposited alloys. The results demonstrate that 15 wt.% Al addition achieves crack-free laser deposition, yielding a uniform microstructure dominated by γ-TiAl phase with dispersedly distributed TiAl2 and minor B2 phases as well as low residual internal stress. No α2-Ti3Al phase is detected in all samples, as the Al-rich composition shift thermodynamically suppresses the stability of Ti-rich α2 phase. Excessive Al addition induces the massive formation of brittle Al-rich intermetallics (TiAl2 and TiAl3), which gradually evolve from isolated particles to a continuous network structure, leading to a sharp increase in crack susceptibility. Al addition continuously improves the microhardness of the alloys, and the 25 wt.% Al sample attains the maximum hardness of 522.3 HV, benefiting from the synergistic effects of grain refinement strengthening and second-phase strengthening. The 15 wt.% Al sample delivers the optimal comprehensive mechanical performance, with an ultimate tensile strength of 550.2 Mpa and a fracture elongation of 0.76%, where the finely dispersed TiAl2 precipitates exert a remarkable dispersion strengthening effect without causing severe embrittlement. This work provides a feasible experimental basis and technical reference for crack control and property optimization of laser deposition-manufactured TiAl alloys.
1. Introduction
TiAl alloy exhibits a compelling combination of low density, high elastic modulus, superior specific strength, outstanding corrosion resistance in aggressive environments, exceptional oxidation resistance and inherent flame retardancy at elevated temperatures, as well as high fatigue strength and creep resistance. Owing to these attributes, it is widely recognized as a leading candidate for next-generation high-temperature structural applications, including supersonic aerospace vehicles, advanced gas turbine engines, and high-speed civil transport aircraft [1,2,3]. Notably, TiAl alloy has emerged as the material of choice for low-pressure turbine (LPT) blades in modern aero-engines, progressively displacing conventional nickel-based superalloys. Its implementation enables a demonstrable 20–30% reduction in component mass—thereby enhancing the thrust-to-weight ratio, improving fuel efficiency, and extending service life—without compromising thermomechanical integrity under operational conditions [4,5].
Additive manufacturing (AM) is an advanced rapid near-net-shape-forming technology that emerged and developed rapidly in the 1990s. Distinct from traditional subtractive manufacturing processes such as casting and forging, AM is characterized by high flexibility, enhanced production efficiency, elevated material utilization, shortened manufacturing cycles, capability for fabricating complex geometric configurations, and digitalized intelligent manufacturing. These attributes render it highly suitable for the production of high-temperature structural components in aerospace engines, which demand intricate structures and stringent precision requirements [6,7,8,9]. During the laser deposition manufacturing (LDM) process, the melting, solidification, and cooling of materials proceed under extremely rapid thermal cycles [10]. As a result, significant residual internal stresses tend to accumulate within the deposited layers and propagate throughout the as-fabricated component. These thermally induced stresses, coupled with the mechanical stress field generated by the laser–material interaction, can readily exceed the material’s fracture toughness, leading to the initiation and propagation of cracks and other microstructural defects [11,12,13]. This susceptibility is particularly pronounced in TiAl alloys, which inherently exhibit limited plastic deformability and low room-temperature ductility, rendering them highly vulnerable to thermally induced cracking during laser deposition [14,15,16]. Given the complex phase constitution of TiAl alloys (encompassing γ, α2, and β phases, among others) and the intense, multi-stage reactions that transpire during laser deposition, further systematic research is warranted to elucidate the underlying mechanisms governing crack formation in laser deposition-manufactured TiAl alloys and to develop robust strategies for crack mitigation.
Aluminum loss induced by evaporation is a widely reported phenomenon during laser additive manufacturing of TiAl alloys, as aluminum has a significantly lower melting point and boiling point than titanium. In severe cases, Al loss shifts the solidification path of the alloy toward the Ti-rich side of the Ti-Al phase diagram, deviating from the designed phase equilibrium and thereby exerting a detrimental effect on its high-temperature performance [17,18,19]. According to existing studies on laser deposition of Ti-48Al-2Cr-2Nb alloy, Al volatilization loss can reach about 15 wt.% under conventional process parameters [20]. The volatilization and segregation of aluminum result in an elevated content of the α2-Ti3Al phase, which further exacerbates the propensity for crack initiation and propagation [21]. Extensive studies have confirmed that Al volatilization behavior during laser deposition of TiAl alloys is significantly regulated by process parameters, and the thermal input of the molten pool is the core influencing mechanism [22,23,24]. Excessively high energy density induces overheating of the molten pool, whereas insufficient energy density tends to promote the formation of coarse near-lamellar microstructures, creating a trade-off that hinders the simultaneous optimization of forming quality and mechanical properties. The microstructure and performance of TiAl-based alloys are highly sensitive to Al content; excessive Al loss directly results in substandard mechanical performance of the as-fabricated components. Consequently, relying solely on process parameter optimization is insufficient to fundamentally mitigate the compositional imbalance arising from Al volatilization [25].
Building upon the aforementioned analysis, this study focuses on the Ti-48Al-2Cr-2Nb alloy as a research subject and employs a gradient Al addition strategy for compositional compensation. A systematic investigation is conducted to explore the effects of three Al addition levels (15 wt.%, 20 wt.%, and 25 wt.%) on the macroscopic cracking behavior, microstructure, phase constitution, and mechanical properties of laser deposition-manufactured TiAl alloys. The intrinsic mechanisms by which Al addition regulates crack initiation and propagation, as well as microstructure and property evolution, are elucidated. This work aims to provide experimental foundations and technical references for the compositional optimization and toughening-oriented fabrication of laser deposition-manufactured TiAl alloys.
2. Materials and Methods
Gas-atomized spherical Ti-48Al-2Cr-2Nb (at.%) powder was employed as the base feedstock material and its chemical composition is listed in Table 1. High-purity elemental aluminum powder (99.9 wt.% purity, particle size range of 45–105 μm) was used as the Al compensation source. Prior to processing, the two kinds of powders were weighed according to the designed mass ratios of 15 wt.%, 20 wt.% and 25 wt.% Al addition, and then mechanically blended in a three-dimensional powder mixer (Jiangsu Wanshen Machinery Technology Development Co., Ltd., Nanjing, China) at a rotation speed of 30 rpm for 2 h to achieve homogeneous mixing. The mixed powder was subsequently dried under vacuum (≤5 Pa) at 120 °C for 2 h in a programmable circulating vacuum oven to eliminate adsorbed moisture and volatile contaminants. The substrate consisted of a commercially pure Ti-6Al-4V (Grade 5) titanium alloy plate (100 mm × 100 mm × 10 mm), cut to dimensions using wire electrical discharge machining (WEDM) with a kerf width of ≤0.25 mm and surface roughness Ra < 0.8 μm. Subsequent surface preparation involved sequential mechanical grinding with SiC abrasive papers (P240 → P600 → P1200), followed by thorough ultrasonic cleaning in anhydrous ethanol for 15 min to remove residual debris and oxide films.
Table 1.
Composition of Ti-48Al-2Cr-2Nb alloy.
The bulk deposited specimens had a total height of approximately 15 mm. All specimens for microstructure characterization, phase analysis and mechanical property testing were extracted from the middle region of the deposited layer, 5–10 mm above the substrate, to eliminate the influence of the deposit–substrate interfacial diffusion zone on test results. Macroscopic crack characterization of the specimens was performed via liquid penetrant testing (PT). Following surface decontamination, a colored penetrant was applied, and the crack count and distribution were statistically analyzed. The specimens were wire-cut, mounted, and etched for 5 s using an etchant with a volume ratio of HF:HNO3:H2O = 1:1:8. After rinsing and drying, the microstructures were observed using an Olympus-GX51 optical microscope (OM, Olympus Corporation, Tokyo, Japan) and Hitachi S-3400N (Hitachi High-Tech Corporation, Tokyo, Japan)/Tescan MARA3 field-emission scanning electron microscopes (SEMs, Tescan Orsay Holding, a.s., Brno, Czech Republic). Concurrently, electron backscatter diffraction (EBSD) analysis was conducted to acquire grain orientation and phase distribution data. Phase constitution was characterized using a Rigaku Ultima IV X-ray diffractometer (XRD, Rigaku Corporation, Tokyo, Japan).
For mechanical properties, microhardness was measured at multiple locations using an HVS-1000A microhardness tester (Laizhou Huayin Testing Instrument Co., Ltd., Laizhou, China) under a 200 gf load with a 15 s dwell time, and the average value was calculated. Room-temperature tensile tests were performed on a QT-6105S electronic universal testing machine (Suzhou Tinius Kuli Precision Instrument Co., Ltd., Suzhou, China). Flat sub-size tensile specimens were fabricated in accordance with the ASTM E8 standard [26], with a gauge length of 25 mm, a gauge width of 6 mm and a nominal thickness of 2 mm. The longitudinal direction of the specimens was parallel to the deposition plane.
Given the high sensitivity of TiAl-based alloys to machining-induced surface defects, all specimens underwent strict post-processing after wire electrical discharge machining: the gauge sections were sequentially ground with SiC abrasive papers from 240 to 2000 grit, followed by final polishing with 1 μm diamond paste to completely remove the heat-affected layer and surface microcracks introduced by wire cutting. The sharp edges along the gauge section were slightly chamfered to eliminate edge stress concentration during tensile loading. All tensile tests were conducted at a constant initial strain rate of 1 × 10⁻⁴ s−1, and load–displacement curves were recorded in real time to determine the ultimate tensile strength and elongation to failure.
Three Al addition levels (15 wt.%, 20 wt.% and 25 wt.%) were designed in this study. The 15 wt.% Al addition was determined based on the widely reported Al volatilization loss range (approximately 10–15 wt.%) of Ti-48Al-2Cr-2Nb alloy during laser deposition manufacturing in existing studies, which was intended to compensate for the elemental loss during molten pool processing. On this basis, 20 wt.% and 25 wt.% Al additions were set to further expand the composition interval so as to systematically explore the evolution of microstructure, crack susceptibility and mechanical properties of the alloy under higher Al content. This gradient design covers both the composition compensation demand and the investigation of excessive Al effect, which helps to clarify the correlation between Al content and alloy performance [20].
3. Results and Discussion
3.1. The Influence of Al Addition on Cracks
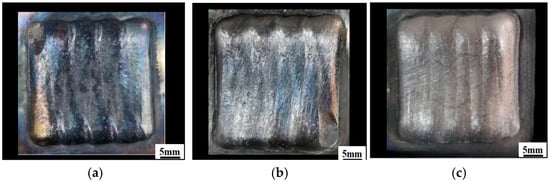
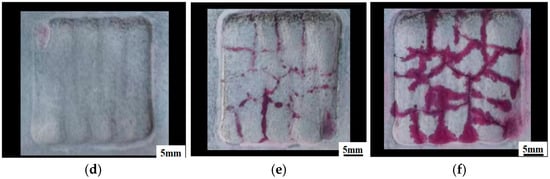
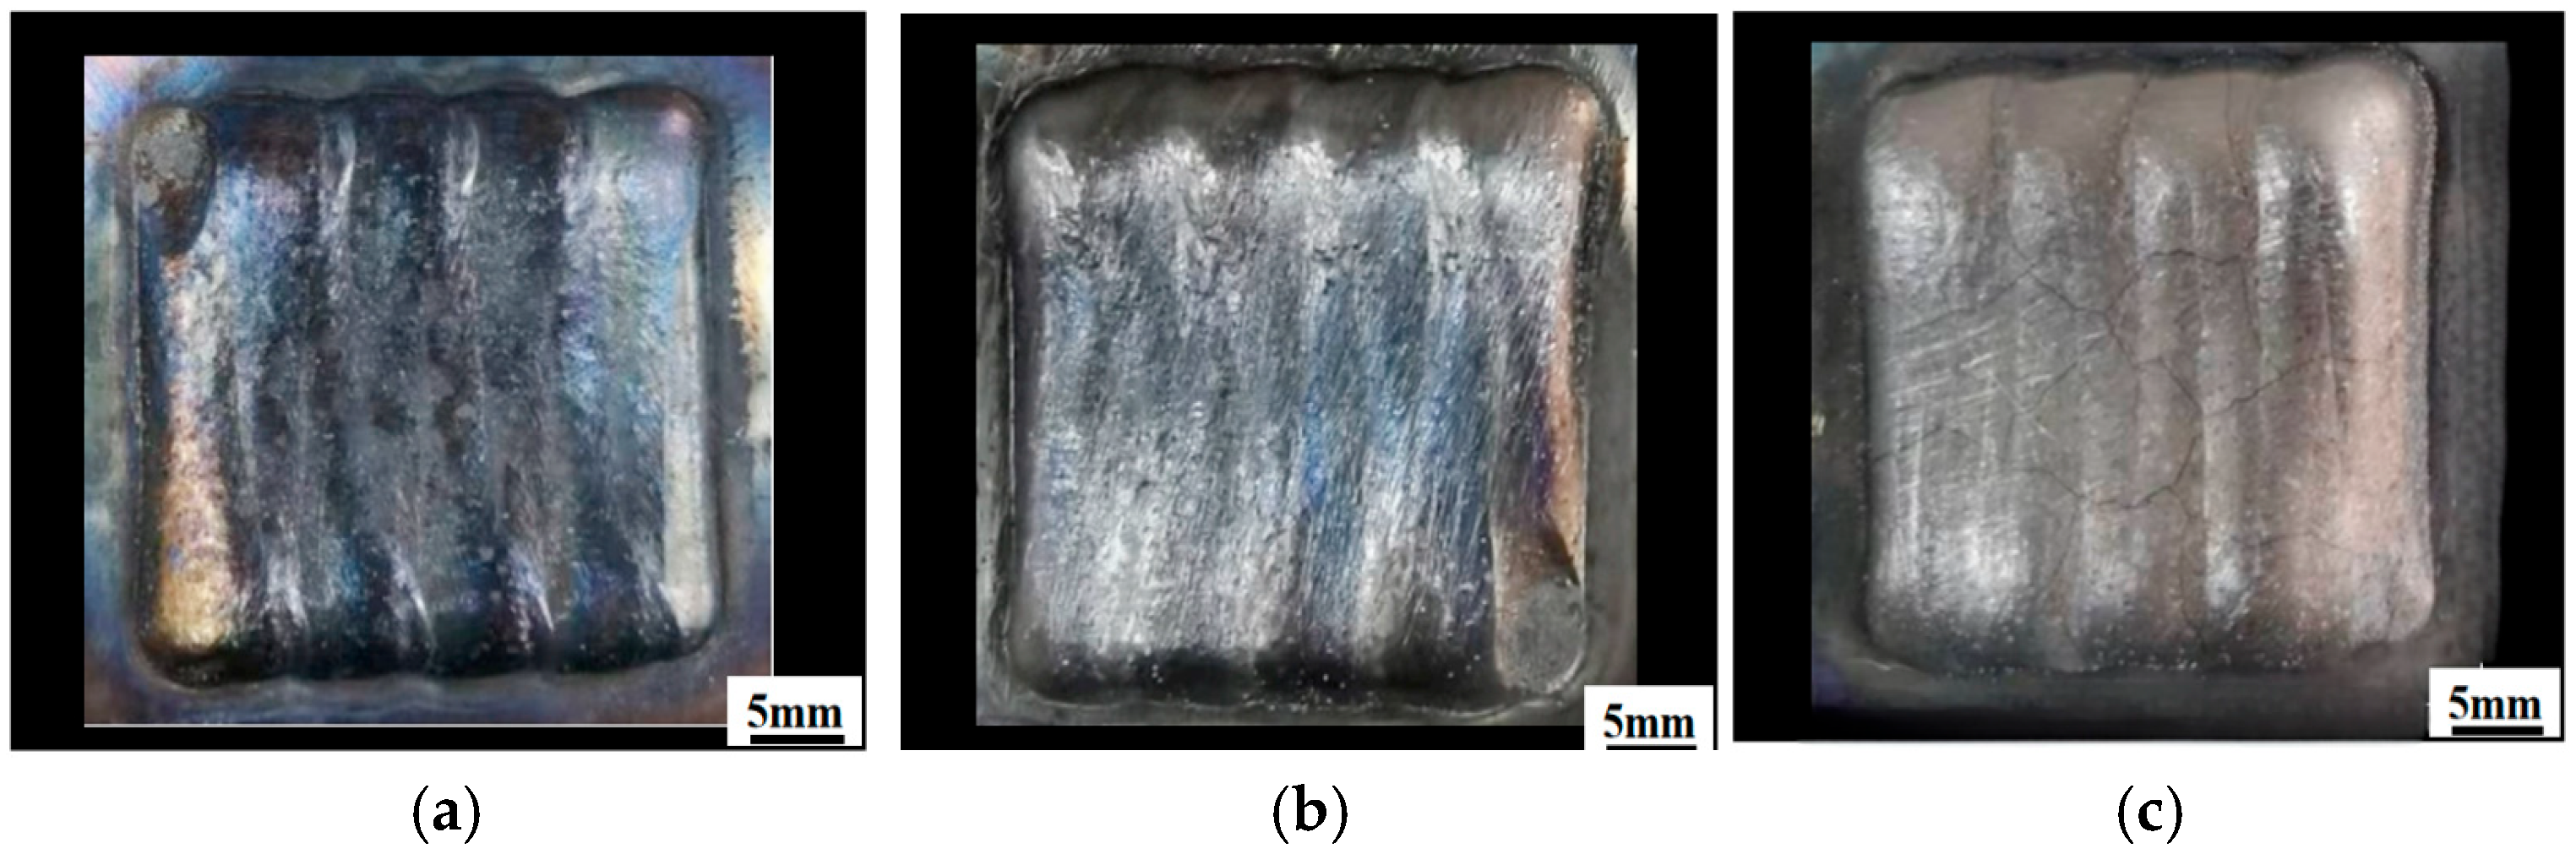
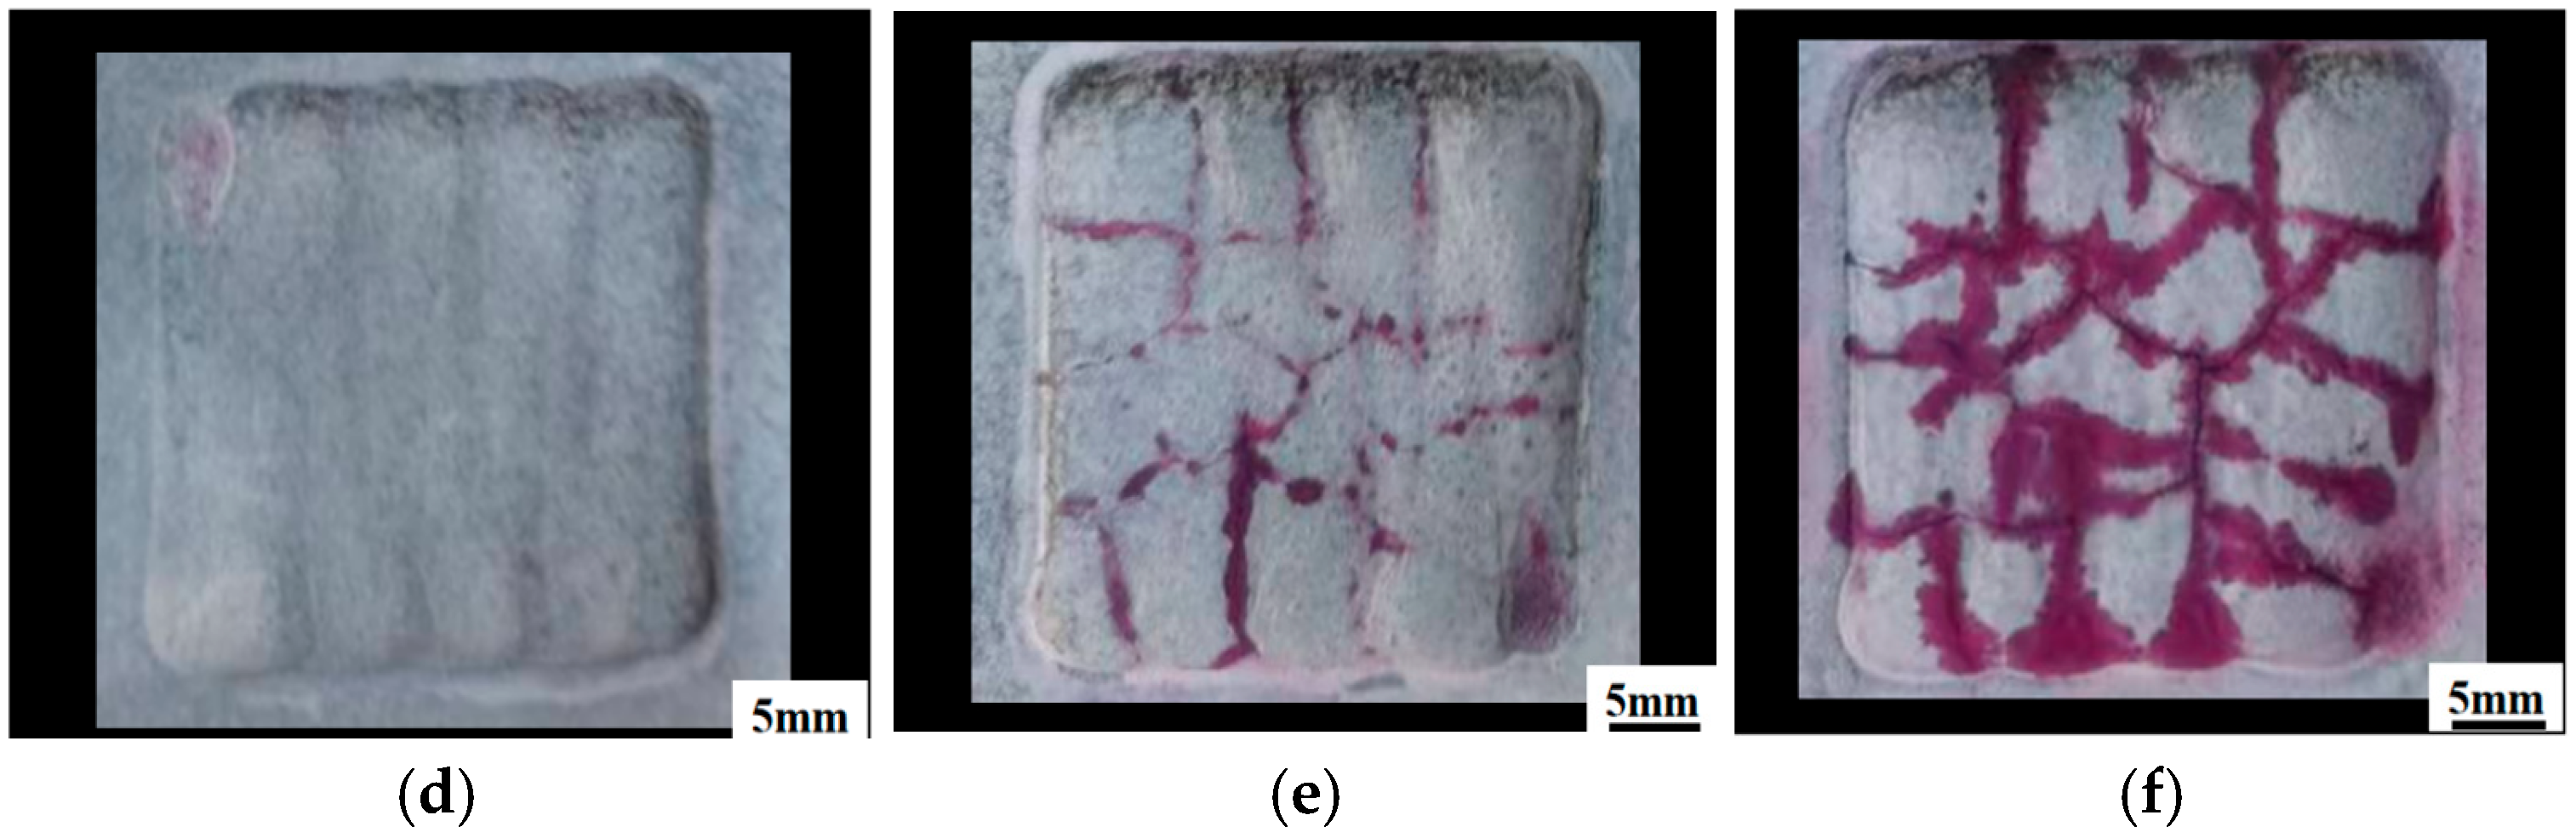
Figure 1 shows the macroscopic surface morphologies of samples with different Al addition amounts after penetrant testing. For the sample with 15 wt.% Al addition (Figure 1a,d), the deposited surface is relatively flat and smooth, and no obvious macroscopic cracks are observed on the whole surface, indicating good forming quality under this component condition. For the sample with 20 wt.% Al addition (Figure 1b,e), a number of microcracks appear on the sample surface, presenting a mixed distribution of intergranular and transgranular cracks. Compared with the 15 wt.% Al sample, both crack quantity and crack scale increase significantly, and the structural integrity declines. For the sample with 25 wt.% Al addition (Figure 1c,f), the cracking phenomenon is further aggravated. The cracks are interconnected to form a dense network structure, with significantly increased crack width and branching degree, and the forming quality deteriorates severely.
Figure 1.
Macroscopic morphology of samples with different Al addition amounts: (a,d) 15 wt.%Al; (b,e) 20 wt.%Al; (c,f) 25 wt.%Al.
3.2. The Influence of Al Addition on Microstructure
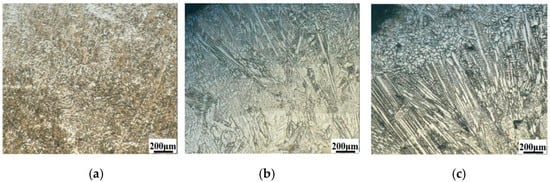
Figure 2 illustrates the microstructures of samples fabricated with different Al addition amounts. The sample with 15 wt.% Al addition exhibits a fine and uniform microstructure with densely distributed grains and no obvious coarse features. In contrast, the sample with 20 wt.% Al addition shows elongated needle-like structures with distinct preferred orientation and larger dimensions. Further increasing Al content to 25 wt.% leads to more pronounced coarse and dense needle-like morphologies, accompanied by pore defects.
Figure 2.
Microstructures of samples with different Al addition amounts: (a) 15 wt.%Al; (b) 20 wt.%Al; (c) 25 wt.%Al.
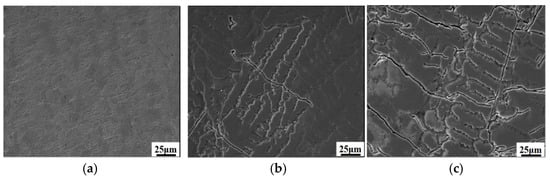
Figure 3 presents secondary electron scanning electron microscopy (SE-SEM) images of specimens with varying Al addition levels, which only characterize surface morphology and crack geometric features, while phase identification cannot be realized via SE mode. For the specimen with 15 wt.% Al (Figure 3a), the surface is generally smooth and flat, and no visible microcracks can be observed within the field of view. The overall surface structure presents a uniform morphology without obvious structural unevenness. When the Al addition increases to 20 wt.% (Figure 3b), the cracking feature changes markedly. Multiple microcracks with different lengths and orientations can be clearly captured; some cracks are short linear fissures, while others extend into curved long cracks. The curved propagation path indicates that the cracks are blocked by local microstructural features during expansion, which changes their growth direction. Compared with the 15 wt.% Al sample, the surface structural uniformity of this specimen is significantly reduced. At 25 wt.% Al (Figure 3c), the crack morphology and distribution become extremely complex. The total number of microcracks increases sharply, forming an interconnected dense crack network. The main cracks extend continuously and produce a large number of branched secondary microcracks, covering most of the observation area. Such complex crack distribution indicates that the material has a strong crack propagation tendency under the same forming thermal cycle.
Figure 3.
SEM images of samples with different Al addition amounts: (a) 15 wt.%Al; (b) 20 wt.%Al; (c) 25 wt.%Al. Three independent random locations were observed for each specimen, and typical representative micrographs are exhibited here.
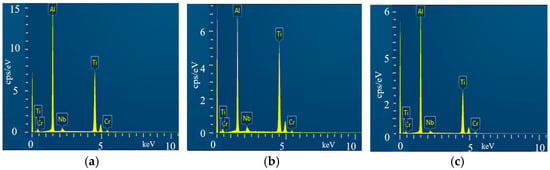
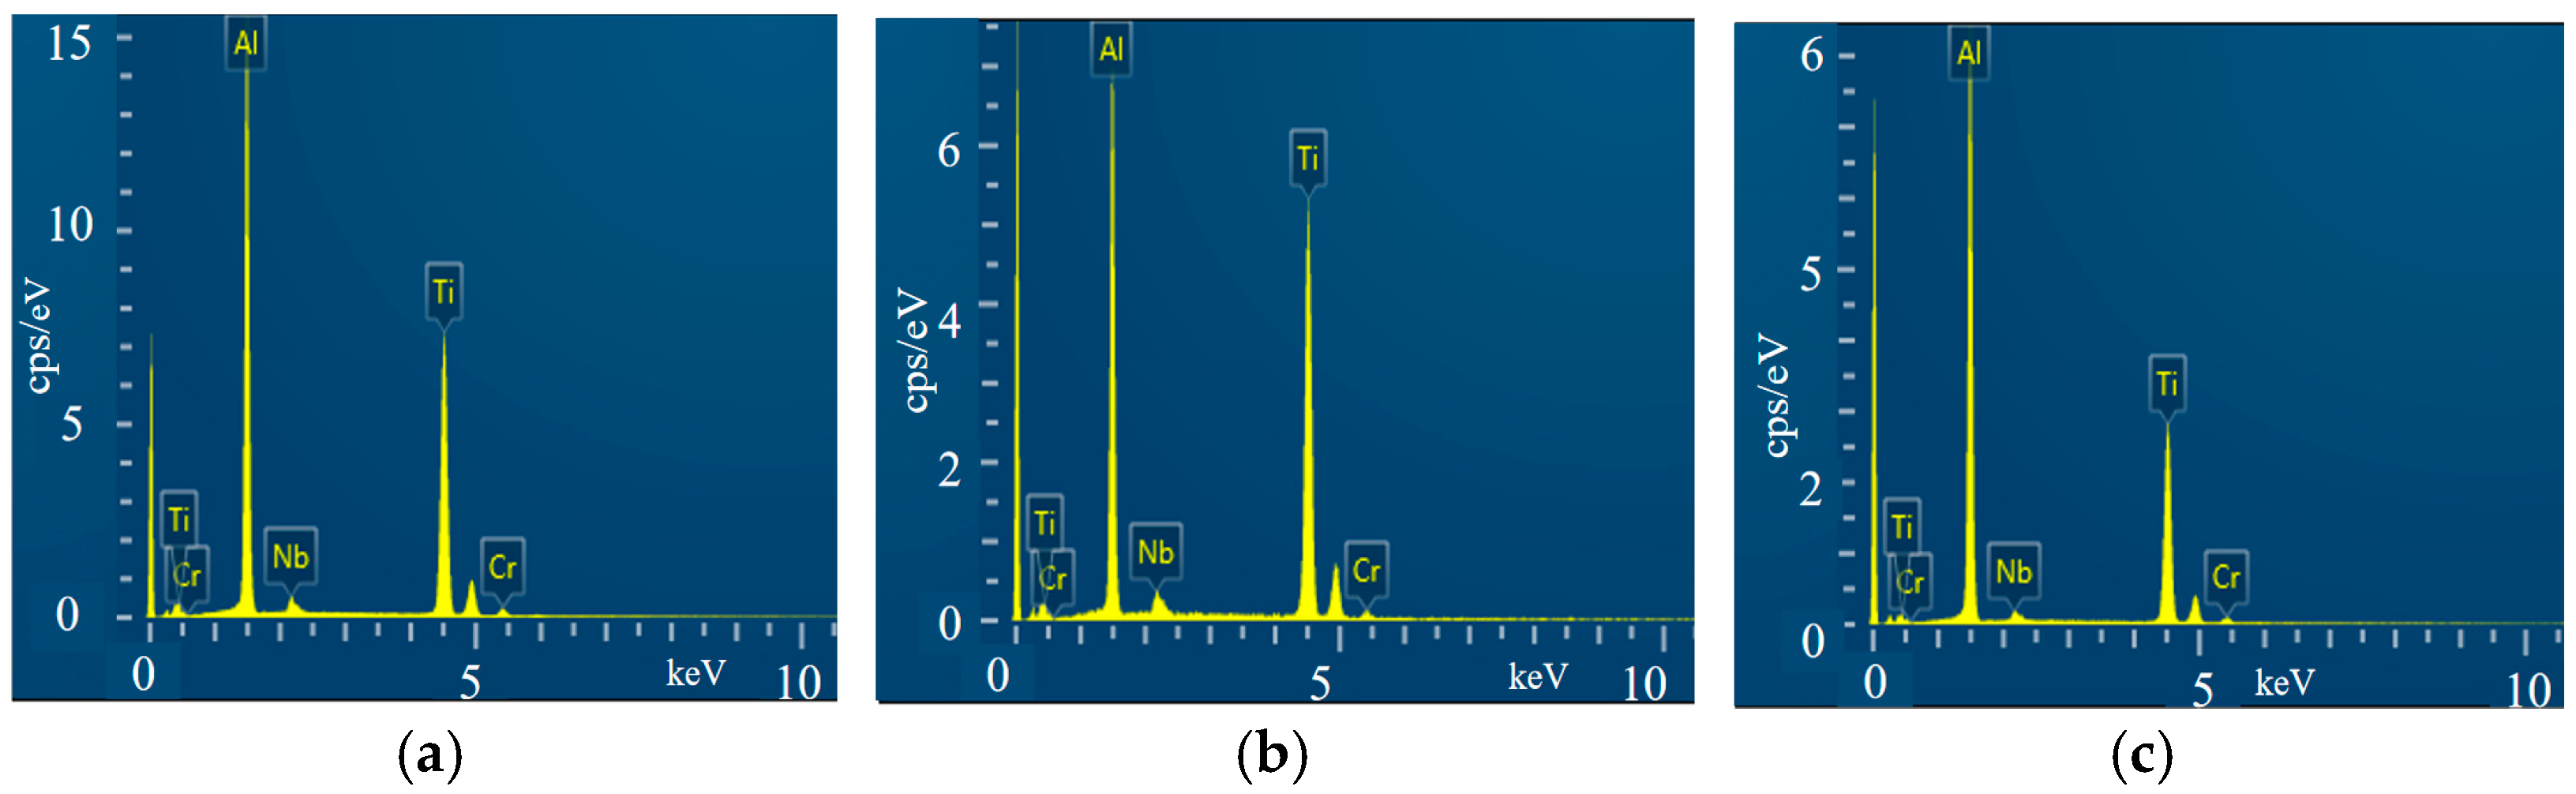
Figure 4 presents the EDS spectra of samples with different Al additions. The characteristic energy peaks of Ti, Al, Cr and Nb can be clearly identified in all three spectra, which qualitatively verifies that the main constituent elements match the designed alloy composition, and no obvious impurity elements are detected. The quantitative atomic fractions of each element are summarized in Table 2.
Figure 4.
Elemental composition spectra of samples with different Al addition amounts: (a) 15 wt.%Al; (b) 20 wt.%Al; (c) 25 wt.%Al.
Table 2.
Results of energy spectrum analysis (at.%).
Table 2 lists the atomic fraction results measured by EDS. With the increase in additional Al content, the detected Al atomic fraction shows a gradual upward trend, while the Ti atomic fraction decreases correspondingly. The contents of Cr and Nb remain relatively stable among all samples.
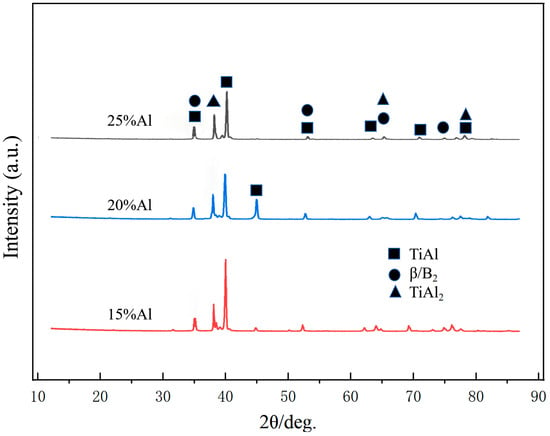
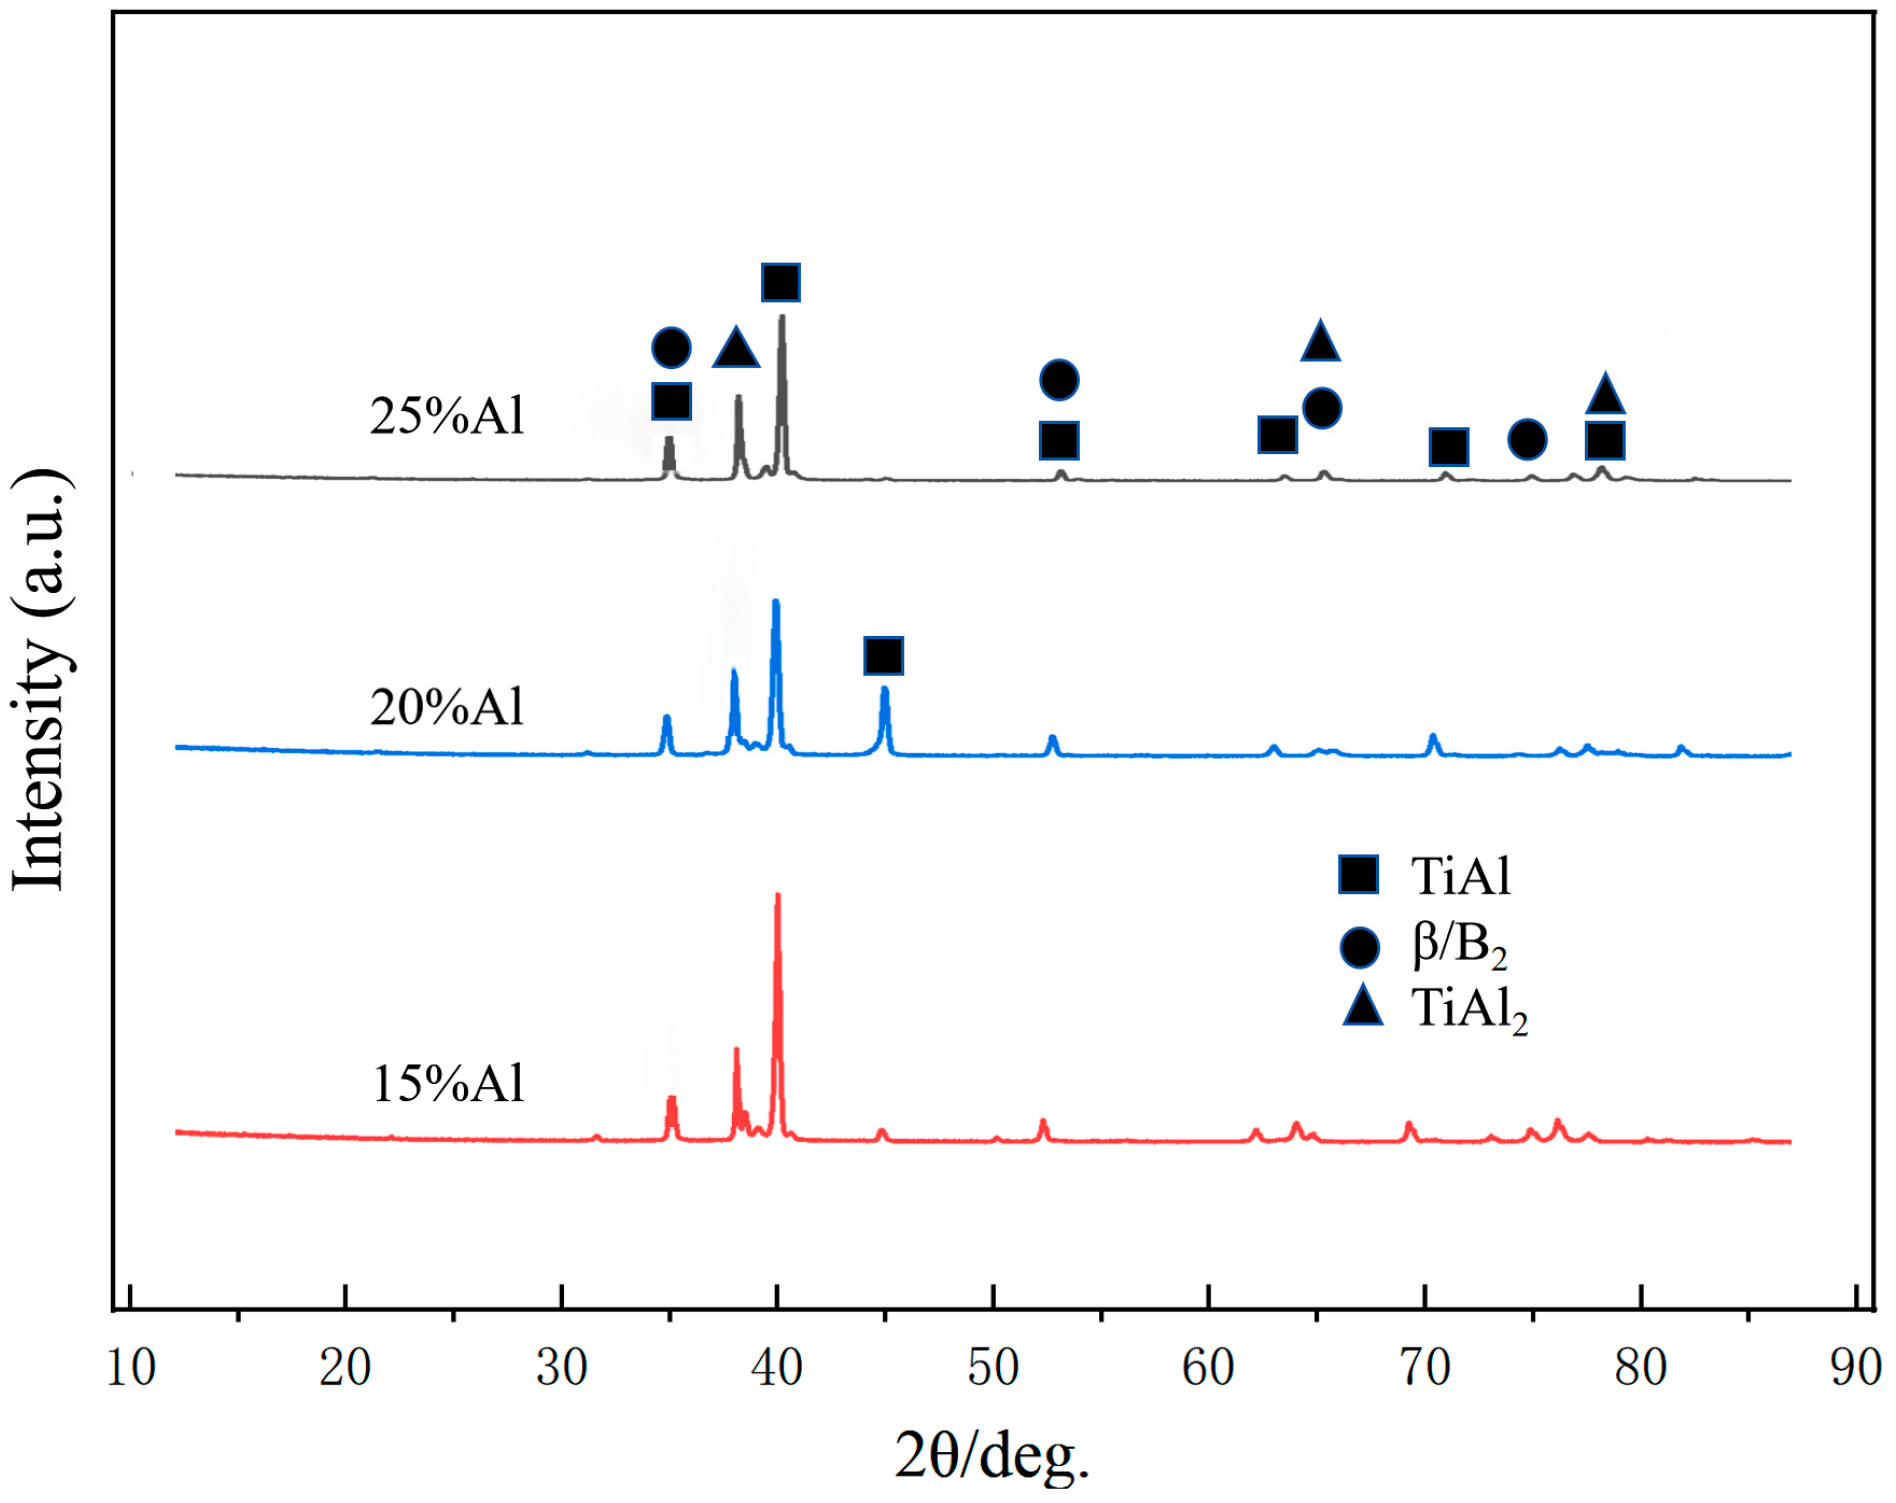
Figure 5 presents the XRD patterns of the samples with varying Al additions. The phase constituents differ noticeably among the three groups rather than being identical. For the 15 wt.% Al sample, the detected phases are dominated by γ-TiAl, accompanied by weak diffraction peaks of TiAl2 and a minor amount of B2/β phase; no TiAl3 or α2-Ti3Al phase is identified in this specimen. With Al addition increasing to 20 wt.% and 25 wt.%, trace diffraction peaks corresponding to TiAl3 phase become detectable, and their relative intensity increases gradually, consistent with the trend of TiAl2 fraction evolution as quantified by EBSD analysis. In all three alloys, γ-TiAl remains the dominant matrix phase, and its relative volume fraction decreases progressively with rising Al content, as confirmed by the EBSD phase quantification results.
Figure 5.
XRD patterns of samples with different Al addition amounts.
The intense diffraction peak at approximately 45° corresponds to the superimposed (002) and (200) crystal planes of the γ-TiAl phase with an ordered L10 tetragonal structure. Due to the c/a axial ratio of L10 TiAl being very close to 1, the two diffraction peaks overlap with each other and appear as a single strong peak. With increasing Al addition, the relative intensity of this peak decreases markedly and becomes very weak in the 25 wt.% Al sample. This trend is consistent with the continuous reduction in the relative volume fraction of the γ-TiAl matrix, as more Ti and Al atoms participate in the formation of Al-rich intermetallic phases (TiAl2 and TiAl3). It should be noted that XRD peak intensity is influenced by multiple microstructural factors besides phase content, and the quantitative phase fractions are provided by EBSD analysis.
Notably, no α2-Ti3Al phase is detected in any of the three samples, which differs from the commonly reported phenomenon in conventional laser-deposited TiAl alloys without Al compensation. This discrepancy can be effectively explained by the compositional shift combined with the Ti-Al binary phase diagram. The α2-Ti3Al phase is a Ti-rich intermetallic compound that is thermodynamically stable on the Ti-rich side of the phase diagram. During conventional laser deposition, severe Al volatilization shifts the alloy composition toward the Ti-rich side, thus promoting the formation of the α2 phase. In this work, however, the Al addition strategy shifts the overall alloy composition toward the Al-rich side instead, which thermodynamically suppresses the stability of the Ti-rich α2 phase and favors the formation of Al-rich intermetallics such as TiAl2 and TiAl3. For the sample with 15 wt.% Al addition, the semi-quantitative EDS results show that its Al content slightly exceeds the nominal composition of standard as-cast Ti-48Al-2Cr-2Nb alloy. Combined with the non-equilibrium rapid solidification characteristic of laser deposition, the alloy composition falls within the γ-TiAl + TiAl2 phase field instead of the conventional γ + α2 two-phase region under equilibrium casting conditions, which is consistent with the XRD detection results.
Furthermore, the crack resistance difference among the samples is compatible with the phase evolution. In the 15 wt.% Al sample, TiAl2 exists only as a small amount of dispersed particles (9.8 vol.%) embedded in the ductile γ-TiAl matrix. Such a low fraction of secondary phase exerts a limited embrittlement effect and will not induce macroscopic cracking, and even provides moderate dispersion strengthening. When Al content further increases, the brittle TiAl2 and TiAl3 phases rise to above 30 vol.% and tend to form a continuous network structure, which sharply increases crack susceptibility and leads to severe cracking in the 20 wt.% and 25 wt.% Al samples.
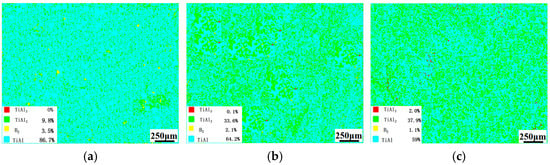
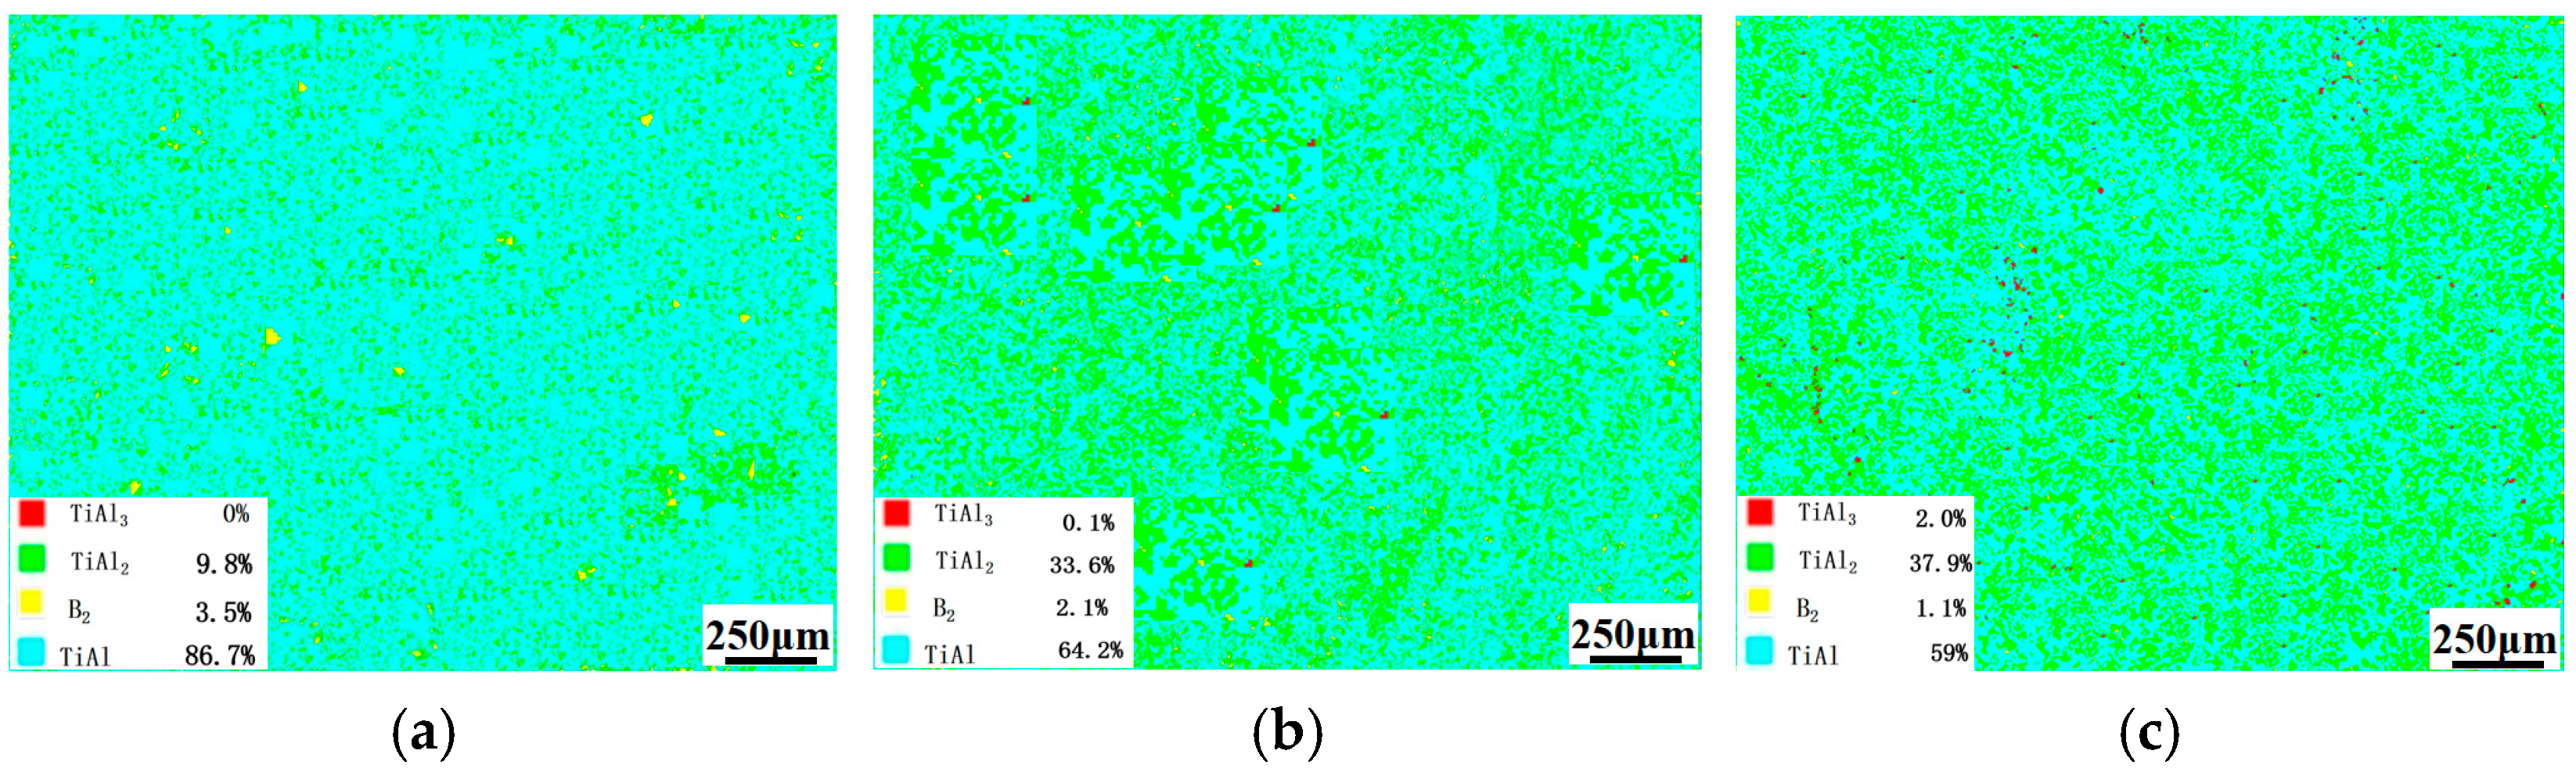
Figure 6 shows the phase composition diagrams of the samples fabricated with Al additions of 15 wt.%, 20 wt.% and 25 wt.%, respectively. At the Al addition of 15 wt.% (Figure 6a), the γ-TiAl phase acts as the dominant constituent, with a fraction of 86.7%, while the TiAl2 phase accounts for 9.8% and the B2 phase is 3.5%. No TiAl3 phase is detected under this condition. Due to the relatively low Al content, the alloy is dominated by a γ-TiAl matrix, in which TiAl2 and B2 phases are dispersedly distributed. Such a phase composition endows the alloy with good plasticity and toughness. The γ-TiAl phase, together with an appropriate amount of B2 phase, provides favorable plastic deformation capacity, while the dispersed TiAl2 phase plays a certain strengthening effect, enabling the alloy to maintain a moderate strength level. When the Al addition increases to 20 wt.% (Figure 6b), compared with the case of 15 wt.% Al, the fraction of γ-TiAl decreases to 64.2%, whereas the TiAl2 content rises continuously to 33.6%. Meanwhile, the B2 phase fraction drops to 2.1%, and the TiAl3 phase initially appears with a low fraction of 0.1%. At 25 wt.% Al addition (Figure 6c), the γ-TiAl phase further decreases to 59%, and the TiAl2 phase content increases remarkably to 37.9%. The fraction of TiAl3 phase rises significantly to 2.0%. The continuous growth of TiAl2 and TiAl3 phases greatly increases the proportion of hard phases in the alloy, while the B2 phase further declines to 1.1%. Accordingly, the number of hard-phase particles in the microstructure increases obviously.
Figure 6.
Phase distribution of samples with different Al addition amounts: (a) 15 wt.%Al; (b) 20 wt.%Al; (c) 25 wt.%Al.
Table 3 quantitatively summarizes the statistical distribution of kernel average misorientation (KAM) angles extracted from EBSD scanning data, including the mean value, standard deviation, minimum/maximum limits and quartile percentiles for each alloy with varying Al supplement contents. The misorientation angle reflects the local lattice distortion and dislocation density inside grains, which can directly characterize the residual strain level induced by rapid laser solidification and phase transformation mismatch.
Table 3.
Statistics of misorientation angles of samples with different Al contents.
The sample with 15 wt.% additional Al presents the lowest average misorientation angle of 0.82°, together with the smallest 25th, 50th and 75th percentile values, demonstrating relatively weak lattice distortion and low stored strain. When the Al addition rises to 20 wt.%, the mean misorientation angle increases obviously to 1.04°, and all quartile values shift upward synchronously; the larger standard deviation of 0.65 also indicates a more uneven strain distribution across the scanned region. The aggravated lattice strain originates from massive precipitation of hard brittle TiAl2 intermetallics, and the mismatched thermal and elastic properties between TiAl matrix and TiAl2 generate severe local stress concentration.
For the 25 wt.% Al specimen, the average misorientation slightly decreases to 0.95° compared with the 20 wt.% Al group, yet all percentile values remain much higher than those of the 15 wt.% Al sample. It is inferred that excessive Al further promotes the formation of TiAl3 phase, which partially releases local concentrated strain via microcrack initiation and expansion during laser deposition. The maximum misorientation angle of all three groups is limited to 5.00°, which is the upper threshold set for KAM calculation in this EBSD post-processing, so no effective comparison can be made based on maximum values. It should be clarified that the KAM data presented in this work serve only for relative comparison of lattice strain trends among specimens with different Al contents and are not intended as absolute quantitative measurements of residual stress, as no independent calibration procedure was applied to the EBSD dataset.
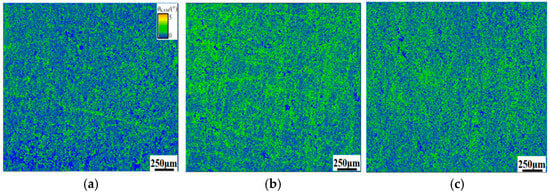
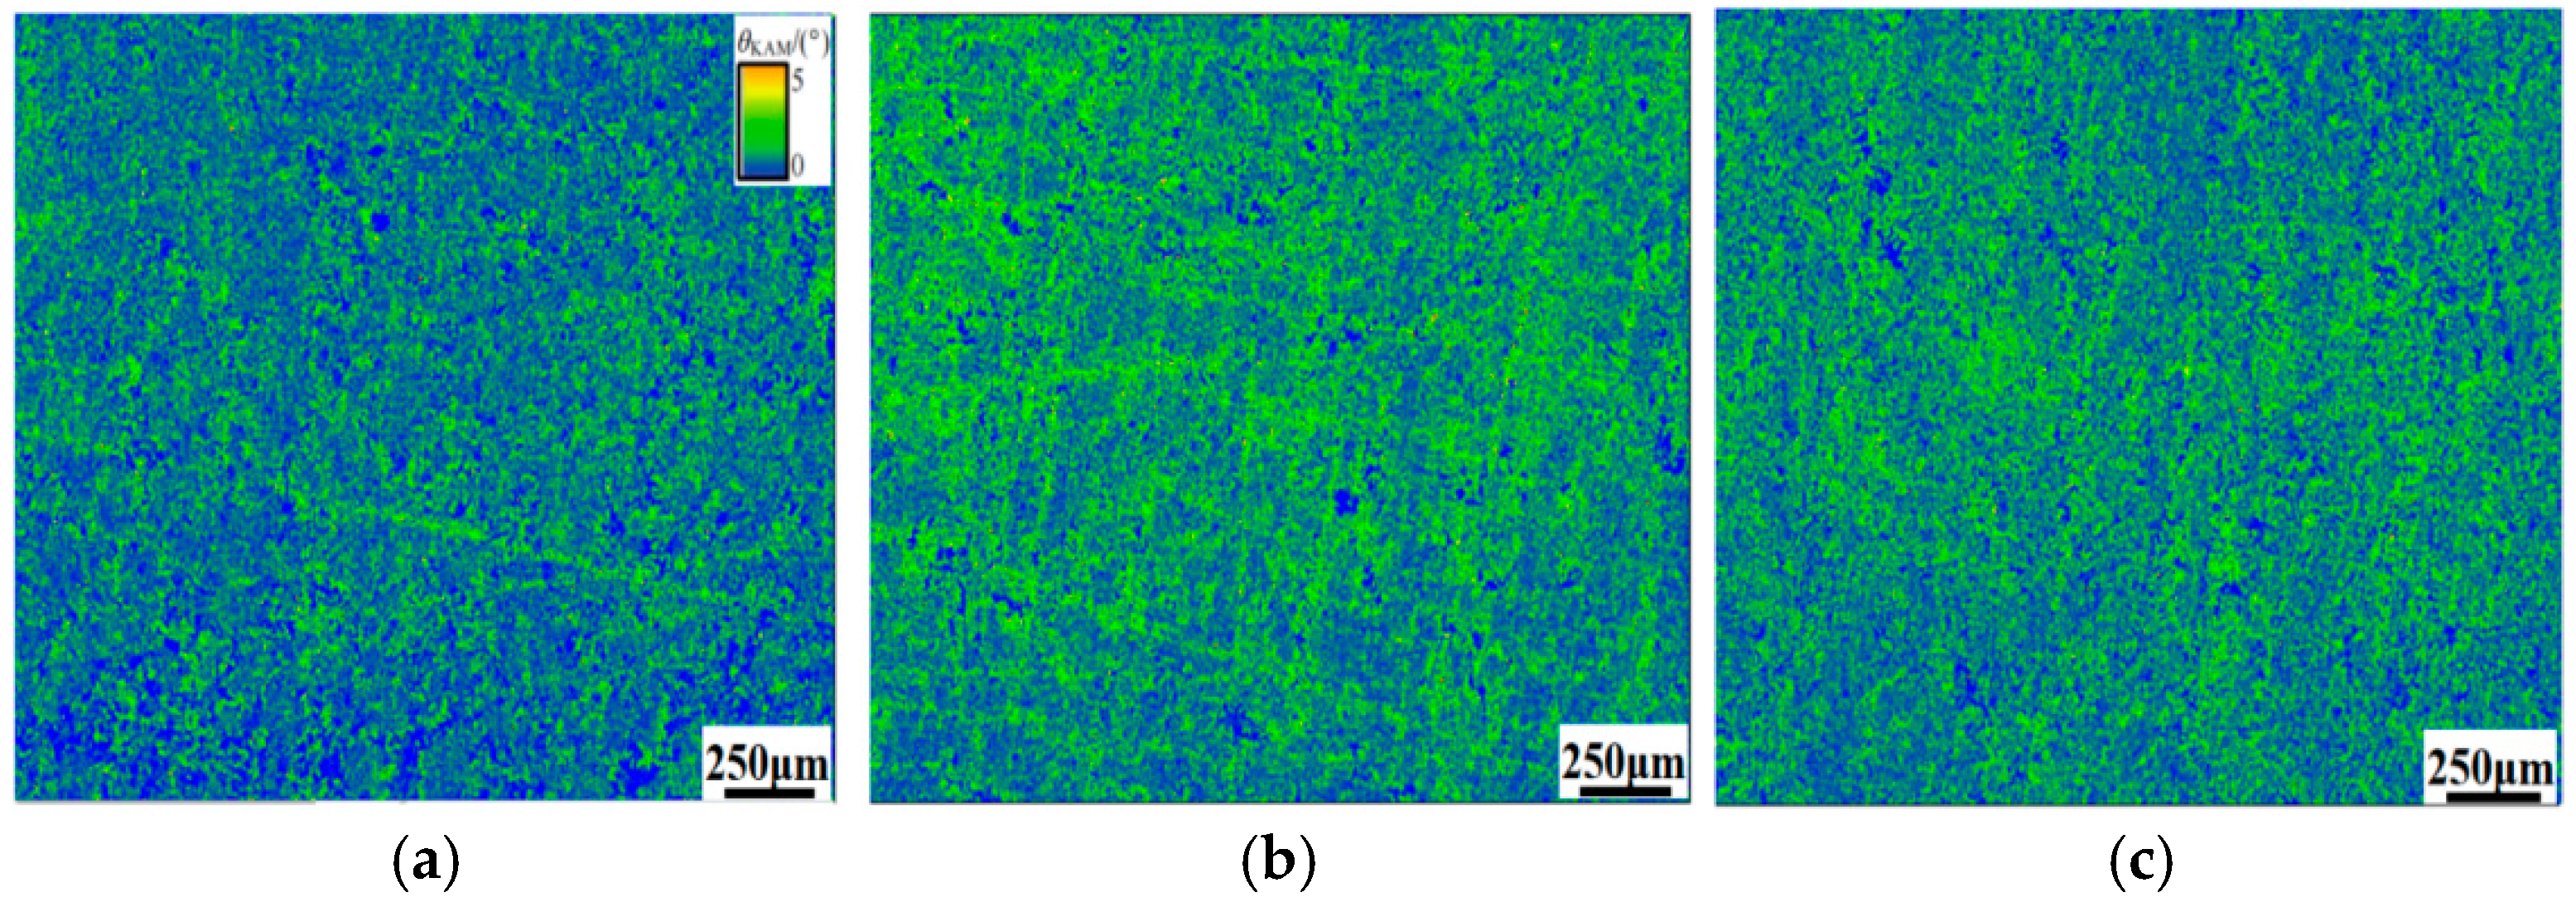
Combined with the KAM contour maps in Figure 7, the statistical data in Table 3 provide quantitative numerical support for the strain evolution rule, further explaining why the crack susceptibility of the alloy reaches the maximum at 20 wt.% Al addition.
Figure 7.
KAM distribution maps of samples with different Al addition amounts: (a) 15 wt.%Al; (b) 20 wt.%Al; (c) 25 wt.%Al.
Figure 7 shows the KAM distribution maps of the samples with different Al additions. For the 15 wt.% Al sample, the KAM mapping is dominated by low misorientation regions, and high-distortion zones are rarely observed across the whole view field. This qualitatively reflects uniform grain orientation distribution inside the alloy matrix, which matches its crack-free smooth macroscopic surface. Uniform grain orientation reduces the possibility of local stress concentration, and thus restricts the generation of microcracks. For the 20 wt.% Al sample, a large area of high misorientation zones can be clearly seen in the KAM map, representing the prominent inhomogeneity of grain orientation inside the material. Areas with severe lattice misorientation easily form local stress concentration sites, which become favorable positions for microcrack initiation, consistent with the microcrack defects observed on the sample surface. For the 25 wt.% Al sample, continuous high-misorientation regions are widely distributed and spatially overlapped with pores and crack networks. Although extensive crack initiation and interconnection occur in this specimen, partial residual stress is released during crack propagation. Even so, localized zones with severe lattice distortion still exist, which further damage the overall structural integrity of the alloy and lead to the formation of dense interconnected crack networks.
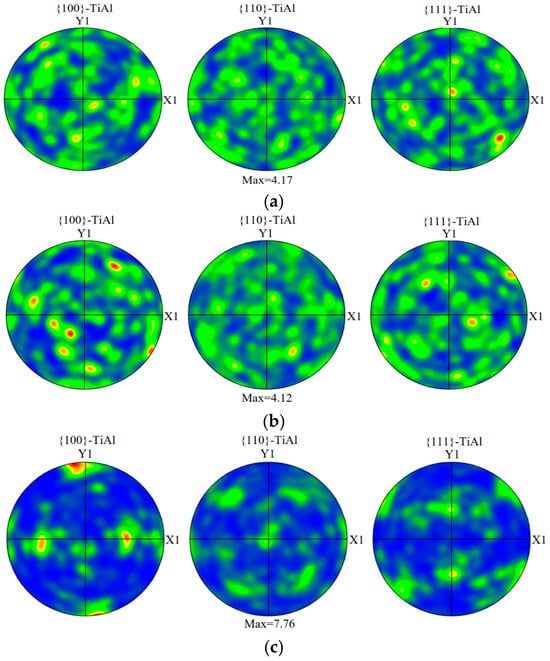
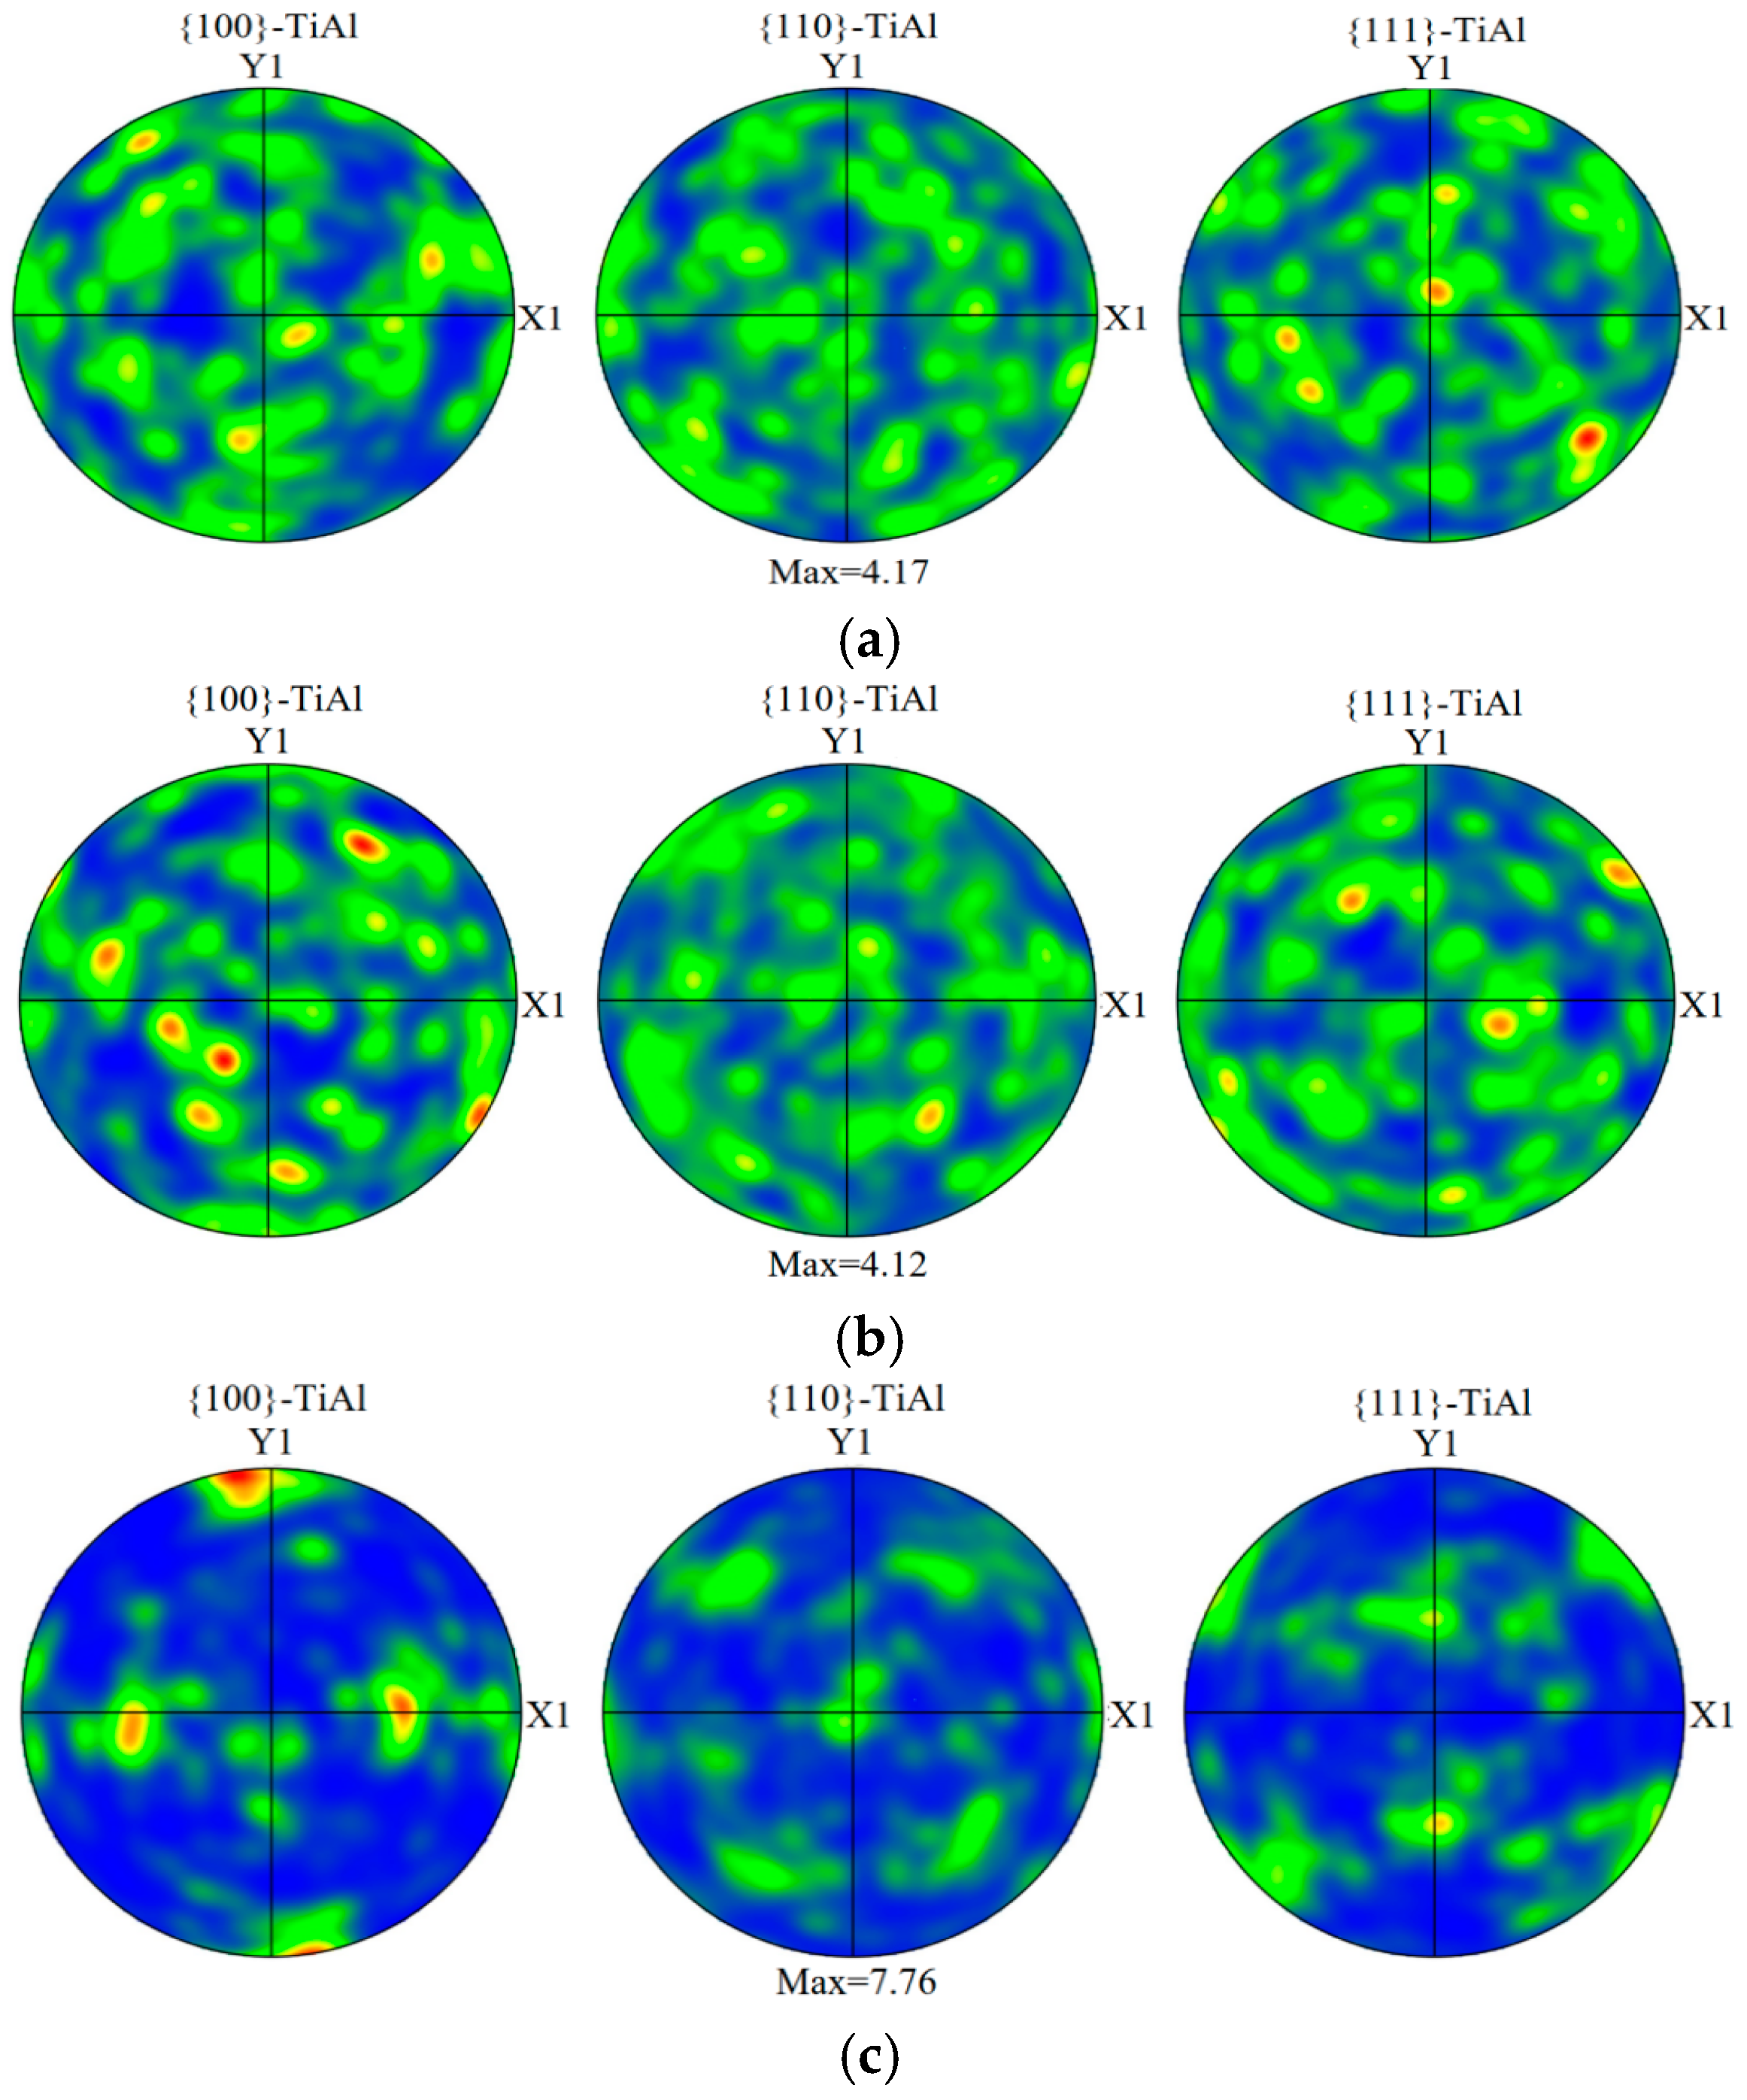
Figure 8 presents the pole figures of the γ-TiAl phase for samples with different Al addition contents. For the 15 wt.% Al sample, a strong <100> fiber texture parallel to the build direction is observed on the {100} pole figure, which is a typical feature of directional epitaxial growth under the steep thermal gradient of laser deposition. The {110} and {111} pole figures show only weak preferred orientation, corresponding to a secondary texture component induced by the anisotropic stacking characteristics of the L10 structure.
Figure 8.
Pole figures of TiAl phase with different Al contents: (a) 15 wt.%Al; (b) 20 wt.%Al; (c) 25 wt.%Al.
With increasing Al content, the overall texture intensity decreases progressively. For the 20 wt.% Al sample, the maximum pole density of the {100} fiber texture decreases and shifts slightly, indicating a weakened and partially reoriented <100> texture. This is attributed to Al-induced changes in solidification path and interfacial energy anisotropy, which alter the competitive growth kinetics of directional dendrites. For the 25 wt.% Al sample, all three pole figures present a nearly isotropic intensity distribution with no dominant texture component, indicating that high Al content promotes heterogeneous nucleation and suppresses directional epitaxial growth, leading to a transition to near-random grain orientation.
This gradual texture weakening is consistent with the microstructural evolution from uniform fine grains to coarse acicular structures. The increased randomness of grain orientation also provides more potential crack propagation paths, which couples with the brittle phase network to aggravate cracking in high-Al samples.
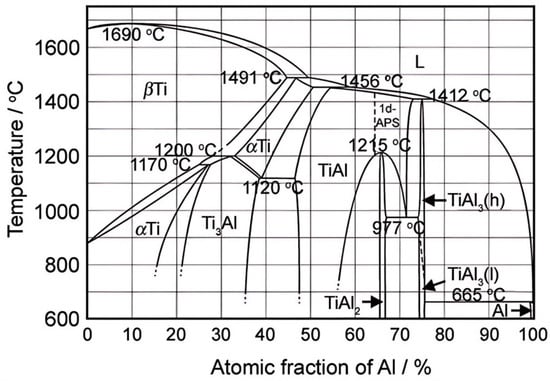
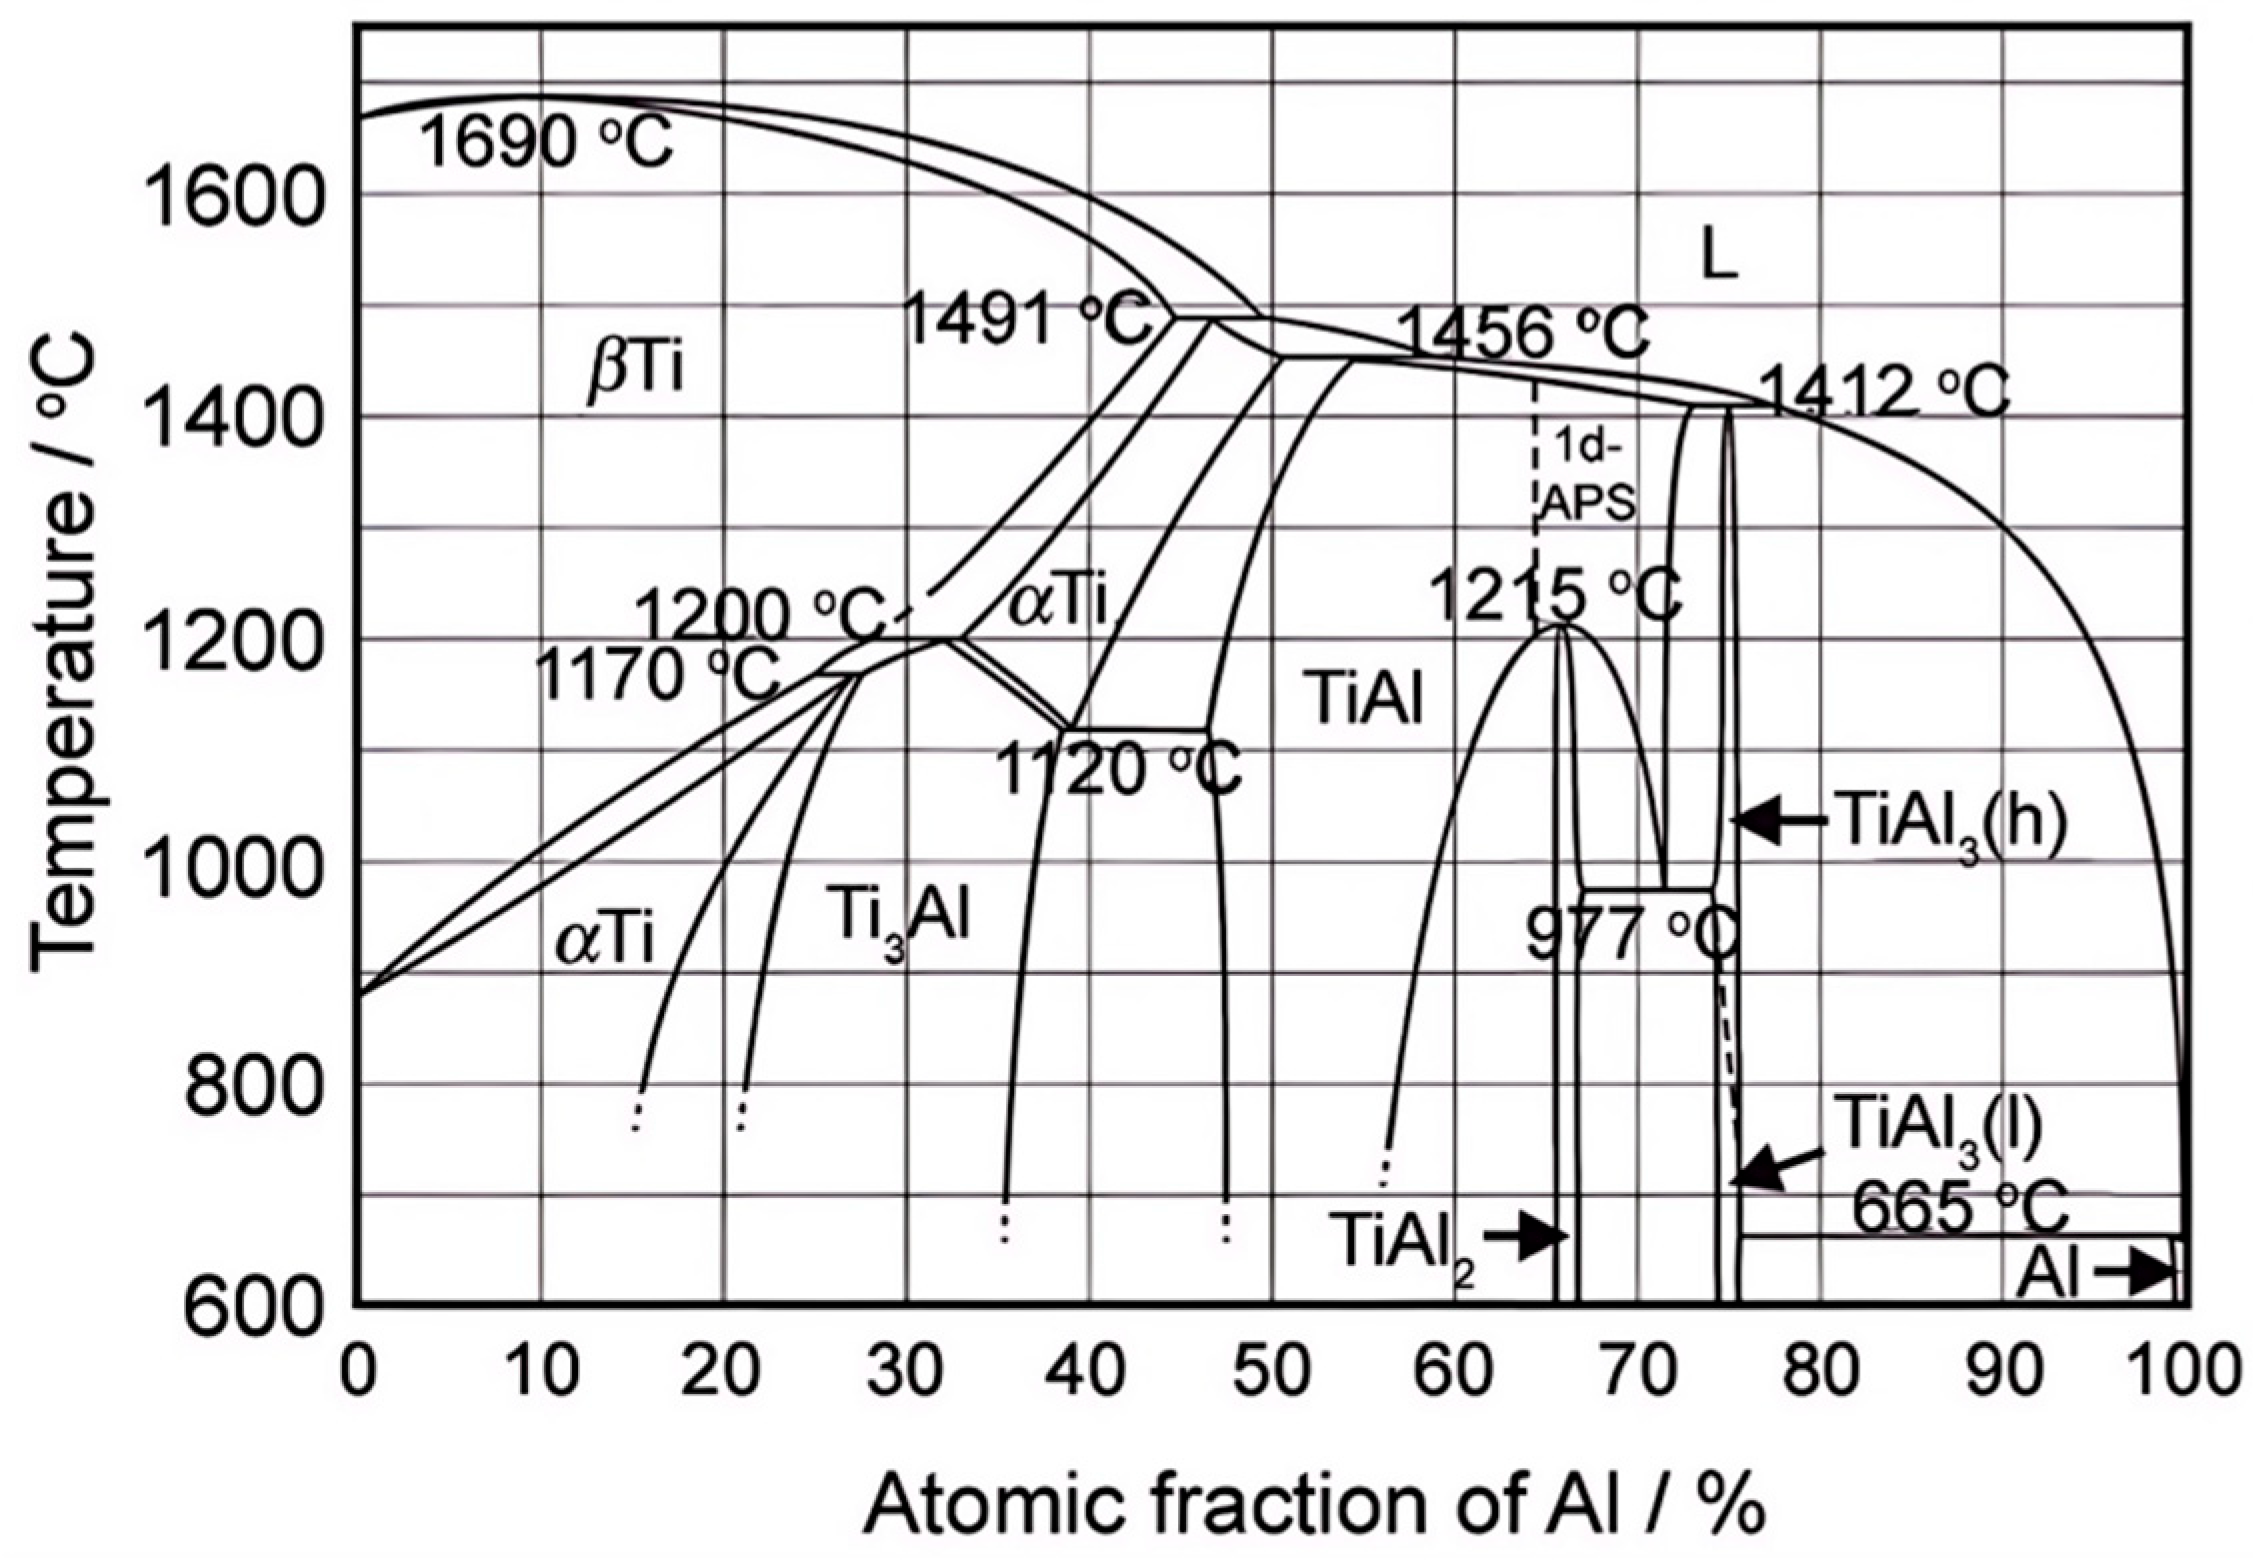
To further interpret the variation rule of equilibrium phases under different Al contents from a thermodynamic perspective, the standard Ti-Al binary equilibrium phase diagram is supplemented, as shown in Figure 9. Cr and Nb in the Ti-48Al-2Cr-2Nb alloy are low-content minor alloying elements, which will not drastically change the primary phase division law of the Ti-Al binary system under equilibrium conditions. Therefore, the Ti-Al binary phase diagram can be adopted as a reliable theoretical basis to predict the potential intermetallic phases generated during laser deposition.
Figure 9.
The binary phase diagram of TiAl alloy.
3.3. The Mechanism of Al Addition on Crack Formation
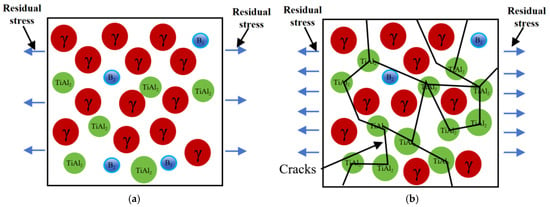
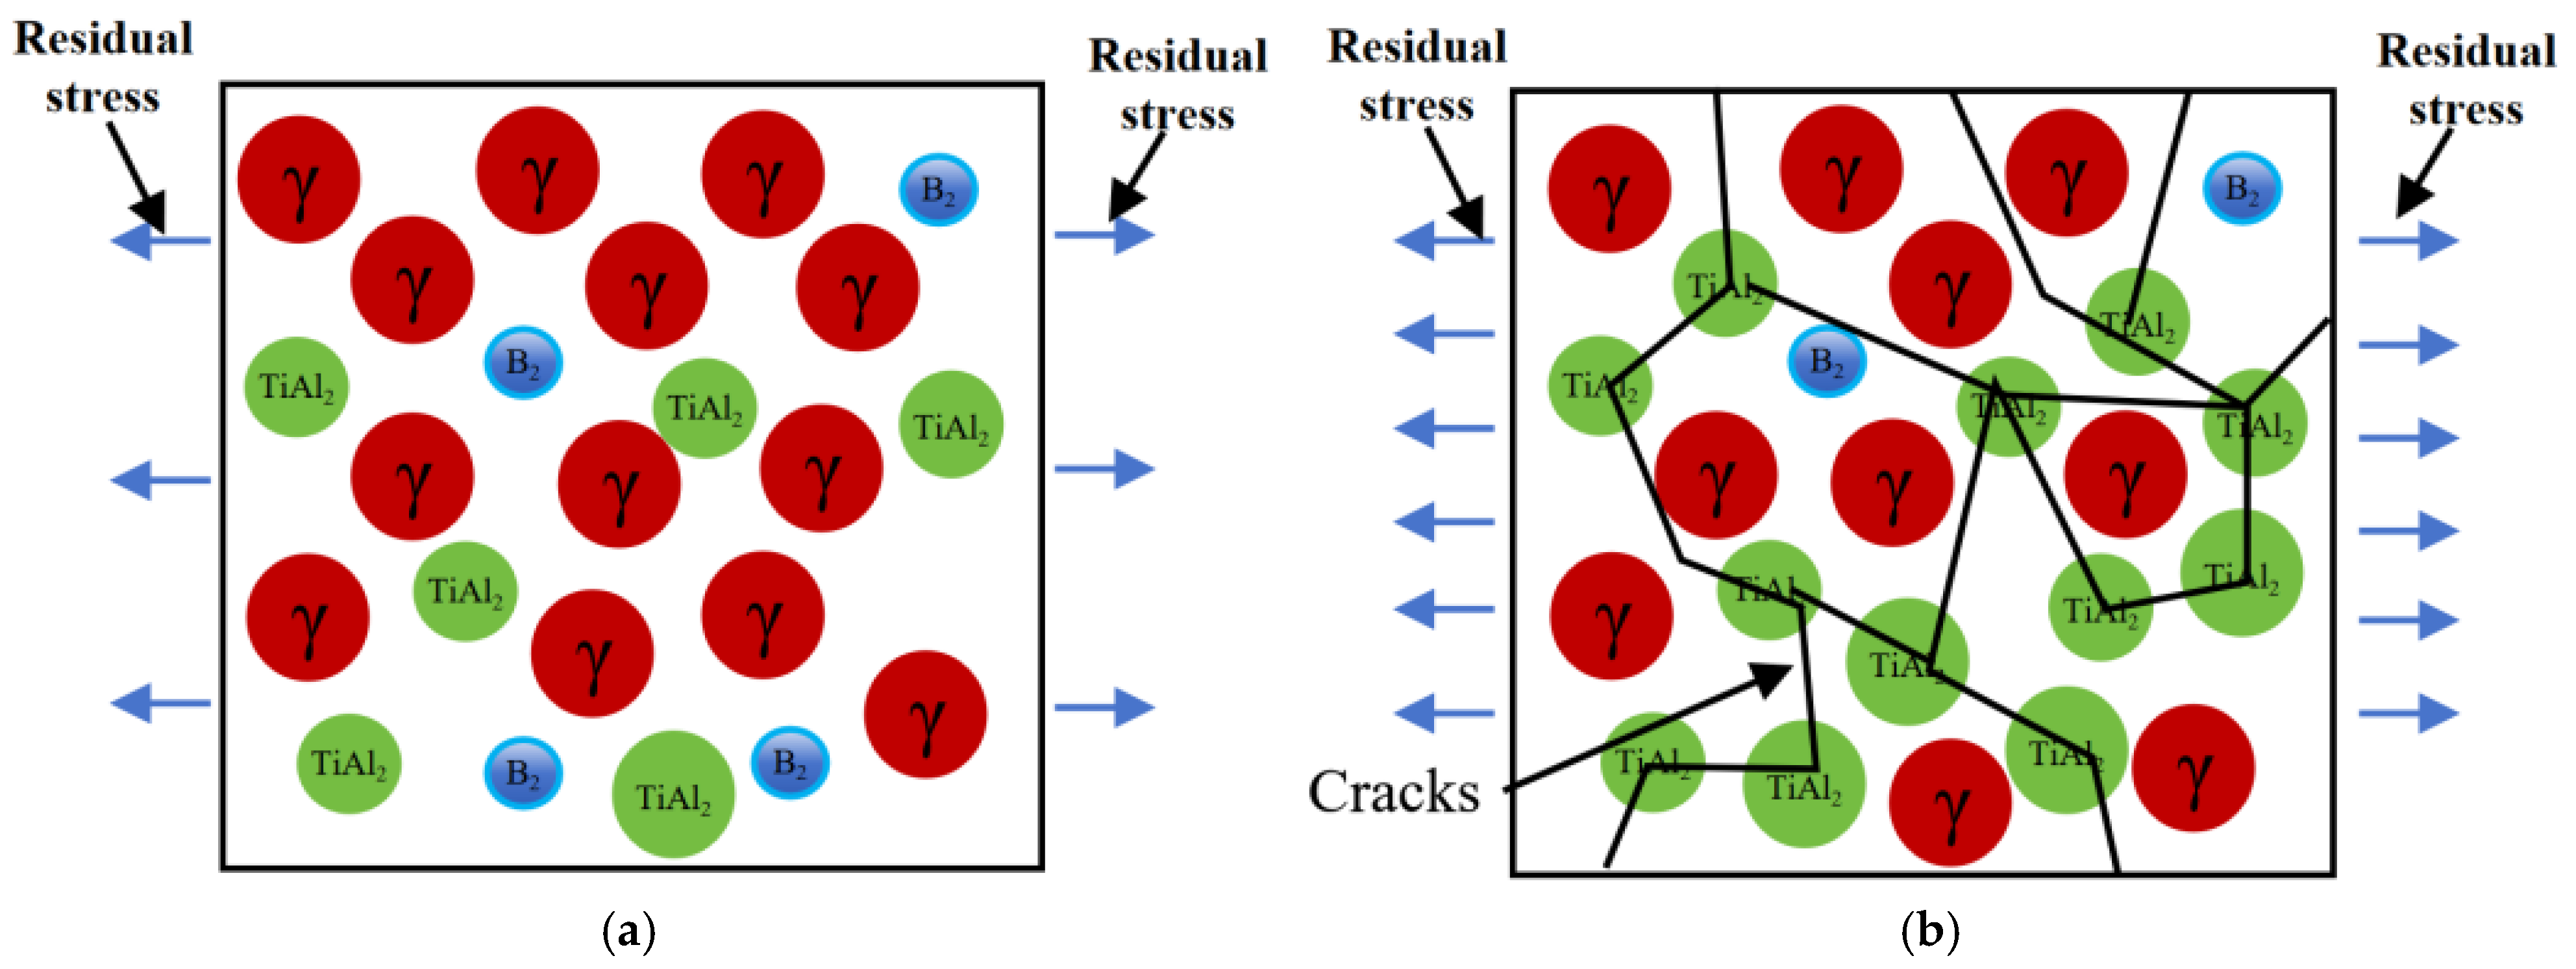
Figure 10 illustrates the schematic mechanism of Al addition on crack initiation and propagation, which is directly validated by the EBSD phase distribution results (Figure 6) and kernel average misorientation (KAM) analysis.
Figure 10.
Schematic diagram of the influence mechanism of Al addition amount on cracks in laser deposition manufacturing of TiAl alloys: (a) 15 wt.%Al; (b) 20 wt.%Al.
At a low Al addition of 15 wt.%, the γ-TiAl phase accounts for 86.7 vol.% and acts as a continuous ductile matrix, while TiAl2 (9.8 vol.%) and B2 (3.5 vol.%) phases exist as isolated, dispersed particles. This microstructural feature corresponds exactly to the schematic in Figure 10a. Under this condition, the limited area of phase boundaries and the uniformly distributed microstructure induce low lattice distortion and residual stress, as verified by the lowest average KAM value of 0.82°. The dispersed minor brittle phases cannot form a continuous brittle network or provide long-range propagation paths for cracks, thus fundamentally suppressing macroscopic crack initiation.
When the Al addition increases to 20 wt.%, the fraction of TiAl2 rises sharply to 33.6 vol.%. The originally isolated TiAl2 particles gradually interconnect and form a semi-continuous network along grain boundaries, which is consistent with the structural sketch in Figure 10b. Owing to the remarkable mismatch in the thermal expansion coefficient and elastic modulus between the hard brittle TiAl2 phase and the ductile γ-TiAl matrix, severe local stress concentration generates at phase interfaces during the rapid thermal cycle of laser deposition. This is confirmed by the elevated average KAM value of 1.04°, where high-strain regions are predominantly distributed at phase boundaries. These stress-concentrated interfaces act as preferential nucleation sites for microcracks, and the semi-continuous brittle phase network provides favorable propagation paths, leading to a significant increase in crack susceptibility.
For the 25 wt.% Al sample, the TiAl2 fraction further increases to 37.9 vol.% and brittle TiAl3 phase emerges, forming a nearly continuous intermetallic network. The massive brittle phases induce more severe microstructural heterogeneity and more widespread stress concentration sites, eventually resulting in the formation of interconnected dense crack networks.
3.4. The Influence of Al Addition on Mechanical Properties
3.4.1. The Influence of Al Addition on Microhardness
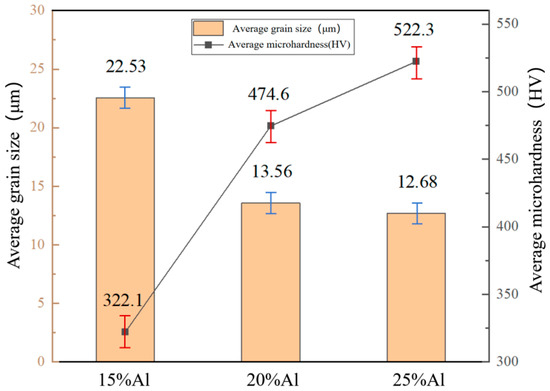
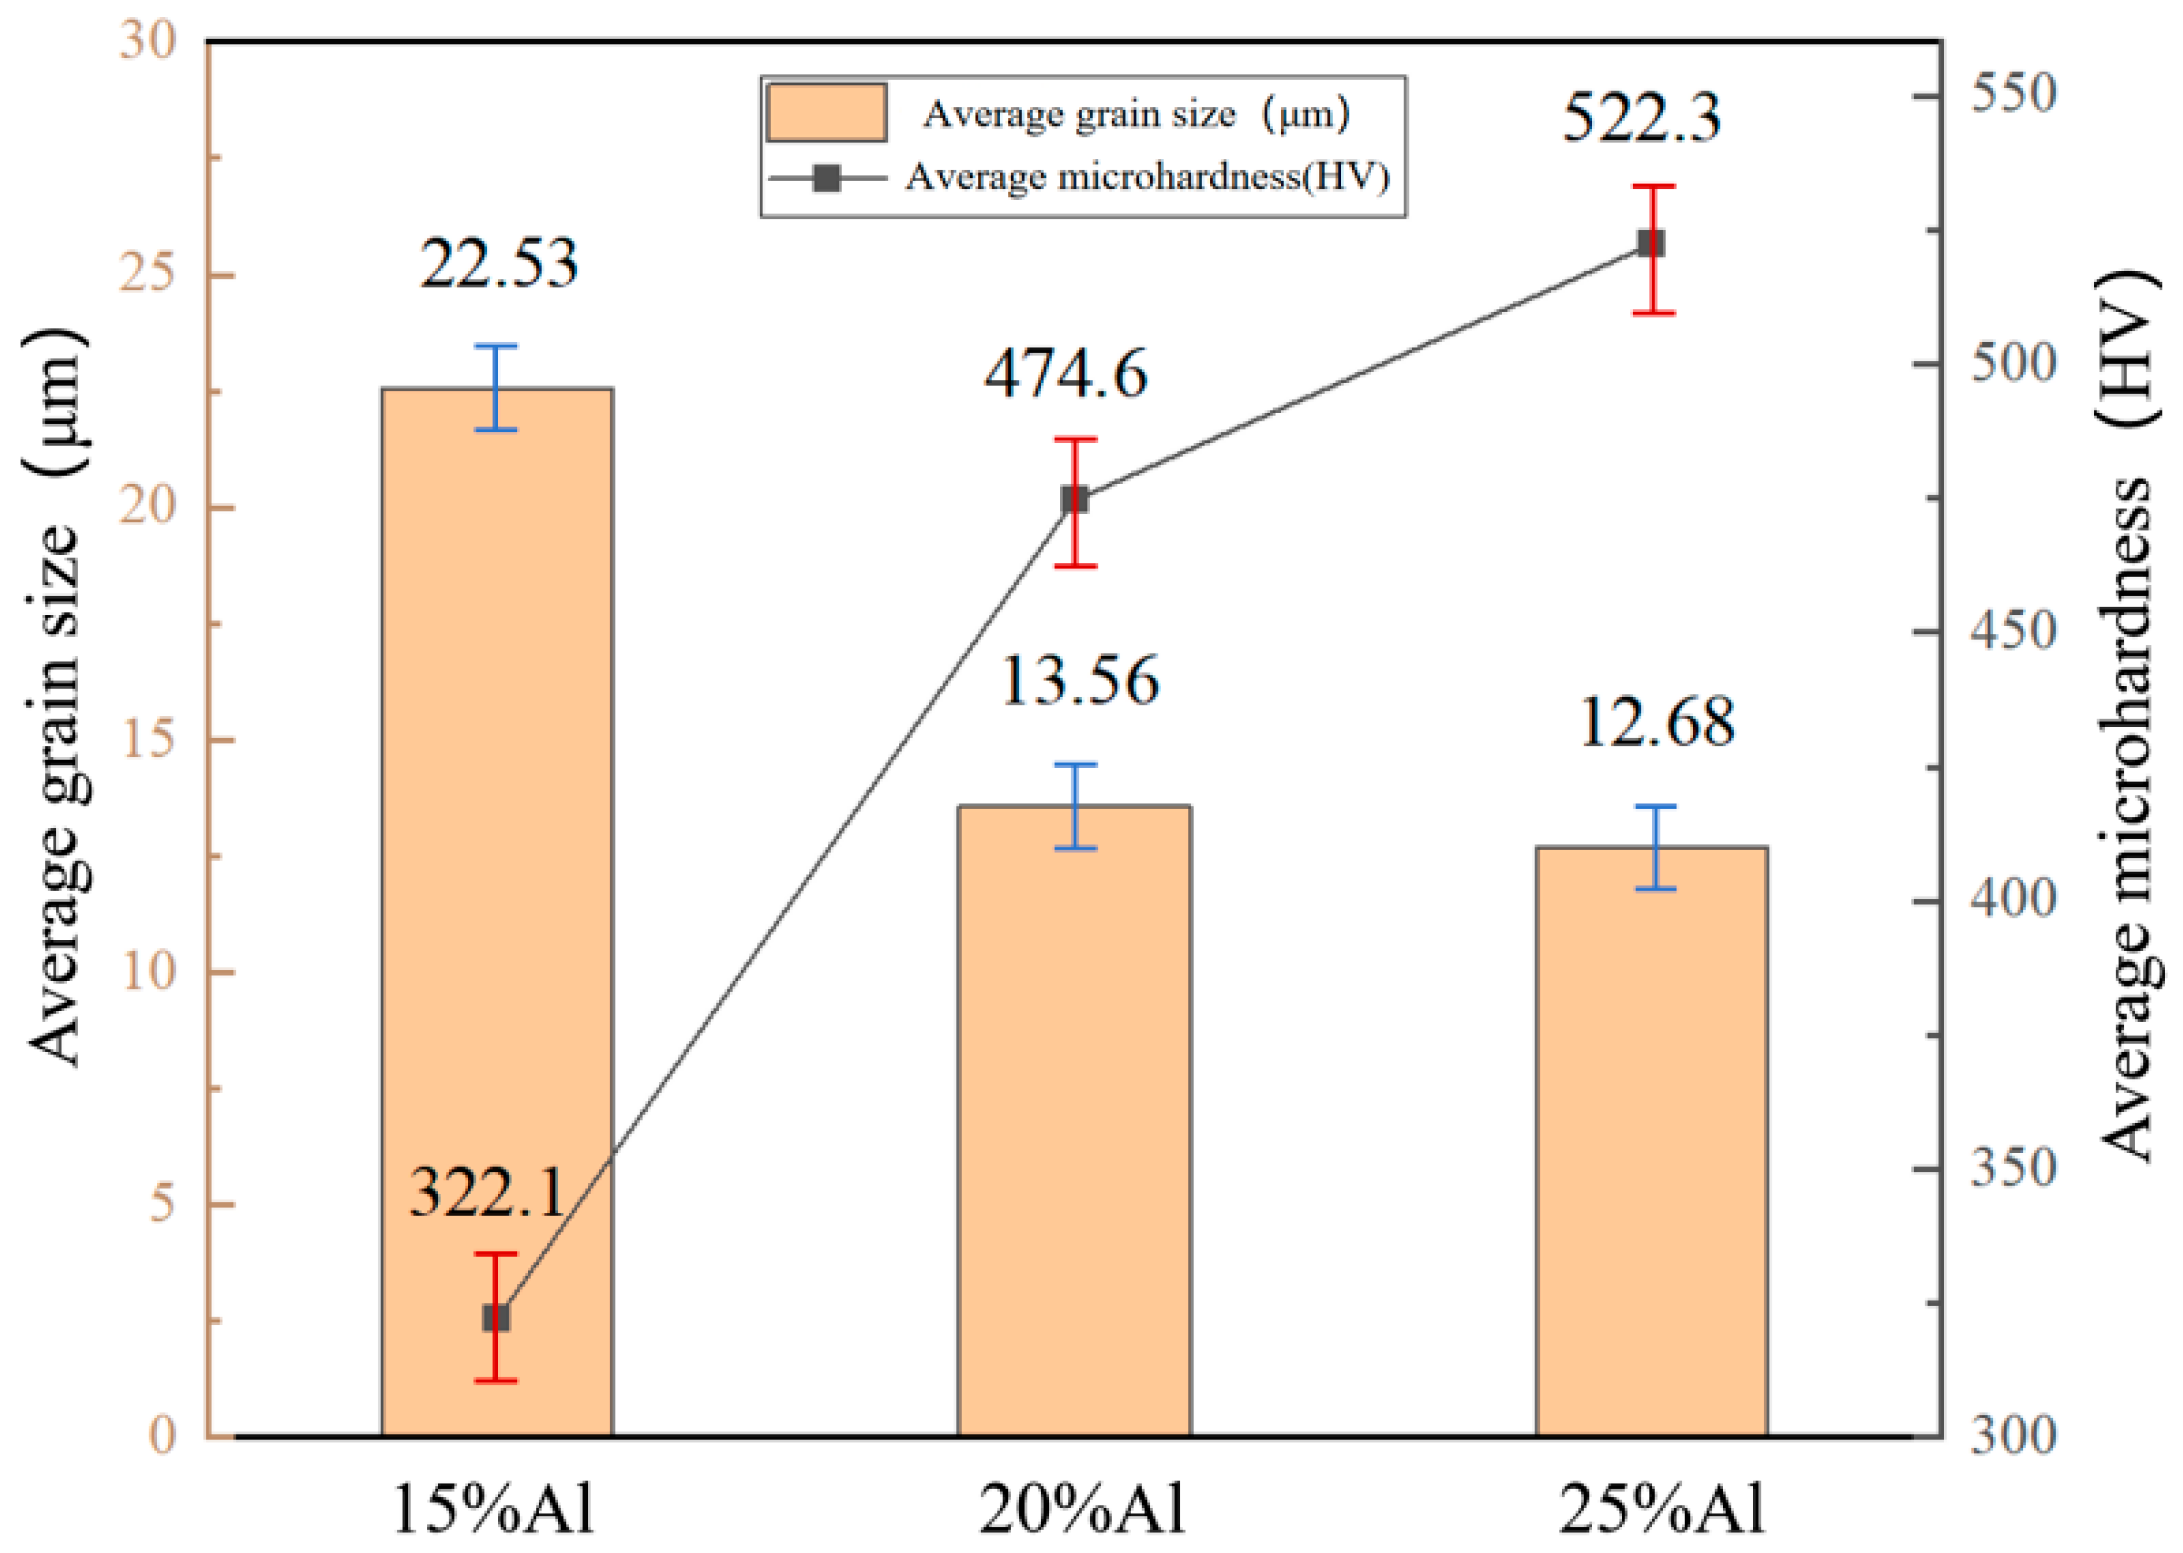
Figure 11 presents the average grain size and microhardness of the samples with different Al additions. The average grain size is 22.53 μm for the 15 wt.% Al sample, 13.56 μm for the 20 wt.% Al sample, and 12.68 μm for the 25 wt.% Al sample. The 25 wt.% Al sample possesses the finest grains, and its grain boundaries impose the strongest hindrance to dislocation motion. Under external loading, dislocations accumulate severely at grain boundaries and form high-density dislocation pile-ups. These pile-ups not only further inhibit dislocation glide but also induce severe stress concentration near grain boundaries, which restricts plastic deformation and thereby endows the sample with the highest microhardness. The 20 wt.% Al sample exhibits a slightly larger grain size than the 25 wt.% Al counterpart. Its grain boundaries show a relatively weaker blocking effect on dislocations, accompanied by a lower degree of dislocation accumulation. Accordingly, its microhardness is lower than that of the 25 wt.% Al sample but higher than that of the 15 wt.% Al sample. The 15 wt.% Al sample exhibits the largest average grain size and the smallest grain boundary area. In this case, dislocations can propagate smoothly within grains with a low probability of being blocked by grain boundaries, thereby resulting in the lowest microhardness among the three groups. The variation in microhardness with average grain size closely follows the classic Hall–Petch relationship, in which material strength is inversely proportional to the square root of grain size [27]. From a microscopic mechanism perspective, finer grains correspond to a larger total grain boundary area. As a special structural region, grain boundaries feature irregular atomic arrangement and relatively high energy. When moving dislocations encounter grain boundaries, their motion is strongly hindered and restrained. This effectively impedes dislocation slip, increases the difficulty of plastic deformation, and consequently improves the strength and microhardness of the material.
Figure 11.
Average grain size and microhardness of samples with different Al addition amounts. Three independent non-overlapping observation regions were taken for each sample.
3.4.2. The Influence of Al Addition on Tensile Properties
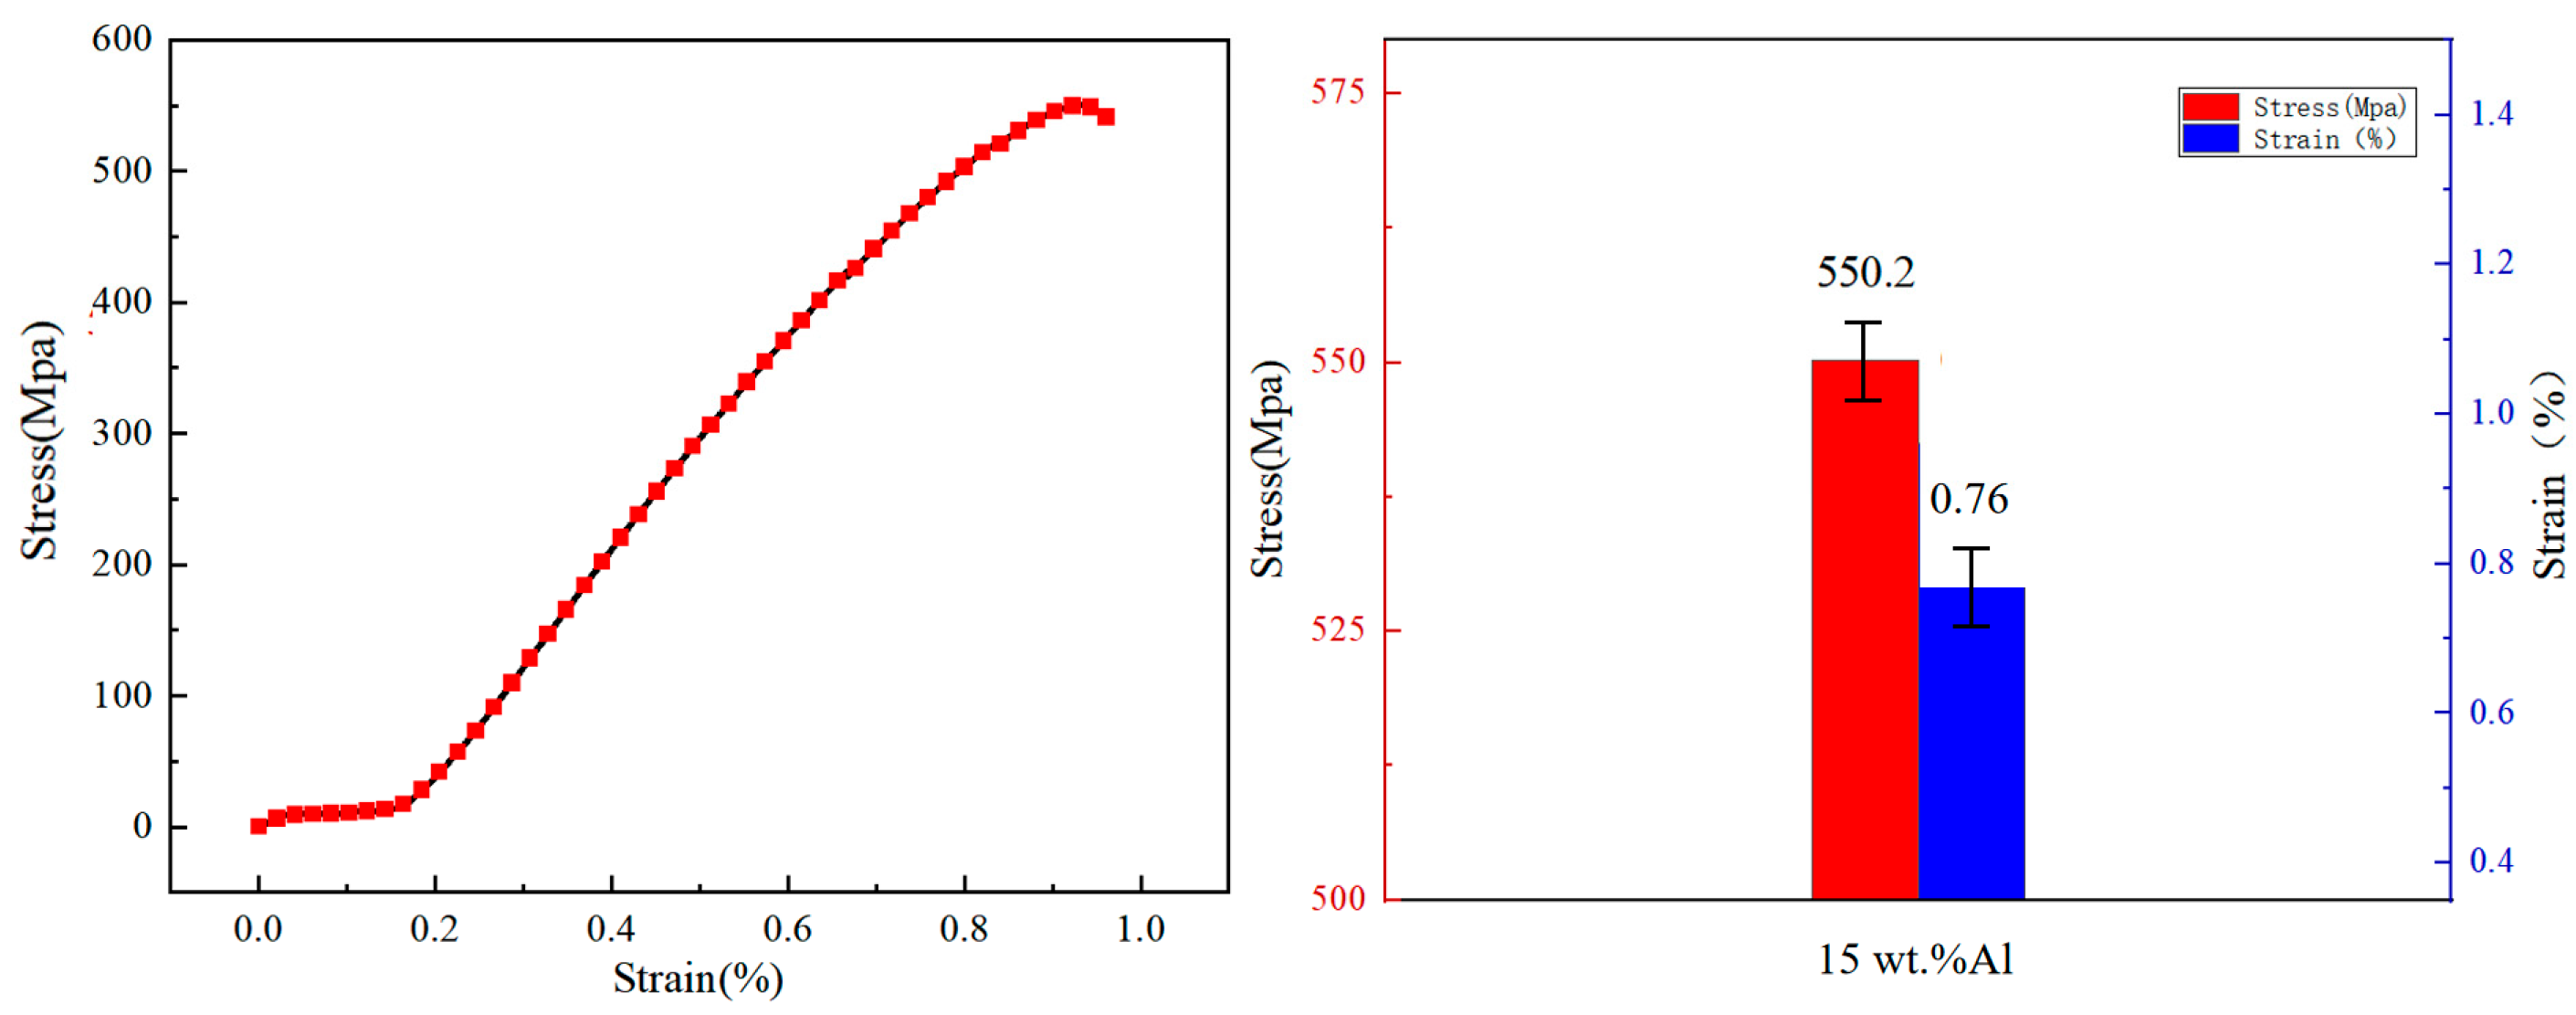
Due to severe cracking defects during fabrication, the samples with 20 wt.% and 25 wt.% Al additions failed to meet the dimensional requirements for tensile testing. Accordingly, only the TiAl alloy samples with 15 wt.% Al addition fabricated by laser deposition manufacturing were selected for the tensile performance evaluation in this work. Five parallel tensile specimens were tested for statistical reliability, and all experimental data are presented as the mean value ± standard deviation in accordance with the ASTM E8 standard. All specimens were extracted from the middle region of the deposited layer, approximately 5–10 mm above the substrate, to eliminate edge effects and minimize the influence of microstructure gradients on mechanical performance.
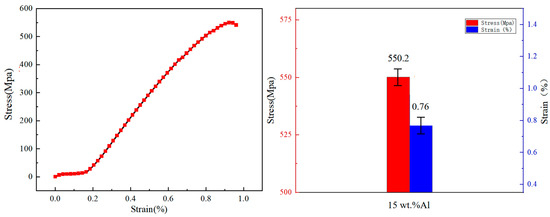
Figure 12 presents the room-temperature tensile stress–strain curves and corresponding statistical data of the 15 wt.% Al-doped laser deposition-manufactured TiAl alloy. The tensile test results show that the average ultimate tensile strength reaches 550.2 ± 15.3 Mpa, while the average elongation is measured as 0.76% ± 0.08.
Figure 12.
Tensile stress–strain curves and data statistics of specimens with 15 wt.% Al addition content.
The superior tensile strength originates from the combined action of multiple strengthening mechanisms induced by the LDM process and Al composition compensation. First, the rapid solidification inherent to laser deposition suppresses grain growth and yields a fine and uniform microstructure, producing a significant fine-grain strengthening effect. Second, the dissolution of additional Al atoms into the γ-TiAl matrix causes lattice distortion, giving rise to solid solution strengthening. More importantly, Al addition promotes the formation of fine and dispersed TiAl2 second-phase particles (Figure 6), which can effectively pin dislocations and impede their movement, exerting a notable dispersion strengthening effect. The synergistic effect of these factors collectively improves the tensile strength of the alloy.
Nevertheless, the introduction of extra Al also induces an obvious strength–ductility trade-off. The brittle TiAl2 intermetallic phase and the phase boundaries between it and the γ matrix act as strong barriers to dislocation movement, causing dislocations to accumulate readily at the interfaces. This increases local stress concentration and accelerates work hardening, leading to the premature loss of uniform plastic deformation capacity and a reduction in elongation.
Table 4 summarizes the room-temperature tensile properties of three TiAl-based materials, conventional as-cast TiAl alloy, laser-deposited (LDM) TiAl alloy without additional Al addition, and LDM TiAl alloy with 15 wt% Al powder supplementation. The results demonstrate that the LDM process markedly improves tensile strength relative to the cast counterpart; however, ductility exhibits a monotonic decline with increasing Al content.
Table 4.
Comparison of tensile properties of TiAl alloys.
The unmodified LDM TiAl alloy achieves a tensile strength of 469 Mpa, 56.3% higher than that of the as-cast alloy (300 Mpa). This enhancement is predominantly attributable to the rapid solidification inherent to LDM: the high cooling rate of the laser melt pool refines the γ-TiAl grain structure, eliminates casting-related defects, and promotes homogeneous elemental distribution—thereby maximizing solid solution strengthening.
Upon introducing 15 wt% supplemental Al, the tensile strength further increases to 550.2 Mpa, 17.3% above the unmodified LDM alloy and 83.4% above the as-cast alloy. This additional strengthening arises from the combined action of enhanced solid solution strengthening and dispersion strengthening by nano/microscale TiAl2 precipitates. Elevated Al content not only increases Al solubility in the γ matrix but also thermodynamically favors the formation of TiAl2, which forms as fine, uniformly distributed particles within the matrix. These particles act as effective obstacles to dislocation glide, thereby elevating yield and ultimate strength. Concurrently, fracture elongation decreases to 0.76% (after correction for the 0.2% machine compliance offset), representing a 30.9% reduction relative to the unmodified LDM sample. This ductility loss is primarily ascribed to the embrittling effect of TiAl2: its intrinsic brittleness and interfacial incoherence with the γ matrix promote localized stress concentration, facilitating early interfacial decohesion and microcrack nucleation during plastic deformation—ultimately curtailing macroscopic uniform elongation.
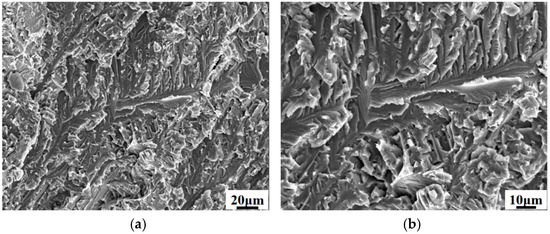
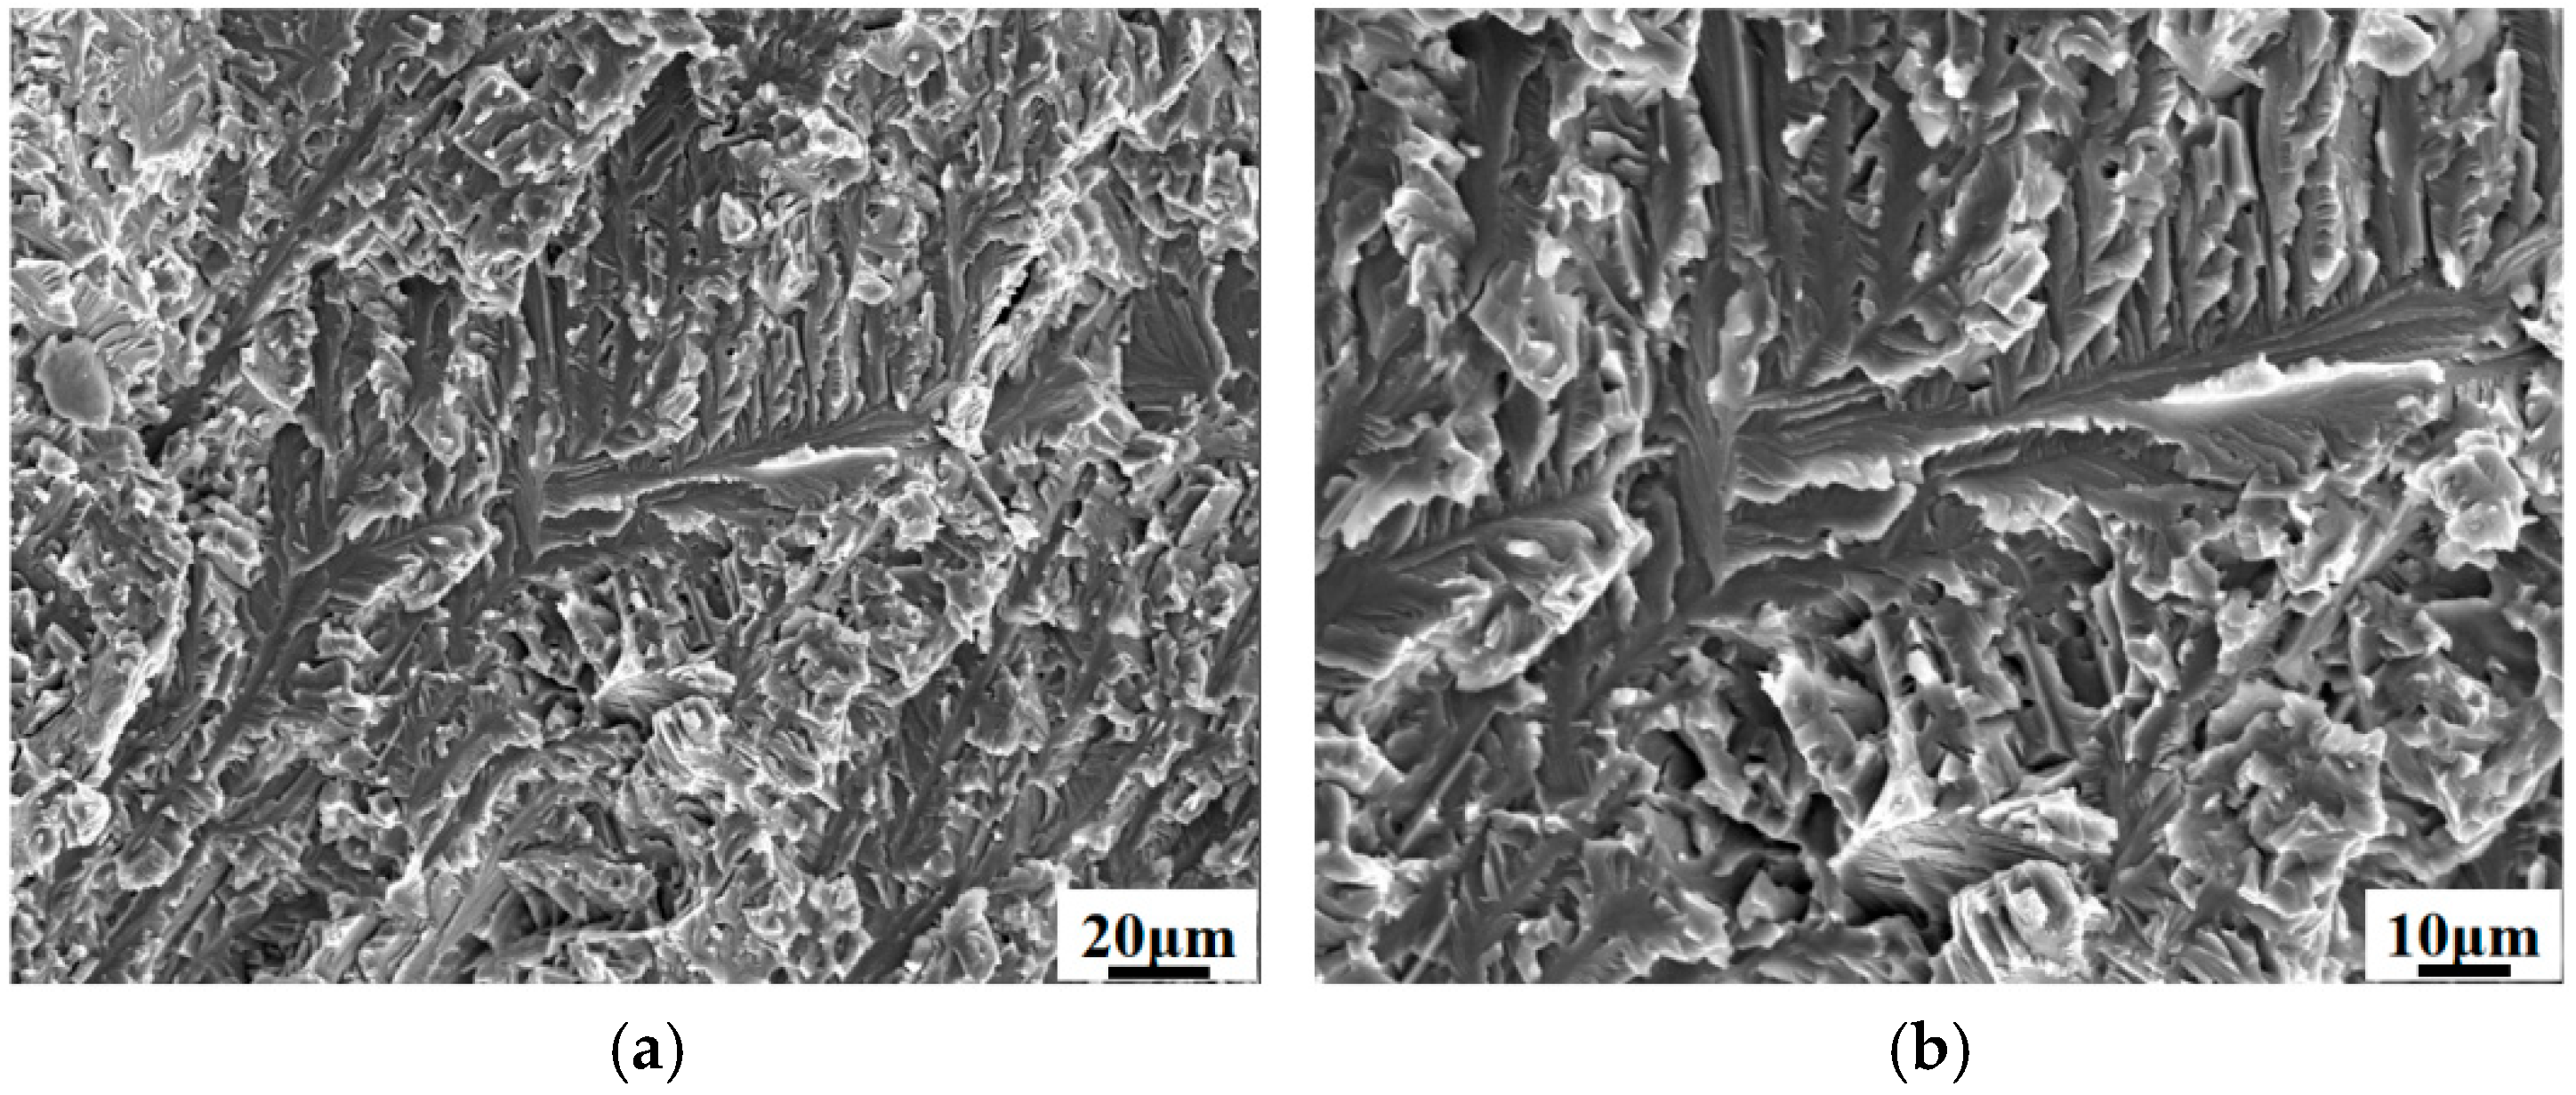
Figure 13 presents the tensile fracture morphology of the laser additive manufactured TiAl alloy specimen with 15 wt.% Al addition. The fracture surface exhibits characteristic features of brittle cleavage fracture, including distinct cleavage steps and river patterns. This morphology is consistent with the specimen’s mechanical behavior, demonstrating high tensile strength (550.2 Mpa) yet low elongation (0.76%). The brittle fracture mechanism is primarily attributed to the following microstructural features. Although the microstructure is predominantly composed of the more ductile γ-TiAl phase (86.7%), it contains a dispersion of brittle TiAl2 second phases (Figure 6a). The interfaces between these particles and the matrix act as potent stress concentrators, promoting microcrack initiation. Furthermore, while the overall microstructure is relatively uniform (Figure 2a), the grain size is comparatively large (22.53 μm, Figure 11). This limits the effectiveness of grain boundaries in hindering crack propagation. Consequently, cracks initiated at these brittle sites propagate rapidly with minimal resistance along cleavage planes, resulting in the observed flat fracture surface.
Figure 13.
Fracture morphology of the tensile test of the specimen with 15 wt.% Al addition: (a) fracture morphology (500×); (b) fracture morphology (1000×).
In summary, the addition of 15 wt.% Al enhances strength via solid solution, grain refinement, and second-phase strengthening mechanisms. However, this is accompanied by the introduction of brittle phases and a specific microstructure that collectively promote a cleavage-dominated brittle fracture mode, illustrating a direct trade-off between strength and ductility.
4. Conclusions
- Al addition content exerts a critical regulatory effect on the crack susceptibility, phase constitution and microstructure of laser deposition-manufactured TiAl alloys. At an Al addition of 15 wt.%, crack-free deposition is achieved. The alloy is dominated by a γ-TiAl matrix with a small amount of dispersedly distributed TiAl2 and B2 phases, and no α2-Ti3Al phase is detected. This composition corresponds to a uniform microstructure, weak lattice distortion and low residual internal stress. With increasing Al addition to 20 wt.% and 25 wt.%, the fractions of Al-rich intermetallic phases (TiAl2 and TiAl3) increase continuously, and the brittle phases evolve from isolated particles into a semi-continuous and eventually continuous network structure. This structural evolution induces severe stress concentration at phase boundaries and sharply elevates crack sensitivity. The 20 wt.% Al sample exhibits the highest level of residual lattice strain, while extensive crack initiation and propagation in the 25 wt.% Al sample release partial internal stress, yet the overall structural integrity deteriorates more severely and forms dense interconnected crack networks. The absence of the α2 phase is attributed to the Al compensation strategy, which shifts the overall alloy composition to the Al-rich side and thermodynamically suppresses the stability of Ti-rich α2-Ti3Al phase, representing the core phase difference from conventional laser-deposited TiAl alloys without Al compensation.
- Al addition significantly modulates the mechanical properties of the alloys, following an evident strength–ductility trade-off relationship. The microhardness increases monotonously with rising Al content, and the 25 wt.% Al sample reaches the maximum value of 522.3 HV, which is attributed to the combined effects of grain refinement strengthening and second-phase strengthening. The 15 wt.% Al sample exhibits the optimal comprehensive mechanical performance, with an ultimate tensile strength of 550.2 Mpa and a fracture elongation of 0.76%. The strength improvement arises from the synergistic action of fine-grain strengthening induced by the rapid solidification of the LDM process, solid solution strengthening from dissolved Al atoms, and dispersion strengthening from fine TiAl2 precipitates. The reduction in ductility is associated with stress concentration at brittle phase boundaries and premature microcrack nucleation during plastic deformation.
- The Al composition compensation strategy proposed in this work can effectively compensate for the Al volatilization loss during laser deposition manufacturing. The 15 wt.% Al addition achieves a favorable balance among crack suppression, microstructure optimization and mechanical property guarantee, which provides a feasible experimental basis and technical reference for crack control and performance optimization of TiAl alloys fabricated by laser additive manufacturing.
Author Contributions
Conceptualization, Y.C. and Y.Y.; methodology, Y.Y. and B.C.; validation, Y.C., Y.Y. and B.C.; investigation, Y.C.; resources, B.C.; data curation, Y.C.; writing—original draft preparation, Y.C.; writing—review and editing, Y.Y. and B.C.; funding acquisition, B.C. All authors have read and agreed to the published version of the manuscript.
Funding
This research was funded by Basic Research Project of Liaoning Provincial Department of Education.
Data Availability Statement
The original contributions presented in this study are included in the article. Further inquiries can be directed to the corresponding author.
Conflicts of Interest
The authors declare no conflicts of interest.
References
- Xu, R.; Li, M.; Zhao, Y. A review of microstructure control and mechanical performance optimization of γ-TiAl alloys. J. Alloys Compd. 2023, 932, 167611. [Google Scholar] [CrossRef] [Scilit]
- Niu, H.Z.; Chen, Y.Y.; Xiao, S.L.; Xu, L.J. Microstructure evolution and mechanical properties of a novel beta γ-TiAl alloy. Intermetallics 2012, 31, 225–231. [Google Scholar] [CrossRef] [Scilit]
- Huang, D.; Dong, Y.; Chen, H.; Zhou, Y.; Zhang, M.X.; Yan, M. Effects of processing parameters on a β-solidifying TiAl alloy fabricated by laser-based additive manufacturing. Microstructures 2022, 2, 2022019. [Google Scholar] [CrossRef] [Scilit]
- Bewlay, B.P.; Nag, S.; Suzuki, A.; Weimer, M.J. TiAl alloys in commercial aircraft engines. Mater. High Temp. 2016, 33, 549–559. [Google Scholar] [CrossRef] [Scilit]
- Wang, Z.; Zheng, G.; Qi, Z.; Chen, Y.; Xu, H.; Xiang, H.; Chen, G. Structures, microstructures, properties, and applications of TiAl alloys. Chin. Sci. Bull. 2023, 68, 3259–3274. [Google Scholar] [CrossRef] [Scilit]
- Yang, Y.; Jiang, R.; Han, C.; Chen, J.; Li, H.; Wang, Y.; Wang, D. Frontiers in laser additive manufacturing technology. Addit. Manuf. Front. 2024, 3, 200160. [Google Scholar] [CrossRef] [Scilit]
- Gong, G.; Ye, J.; Chi, Y.; Zhao, Z.; Wang, Z.; Xia, G.; Du, X.; Tian, H.; Yu, H.; Chen, C. Research status of laser additive manufacturing for metal: A review. J. Mater. Res. Technol. 2021, 15, 855–884. [Google Scholar] [CrossRef] [Scilit]
- Li, N.; Huang, S.; Zhang, G.; Qin, R.; Liu, W.; Xiong, H.; Blackburn, J. Progress in additive manufacturing on new materials: A review. J. Mater. Sci. Technol. 2019, 35, 242–269. [Google Scholar] [CrossRef] [Scilit]
- Wang, Y.D.; Tang, H.B.; Fang, Y.L.; Wang, H.M. Microstructure and mechanical properties of laser melting deposited 1Cr12Ni2WMoVNb steel. Mater. Sci. Eng. A 2010, 527, 4804–4809. [Google Scholar] [CrossRef] [Scilit]
- Sedighi, A.M.; Nabavi, S.F.; Farshidianfar, A. A review on effect of cooling rate on metallurgical, mechanical, geometrical characteristics and defects of laser cladding process. Lasers Manuf. Mater. Process. 2024, 11, 677–742. [Google Scholar] [CrossRef] [Scilit]
- Chen, Y.; Zhang, K.; Huang, J.; Hosseini, S.R.E.; Li, Z. Characterization of heat affected zone liquation cracking in laser additive manufacturing of Inconel 718. Mater. Des. 2016, 90, 586–594. [Google Scholar] [CrossRef] [Scilit]
- Mehta, A.; Zhou, L.; Huynh, T.; Park, S.; Hyer, H.; Song, S.; Sohn, Y. Additive manufacturing and mechanical properties of the dense and crack free Zr-modified aluminum alloy fabricated by the laser-powder bed fusion. Addit. Manuf. 2021, 41, 101966. [Google Scholar] [CrossRef] [Scilit]
- Uddin, S.Z.; Murr, L.E.; Terrazas, C.A.; Morton, P.; Roberson, D.A.; Wicker, R.B. Processing and characterization of crack-free aluminum 6061 using high-temperature heating in laser powder bed fusion additive manufacturing. Addit. Manuf. 2018, 22, 405–415. [Google Scholar] [CrossRef] [Scilit]
- Soliman, H.A.; Elbestawi, M. Titanium aluminides processing by additive-manufacturing-a review. Int. J. Adv. Manuf. Technol. 2022, 119, 5583–5614. [Google Scholar] [CrossRef] [Scilit]
- Zheng, G.; Tang, B.; Zhao, S.; Wang, W.Y.; Chen, X.; Zhu, L.; Li, J. Evading the strength-ductility trade-off at room temperature and achieving ultrahigh plasticity at 800 °C in a TiAl alloy. Acta Mater. 2022, 225, 117585. [Google Scholar] [CrossRef] [Scilit]
- Cui, B.; Liu, W.; Bian, H.; Chen, K.; Xu, X. Investigation of the influence of process parameters on crack formation and mechanisms in Ti-48Al-2Cr-2Nb alloy via laser directed energy deposition. Mater. Res. Express 2023, 10, 126509. [Google Scholar] [CrossRef] [Scilit]
- Stark, A.; Bartels, A.; Clemens, H.; Schimansky, F.P. On the formation of ordered ω-phase in high Nb containing γ-TiAl based alloys. Adv. Eng. Mater. 2008, 10, 929–934. [Google Scholar] [CrossRef] [Scilit]
- Rittinghaus, S.K.; Molina Ramirez, V.R.; Zielinski, J.; Hecht, U. Oxygen gain and aluminum loss during laser metal deposition of intermetallic TiAl. J. Laser Appl. 2019, 31, 042005. [Google Scholar] [CrossRef] [Scilit]
- Ghibaudo, C.; Wartbichler, R.; Marchese, G.; Clemens, H.; Ugues, D.; Biamino, S. Influence of focus offset on the microstructure of an intermetallic γ-TiAl based alloy produced by electron beam powder bed fusion. J. Manuf. Process. 2023, 89, 132–141. [Google Scholar] [CrossRef] [Scilit]
- Cui, B.; Liu, W.; Bian, H. Influence of Substrate Preheating on the Formation of Cracks and Microstructure in Ti-48Al-2Cr-2Nb Alloy via Laser Directed Energy Deposition. Mater. Trans. 2024, 65, 597–602. [Google Scholar] [CrossRef] [Scilit]
- Shi, X.; Wang, H.; Feng, W.; Zhang, Y.; Ma, S.; Wei, J. The crack and pore formation mechanism of Ti-47Al-2Cr-2Nb alloy fabricated by selective laser melting. Int. J. Refract. Met. Hard Mater. 2020, 91, 105247. [Google Scholar] [CrossRef] [Scilit]
- Li, Q.; Yu, Y.; Wang, Y.; Shi, H.; Xu, X.; He, W.; Kou, H. Eliminating Layered Structure through Cyclic Heat Treatment in SEBM-Fabricated TiAl Alloy and Enhanced Tensile Properties. Mater. Sci. Eng. A 2026, 962, 150223. [Google Scholar] [CrossRef] [Scilit]
- Wang, H.; Zhao, L.; Peng, Y. Effects of laser power on microstructure and mechanical properties of TiAl-based alloys fabricated via laser melting deposition. J. Mater. Res. Technol. 2026, 41, 7309–7321. [Google Scholar] [CrossRef] [Scilit]
- Jiang, L.; Lan, L.; Bai, C.; Wang, H.; Gao, S.; He, B. Research progress on powder bed fusion additive manufacturing of TiAl-based alloy. Int. J. Adv. Manuf. Technol. 2024, 133, 1045–1061. [Google Scholar] [CrossRef] [Scilit]
- Gussone, J.; Hagedorn, Y.C.; Gherekhloo, H.; Kasperovich, G.; Merzouk, T.; Hausmann, J. Microstructure of γ-titanium aluminide processed by selective laser melting at elevated temperatures. Intermetallics 2015, 66, 133–140. [Google Scholar] [CrossRef] [Scilit]
- ASTM E8; Standard Test Methods for Tension Testing of Metallic Materials. ASTM International: West Conshohocken, PA, USA, 2022.
- Naik, S.N.; Walley, S.M. The Hall–Petch and inverse Hall–Petch relations and the hardness of nanocrystalline metals. J. Mater. Sci. 2020, 55, 2661–2681. [Google Scholar]
- Kim, Y.W.; Kim, S.L. Advances in gammalloy materials-processes-application technology: Successes, dile mmas, and future. JOM 2018, 70, 553–560. [Google Scholar] [CrossRef] [Scilit]
- Liu, Z.Q.; Ma, R.X.; Xu, G.J.; Wang, W.B.; Su, Y.H. Effects of annealing on microstructure and mechanical properties of γ-TiAl alloy fabricated via laser melting deposition. Trans. Nonferrous Met. Soc. China 2020, 30, 917–927. [Google Scholar] [CrossRef] [Scilit]

Disclaimer/Publisher’s Note: The statements, opinions and data contained in all publications are solely those of the individual author(s) and contributor(s) and not of MDPI and/or the editor(s). MDPI and/or the editor(s) disclaim responsibility for any injury to people or property resulting from any ideas, methods, instructions or products referred to in the content. |
© 2026 by the authors. Licensee MDPI, Basel, Switzerland. This article is an open access article distributed under the terms and conditions of the Creative Commons Attribution (CC BY) license.