


Abstract
This study systematically investigates the effect of Ce doping on the microstructure and hydrogen compression performance of Ti-based AB2-type Ti0.94Zr0.08Cr1.0Mn0.4Fe0.6Cex (x = 0, 0.01, 0.02, 0.03, 0.04) alloys for hydrogen compression targeting 25 MPa. The results show that Ce doping does not alter the main phase of the alloys, which remains the C14 Laves phase. The effect of Ce doping on lattice parameters is negligible, and Ce exists mainly in two forms: elemental Ce and CeO2. Within the test temperature range of −80 to −50 °C, the hydrogen storage capacity first increases and then decreases as the Ce doping increases, while the hydrogen absorption kinetics are noticeably improved. Pressure–composition isotherms exhibit a single plateau, and Ce doping lowers the plateau pressure. Ce doping significantly reduces the slope factor and hysteresis factor, and the absolute values of both absorption and desorption enthalpies decrease with increasing Ce content. The compression factor did not vary monotonically: based on van’t Hoff extrapolation to 30 °C for absorption and 80 °C for desorption, it peaked at 2.05 when x = 0.02, while the x = 0.03 alloy achieves a desorption pressure of 57.24 MPa at 80 °C. Overall, Ce doping at x = 0.02 is the optimal content among the series of alloys for tuning the plateau pressure, improving plateau flatness, reducing hysteresis, and enhancing hydrogen compression performance, demonstrating promising potential for low-grade heat-driven hydrogen compression in refueling infrastructure.
1. Introduction
Driven by shrinking fossil fuel supplies and the need for deep decarbonization, the global energy system is changing fundamentally. Hydrogen, which is renewable, clean, stores a large amount of energy per unit mass, and emits no carbon when used, is widely seen as one of the strongest alternatives to fossil fuels [1,2,3]. The rapid proliferation of hydrogen fuel cell vehicles has intensified the demand for hydrogen refueling stations (HRSs), which serve as critical nodes in the hydrogen supply chain. The IEA’s Global Hydrogen Review 2025 finds that policies already enshrined in legislation could support close to 6 Mtpa of low-emission hydrogen demand in 2030, while aggregated government demand goals reach 9.5 Mtpa. This gap highlights how indispensable hydrogen infrastructure is for scaling up fuel-cell vehicle adoption [4,5].
For HRSs, the hydrogen compressor is a key component, as it must boost hydrogen pressure to satisfy the demanding specifications of onboard high-pressure storage tanks [6]. Today, commercial HRSs are still largely equipped with mechanical compressors, particularly diaphragm and piston designs [7]. These mechanical systems, however, have inherent shortcomings, such as safety risks, pronounced vibration and noise, high upkeep expenses, and substantial electricity consumption [6,8]. By contrast, metal hydride hydrogen compressors (MHHCs) have become a promising non-mechanical substitute. They use a distinctive thermodynamic feature of hydrogen storage alloys: the hydrogen desorption plateau pressure rises exponentially with temperature, which allows hydrogen pressurization with no moving components [8]. Their benefits are numerous, including safer operation, environmental compatibility, no vibration or noise, reliable sealing, built-in hydrogen purification, reduced maintenance requirements, and the option of using low-grade waste heat rather than electricity.
The two key performance indicators of MHHCs—hydrogen compression ratio and effective hydrogen compression capacity—are essentially controlled by the thermodynamic characteristics of the materials used for compression [7]. For MHHC applications, hydrogen storage alloys have to fulfill multiple stringent demands: plateau pressures must be accurately matched among stages, while the material should also exhibit high reversible capacity, a low plateau slope, small hysteresis, easy activation, fast kinetics, strong resistance to impurities, and reliable cycling stability [9]. Within the available families of hydrogen storage alloys, AB5-type (LaNi5-based) and AB2-type (TiCr2- and ZrFe2-based) intermetallics are considered the most promising options for hydrogen compression [10]. In particular, TiCr2-based alloys with a C14 hexagonal Laves phase offer higher hydrogen storage capacity and readily tunable plateau pressures, and are therefore especially appropriate for the intermediate and final compression stages [6].
Researchers have made extensive efforts to tailor the hydrogen-compression behavior of Ti-based AB2-type alloys by adjusting their composition. In the Ti-Zr-Cr-Mn-Fe-V system, Cao et al. revealed a clear trade-off: progressively replacing Fe with Cr raised the plateau pressure but lowered the hydrogen storage capacity, whereas using Mn in place of Cr produced a notable gain in capacity and also improved plateau behavior by flattening the plateau and decreasing the slope factor [7]. Zhou et al. studied Ti-Zr-Mn-Cr-V alloys intended for high-density hydrogen storage and confirmed that changing the elemental makeup is an effective route for regulating both plateau pressure and storage capacity [11]. Peng et al., who reviewed the design of three-stage MHHCs, concluded that TiCr2-based alloys are the leading option for the intermediate and final compression stages [10]. Xu et al. recently prepared C15-structured Zr-Ti-Fe-Ni-V alloys through a high-Ni/low-V compositional design combined with quenching; these alloys exhibited hydrogen compression ratios of 2.61–3.67 and effective capacities above 0.80 wt.% [8]. For the same alloy family, our earlier study of Ti0.94Zr0.08Cr1.0Mn0.6-xFe0.4+x (x = 0–0.4) alloys identified a composition with a compression factor of 1.99 for 25 MPa hydrogen compression, indicating that this system is promising for first-stage MHHC applications [12].
Despite these advances, a critical bottleneck persists: the pressure–composition–temperature (PCT) isotherms of Ti-based AB2 alloys exhibit pronounced hysteresis between absorption and desorption, alongside a noticeably sloping plateau. Large hysteresis is widely considered undesirable because it increases the energy demand required to complete the hydrogenation–dehydrogenation cycle [10]. The sloping plateau diminishes the fraction of hydrogen that can be reversibly cycled within the targeted pressure window, thereby undermining both compression efficiency and effective capacity [6]. These shortcomings are particularly detrimental for primary compression, where precise pressure control and high reversible capacity must be achieved simultaneously. Furthermore, activation difficulty remains a practical obstacle for many Ti-based AB2 alloys.
Rare earth doping has been identified as a potent strategy for mitigating these limitations. Cerium, in particular, possesses a high affinity for oxygen and can effectively scavenge dissolved oxygen impurities to form CeO2, a process that lowers the oxygen concentration in the alloy matrix and promotes compositional homogenization [9]. A recent study on Al–Ce co-doping in Ti–Zr–Cr–Mn-based AB2 alloys revealed that Ce incorporation induces lattice expansion that weakens metal–hydrogen interactions, while simultaneously suppressing elemental segregation, resulting in significantly reduced hysteresis factor (Hf = 0.214) and rapid room-temperature activation [13]. Wu et al. reported that the addition of Ce to Ti1−xCexV0.45Mn1.5 alloys promotes the formation of CeO2 phases, which are responsible for enhancing absorption and desorption kinetics due to the catalytic effect of CeO2 [14]. Liu et al. further reported that rare earth doping in Ti1.02Cr1.1Mn0.3Fe0.6RE0.03 (RE = La, Ce, Ho) alloys expands the unit cell volume of the C14 Laves main phase, improves activation behavior, and increases hydrogen storage capacity, with the desorption plateau slope reduced to 0.098 for the La-doped alloy [2]. Moreover, comprehensive investigations on Ce substitution for A-side elements in Ti-Mn-based AB2 alloys have demonstrated that Ce substitution significantly enhances hydrogen storage and cyclic performance, with Ce substituting for Ti leading to lower formation energy and easier hydrogen absorption [15]. A separate study on Ce-doped TiZrCrMn alloys similarly reported that Ce addition improves activation, enhances hydrogen storage capacity, reduces hysteresis, and optimizes cycle life [16].
Despite these encouraging advances, the specific influence of Ce doping on the Ti0.94Zr0.08Cr1.0Mn0.4Fe0.6 alloy system, which has been identified as a promising candidate for 25 MPa primary hydrogen compression, remains unexplored. The present work therefore aims to systematically investigate the effect of Ce doping on the microstructure and hydrogen compression performance of Ti0.94Zr0.08Cr1.0Mn0.4Fe0.6 alloy. The microstructure, thermodynamic parameters, kinetic properties and plateau characteristics are comprehensively characterized through X-ray diffraction, SEM, TEM, pressure–composition–temperature (PCT) measurements, and Van’t Hoff analysis. This work aims to clarify how Ce doping governs plateau hysteresis and slope, and thereby to formulate a rational composition-design strategy for Ti-based AB2-type hydrogen-compression alloys that deliver higher effective reversible capacity and lower thermodynamic irreversibility in 1st-stage MHHC applications at hydrogen refueling stations.
2. Experimental Details
2.1. Alloy Preparation
Target alloys with compositions Ti0.94Zr0.08Cr1.0Mn0.4Fe0.6Cex (x = 0, 0.01, 0.02, 0.03, 0.04) were prepared. All raw materials (Ti, Zr, Mn, Cr, Fe, Ce) had purities exceeding 99.9% and were weighed with an accuracy of 0.0001 g, with allowances made for anticipated material losses during processing. Melting was performed using a WI A vacuum induction furnace. After the melt had cooled and solidified, the oxide layer on the ingot surface was removed. The ingot was then crushed and ground into powder, and the powder was passed through a 200-mesh sieve to collect the fraction suitable for the subsequent experiments, namely composition analysis, activation, and PCT measurements.
A JY2000-2 inductively coupled plasma optical emission spectrometer (ICP-OES, HORIBA, Longjumeau, France) equipped with Smart Analyzer analysis software (Version 5.01) was used to determine the elemental composition of hydrogen storage alloys. An alloy sample of 0.1600 g was accurately weighed into a polytetrafluoroethylene (PTFE) beaker, mixed nitric and hydrochloric acids were added, and the sample was digested by low-temperature heating on a hot plate. After the sample was completely dissolved and the solution became clear, it was cooled, transferred to a 100 mL volumetric flask, and made up to volume. The solution was appropriately diluted according to the elemental concentrations to prepare the test solution. Before testing, the exhaust, argon, and water-cooling systems were turned on sequentially. After plasma ignition, the system was stabilized for 30 min, and standard curve calibration was completed. The blank, standard sample, and test solution were measured sequentially; between sample measurements, the injection tubing was flushed with deionized water to avoid cross-contamination.
2.2. Structure Characterization
The crystal structures of the alloys were characterized by X-ray diffractometer (XRD, SmartLab, Rigaku, Tokyo, Japan, λ = 1.5418 Å, 45 kV, 200 mA, 2θ = 20–120°, 5°/min), field-emission transmission electron microscopy (FETEM, EOL Ltd., Tokyo, Japan, JEM-2100F, 200 kV), and field-emission scanning electron microscopy (FESEM, TESCAN GAIA-3, Brno, Czech Republic, 15 kV) combined with energy-dispersive X-Ray spectroscopy (EDS, ULTIMMAX 40, Oxford, UK).
2.3. Hydrogen Compression Performance Evaluation
The activation behavior, kinetic properties, and PCT characteristics of the study alloys were assessed with an automated Sievert-type instrument (H2PCT-3101NiH, Yangzhou Yinghui Zhiyue Technology Co., Ltd., Yang Zhou, China). Before testing, the alloys were ground to 200 mesh under argon protection, and approximately 1.6000 g of the powder was placed in a reaction tube. Activation was conducted using high-purity hydrogen (99.999%) at 7.5 MPa. The activation process involved evacuation at 373 K for 1 h, followed by hydrogen absorption at −80 °C for 2 h; this cycle was repeated until no further change in hydrogen uptake was observed, indicating complete activation. After full activation, the system was evacuated again for 1 h. Subsequently, kinetic and PCT curves were recorded at −50, −60, −70, and −80 °C under a hydrogen pressure of 7 MPa. All hydrogen ab/de-sorption steps and data collection were automatically controlled. The entire experiment was performed in a low-temperature thermostat bath.
3. Results and Discussion
3.1. Microstructure Characterization
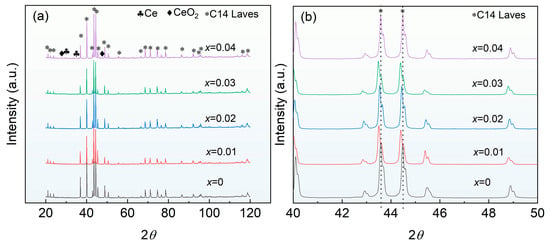
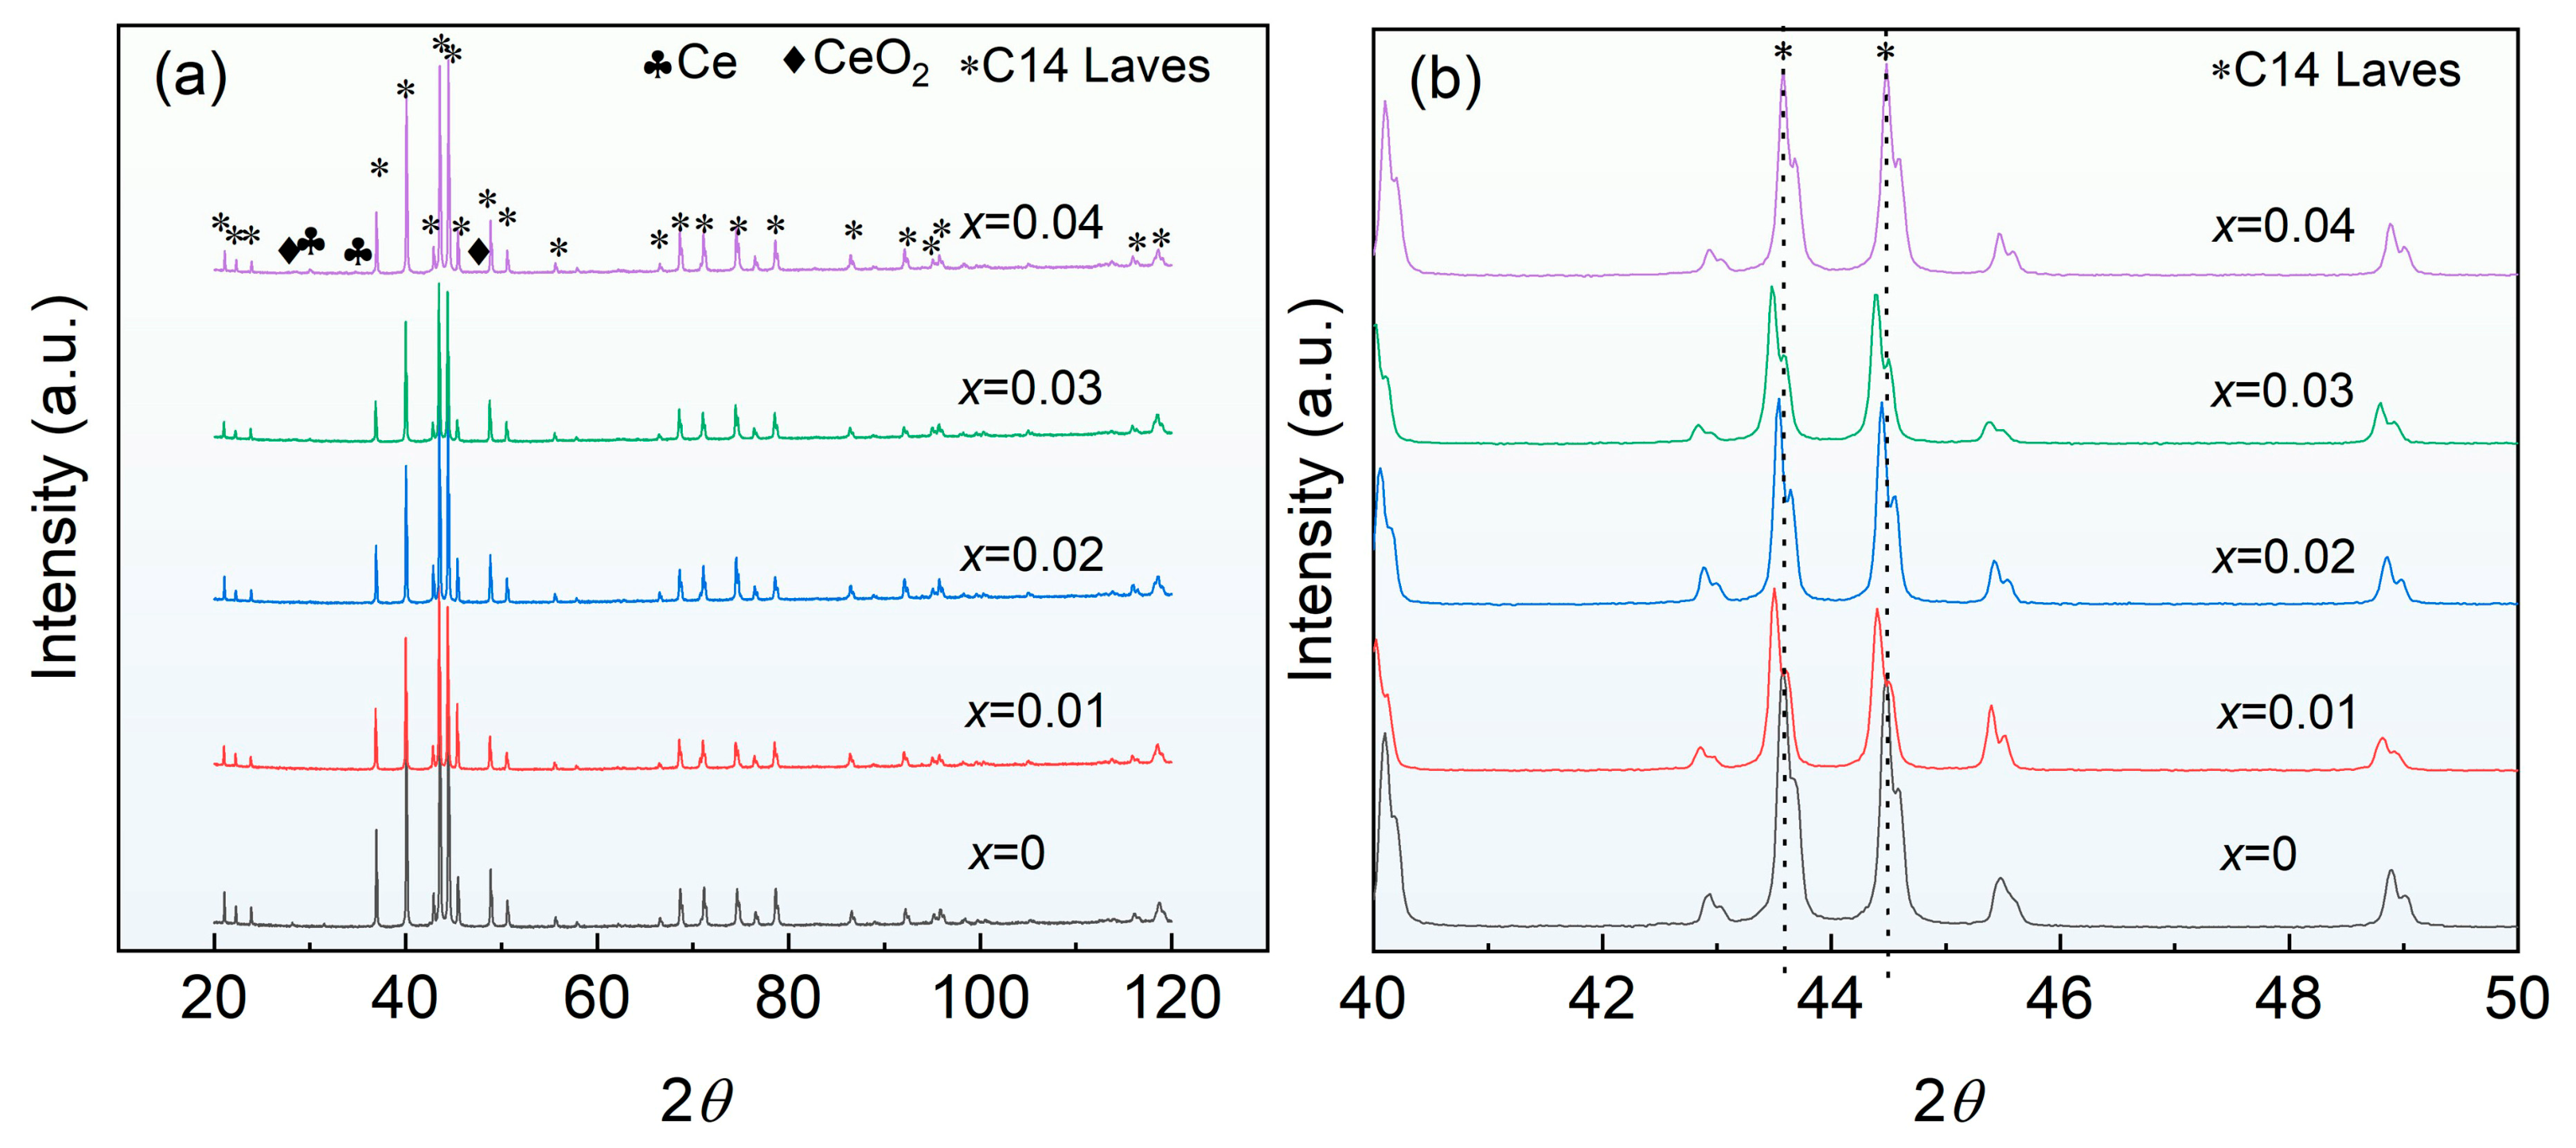
Table 1 presents the ICP-derived compositional data for the fabricated alloys, indicating that the measured compositions closely match the nominal values. The XRD patterns of the Ti0.94Zr0.08Cr1.0Mn0.4Fe0.6Cex (x = 0, 0.01,0.02, 0.03, 0.04) alloys are shown in Figure 1a. XRD patterns reveal that the master alloy consists of the C14 Laves phase, while the Ce-doped alloys still retain the C14 Laves phase as the main phase, with pure Ce and CeO2 phases also detected. Figure 1b presents a magnified view of the main diffraction peaks. It shows that when the Ce doping amount is 0.01, 0.02, and 0.03, the main peak position shifts slightly to the left, indicating that Ce doping slightly increases the lattice parameters of the main C14 Laves phase. This is mainly because the atomic radius of Ce is 182 pm [17], and the incorporation of Ce into the lattice would increase the lattice parameters. In addition, the increase in lattice parameters is extremely limited, which is mainly related to the very limited solid solubility of Ce in the alloy. However, it should be noted that when the Ce doping amount is 0.04, the lattice parameters of the main phase become consistent with those of the master alloy again, exhibiting a different variation trend. Furthermore, no significant changes are observed in the intensity or full width at half maximum of the main peaks. The diffraction peaks at approximately 43.6° and 44.5° correspond to the (−1 2 2) and (0 2 1) planes, respectively.
Table 1.
Elemental composition determined by ICP analysis.
Figure 1.
XRD patterns of the Ti0.94Zr0.08Cr1.0Mn0.4Fe0.6Cex (x = 0, 0.01, 0.02, 0.03, 0.04) alloys: (a) 2θ = 20–120 °, (b) 2θ = 40–50 °. The dotted line is used as a comparison reference line for the horizontal coordinate.
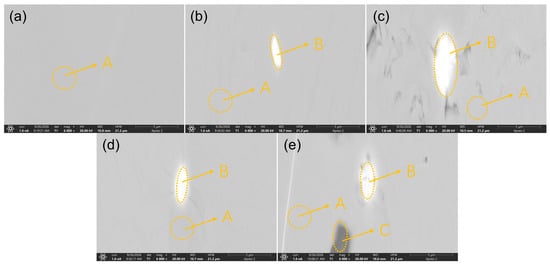
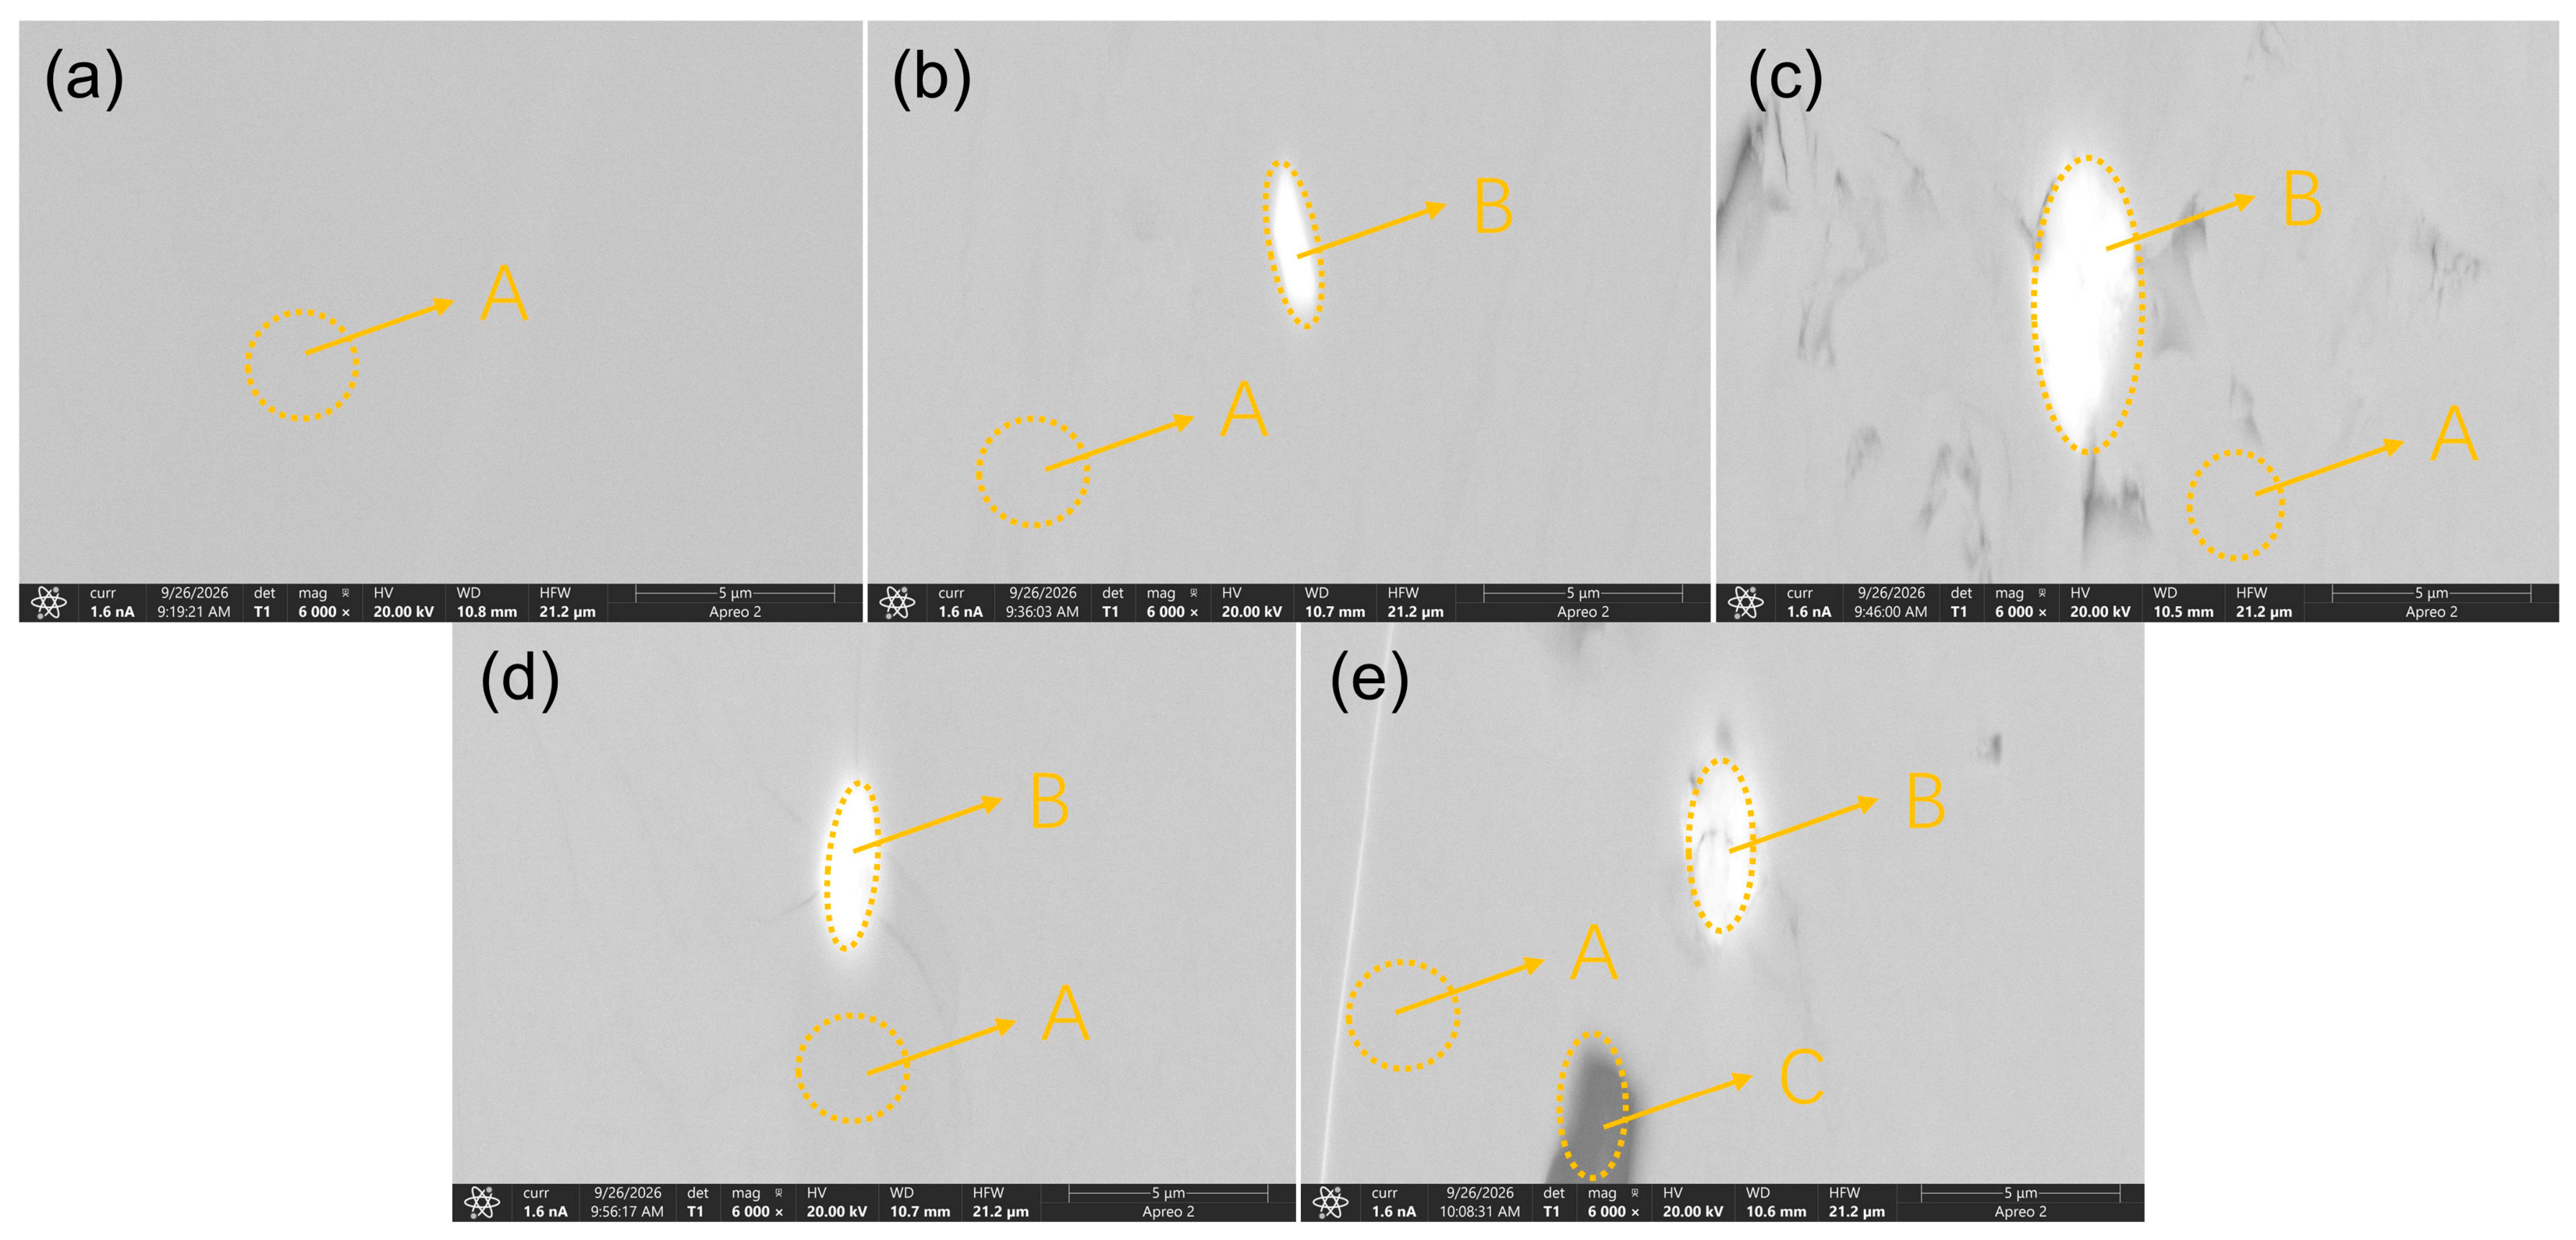
Figure 2 shows the backscattered electron (BSE) images of the Ti0.94Zr0.08Cr1.0Mn0.4Fe0.6Cex (x = 0, 0.01,0.02, 0.03, 0.04) alloys. The BSE image of the master alloy shows only one type of contrast, indicating that the master alloy consists of a single phase, which is consistent with the XRD analysis results. For the alloys with Ce doping amounts of 0.01, 0.02, and 0.03, the SEM micrographs exhibit two distinct contrast regions: a brighter region (labeled B) and a darker region (labeled A), while the alloy with a Ce doping amount of 0.04 exhibits three regions (the darkest one labeled C). Since Ce (Z = 58) is heavier than Ti, Cr, Mn and Fe, local Ce enrichment or depletion can contribute to the observed contrast. The BSE images therefore suggest that Ce is not completely uniformly distributed in all samples, and the heterogeneity becomes more pronounced at x = 0.04. The brighter region B is likely associated with local enrichment of heavier elements such as Ce and Zr, while the darkest region C may correspond to a Ce-depleted or light-element-rich region. These observations indicate that low Ce additions can be largely accommodated in the matrix, whereas excessive Ce addition may exceed the solid solubility and promote local chemical heterogeneity and/or Ce-rich secondary phases. Nevertheless, BSE contrast alone cannot directly quantify the Ce distribution.
Figure 2.
The SEM images of Ti0.94Zr0.08Cr1.0Mn0.4Fe0.6Cex (x = 0, 0.01, 0.02, 0.03, 0.04) alloys: (a) x = 0, (b) x = 0.01, (c) x = 0.02, (d) x = 0.03, and (e) x = 0.04.
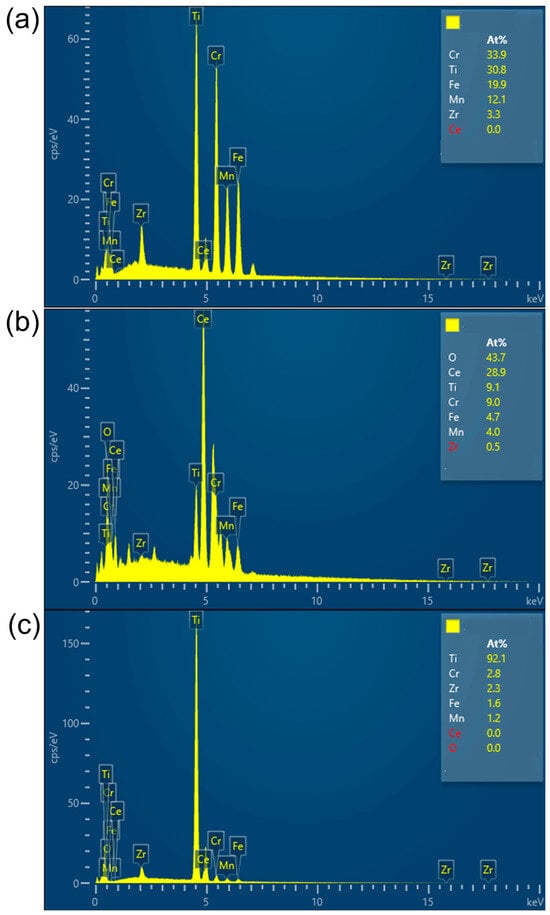
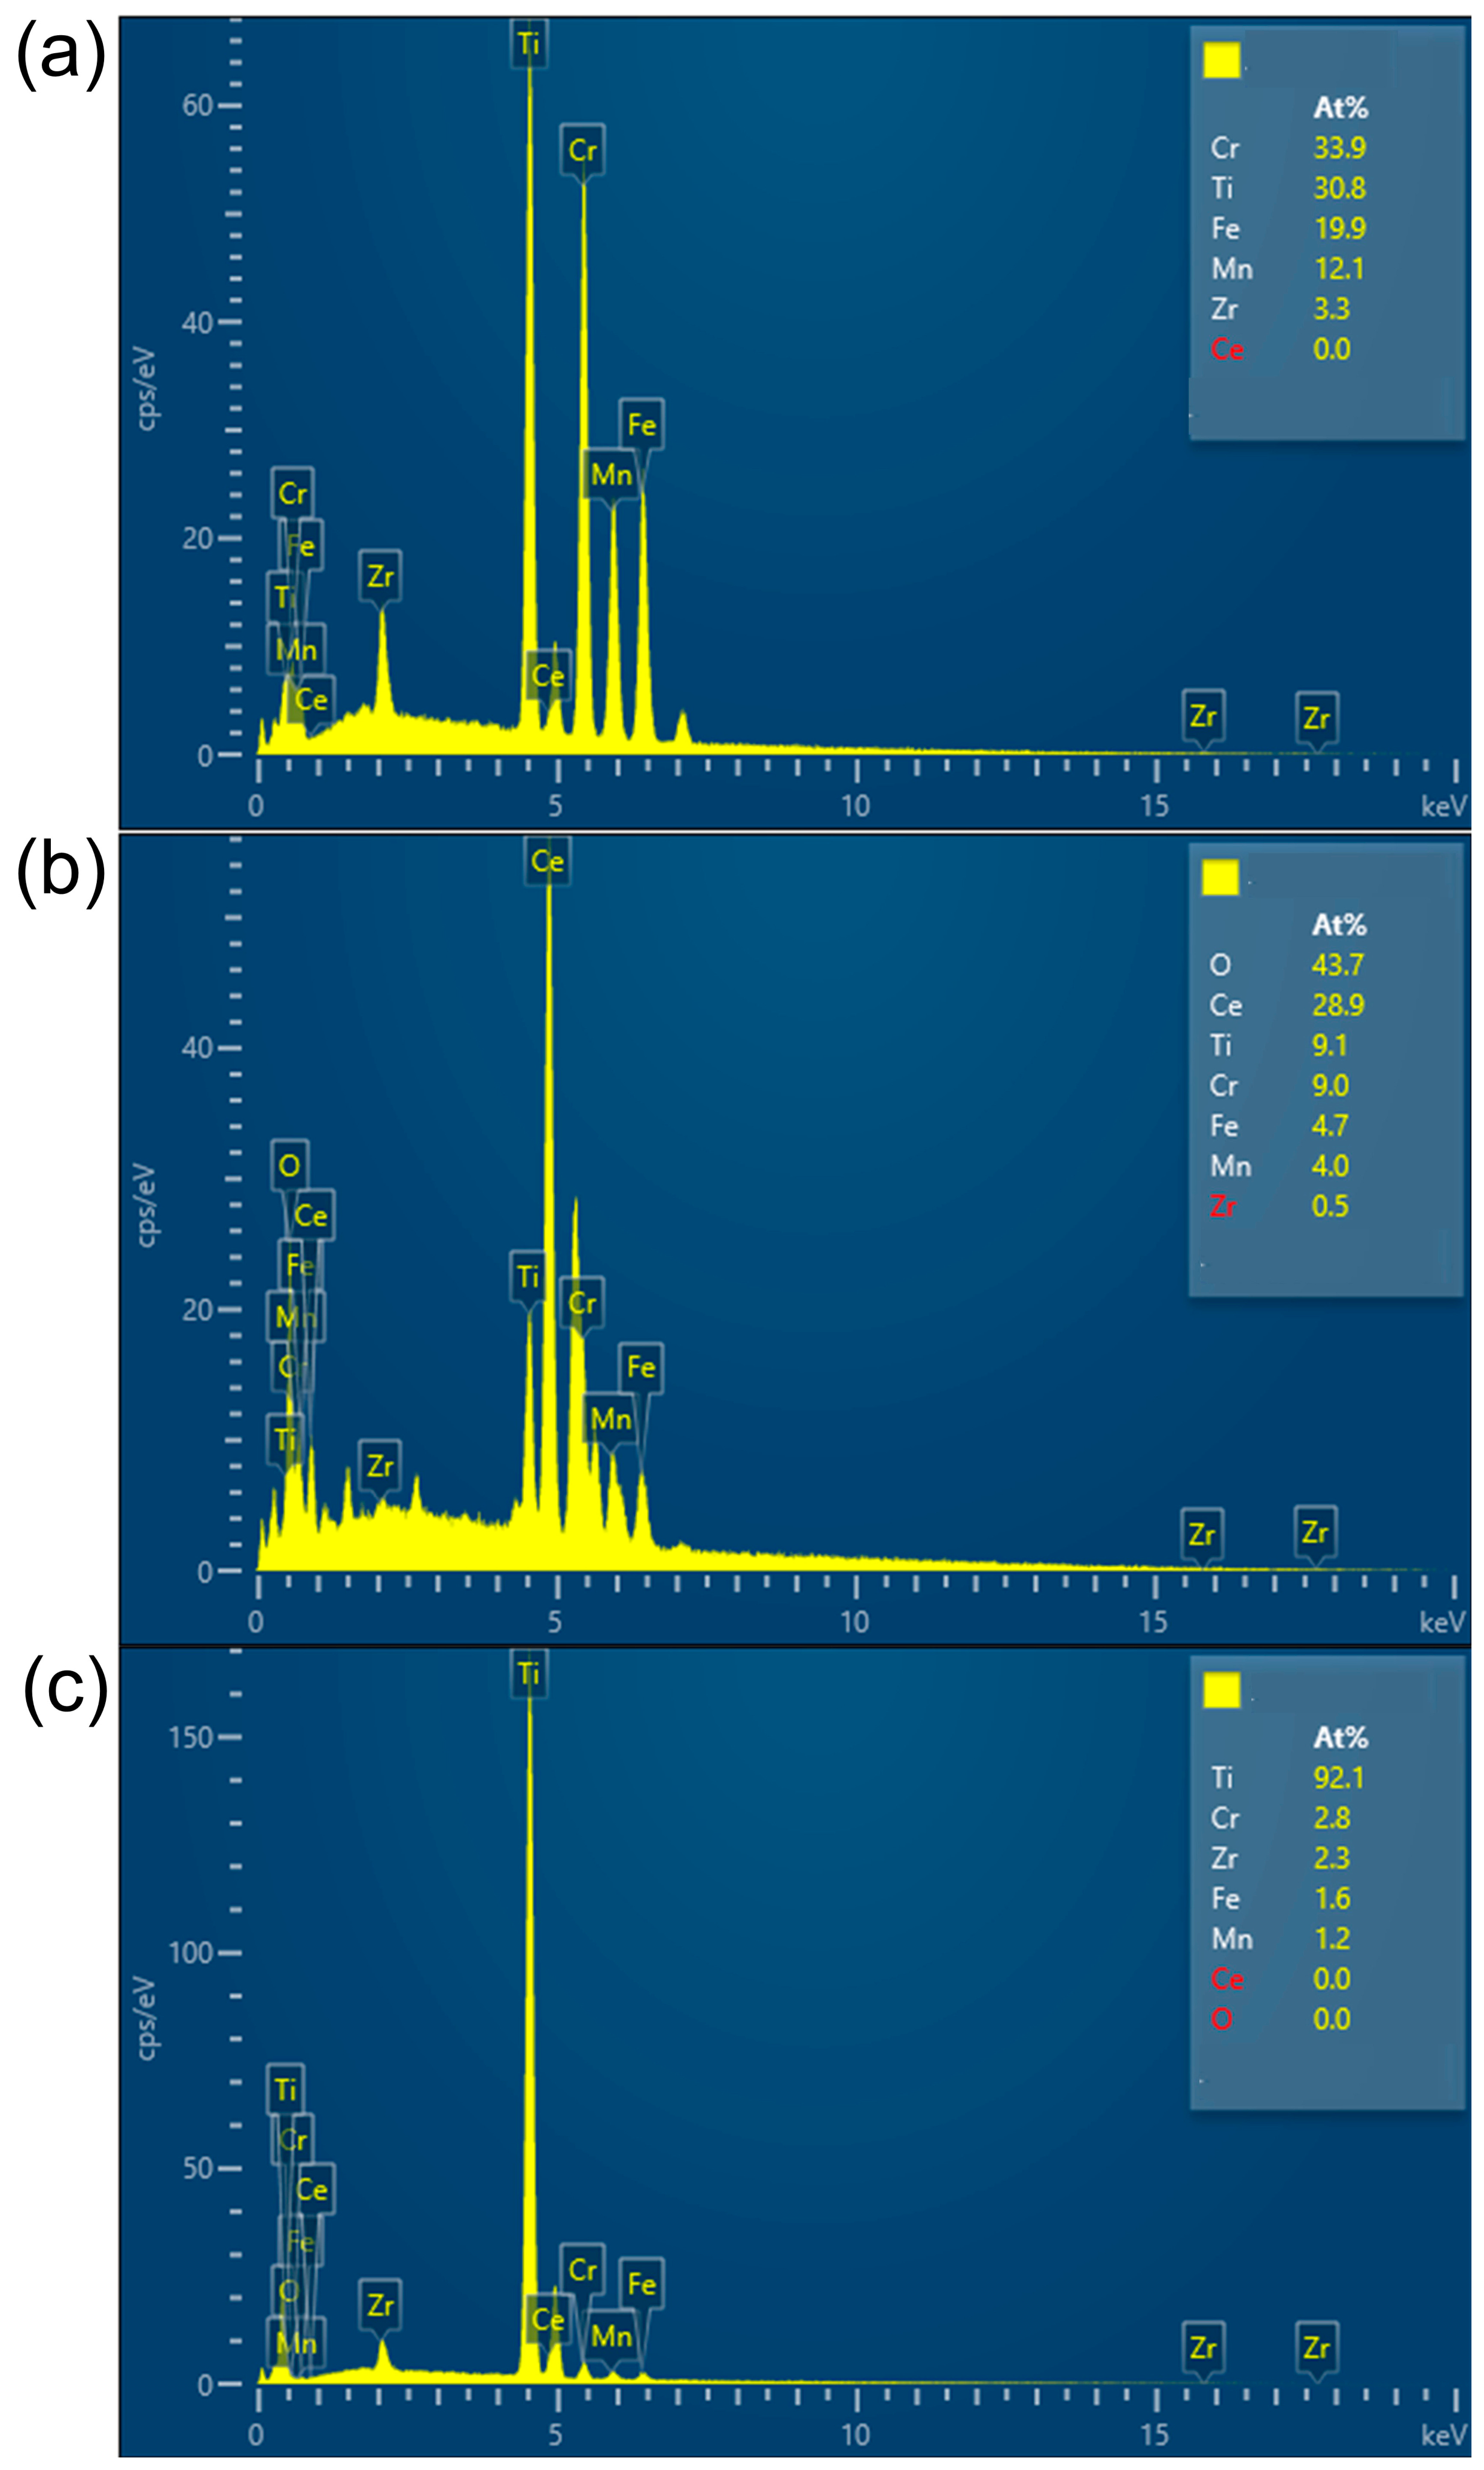
EDS analysis was conducted on selected regions to determine their chemical composition, as shown in Figure 3. The EDS results indicate that the composition of region A is essentially consistent with the nominal composition of the alloy, corresponding to the C14 Laves matrix phase. Region B is enriched in Ce and O; based on the atomic ratio, excess Ce exists in elemental form, indicating the coexistence of elemental Ce and CeO2. This result is consistent with the XRD phase analysis. Compositional analysis of region C indicates a Ti-rich phase, with Ti accounting for approximately 90%. This Ti-rich phase was observed in the BSE image at 6000× magnification but was not detected in the XRD patterns. The presence of the Ti-rich phase may be related to the presence of oxygen [18].
Figure 3.
EDS analysis of Ti0.94Zr0.08Cr1.0Mn0.4Fe0.6Ce0.04 alloy: (a) region A, (b) region B and (c) region C marked in Figure 2.
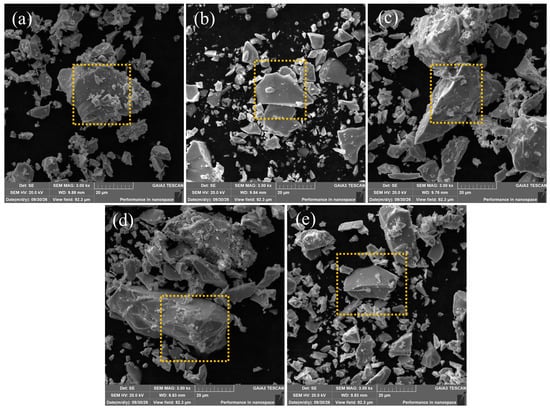
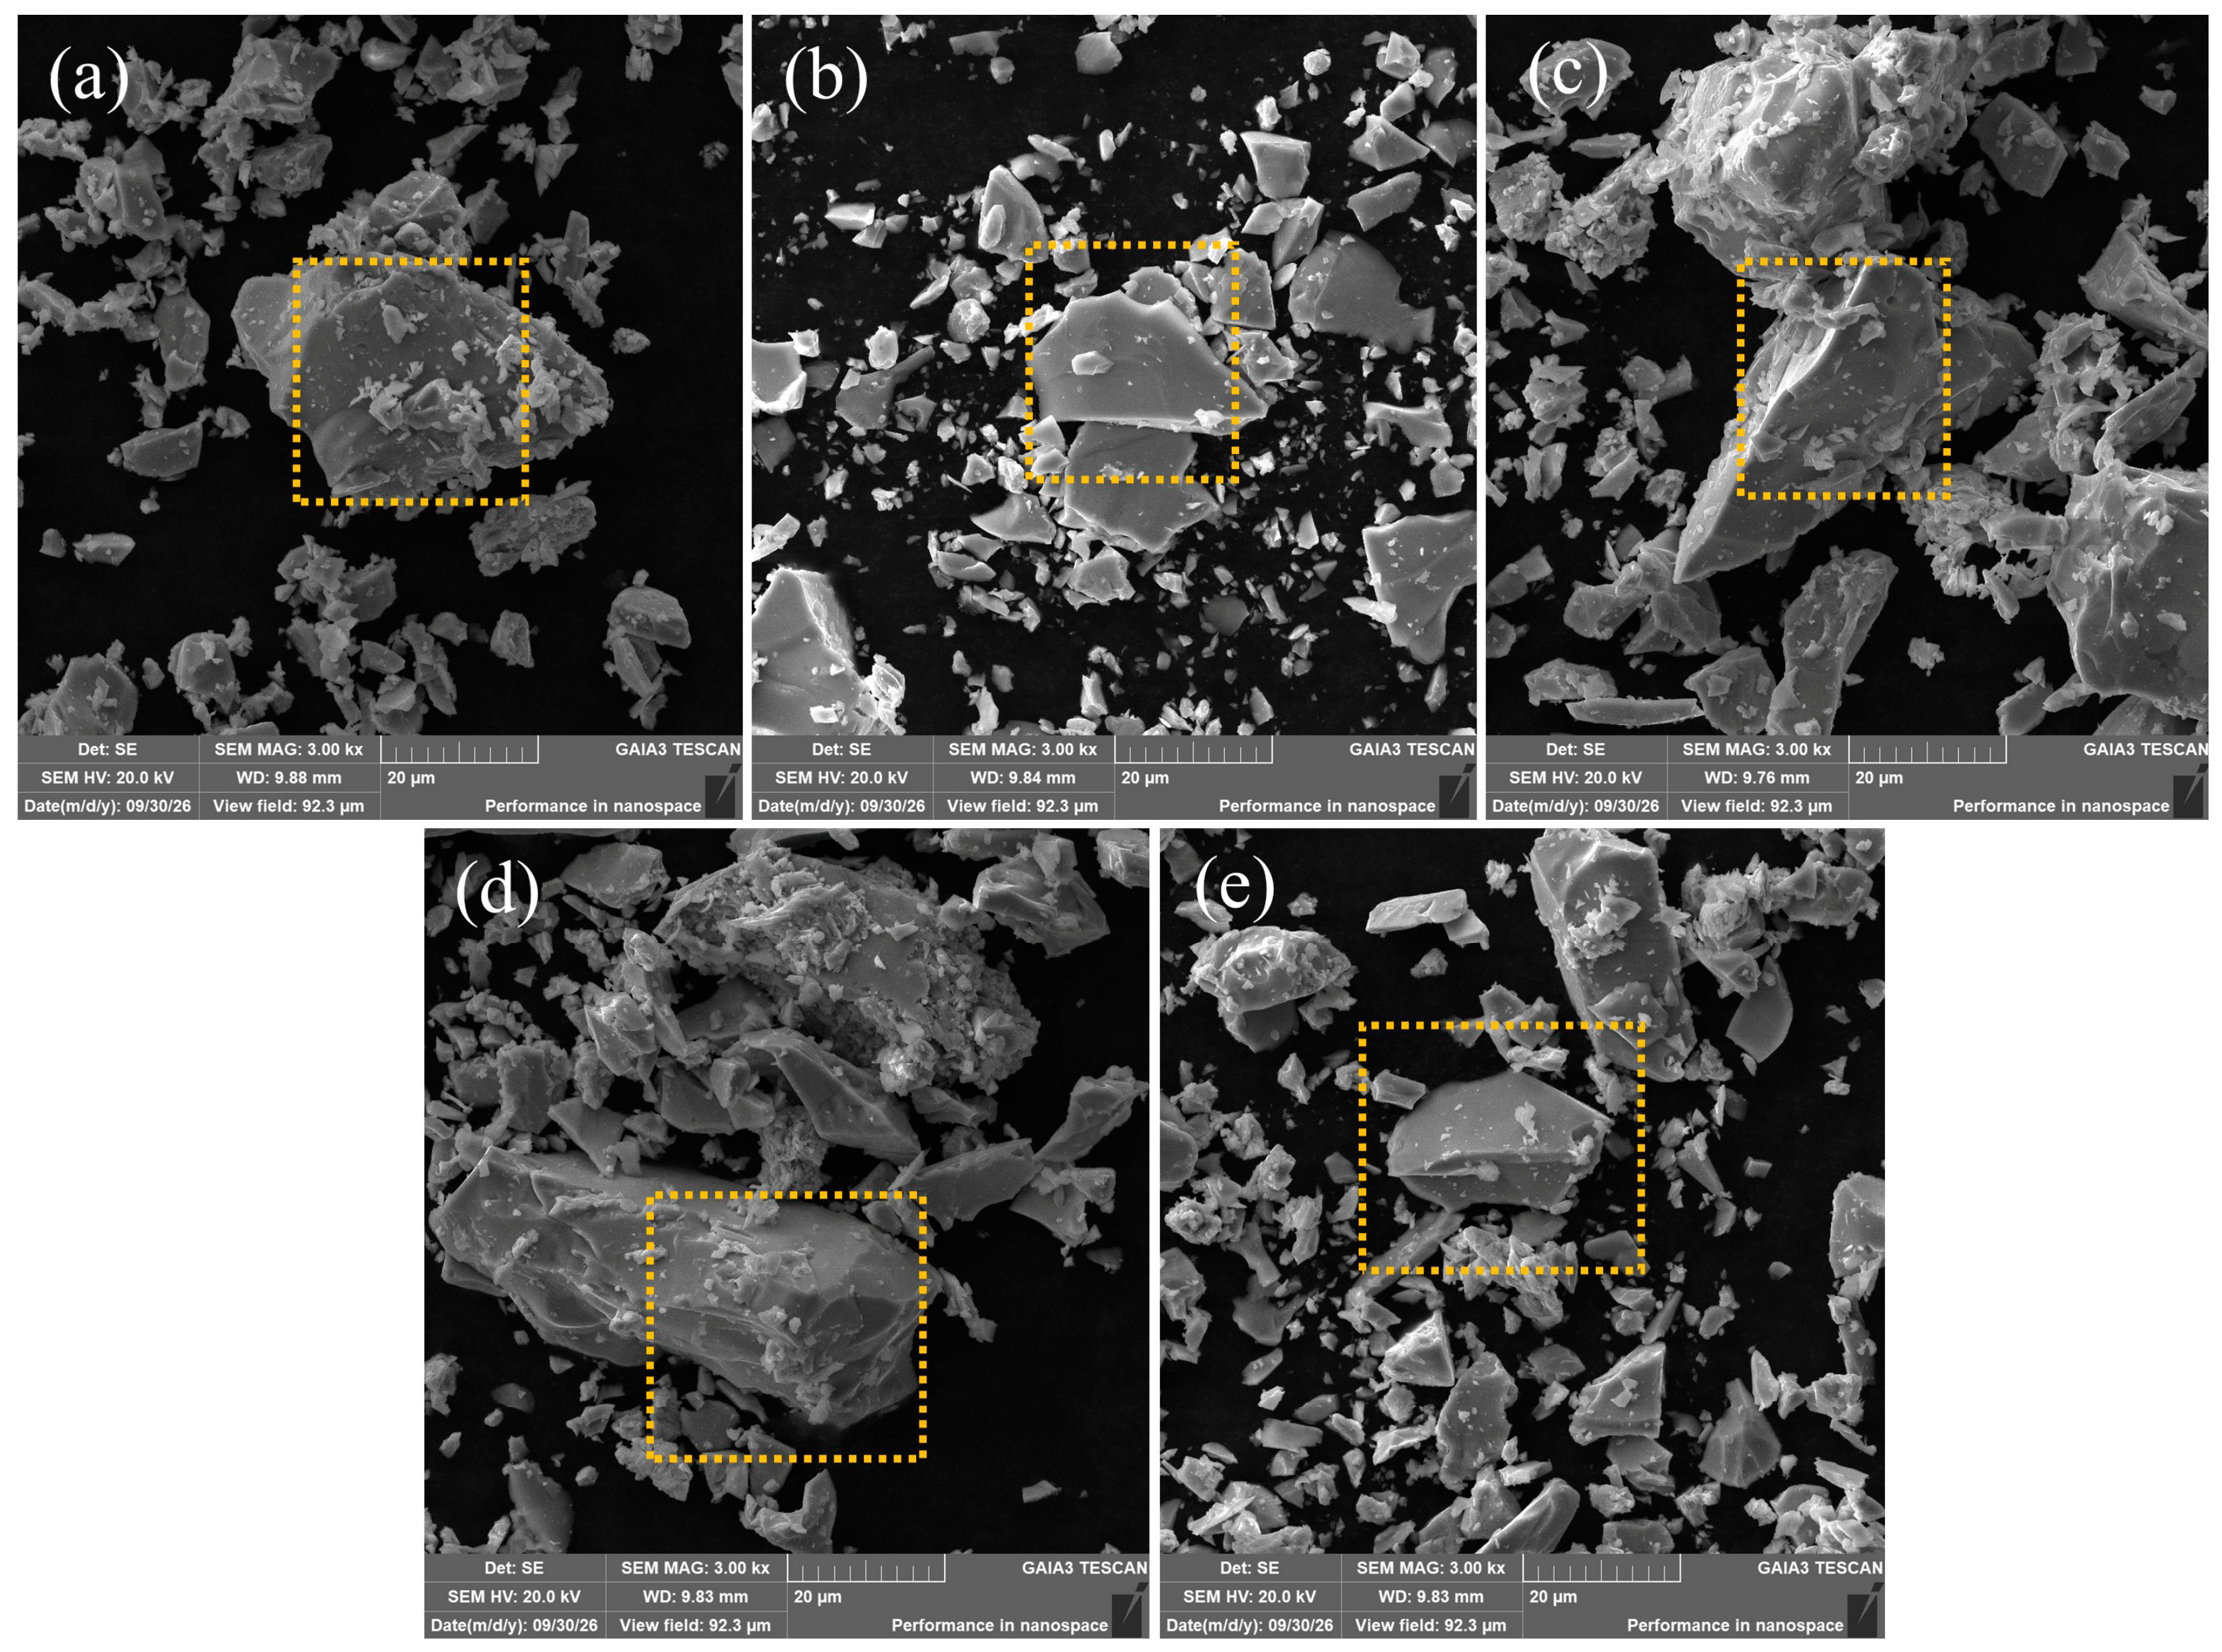
Figure 4 presents SEM micrographs illustrating the morphology of the hydrogen storage alloy particles examined in this work after mechanical crushing and sieving with a 200-mesh sieve. Since the C14 Laves phase is a brittle phase [19], the hydrogen storage alloy in this study exhibits a typical irregular angular morphology after crushing, with sharp edges. Distinct cleavage fracture steps and a few intergranular fracture features are observed on the surfaces, and the addition of rare earth Ce does not alter these fracture characteristics; some larger particles are also covered with fine debris or contain incipient microcracks. For hydrogen storage alloys, particle shape and size distribution are key factors that directly govern activation behavior, hydrogen absorption/desorption kinetics, and resistance to pulverization during cycling. A non-regular particle morphology provides a larger geometric specific surface area, which promotes the adsorption and dissociation of hydrogen molecules on the alloy surface and consequently shortens the incubation period required for activation [20].
Figure 4.
SEM morphology of the Ti0.94Zr0.08Cr1.0Mn0.4Fe0.6Cex (x = 0, 0.01, 0.02, 0.03, 0.04) alloys particles after sieving through a 200-mesh screen. (a) x = 0, (b) x = 0.01, (c) x = 0.02, (d) x = 0.03, and (e) x = 0.04.
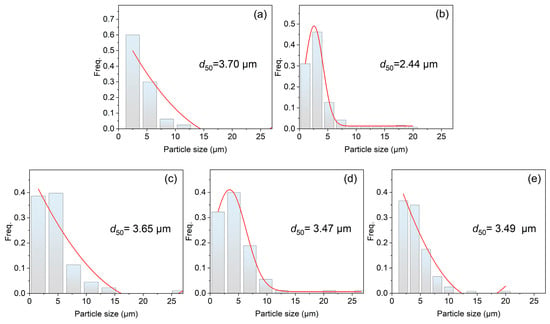
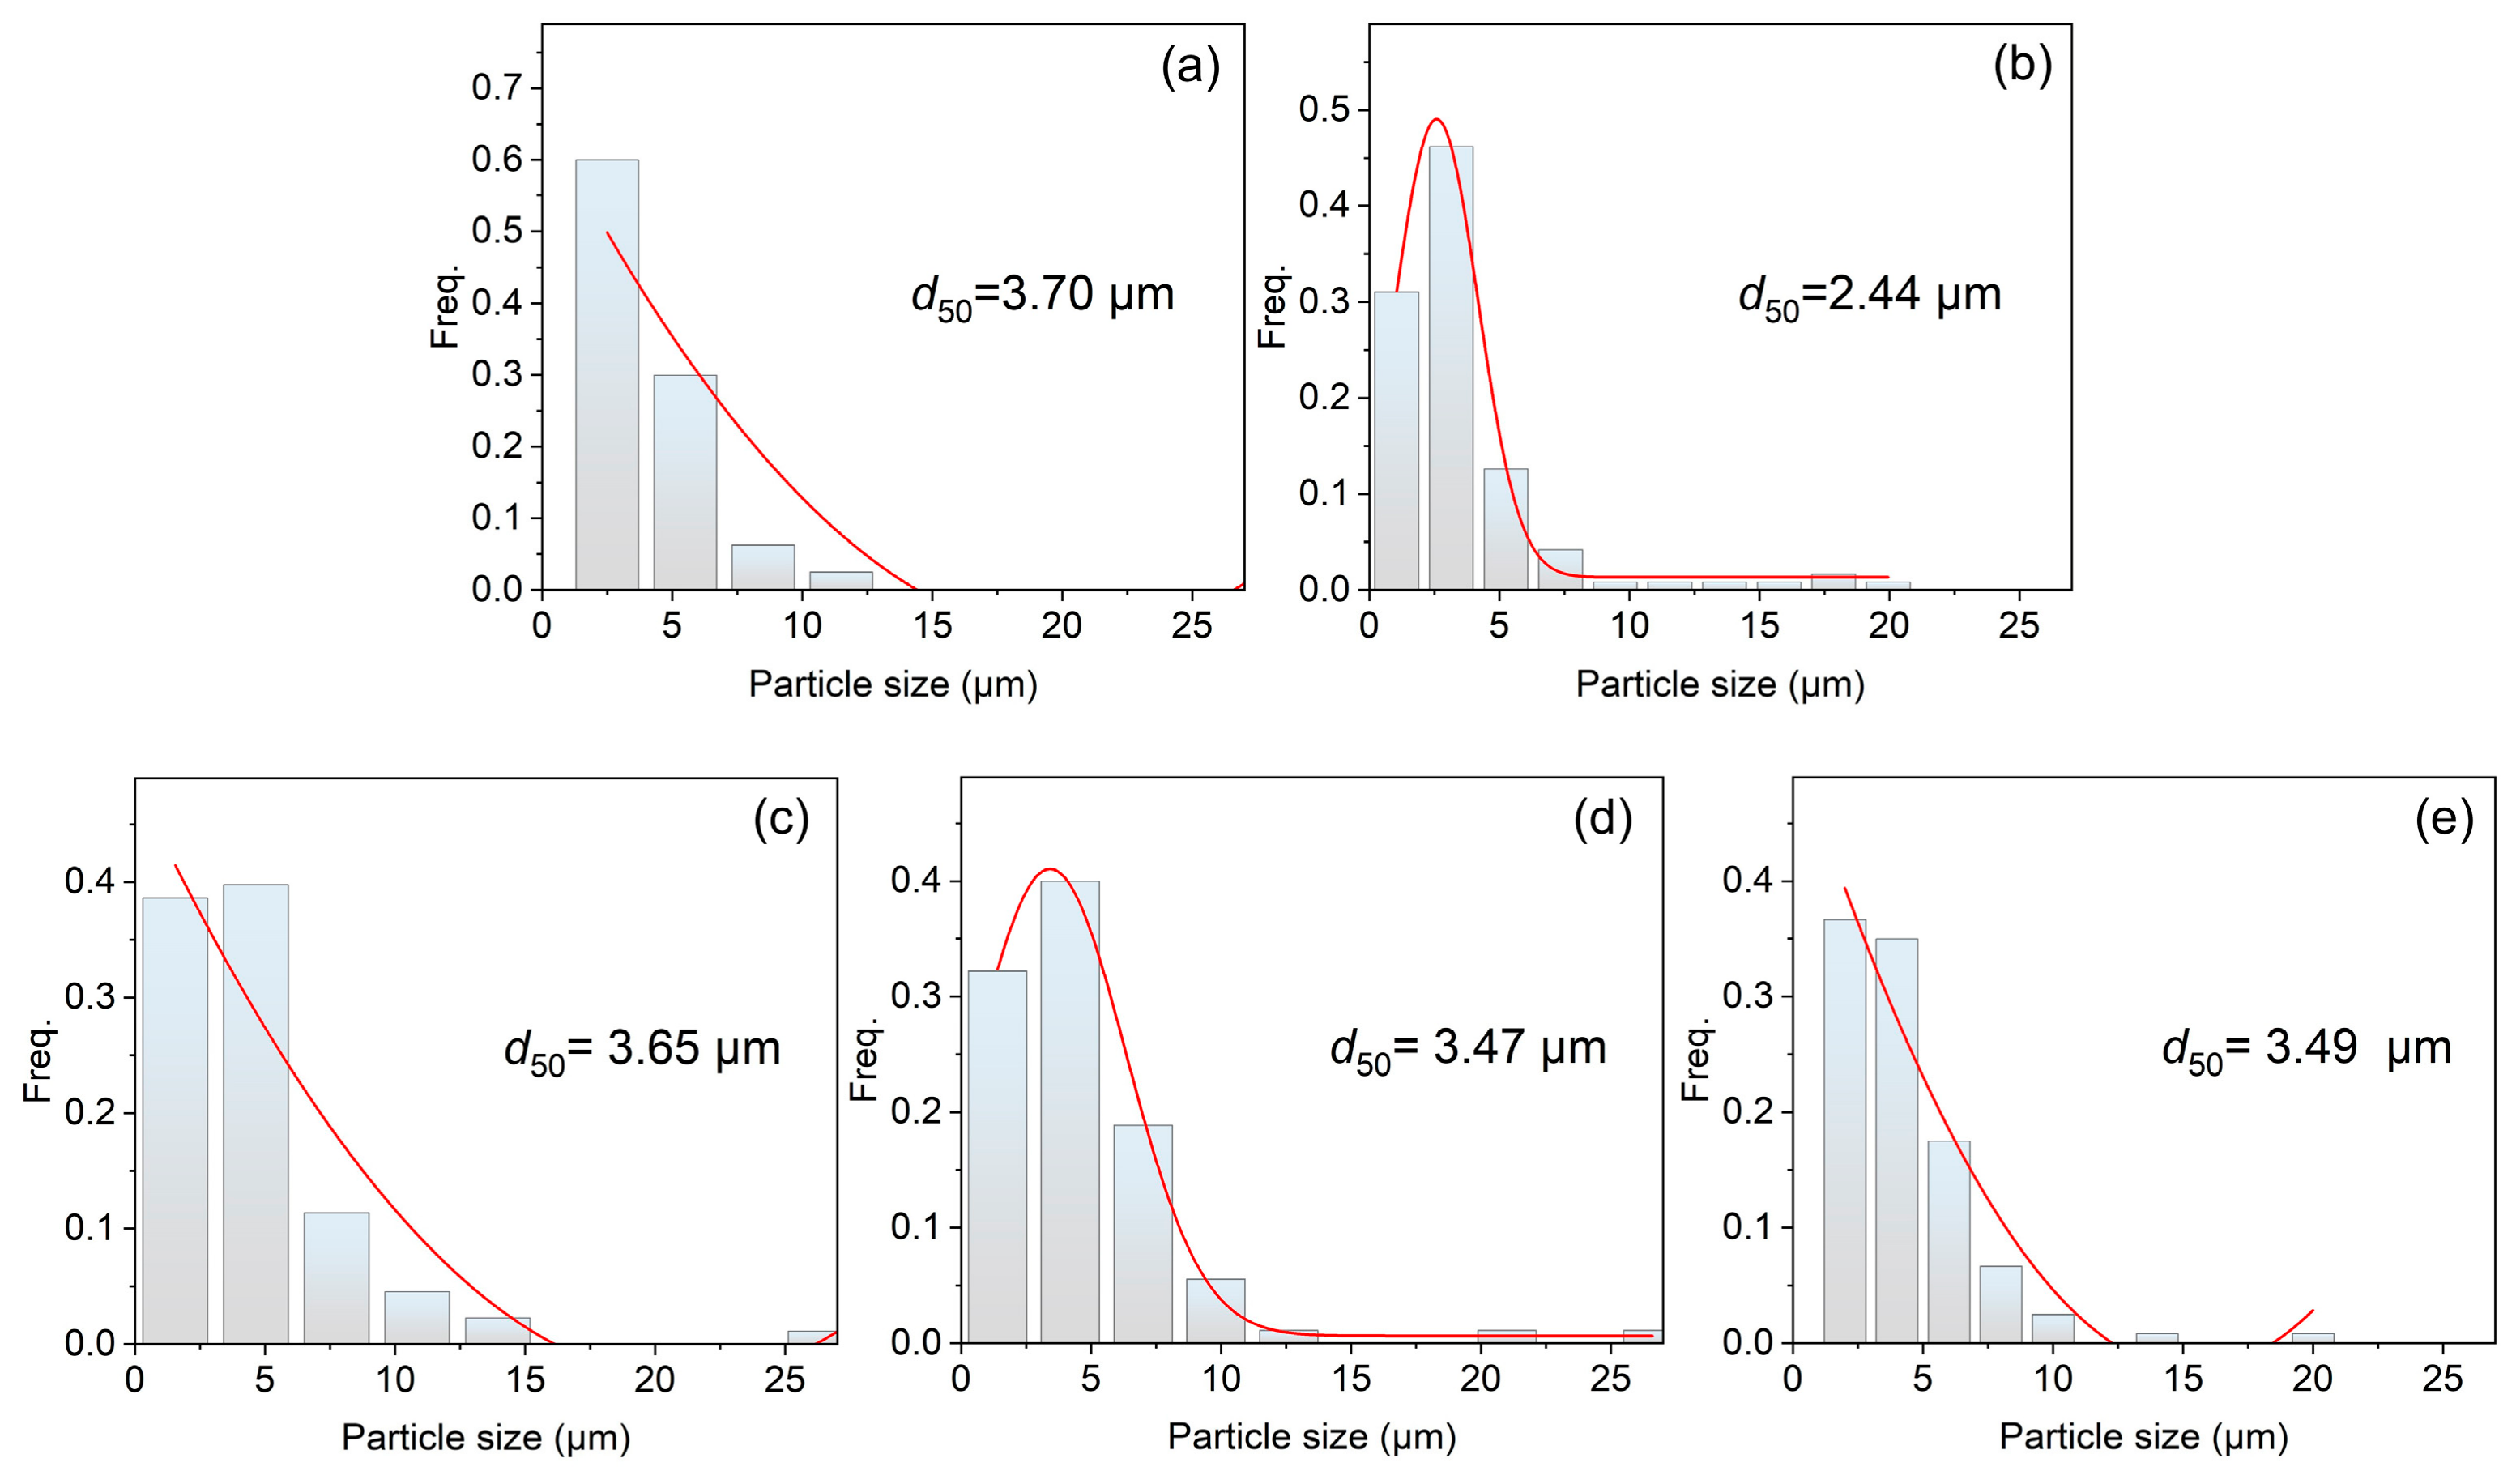
Figure 5 shows the size distribution of the alloy powders, as determined from statistical analysis of SEM images. As shown, for the alloy powder passing through a 200-mesh sieve, Ce doping did not substantially change the particle size distribution of the alloy, with the median particle size d50 remaining essentially around 3.50 μm. This result indicates that the introduction of Ce has no significant effect on the comminution behavior of the alloy, and the alloy still exhibits relatively consistent refinement characteristics during mechanical crushing.
Figure 5.
Particle size analysis of the Ti0.94Zr0.08Cr1.0Mn0.4Fe0.6Cex (x = 0, 0.01, 0.02, 0.03, 0.04) alloys particles after sieving through a 200-mesh screen. (a) x = 0, (b) x = 0.01, (c) x = 0.02, (d) x = 0.03, and (e) x = 0.04. The red line represents a Gaussian fit.
Furthermore, this phenomenon suggests that under the present experimental conditions, the addition of Ce does not markedly alter the brittleness or plastic deformation capacity of the alloy. Consequently, under identical mechanical crushing conditions, the degree of pulverization and the particle size distribution remain basically stable. In contrast to the pronounced coarsening effect caused by Fe substitution for Mn in our previous work [12], the influence of Ce doping on alloy particle size is relatively limited. This, to a certain extent, reflects the differences in the underlying mechanisms by which different alloying elements affect the microstructure, mechanical properties, and subsequent powder processing behavior of hydrogen storage alloys.
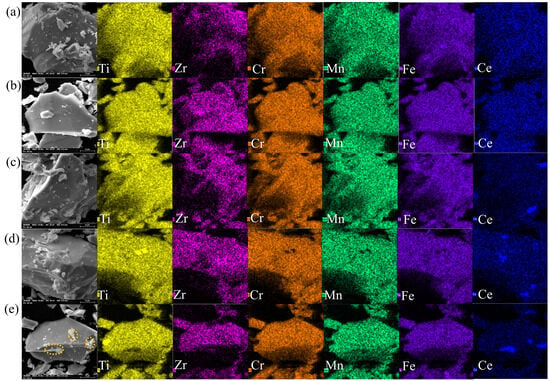
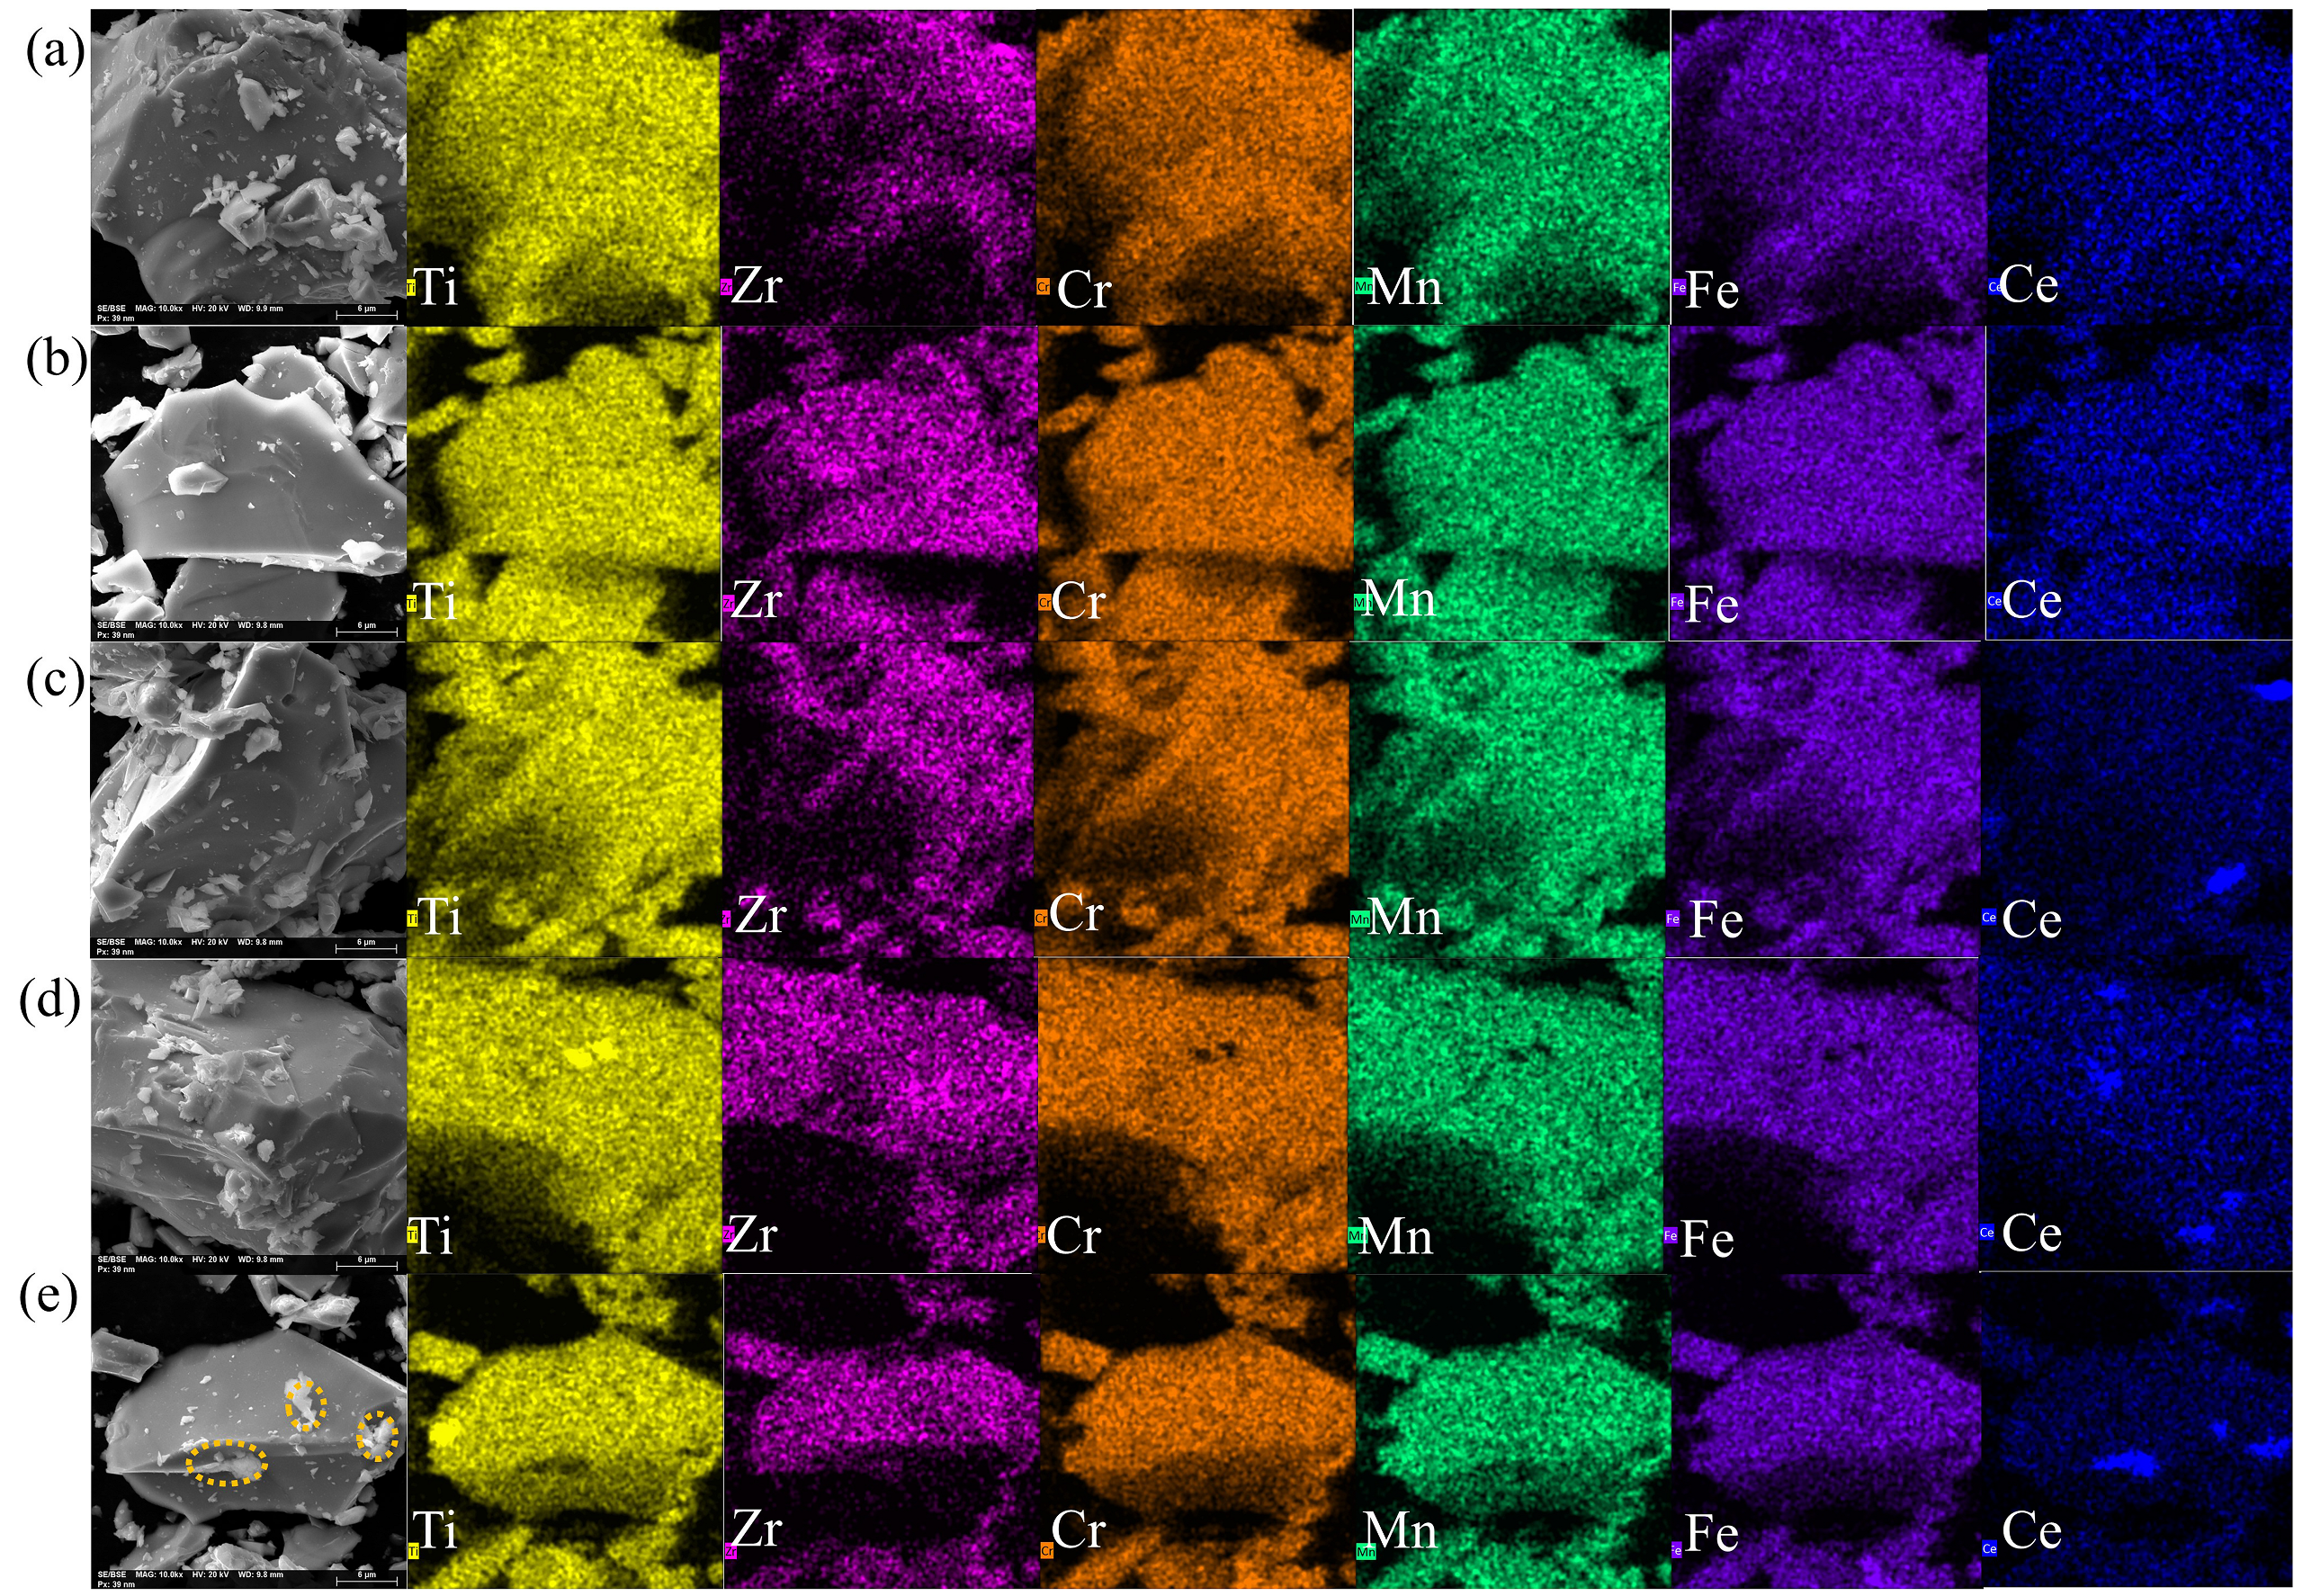
Figure 6 displays the EDS elemental mapping results obtained for a selected region of the particles presented in Figure 4. The elemental distribution maps demonstrate that, on the micrometer scale, the constituent elements Ti, Zr, Cr, Mn, and Fe are distributed in a highly uniform manner within the alloy particles. As for Ce, it is almost undetectable in the alloy with x = 0.01, which is mainly attributed to the relatively low doping amount. With increasing Ce doping, obvious segregation of Ce can be observed in the three alloys with x = 0.02–0.04. Rather than being dissolved in the alloy matrix, Ce exists predominantly in the form of particle debris on the surfaces of the alloy particles, as indicated by the dashed circles in the morphology image of Figure 6e.
Figure 6.
EDS elemental mapping of the selected area within particles of Ti0.94Zr0.08Cr1.0Mn0.4Fe0.6CeX (x = 0, 0.01, 0.02, 0.03, 0.04) alloys shown in Figure 4. (a) x = 0, (b) x = 0.01, (c) x = 0.02, (d) x = 0.03, and (e) x = 0.04. The dashed circles highlight the Ce-containing phases.
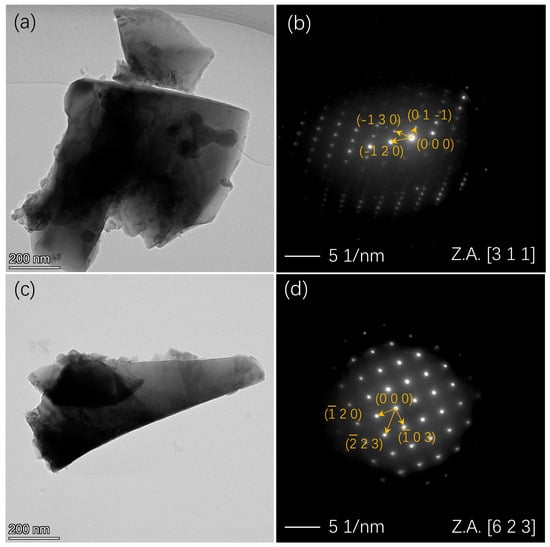
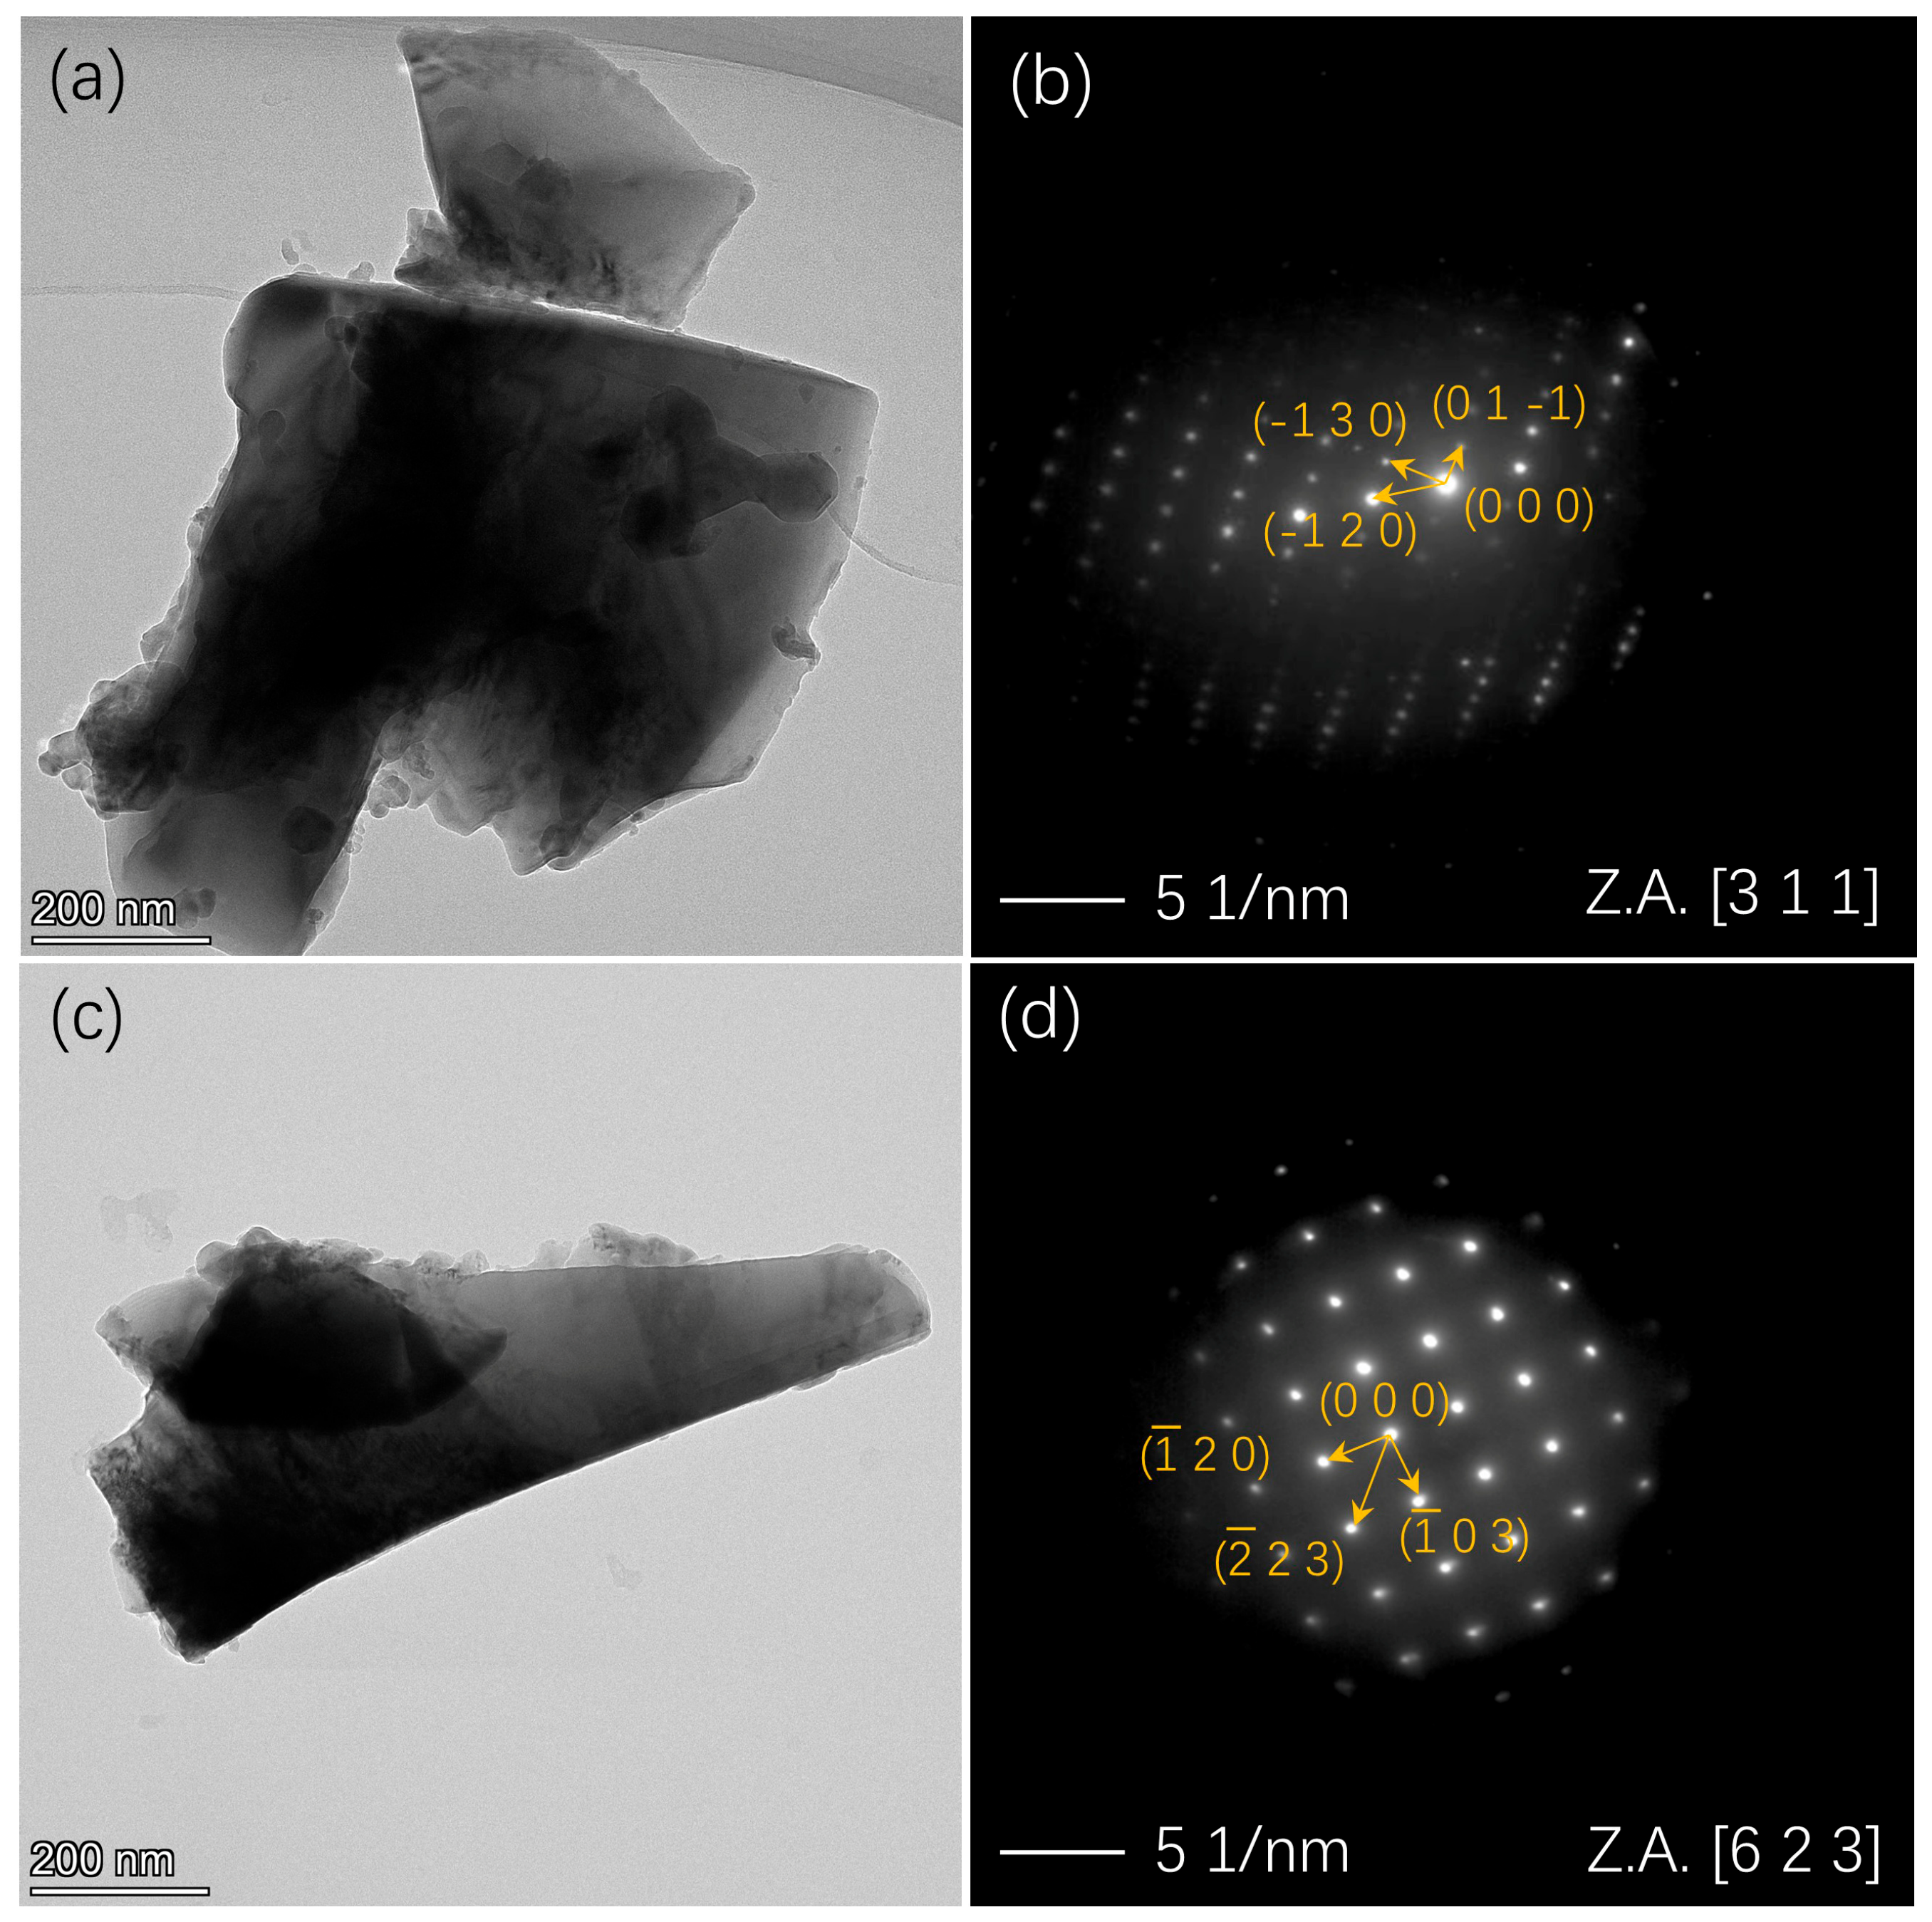
Figure 7 shows the TEM analysis of the Ti0.94Zr0.08Cr1.0Mn0.4Fe0.6 alloy and its Ce-doped analogue, Ti0.94Zr0.08Cr1.0Mn0.4Fe0.6Ce2. The bright-field TEM micrographs in Figure 7a,c illustrate the general morphology and grain size of the two alloys, revealing dense and fairly uniform microstructures with no visible precipitates or defects at the scale examined. The corresponding selected area electron diffraction (SAED) patterns are given in Figure 7b,d. In both cases, the patterns exhibit distinct and well-defined periodic diffraction spots that can be unambiguously assigned to the hexagonal MgZn2-type C14 Laves phase, in full agreement with the XRD results (Figure 1). Ce doping did not change the structure of the main phase.
Figure 7.
TEM characterization of the Ti0.94Zr0.08Cr1.0Mn0.4Fe0.6 (a,b), and Ti0.94Zr0.08Cr1.0Mn0.4Fe0.6Ce2 (c,d): (a,c) bright-field images, (b,d) selected area electron diffraction (SAED) patterns.
3.2. Hydrogen Compression Properties
3.2.1. Kinetic Properties
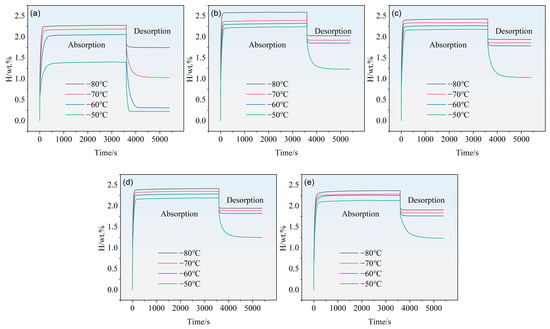
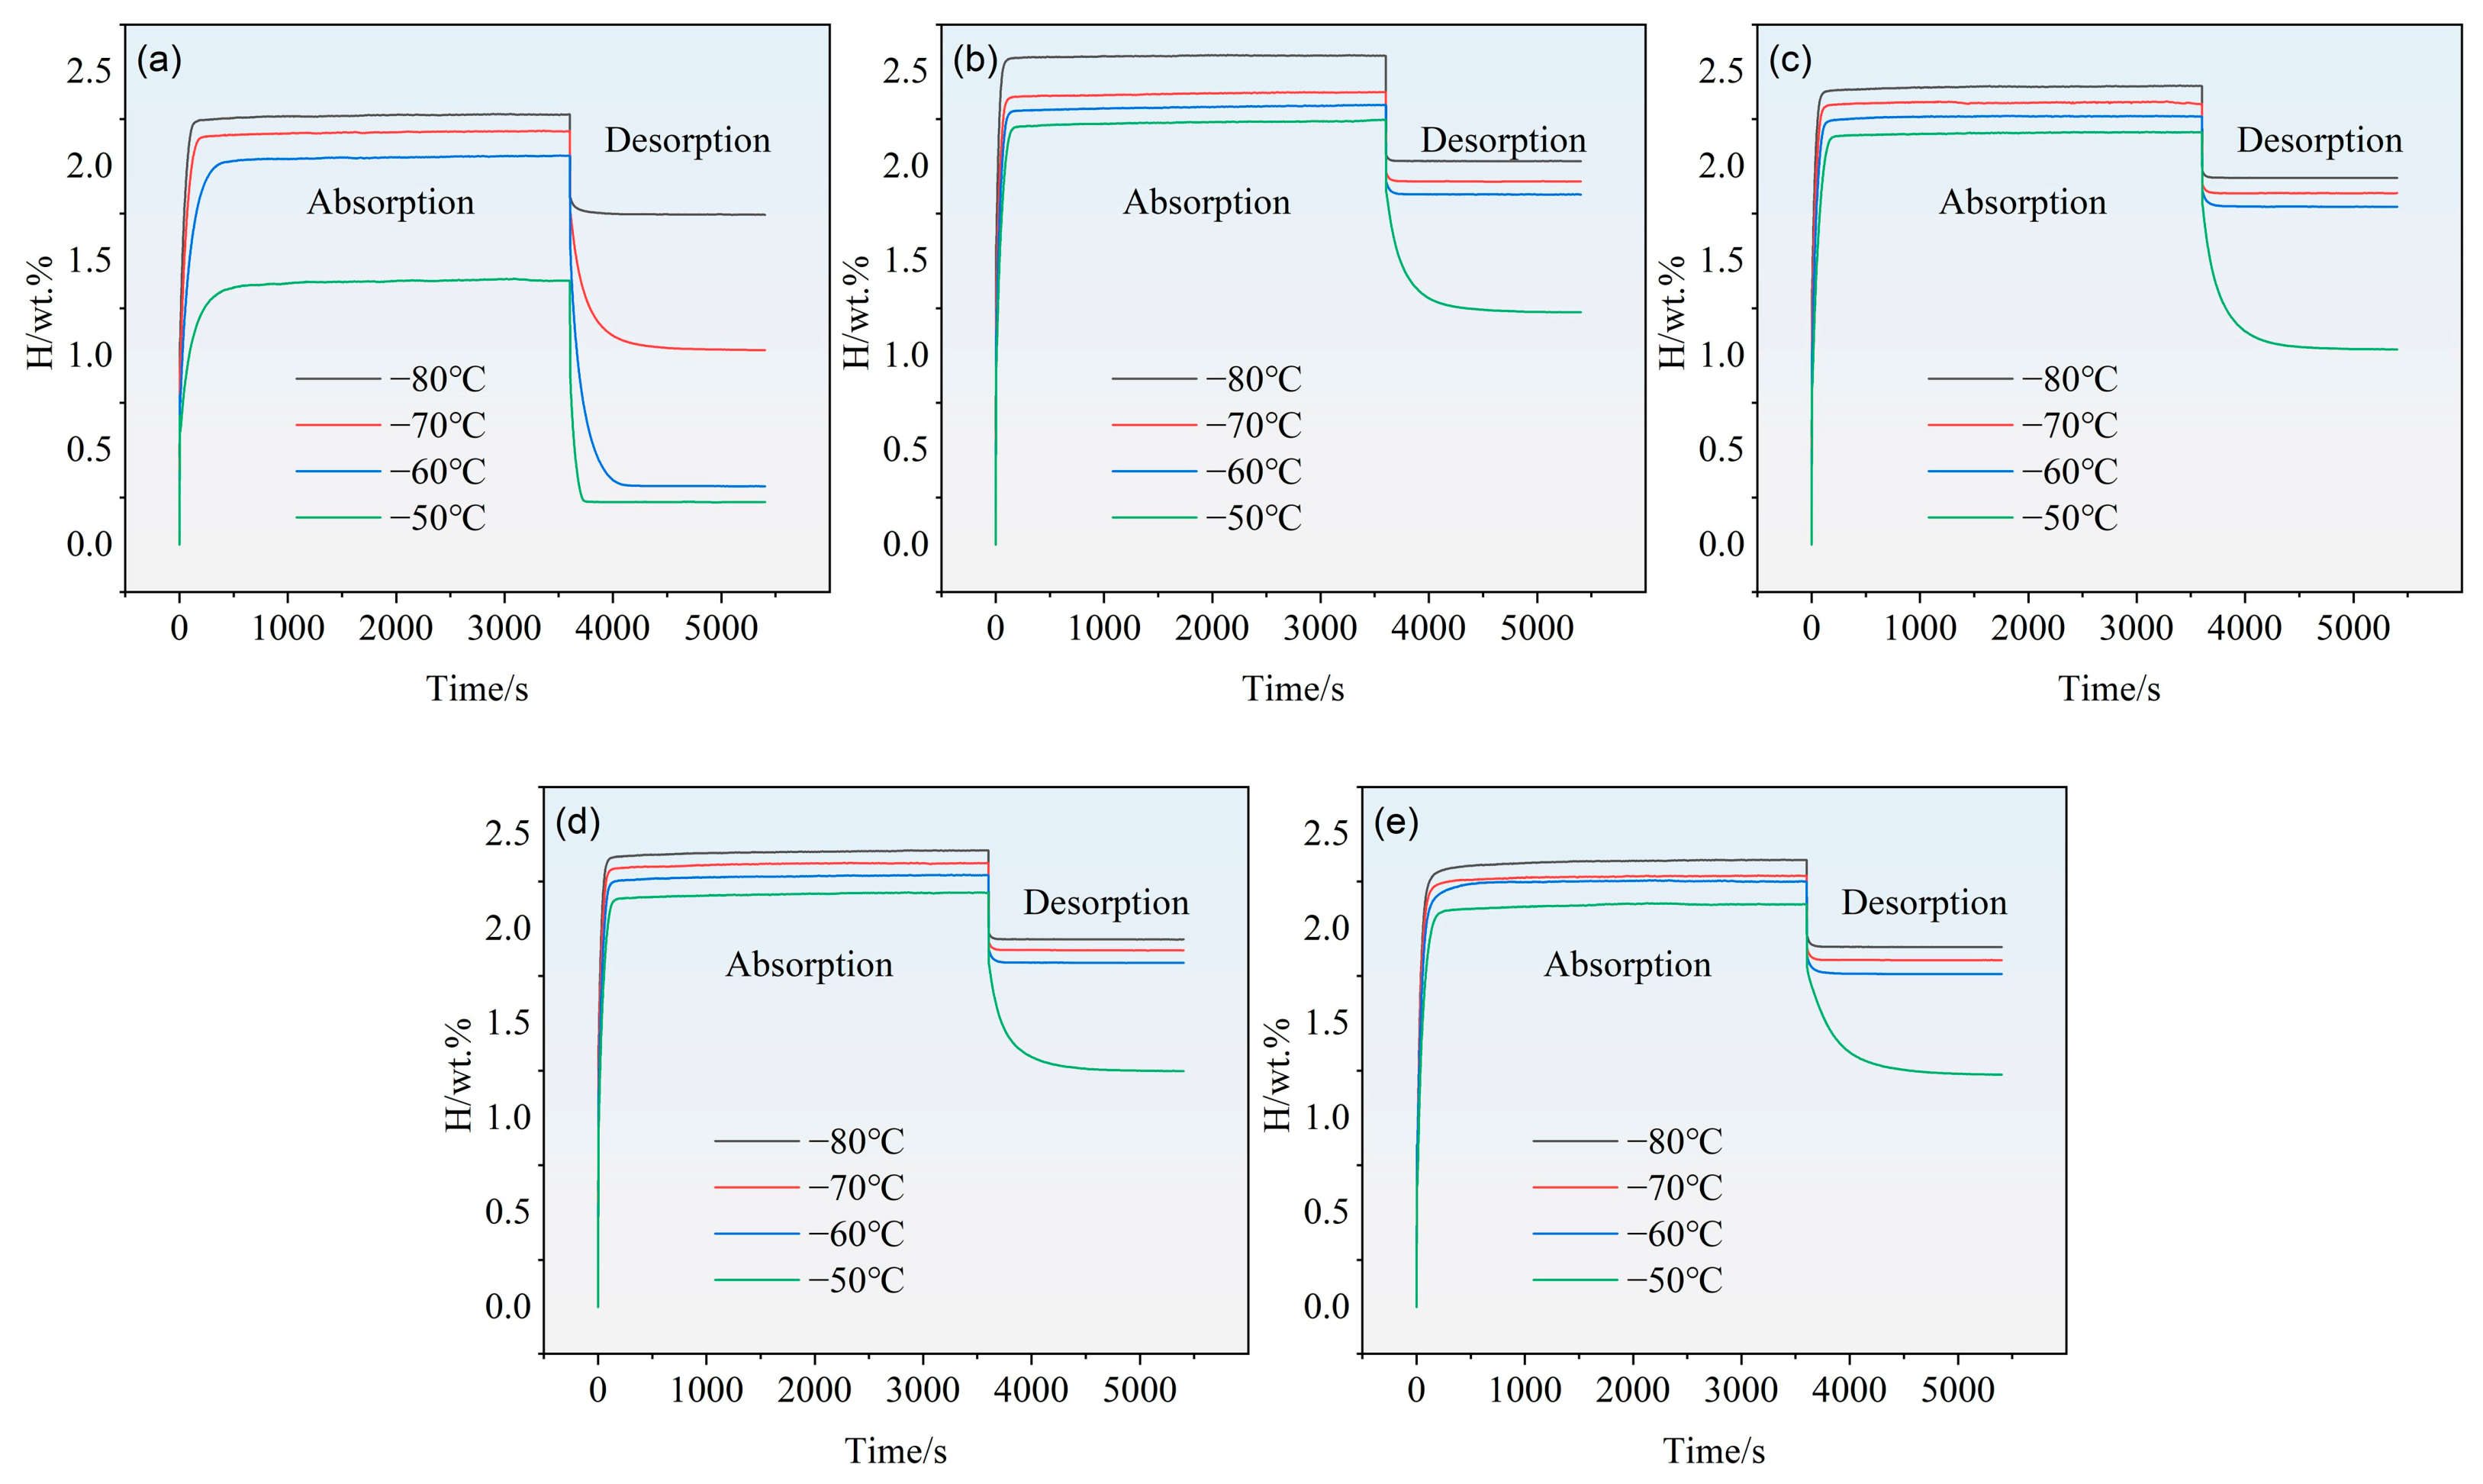
Figure 8 presents the hydrogen absorption/desorption kinetic curves of these alloys. It is evident that, at a given temperature, the hydrogen storage capacity first increases and then gradually decreases with increasing Ce doping content. For example, at an operating temperature of –80 °C, the absorption capacity increases from 2.27 wt.% at x = 0 to 2.58 wt.% at x = 0.01. This may be related to the increase in the lattice parameters of the C14 Laves phase, the main hydrogen-absorbing phase, caused by Ce doping. As the Ce doping content continues to increase, the absorption capacities are 2.42 wt.% at x = 0.02, 2.40 wt.% at x = 0.03, and 2.36 wt.% at x = 0.04. We attribute the gradual decrease in hydrogen absorption capacity to the following: although doped Ce can absorb hydrogen to form CeHx, the cerium hydride is thermodynamically very stable and is difficult to decompose after being formed during the first hydrogen absorption; therefore, it does not participate in hydrogen absorption in subsequent absorption processes [21]. In contrast, compared with the parent alloy, the Ce-doped alloys exhibit slightly slower desorption kinetics.
Figure 8.
The hydrogen absorption/desorption kinetic curves of Ti0.94Zr0.08Cr1.0Mn0.4Fe0.6Cex (x = 0, 0.01, 0.02, 0.03, 0.04) alloys: (a) x = 0, (b) x = 0.01, (c) x = 0.02, (d) x = 0.03, and (e) x = 0.04.
For all samples, the hydrogenation kinetics are relatively fast. At −80 °C, the parent alloy reaches approximately 90% of its saturated capacity in about 76 s, while for the rare-earth-doped alloys with x = 0.01, x = 0.02, x = 0.03, and x = 0.04, the corresponding times are 40 s, 48 s, 44 s, and 50 s, respectively. It can be seen that doping with rare-earth Ce can improve the hydrogenation kinetics of the alloys. In addition, for a given alloy composition, a higher operating temperature leads to a lower hydrogen storage capacity but a higher hydrogen desorption capacity.
In addition, Figure 8 shows that the hydrogen desorption capacity of the alloy differs significantly at different temperatures. The amount of hydrogen desorbed at −50 °C is markedly higher than that at −80 °C. This is mainly because hydrogen desorption from hydrogen storage alloys is an endothermic reaction; a higher temperature provides more favorable conditions for desorption both thermodynamically and kinetically, thereby promoting the desorption process.
3.2.2. PCI Curves and Hydrogen Compression Properties
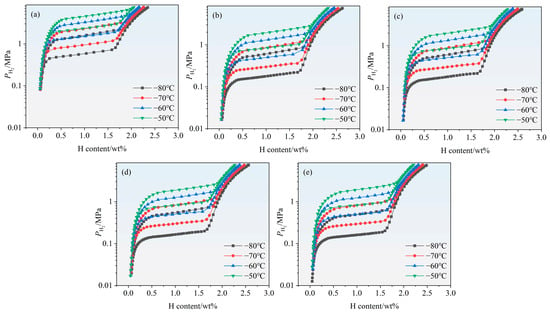
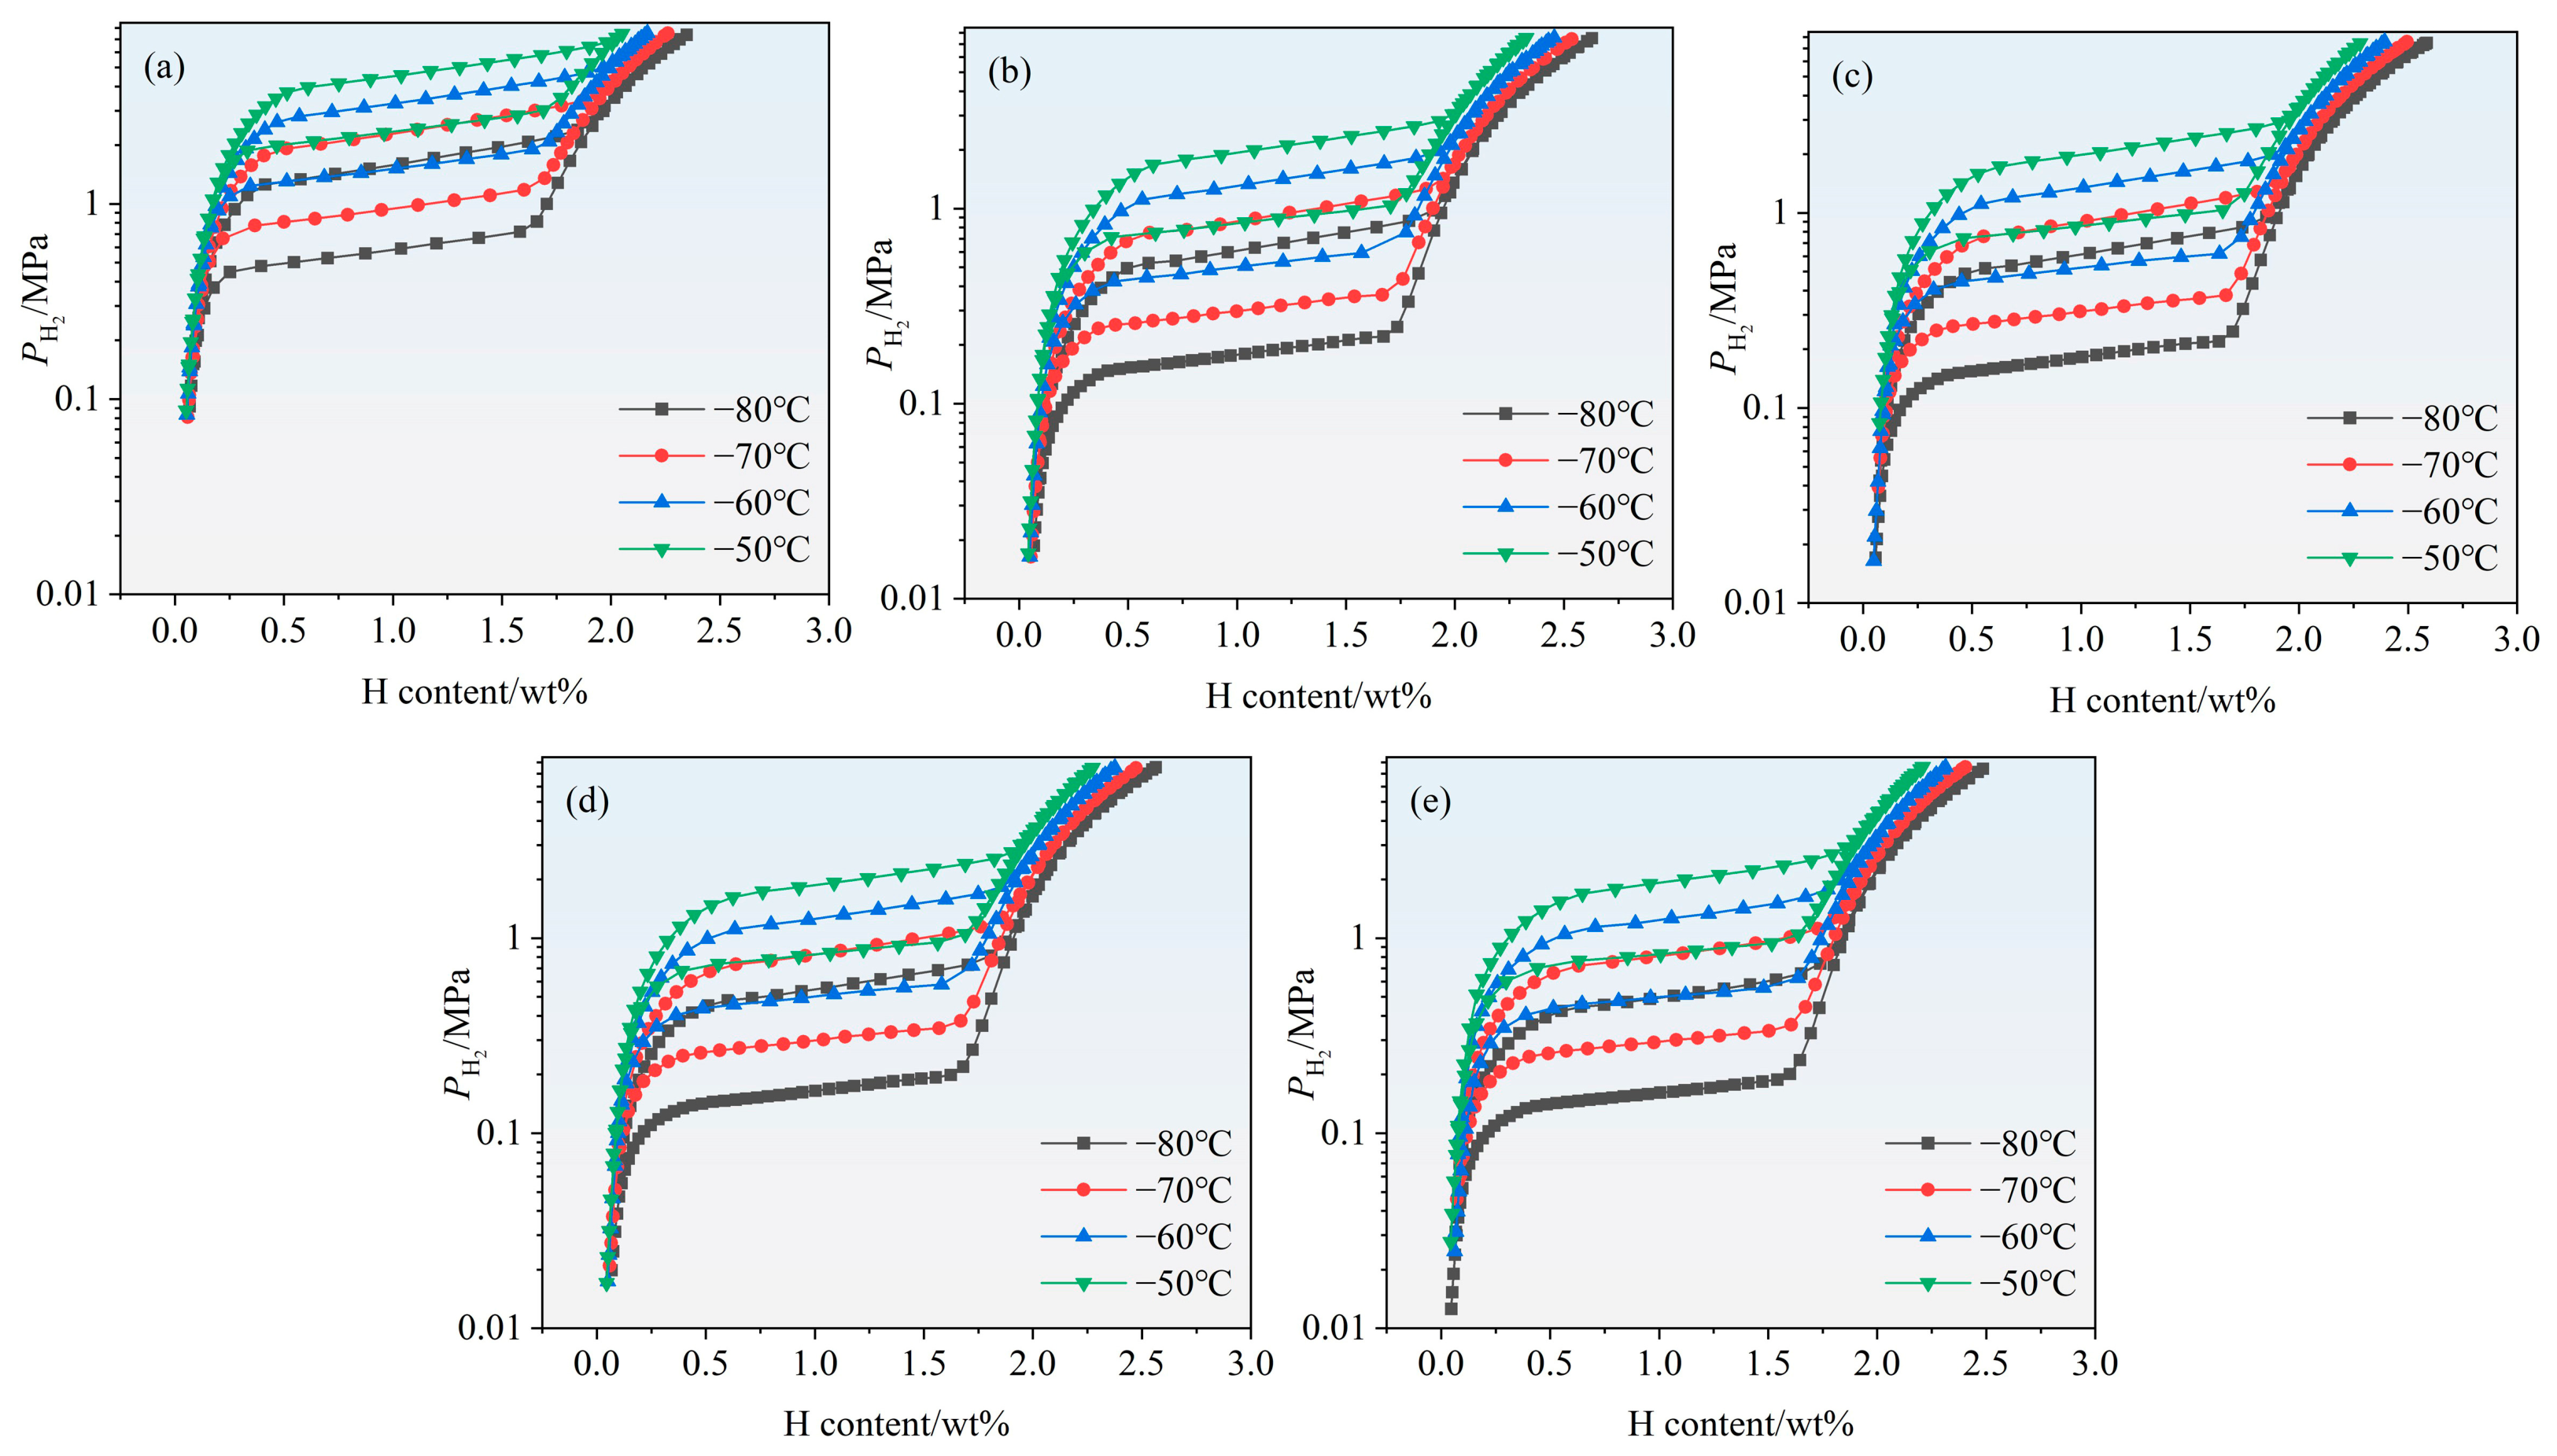
Figure 9 shows the PCI curves characterizing the hydrogen absorption/desorption behavior of the Ti0.94Zr0.08Cr1.0Mn0.4Fe0.6Cex (x = 0, 0.01, 0.02, 0.03, 0.04) alloys measured at −80, −70, −60, and −50 °C. Within the resolution of the present measurements, only one dominant plateau is clearly resolved. An increase in the stoichiometric parameter x tends to lower the plateau pressure, i.e., doping the parent alloy with Ce leads to a decrease in plateau pressure. This may be related to the increase in the lattice parameters of the Laves phase caused by Ce doping. As the doping amount increases, no obvious change in plateau pressure can be discerned from the figure, which is associated with the low solid solubility of Ce. In addition, it can be seen from the figure that the Ce-doped alloys possess a higher hydrogen absorption capacity than the parent alloy. At −80 °C, the maximum capacities are 2.57 wt%, 2.58 wt%, 2.56 wt%, and 2.48 wt%, respectively, while that of the parent alloy is 2.34 wt% at −80 °C. Literature reports indicate that the maximum hydrogen storage capacity of AB2 compounds, whether of C14-type [22] or C15-type [23], is around 2.0 wt%; the capacities of our alloys are higher than those reported in the literature. Furthermore, literature reports indicate that some AB2 compounds exhibit a second plateau at lower temperatures, such as TiCr1.8 (C15-type) [24], TiCr1.9 (C14-type) [24], and even TiCr1.5Mn0.5 (C14-type) [24]. Beeri et al. reported a second plateau at −77 °C for TiCr1.5Mn0.5. In contrast, under the pressure and temperature conditions employed in the present work, no such second plateau was detected. For the operating conditions used here, it was verified that all compounds reached full hydrogen uptake at least within the first plateau region.
Figure 9.
PC-isotherms for the Ti0.94Zr0.08Cr1.0Mn0.4Fe0.6Cex (x = 0, 0.01, 0.02, 0.03, 0.04) alloys measured at −80, −70, −60 and −50 °C. (a) x = 0, (b) x = 0.01, (c) x = 0.02, (d) x = 0.03, and (e) x = 0.04.
In the PCT curves of hydrogen compression materials, two indicators have attracted considerable attention: the hysteresis factor (Hf) and the slope factor (Sf). The hysteresis factor is used to quantify the difference between the hydrogen absorption plateau pressure and the hydrogen desorption plateau pressure, reflecting the degree of irreversibility of the absorption/desorption process. The slope factor is used to quantify the degree of inclination of the plateau region, reflecting the sensitivity of the plateau pressure to changes in hydrogen content. We calculated the hysteresis and slope factors of the PCT curves for the alloys, and the relevant data are listed in Table 2.
Table 2.
Absorption and dissociation pressures at −80 °C, −70 °C, −60 °C and −50 °C, ΔH and ΔS of Ti0.94Zr0.08Cr1.0Mn0.4Fe0.6Cex (x = 0, 0.01, 0.02, 0.03, 0.04) alloys.
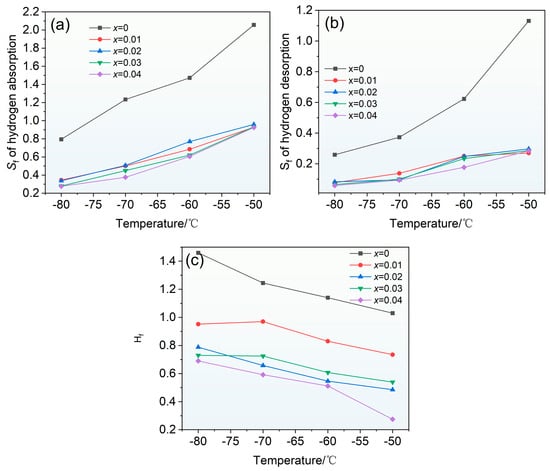
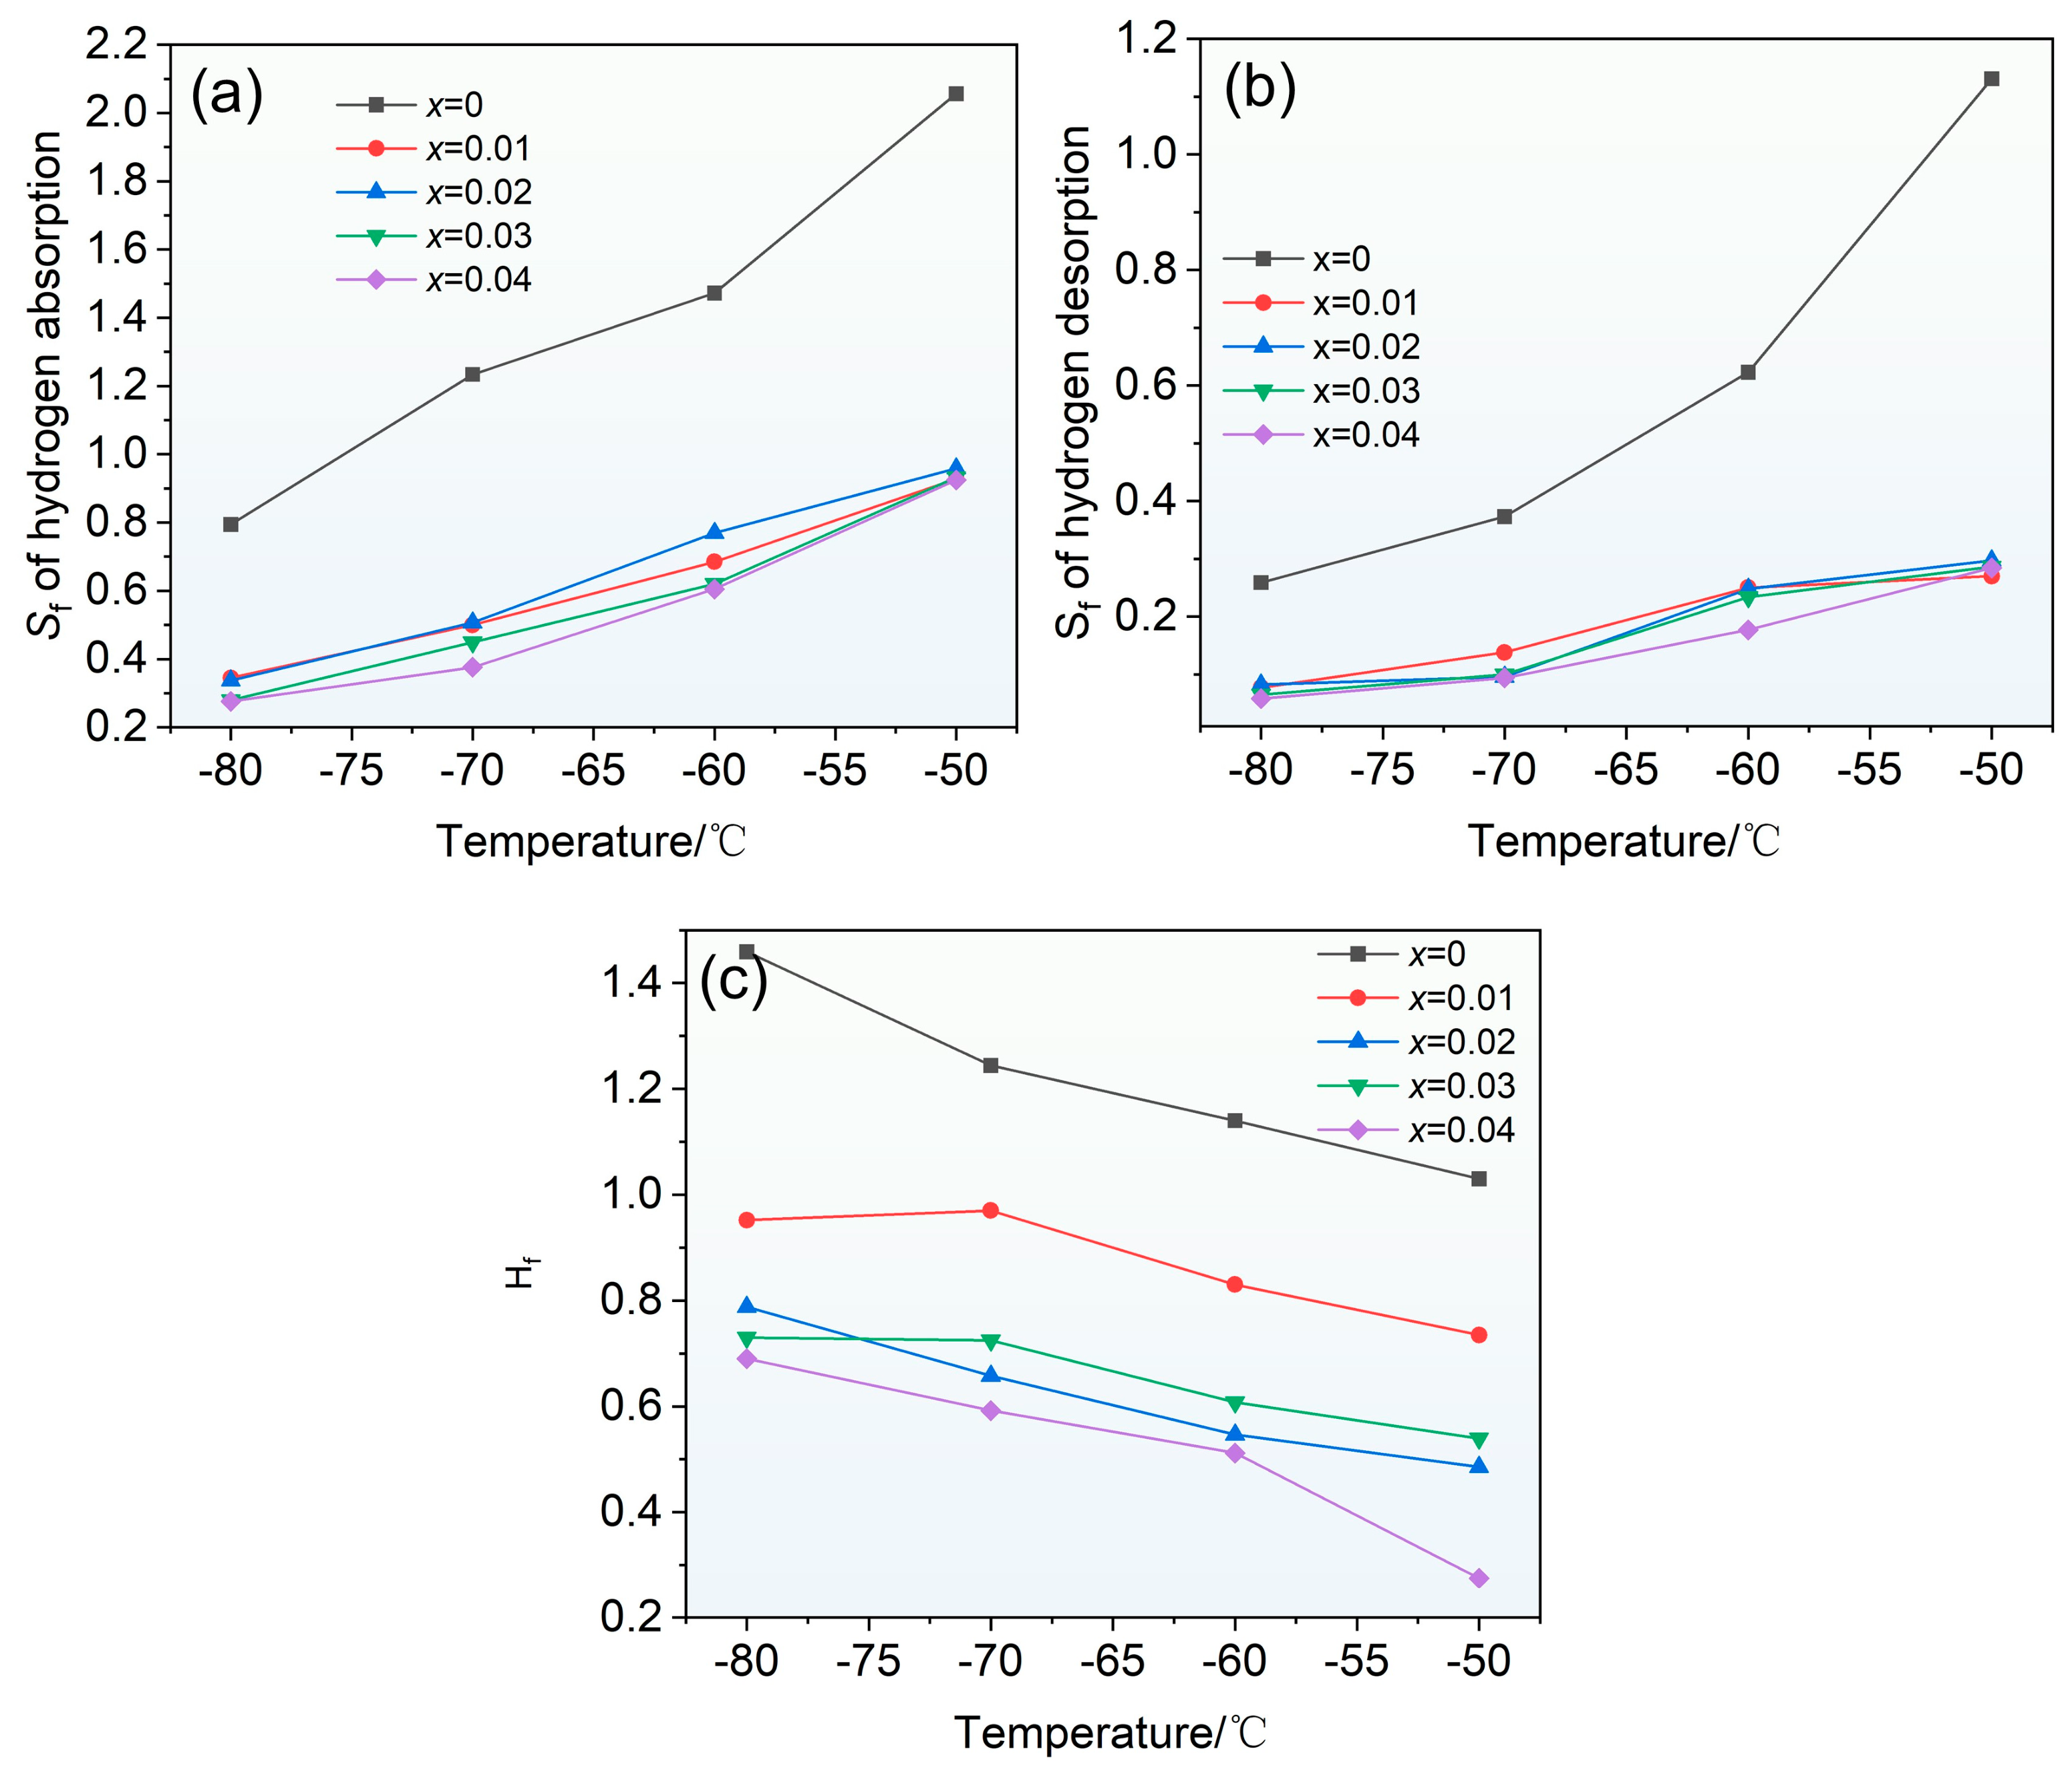
To further investigate the influence of rare earth Ce doping on the slope factor (Sf) and hysteresis factor (Hf) of the alloys, the Sf and Hf derived from the hydrogen ab/de-sorption PCT curves were systematically analyzed in this work, and the results are shown in Figure 10. Figure 10a presents the variation in the slope factor of the hydrogen absorption PCT curves with operating temperature. It can be seen that, with increasing temperature, the hydrogen absorption slope factor gradually increases for both the Ce-doped and Ce-free alloys. Figure 10b shows the variation in the slope factor of the hydrogen desorption PCT curves with operating temperature, exhibiting the same trend—the hydrogen desorption slope factor gradually increases with increasing temperature for both the Ce-doped and Ce-free alloys. In addition, Ce doping can significantly reduce the hydrogen absorption and desorption slope factor Sf, but the improvement effect on Sf is not significantly different among different Ce doping amounts, and is basically consistent. This may be related to the low solid solubility of Ce in the alloy; such improvement may only arise from the effect of Ce dissolved in the lattice.
Figure 10.
Variations in the slope factor and hysteresis factor derived from the PC isotherms for Ti0.94Zr0.08Cr1.0Mn0.4Fe0.6Cex (x = 0, 0.01, 0.02, 0.03, 0.04) alloys. (a) Sf of hydrogen absorption; (b) Sf of hydrogen desorption; (c) Hf of the hydrogen absorption/desorption curves.
The increase in the slope factor is closely related to the changes in the internal microstructure and thermodynamic characteristics of the alloy with temperature. On the one hand, as the temperature increases, the alloy lattice undergoes thermal expansion, and the size of the interstitial sites occupied by hydrogen atoms increases, which amplifies the differences in binding energy among different interstitial sites, thereby increasing the pressure gradient in the plateau region during hydride formation. Related studies have shown that changes in the local environment around interstitial sites directly affect the stability of hydrogen (plateau pressure) and the slope factor, and the slope factor is correlated with changes in the unit cell volume of the alloy [25]. On the other hand, the increase in temperature intensifies the thermal vibration of atoms within the alloy, leading to an increase in the occupancy disorder of the A-side and B-side elements in the C14 Laves phase. This non-uniformity of the local chemical environment enlarges the differences in hydride formation enthalpy among different regions, which manifests as an increased degree of plateau slope. Park et al. pointed out that the compositional non-uniformity of the alloy is an important cause of the sloping hydrogen absorption plateau, which leads to changes in interstitial binding energy and thereby increases the slope factor [26]. In addition, from a thermodynamic perspective, the plateau pressure in practical metal hydride systems is significantly affected by temperature. In real alloys, owing to factors such as microstrain and compositional segregation, different microdomains respond differently to temperature, further amplifying the “non-ideality” of the plateau region at elevated temperatures [27].
The improvement effect of Ce doping on the slope factor can be explained from the following aspects. First, the atomic radius of Ce is relatively large, and doping with Ce can significantly increase the unit cell volume of the C14 Laves main phase. The rare earth doping strategy can expand the unit cell volume of the C14 Laves main phase, increase the size of interstitial sites, facilitate the uniform occupation of hydrogen atoms, and thereby reduce the energy differences among different interstitial sites, making the plateau flatter [2]. Second, the addition of Ce helps to inhibit the precipitation and segregation of the C14 Laves phase, reduce the content of the C14 Laves phase in the alloy, and make the microstructure of the alloy more uniform, thereby improving the flatness of the plateau region [28]. Third, Ce has a strong deoxidizing effect, which can effectively reduce the oxygen content in the alloy and decrease the interference of oxide inclusions with hydride nucleation and growth [29], enabling the hydrogenation reaction to proceed in a more uniform microdomain environment, thereby reducing the slope factor. It is worth noting that in this study, the improvement effect on Sf is basically consistent among different Ce doping amounts (x = 0.01–0.04). This may be because the addition of a low content of Ce is already sufficient to effectively increase the unit cell volume and reduce the oxygen content, and further increasing the Ce content leads to a weakened marginal improvement effect.
Figure 10c shows the variation in the hysteresis factor of the hydrogen absorption/desorption PCT curves with operating temperature. The results indicate that, regardless of whether Ce is doped, the hysteresis factor of the alloy gradually decreases with increasing temperature. This is mainly attributed to the fact that increasing temperature reduces the yield strength and enhances the plastic deformation capability of the alloy, thereby decreasing the elastic strain and irreversible plastic deformation work caused by volume changes during hydride formation and decomposition, and consequently narrowing the plateau pressure difference between hydrogen absorption and desorption. Meanwhile, the contribution of the enthalpy difference between hydrogen absorption and desorption to the total free energy is diluted because the RT term increases, thus reducing hysteresis, which tends to disappear near the critical temperature [30]. A comparison of different Ce doping amounts shows that Ce doping can effectively reduce the hysteresis of the hydrogen absorption/desorption PCT curves. The mechanism lies in the following: the relatively large atomic radius of Ce can increase the unit cell volume of the C14 Laves main phase and the size of interstitial sites, alleviating the local lattice distortion and stress concentration caused by hydrogen atom insertion; the preferential oxygen absorption/deoxidation effect of Ce can also reduce oxide inclusions and elemental segregation, making the microstructure and hydrogenation microdomains more uniform, thereby reducing hysteresis. Unlike the case for Sf, for which the improvement effect of Ce doping is basically consistent, the improvement effect of different Ce doping amounts (x = 0.01–0.04) on Hf is different; the general trend is that the larger the Ce doping amount, the smaller the hysteresis factor Hf.
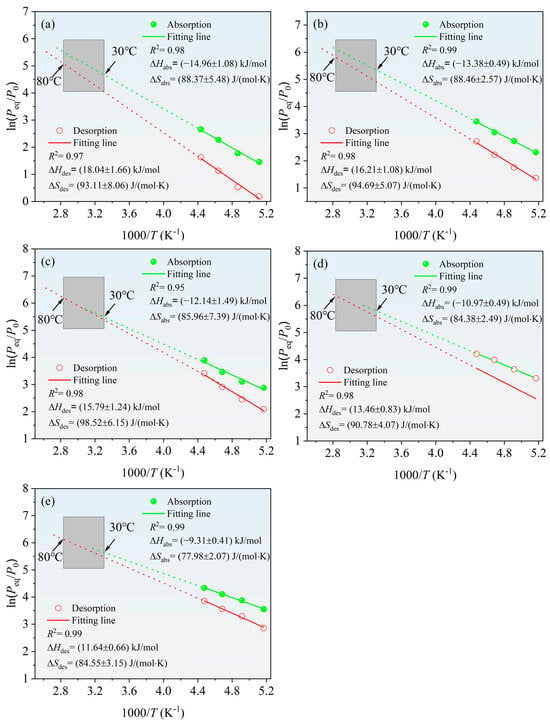
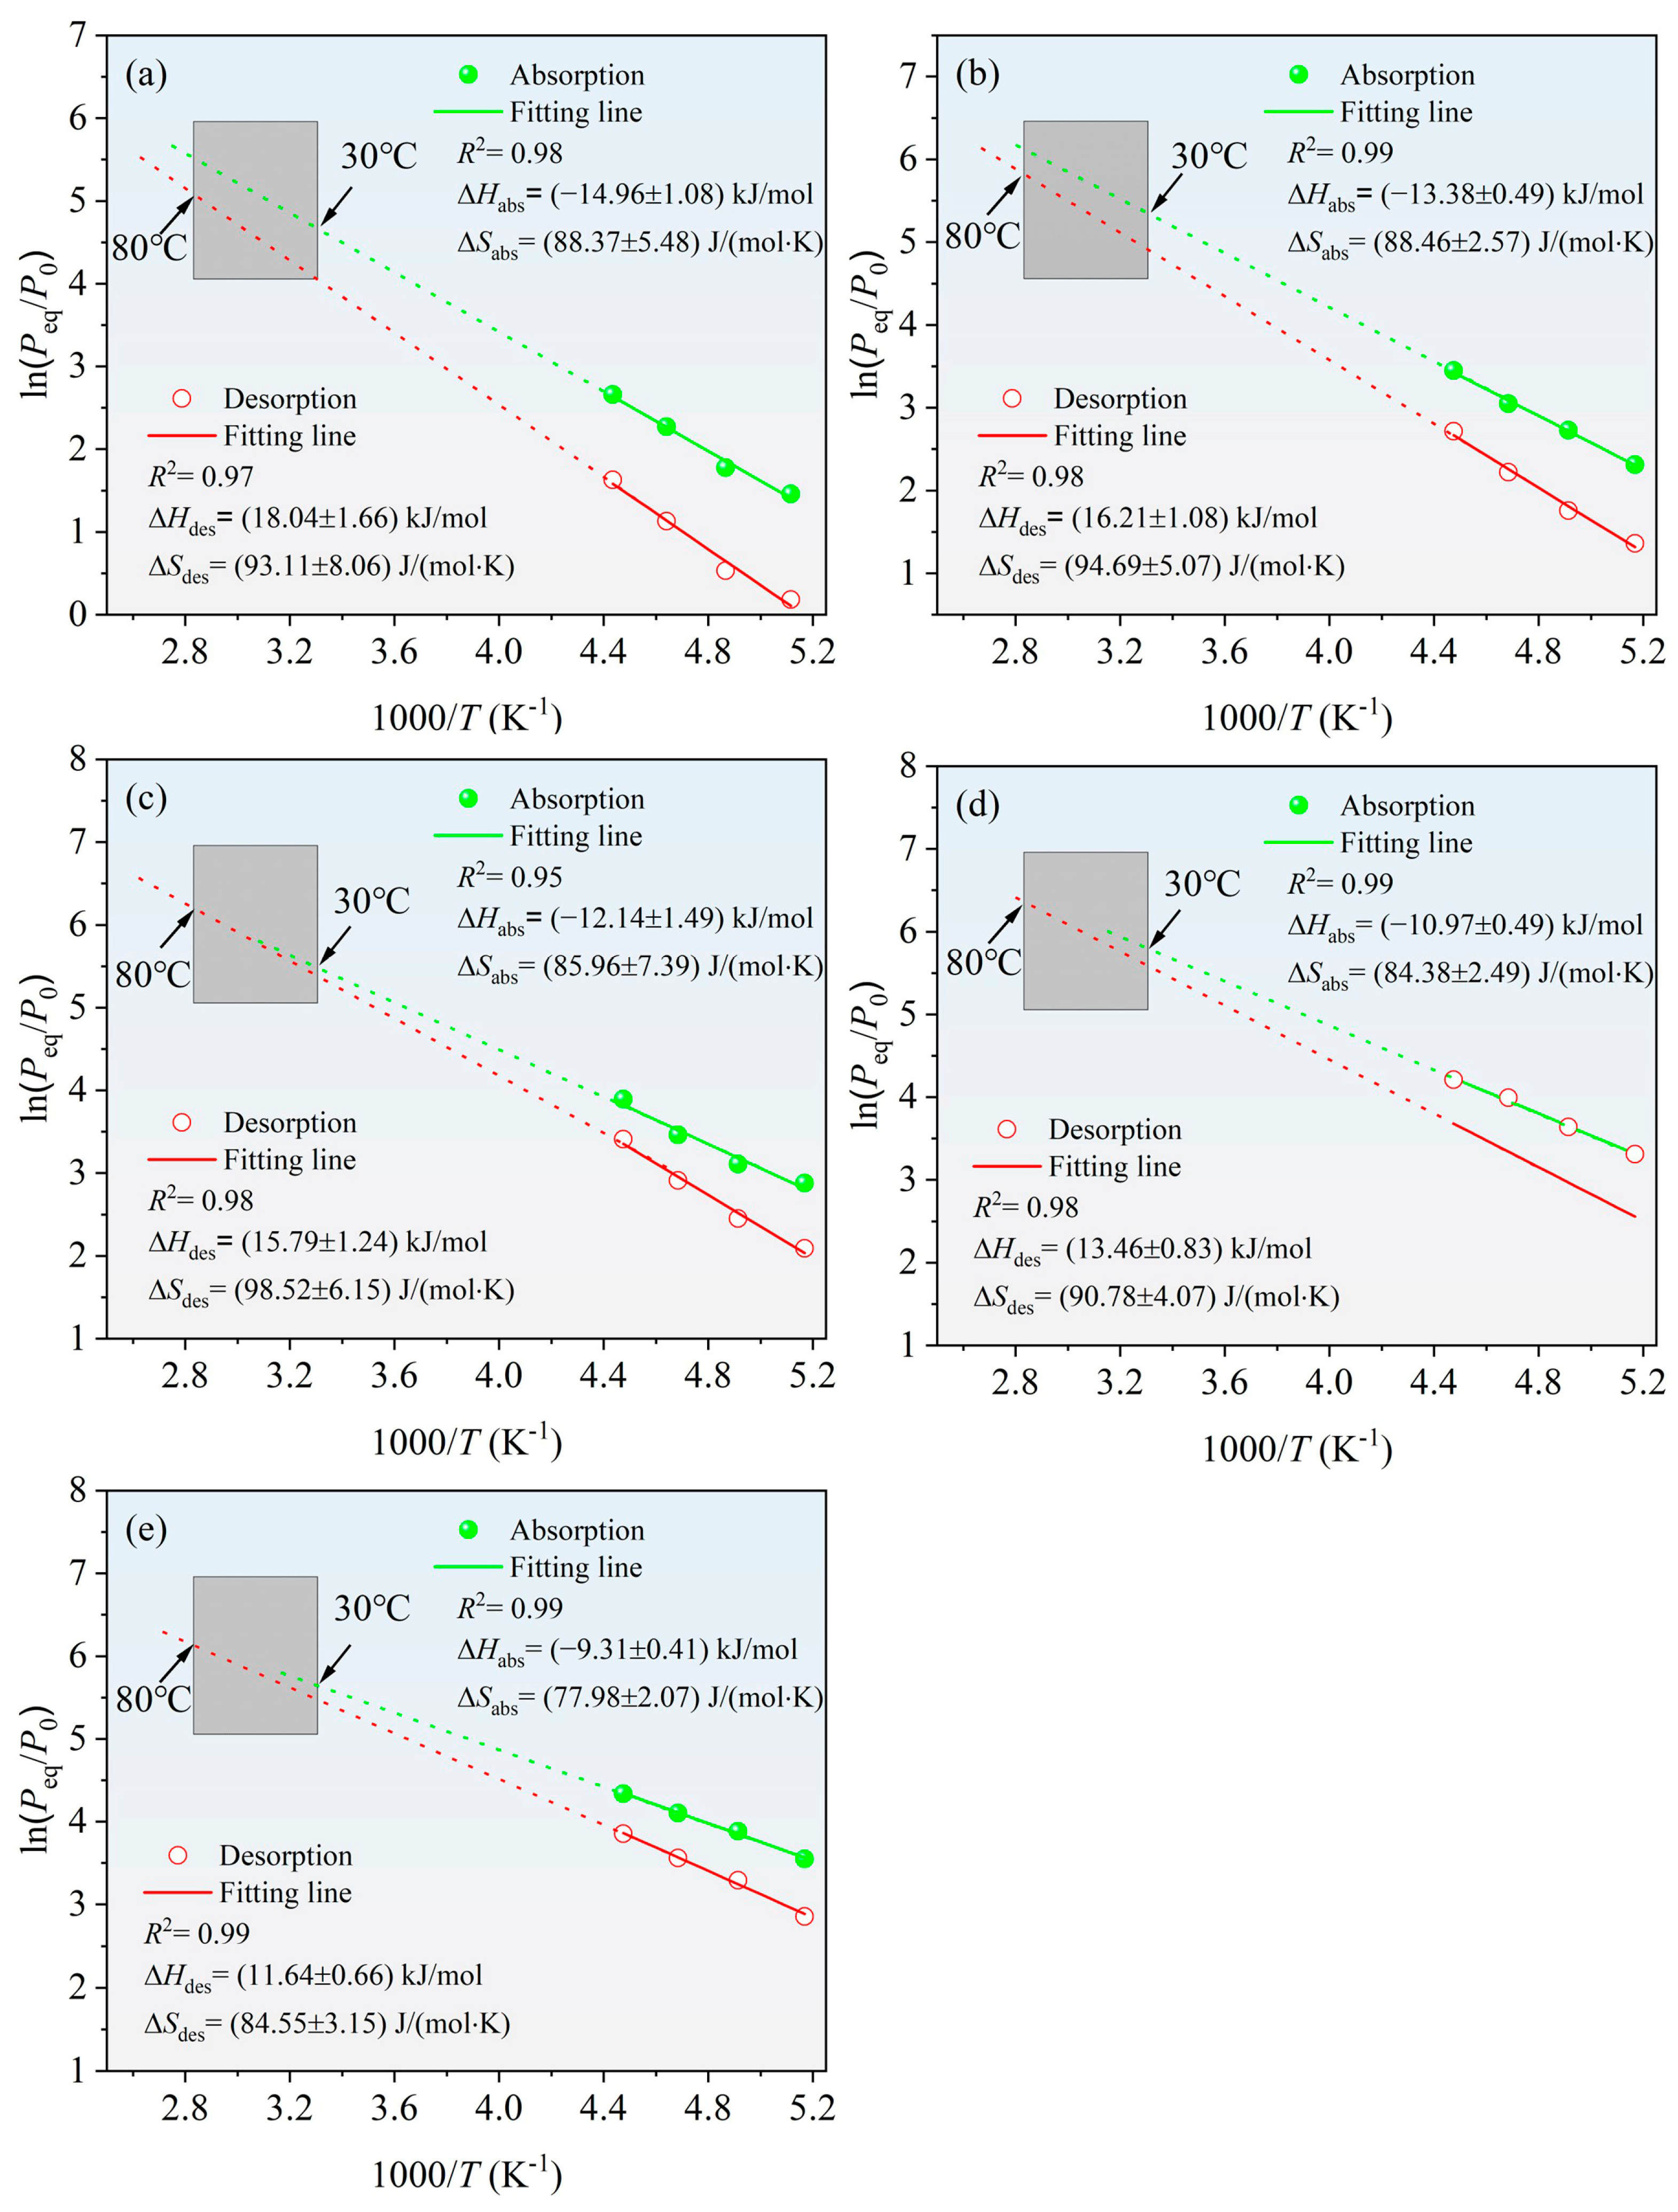
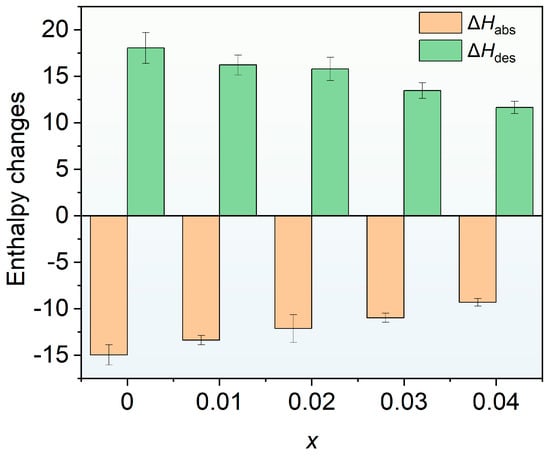
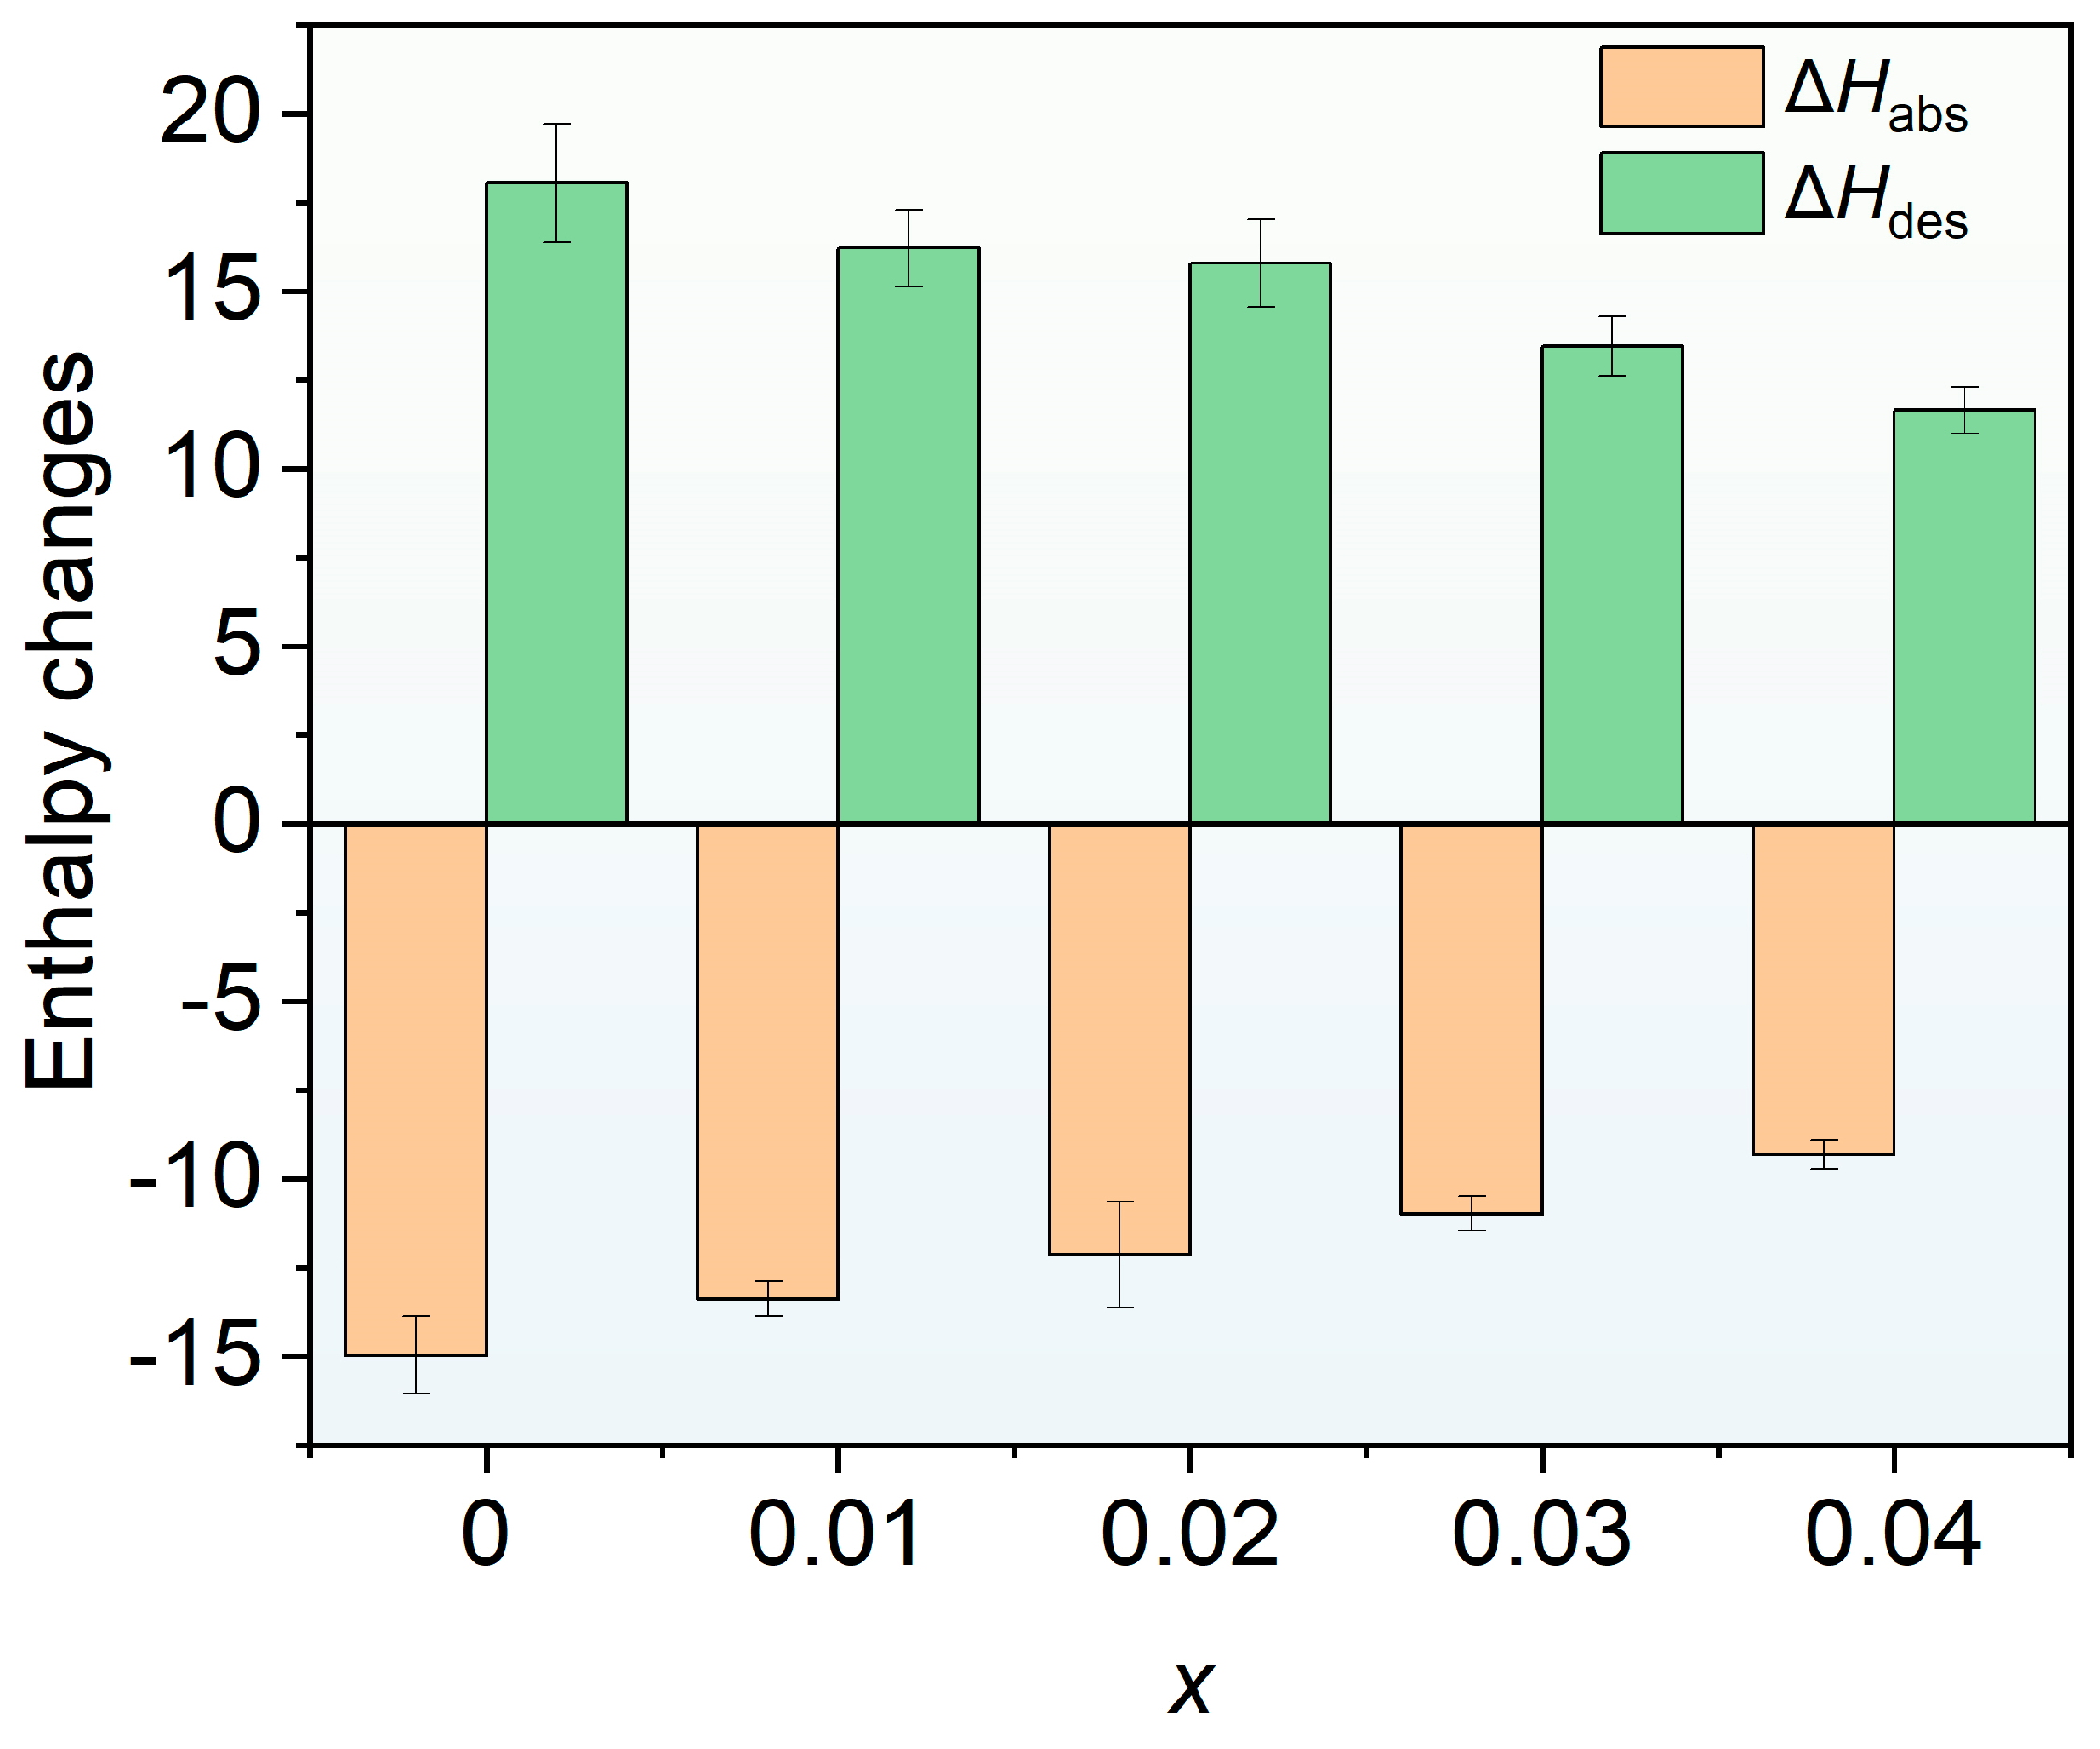
To calculate the enthalpy (ΔH) and entropy (ΔS) changes during the formation and decomposition of metal hydrides, the van’t Hoff equation was used based on the hydrogen absorption/desorption plateau pressures in the PCT curves and the corresponding temperatures. The corresponding van’t Hoff plots are shown in Figure 11, and the ΔH and ΔS are summarized in Table 2. To intuitively show the variation in the enthalpy change of hydrogen absorption/desorption with rare-earth Ce doping, Figure 12 presents a bar chart of these changes. It can be seen that the absolute values of the enthalpy changes for hydrogen absorption and desorption decrease with increasing Ce doping amount.
Figure 11.
Van’t Hoff plots of Ti0.94Zr0.08Cr1.0Mn0.4Fe0.6Cex (x = 0, 0.01, 0.02, 0.03, 0.04) alloys. (a) x = 0, (b) x = 0.01, (c) x = 0.02, (d) x = 0.03, and (e) x = 0.04.
Figure 12.
Bar chart of the hydrogen absorption/desorption enthalpy changes of Ti0.94Zr0.08Cr1.0Mn0.4Fe0.6Cex (x = 0, 0.01, 0.02, 0.03, 0.04) as a function of Ce doping amount x.
To assess whether the developed alloys are suitable for a metal hydride (MH) thermally driven compressor, this work adopts typical operating conditions of hydrogen absorption at 30 °C and desorption at 80 °C. In this conceptual compressor cycle, the absorption plateau pressure governs whether the alloy can effectively capture low-pressure hydrogen at a relatively low temperature, whereas the desorption plateau pressure is directly linked to its ability to supply high-pressure hydrogen. Because full pressure–composition (PC) isotherms at 30 °C and 80 °C were not available for every alloy, the absorption pressures at 30 °C were extrapolated from van’t Hoff relationships derived from the other measured temperatures, together with fugacity corrections (the absorption Van’t Hoff plots are given as solid lines in Figure 11). The calculated results reveal that the absorption equilibrium pressures of all alloys at this temperature lie within 10–33 MPa (see Table 3 for details), encompassing the target inlet pressure of approximately 30 MPa expected for a first-stage high-pressure hydrogen storage or compression system [31]. This indicates that these alloys exhibit strong hydrogen capture capability at relatively low temperatures and are promising candidates for the primary or intermediate compressor stage. In addition, rare-earth Ce doping can raise the hydrogen absorption pressure at 30 °C.
Table 3.
Absorption and dissociation pressures at 30 °C and 80 °C (estimated from the Van’t Hoff plots), compression factor of Ti0.94Zr0.08Cr1.0Mn0.4Fe0.6Cex (x = 0, 0.01, 0.02, 0.03, 0.04).
Because of experimental constraints, the PCT curves at 80 °C were not measured directly in this work; consequently, the hydrogen desorption pressure at this temperature was not determined experimentally. Nevertheless, the corresponding high-temperature desorption equilibrium pressure can be reasonably estimated from the van’t Hoff plots for the hydrogen absorption and desorption reactions (the dashed lines in Figure 11 denote the extrapolated high-temperature portions) together with the ΔH values derived from the slopes of these plots. Specifically, since the ΔS and ΔH during desorption remain essentially constant, the Van’t Hoff equation: lnP = ΔH/(RT) − ΔS/R can be used, together with the obtained ΔH and ΔS values, to extrapolate the desorption plateau pressure at 80 °C. The corresponding estimates are also listed in Table 3. Although this approach involves extrapolation, the linearity of the thermodynamic relationship makes it reasonably reliable, and it can serve as a useful reference for evaluating compressor performance. Such a method is widely used in studies on hydrogen compression materials. For instance, M. Zhu et al. [32] measured the PCT isotherms of a Ti–Cr–Mn–Fe-based alloy at –50, –40, –30, and –20 °C, and then applied van’t Hoff extrapolation to estimate the absorption pressure at 24.5 °C and the desorption pressure at 89.5 °C. In this study, it can be seen that Ce doping can increase the hydrogen desorption pressure at 80 °C. Specifically, the alloy with x = 0.03 achieves a hydrogen desorption pressure of 57.24 MPa at 80 °C, demonstrating excellent hydrogen compression capability.
Using the absorption and desorption pressures estimated above, the compression factor of the alloys over the present operating temperature range was further calculated as the ratio of the desorption pressure at 80 °C to the absorption pressure at 30 °C. This parameter is a critical metric for assessing the single-stage pressure-boosting capability of the compressor. The results reveal that with increasing Ce content, the compression factor first rises and then declines, reaching a peak value of 2.05 at x = 0.02. Such non-monotonic behavior is likely associated with coupled changes in lattice parameters, plateau slope, and absorption–desorption hysteresis. Moderate Ce doping may tailor the unit-cell dimensions and modify the differences in hydrogen stability within the lattice, thereby lowering the absolute value of the desorption enthalpy change and favoring a higher desorption pressure at elevated temperature. Excessive Ce, however, may give rise to a non-uniform phase structure and thus weaken the effective pressure-boosting ability. A maximum compression factor exceeding 2 indicates that, under hydrogen absorption at 30 °C and desorption at 80 °C, this conceptual compressor can achieve a two-fold pressure increase, demonstrating promising prospects for engineering applications.
Figure 12 presents the changes in these enthalpy values. It can be seen that the absolute values of the enthalpy changes for hydrogen absorption and desorption decrease with increasing Ce doping amount, indicating that the thermal effects of the absorption/desorption reactions are weakened, which is beneficial for reducing the thermal management burden and improving the energy efficiency of the compression cycle. From the perspective of hydrogen compression efficiency, a moderate reduction in the absolute enthalpy change can increase the high-temperature desorption plateau pressure, thereby enlarging the compression factor between desorption at 80 °C and absorption at 30 °C; this is consistent with the maximum compression factor of 2.05 achieved at x = 0.02. However, excessive Ce doping may cause inhomogeneous phase structures, increased plateau slope, and enhanced hysteresis, thereby weakening the effective pressure-boosting capability, so the thermodynamic performance does not improve monotonically with decreasing enthalpy change. Overall, the improvement in compression efficiency by Ce doping has an optimal range, and a balance should be struck among reducing the enthalpy change, increasing the desorption pressure, and suppressing hysteresis/plateau degradation; the composition near x = 0.02 exhibits relatively favorable thermodynamic compression performance.
4. Conclusions
This study systematically investigated the effects of Ce doping on the microstructure, hydrogen storage thermodynamics, and hydrogen compression performance of Ti0.94Zr0.08Cr1.0Mn0.4Fe0.6Cex (x = 0–0.04) alloys. Microstructural analysis showed that all alloys were dominated by the C14 Laves phase, while Ce doping introduced small amounts of elemental Ce and CeO2 phases. SEM/EDS revealed microscale compositional inhomogeneity and Ce segregation, with Ce existing mainly as elemental Ce and CeO2.
All alloys exhibited relatively fast hydrogen absorption kinetics. At –80 °C, the parent alloy reached about 90% of its saturated capacity in approximately 76 s, whereas the Ce-doped alloys required only 40–50 s, indicating that Ce doping improved the hydrogen absorption kinetics, although the desorption kinetics became slightly slower. The hydrogen absorption capacity first increased and then decreased with increasing Ce content; moderate Ce doping increased the capacity, whereas excessive Ce reduced it. Ce doping significantly reduced the slope factor and hysteresis factor of the PCT curves, and the hysteresis factor generally decreased with increasing Ce content. The absolute values of both absorption and desorption enthalpy changes decreased with increasing Ce doping content.
The compression factor first increased and then decreased with increasing Ce content, reaching a maximum of 2.05 at x = 0.02, while the x = 0.03 alloy achieved the highest desorption pressure of 57.24 MPa at 80 °C. Overall, moderate Ce doping is an effective strategy for tuning the plateau pressure, improving plateau flatness, reducing hysteresis, and enhancing hydrogen compression performance. The x = 0.02 alloy exhibits the best compression factor, and the optimized Ce-doped alloys show promising potential for low-grade waste heat-driven hydrogen compressors in refueling stations.
Author Contributions
Conceptualization, Y.D., Y.W., Y.H. and X.Z.; Methodology, T.D.; Software, T.D.; Formal analysis, T.D.; Investigation, Y.D., Y.W., X.Z. and L.L.; Resources, X.Z. and L.L.; Data curation, T.D.; Writing—original draft, Y.D.; Writing—review & editing, Y.D.; Visualization, Y.H. and X.Z.; Supervision, Y.W., Y.H. and L.L.; Project administration, L.L. All authors have read and agreed to the published version of the manuscript.
Funding
This work was supported by Major Scientific and Technological Projects in the Inner Mongolia Autonomous Region (2026ZD0110), and Natural Science Foundation of Inner Mongolia, China (2026MS0558).
Data Availability Statement
The original contributions presented in this study are included in the article. Further inquiries can be directed to the corresponding authors.
Conflicts of Interest
Yuan Deng, Yongguang Wang, Yi Huangfu, and Tao Deng were employed by Inner Mongolia Rare Earth Ovonic Metal Hydride Co., Ltd., Baotou 014010, China. The remaining authors declare that the research was conducted in the absence of any commercial or financial relationships that could be construed as a potential conflict of interest.
References
- Luo, L.; Yu, K.; Chen, L.; Han, H.; Deng, Y.; Chen, B.; Cheng, Y.; Li, Y.; Zhang, X. Optimizing the microstructure of high-entropy alloys to achieve efficient hydrogen storage at room temperature. Nano Res. 2026, 19, 94908396. [Google Scholar] [CrossRef] [Scilit]
- Yao, Z.D.; Liu, L.X.; Xiao, X.Z.; Wang, C.T.; Jiang, L.J.; Chen, L.X. Effect of rare earth doping on the hydrogen storage performance of Ti1.02Cr1.1Mn0.3Fe0.6 alloy for hybrid hydrogen storage application. J. Alloys Compd. 2018, 731, 524–530. [Google Scholar] [CrossRef] [Scilit]
- Luo, L.; Yu, K.C.; Chen, L.P.; Ma, R.; Zhang, X.F. Effect of Ti/V ratio on the microstructure and hydrogen storage properties of V–Ti–Cr–Fe–Mn medium-entropy alloys. Int. J. Hydrogen Energy 2026, 275, 157484. [Google Scholar] [CrossRef] [Scilit]
- Abe, J.O.; Popoola, A.P.I.; Ajenifuja, E.; Popoola, O.M. Hydrogen energy, economy and storage: Review and recommendation. Int. J. Hydrogen Energy 2019, 44, 15072–15086. [Google Scholar] [CrossRef] [Scilit]
- Staffell, I.; Scamman, D.; Velazquez Abad, A.; Balcombe, P.; Dodds, P.E.; Ekins, P.; Shah, N.; Ward, K.R. The role of hydrogen and fuel cells in the global energy system. Energy Environ. Sci. 2019, 12, 463–491. [Google Scholar] [CrossRef] [Scilit]
- Lototskyy, M.V.; Yartys, V.A.; Pollet, B.G.; Bowman, R.C. Metal hydride hydrogen compressors: A review. Int. J. Hydrogen Energy 2014, 39, 5818–5851. [Google Scholar] [CrossRef] [Scilit]
- Cao, Z.M.; Zhou, P.P.; Xiao, X.Z.; Zhan, L.J.; Jiang, Z.F.; Piao, M.Y.; Wang, S.M.; Jiang, L.J.; Chen, L.X. Studies on Ti-Zr-Cr-Mn-Fe-V based alloys for hydrogen compression under mild thermal conditions of water bath. J. Alloys Compd. 2022, 892, 162145. [Google Scholar] [CrossRef] [Scilit]
- Xu, J.; Qin, C.; Wang, H. C15-Structured Zr-Ti-Fe-Ni-V Alloys for High-Pressure Hydrogen Compression. Materials 2025, 18, 5482. [Google Scholar] [CrossRef] [Scilit] [PubMed]
- Yartys, V.A.; Lototskyy, M.; Linkov, V.; Grant, D.; Stuart, A.; Eriksen, J.; Denys, R.; Bowman, R.C., Jr. Metal hydride hydrogen compression: Recent advances and future prospects. Appl. Phys. A 2016, 122, 415. [Google Scholar] [CrossRef] [Scilit]
- Peng, Z.Y.; Li, Q.; Ouyang, L.Z.; Jiang, W.B.; Chen, K.; Wang, H.; Liu, J.W.; Li, Z.N.; Wang, S.M.; Zhu, M. Overview of hydrogen compression materials based on a three-stage metal hydride hydrogen compressor. J. Alloys Compd. 2022, 895, 162465. [Google Scholar] [CrossRef] [Scilit]
- Zhou, P.P.; Cao, Z.Z.; Xiao, X.Z.; Zhan, L.J.; Li, S.Q.; Li, Z.N.; Jiang, L.J.; Chen, L.X. Development of Ti-Zr-Mn-Cr-V based alloys for high-density hydrogen storage. J. Alloys Compd. 2021, 875, 160035. [Google Scholar] [CrossRef] [Scilit]
- Deng, Y.; Deng, T.; Wang, Y.G.; Huangfu, Y.; Zhao, X.; Luo, L. Investigation on Ti0.94Zr0.08Cr1.0Mn0.6−xFe0.4+x (x = 0, 0.1, 0.2, 0.3, 0.4) Alloys for 25 MPa Hydrogen Compression Materials. Metals 2026, 16, 965. [Google Scholar] [CrossRef] [Scilit]
- Chen, H.D.; Hu, H.Z.; Li, C.J.; Xu, C.H.; Yi, L.C.; Ma, C.M.; Chen, Q.J. Ce-Al synergy on microstructural, kinetics and thermodynamics properties of AB2-type hydrogen storage alloys. J. Rare Earths, 2025; in press. [CrossRef] [Scilit]
- Wu, R.; Zhao, X.; Ke, D.D.; Liu, J.J.; Hu, F.; Li, R.H.; Zou, S.T.; Zhang, B. Microstructure and hydrogen storage properties of Ti1-xCexV0.45Mn1.5 (x = 0, 0.05, 0.10, 0.15, and 0.20) alloys. J. Alloys Compd. 2024, 976, 173163. [Google Scholar] [CrossRef] [Scilit]
- Qiao, W.F.; Liu, W.Q.; Yin, D.M.; Ding, N.; Zhao, S.L.; Xiu, H.X.; Liu, C.; Wang, Y.; He, M.; Wang, C.L.; et al. Comprehensive improvement of AB2 hydrogen storage alloy: Substitution of rare earth elements for different A-side alloys. Chem. Eng. J. 2024, 495, 153489. [Google Scholar] [CrossRef] [Scilit]
- Zhou, L.; Li, W.X.; Hu, H.Z.; Zeng, H.F.; Chen, Q.J. Ce-Doped TiZrCrMn Alloys for Enhanced Hydrogen Storage. Energy Fuels 2022, 36, 3997–4005. [Google Scholar] [CrossRef] [Scilit]
- Pauling, L. Atomic Radii and Interatomic Distances in Metals. J. Am. Chem. Soc. 1947, 69, 542–553. [Google Scholar] [CrossRef] [Scilit]
- Luo, L.; Yang, F.; Li, Y.; Li, L.; Li, Y. Investigation of the microstructure and hydrogen storage behavior of V48Fe12Ti15+xCr25-x (x = 0, 5, 10, 15) alloys. Int. J. Hydrogen Energy 2022, 47, 9653–9671. [Google Scholar] [CrossRef] [Scilit]
- Philipose, S.M.; Mani, N.; Kesavan, T.R.; Ramaprabhu, S. Investigations of hydrogen storage properties in certain Zr-based AB2 alloys. Int. J. Hydrogen Energy 2002, 27, 419–424. [Google Scholar] [CrossRef] [Scilit]
- Tao, G.; Zhang, H.; Li, A.; Xue, X.Y.; Zhang, Y.Q.; Zhang, Y.J.; He, T.M.; Wang, H.; Liu, Y.R. Effect of alloy particle size and device internal structure on the de-/hydriding properties of Ti-Zr-Cr-Mn based hydrogen storage alloys. Int. J. Hydrogen Energy 2025, 173, 151029. [Google Scholar] [CrossRef] [Scilit]
- Luo, L.; Li, Y.M.; Yuan, Z.M.; Liu, S.X.; Singh, A.; Yang, F.; Li, B.Q.; Li, L.R.; Li, Y.Z. Nanoscale microstructures and novel hydrogen storage performance of as cast V47Fe11Ti30Cr10RE2 (RE = La, Ce, Y, Sc) medium entropy alloys. J. Alloys Compd. 2022, 913, 165273. [Google Scholar] [CrossRef] [Scilit]
- Park, J.G.; Jang, H.Y.; Han, S.C.; Lee, P.S.; Lee, J.Y. Hydrogen storage properties of TiMn2-based alloys for metal hydride heat pump. Mater. Sci. Eng. 2002, 329–331, 351–355. [Google Scholar] [CrossRef] [Scilit]
- Mitrokhin, S.; Zotov, T.; Movlaev, E.; Verbetsky, V. Hydrogen interaction with intermetallic compounds and alloys at high pressure. J. Alloys Compd. 2013, 580, S90–S93. [Google Scholar] [CrossRef] [Scilit]
- Beeri, O.; Cohen, D.; Gavra, Z.; Mintz, M.H. Sites occupation and thermodynamic properties of the TiCr2−xMnx–H2 (0 ≤ x ≤ 1) system: Statistical thermodynamics analysis. J. Alloys Compd. 2003, 352, 111–122. [Google Scholar] [CrossRef] [Scilit]
- Feng, F.; Geng, M.; Northwood, D.O. Mathematical model for the plateau region of P–C-isotherms of hydrogen-absorbing alloys using hydrogen reaction kinetics. Comput. Mater. Sci. 2002, 23, 291–299. [Google Scholar] [CrossRef] [Scilit]
- Park, C.N.; Luo, S.F.; Flanagan, T.B. Analysis of sloping plateaux in alloys and intermetallic hydrides: I. Diagnostic features. J. Alloys Compd. 2004, 384, 203–207. [Google Scholar] [CrossRef] [Scilit]
- Fang, S.; Zhou, Z.; Zhang, J.; Yao, M.; Feng, F.; Northwood, D.O. The application of mathematical models to the calculation of selected hydrogen storage properties (formation enthalpy and hysteresis) of AB2-type alloys. Int. J. Hydrogen Energy 2000, 25, 143–149. [Google Scholar] [CrossRef] [Scilit]
- Chen, X.Y.; Chen, R.R.; Yu, K.; Ding, X.; Li, X.Z.; Ding, H.S.; Su, Y.Q.; Guo, J.J. Effect of Ce substitution on hydrogen absorption/desorption of Laves phase-related BCC solid solution Ti33V37Mn30 alloy. J. Alloys Compd. 2019, 783, 617–624. [Google Scholar] [CrossRef] [Scilit]
- Ponson, J.B.; Botta, W.J.; Zepon, G. Ce-Doping in (Ti0.5Zr0.5)1(Fe0.5Mn0.5)2 Alloy: A Strategy for Improved Hydrogen Absorption. ACS Appl. Energy Mater. 2026, 9, 7712–7724. [Google Scholar] [CrossRef] [Scilit]
- Flanagan, T.B.; Clewley, J.D. Hysteresis in metal hydrides. J. Less Common Met. 1982, 83, 127–141. [Google Scholar] [CrossRef] [Scilit]
- Charbonnier, V.; Enoki, H.; Asano, K.; Kim, H.; Sakaki, K. Tuning the hydrogenation properties of Ti1+yCr2-xMnx laves phase compounds for high pressure metal-hydride compressors. Int. J. Hydrogen Energy 2021, 46, 36369–36380. [Google Scholar] [CrossRef] [Scilit]
- Peng, Z.Y.; Li, Q.; Sun, J.Y.; Chen, K.; Jiang, W.B.; Wang, H.; Liu, J.W.; Ouyang, L.Z.; Zhu, M. Ti-Cr-Mn-Fe-based alloys optimized by orthogonal experiment for 85 MPa hydrogen compression materials. J. Alloys Compd. 2022, 891, 161791. [Google Scholar] [CrossRef] [Scilit]

Disclaimer/Publisher’s Note: The statements, opinions and data contained in all publications are solely those of the individual author(s) and contributor(s) and not of MDPI and/or the editor(s). MDPI and/or the editor(s) disclaim responsibility for any injury to people or property resulting from any ideas, methods, instructions or products referred to in the content. |
© 2026 by the authors. Licensee MDPI, Basel, Switzerland. This article is an open access article distributed under the terms and conditions of the Creative Commons Attribution (CC BY) license.