


Abstract
Investigation of the isothermal phase diagram of the CaO-Al2O3-CeO2-MgO slag system is of considerable importance for the enrichment and recovery of secondary rare-earth resources. However, studies on the thermodynamic properties of this quaternary slag system remain limited, and essential thermodynamic data, particularly those concerning phase-equilibrium relationships, are still lacking. In the present study, the phase equilibria of the CaO-Al2O3-CeO2-MgO slag system were systematically investigated through high-temperature equilibration experiments at 1500 °C in an air atmosphere, combined with scanning electron microscopy-energy dispersive spectroscopy (SEM-EDS), and an isothermal phase diagram of the system was constructed. The results indicate that 14 phase equilibrium relationships exist within the investigated composition range. A liquid-phase region was identified at 1500 °C over the composition ranges of w(CaO)/w(Al2O3) = 0.52~1.39, w(CeO2) = 0~25.75% and w(MgO) = 0~10.00%. Based on the constructed isothermal phase diagram, the formation of Ce-enriched solid phases during the recovery of secondary rare-earth resources was further analyzed. These results provide an important thermodynamic basis for the efficient recovery of secondary rare-earth resources and the optimization of related metallurgical processes.
1. Introduction
Rare earth elements are critical strategic resources that underpin the development of renewable energy, aerospace, electronic information technology, advanced manufacturing, and national defense industries [1,2,3]. In recent years, the continuously increasing demand for rare-earth functional materials has driven rapid advances in rare-earth smelting, separation and purification, materials applications, and comprehensive resource utilization [4,5,6,7]. The Bayan Obo deposit in Inner Mongolia, the world’s largest rare-earth–niobium–iron polymetallic deposit, contains abundant rare-earth resources and serves as an important resource base for the development of China’s rare-earth industry. However, during the mining, beneficiation, and smelting of rare-earth resources, substantial quantities of rare-earth oxides inevitably remain in tailings, metallurgical slags, and other industrial solid wastes [8,9,10]. These rare-earth-bearing solid wastes not only represent a potential loss of valuable rare-earth resources but also pose greater challenges to efficient resource utilization and the development of environmentally sustainable metallurgical processes. Consequently, the efficient separation, enrichment, and recovery of rare-earth components from rare-earth-bearing solid wastes have become an important research direction in the utilization of secondary rare-earth resources. To date, various pyrometallurgical separation and enrichment processes have been investigated [11,12,13,14,15,16]. These methods promote the selective precipitation or enrichment of rare-earth-containing phases by controlling the slag composition, temperature, and atmosphere. Although several process routes have been proposed, most remain difficult to implement on a stable and efficient industrial scale because of their process complexity, high energy consumption, and the lack of fundamental phase-diagram data.
During the comprehensive utilization of rare-earth resources, the associated metallurgical slags can generally be regarded as multicomponent slag systems based on CaO-Al2O3-CeO2-MgO [17,18]. However, the phase-equilibrium relationships and thermodynamic properties of these complex slag systems under different temperatures, atmospheres, and compositional conditions have not yet been fully clarified. In particular, isothermal phase-diagram data that can be directly applied to the design of high-temperature metallurgical processes remain scarce. This lack of fundamental data has become a major constraint on the resource utilization of rare-earth-bearing slags and the precise control of the corresponding metallurgical processes. Phase diagrams provide essential thermodynamic information for the design and development of metallurgical slag systems and for the development and optimization of processes involving mining, smelting, and comprehensive resource utilization. For rare-earth-bearing slags, phase diagrams can not only identify the stability regions of rare-earth-containing phases but also provide theoretical guidance for the controlled enrichment, selective precipitation, and efficient separation of rare-earth components. The CaO-Al2O3-CeO2-MgO system is an important quaternary slag system encountered in the comprehensive utilization of rare-earth resources, and its phase-equilibrium information is essential for understanding the formation mechanisms and evolution of rare-earth-containing phases in Ce-bearing slags. Nevertheless, systematic investigations of the complete thermodynamic and phase-diagram information for this quaternary system remain scarce. Existing phase-diagram and thermodynamic studies of the CaO-Al2O3-CeO2-MgO system have primarily focused on its constituent binary and ternary subsystems [19,20,21,22,23,24]. Regarding the quaternary system, only Qiu [25] had investigated its phase equilibria at 1300 °C. However, the operating temperatures employed in rare-earth steelmaking and the comprehensive utilization of rare-earth resources are generally approximately 1500 °C. Therefore, it is necessary to investigate the phase equilibria of the CaO-Al2O3-CeO2-MgO slag system at 1500 °C. The resulting data will not only enrich the available high-temperature thermodynamic database for metallurgical slag systems but also provide important theoretical guidance for the efficient recovery of rare-earth resources.
In the present study, the phase-equilibrium relationships of the CaO-Al2O3-CeO2-MgO slag system at 1500 °C in an air atmosphere (P(O2) = 0.21 atm) were systematically investigated using high-temperature equilibrium experiments [26,27,28,29] in conjunction with scanning electron microscopy-energy dispersive spectroscopy (SEM-EDS). Based on the experimental results, together with the relevant thermodynamic principles and phase-rule constraints, an isothermal phase diagram of the CaO-Al2O3-CeO2-MgO slag system at 1500 °C in an air atmosphere was established.
2. Experiment
2.1. Sample Preparation
To ensure experimental accuracy, all slag samples were prepared using CaO, Al2O3, CeO2, and MgO chemical reagents with a stated purity of 99.99% (Sinopharm Chemical Reagent Co., Ltd., Beijing, China). Before weighing, each reagent was heated to 1000 °C in a muffle furnace (Model: TMF-14-09, Manufacturer: Beijing Hexin Tongtong Technology Development Co., Ltd., Beijing, China) and calcined for 4 h to remove volatile surface impurities and water from crystallization. Subsequently, 15 g of each slag sample was accurately weighed using a JA203H (Manufacturer: Changzhou Maikenuo Instrument Co., Ltd., Changzhou, China) electronic balance with a precision of 0.0001 g. The nominal compositions of the slag samples are listed in Table 1.
Table 1.
Design Composition of Experimental Slag Samples, mass%.
To ensure compositional homogeneity, the thoroughly mixed slag samples were placed in platinum crucibles and heated to 1600 °C in a high-frequency induction furnace, followed by holding for 9 h. After complete melting, the samples were rapidly quenched in an ice–water mixture. The premelted slag samples were subsequently examined by scanning electron microscopy-energy dispersive spectroscopy (SEM-EDS, Model: Phenom ProX, Manufacturer: Phenom Scientific Instruments, Shanghai, China). As shown in Figure 1, all 24 premelted slag samples exhibited a homogeneous glassy phase, indicating that the slag samples were compositionally homogeneous.
Figure 1.
Typical photograph of a pre-melted slag sample.
2.2. Experimental Methods
The high-temperature equilibrium experiments were conducted in a MoSi2 resistance furnace equipped with a quenching system. The temperature was measured using a Type B Pt-Rh thermocouple in accordance with GB/T 16839.1-2018 [30] and regulated by a PID controller (AI-719P, Xiamen Yudian Automation Technology Co., Ltd., Xiamen, China) with a temperature-control accuracy of ±1 °C. To ensure accurate temperature measurements, the thermocouple was calibrated before and after the experiments in accordance with JJG 141-2013 [31]. A platinum crucible containing 2 g of the premelted slag was placed in the constant-temperature zone of the furnace. The furnace was heated to 1600 °C and held for 2 h to ensure complete melting of the slag, after which the temperature was decreased to the equilibrium temperature of 1500 °C. The sample was then held at 1500 °C for 24 h to ensure the attainment of thermodynamic equilibrium.
After equilibration, the slag samples were rapidly quenched by dropping them into an ice–water mixture. The entire quenching procedure was completed within 3 s to suppress the precipitation of nonequilibrium phases from the high-temperature melt. The phases present in each experimental sample were identified and evaluated in conjunction with phase-rule calculations to verify that thermodynamic equilibrium had been attained. The quenched samples were crushed, mounted, ground, and polished, and subsequently analyzed using scanning electron microscopy coupled with energy-dispersive spectroscopy (SEM-EDS) to determine the microstructures and compositions of the equilibrium phases. The SEM-EDS operating conditions were as follows: an accelerating voltage (EHT) of 15 kV and a probe current of 200 pA. The elemental concentrations were reported in terms of Ca, Al, Ce, Mg, and O. A ZAF correction procedure was applied, where Z, A, and F represent the atomic-number, absorption, and fluorescence effects, respectively. The standards used for quantitative analysis were CaSiO3 for Ca, Al2O3 for Al, CeO2 for Ce, MgO for Mg, and Al2O3 for O, with an analytical accuracy of 1%. For each phase, EDS point analysis was performed at six randomly selected locations, and the average value was reported as the representative composition. The analytical errors of the EDS measurements were within the maximum detection limit of the instrument.
Prior to the experiments, the oxidation states of Ce in the CaO-Al2O3-CeO2-MgO slag system were qualitatively evaluated using thermodynamic data obtained from FactSage 8.4. Under the present experimental conditions in air (P(O2) = 0.21 atm), the following reactions can be considered:
in which , with the pure solid substance as the standard state. Taking pure solid substances as the standard states, the ratio a(Ce2O3)/a2(CeO2) in the slag was calculated to be 0.000262 according to Equation (1). When a(CeO2) approaches 1, a(Ce2O3) approaches 0.000262. In the analysis, we used the activity to replace the concentration. The extremely low activity of Ce2O3 indicates that its amount in the slag is negligible under the present conditions. Therefore, under the present experimental conditions in air, it is reasonable to assume that Ce exists predominantly as CeO2 and to treat all Ce as CeO2 in the subsequent phase-equilibrium analysis.
4(CeO2) = O2(P(O2) = 0.21atm) + 2(Ce2O3)
3. Results and Discussion
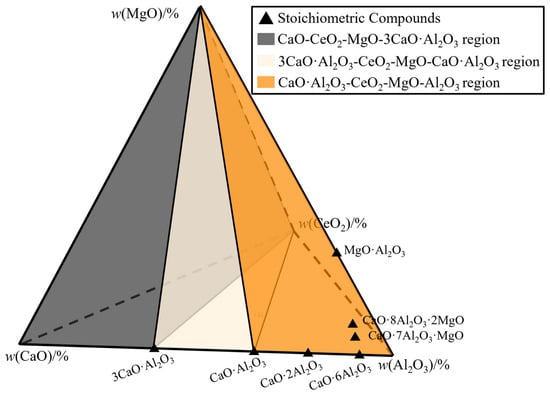
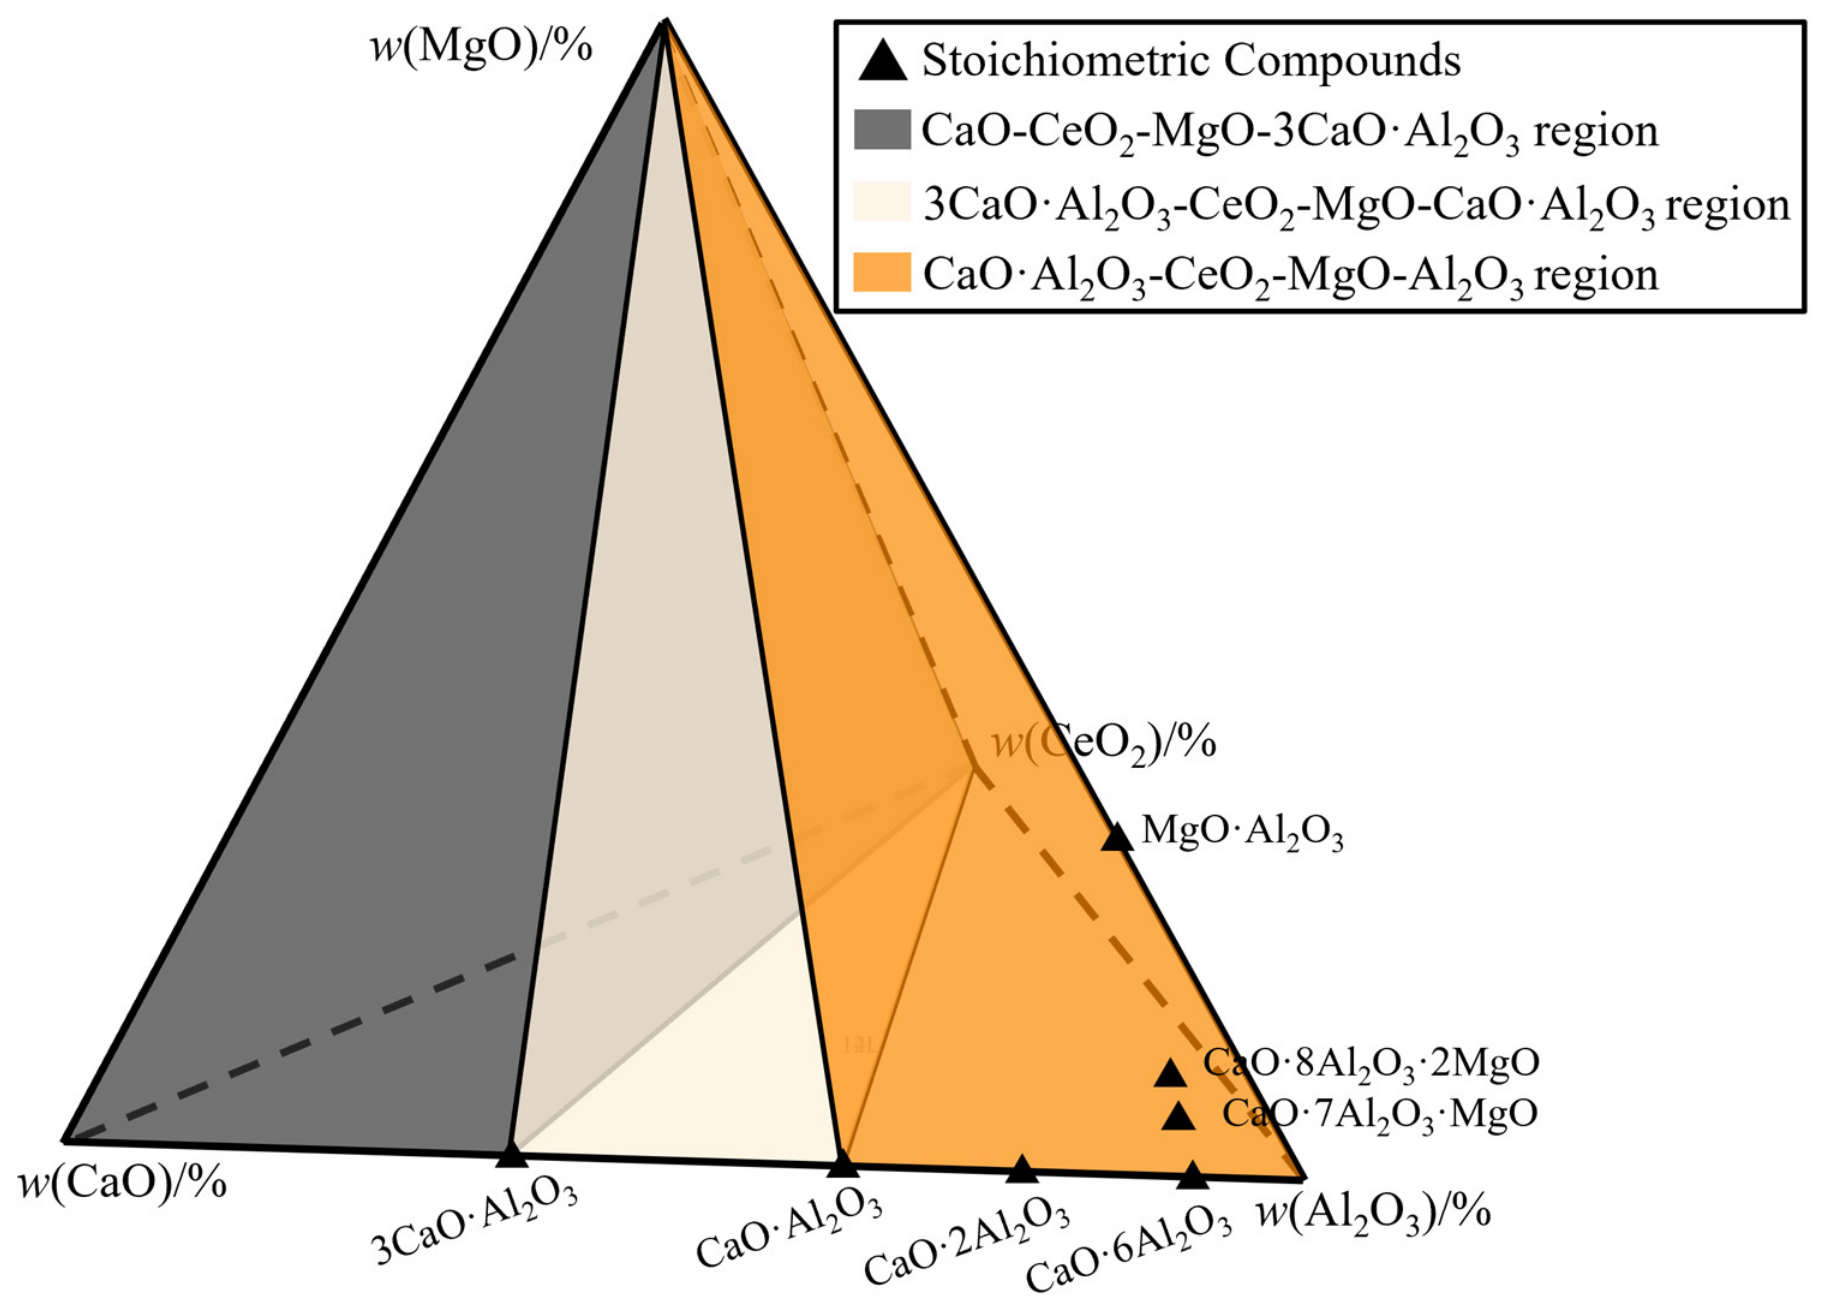
Based on the results of high-temperature thermodynamic equilibrium experiments conducted on 24 slag samples, a total of 14 distinct phase equilibrium relationships were identified. These comprised two four-phase equilibrium relationships (Liquid + CaO + CeO2 + MgO and Liquid + CeO2 + MgO·Al2O3 + CaO·2Al2O3), five three-phase equilibrium relationships (Liquid + CaO + 3CaO·Al2O3, Liquid + CeO2 + MgO·Al2O3, Liquid + CaO + MgO, Liquid + MgO + CeO2, and Liquid + CaO + CeO2), six two-phase equilibrium relationships (Liquid + CeO2, Liquid + CaO·Al2O3, Liquid + 3CaO·Al2O3, Liquid + MgO·Al2O3, Liquid + MgO and Liquid + CaO), and a single liquid phase. To clearly illustrate the construction of the isothermal phase diagram of the CaO-Al2O3-CeO2-MgO quaternary system, the composition space was divided into three separate tetrahedral regions (Figure 2), and the isothermal phase diagram for each region was constructed separately. In addition, to facilitate direct comparison of the microstructures and equilibrium phase assemblages of the slag samples with their corresponding locations in the phase diagram, while ensuring both completeness of the presented information and a compact figure layout, these results are integrated into a single figure in the following sections.
Figure 2.
Schematic diagram of the three independent tetrahedral regions in the CaO-Al2O3-CeO2-MgO quaternary system.
3.1. Construction of the Isothermal Phase Diagram for the CaO-CeO2-MgO-3CaO·Al2O3 Region
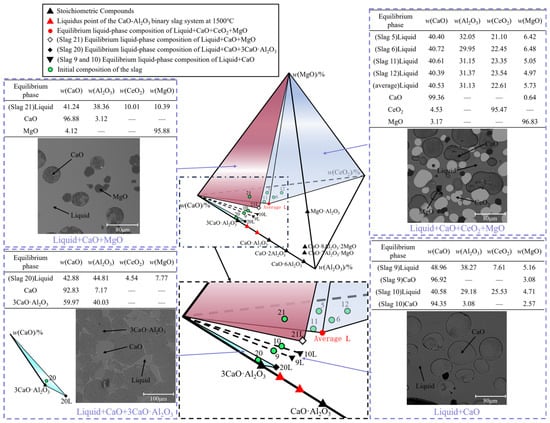
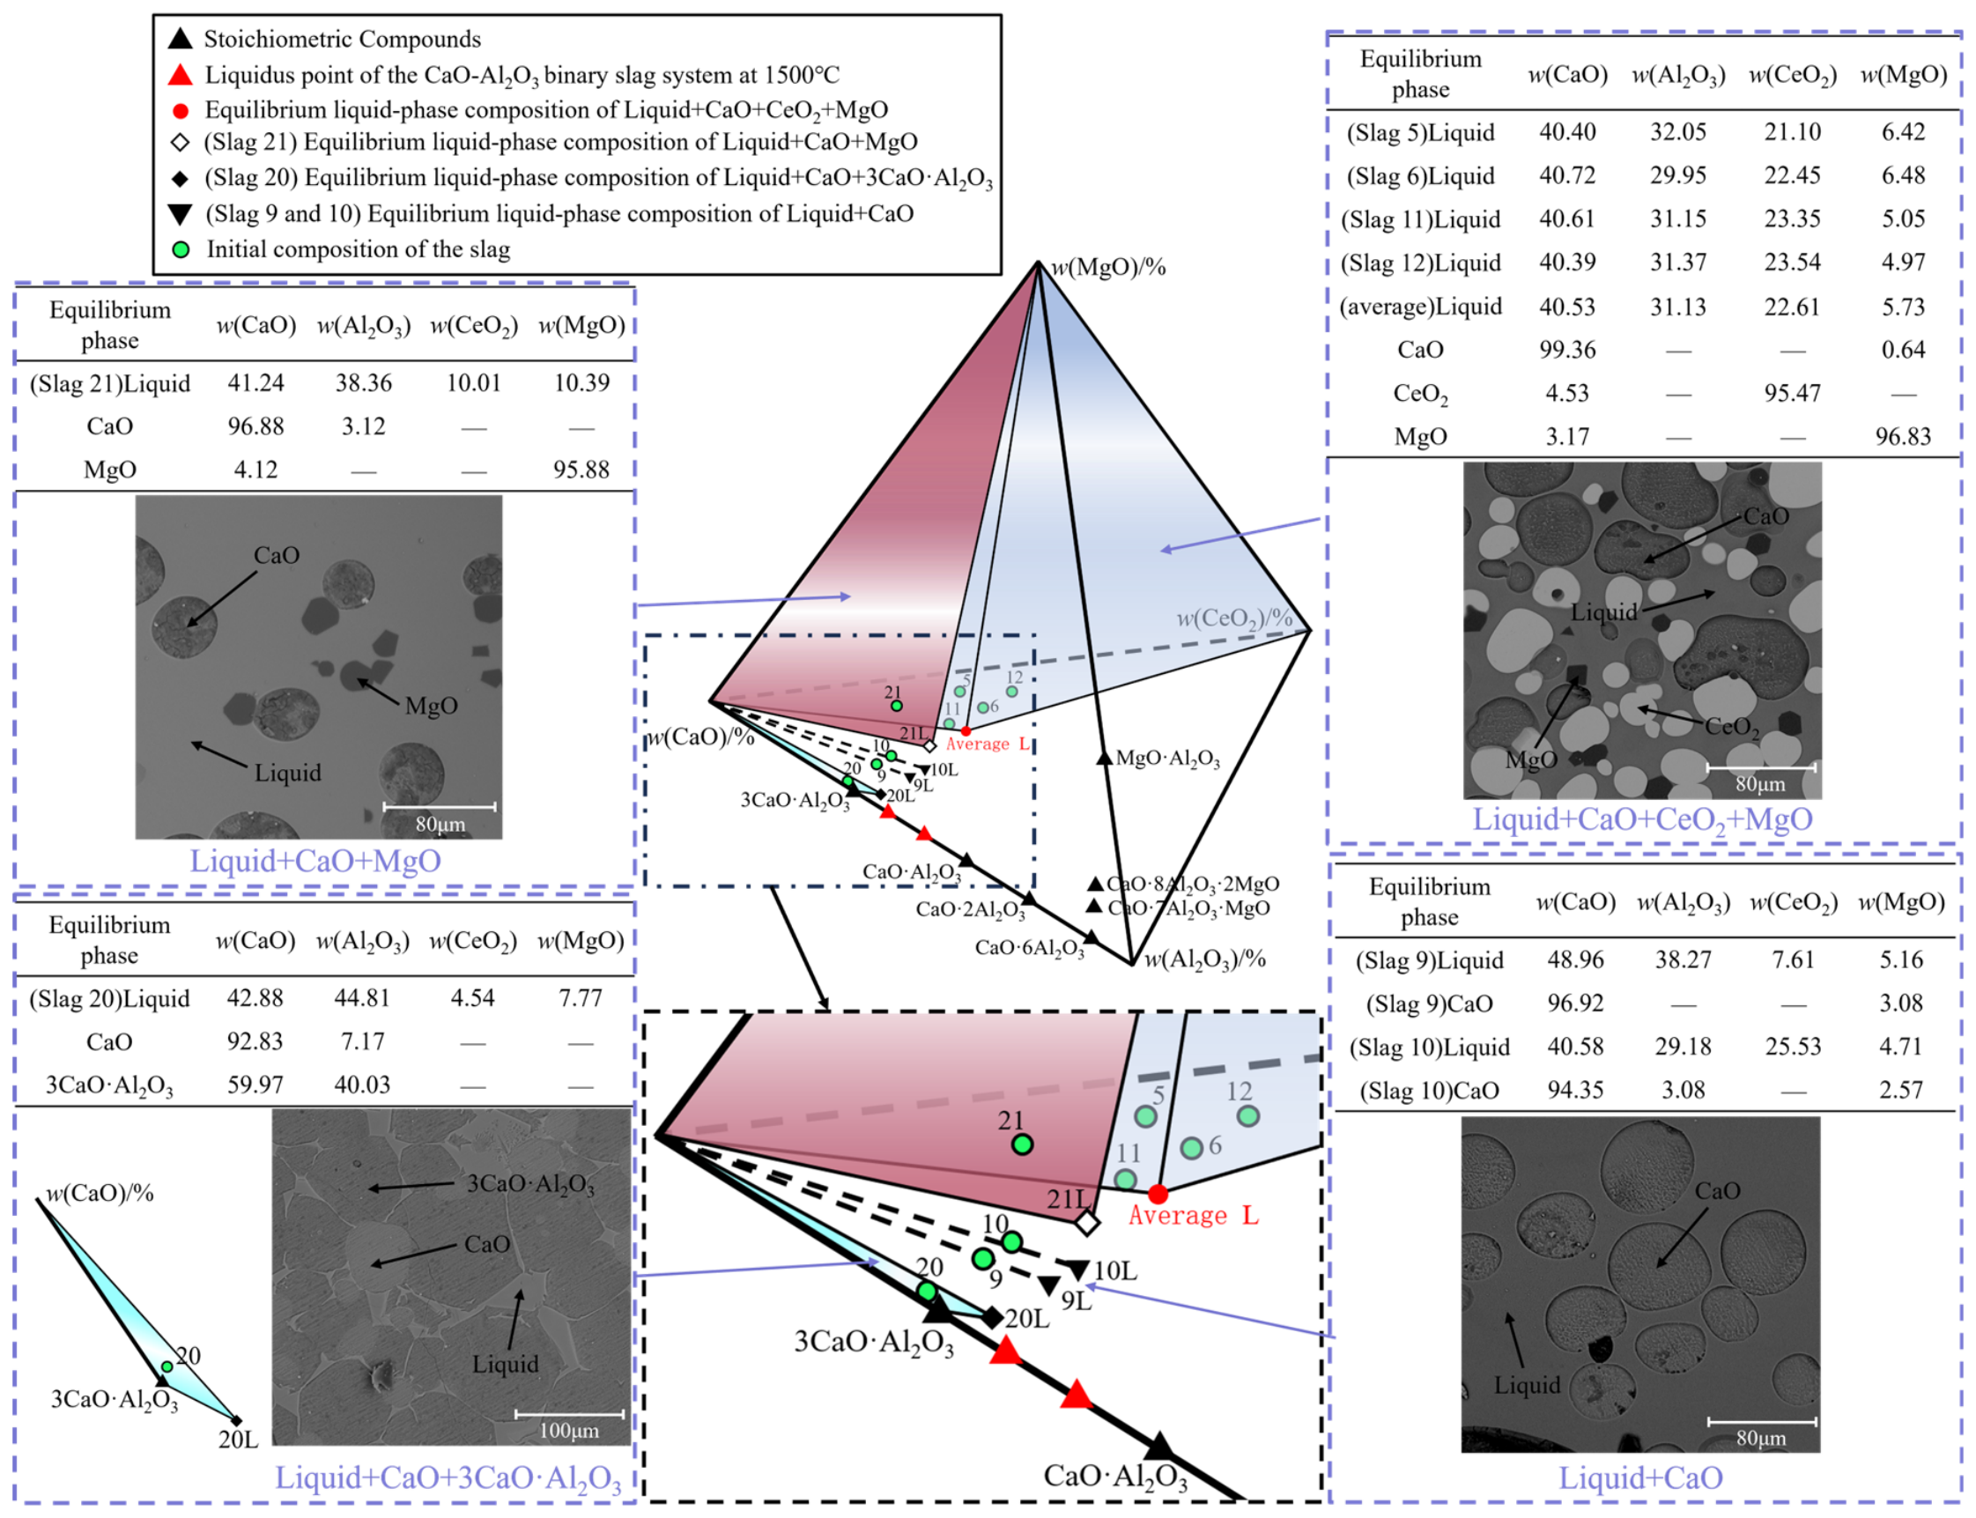
Figure 3 shows the phase equilibrium relationships of the slag samples within the CaO-CeO2-MgO-3CaO·Al2O3 tetrahedral region. The experimental results for a total of eight slag samples equilibrated at 1500 °C were used to construct the isothermal phase diagram shown in Figure 4. Among them, Samples 5, 6, 11, and 12 all exhibited the four-phase equilibrium relationship Liquid + CaO + CeO2 + MgO (Figure 3). According to the Gibbs phase rule [30], the number of degrees of freedom for a four-phase equilibrium in a quaternary system at constant temperature and pressure is zero ((F = C − P = 4 − 4 = 0)). Therefore, the four-phase coexistence region can be defined by connecting the composition points of the equilibrium phases, as indicated by the blue region in Figure 3, while the equilibrium liquid has a unique composition, represented by the red circle in Figure 3. As shown in Figure 3, the initial compositions of Samples 5, 6, 11, and 12 all lie within the Liquid + CaO + CeO2 + MgO four-phase coexistence region. This confirms that the observed phase assemblages satisfy the lever rule and that the samples attained thermodynamic equilibrium.
Figure 3.
Phase-equilibrium relationships in the CaO-CeO2-MgO-3CaO·Al2O3 tetrahedral region [19].
Figure 4.
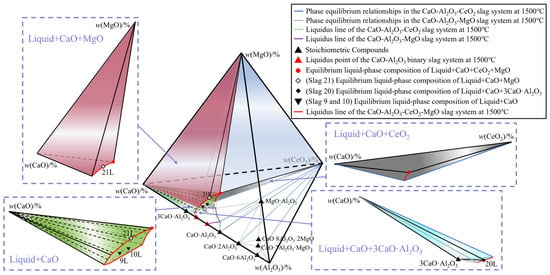
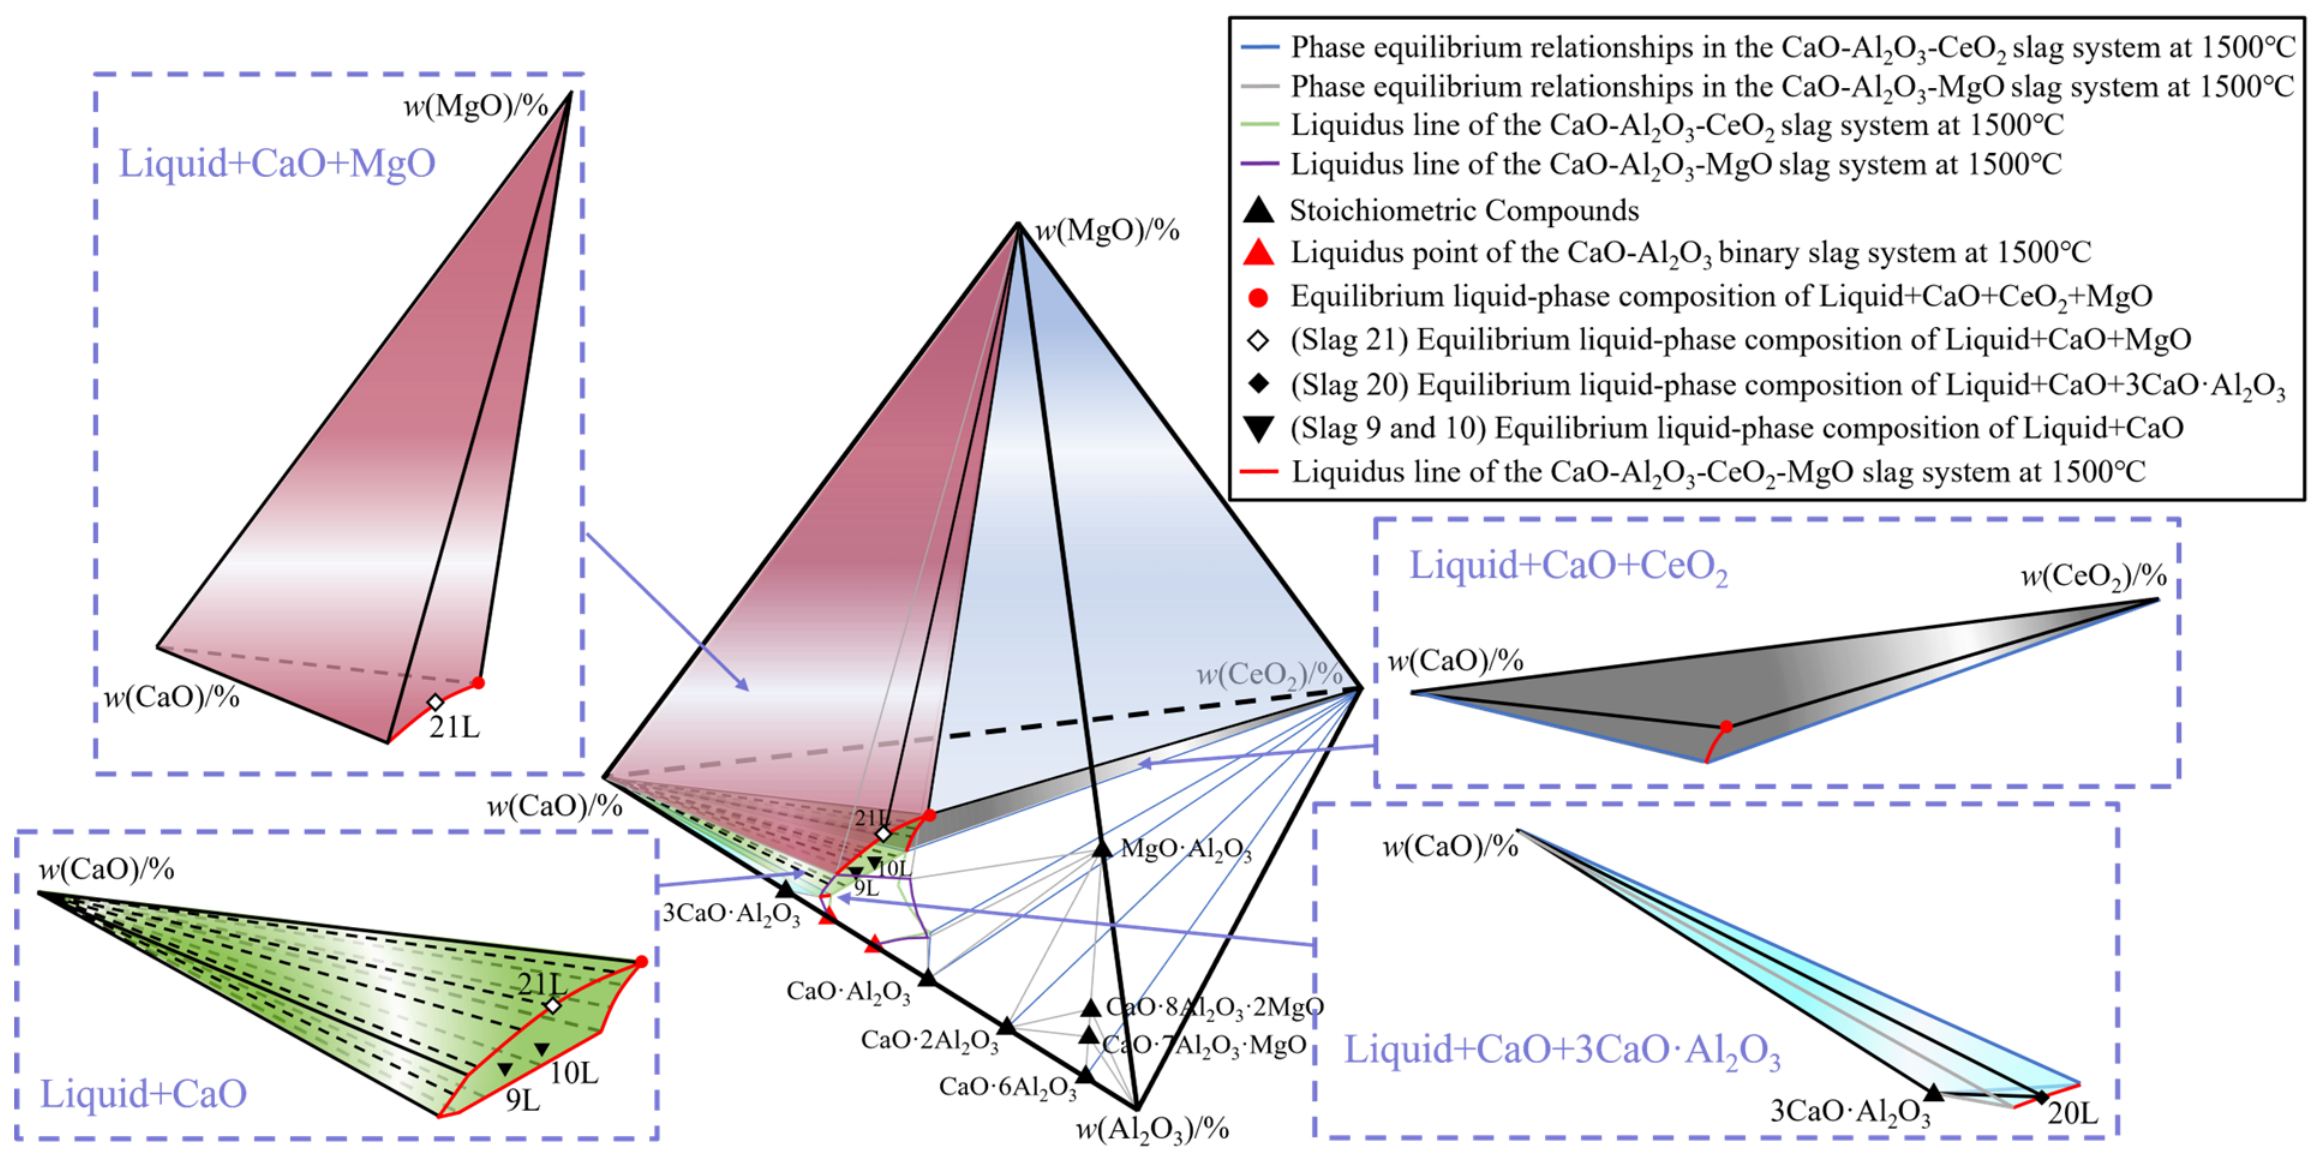
Construction of the isothermal phase diagram for the CaO-CeO2-MgO-3CaO·Al2O3 tetrahedral region [19,22,23].
Sample 21 exhibited the three-phase equilibrium relationship Liquid + CaO + MgO (Figure 3). According to the phase rule, a three-phase equilibrium in a quaternary system has one degree of freedom (F = 4 − 3 = 1). The corresponding three-phase coexistence region can therefore be constructed by connecting the composition points of the equilibrium phases, as indicated by the dark-red region in Figure 3. The initial composition of Sample 21 lies within the three-phase coexistence region defined by liquid, CaO, and MgO, demonstrating that the experimental result satisfies the lever rule and that thermodynamic equilibrium was attained. Similarly, the Liquid + CaO + 3CaO·Al2O3 three-phase coexistence region, shown as the cyan region in Figure 3, was determined from the equilibrium phase relationship of Sample 20. Based on the phase-region adjacency principle [32], the Liquid + CaO + CeO2 three-phase coexistence region was subsequently determined, as shown by the gray region in Figure 4. Samples 9 and 10 both exhibited the two-phase relationships Liquid + CaO (Figure 3). According to the phase rule, a two-phase equilibrium in a quaternary system has two degrees of freedom (F = 4 − 2 = 2). A tie line can therefore be drawn between the composition points of the two equilibrium phases, as represented by the black dotted lines in Figure 3. The initial compositions of Samples 9 and 10 both lie on the corresponding tie lines connecting the liquid phase and CaO phase, further confirming the reliability of the experimental results and the attainment of thermodynamic equilibrium.
In a quaternary system, a complete three-phase coexistence region consists of an infinite number of adjacent tie triangles. The boundary tie triangles may correspond either to neighboring four-phase coexistence regions or to the corresponding three-phase coexistence regions in the isothermal phase diagrams of the constituent ternary subsystems. The equilibrium liquid compositions within such a region geometrically define a curve in composition space. Similarly, a complete two-phase coexistence region consists of an infinite number of tie lines, and the equilibrium liquid compositions geometrically form a surface in composition space. To determine the liquidus curve (red line) of the Liquid + CaO + MgO three-phase coexistence region (dark-red region) in Figure 4, a compositional relationship for the liquidus curve was established by polynomial interpolation using three sets of equilibrium liquid composition data within this phase region, as given in Equation (2). This method adequately reproduces the variation in liquid composition within the range constrained by the available experimental data and provides a continuous representation of the liquidus curve. Since the present study focuses on the liquidus curve under isothermal conditions at 1500 °C and the established relationship is an interpolation based on a limited number of experimental data points, its applicability is restricted to the composition range investigated in this study and it is not intended for extrapolation beyond the experimental data range.
w(MgO) = f(w(CaO),w(Al2O3),w(CeO2))
The data used for the interpolation represent the mass fractions of CaO, Al2O3, CeO2, and MgO, respectively, all expressed in mass percent. The interpolation was performed using the equilibrium liquid composition of Sample 21, (41.24, 38.36, 10.01, 10.40); the equilibrium liquid composition of the Liquid + CaO + CeO2 + MgO four-phase coexistence region, (40.53, 31.13, 22.61, 5.73); and the equilibrium liquid composition associated with the Liquid + CaO + MgO three-phase coexistence region in the CaO-Al2O3-MgO ternary subsystem at 1500 °C, (51.57, 42.66, 0.00, 5.77) [23]. The resulting interpolation equation is given in Equation (3). The interpolation equation provides a good reproduction of the equilibrium liquid composition data used to construct the liquidus curve, with a root-mean-square deviation of 0.015 wt.% for w(MgO) and a maximum absolute deviation of less than 0.023 wt.%. Within the investigated composition range, the liquidus curve of the Liquid + CaO + MgO three-phase coexistence region in the CaO-Al2O3-CeO2-MgO slag system at 1500 °C in air can therefore be constructed based on this equation, as shown in Figure 4.
Similarly, the corresponding liquid-phase region information was determined using the same method. Table 2 summarizes the interpolation equations used to calculate the liquid-phase boundaries from the equilibrium liquid compositions associated with the respective phase-coexistence regions.
Table 2.
Liquidus Line/Surface Equations for the CaO-CeO2-MgO-3CaO·Al2O3 Region.
3.2. Construction of the Isothermal Phase Diagram for the CaO·Al2O3-CeO2-MgO-Al2O3 Region
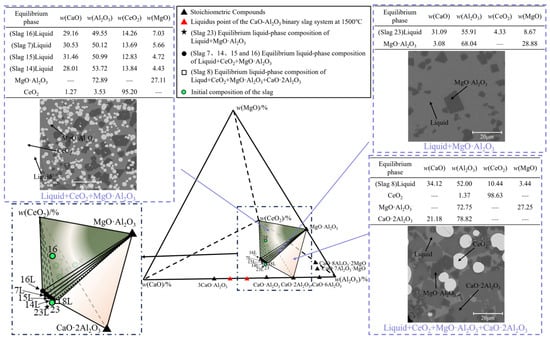
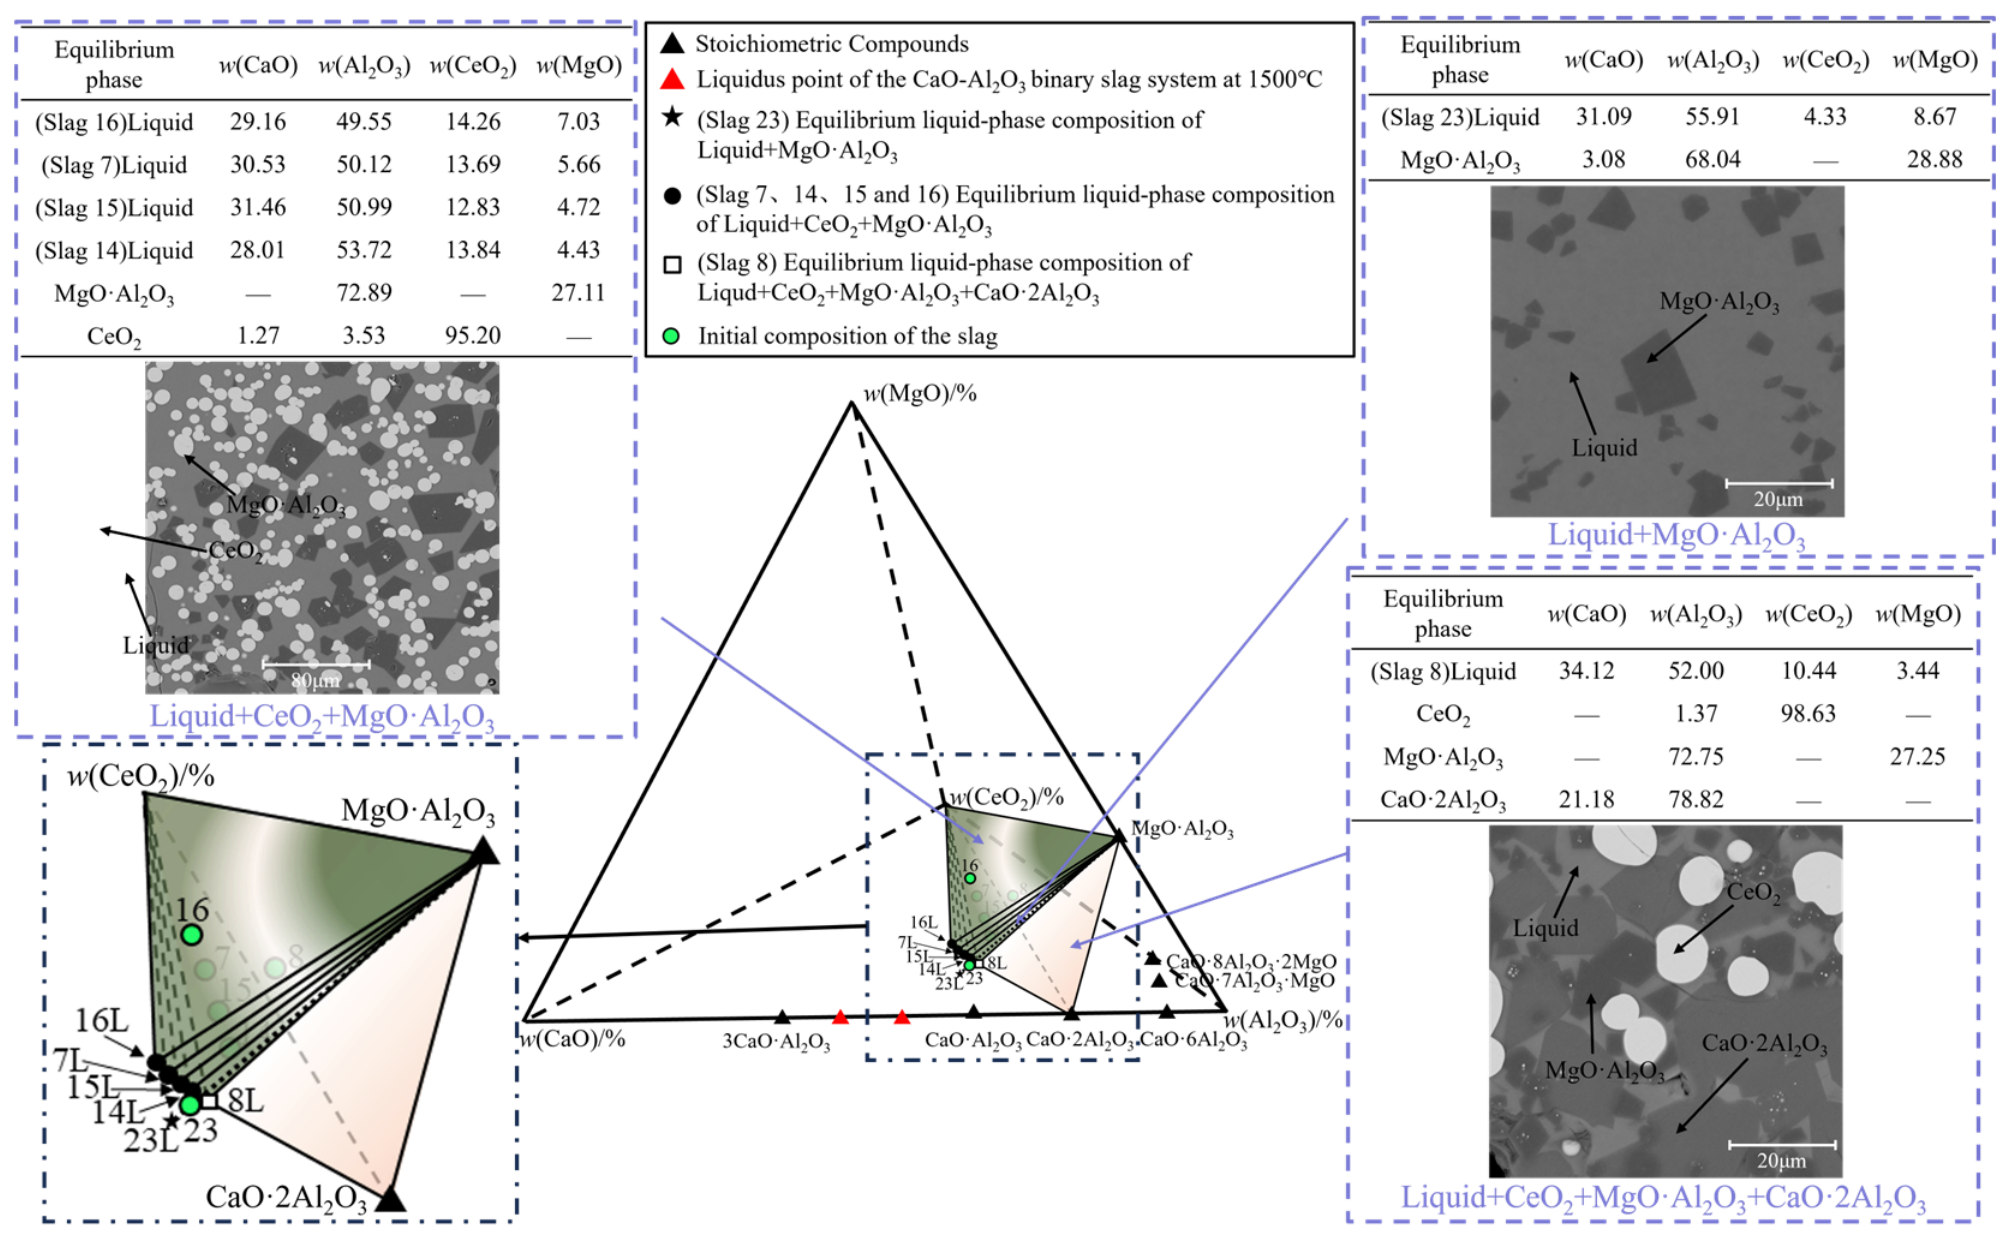
Figure 5 shows the phase equilibrium relationships of the slag samples within the CaO·Al2O3-CeO2-MgO-Al2O3 tetrahedral region. The experimental results for a total of six slag samples equilibrated at 1500 °C were used to construct the isothermal phase diagram shown in Figure 6. Sample 8 exhibited the four-phase equilibrium relationship Liquid + CeO2 + MgO·Al2O3 + CaO·2Al2O3 (Figure 5). According to the Gibbs phase rule, the four-phase coexistence region of Liquid + CeO2 + MgO·Al2O3 + CaO·2Al2O3, shown in light orange, was determined by connecting the composition points of the equilibrium phases. The compositions of the coexisting phases were verified to satisfy the lever rule, confirming the reliability of the experimental result and the attainment of thermodynamic equilibrium.
Figure 5.
Phase-equilibrium relationships in the CaO·Al2O3-CeO2-MgO-Al2O3 tetrahedral region [19].
Figure 6.
Construction of the isothermal phase diagram for the CaO·Al2O3-CeO2-MgO-Al2O3 tetrahedral [19,22,23].
Samples 7, 14, 15, and 16 all exhibited the three-phase equilibrium relationships Liquid + CeO2 + MgO·Al2O3 (Figure 5). The corresponding three-phase coexistence region was constructed by connecting the composition points of the equilibrium phases, as indicated by the dark-green region in Figure 5. The initial compositions of these samples were confirmed to lie on the Liquid + CeO2 + MgO·Al2O3 three-phase coexistence surface, indicating that the observed phase-equilibrium relationships satisfy the lever rule and that thermodynamic equilibrium was attained. In addition, the Liquid + MgO·Al2O3 two-phase equilibrium region, represented by the black dotted lines in Figure 5, was determined from the equilibrium phase assemblage of Sample 23.
Similarly, the corresponding liquid-phase boundary information was calculated using the same method. Table 3 summarizes the interpolation equations used to determine the liquid-phase boundaries from the equilibrium liquid compositions associated with the respective phase-coexistence regions.
Table 3.
Liquidus Line/Surface Equations for the CaO·Al2O3-CeO2-MgO-Al2O3 Region.
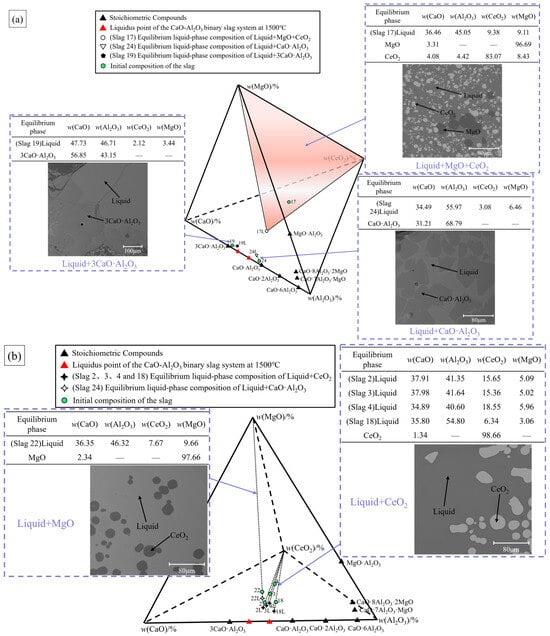
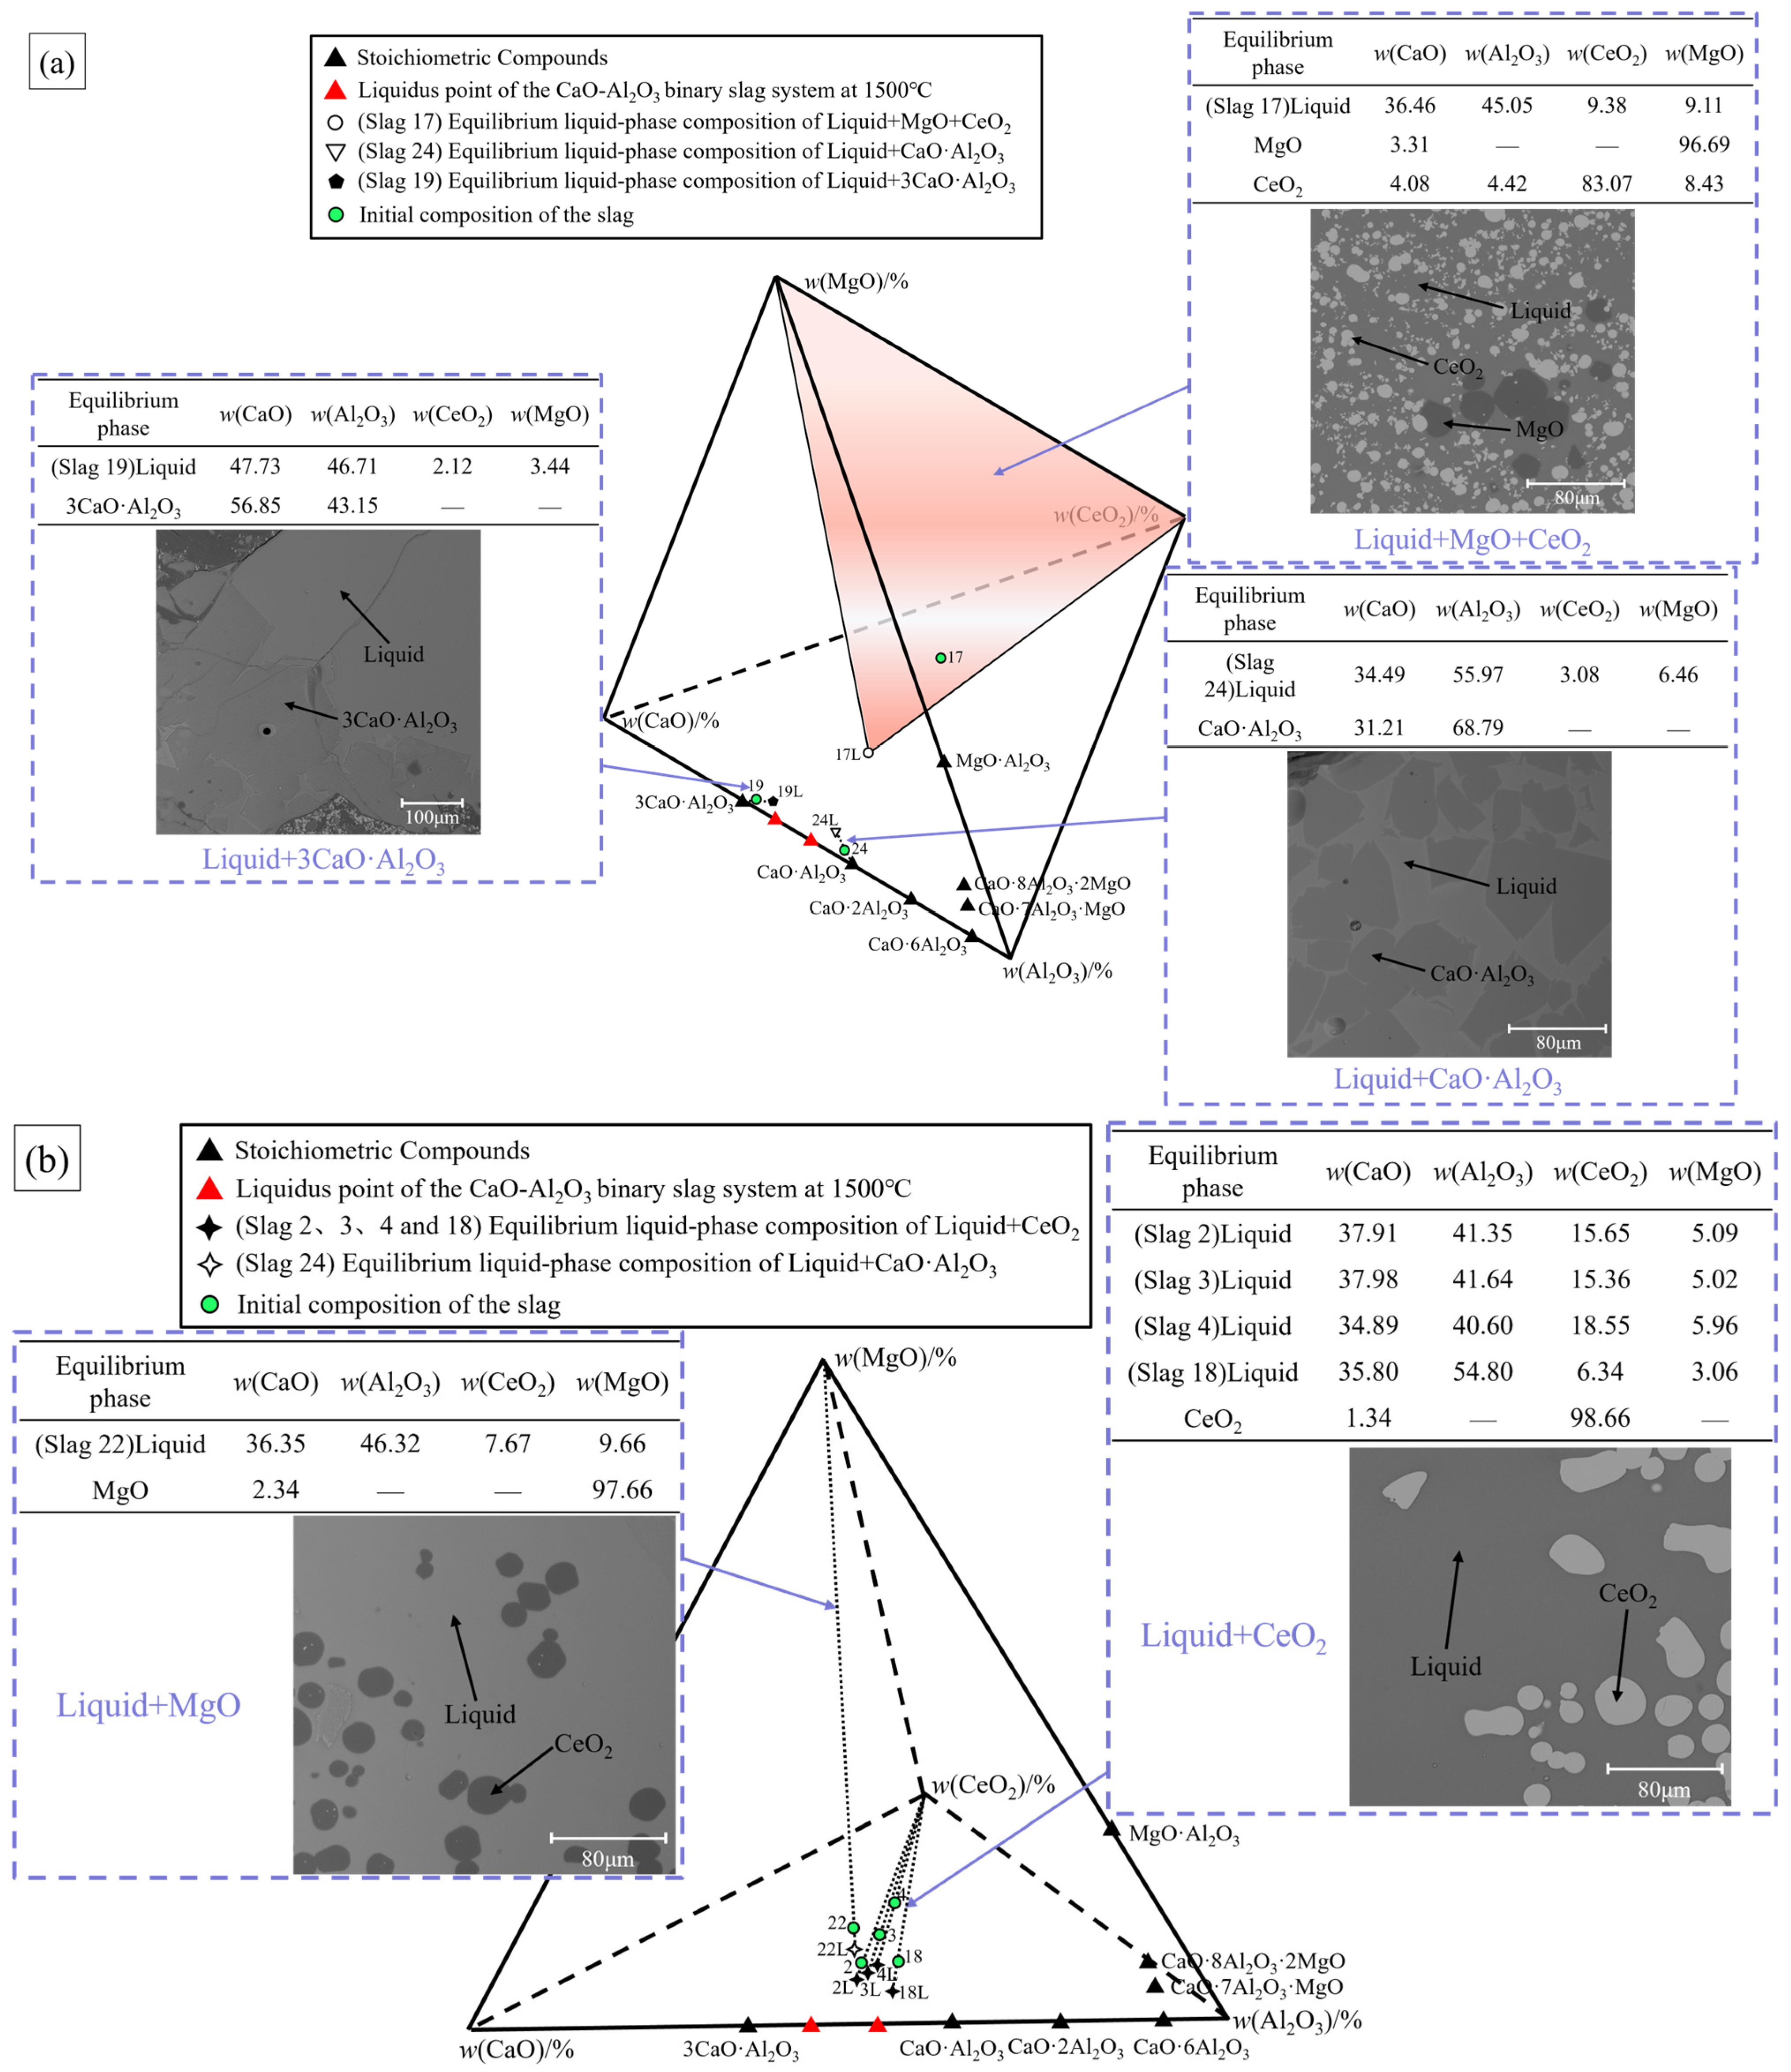
3.3. Construction of the Isothermal Phase Diagram for the 3CaO·Al2O3-CeO2-MgO-CaO·Al2O3 Region
Figure 7 shows the phase equilibrium relationships of the slag samples within the 3CaO·Al2O3-CeO2-MgO-CaO·Al2O3 tetrahedral region. The experimental results for a total of eight slag samples equilibrated at 1500 °C were used to construct the isothermal phase diagram shown in Figure 8. Sample 17 exhibited the three-phase equilibrium relationship Liquid + MgO + CeO2, as shown in Figure 7a. The corresponding three-phase coexistence region was constructed by connecting the composition points of the equilibrium phases and is represented by the bright-orange region in Figure 7a. The phase-equilibrium result was verified to satisfy the lever rule, confirming the reliability of the experimental result and the attainment of thermodynamic equilibrium.
Figure 7.
Phase-equilibrium relationships in the 3CaO·Al2O3-CeO2-MgO-CaO·Al2O3 tetrahedral region [19]. (a) View 1; (b) view 2.
Figure 8.
Construction of the isothermal phase diagram for the 3CaO·Al2O3-CeO2-MgO-CaO·Al2O3 [19,22,23].
Sample 19 exhibited the two-phase equilibrium relationship Liquid + 3CaO·Al2O3, as shown in Figure 7a. The corresponding two-phase coexistence region was determined by connecting the composition points of the two equilibrium phases and is indicated by the black dotted line on the left side of Figure 7a. The phase-equilibrium result was confirmed to satisfy the lever rule. Similarly, the Liquid + CaO·Al2O3 two-phase coexistence region was determined from the equilibrium phase relationship of Sample 24 and is represented by the black dotted line on the right side of Figure 7a. The Liquid + MgO two-phase coexistence region was determined from the equilibrium phase relationship of Sample 22 and is indicated by the black dotted line in the upper part of Figure 7b. Based on the Liquid + CeO2 two-phase equilibrium relationships observed for Samples 2, 3, 4, and 18, the corresponding two-phase coexistence region was determined, as represented by the black dotted lines in the lower part of Figure 7b.
Similarly, the corresponding liquid-phase boundary information was calculated using the same method. Table 4 summarizes the interpolation equations used to determine the liquid-phase boundaries from the equilibrium liquid compositions associated with the respective phase-coexistence regions.
Table 4.
Liquidus Line/Surface Equations for the 3CaO·Al2O3-CeO2-MgO-CaO·Al2O3 Region.
3.4. Isothermal Phase Diagram of the CaO-Al2O3-CeO2-MgO Slag System
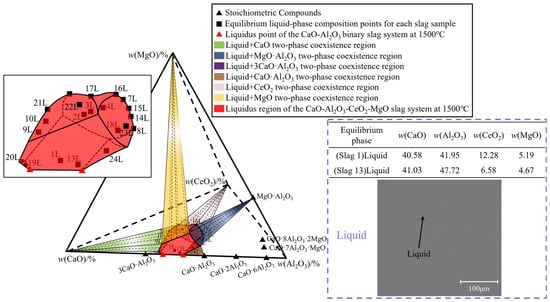
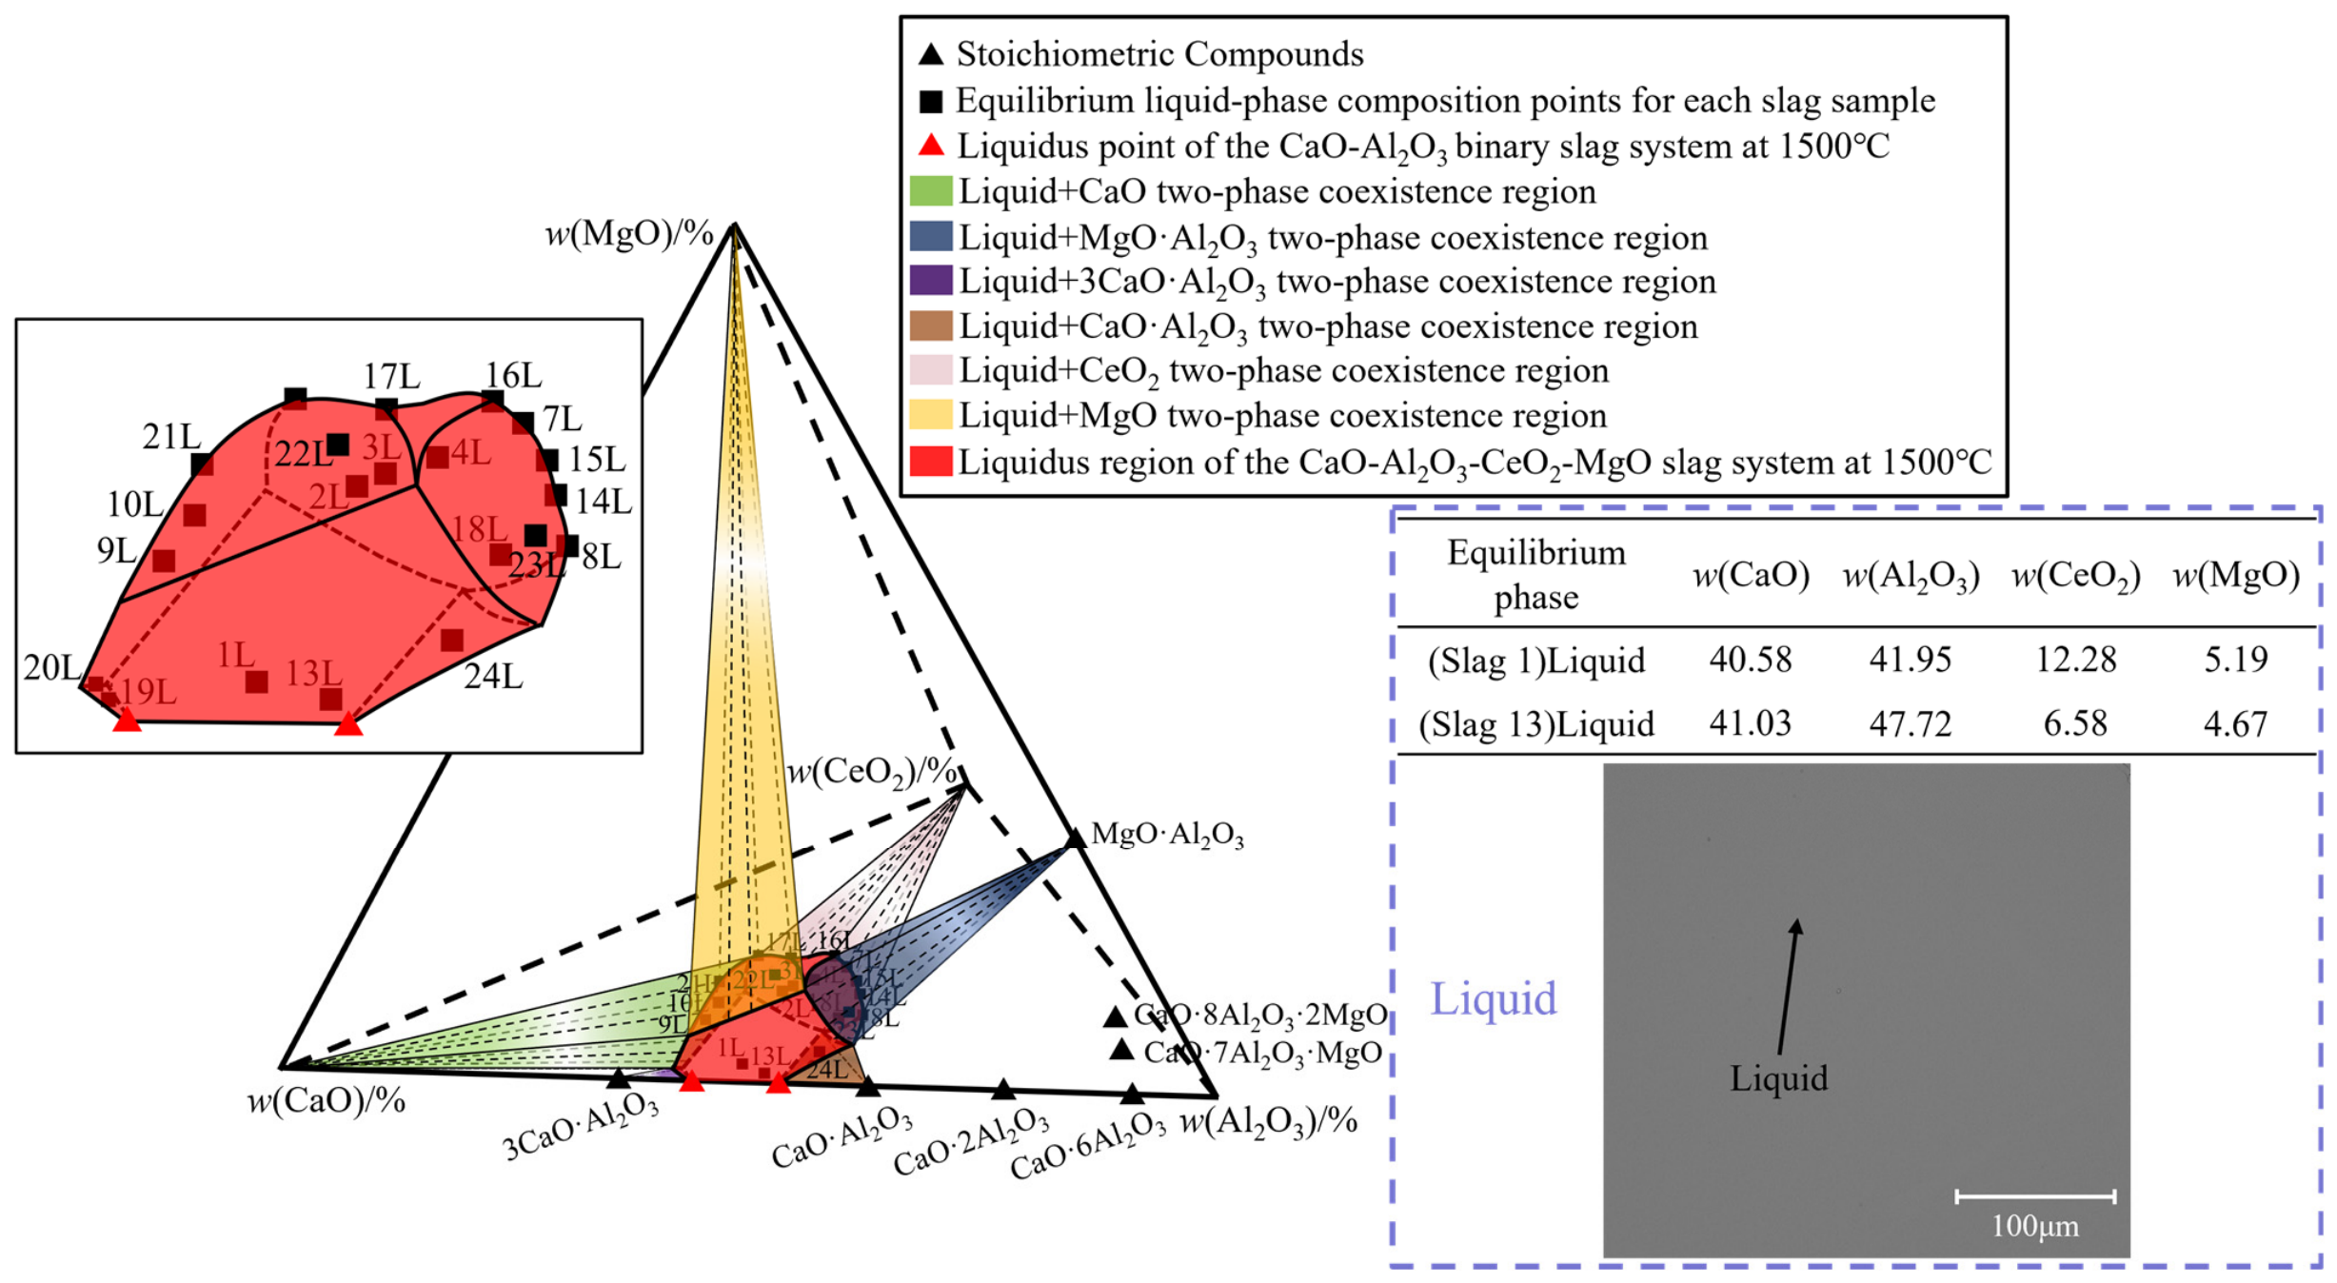
The red region in the center of Figure 9 shows the liquid-phase region of the CaO-Al2O3-CeO2-MgO slag system at 1500 °C in an air atmosphere; this region was determined based on the equilibrium liquid-phase compositions associated with the regions of coexistence of the various phases. The composition range of this liquid-phase region is w(CaO)/w(Al2O3) = 0.52~1.39, w(CeO2) = 0~25.75%, w(MgO) = 0~10.00%. Samples 1 and 13, which were identified as single-liquid-phase samples in the high-temperature equilibrium experiments, both lie within this liquid-phase region. This agreement supports the accuracy and validity of the liquid-phase region determined under the present experimental conditions.
Figure 9.
Liquid-phase region of the CaO-Al2O3-CeO2-MgO slag system at 1500 °C. [19,22,23].
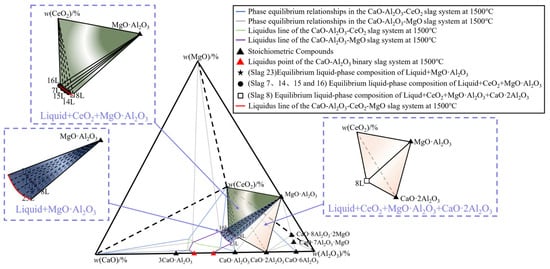
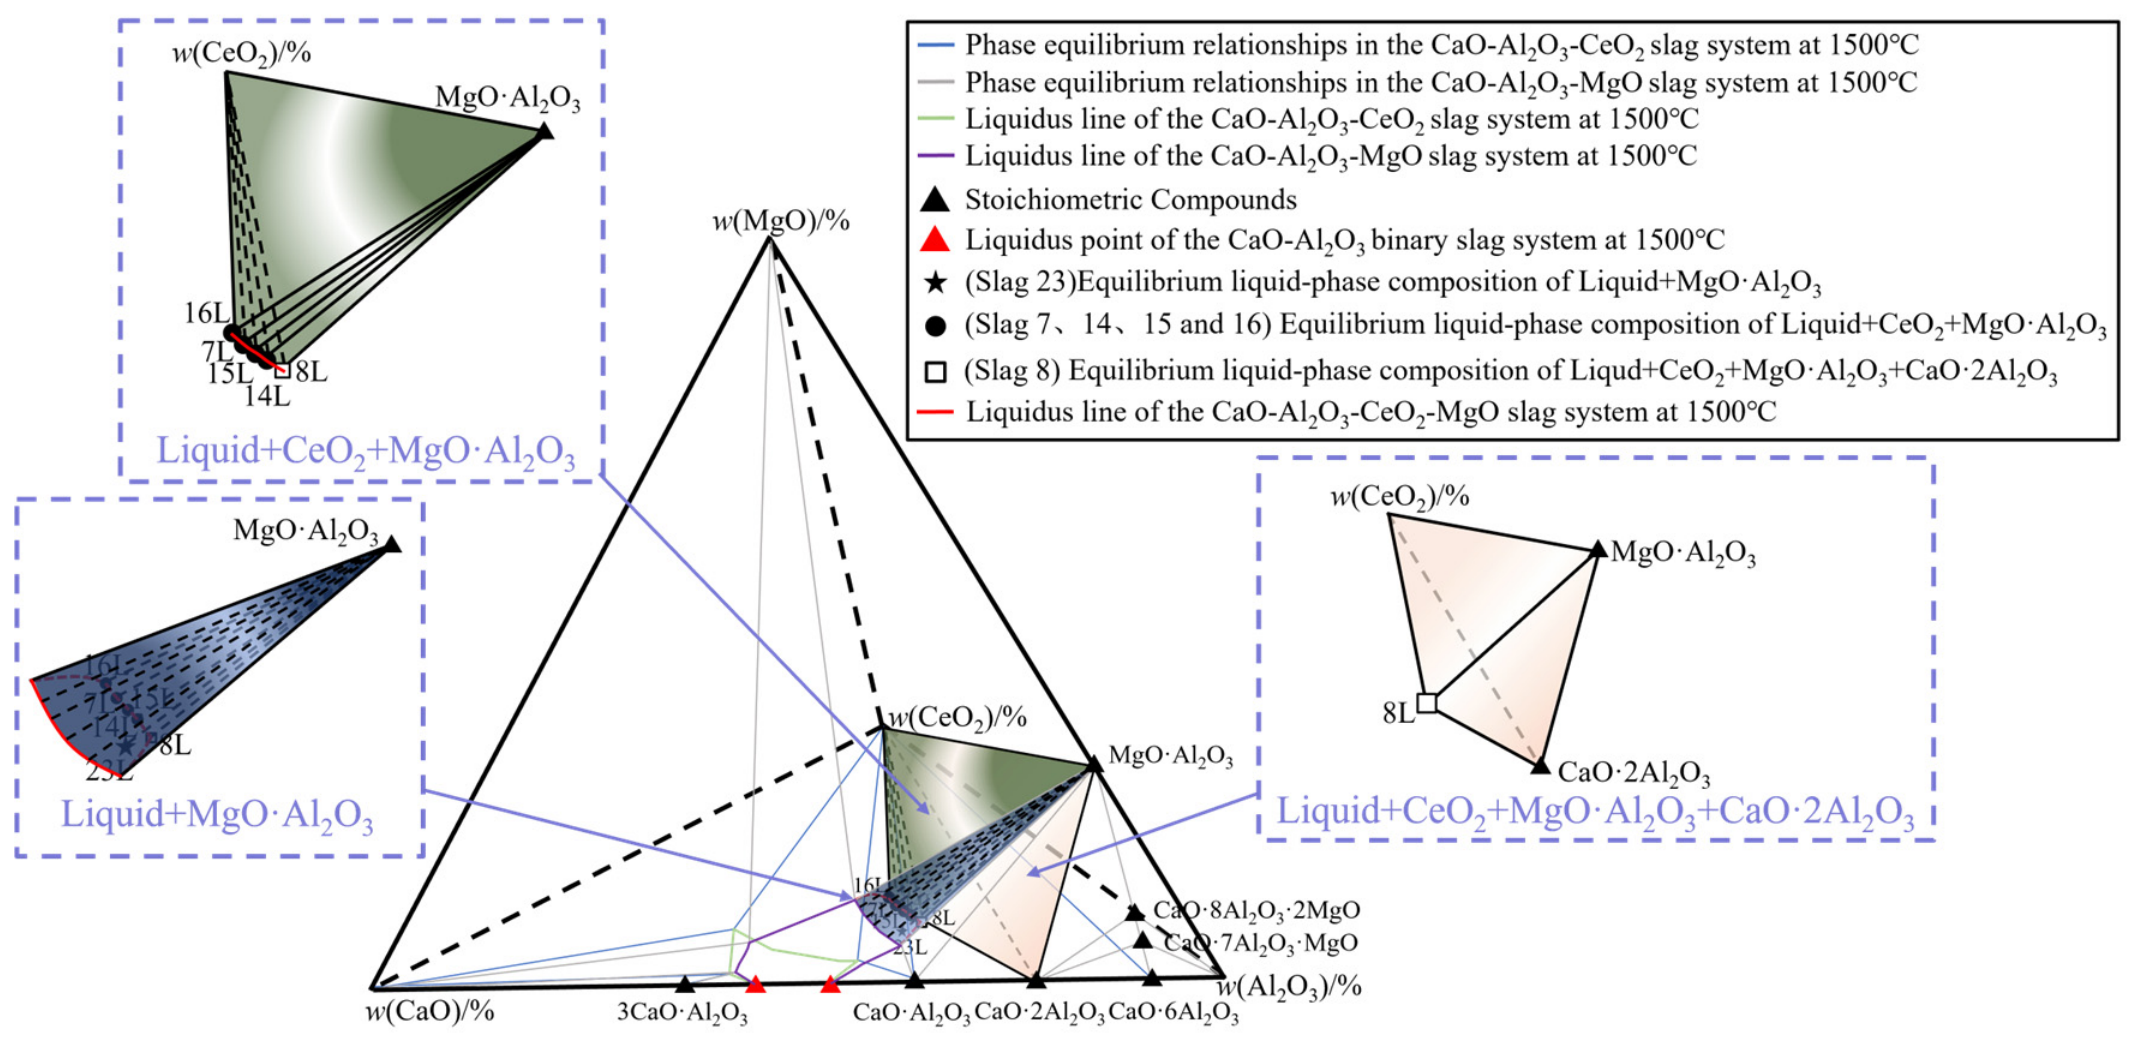
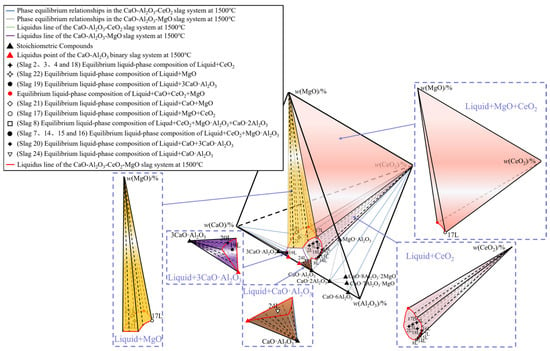
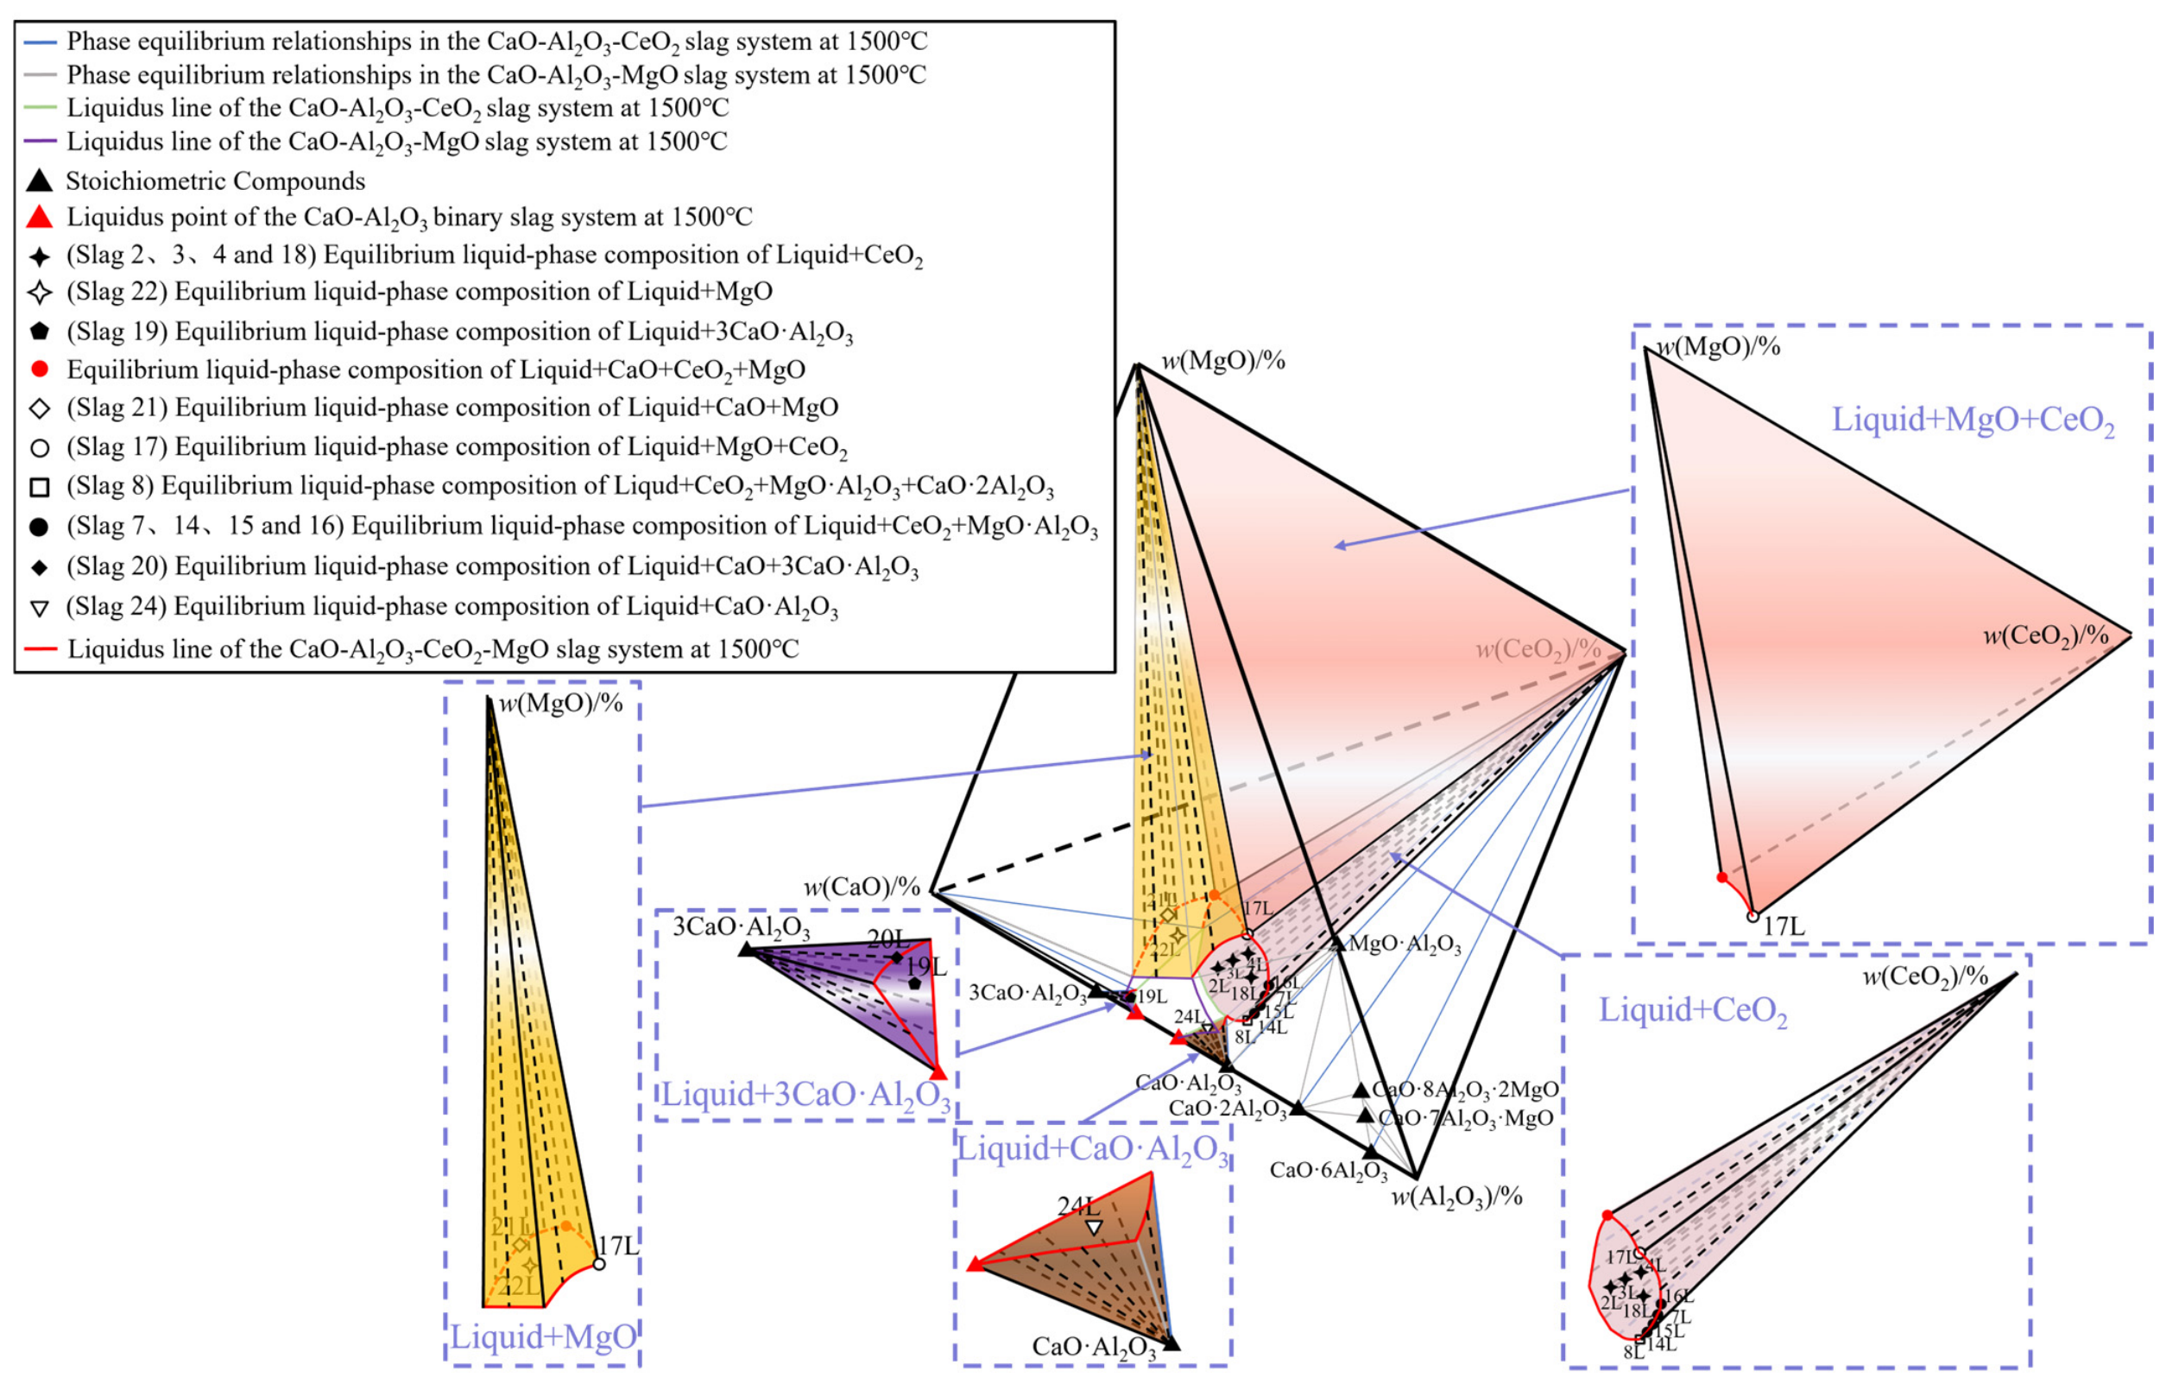
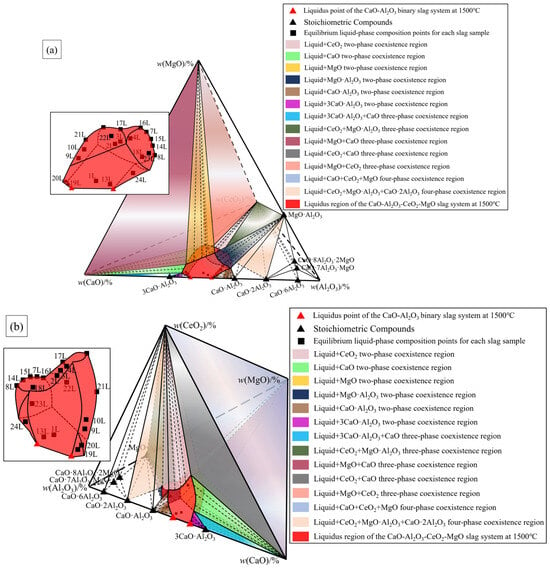
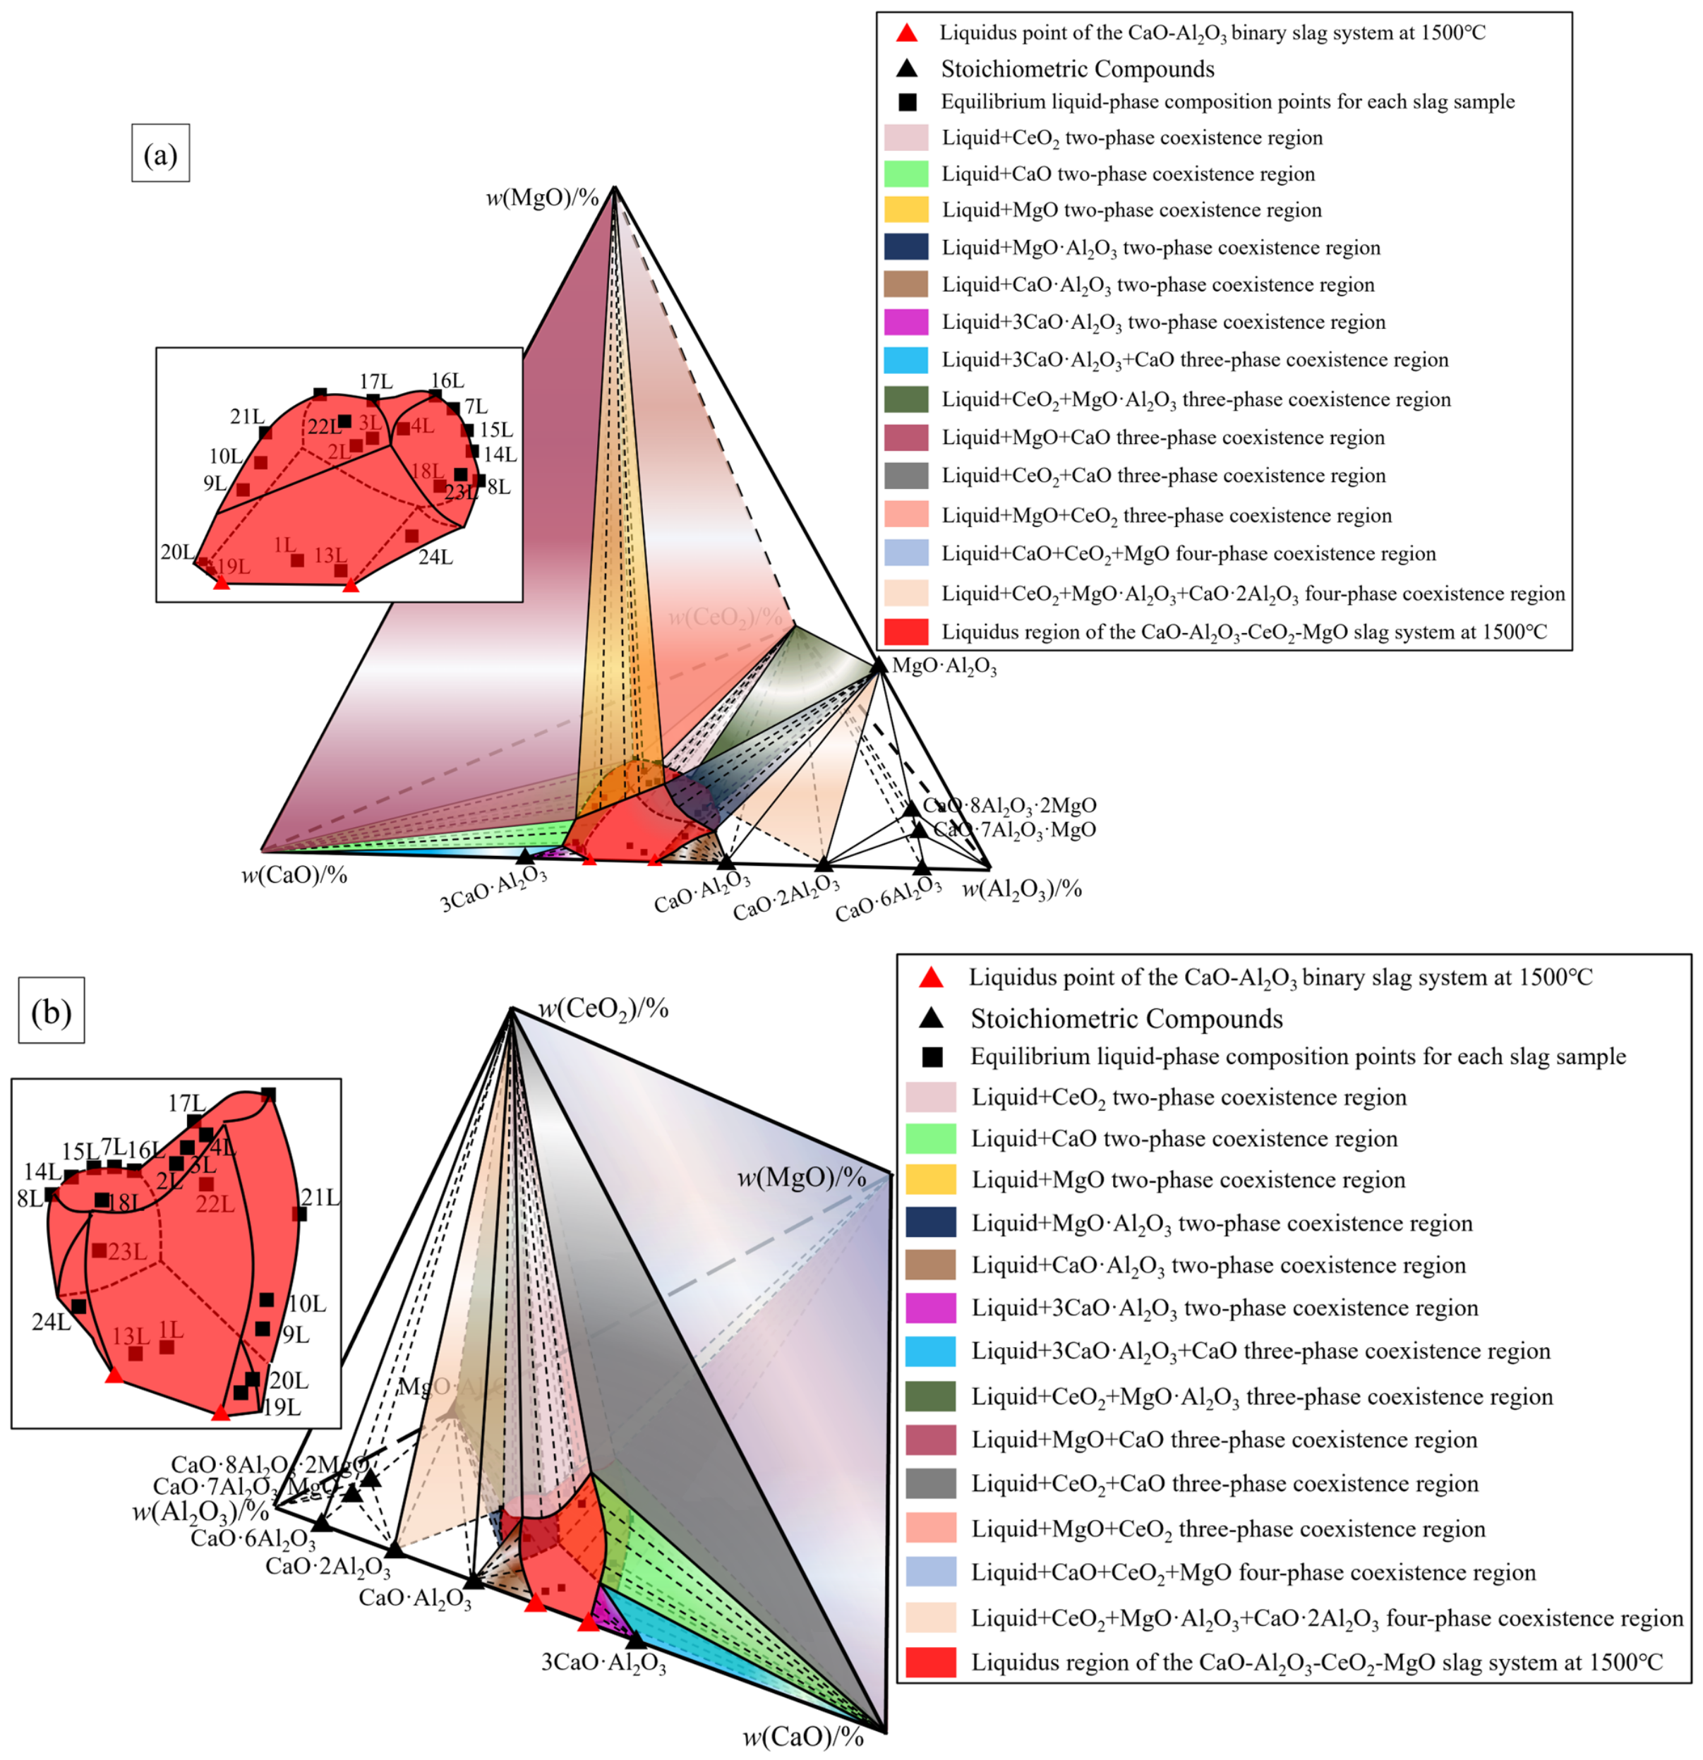
Figure 10 presents the isothermal phase diagram of the CaO-Al2O3-CeO2-MgO slag system at 1500 °C in an air atmosphere, constructed under the present experimental conditions. As shown in the figure, CeO2 is the predominant Ce-bearing equilibrium phase at 1500 °C in an air atmosphere, indicating that Ce enrichment in this slag system occurs mainly through the precipitation of CeO2. The phase diagram also contains a Liquid + CeO2 two-phase coexistence region, together with several three and four-phase coexistence regions involving CeO2. These phase regions may therefore serve as target composition domains for controlling the enrichment and recovery of Ce from rare-earth-bearing slags.
Figure 10.
Isothermal phase diagram of the CaO-Al2O3-CeO2-MgO slag system at 1500 °C [19,22,23] (a) Viewed from the CaO-Al2O3-MgO side; (b) viewed from the CaO-Al2O3-CeO2 side.
3.5. Future Work
However, this study has not yet directly verified the actual separation and recovery efficiency of cerium. Therefore, in the future, we will combine the isothermal phase diagram developed in this study with slag compositions that show potential for cerium enrichment to conduct further separation and recovery experiments, with the aim of evaluating the feasibility and practical effectiveness of selective cerium enrichment and recovery. Furthermore, due to the limited range of experimental compositions and the small number of experimental data points in this study, there remain some composition regions in this quaternary system at 1500 °C that have not been fully investigated. In the future, by increasing the number of experimental composition points, we will conduct more precise experimental measurements of the phase regions and phase boundaries that have not yet been fully determined. At the same time, phase equilibrium experiments at different temperatures will be conducted to construct corresponding isothermal phase diagrams and systematically investigate the effects of temperature changes on the composition of equilibrium phases, the distribution of phase regions, and phase equilibrium relationships. This will provide a more comprehensive experimental basis for refining the thermodynamic database of the CaO-Al2O3-CeO2-MgO quaternary system and for the development and application of rare-earth-containing slag systems.
4. Conclusions
In the present study, the phase-equilibrium relationships of the CaO-Al2O3-CeO2-MgO slag system at 1500 °C in an air atmosphere were systematically investigated through high-temperature equilibrium experiments combined with scanning electron microscopy-energy dispersive spectroscopy (SEM-EDS), and the corresponding isothermal phase diagram was constructed. Within the investigated composition range, a total of 14 distinct phase regions were identified, including two four-phase regions, five three-phase regions, six two-phase regions, and one single-liquid-phase region. The approximate composition range of the liquid-phase region was w(CaO)/w(Al2O3) = 0.52~1.39, w(CeO2) = 0~25.75%, w(MgO) = 0~10.00%.
Author Contributions
Conceptualization, L.S.; methodology, L.S.; validation, H.Z., D.S. and B.Y.; formal analysis, C.L.; resources, D.S. and B.Y.; data curation, M.J.; writing—original draft preparation, H.Z.; writing—review and editing, H.Z. and L.S.; supervision, L.S., C.L. and M.J.; project administration, C.L. and M.J.; funding acquisition, C.L. and M.J. All authors have read and agreed to the published version of the manuscript.
Funding
This work was supported by the National Natural Science Foundation of China (52374412).
Data Availability Statement
The original contributions presented in this study are included in the article material. Further inquiries can be directed to the corresponding author.
Conflicts of Interest
The authors declare no conflicts of interest.
References
- Zhang, J.; Li, G.; Wang, H.; Wan, X.; Hu, M.; Cao, Y. Achieving superior cryogenic impact toughness and sufficient tensile properties in a novel high-Mn austenitic steel weld metal via cerium addition. J. Mater. Res. Technol. 2023, 23, 5016–5030. [Google Scholar] [CrossRef] [Scilit]
- Meng, Z.; Li, G.; Zhao, Y.; Zheng, Q.; Zeng, B.; Liu, Y. Industrial experimental on inclusion characteristics and corrosion resistance of La-Ce treated 75Cr1 steel. Iron Steel 2023, 58, 110–117. [Google Scholar] [CrossRef]
- Imashuku, S.; Wagatsuma, K. Cathodoluminescence analysis of nonmetallic inclusions in steel deoxidized and desulfurized by rare-earth metals (La, Ce, Nd). Metall. Mater. Trans. B 2020, 51, 79–84. [Google Scholar] [CrossRef] [Scilit]
- Balaram, V. Rare earth elements: A review of applications, occurrence, exploration, analysis, recycling, and environmental impact. Geosci. Front. 2019, 10, 1285–1303. [Google Scholar] [CrossRef] [Scilit]
- Goodenough, K.M.; Wall, F.; Merriman, D. The rare earth elements: Demand, global resources, and challenges for resourcing future generations. Nat. Resour. Res. 2018, 27, 201–216. [Google Scholar] [CrossRef] [Scilit]
- Wang, P.; Yang, Y.-Y.; Heidrich, O.; Chen, L.-Y.; Chen, L.-H.; Fishman, T.; Chen, W.-Q. Regional rare-earth element supply and demand balanced with circular economy strategies. Nat. Geosci. 2024, 17, 94–102. [Google Scholar] [CrossRef] [Scilit]
- Lee, J.C.K.; Wen, Z. Pathways for greening the supply of rare earth elements in China. Nat. Sustain. 2018, 1, 598–605. [Google Scholar] [CrossRef] [Scilit]
- Chen, P.; Ilton, E.S.; Wang, Z.; Rosso, K.M.; Zhang, X. Global rare earth element resources: A concise review. Appl. Geochem. 2024, 175, 106158. [Google Scholar] [CrossRef] [Scilit]
- Dushyantha, N.; Batapola, N.; Ilankoon, I.M.S.K.; Rohitha, S.; Premasiri, R.; Abeysinghe, B.; Ratnayake, N.; Dissanayake, K. The story of rare earth elements (REEs): Occurrences, global distribution, genesis, geology, mineralogy and global production. Ore Geol. Rev. 2020, 122, 103521. [Google Scholar] [CrossRef] [Scilit]
- Fan, H.-R.; Yang, K.-F.; Hu, F.-F.; Liu, S.; Wang, K.-Y. The giant Bayan Obo REE-Nb-Fe deposit, China: Controversy and ore genesis. Geosci. Front. 2016, 7, 335–344. [Google Scholar] [CrossRef] [Scilit]
- Faris, N.; Ram, R.; Tardio, J.; Bhargava, S.; McMaster, S.; Pownceby, M.I. Application of ferrous pyrometallurgy to the beneficiation of rare earth bearing iron ores-A review. Miner. Eng. 2017, 110, 20–30. [Google Scholar] [CrossRef] [Scilit]
- Whitworth, A.J.; Vaughan, J.; Southam, G.; van der Ent, A.; Nkrumah, P.N.; Ma, X.; Parbhakar-Fox, A. Review on metal extraction technologies suitable for critical metal recovery from mining and processing wastes. Miner. Eng. 2022, 182, 107537. [Google Scholar] [CrossRef] [Scilit]
- Ambaye, T.G.; Vaccari, M.; Castro, F.D.; Prasad, S.; Rtimi, S. Emerging technologies for the recovery of rare earth elements (REEs) from end-of-life electronic wastes: A review on progress, challenges, and perspectives. Environ. Sci. Pollut. Res. 2020, 27, 36052–36074. [Google Scholar] [CrossRef] [Scilit] [PubMed]
- Jyothi, R.K.; Thenepalli, T.; Ahn, J.W.; Parhi, P.K.; Chung, K.W.; Lee, J.-Y. Review of rare earth elements recovery from secondary resources for clean energy technologies: Grand opportunities to create wealth from waste. J. Clean. Prod. 2020, 267, 122048. [Google Scholar] [CrossRef] [Scilit]
- Danouche, M.; Bounaga, A.; Oulkhir, A.; Boulif, R.; Zeroual, Y.; Benhida, R.; Lyamlouli, K. Advances in bio/chemical approaches for sustainable recycling and recovery of rare earth elements from secondary resources. Sci. Total Environ. 2024, 912, 168811. [Google Scholar] [CrossRef] [Scilit] [PubMed]
- Gaustad, G.; Williams, E.; Leader, A. Rare earth metals from secondary sources: Review of potential supply from waste and byproducts. Resour. Conserv. Recycl. 2021, 167, 105213. [Google Scholar] [CrossRef] [Scilit]
- Shi, J.; Zhai, Y.; Qiu, Y.; Jiang, C.; Hou, C.; Dong, J.; Li, J. Phase equilibria of the CaO-SiO2-CeO2-Al2O3-MgO system at 1300 °C and 1400 °C. JOM 2024, 76, 4598–4607. [Google Scholar] [CrossRef] [Scilit]
- Jia, X.; Zhang, B.; Jia, Z.; Liu, C.; Jiang, M. Recovery of niobium, titanium and rare earths from Bayan Obo tailings via silicothermic reduction and targeted crystallization. Miner. Eng. 2025, 234, 109718. [Google Scholar] [CrossRef] [Scilit]
- Eriksson, G.; Pelton, A.D. Critical evaluation and optimization of the thermodynamic properties and phase diagrams of the CaO-Al2O3, Al2O3-SiO2, and CaO-Al2O3-SiO2 systems. Metall. Trans. B 1993, 24, 807–816. [Google Scholar] [CrossRef] [Scilit]
- Tan, J.; Shi, C.; Liu, Y.; Deng, T.; Wu, Q.; Du, Y. Thermodynamic descriptions of the CaO-Al2O3 and CaO-Al2O3-SiO2 systems over the whole composition and temperature ranges. J. Am. Ceram. Soc. 2024, 107, 6388–6409. [Google Scholar] [CrossRef] [Scilit]
- Mizuno, M.; Berjoan, R.; Coutures, J.P.; Foex, M. Phase diagram of the system Al2O3-CeO2 at liquidus temperature. J. Ceram. Assoc. Jpn. 1975, 83, 90–96. [Google Scholar] [CrossRef] [PubMed]
- Huo, G.; Qiu, J.; Liu, C. Experimental study on phase equilibria of the CaO-Al2O3-CeO2 system at 1673-1873 K. J. Mater. Res. Technol. 2025, 37, 4027–4039. [Google Scholar] [CrossRef] [Scilit]
- Rankin, G.A.; Merwin, H.E. The ternary system CaO-Al2O3-MgO. J. Am. Chem. Soc. 1916, 38, 568–588. [Google Scholar] [CrossRef] [Scilit]
- Qiu, J.; Wang, H.; Huo, G.; Liu, C. Phase diagram of the CaO-Al2O3-CeOx slag system at 1600 °C in reducing atmosphere and air atmosphere. Ceram. Int. 2023, 49, 20447–20455. [Google Scholar] [CrossRef] [Scilit]
- Qiu, J.; Huo, G.; Liu, C. Phase equilibrium relationship of the CaO-Al2O3-Ce2O3-MgO system at 1573 K. Metall. Mater. Trans. B 2023, 54, 2411–2425. [Google Scholar] [CrossRef] [Scilit]
- Liu, Z.; Sun, L.; Zhao, H.; Xiang, T.; Qiu, J.; Jiang, M. Isothermal phase diagram of the CaO-SiO2-Nb2O5-5 wt% Fe2O3-TiO2 system at 1200 °C. Ceram. Int. 2022, 48, 31636–31651. [Google Scholar] [CrossRef] [Scilit]
- Qiu, J.; Liu, C.; Liu, Z.; Zhu, D. Isothermal phase diagram of the CaO-SiO2-Nb2O5-La2O3 system at 1300 °C and 1200 °C. Ceram. Int. 2020, 46, 4832–4842. [Google Scholar] [CrossRef] [Scilit]
- Huo, G.; Qiu, J.; Liu, C. Phase equilibria of the Al2O3-SiO2-CeOx system at 1400 °C. Ceram. Int. 2026, 52, 5902–5910. [Google Scholar] [CrossRef] [Scilit]
- Huo, G.; Qiu, J.; Liu, C. Experimental study on phase equilibria of the CaO-Al2O3-La2O3 system at 1873 and 1773 K. J. Am. Ceram. Soc. 2026, 109, e70534. [Google Scholar] [CrossRef] [Scilit]
- GB/T 16839.1-2018; Thermocouples—Part 1: EMF Specifications and Tolerances. Standards Press of China: Beijing, China, 2018.
- JJG 141-2013; Verification Regulation of Working Noble Metal Thermocouples. Standards Press of China: Beijing, China, 2013.
- Shen, F.M. Physical Chemistry of Metallurgy; Higher Education Press: Beijing, China, 2017. (In Chinese) [Google Scholar]

Disclaimer/Publisher’s Note: The statements, opinions and data contained in all publications are solely those of the individual author(s) and contributor(s) and not of MDPI and/or the editor(s). MDPI and/or the editor(s) disclaim responsibility for any injury to people or property resulting from any ideas, methods, instructions or products referred to in the content. |
© 2026 by the authors. Licensee MDPI, Basel, Switzerland. This article is an open access article distributed under the terms and conditions of the Creative Commons Attribution (CC BY) license.