


Abstract
Efficient lime utilization and dephosphorization in basic oxygen furnace (BOF) steelmaking require a bottom-blowing regime that disperses injected lime powder without forming a penetrating gas column. This study optimized the bottom-blowing flow rate for O2–CO2–CaO powder injection in a 300 t BOF by combining a 1:7 water-model experiment, three-phase volume-of-fluid computational fluid dynamics (CFD), and industrial trials. The industrial process used an O2–CO2 carrier-gas mixture with a volumetric ratio of 50:50 to convey CaO powder. The water model showed that bath homogenization time first decreased and then increased with flow rate, reaching a minimum of 35.90 s at 1350 Nm3/h. The simulations predicted dispersed bubble flow at 1200–1350 Nm3/h, a transitional regime at 1450 Nm3/h, and a fully developed gas column at 1500 Nm3/h. At 1350 Nm3/h, the gas–liquid interfacial area reached 5.624 m2 and the low-velocity-zone fraction decreased to 0.04%. Industrial implementation reduced lime consumption from 9.28 to 7.57kg/t, lowered endpoint phosphorus from 0.037% to 0.029%, increased the lime dissolution ratio from 0.52 to 0.68, and decreased total iron in the endpoint slag from 24.7% to 22.9%. By correlating flue gas behavior with hydrodynamic parameters from CFD simulations and industrial metallurgical performance, this study confirms that the bottom-blown gas process is favorable under the investigated converter conditions.
1. Introduction
Basic oxygen furnace (BOF) steelmaking remains one of the principal routes for modern steel production because it combines high productivity, a short refining cycle, and suitability for large-scale industrial operation. The performance of a BOF heat nevertheless depends on the coordinated evolution of bath composition, temperature, slag chemistry, material additions, and the top- and bottom-blowing practices [1]. As market demand for clean and low-phosphorus steels continues to increase, converter operation must achieve efficient phosphorus removal while limiting flux consumption, slag generation, and iron loss. Industrial and data-driven investigations have shown that endpoint phosphorus is governed by the combined effects of slag basicity, oxidation level, temperature, and mass-transfer conditions, rather than by a single operating variable [2,3]. These requirements make the rapid formation of a reactive dephosphorization slag especially important: CaO must become available early enough to establish the required basicity, while an appropriate oxygen potential and sufficient bath agitation must be maintained to transfer phosphorus from the metal to the slag without excessive oxidation of iron.
Lime is the main basic flux used to supply CaO during BOF refining, and its dissolution and reaction behavior directly affect initial slag formation, basicity development, dephosphorization efficiency, and the amount of undissolved material remaining at the end of the heat. Reviews and direct dissolution measurements indicate that lime utilization depends strongly on particle characteristics, slag composition, temperature, interfacial reaction, and liquid-side mass transfer [4,5]. More recently, Xia et al. [6] investigated the effect of MgO content on lime dissolution in dephosphorization slags and demonstrated that the formation of reaction-product layers and solid solutions at the lime–slag interface can hinder lime dissolution. Conventional lump-lime addition has inherent kinetic limitations. A relatively small external surface area restricts contact with the liquid phase, and dense reaction products may develop at the lime–slag interface and retard the continued transfer of CaO into the slag [7]. Consequently, part of the added lime may dissolve too slowly to participate effectively during the limited BOF refining period. The resulting delay in basicity establishment can increase lime consumption, enlarge slag volume, and weaken dephosphorization stability. Increasing the available reaction area and delivering CaO more directly to regions with intense heat and mass transfer are therefore practical routes for improving flux utilization without simply increasing the amount of lump lime charged from the top.
Combined top and bottom blowing and powder-injection technologies provide complementary means of overcoming these limitations. Bottom gas injection strengthens bath circulation, renews reaction interfaces, and reduces weakly stirred regions, whereas the tuyere arrangement and blowing intensity determine plume interaction, circulation-loop structure, homogenization time, and top-jet penetration behavior [8,9,10]. Recent numerical investigations by Cai et al. [11] further examined multiphase flow in a top–bottom combined-blowing BOF, highlighting the influence of blowing parameters on bath flow and splashing behavior. Fine lime powder also has a much larger specific surface area than lump lime and can therefore be heated, dispersed, and incorporated into the refining slag more rapidly. Top-blown and bottom-injected lime-powder studies have demonstrated that the delivery position, powder feed rate, particle residence path, and local oxygen supply govern the extent to which the injected CaO contributes to dephosphorization [12,13,14,15,16,17]. Bottom injection is particularly attractive because the carrier gas can convey CaO powder directly into the bath. During its upward transport, the powder can contact liquid steel and slag over an extended path, while plume-induced circulation promotes lateral dispersion and renews the surrounding liquid. If this transport process is properly controlled [18], fine-particle injection can accelerate CaO participation in slag formation, improve the utilization of the added flux, and enhance the kinetics of phosphorus removal by promoting bath mixing, facilitating slag–metal interfacial renewal, and improving phosphorus mass transfer from the molten metal to the slag.
The present work focuses specifically on the bottom-blown O2–CO2–CaO powder injection process, in which an O2–CO2 carrier-gas mixture conveys CaO powder through bottom tuyeres. This designation is used consistently throughout the manuscript and is distinct from earlier oxygen-assisted CaO-injection processes or CO2-containing bottom-blowing practices considered separately in previous industrial studies [19,20]. The gas-supply regime is a decisive operating variable for the combined process. At an excessively low flow rate, the carrier gas may be unable to maintain stable powder transport, increasing the risk of irregular feeding, powder deposition, or tuyere blockage. As the flow rate increases, the plume initially provides stronger gas–liquid momentum exchange, better bubble dispersion, and more vigorous bath circulation. However, a further increase can intensify bubble coalescence and transform a dispersed plume into an intermittent or penetrating gas column. In this regime, gas and entrained particles rise rapidly through a narrow channel, limiting lateral spreading and shortening the effective residence path of CaO powder in the liquid steel. The powder may then enter the slag before it has been adequately dispersed, heated, and brought into contact with the surrounding bath. Particle-scale dissolution behavior is also sensitive to the evolving interfacial and gas-release conditions [21]. Thus, the highest bottom-blowing flow rate does not necessarily provide the best mixing or powder utilization. The required operating condition must simultaneously ensure reliable conveying and preserve a dispersed bubble plume that couples the injected momentum to the bulk bath.
Extensive research has been conducted on the individual phenomena relevant to converter dephosphorization. Mechanistic refining models and slag studies have clarified the roles of slag–metal mass transfer, basicity, and iron oxides in determining phosphorus removal [22]. Industrial experiments have further examined temperature effects and phosphorus enrichment during the evolution of dephosphorization slag. Other investigations have addressed the acceleration of lime dissolution through modified fluxes and the relationship between BOF slag composition, refining behavior, and subsequent slag utilization [23]. In parallel, cold physical models and computational fluid dynamics have become established tools for evaluating converter plume behavior, mixing, and flow-field uniformity. Despite this substantial body of work, the relevant topics have generally been treated separately. For the bottom-blown O2–CO2–CaO powder injection process, systematic evidence linking the gas-supply regime to bubble morphology, the transition from dispersed bubbles to a penetrating gas column, gas–liquid interfacial area, global bath circulation, and full-scale metallurgical performance remains limited. In particular, an optimum inferred only from homogenization time or local velocity is insufficient unless it also provides stable powder conveying and measurable improvements in lime utilization, endpoint phosphorus, and iron-loss control under industrial conditions.
Accordingly, this study investigates a 300 t industrial BOF by combining water-model experiments, three-phase computational fluid dynamics (CFD), and industrial trials within an integrated assessment framework. The main novelty of this work lies in linking the evolution of bottom-blown plume behavior with quantitative CFD-derived hydrodynamic indicators and evaluating their correspondence with metallurgical performance under industrial operating conditions. The water model was used to characterize bubble-rise behavior, plume morphology, and homogenization time over a prototype-equivalent bottom-blowing range of 1200–1500 Nm3/h. Numerical simulations were then employed to quantify gas distribution, gas–liquid interfacial area, bath-averaged velocity, and the fraction of low-velocity regions, thereby identifying the hydrodynamic changes associated with different flow regimes. Finally, the selected condition was implemented industrially and evaluated in terms of lime consumption, endpoint phosphorus content, lime dissolution ratio, and total iron in the end-point slag (T.Fe). By integrating these experimental, numerical, and industrial findings, this study aims to establish a reliable basis for selecting the bottom-blowing flow rate, rather than relying solely on homogenization time or individual CFD indicators.
2. Water-Model Experiments
2.1. Experimental Setup
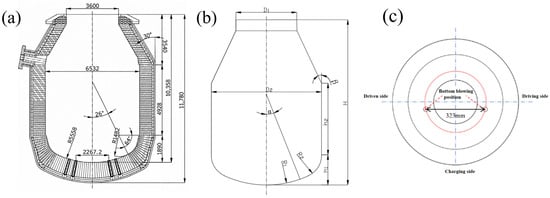
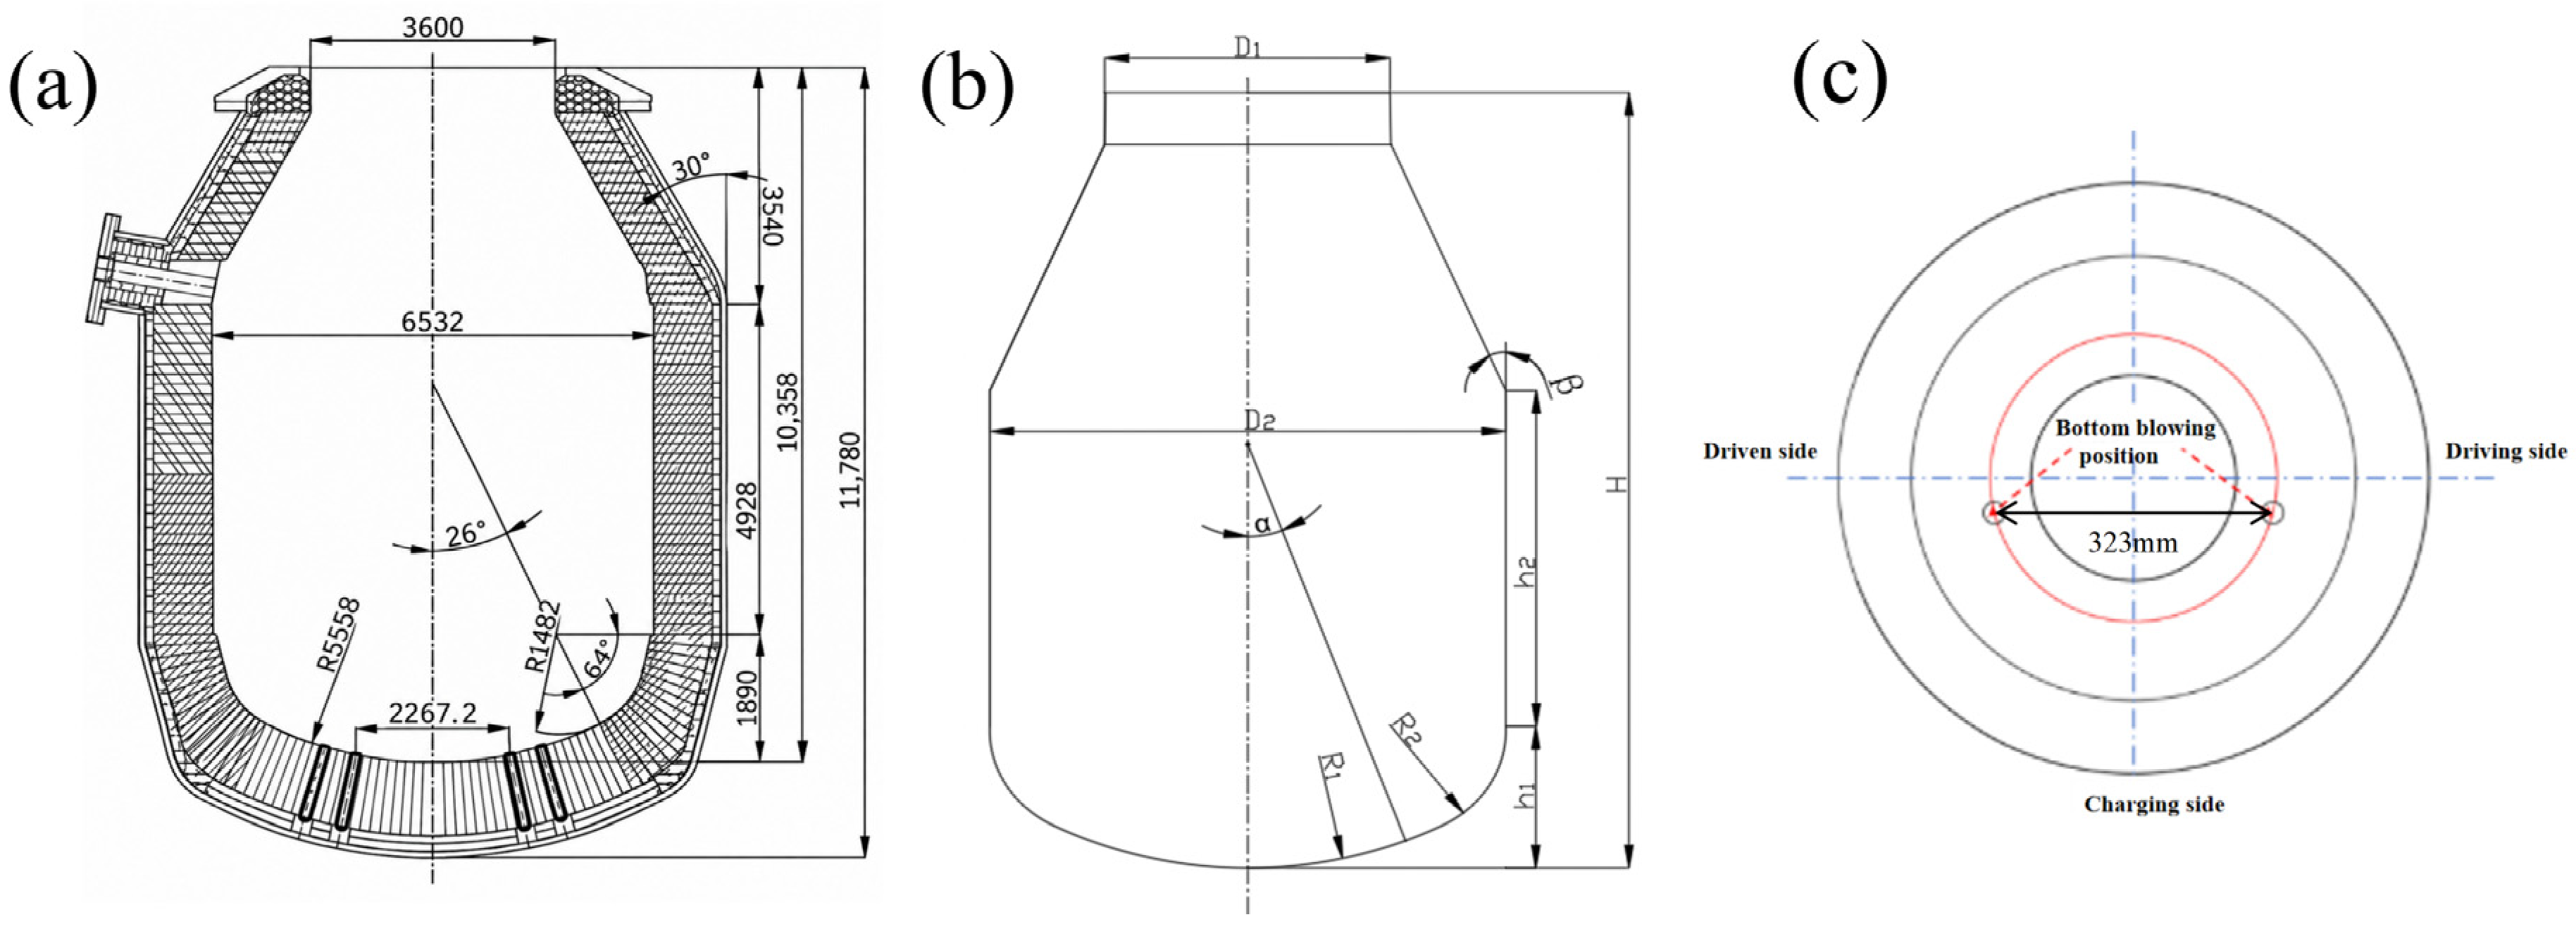
A 1:7 geometrically scaled water model was constructed from 2.5 mm-thick transparent acrylic using a 300 t industrial BOF as the prototype. The principal geometric ratios were preserved, while local structural details not governing the bulk flow were simplified to permit optical access. Figure 1a,b compares the prototype and the physical model, Table 1 summarizes the principal dimensions, and Figure 1c shows the two bottom-blowing tuyere positions.
Figure 1.
Geometry of the 300 t BOF and the water model: (a) industrial prototype; (b) 1:7 water model; and (c) bottom-blowing tuyere arrangement. (unit: mm).
Table 1.
Principal geometric parameters of the BOF prototype and water model.
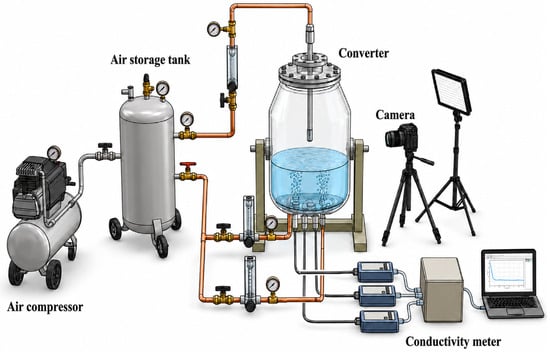
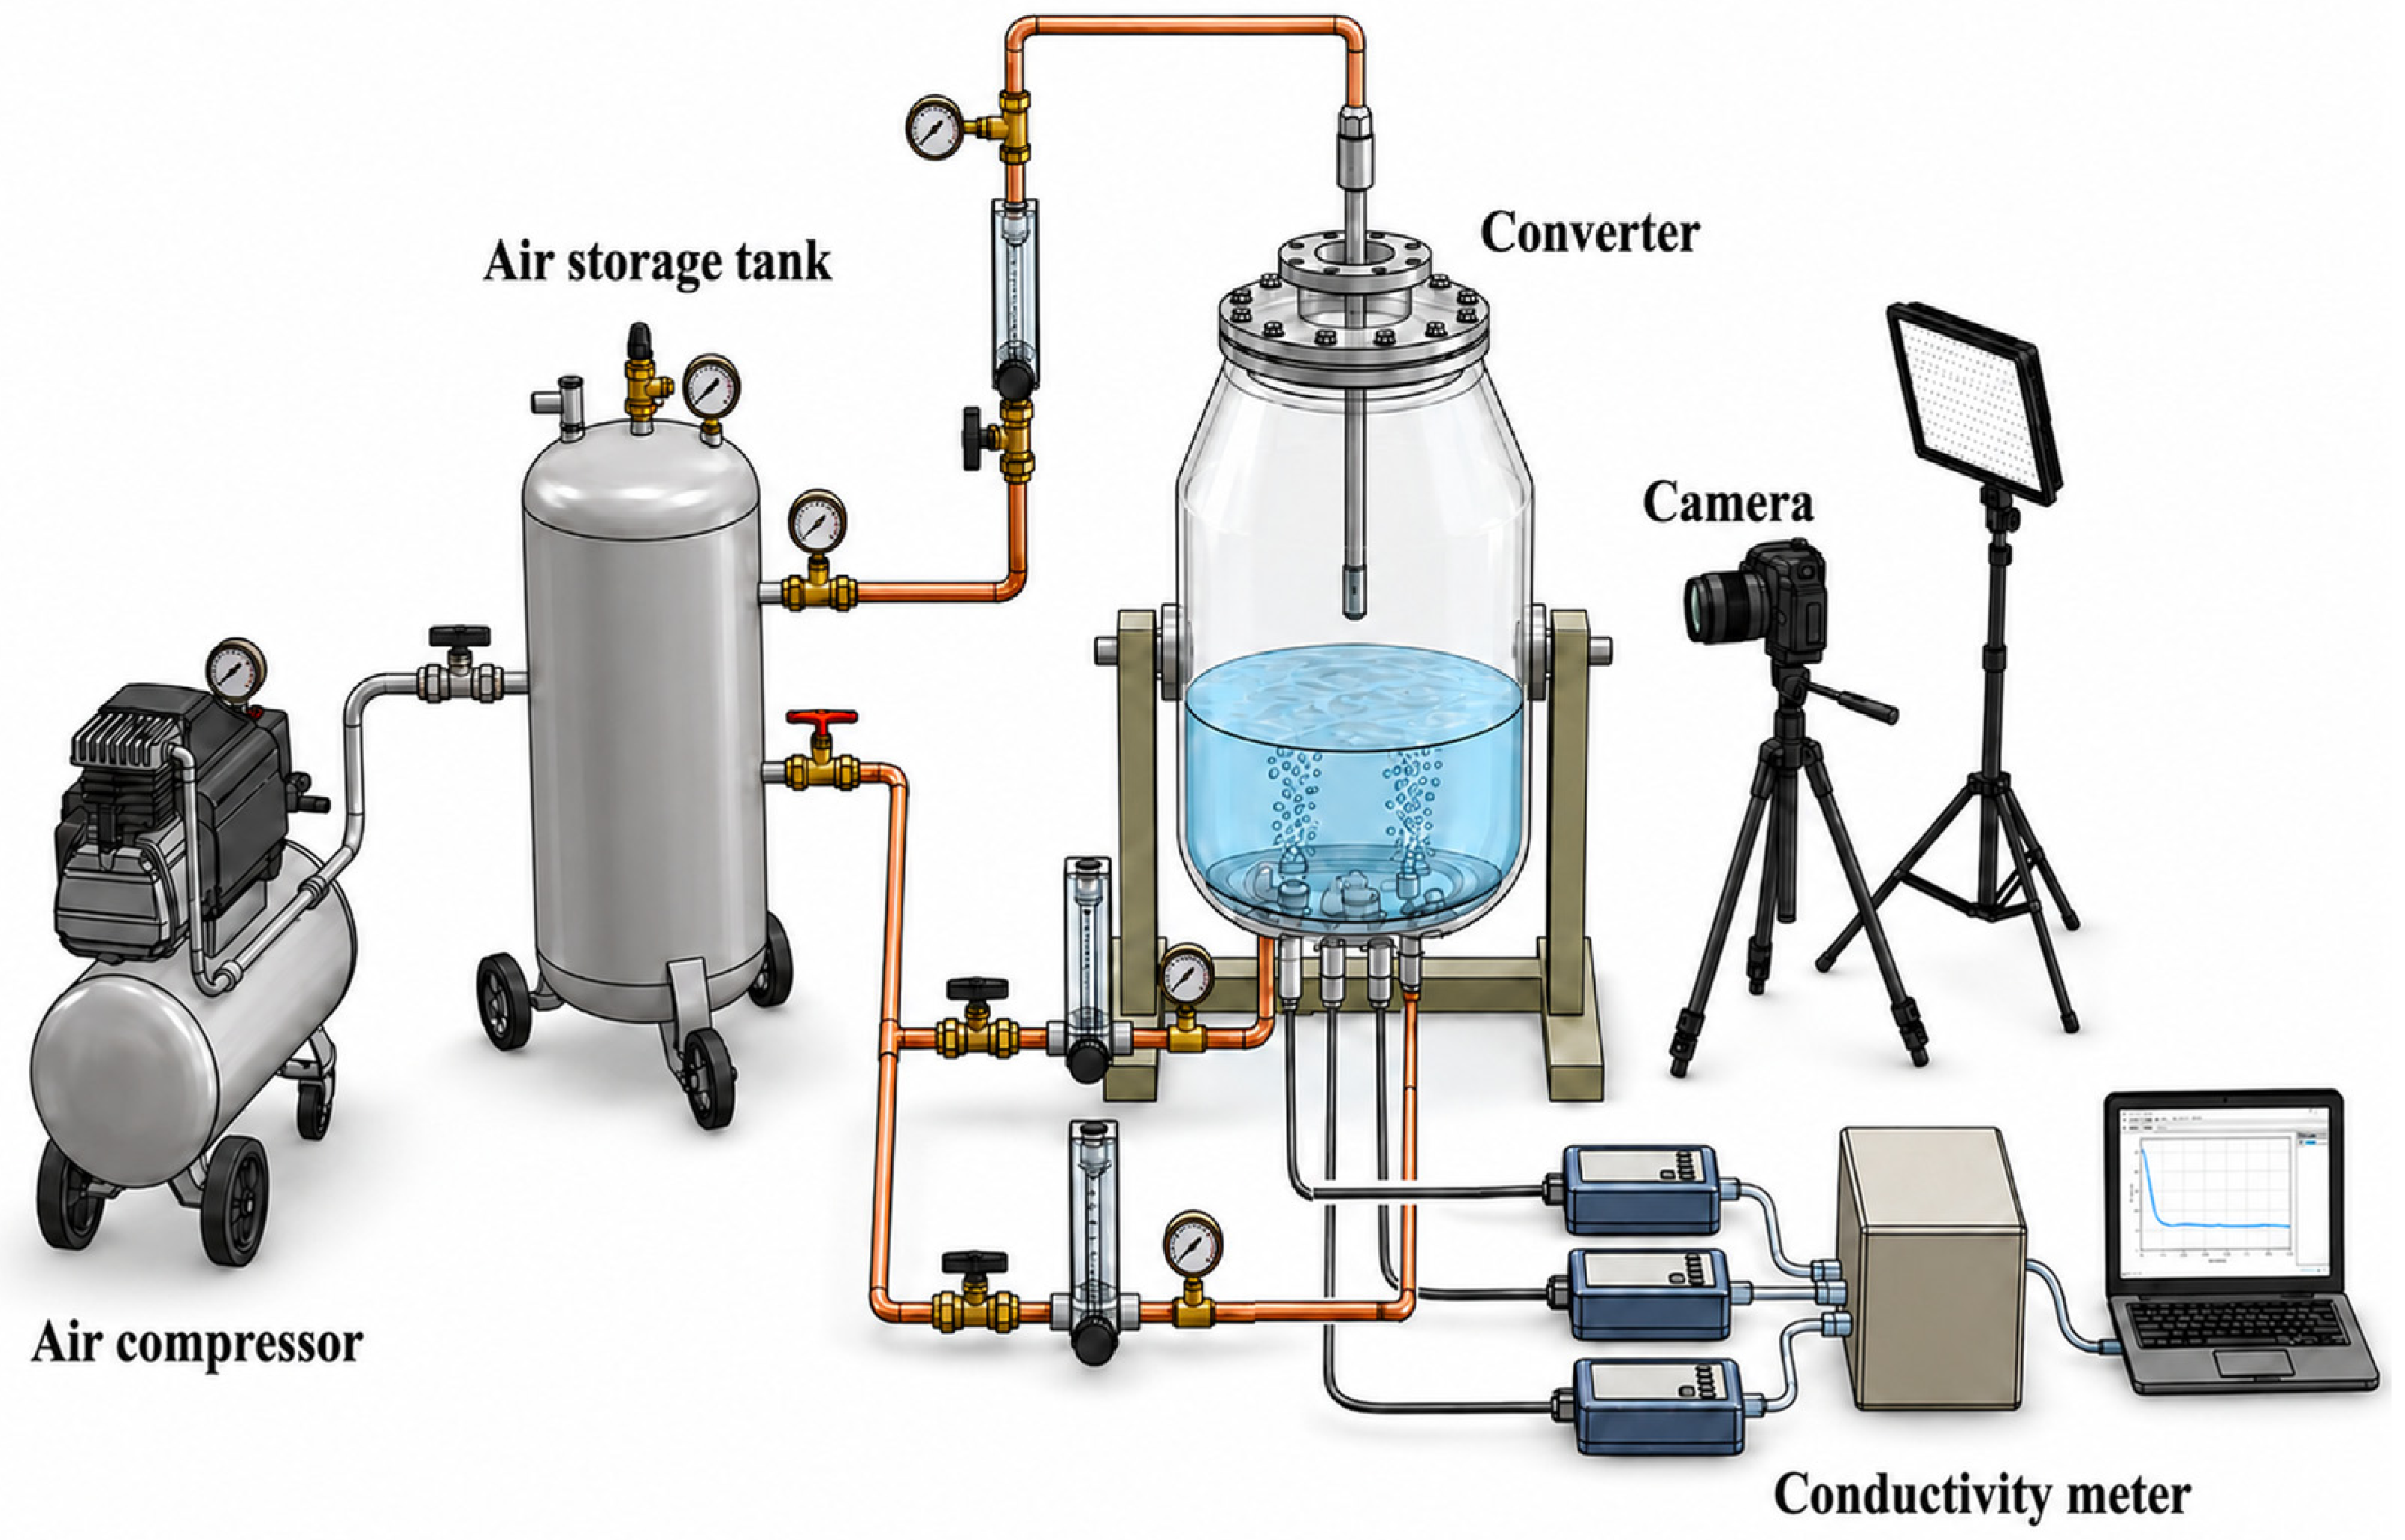
The combined-blowing water-model apparatus is shown in Figure 2. It comprised (i) a gas-injection system consisting of an air compressor, air-storage tank, bottom-blowing elements, and a top lance; (ii) a flow-control and measurement system consisting of pressure gauges, gas flowmeters, and valves; and (iii) a hydraulic measurement system consisting of the converter model, rulers, a conductivity meter, a high-speed camera, a computer, and a movable light-emitting-diode source.
Figure 2.
Schematic of the water-model experimental apparatus.
2.2. Similarity Principles and Experimental Procedure
The BOF bath is characterized by strongly turbulent flow, in which inertial and buoyancy forces generally dominate the large-scale circulation induced by gas injection. Therefore, geometric similarity and the equality of the modified Froude number were adopted to establish the dynamic similarity between the industrial converter and the water model [24]. This approach has been widely applied in physical modeling of metallurgical gas-stirred systems and provides a reasonable basis for investigating macroscopic bath circulation, plume development, and mixing characteristics. Previous studies have also demonstrated the applicability of water modeling to the investigation of bubble formation and rising behavior. Kumar et al. [25] investigated bubble diameter and rising velocity using a water model and extended their results to molten iron by accounting for differences in temperature and fluid properties, obtaining predictions that were broadly consistent with published molten-iron measurements. Similarly, Wang et al. [26] employed a modified-Froude-scaled water model to investigate bubble-size characteristics during bottom gas injection.
Based on geometric similarity, if the modified Froude number (Fr’) of the model is equal to that of the prototype, then it is considered that the model and the prototype satisfy dynamic similarity. Nevertheless, modified Froude similarity does not ensure complete similarity at the individual-bubble scale. Differences in density, viscosity, surface tension, and gas–liquid interfacial properties between the air–water system and the industrial gas–molten-steel system can influence bubble formation, deformation, coalescence, and breakup. In particular, the substantially higher surface tension of molten metal may result in different bubble-size distributions and coalescence behavior compared with those observed in water [27,28]. These differences can be characterized by dimensionless parameters such as the Reynolds, Weber, and Eötvös numbers, which cannot generally be matched simultaneously with the modified Froude number in a geometrically scaled water model. Consequently, the present water model is considered suitable for evaluating the qualitative evolution of gas-plume behavior and the relative changes in bath mixing under different bottom-blowing conditions, rather than for quantitatively reproducing individual bubble diameters or the exact critical flow rate for gas-column formation in the industrial converter.
Because the liquid density is much greater than the gas density, the relationship between the prototype and model gas flow rates can be derived based on the modified Froude number similarity criterion, as expressed in Equation (3). This similarity principle was applied to both the top- and bottom-blowing systems.
After the prototype top-blowing rate was specified, Equation (3) was used to determine the corresponding flow rate for the water model.
The pressure and flowmeter readings of the bottom-blowing system were calibrated at standard conditions. Because the gas pressure at the tuyere outlet differed from the standard-state pressure, the gas density was corrected using the ideal-gas equation, PM = ρRT. The bottom-blowing flow-rate conversion was then expressed as follows:
In Equations (1)–(4), ρ is the liquid density, kg/m3; Q is the standard volumetric gas flow rate, Nm3/h; n is the number of bottom-blowing elements; dn is the tuyere diameter, m; g is the gravitational acceleration, m/s2; H is the liquid bath depth, m; T is the absolute temperature of the injected gas used for the density correction, K; and the reference-state pressure and gas density are denoted by P0 (Pa) and (kg/Nm3), respectively. Subscripts y and p denote the prototype and model, respectively, whereas g and l denote the gas and liquid phases, respectively. Equations (3) and (4) were used to convert the prototype top-blown O2 rate and bottom-blown O2–CO2 mixture rate to the corresponding water-model conditions. The prototype top-blowing oxygen flow rate was fixed at 60,000 Nm3/h, and the bottom-blowing flow rate was varied from 1200 to 1500 Nm3/h, as summarized in Table 2.
Table 2.
Water-model test matrix.
Ambient-temperature water represented the molten metal bath, while compressed air represented both the top-blown oxygen and the bottom-blown O2–CO2 mixture. The influence of the slag phase on bath flow was neglected. In the water-model experiments, CaO powder injection was not considered. Compressed air was used to represent the carrier gas, and water was used to simulate molten metal. This simplification was adopted to isolate the effects of bottom-blowing gas flow rate on gas-plume morphology, gas–liquid interaction, and bath-mixing behavior. Accordingly, the water model was intended to characterize the hydrodynamic response of the bath rather than to reproduce the transport and dissolution of solid CaO particles. The prototype used two bottom-blowing tuyeres, and the O2:CO2 volumetric ratio was 50:50. The lance height and the top- and bottom-blowing flow rates were converted using the 1:7 geometric scale and Equation (4). The resulting physical-property parameters are listed in Table 3. The bath mixing time was determined using the conductivity tracer method. A 50 mL saturated potassium chloride (KCl) solution was used as the tracer. At the moment when the top-blowing and bottom-blowing valves were opened, the saturated KCl solution was added from the top of the model into the bath. Following tracer addition, the electrical conductivity of the bath was continuously monitored by conductivity probes installed at the measurement positions shown in Figure 2. The bath was considered to be mixed when the difference between the stabilized sections of the conductivity curves was less than 2%, and the corresponding time was defined as the mixing time. To reduce the influence of human error on the experimental accuracy, each operating condition was repeated three times, and the arithmetic mean of the three measurements was taken as the mixing time for that condition.
Table 3.
Physical properties of the prototype and model fluids.
The density of the mixed gas was calculated using Equation (5):
where ρmix is the density of the gas mixture (kg/m3) and Vmix is the volume of the gas mixture (m3).
2.3. Experimental Results and Discussion
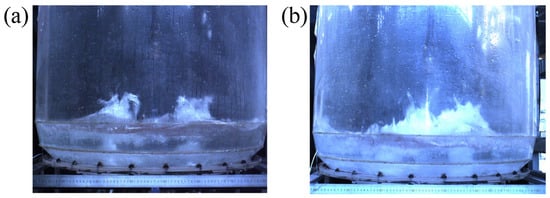
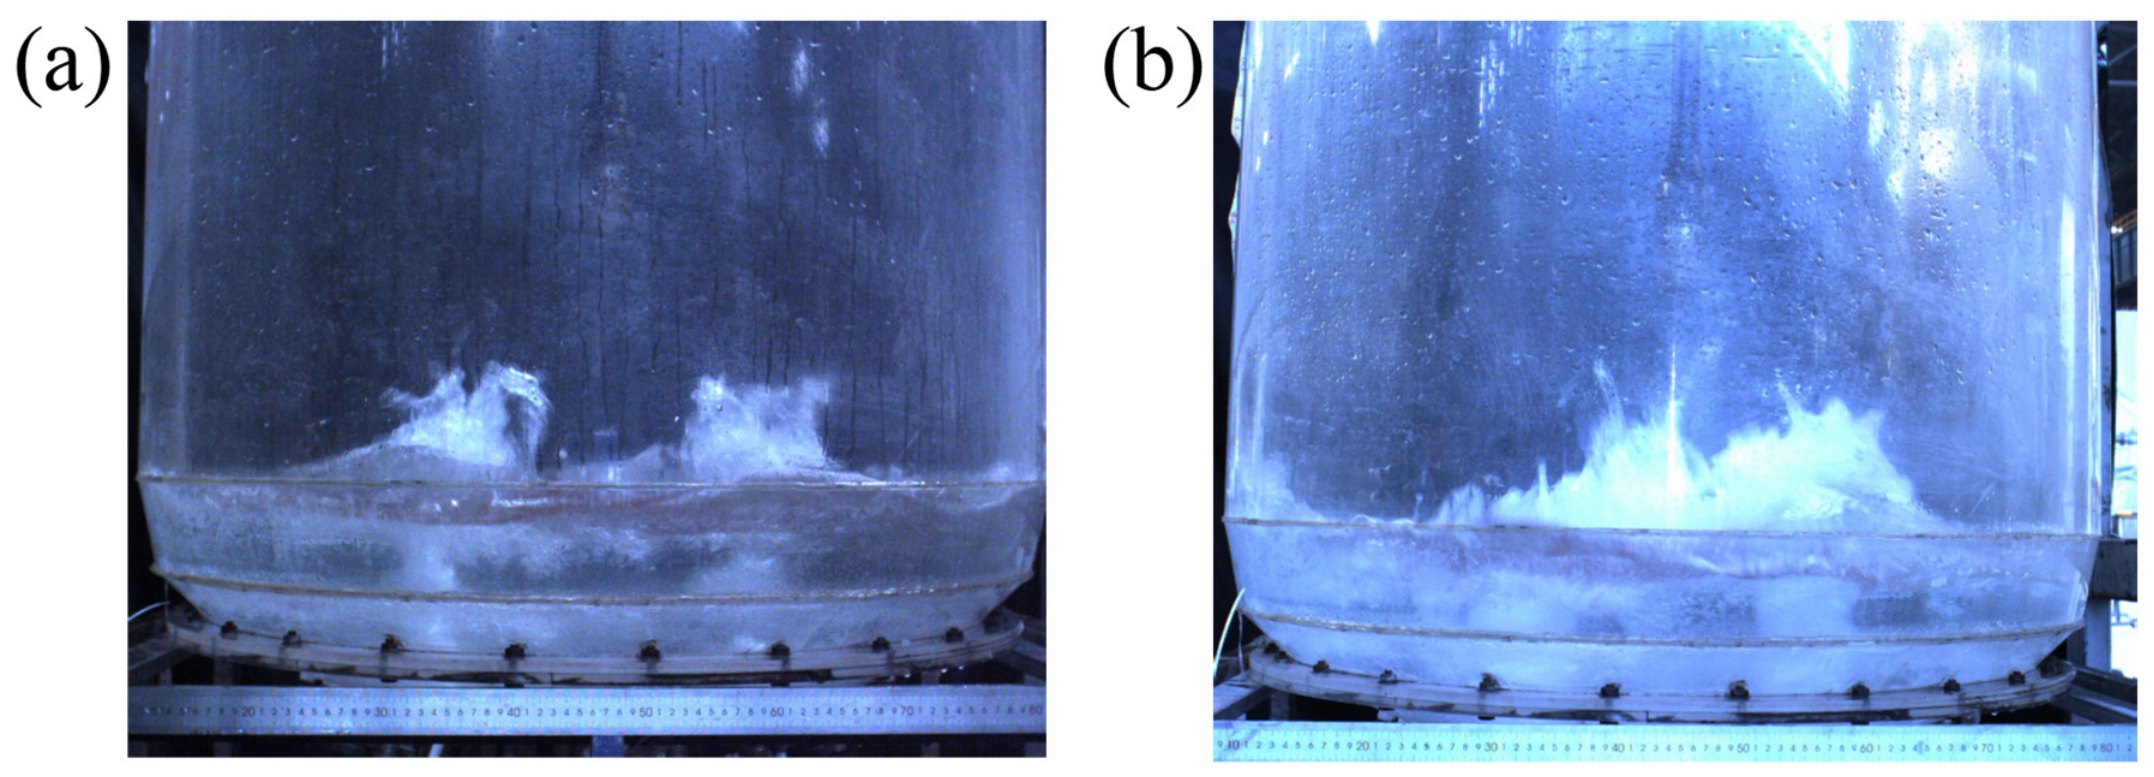
For the bottom-blown O2–CO2–CaO powder injection process, the effective transport, dispersion, and reaction of CaO powder are essential for improving metallurgical performance. Bottom-blown oxygen helps maintain an oxidizing environment near the tuyere and supplies the oxygen potential required for dephosphorization, whereas CO2 moderates the local reaction intensity and acts as part of the carrier-gas mixture. The injected CaO powder provides a high specific surface area and can participate rapidly in slag formation and phosphorus removal after contacting the molten metal and slag. Its residence path and spatial distribution are therefore important: an insufficient bottom-blowing rate can destabilize powder conveying or cause tuyere blockage, whereas an excessive rate can generate a penetrating gas column, resulting in concentrated upward gas flow and reduced lateral momentum transfer to the surrounding liquid. From a physical perspective, such a flow structure may be less favorable for the lateral dispersion of entrained CaO particles during industrial powder injection. However, particle transport was not directly investigated in the present water-model experiments. An appropriate flow rate should maintain a dispersed plume, enhance gas–liquid momentum transfer, and provide adequate residence time for powder heating, dissolution, and reaction. High-speed imaging was used to examine the evolution of the carrier-gas plume in the water model. Across the seven prototype-equivalent conditions from 1200 to 1500 Nm3/h, irregular bubbles were observed, but their coalescence behavior changed systematically with increasing gas input. Figure 3 summarizes the characteristic bubble and plume morphologies used to distinguish the dispersed and channeling regimes.
Figure 3.
Bubble and plume morphologies observed in the water model at different bottom-blowing flow rates: (a) 1200–1400 Nm3/h and (b) 1450–1500 Nm3/h.
Figure 3a shows that, at 1200–1400 Nm3/h, the bottom-blown gas rose predominantly as discrete and irregular bubbles with appreciable lateral spreading. When the flow rate increased to 1450–1500 Nm3/h (Figure 3b), bubble coalescence became pronounced and the plume progressively changed from a dispersed-bubble regime to an intermittent or continuous gas column. In the columnar regime, gas passed rapidly through a concentrated channel rather than being distributed throughout the bath. Consequently, the increase in total gas throughput did not produce a proportional increase in effective gas–liquid contact area. The localized upward flow also weakened circulation outside the plume and reduced the uniformity of bath stirring. For the industrial O2–CO2–CaO powder injection process, such gas channeling may create less favorable hydrodynamic conditions for powder dispersion and interaction with the surrounding bath. This potential effect is inferred from the observed gas-flow structure rather than from direct measurements of CaO particle transport. The bottom-blowing rate must therefore be controlled below the stable-column threshold while remaining sufficiently high for reliable powder conveying. It should be emphasized that the observed transition from dispersed bubbles to a concentrated gas column represents the hydrodynamic response of the present air–water model. Owing to differences in surface tension, density, and gas–liquid interfacial properties, the bubble-size distribution, coalescence characteristics, and critical transition flow rate in the industrial molten-steel system may differ from those observed in the water model. Nevertheless, previous investigations have demonstrated that appropriately scaled water models can provide useful information on the evolution of gas-bubble rising behavior and plume characteristics in metallurgical gas-injection systems. Therefore, the present observations are primarily used to identify the relative changes in plume dispersion and flow structure with increasing bottom-blowing intensity, rather than to establish an exact bubble-scale correspondence with the industrial process.
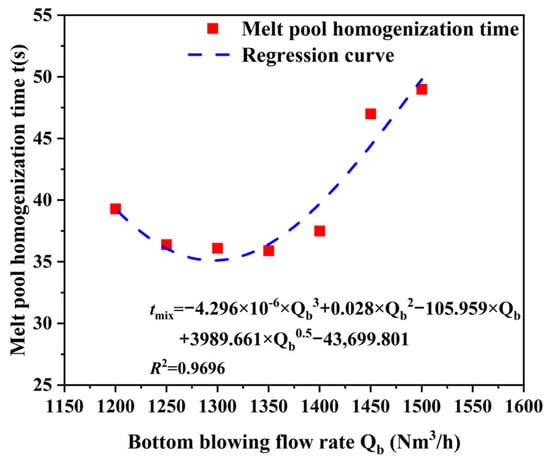
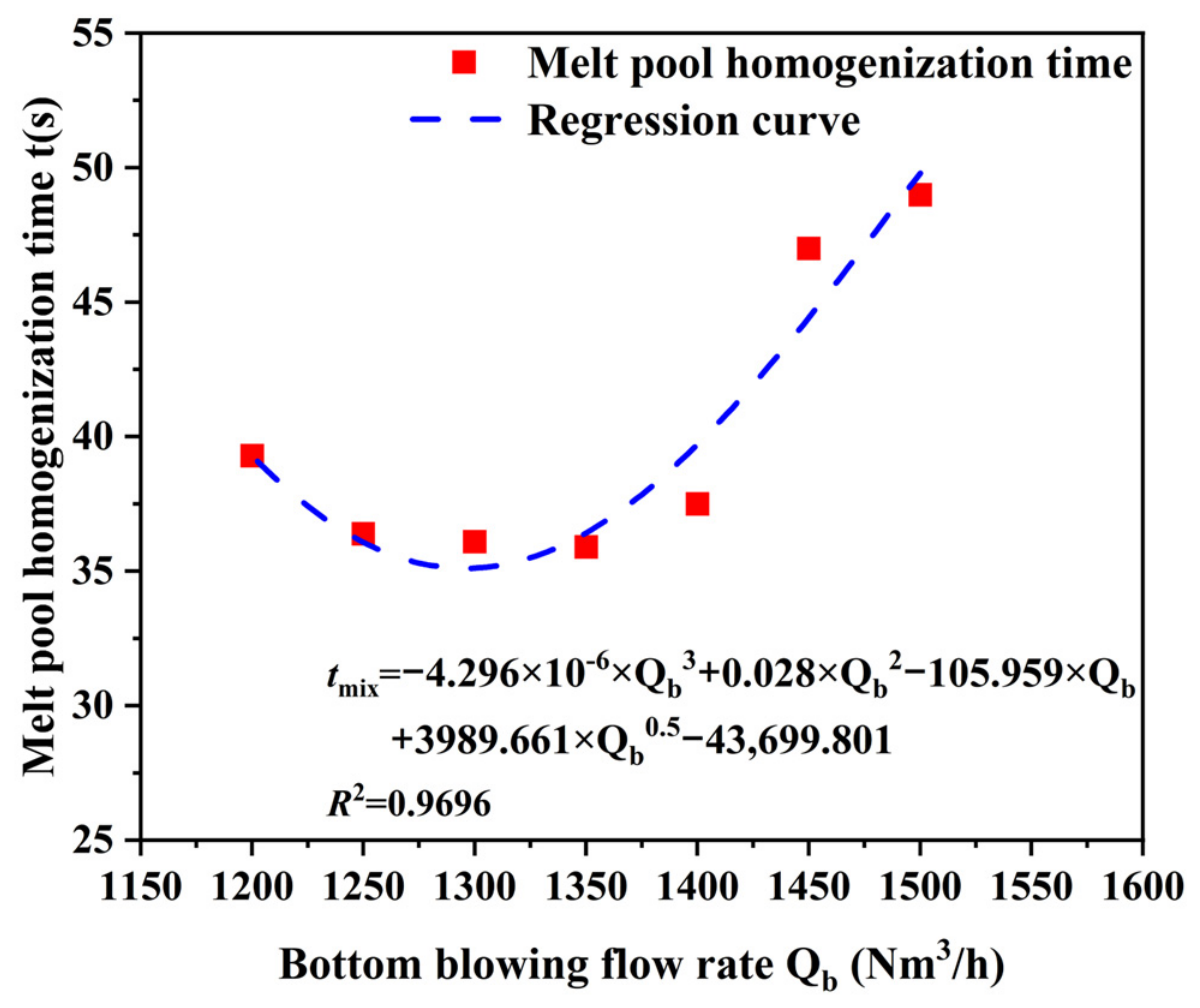
High-speed imaging identified the transition in plume morphology but, by itself, could not determine the optimum gas-supply range. Bath pool homogenization time was therefore measured as a quantitative indicator of global stirring, as shown in Figure 4. With the top-lance position and top-blowing flow rate held constant, the homogenization time first decreased and then increased as the prototype-equivalent bottom-blowing rate rose. It decreased between 1200 and 1250 Nm3/h, remained comparatively low within 1250–1350 Nm3/h, and reached its minimum value of 35.90 s at 1350 Nm3/h. Further increases in flow rate prolonged the homogenization time. The measured values at 1200 and 1500 Nm3/h were similar, demonstrating that the highest gas input did not provide the strongest global circulation. At lower rates, increasing the gas input strengthened plume-induced recirculation and accelerated tracer homogenization. At higher rates, however, bubble coalescence concentrated the gas momentum within a narrow vertical channel and increased interference between the bottom-upward plume and the top-downward jet. The resulting loss of lateral momentum transfer explains why mixing deteriorated beyond the favorable range despite the increase in nominal flow rate.
Figure 4.
Effect of bottom-blowing flow rate on melt pool homogenization time in the combined-blown BOF water model.
All measured homogenization times were below 50 s, confirming that the bottom-blowing system enhanced bath homogenization throughout the investigated range. Nevertheless, the results reveal a distinct hydrodynamic threshold. Below this threshold, increasing the gas-supply intensity promotes bubble dispersion, enlarges the plume-affected region, strengthens liquid circulation, and shortens the time required for the tracer concentration to become uniform. Once the threshold is exceeded, the flow regime changes progressively from dispersed bubbles to an intermittent and then penetrating gas column. The concentrated plume transfers less momentum laterally to the bulk liquid, while its interaction with the top-blown jet becomes stronger and less spatially uniform. These effects increase the volume of weakly stirred liquid and lengthen the overall homogenization time. The physical observations and mixing-time measurements therefore identify 1250–1350 Nm3/h as the favorable bottom-blowing range for the investigated 300 t BOF. Although the precise bubble morphology and gas-column transition threshold may differ between the water model and the industrial converter, the observed variation in mixing time provides a comparative measure of bath stirring performance within the investigated model conditions. The selection of 1350 Nm3/h is therefore based not solely on the water-model observations but also on the complementary CFD analysis and subsequent industrial performance evaluation. Within this range, 1350 Nm3/h provides the minimum measured homogenization time while maintaining a dispersed plume. Regression of bottom-blowing flow rate against homogenization time yielded Equation (6), with a coefficient of determination of R2 = 0.9696, indicating that the fitted relationship adequately represents the experimental trend within the tested range.
3. Numerical Modeling
3.1. Geometric Model and Meshing
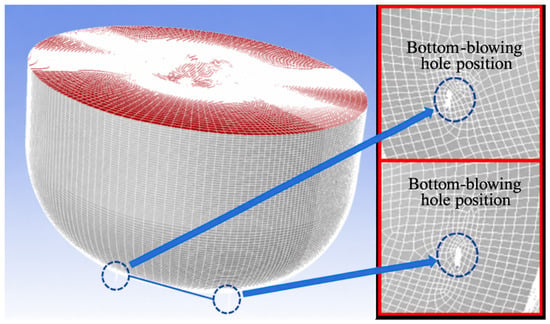
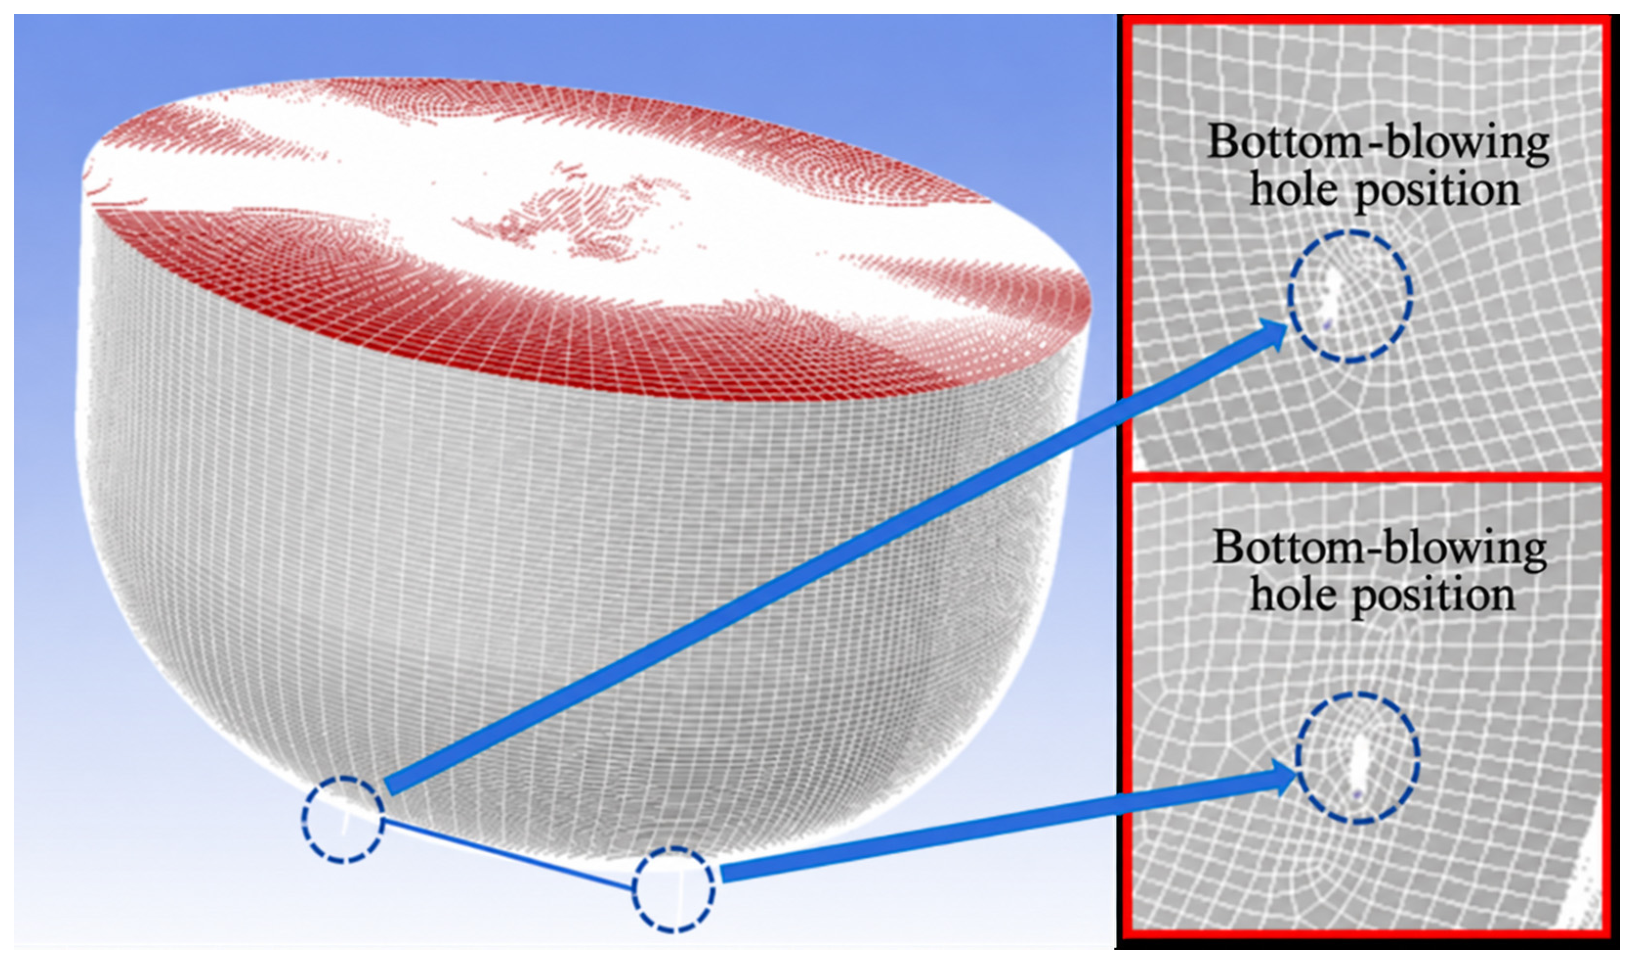
A three-dimensional computational model was established based on the geometric dimensions of an industrial 300 t BOF using Gambit, which was also employed for mesh generation. Numerical simulations were performed using ANSYS Fluent (2022R1) to investigate the gas-plume evolution and the effects of different bottom-blowing gas flow rates on the hydrodynamic characteristics and stirring behavior of the molten bath under the investigated operating conditions. The numerical results were subsequently post-processed using ANSYS CFD-Post and Tecplot, with particular emphasis on gas-phase distribution, bath velocity fields, gas–liquid interfacial area, and flow-field uniformity. The total number of model grids was approximately 3.6 million, and the average grid quality was ensured to be 0.87. In the calculation domain, the average aspect ratio of the grids was 4:3. Due to the large bottom-blowing flow rate, the speed of the bottom-blowing carrier gas attenuation was relatively fast. To ensure the accuracy of the simulation calculation, the regions with large physical quantity gradients (the bottom-blowing position and its surrounding areas, the area where the bottom-blowing gas flows and the gas impact area) and the gas–liquid interface near the grids were encrypted and gradually processed. The grid gradient rate was approximately 1.03. Further, in order to obtain more accurate calculation results, the grid type adopted a structured grid. The specific grid division and details of the bottom-blowing nozzle are shown in Figure 5. The red area in the figure is set as the pressure outlet, the blue area is circled as the mass flow rate inlet, and the gray area is the wall. The physical properties of the molten metal, slag, O2, and CO2 used in the numerical simulations are summarized in Table 4.
Figure 5.
Grid division of the numerical model of the converter and detailed diagrams of the bottom-blown nozzle.
Table 4.
Numerical simulation of medium parameters.
A full three-dimensional computational domain of the 300 t BOF was established without applying geometric symmetry simplifications. Two bottom-blowing tuyeres were included in the numerical model, consistent with the industrial configuration. The numerical simulations focused on the hydrodynamic behavior induced by bottom gas injection, while the top-blown oxygen jet was not explicitly included. The upper boundary of the converter was treated as a pressure outlet. Therefore, the CFD results were primarily used to evaluate the effects of bottom-blowing flow rate on gas-plume morphology, gas distribution, and bath circulation under the simplified numerical conditions.
3.2. Model Assumptions and Boundary Conditions
- (1)
- Model assumptions
- The gas phase was treated as a compressible Newtonian fluid, whereas the molten metal and slag were treated as incompressible Newtonian fluids.
- Chemical reactions and slag–metal emulsification were neglected.
- No-slip conditions and standard wall functions were applied at the refractory wall.
- The viscosities of all phases and the interfacial tensions were treated as constants.
- CaO particles were not explicitly included as a discrete solid phase in the numerical model. Therefore, the present CFD simulations describe the hydrodynamic behavior of the gas, molten metal, and slag phases without resolving CaO particle trajectories, residence times, spatial dispersion, or dissolution. Any implications for powder transport inferred from the gas-flow structure are qualitative physical interpretations rather than direct CFD predictions.
- (2)
- Boundary conditions and numerical settings
Transient calculations were performed using a pressure-based solver. For each bottom blowdown flow condition, the transient simulation is conducted within the physical time range, and the total simulation duration is 10 s. The pressure–velocity coupling employed the phase-coupled SIMPLE algorithm. PRESTO was used for pressure interpolation, Geo-Reconstruct for interface reconstruction, and first-order upwind discretization for the remaining transport equations. Convergence was accepted when the energy residual was below 10−6 and all other residuals were below 10−3. The initial time step was 1 × 10⁻⁴ s and was subsequently adjusted using a global Courant number of 1.0. The boundary conditions are summarized in Table 5.
Table 5.
Boundary conditions used in the numerical model.
3.3. Governing Equations
The governing equations employed in this study are based on the conventional VOF multiphase-flow formulation, together with the standard k–ε turbulence model, energy conservation, and species transport. Although these formulations are well established, they are presented here to provide a complete mathematical description of the numerical framework. The numerical simulations were conducted to investigate the three-phase flow of gas, molten metal, and slag in the BOF. The gas phase represented the injected O2–CO2 carrier gas, while the liquid phases consisted of molten metal and slag. The volume-of-fluid (VOF) model was employed to describe the flow behavior and interfacial evolution of these three phases. The flow was governed by the conservation equations of mass and momentum. In the VOF framework, a shared momentum equation was solved for the multiphase system, while the volume-fraction equations were used to track the spatial distribution and interfaces of the individual phases [29].
- (1)
- VOF model
The VOF formulation solves a single momentum equation and tracks the interface between immiscible phases through the transport equations for their volume fractions. The continuity equation for phase i is given by Equation (7).
where is the volume fraction of phase i (dimensionless), is the density of phase i, is the shared velocity vector, is the volumetric mass source term for phase i, and denotes the volumetric mass transfer rate from phase j to phase i. The primary-phase volume fraction is obtained from Equation (8). Because no volumetric mass source was included, .
The phases share a velocity field obtained from the mixture momentum equation, with mixture properties calculated from the local phase fractions, as expressed by Equations (9)–(11).
Here, μ is the mixture viscosity, kg/(m·s); P is the static pressure, Pa; and F is the volumetric body force, N/m3.
- (2)
- Energy conservation
In Equation (12), keff is the effective thermal conductivity, W/(m·K); E is the energy, J/kg; and Sh is a user-defined volumetric heat source. No additional heat source was imposed, and Sh was therefore set to 0 W/m3.
In the VOF formulation, the energy equation is shared by the phases, and the mixture-specific energy is calculated by mass-weighted averaging of the phase-specific energies, as expressed in Equation (13). Here, Ei denotes the specific energy of phase i, J/kg, and a shared temperature field is assumed for the phases.
3.3.1. Turbulence Model
The standard k–ε model was used to represent turbulence. The transport equations for turbulent kinetic energy, k, and turbulent dissipation rate, ε, are given by Equations (14) and (15), respectively.
In these equations, Gk is the production of turbulent kinetic energy by mean velocity gradients, W/m3; Gb is the contribution from buoyancy, W/m3; YM is the contribution of fluctuating dilatation in compressible turbulence to the overall dissipation rate, and C1ε, C2ε, C3ε, σk, and σε are model constants.
3.3.2. Species Transport
Although chemical reactions were neglected in the present CFD model, the species-transport equations were employed to describe the convection and diffusion of O2 and CO2 within the gas phase. The inlet O2/CO2 volumetric ratio was fixed at 50:50, and the transport equations were used to describe the distribution of these gas components without accounting for their chemical consumption or generation. Accordingly, the chemical reaction source term, Rj, was set to zero. The mass fraction of species j was determined using the species conservation equation (Equation (16)) and the diffusion-flux expression (Equation (17)).
Here, Rj is the net production rate of species j by chemical reaction, Jj is the diffusion flux of species j, Dj,m is the diffusion coefficient of species j in the mixture, DT,j is the thermal diffusion coefficient, and Sct is the turbulent schmidt number, set to 0.7.
3.4. Numerical Simulation Results and Discussion
To ensure that the powder can be smoothly transported to the bath, the bottom-blown O2–CO2–CaO powder injection process usually requires a bottom blowing flow rate higher than that of the conventional top-bottom combined blowing. However, an excessively high bottom-blowing flow rate may cause the gas phase to form a continuous column within the bath, resulting in concentrated upward gas flow and reduced lateral gas dispersion. From a physical perspective, such a flow structure could potentially promote preferential upward transport of entrained CaO particles during industrial injection. Nevertheless, because CaO particles were not explicitly included in the numerical model, their trajectories, residence times, and transfer to the slag phase cannot be determined from the present CFD results. Therefore, the analysis focuses on the gas-flow characteristics and their potential implications for powder-injection performance.
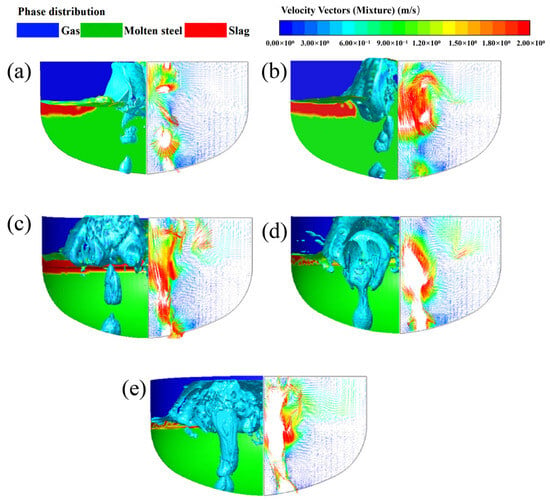
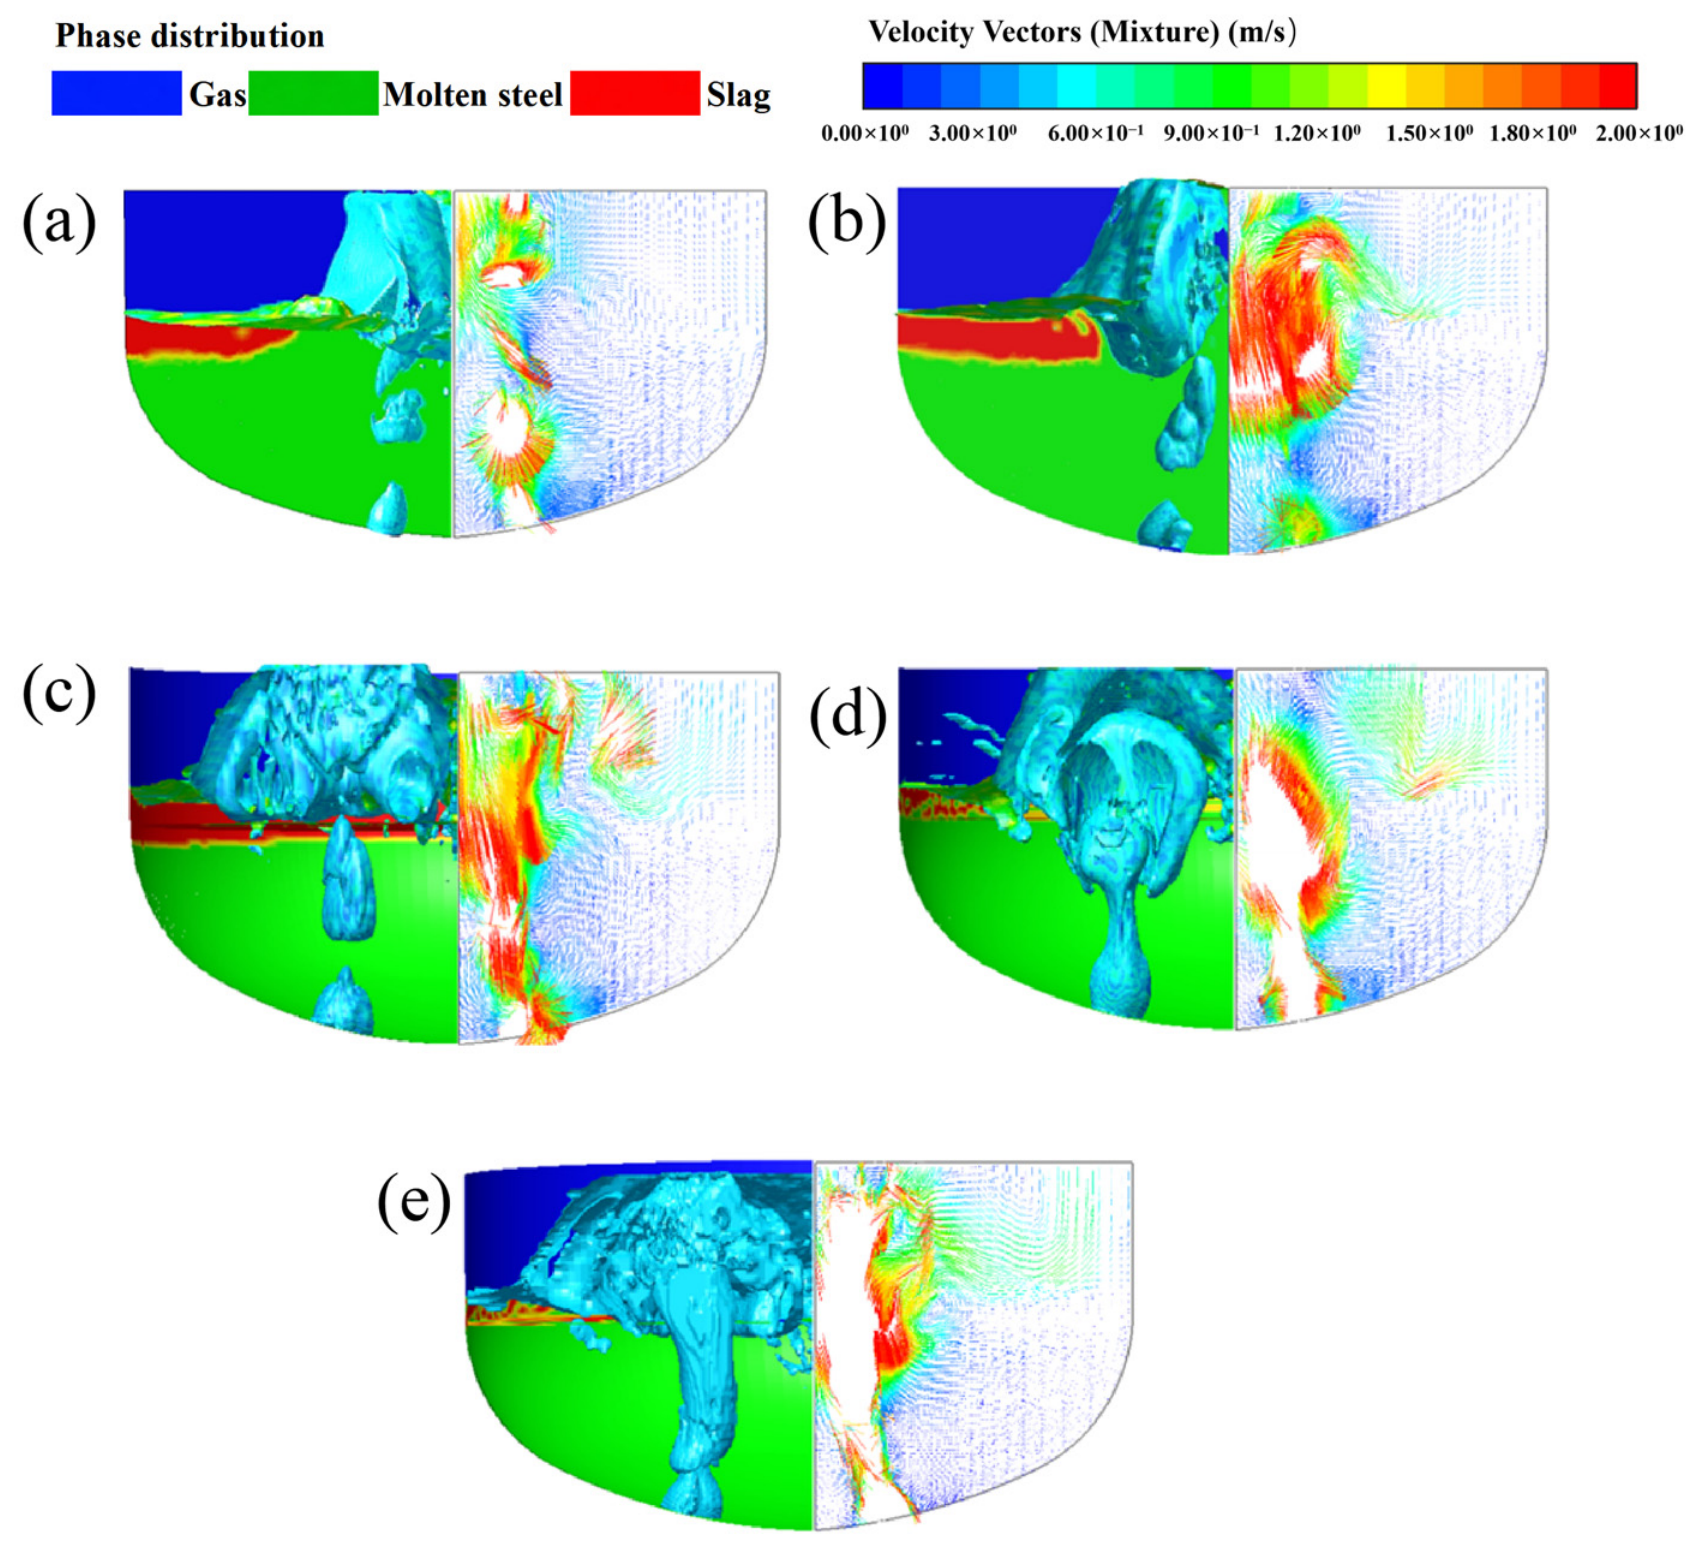
Based on the measured results of the pressure and flow rate of the powder injection system, this paper conducted numerical simulations of the bottom blowing jet characteristics in the bath when the bottom blowing flow rates were 1200, 1250, 1350, 1450, and 1500 Nm3/h, and analyzed the bubble rising morphology and the flow characteristics of the molten metal. Figure 6 shows the morphology and velocity vector diagrams of the gas–liquid two-phase zone in the bath under different bottom blowing flow rates (0–5 m/s), where the blank area indicates local velocities exceeding 5 m/s. The results show that when the bottom blowing flow rate is 1200–1350 Nm3/h, the gas mainly rises in the form of discrete bubbles; when the bottom blowing flow rate is 1450 Nm3/h, the flow pattern is alternating between discrete bubbles and columnar flow; when the bottom blowing flow rate reaches 1500 Nm3/h, a complete columnar flow forms in the bath.
Figure 6.
Gas–liquid two-phase morphology and velocity vectors inside the molten bath under different bottom-blowing volumetric flow rates: (a) 1200 Nm3/h, (b) 1250 Nm3/h, (c) 1350 Nm3/h, (d) 1450 Nm3/h and (e) 1500 Nm3/h.
Based on actual production, it is known that too low a bottom blowing flow rate can easily lead to poor powder transportation or even blockage, while too high a flow rate will cause the gas column to directly penetrate the molten metal and slag layer, reducing the powder utilization rate and dephosphorization efficiency. Based on the analysis of the morphology of the gas–liquid two-phase zone, 1350 Nm3/h is the more optimal bottom blowing flow rate under the conditions of this study.
The flow behavior above the two bottom-blowing tuyeres is also relevant to the symmetry of bath circulation. At relatively low bottom-blowing flow rates (1200–1350 Nm3/h), the injected gas predominantly rises as dispersed plumes, inducing upward flow above the tuyere regions and circulation in the surrounding molten-metal bath. Under nominally symmetric tuyere arrangements, comparable gas-injection conditions provide a basis for approximately symmetric large-scale circulation, although local fluctuations may occur. As the bottom-blowing flow rate increases to 1450–1500 Nm3/h, gas coalescence becomes more pronounced and the plumes progressively develop into concentrated gas columns. This change concentrates the upward gas momentum and modifies the surrounding circulation patterns, potentially affecting the spatial symmetry of the flow field. It should be emphasized that geometric symmetry does not necessarily imply instantaneous flow symmetry in a transient turbulent multiphase system.
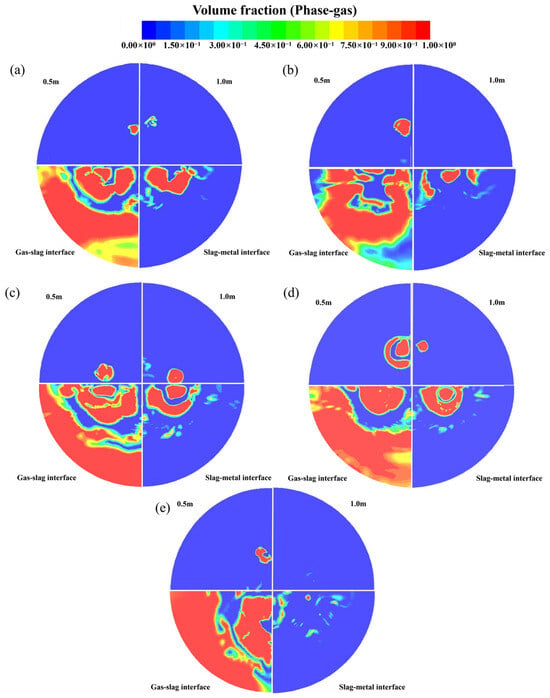
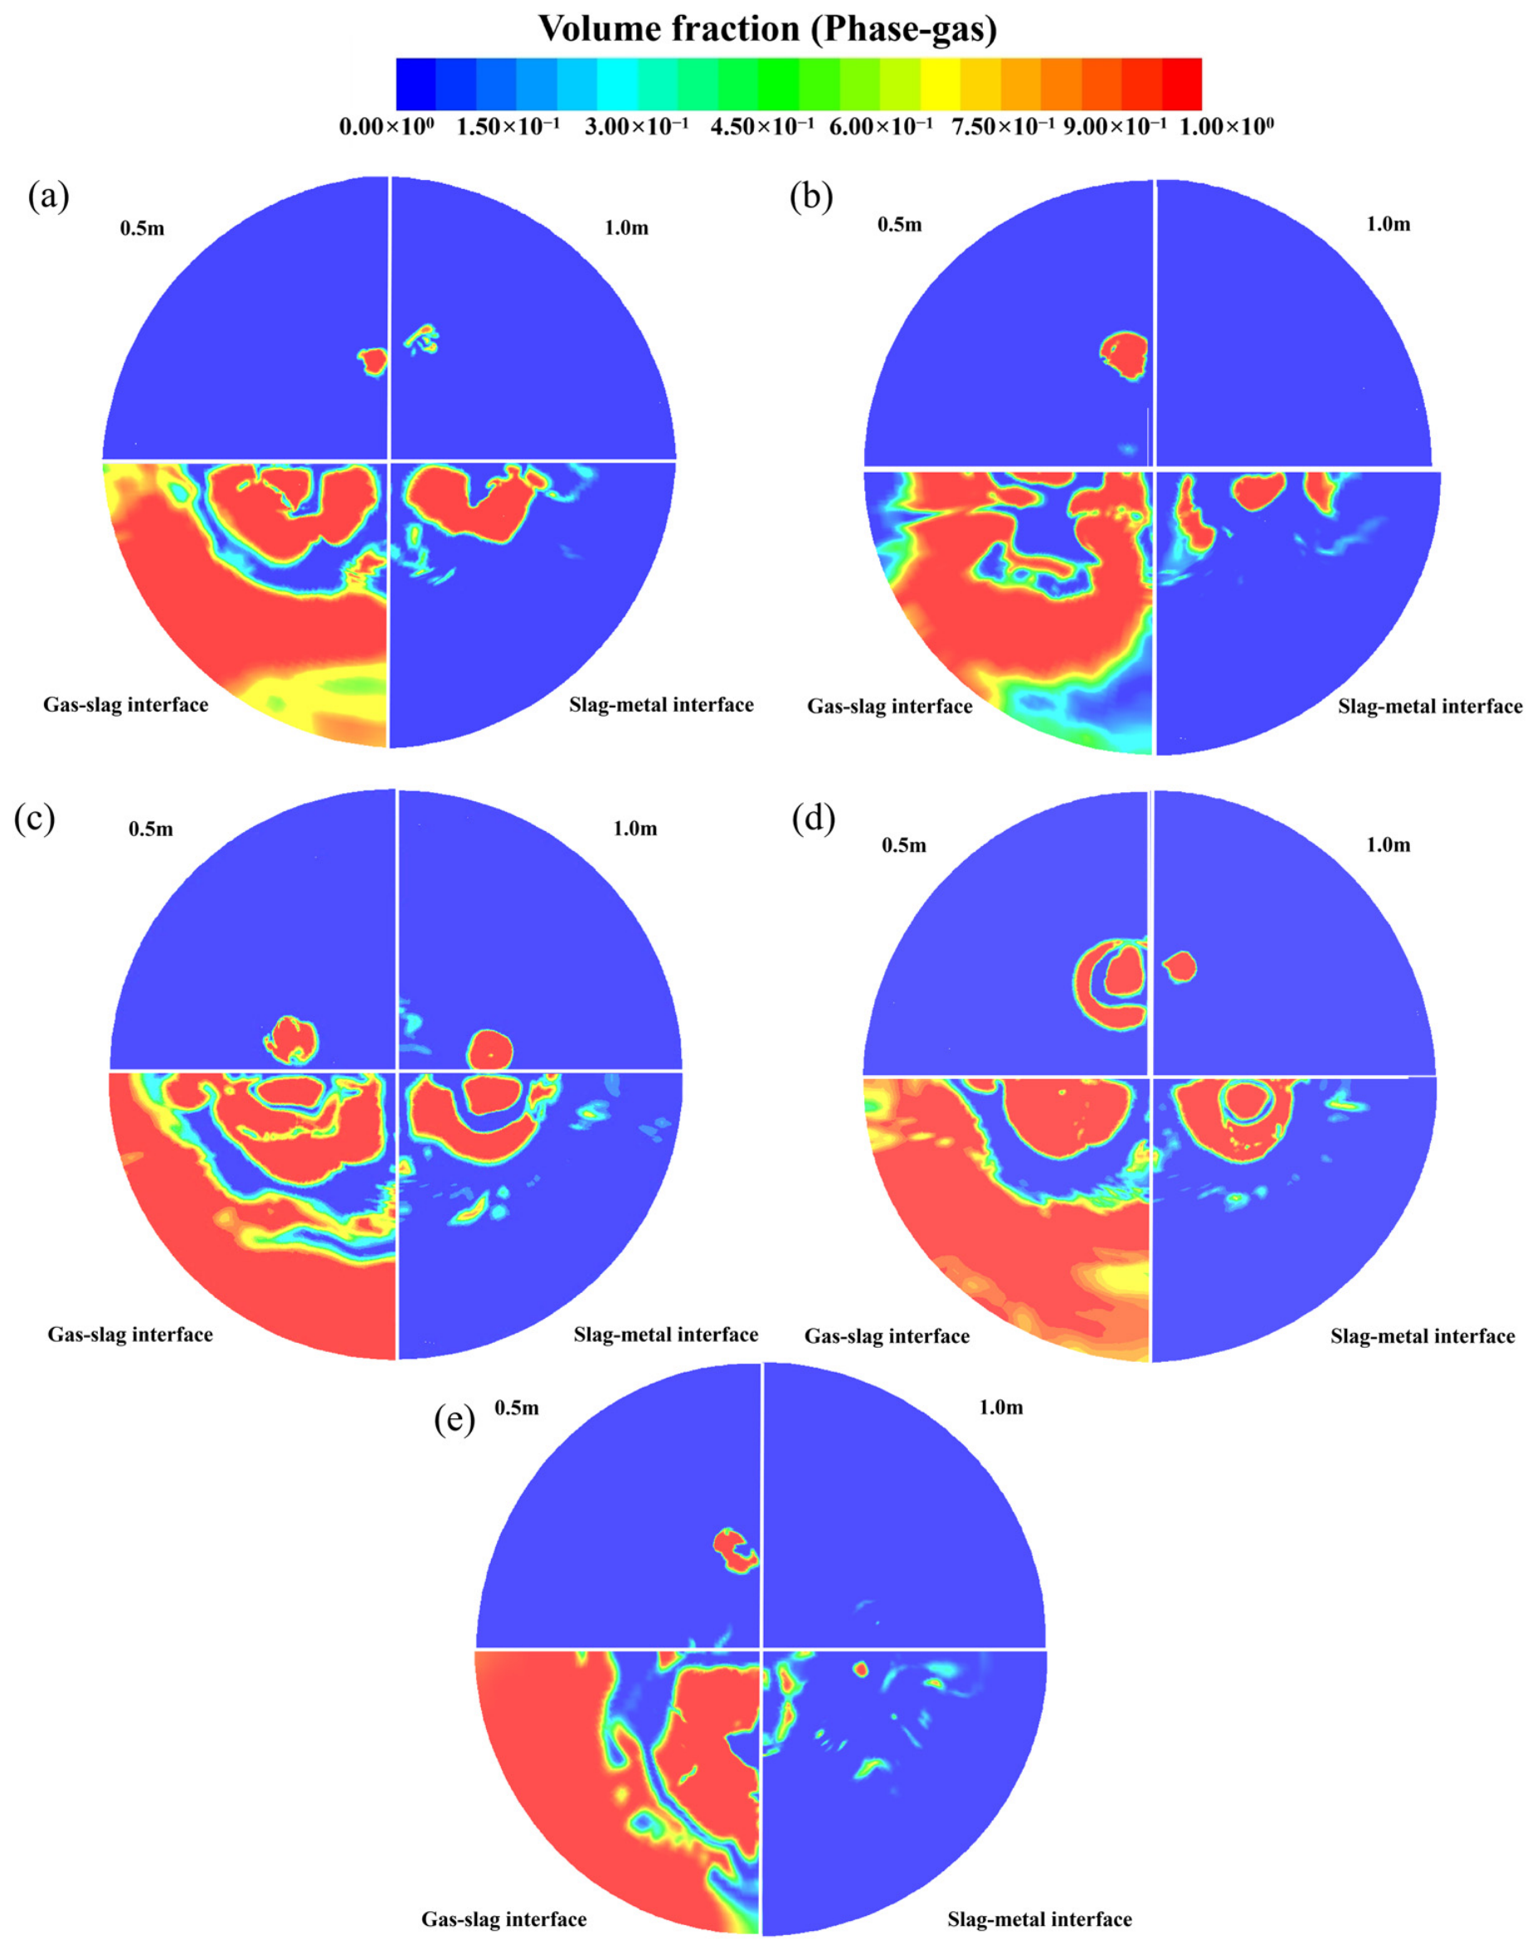
To further analyze the evolution characteristics of the gas jet entering the bath under different bottom-blowing flow rates, the gas phase volume fraction distributions at positions 0.5 m and 1.0 m above the liquid level, as well as at the slag–metal interface and slag–gas interface were extracted. The results are shown in Figure 7. When the bottom-blowing flow rate is lower than 1350 Nm3/h, the bottom-blowing gas mainly rises in the form of discrete bubbles, and there are local areas with a gas phase volume fraction of 0 at each section, indicating that the gas distribution has a strong discreteness. As the bottom-blowing flow rate increases from 1200 Nm3/h to 1350 Nm3/h, the gas distribution range and proportion on the same section gradually increase, indicating that the gas–liquid contact area increases, which is conducive to strengthening the mass transfer process. When the bottom-blowing flow rate increases to 1450 Nm3/h, the gas distribution shows a changing characteristic of first decreasing and then increasing, indicating that the bottom-blowing jet has changed from a simple bubble flow to a transitional state of alternating bubble flow and columnar flow. When the bottom-blowing flow rate is further increased to 1500 Nm3/h, a stable columnar flow is formed in the bath, and the gas directly passes through the molten metal and enters the slag phase, resulting in a significant decrease in the gas–liquid contact area. For the bottom-blown O2–CO2–CaO powder injection process, this gas-column structure may create a tendency toward preferential upward transport of entrained powder, potentially limiting its lateral dispersion within the bath. However, this interpretation is based on the simulated gas-flow characteristics, and the actual transport and distribution of CaO particles were not directly resolved.
Figure 7.
Gas-phase volume-fraction distributions at selected horizontal sections and phase interfaces for different bottom-blowing flow rates: (a) 1200, (b) 1250, (c) 1350, (d) 1450, (e) 1500 Nm3/h.
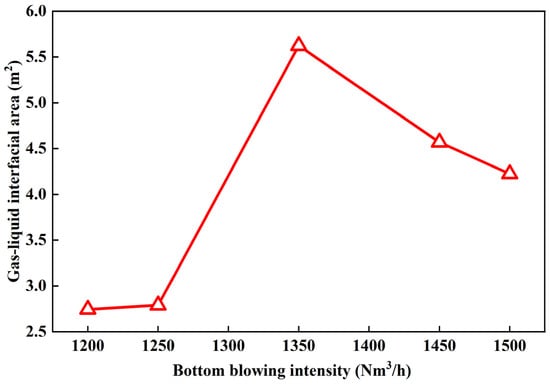
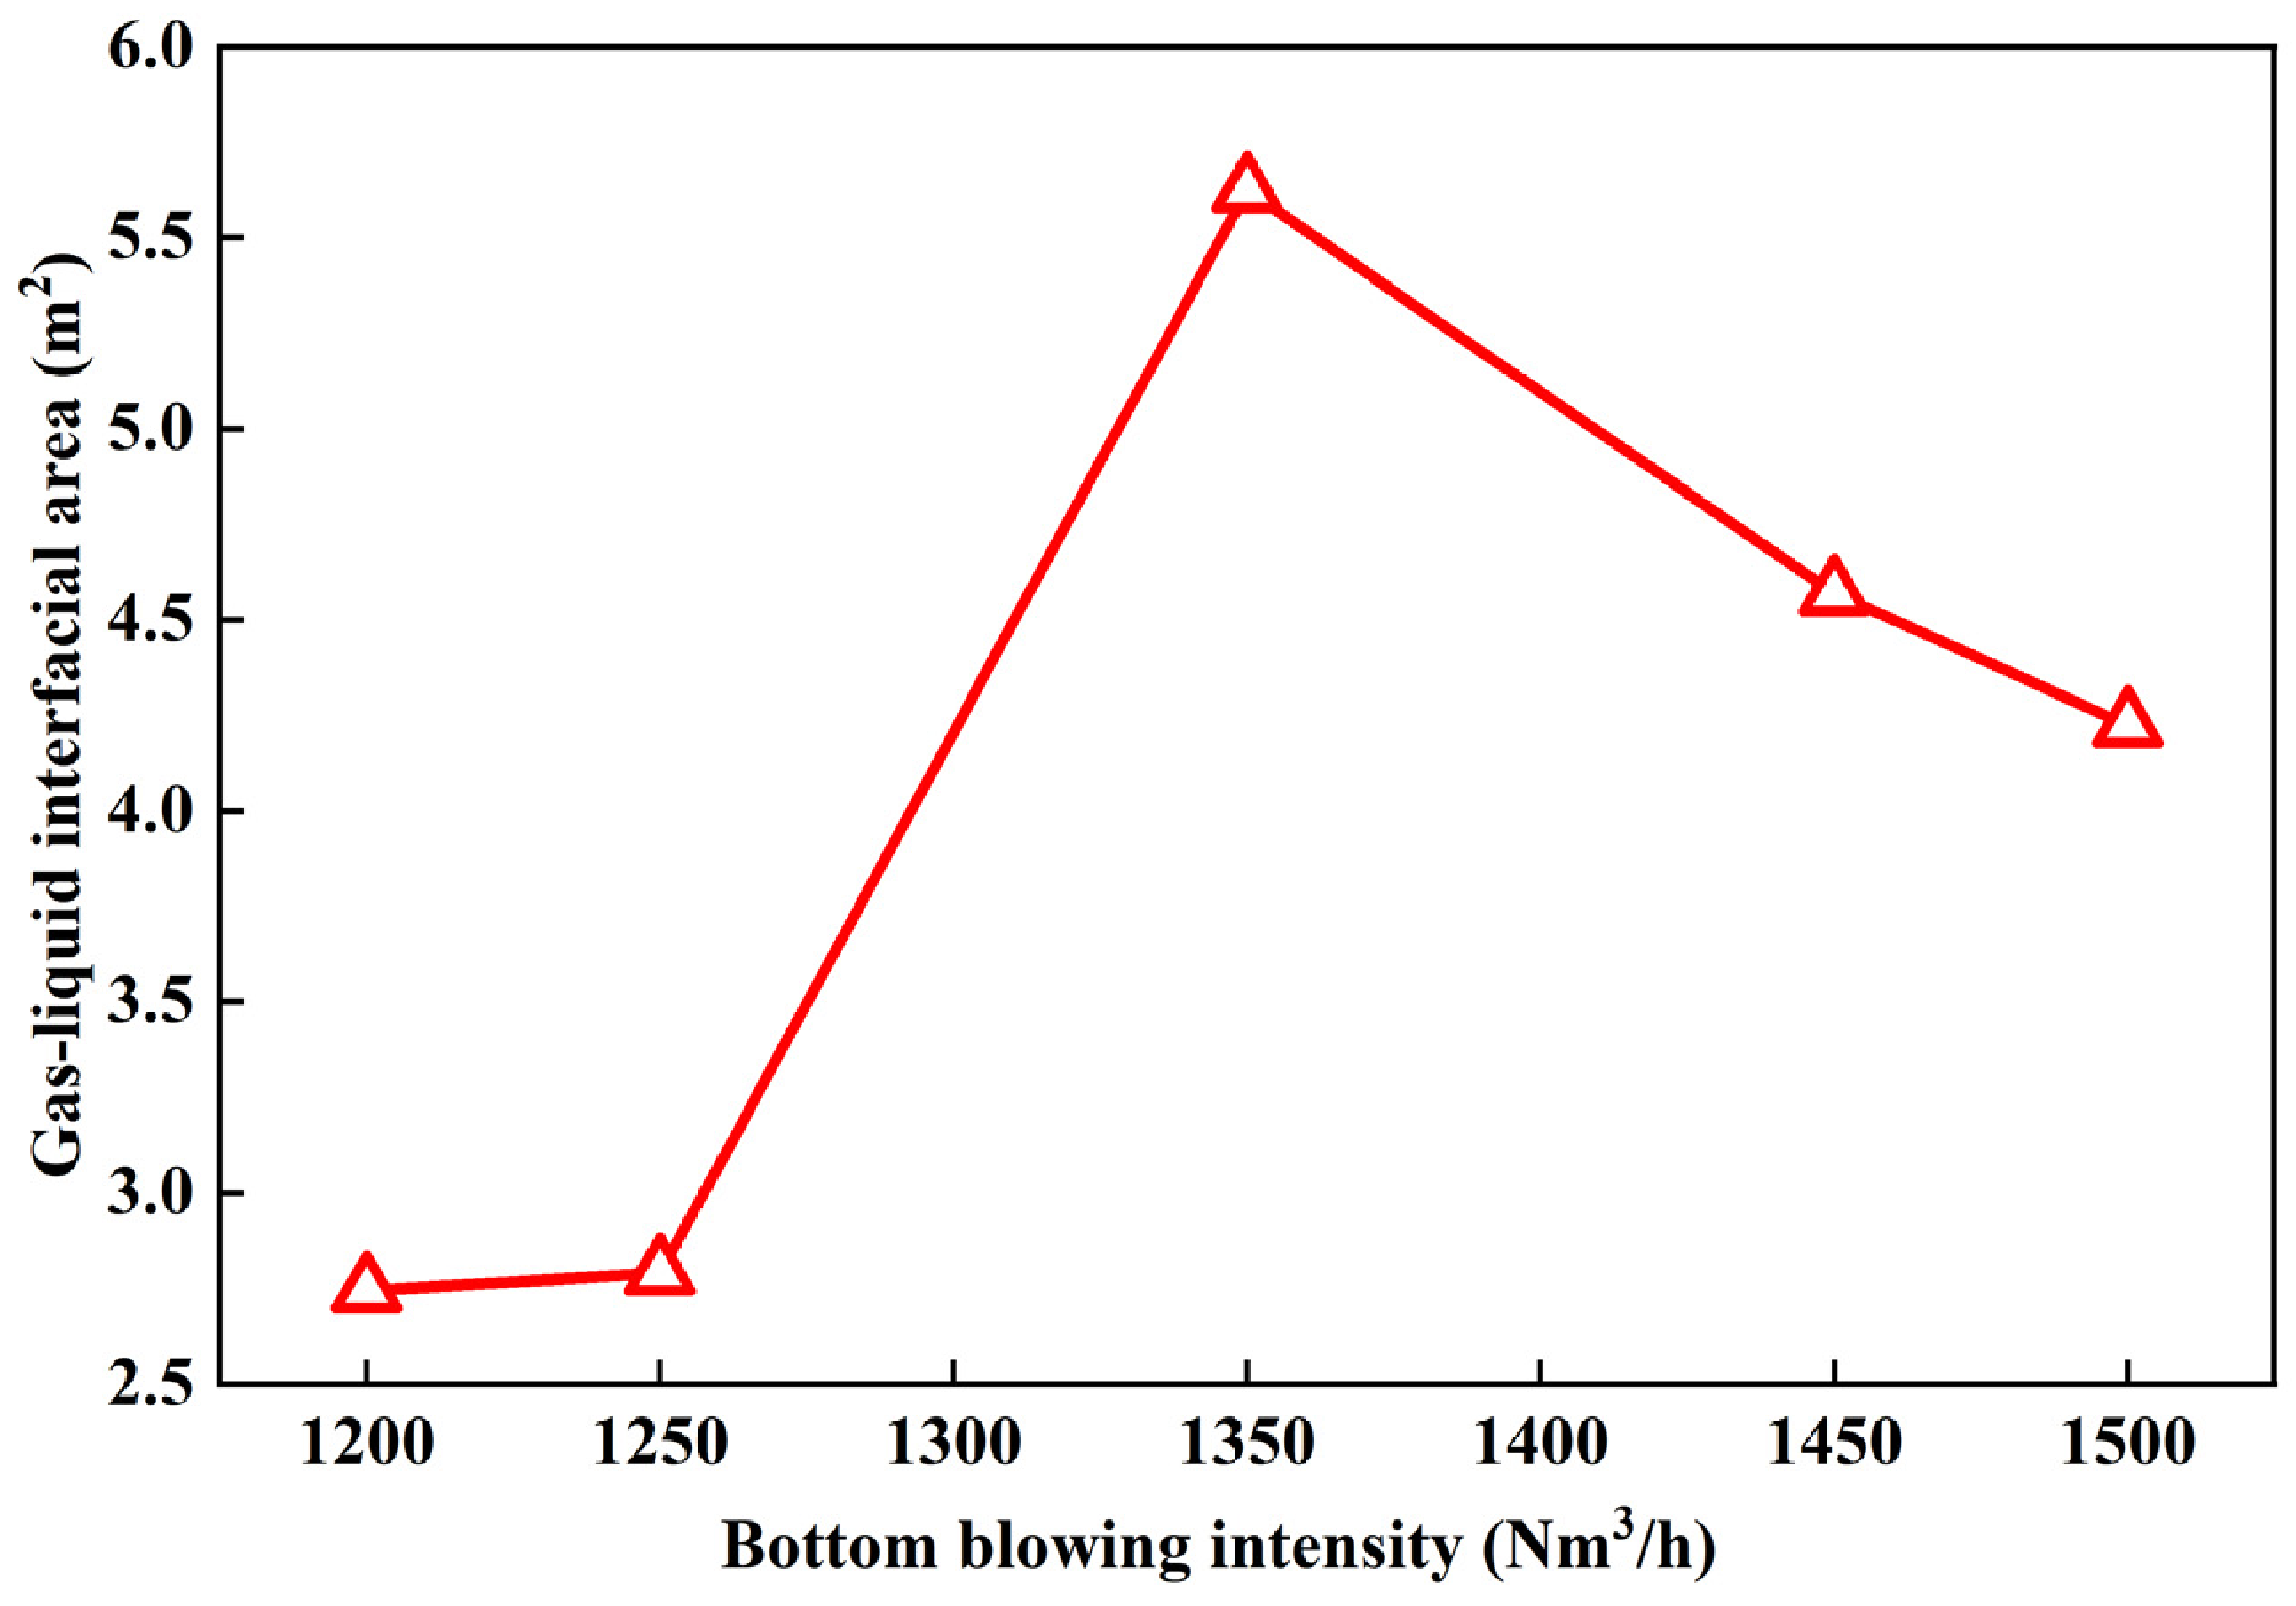
To further quantitatively evaluate the influence of different bottom-blowing flow rates on the reaction efficiency of the bath, the gas–molten metal interfacial area was statistically analyzed under 5 bottom-blowing conditions. The results are shown in Figure 8. It can be observed that as the bottom-blowing flow rate increased from 1200 Nm3/h to 1500 Nm3/h, the overall contact area between gas and liquid showed a trend of first increasing and then decreasing. The gas–liquid interfacial area increased initially and then decreased with increasing bottom-blowing flow rate, reaching a maximum of 5.624 m2 at 1350 Nm3/h. This result indicates that the gas phase exhibited a relatively dispersed distribution within the bath under this condition, providing a larger interfacial area for gas–liquid interactions. Such hydrodynamic characteristics may also create favorable conditions for powder transport and dispersion during industrial injection. However, the calculated gas–liquid interfacial area does not directly represent the contact area between CaO particles and molten metal, nor does it quantify particle dispersion, dissolution, or dephosphorization kinetics. Therefore, the implications for powder behavior should be regarded as qualitative physical interpretations of the simulated flow field.
Figure 8.
Gas–liquid interfacial area at different bottom-blowing flow rates.
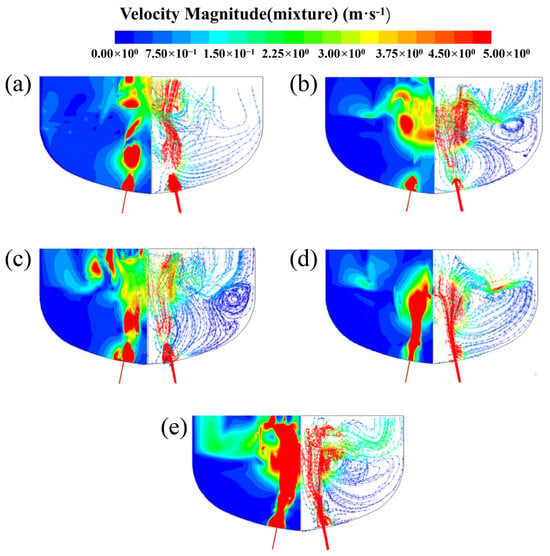
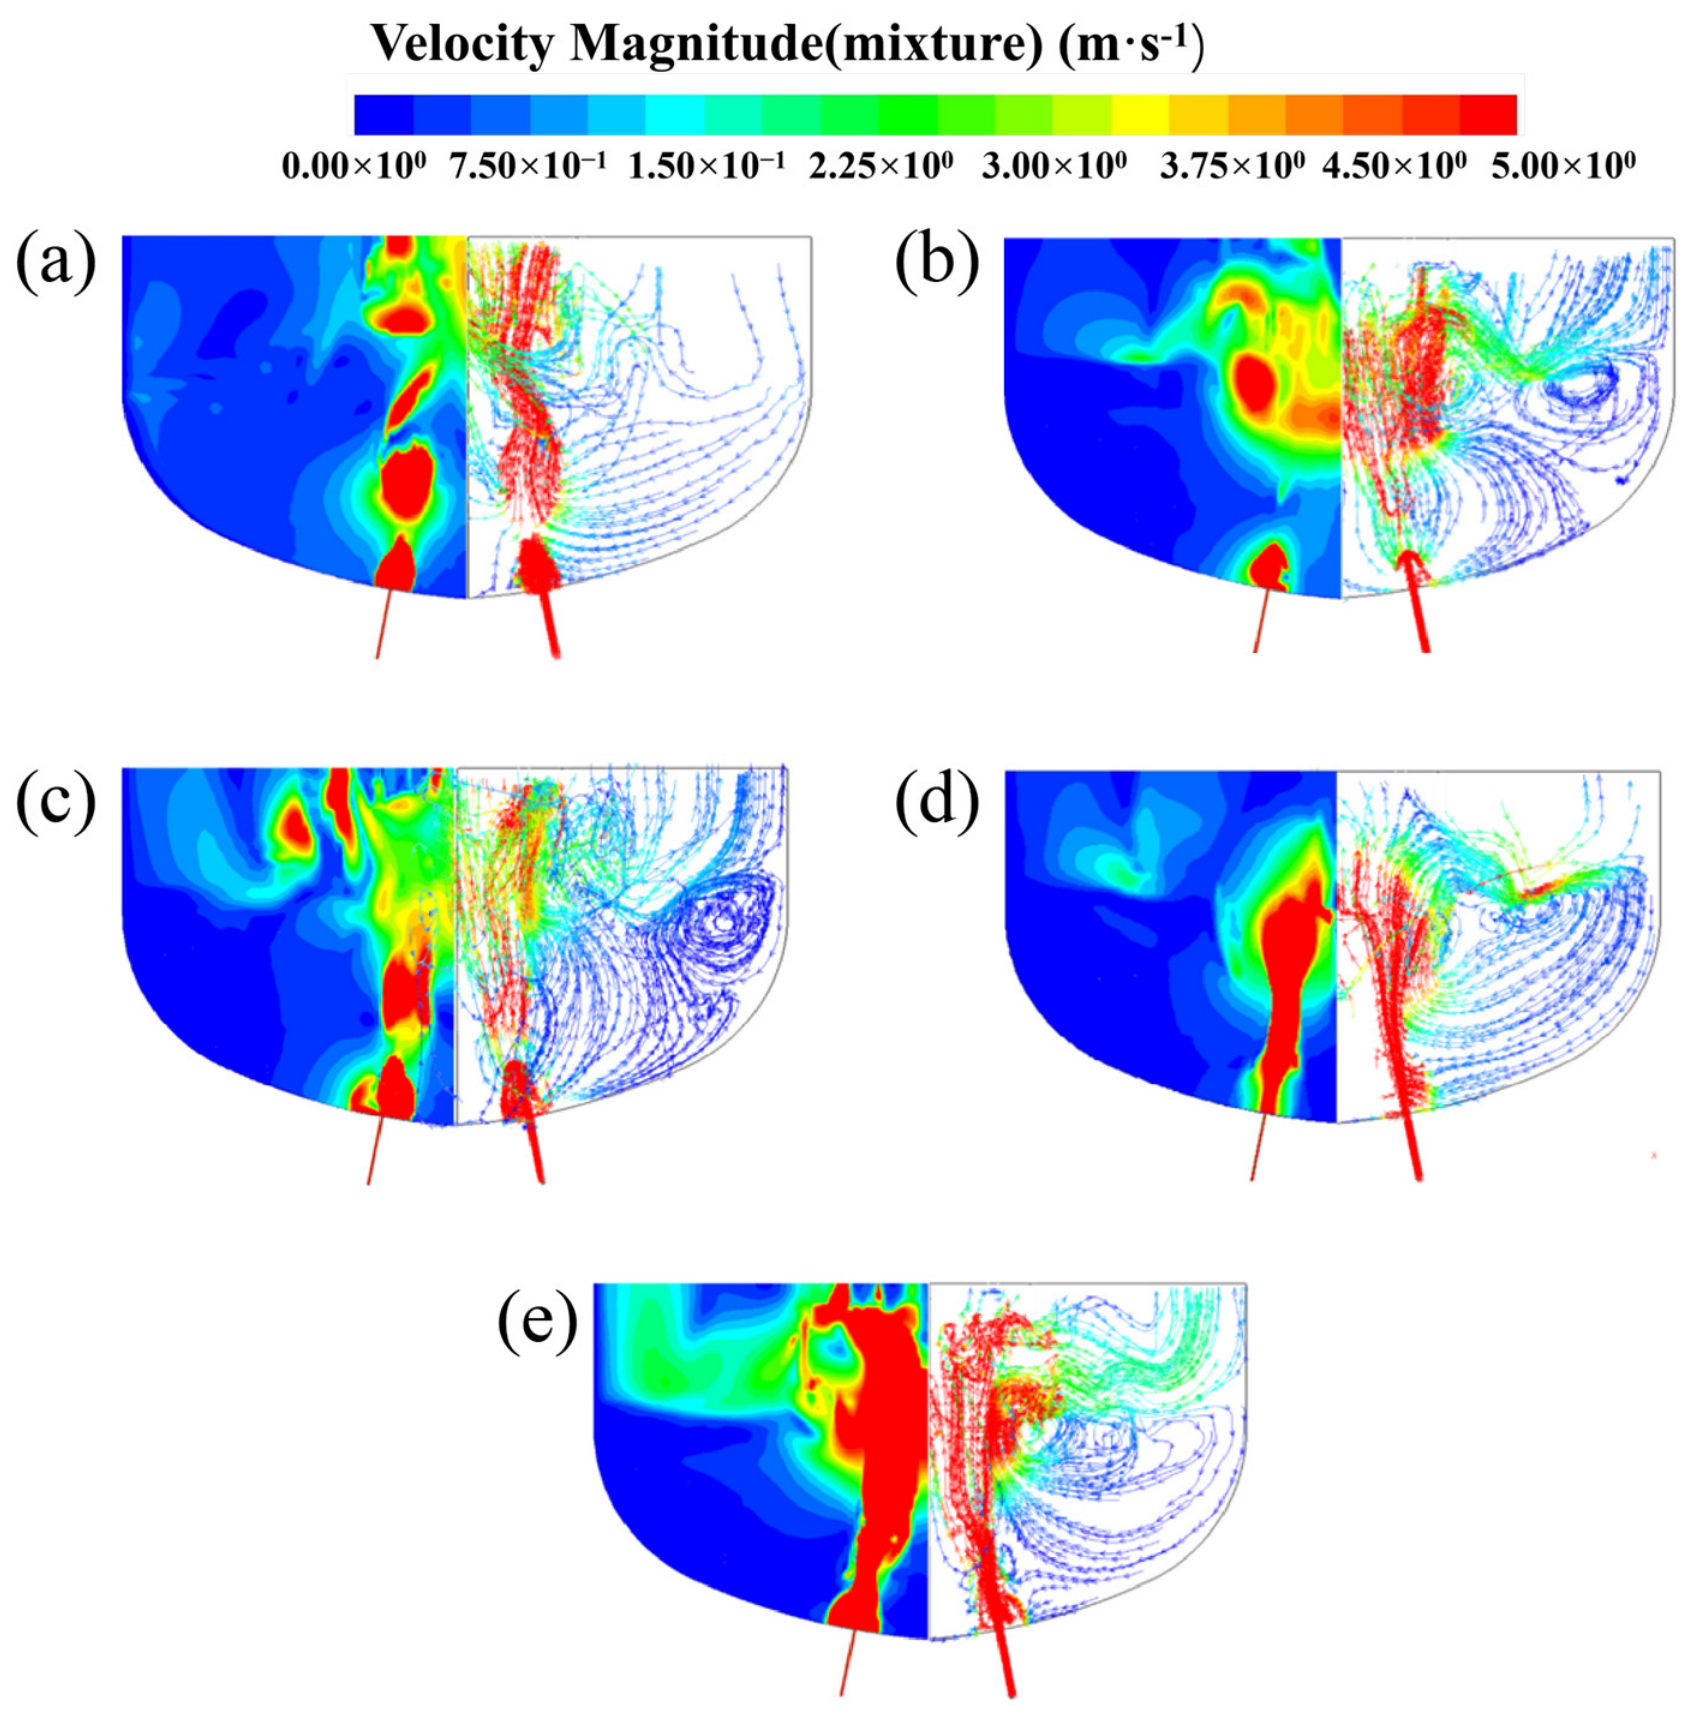
Figure 9 shows the velocity distribution cloud map and streamline map of the longitudinal section at the bottom blowing hole position under different bottom blowing flow rates. Considering that the local velocity of the bottom blowing jet in the bottom blowing process is much higher than the main flow velocity of the molten metal in the bath, to facilitate the comparison of the stirring characteristics under different working conditions, the velocity range in the figure is uniformly set at 0–5 m/s. The results show that the velocity in the area affected by the bottom blowing jet is significantly higher than that in other areas of the bath. As the bottom blowing flow rate increases from 1200 Nm3/h to 1500 Nm3/h, the streamline distribution in the bath shows a trend of first becoming dense and then becoming sparse. At 1250 Nm3/h and 1350 Nm3/h conditions, multiple obvious vortex zones were formed in the bath, indicating that the liquid steel circulated sufficiently and the stirring effect was better; while when the bottom blowing flow rate increased to 1500 Nm3/h, the streamline distribution became sparser again, and the range of low-speed areas expanded significantly, indicating that an excessively high bottom blowing flow rate actually weakened the overall stirring effect of the bottom blowing gas on the bath.
Figure 9.
Velocity magnitude contours (left) and streamlines (right) on the longitudinal section of the molten bath at different bottom-blowing flow rates: (a) 1200 Nm3/h; (b) 1250 Nm3/h; (c) 1350 Nm3/h; (d) 1450 Nm3/h; and (e) 1500 Nm3/h. The color scale represents the local velocity magnitude (m/s), while the streamlines illustrate the flow direction and circulation patterns.
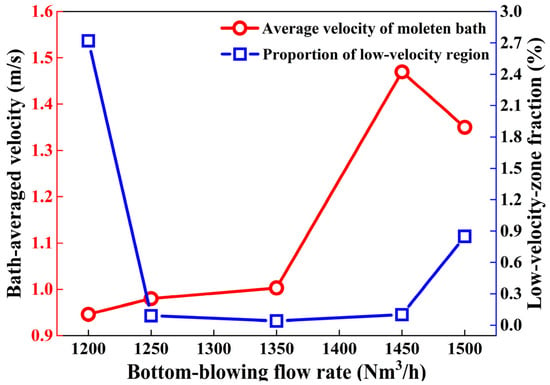
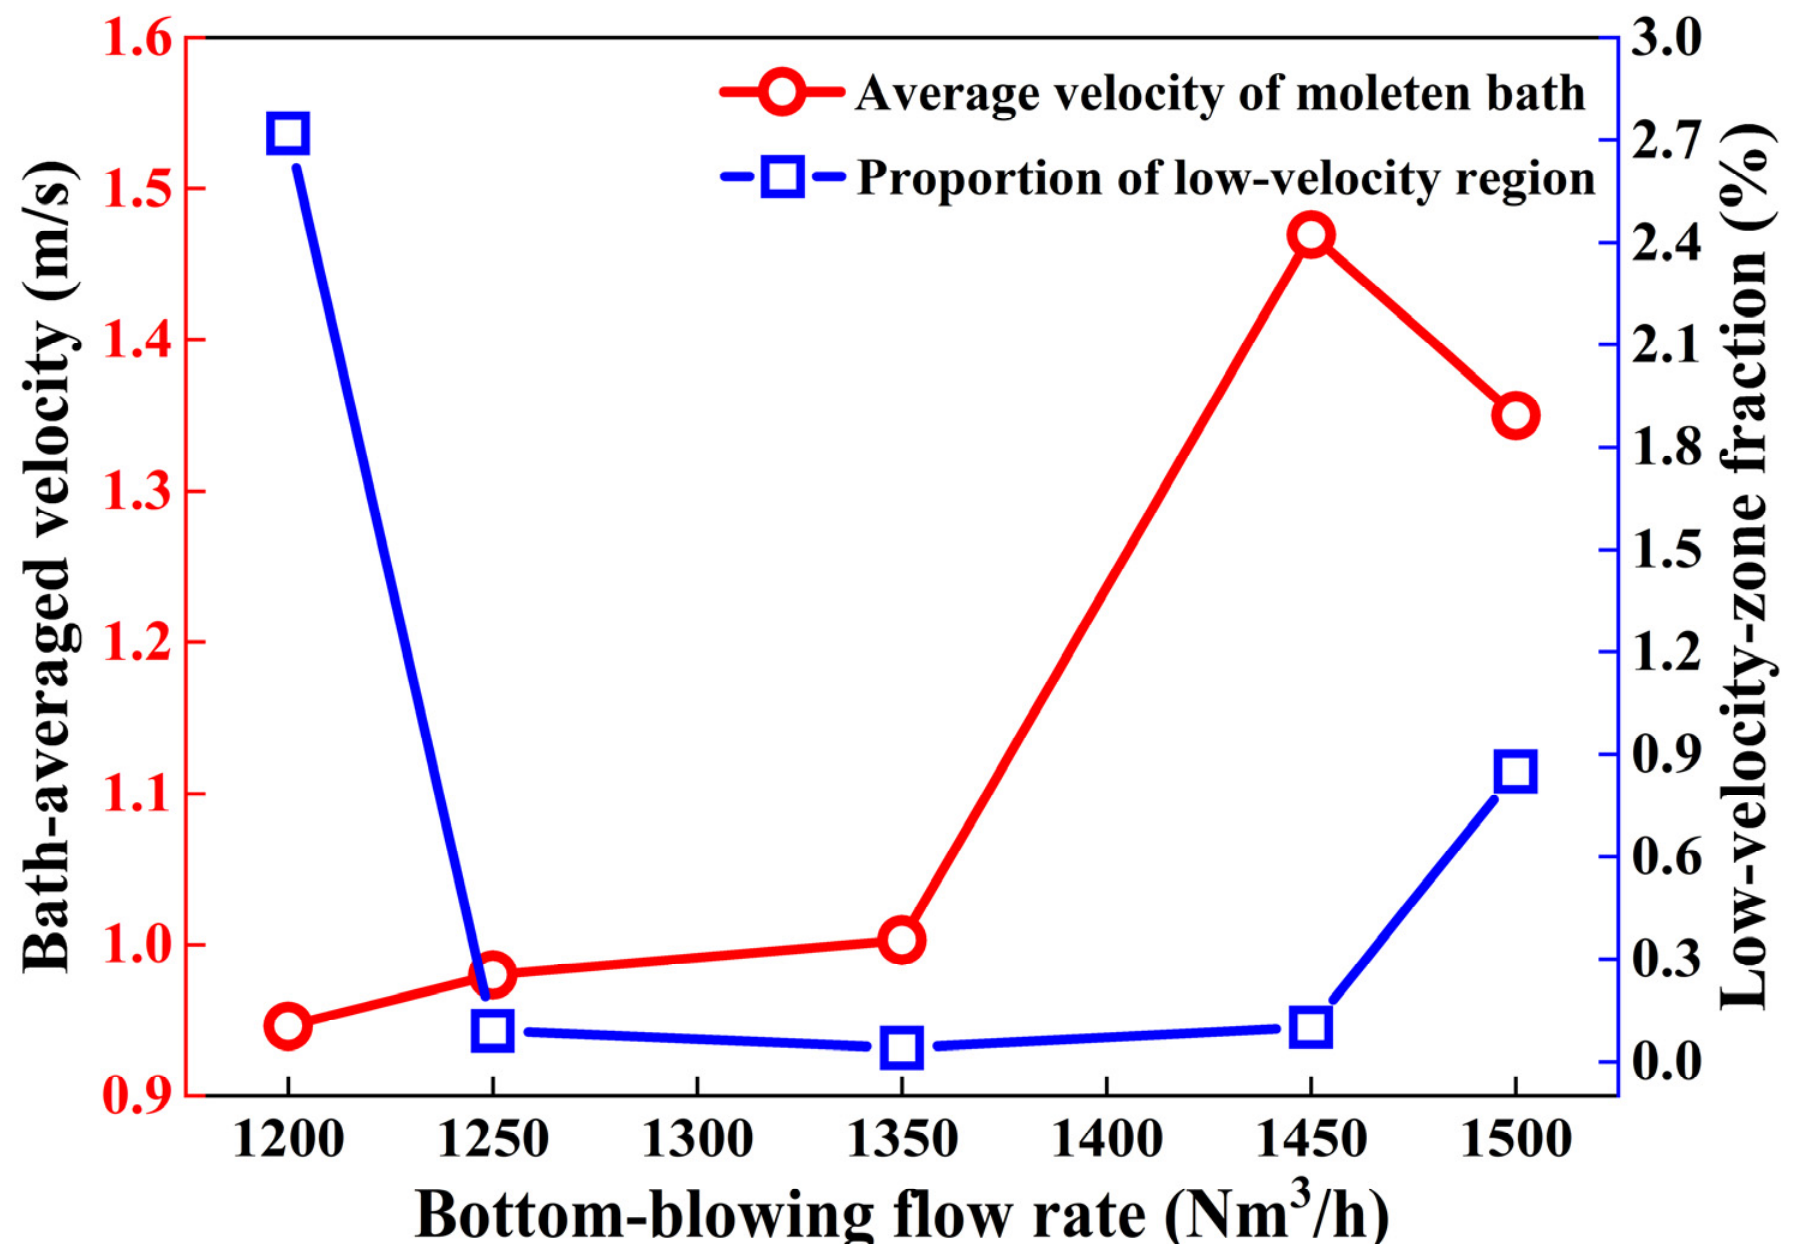
To quantitatively analyze the influence of different bottom-blowing flow rates on the stirring effect of the bath, CFD-Post was used to statistically calculate the average velocity of the bath under each condition. The results are shown in Figure 10. Since the average velocity calculated includes the area of the bottom-blowing gas jet, and the velocity in this area is significantly higher than the main flow velocity of the molten metal within the bath, the overall average velocity of the bath shows an upward trend as the bottom-blowing flow rate increases. When the bottom-blowing flow rate increases from 1200 Nm3/h to 1450 Nm3/h, the average velocity of the bath increases from 0.946 m/s to 1.47 m/s; however, when the bottom-blowing flow rate is further increased to 1500 Nm3/h, the average velocity decreases to 1.35 m/s. This phenomenon indicates that at a bottom-blowing flow rate of 1500 Nm3/h, the bottom-blowing airflow has formed a stable columnar flow, and failed to effectively enhance the overall stirring of the bath. Further, the area with a velocity lower than 0.05 m/s within the bath was defined as the low-velocity region, and its proportion was represented by the volume of the low-speed zone as a proportion of the total volume of the bath. The results show that when the bottom-blowing flow rate is 1350 Nm3/h, the proportion of the low-velocity region in the bath is the smallest, only 0.04%, indicating that in this condition, the molten metal flow within the bath is the most sufficient and the uniformity of stirring is the best. This result is consistent with the analysis results of bubble morphology, gas–liquid contact area, and flow field distribution in the previous text. The water-model and CFD results consistently showed that 1350 Nm3/h maintained dispersed bubble rise while maximizing bath circulation and interfacial contact. This flow rate was therefore selected for the subsequent industrial validation of lime powder injection.
Figure 10.
Bath-averaged velocity and low-velocity-zone fraction at different bottom-blowing flow rates.
4. Industrial Validation
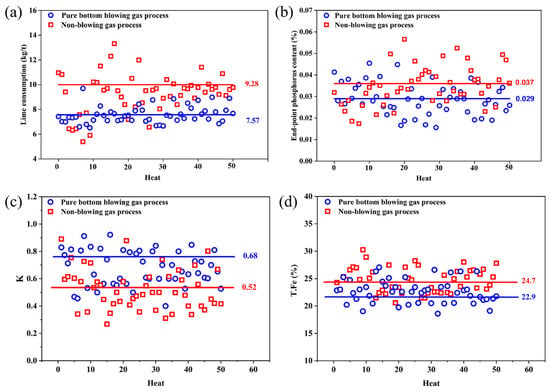
To verify the application effect of the pure bottom blowing gas process under actual production conditions and to examine the engineering applicability of the aforementioned water-model experiment and CFD-based optimization results, an industrial test was conducted on the converter production line of a certain steel mill. In order to evaluate the applicability of the optimized bottom blowing process in industrial settings, production data from a 300 t basic oxygen furnace were used for comparative analysis. The experimental group consisted of 50 runs using the bottom gas blowing process, while the control group included 50 runs without bottom gas blowing. Regular granular lime is added through the top feeding system of the furnace. Apart from the bottom gas used in the study, the main operational conditions of both groups remained consistent. The two industrial trials were carried out under comparable hot-metal charging conditions. The reference hot-metal compositions for the conventional scheme (A) and the bottom-blown gas scheme (B) are summarized in Table 6, while the corresponding endpoint slag compositions are given in Table 7, with a fixed hot-metal-to-scrap mass ratio of 6.93:1. Descriptive comparisons were made for lime consumption, endpoint phosphorus content, calculated lime dissolution rate, and T.Fe content in the endpoint slag among the groups based on their respective means.
Table 6.
The composition and temperature of molten iron entering the furnace.
Table 7.
Endpoint slag composition.
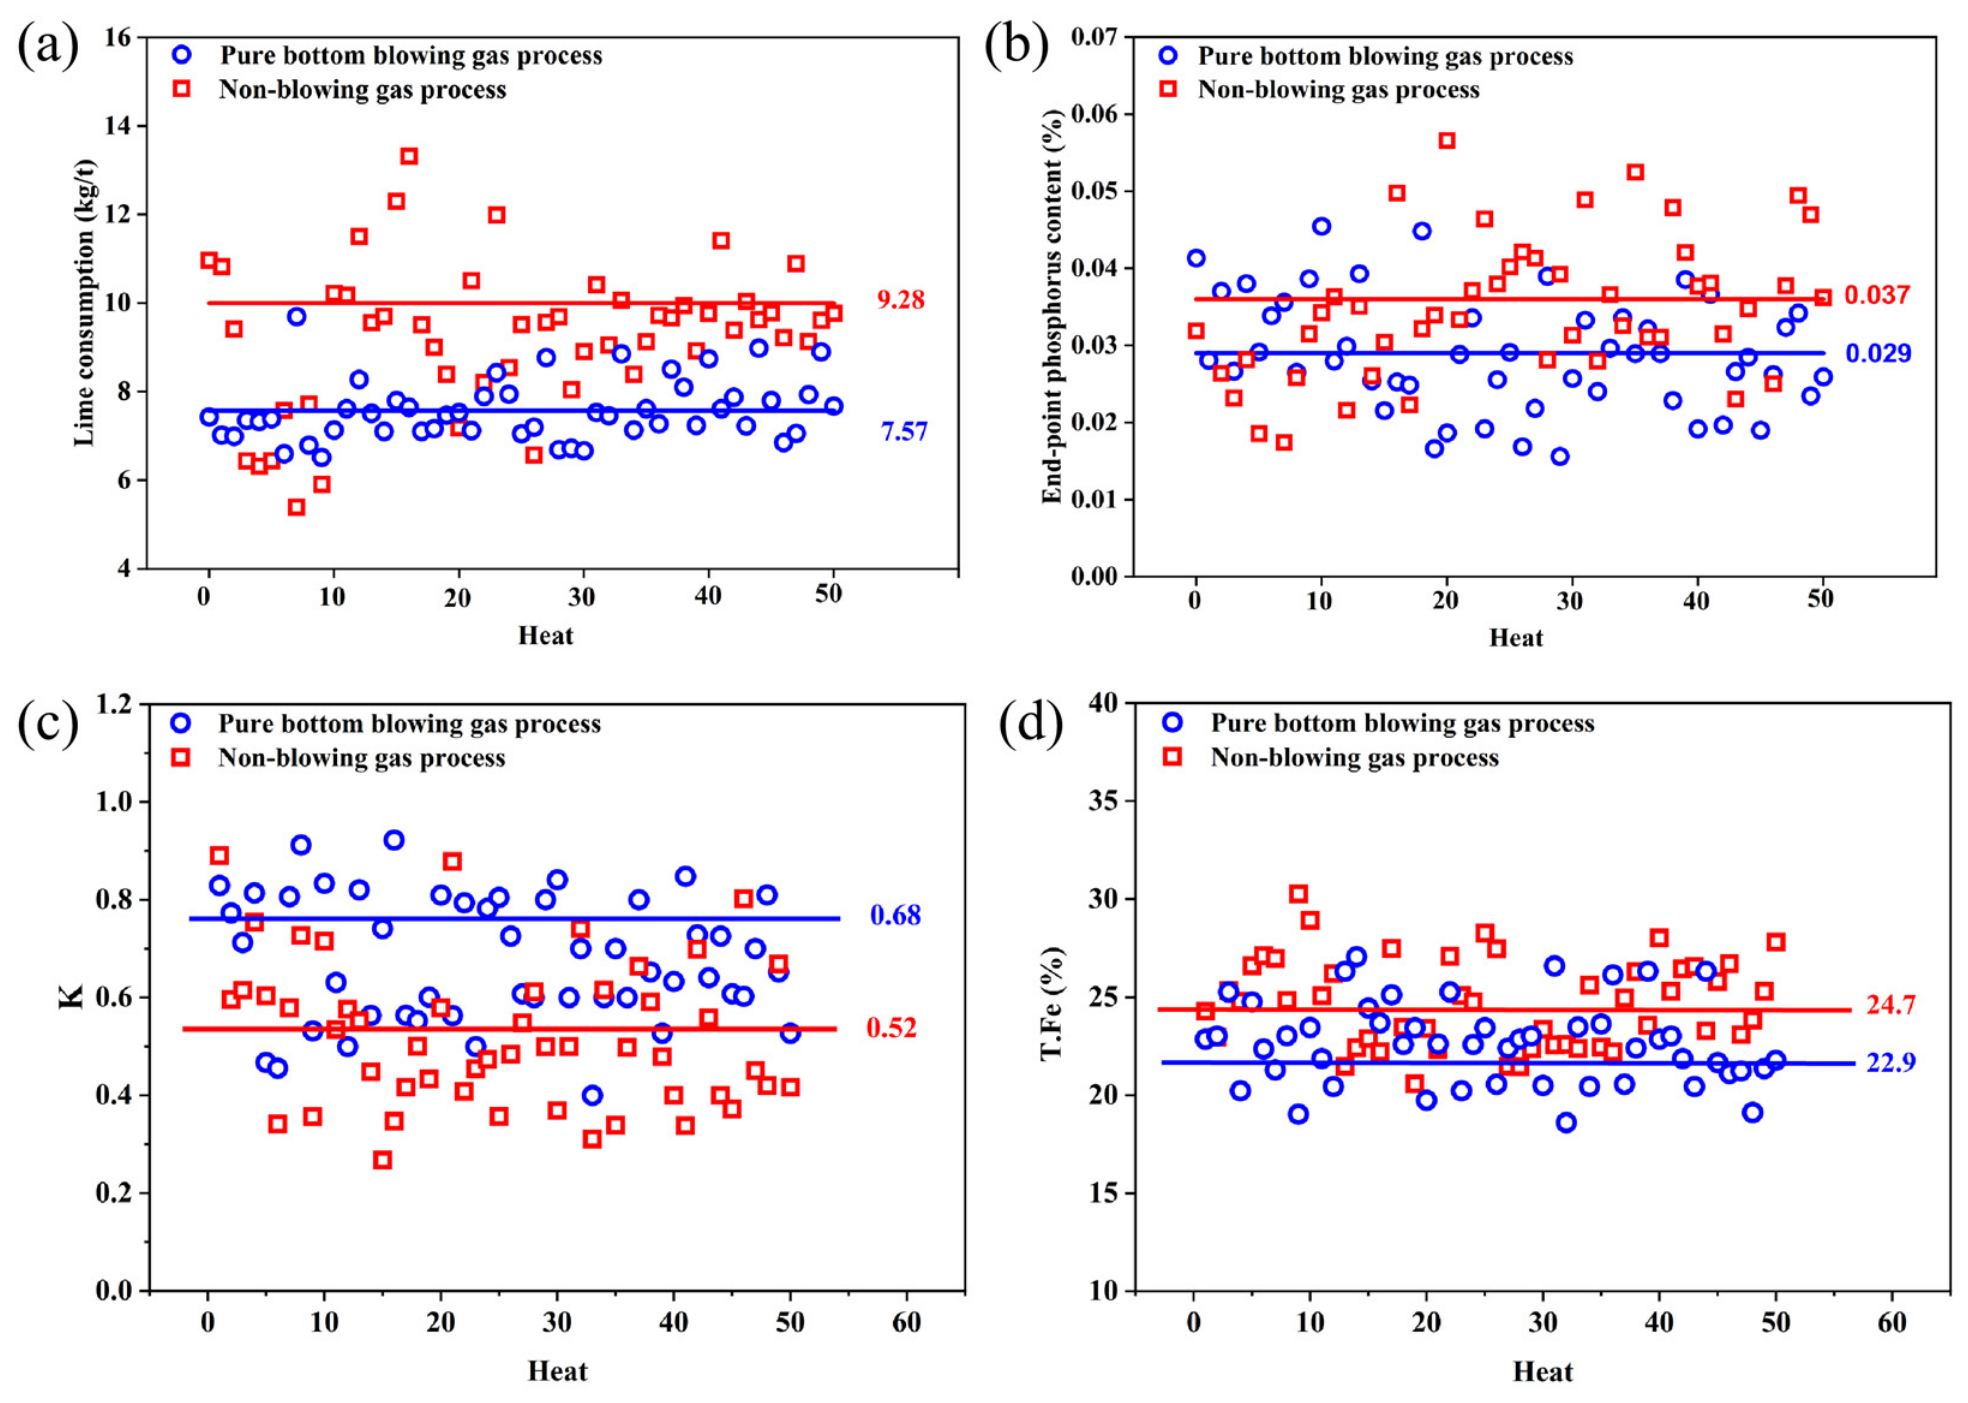
Figure 11 presents the descriptive comparison of the industrial metallurgical indicators between the two operating practices. As shown in Figure 11a, the pure bottom blowing gas group exhibited a lower mean lime consumption of 7.57 kg/t, compared with 9.28 kg/t in the reference group. This difference suggests a potential advantage of the powder-injection practice in reducing lime consumption under the investigated production conditions. Similarly, Figure 11b shows that the mean endpoint phosphorus content was 0.029% in the powder-injection group and 0.037% in the reference group. The lower mean phosphorus content is consistent with more favorable conditions for dephosphorization. However, because the present comparison is descriptive and no inferential statistical analysis was performed, these observations should not be interpreted as establishing a statistically significant improvement in dephosphorization performance.
Figure 11.
Comparison of industrial metallurgical performance between pure bottom blowing gas process and the reference process without gas injection: (a) lime consumption; (b) endpoint phosphorus content; (c) lime dissolution ratio, K; and (d) endpoint total iron, T.Fe.
As shown in Figure 11c, the mean calculated lime dissolution ratio, K, was 0.68 for the pure bottom blowing gas group, compared with 0.52 for the reference group. This higher mean value indicates a favorable trend in the calculated lime utilization indicator. Nevertheless, the particle-scale transport and dissolution processes were not directly measured or simulated in this study. Regarding endpoint slag composition, Figure 11d shows that the mean T.Fe content was 22.9% in the powder-injection group, compared with 24.7% in the reference group. This observation suggests that the lower endpoint phosphorus content was not accompanied by a higher mean slag T.Fe content under the investigated conditions. These differences are descriptive and should be interpreted in the context of the operating conditions and limitations of the industrial comparison.
To further evaluate the impact of the pure bottom blowing gas process on the utilization efficiency of lime, the ratio of the theoretical consumption of lime to the actual addition amount is defined as the lime dissolution ratio, K. It is calculated as the theoretical lime requirement divided by the actual lime addition. The calculation formula is shown in Equation (18) [30].
In Equation (18), R is the slag basicity; W is the mass of each material, kg; [Si] is the mass fraction of silicon in each material,%; and the subscripts metal, aux, and steel denote hot metal, auxiliary materials, and steel liquid, respectively. Auxiliary materials include lime, ferrosilicon, and other silicon-bearing additions. MSiO2 and MSi are the molar masses of SiO2 and Si, kg/mol, respectively. Based on Equation (18), the lime dissolution ratios of the semi-steel pure bottom blowing gas process and the control process were calculated. The results are shown in Figure 11c. The average K value of the pure bottom blowing gas process increased from 0.52 of the control process to 0.68, with an increase of 0.16. This indicates that this process showed a higher mean lime dissolution ratio. The improvement in the calculated lime dissolution ratio can be interpreted in relation to the favorable hydrodynamic conditions identified by the water-model experiments and CFD simulations. Enhanced bath circulation and gas dispersion may facilitate the distribution of injected CaO powder and its interaction with the molten bath and slag, thereby promoting lime utilization and slag formation. Although the detailed particle trajectories and dissolution kinetics were not explicitly resolved, the combined hydrodynamic and industrial observations provide supporting evidence for this interpretation. The increase in lime dissolution ratio directly leads to a reduction in lime consumption and a decrease in slag production, which is of positive significance for improving the dephosphorization effect, reducing smelting consumption, and increasing economic benefits.
In addition, the change in the endpoint slag total Fe (T.Fe) also indicates that this process has a good overall metallurgical effect. As shown in Figure 11d, the T.Fe under the pure bottom blowing gas process is generally lower than that of the control process. The average value is approximately 22.9%, while that of the control process is approximately 24.7%, a reduction of 1.8 percentage points. The T.Fe can generally reflect the iron oxide loss level in the slag. Its reduction indicates that the pure bottom blowing gas process not only strengthens dephosphorization and improves the lime utilization, but also does not lead to an increase in additional iron loss, instead helping to reduce the iron content in the slag and increase the metal yield. This shows that the optimized bottom-blowing system not only improves the reaction kinetics conditions inside the furnace, but also helps to achieve a reasonable distribution of oxygen potential utilization, achieving a better balance between the dephosphorization required oxidation environment and the reduction in metal loss.
Overall, the industrial comparison showed lower mean lime consumption, endpoint phosphorus content, and slag T.Fe, together with a higher mean calculated lime dissolution ratio, for the pure bottom blowing gas group. These observations are consistent with the favorable hydrodynamic conditions identified by the water-model experiments and CFD simulations. However, the industrial results are based on a descriptive comparison, and the effects of individual operating variables cannot be completely isolated. Therefore, the observed differences should be regarded as preliminary evidence of the potential metallurgical benefits of the optimized powder-injection practice rather than definitive proof of statistically significant improvements.
5. Conclusions
A combined water-model, CFD, and industrial investigation was conducted to evaluate the influence of bottom-blowing flow rate on bath hydrodynamics and metallurgical performance in a 300 t BOF employing O2–CO2–CaO powder injection. The study examined the relationship between experimentally observed plume behavior, CFD-derived hydrodynamic indicators, and industrial operating performance. The principal conclusions are summarized as follows:
- (1)
- The water-model experiments showed that the bath homogenization time initially decreased and then increased with increasing bottom-blowing flow rate. Among the seven investigated conditions, the minimum homogenization time of 35.90 s was obtained at 1350 Nm3/h. At higher flow rates of 1450–1500 Nm3/h, increased bubble coalescence and the development of concentrated gas-flow structures were observed, accompanied by less favorable bath-mixing characteristics. These observations indicate that increasing the bottom-blowing intensity does not necessarily improve bath mixing.
- (2)
- The CFD simulations showed a non-monotonic variation in the evaluated hydrodynamic indicators with increasing bottom-blowing flow rate. Among the simulated conditions, the gas–liquid interfacial area reached 5.624 m2 and the low-velocity-zone fraction decreased to 0.04% at 1350 Nm3/h. At higher flow rates, gas flow became increasingly concentrated, accompanied by reduced lateral gas dispersion. These trends were qualitatively consistent with the water-model observations regarding plume development and mixing behavior. However, this agreement was limited to the hydrodynamic characteristics considered in the two models and did not constitute validation of CaO particle transport or dissolution.
- (3)
- The industrial comparison showed lower mean lime consumption, endpoint phosphorus content, and slag T.Fe, together with a higher mean calculated lime dissolution ratio, under the bottom-blown O2–CO2–CaO powder-injection practice than under the reference operating practice. These results suggest potential metallurgical benefits under the investigated production conditions. However, the industrial trials were not designed to compare multiple bottom-blowing flow rates systematically.
- (4)
- Based on the combined assessment of water-model mixing characteristics and CFD-derived hydrodynamic indicators, 1350 Nm3/h was identified as a favorable candidate among the investigated bottom-blowing conditions. Nevertheless, this value should not be regarded as a universally applicable or conclusively established industrial optimum. Future studies should incorporate particle transport and reactive multiphase-flow modeling, together with systematic industrial comparisons at different bottom-blowing flow rates, to establish more robust relationships between hydrodynamic characteristics and metallurgical performance.
It should be noted that the present CFD model does not explicitly account for CaO particle transport, dispersion, or dissolution. Therefore, the proposed influence of plume behavior on powder transport is based on qualitative physical interpretation rather than direct particle-scale simulation. Future investigations incorporating gas–liquid–solid coupling and particle-tracking models would be valuable for quantitatively evaluating CaO particle trajectories, residence times, and dissolution behavior under different bottom-blowing conditions.
Author Contributions
Conceptualization, Z.L.; methodology, Z.L.; validation, C.W.; formal analysis, B.T., Z.M. and R.Z.; investigation, B.T., Z.M. and R.Z.; resources, K.D.; data curation, Z.L., C.W. and Z.M.; writing—original draft preparation, Z.L. and C.W.; writing—review and editing, K.D., F.L., and G.W.; supervision, K.D.; project administration, K.D.; funding acquisition, K.D., F.L., and G.W. All authors have read and agreed to the published version of the manuscript.
Funding
This work was supported by the Fundamental and Interdisciplinary Disciplines Breakthrough Plan of the Ministry of Education of China (No. JYB2025XDXM405), the Jing–Jin–Ji Regional Integrated Environmental Improvement-National Science and Technology (No. 2025ZD1206102), the National Natural Science Foundation of China (No. 51974024), the National Key R&D Program of China (No. 2020YFC1910002), and the National Natural Science Foundation of China (52474343).
Data Availability Statement
The original contributions presented in this study are included in the article. Further inquiries can be directed to the corresponding authors.
Conflicts of Interest
Author Chunyang Wang was employed by the company Central Iron and Steel Institute Co., Ltd., Ruimin Zhao was employed by the company Beijing Metallurgical Equipment Research Design Institute Co., Ltd. The remaining authors declare that the research was conducted in the absence of any commercial or financial relationships that could be construed as a potential conflict of interest.
References
- Penz, F.M.; Schenk, J.; Ammer, R.; Klösch, G.; Pastucha, K. Evaluation of the Influences of Scrap Melting and Dissolution During Dynamic Linz–Donawitz (LD) Converter Modelling. Processes 2019, 7, 186. [Google Scholar] [CrossRef] [Scilit]
- Ogasawara, Y.; Miki, Y.; Uchida, Y.; Kikuchi, N. Development of High Efficiency Dephosphorization System in Decarburization Converter Utilizing FetO Dynamic Control. ISIJ Int. 2013, 53, 1786–1793. [Google Scholar] [CrossRef] [Scilit]
- Barui, S.; Mukherjee, S.; Srivastava, A.; Chattopadhyay, K. Understanding Dephosphorization in Basic Oxygen Furnaces (BOFs) Using Data Driven Modeling Techniques. Metals 2019, 9, 955. [Google Scholar] [CrossRef] [Scilit]
- Hamano, T.; Horibe, M.; Ito, K. The Dissolution Rate of Solid Lime into Molten Slag Used for Hot-Metal Dephosphorization. ISIJ Int. 2004, 44, 263–267. [Google Scholar] [CrossRef] [Scilit]
- Kikuchi, N.; Matsui, A.; Uchida, Y. Effect of Lime Dissolution Rate in Slag on Hot Metal Dephosphorization. ISIJ Int. 2020, 60, 922–929. [Google Scholar] [CrossRef] [Scilit]
- Xia, Y.; Zhang, X.; Li, J.; Fan, D. Effect of MgO on the Dissolution Behavior of Lime in Dephosphorization Slags for Double Slag Refining in Basic Oxygen Furnace. Steel Res. Int. 2026, 97, 1136–1142. [Google Scholar] [CrossRef] [Scilit]
- Amini, S.; Brungs, M.; Ostrovski, O. Dissolution of Dense Lime in Molten Slags under Static Conditions. ISIJ Int. 2007, 47, 32–37. [Google Scholar] [CrossRef] [Scilit]
- Martín, M.; Rendueles, M.; Díaz, M. Global and Local Mixing Determinations for Steel Converter Analysis. Chem. Eng. Sci. 2005, 60, 5781–5791. [Google Scholar] [CrossRef] [Scilit]
- Quiyoom, A.; Ajmani, S.K.; Buwa, V.V. Optimization of Bottom Tuyere Configuration for Basic Oxygen Furnace Steelmaking through Experiments and CFD Simulations. Chem. Eng. J. 2018, 346, 127–142. [Google Scholar] [CrossRef] [Scilit]
- Maia, B.T.; Imagawa, R.K.; Petrucelli, A.C.; Tavares, R.P. Effect of Blow Parameters in the Jet Penetration by Physical Model of BOF Converter. J. Mater. Res. Technol. 2014, 3, 244–256. [Google Scholar] [CrossRef] [Scilit]
- Cai, X.; Duan, H.; Xu, A.; Chen, W.; Zhang, L. Mathematical Modeling on the Multiphase Flow during Top–Bottom Combined Blowing Basic Oxygen Furnace Steelmaking Process. Steel Res. Int. 2025, 96, 2400256. [Google Scholar] [CrossRef] [Scilit]
- Miyata, M.; Tamura, T.; Higuchi, Y. Development of Hot Metal Dephosphorization with Lime Powder Top Blowing: Part 2. High Blowing Rate. ISIJ Int. 2017, 57, 1756–1761. [Google Scholar] [CrossRef] [Scilit]
- Haida, O.; Takeuchi, S.; Nozaki, T.; Emi, T.; Sudo, F. Mechanism of Hot Metal Dephosphorization by Injecting Lime Base Fluxes into Bottom Blown Converter. Tetsu-to-Hagane 1982, 68, 1744–1753. [Google Scholar] [CrossRef] [Scilit] [PubMed]
- Ono, H.; Masui, T.; Mori, H. Dephosphorization Kinetics and Reaction Region in Hot Metal during Lime Injection with Oxygen. Trans. Iron Steel Inst. Jpn. 1985, 25, 133–141. [Google Scholar] [CrossRef] [Scilit]
- Zhang, K.; Wang, S.; Li, C.; Yuan, Z.; Zhang, Y. Numerical simulation of multiphase flow induced by bottom blowing limestone powder in converter steelmaking. Powder Technol. 2025, 449, 120369. [Google Scholar] [CrossRef] [Scilit]
- Zhang, Y.; Hu, S.; Wang, D.; Wang, C.; Zhu, R.; Wang, D. Stirring power and metallurgical effect of converter steelmaking with O2–CO2 bottom blowing. China Metall. 2024, 34, 99–107. [Google Scholar] [CrossRef]
- Chen, R.; Cheng, C.; Hu, Y.; Zhao, J.; Zuo, Z.; Xu, J.; Wang, H. Study on bubble formation and heat transfer characteristics and enhanced heat transfer during bottom-blown gas agitation. Appl. Therm. Eng. 2024, 247, 123066. [Google Scholar] [CrossRef] [Scilit]
- Miyata, M.; Tamura, T.; Higuchi, Y. Development of Hot Metal Dephosphorization with Lime Powder Top Blowing: Part 1. Low Blowing Rate. ISIJ Int. 2017, 57, 1751–1755. [Google Scholar] [CrossRef] [Scilit]
- Li, W.; Zhu, R.; Dong, K.; Zhang, J.; Feng, C.; Han, B.; Wu, X. Physical Simulation and Industrial Testing of Bottom-Blown O2–CaO Converter for Steelmaking Process. Metall. Mater. Trans. B 2020, 51, 1060–1069. [Google Scholar] [CrossRef] [Scilit]
- Feng, C.; Dong, J.; Zhu, R.; Yang, H. Development and Application of Converter COMI-B Technology: A New Way of CO2 Utilization. Metals 2023, 13, 926. [Google Scholar] [CrossRef] [Scilit]
- Chen, M.; Deng, H.; Wang, N.; Zhang, G. Limestone Dissolution in Converter Slag: Kinetics and Influence of Decomposition Reaction. ISIJ Int. 2018, 58, 2271–2279. [Google Scholar] [CrossRef] [Scilit]
- Kadrolkar, A.; Dogan, N. Model Development for Refining Rates in Oxygen Steelmaking: Impact and Slag-Metal Bulk Zones. Metals 2019, 9, 309. [Google Scholar] [CrossRef] [Scilit]
- Naidu, T.S.; Sheridan, C.M.; van Dyk, L.D. Basic Oxygen Furnace Slag: Review of Current and Potential Uses. Miner. Eng. 2020, 149, 106234. [Google Scholar] [CrossRef] [Scilit]
- Gonçalves, F.; Ribeiro, M.; Correa, R.; Silva, R.; Braga, B.; Maia, B.; Tavares, R.; Carvalho, D.; Schenk, J. Measurements Methodologies for Basic Oxygen Furnace Cold Modeling. J. Mater. Res. Technol. 2021, 13, 834–856. [Google Scholar] [CrossRef] [Scilit]
- Kumar, A.; Malathi, M.; Godiwalla, K.M.; Chacko, E.Z.; Ajmani, S.K.; Ranganathan, S. Cold Model Study of Submerged Peripheral Gas Bubbling from a Cylindrical Dispenser. ISIJ Int. 2014, 54, 2239–2247. [Google Scholar] [CrossRef] [Scilit]
- Wang, D.; Liu, Y.; Zhang, Z.; Shao, P.; Zhang, T.A. Dimensional Analysis of Average Diameter of Bubbles for Bottom Blown Oxygen Copper Furnace. Math. Probl. Eng. 2016, 2016, 4170371. [Google Scholar] [CrossRef] [Scilit]
- Cho, S.-M.; Thomas, B.G.; Kim, S.-H. Bubble Behavior and Size Distributions in Stopper-Rod Nozzle and Mold during Continuous Casting of Steel Slabs. ISIJ Int. 2018, 58, 1443–1452. [Google Scholar] [CrossRef] [Scilit]
- Javurek, M.; Wincor, R. Bubbly Mold Flow in Continuous Casting: Comparison of Numerical Flow Simulations with Water Model Measurements. Steel Res. Int. 2020, 91, 2000415. [Google Scholar] [CrossRef] [Scilit]
- Liu, Z.; Cheng, S.; Peng, J. Simulation of Fluid Flow in the Top–Bottom Combined Blowing Converter. Metals 2024, 14, 56. [Google Scholar] [CrossRef] [Scilit]
- Wang, C.; Zhu, R.; Dong, K.; Wei, G.; Ren, X.; Zhou, Y.; Xue, Z.; Feng, C. Research on Mechanism Change of Temperature Effect on Dephosphorization in the Bottom-Blown O2–CaO Process of Semi-Steelmaking. J. Mater. Res. Technol. 2023, 24, 8725–8734. [Google Scholar] [CrossRef] [Scilit]

Disclaimer/Publisher’s Note: The statements, opinions and data contained in all publications are solely those of the individual author(s) and contributor(s) and not of MDPI and/or the editor(s). MDPI and/or the editor(s) disclaim responsibility for any injury to people or property resulting from any ideas, methods, instructions or products referred to in the content. |
© 2026 by the authors. Licensee MDPI, Basel, Switzerland. This article is an open access article distributed under the terms and conditions of the Creative Commons Attribution (CC BY) license.