


Abstract
Silicon is an essential material for metallurgical and energy applications, yet its conventional carbothermic production is associated with high CO2 emissions. The SisAl process offers a low-emission alternative based on the reduction of SiO2 using aluminium as the reductant, followed by slag refining of the resulting Si–Ca–Al alloy. This study investigates the refining stage using CaO–SiO2-based slags with varying SiO2 contents and slag-to-alloy ratios. Equilibrium simulations and laboratory-scale experiments in an induction furnace were conducted to evaluate the influence of these parameters on the normalized Si concentration in the alloy. Increasing the initial SiO2 content of the slag and the slag-to-alloy ratio generally resulted in higher normalized Si concentrations in the recovered alloy. At 60 wt.% SiO2 and a slag-to-alloy ratio of 5:1, an average normalized silicon content of 97.72 wt.% was achieved, with residual Ca and Al contents of 0.78 and 0.17 wt.%, respectively, while individual experiments exceeded 98 wt.% Si. Phase separation was identified as an additional factor affecting refining performance. The results demonstrate the feasibility of the investigated slag-refining approach and provide suitable process parameters for further development of the SisAl process.
1. Introduction
Silicon serves multiple critical applications across its different purity levels. Polycrystalline silicon, a high purity silicon, is indispensable as a semiconductor material for microchips and transistors and plays a key role in the production of photovoltaic cells for solar panels. Metallurgical-grade silicon typically has a purity of approximately 99 wt.% and is used in metallurgical processes as a deoxidizing agent and alloying material [1,2,3,4].
The primary production process for metallurgical-grade silicon is the carbothermic reduction of quartz in a submerged arc furnace, which is associated with CO2 emissions of approximately 3.26 kg CO2 per kg of silicon produced. Consequently, the development of lower emission process designs for the production of silicon could have a substantial impact on future climate mitigation efforts [5,6].
In conventional silicon production, slags are both a by-product and an additive. They are formed during the carbothermic reduction of quartz in submerged arc furnaces and during oxidative ladle refining of molten silicon after the carbothermic process [7,8]. Slags can also be introduced manually for the removal of certain impurities, e.g., boron [9].
In the novel SisAl process, silicon is produced utilizing aluminium as a reductant for SiO2 instead of carbonaceous reductants. It consists of a first reduction step toward a silicon-containing alloy and a second oxidative slag-refining step for the production of metallurgical-grade silicon. This study investigates the fundamentals of the refining step and pursues the optimization of key process parameters, including temperature, slag composition, holding time, and slag-to-alloy ratio. Since slag liquidus temperature and viscosity are strongly dependent on slag composition and can significantly affect refining performance, they constitute critical boundary conditions [10].
The reduction step in the SisAl process produces a silicon alloy with high calcium and aluminium impurity concentrations that do not meet the purity criteria for metallurgical-grade silicon. In the slag-refining step, the SiO2 in the slag provides the oxidation potential for the oxidation of calcium and aluminium in the alloy. While aluminium and calcium are oxidized to CaO and Al2O3, SiO2 is reduced to silicon, thus further increasing Si concentration in the alloy. The reactions during refining for the dissolved elements can be described as follows [7]:
2[Ca]alloy + (SiO2)slag = 2(CaO)slag + [Si]alloy
4[Al]alloy + 3(SiO2)slag = 2(Al2O3)slag + 3[Si]alloy
During the SisAl Pilot project, a variety of refining techniques have been investigated to upgrade the intermediate silicon alloy derived from the initial reduction step. Emil Kaya et al. [11] have demonstrated that calcium silicate slag, silicon sculls and even anorthosite can be used to refine a crude silicon with an initial Ca concentration of 15 wt.% and an initial Al concentration of 10 wt.% to an alloy with >98 wt.% silicon.
However, in contrast to Emil Kaya et al. [11], the present study focuses on the slag-to-alloy ratio and the initial SiO2 content of the slag as key process variables of the slag-refining process under an argon-protected, non-sealed atmosphere instead of investigating a broad range of refining agents. The study connects equilibrium simulations using FactSage 8.2 with preliminary trials and a main experimental campaign in a medium-frequency induction furnace. The simulations provide initial reference points for the experimental campaign and support a deeper understanding of the refining behavior of different slag compositions. Ultimately, this work provides a basis for establishing a circular silicon production route in which spent refining slag is recycled back into the upstream reduction step.
2. Materials and Methods
2.1. Input Materials
Two pre-melted slags with different chemical compositions, along with two different pre-melted silicon alloys derived from the reduction step, were used as input material in this study. The input materials were analyzed by X-ray fluorescence (XRF) using a SPECTRO XEPOS XEP05 spectrometer (SPECTRO Analytical Instruments GmbH, Kleve, Germany). Additional inductively coupled plasma optical emission spectroscopy (ICP-OES) was carried out by the Analytical Services of Elektrowerk Weisweiler GmbH (Eschweiler, Germany) with a modified method according to DIN EN ISO 11885:2009-09 [12]. The ICP-OES results showed generally similar compositions to those obtained by XRF. A comparison of the results obtained by both methods is provided in Supplementary Table S4. As the ICP-OES analyses showed some limitations in reproducibility, XRF was used for the subsequent analysis of the experimental samples. The normalized oxide compositions determined by XRF are presented in Table 1.
Table 1.
Normalized chemical composition of input materials analyzed by XRF.
For the experimental work, these two pre-melted slags and low amounts of quartz were used to match the desired parameters.
2.2. Preliminary Trials and Simulations
Before the main trial campaign, equilibrium calculations in FactSage 8.2 [13] were performed to determine the temperature range, input slag composition and slag-to-metal ratio. Additionally, preliminary trials were carried out to evaluate feasible holding times and temperatures for the main trials. The main objective of the preliminary trials and simulations was to determine whether the theoretically calculated equilibria could be reached within a reasonable time or if they were kinetically inhibited.
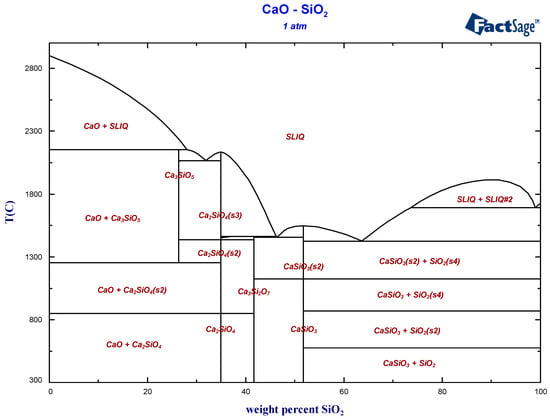
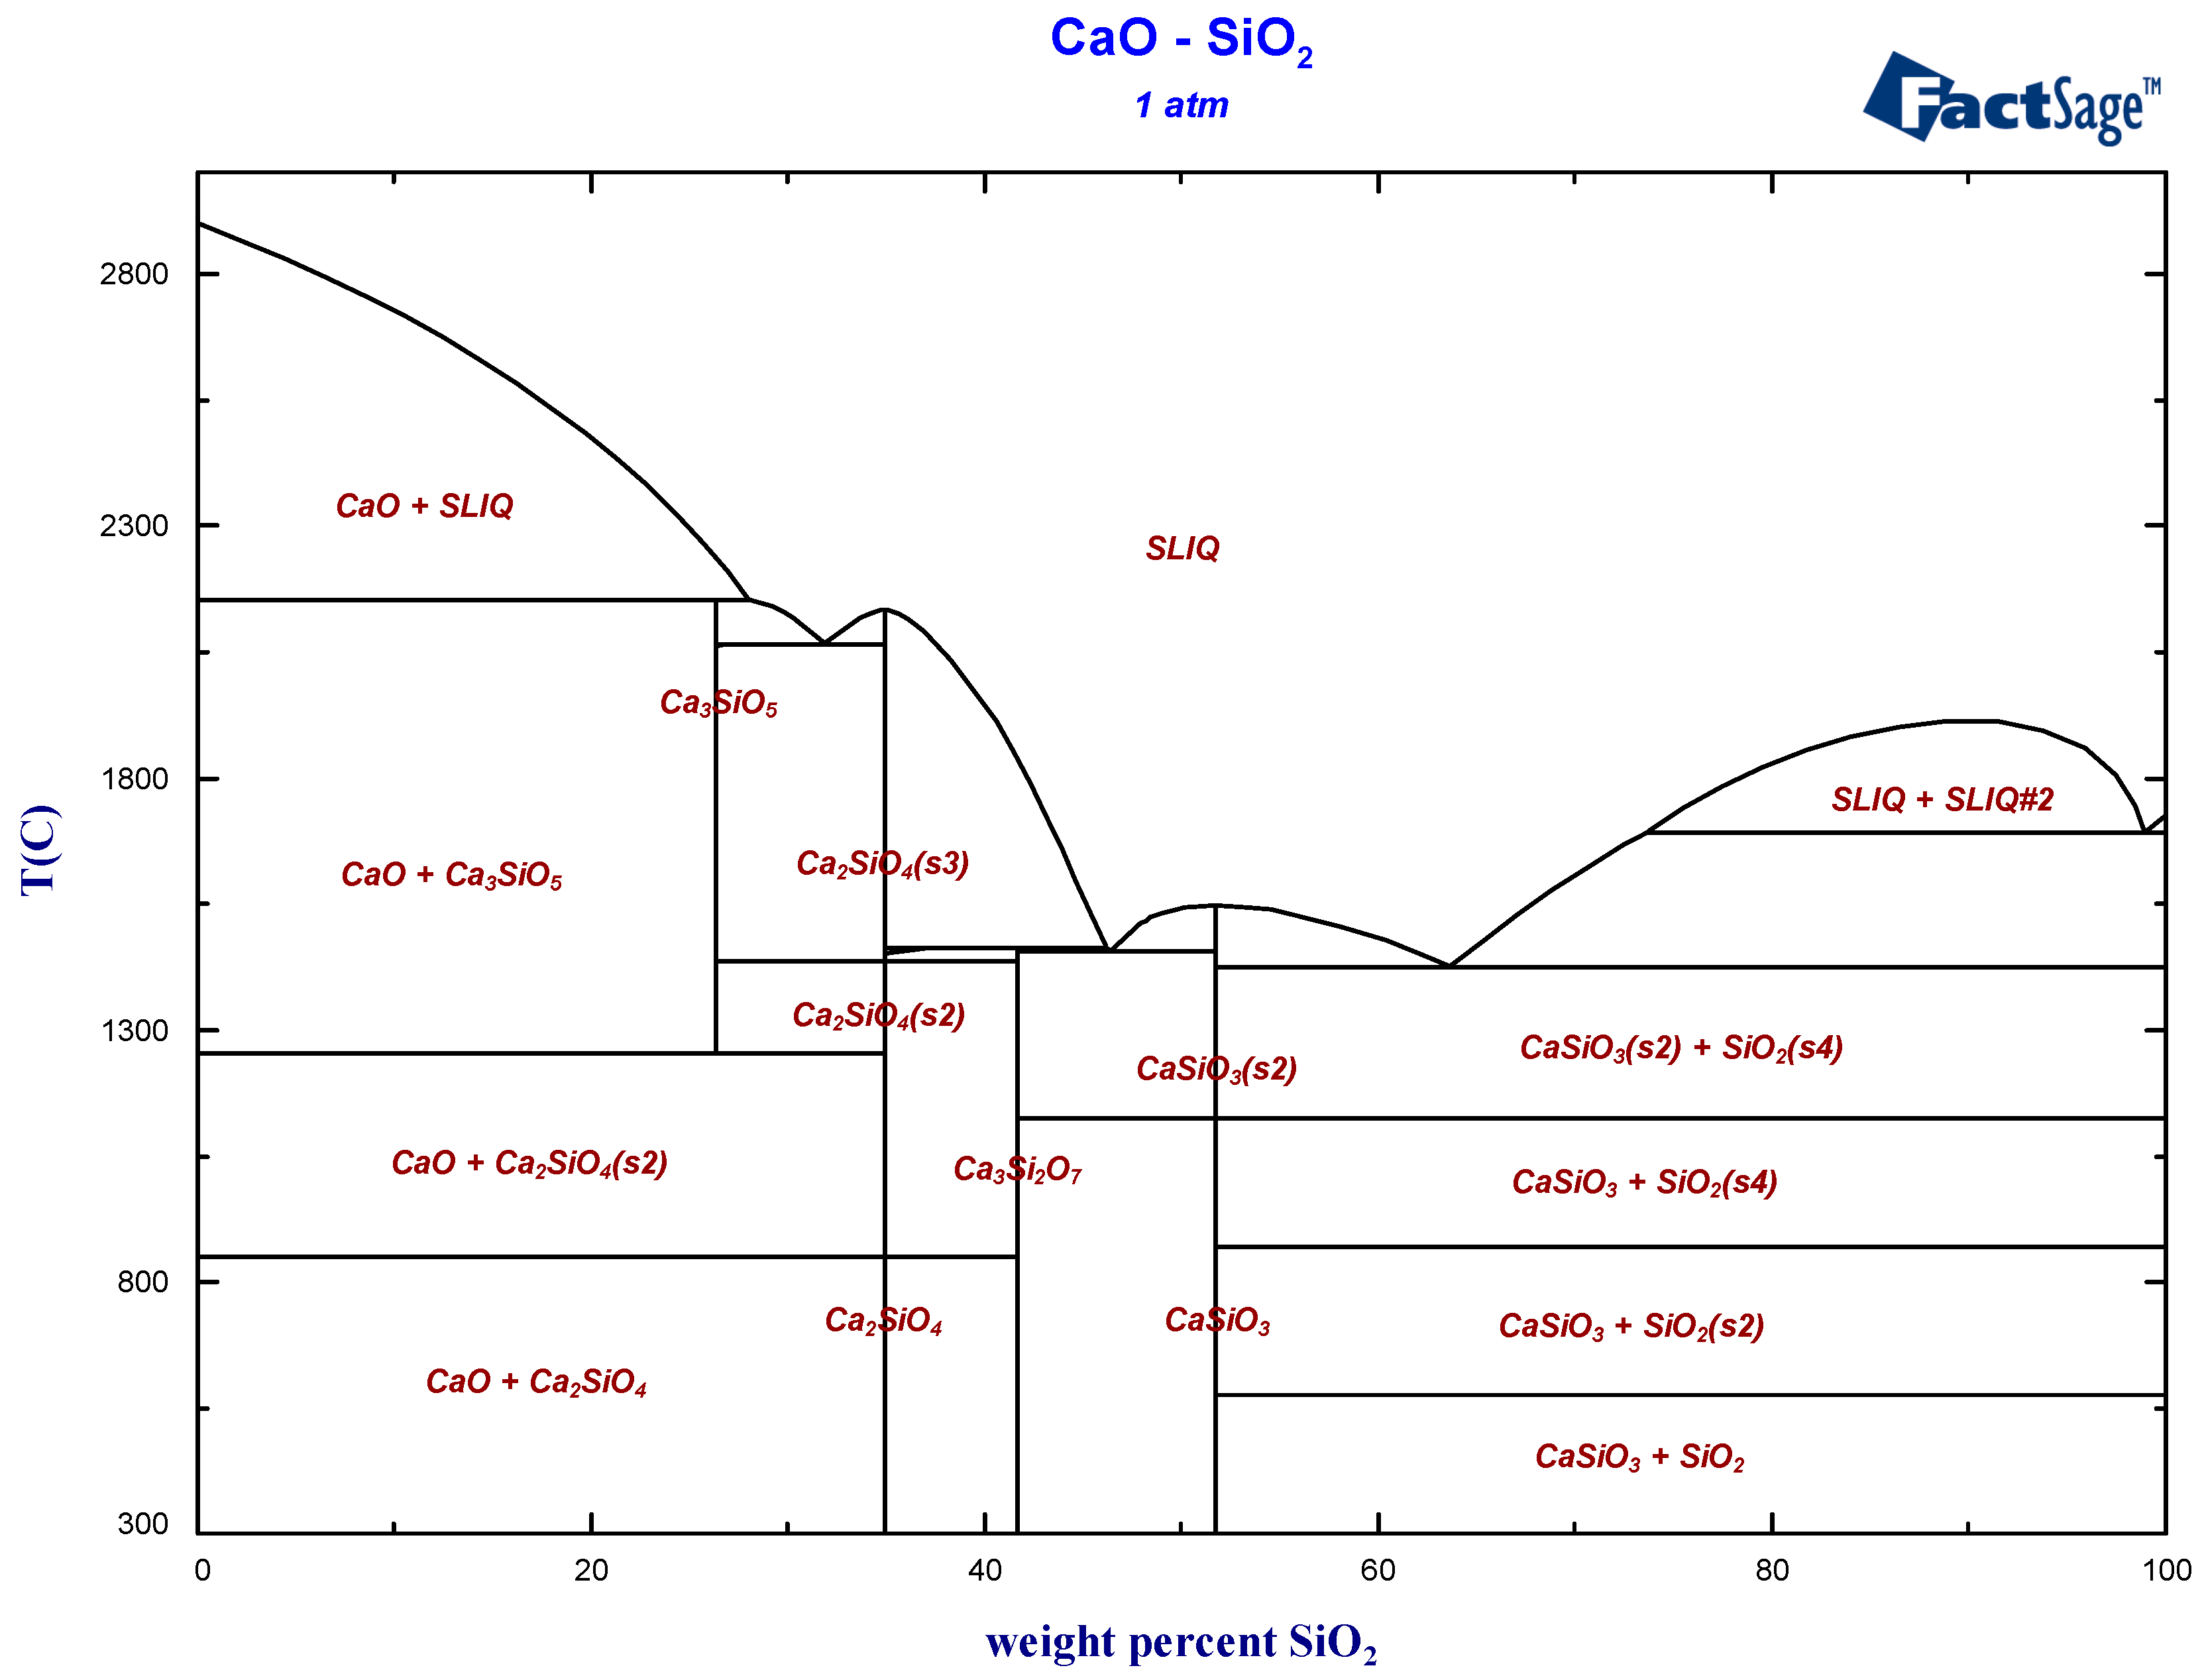
Based on equilibrium calculations and preliminary trial results, a temperature of 1600 °C was determined to be sufficient to provide suitable melting conditions within the slag composition range. This temperature was also selected for the main experimental campaign, since temperatures that are close to the liquidus temperature of the slag reduce SiO2 evaporation losses [7] and thus theoretically leave more total SiO2 in the system to react with the alloy. A binary phase diagram of the SiO2-CaO slag system is shown in Figure 1.
Figure 1.
Binary phase diagram of CaO-SiO2. Reprinted with permission from Ref. [14]. Copyright 2025 GTT-Technologies.
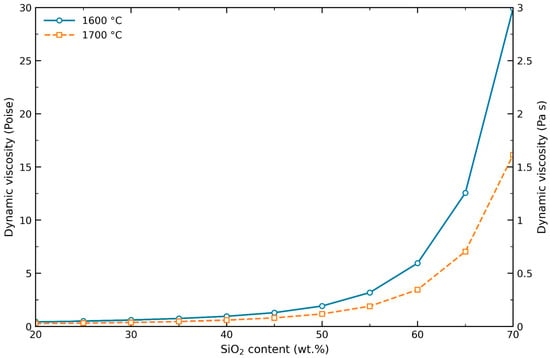
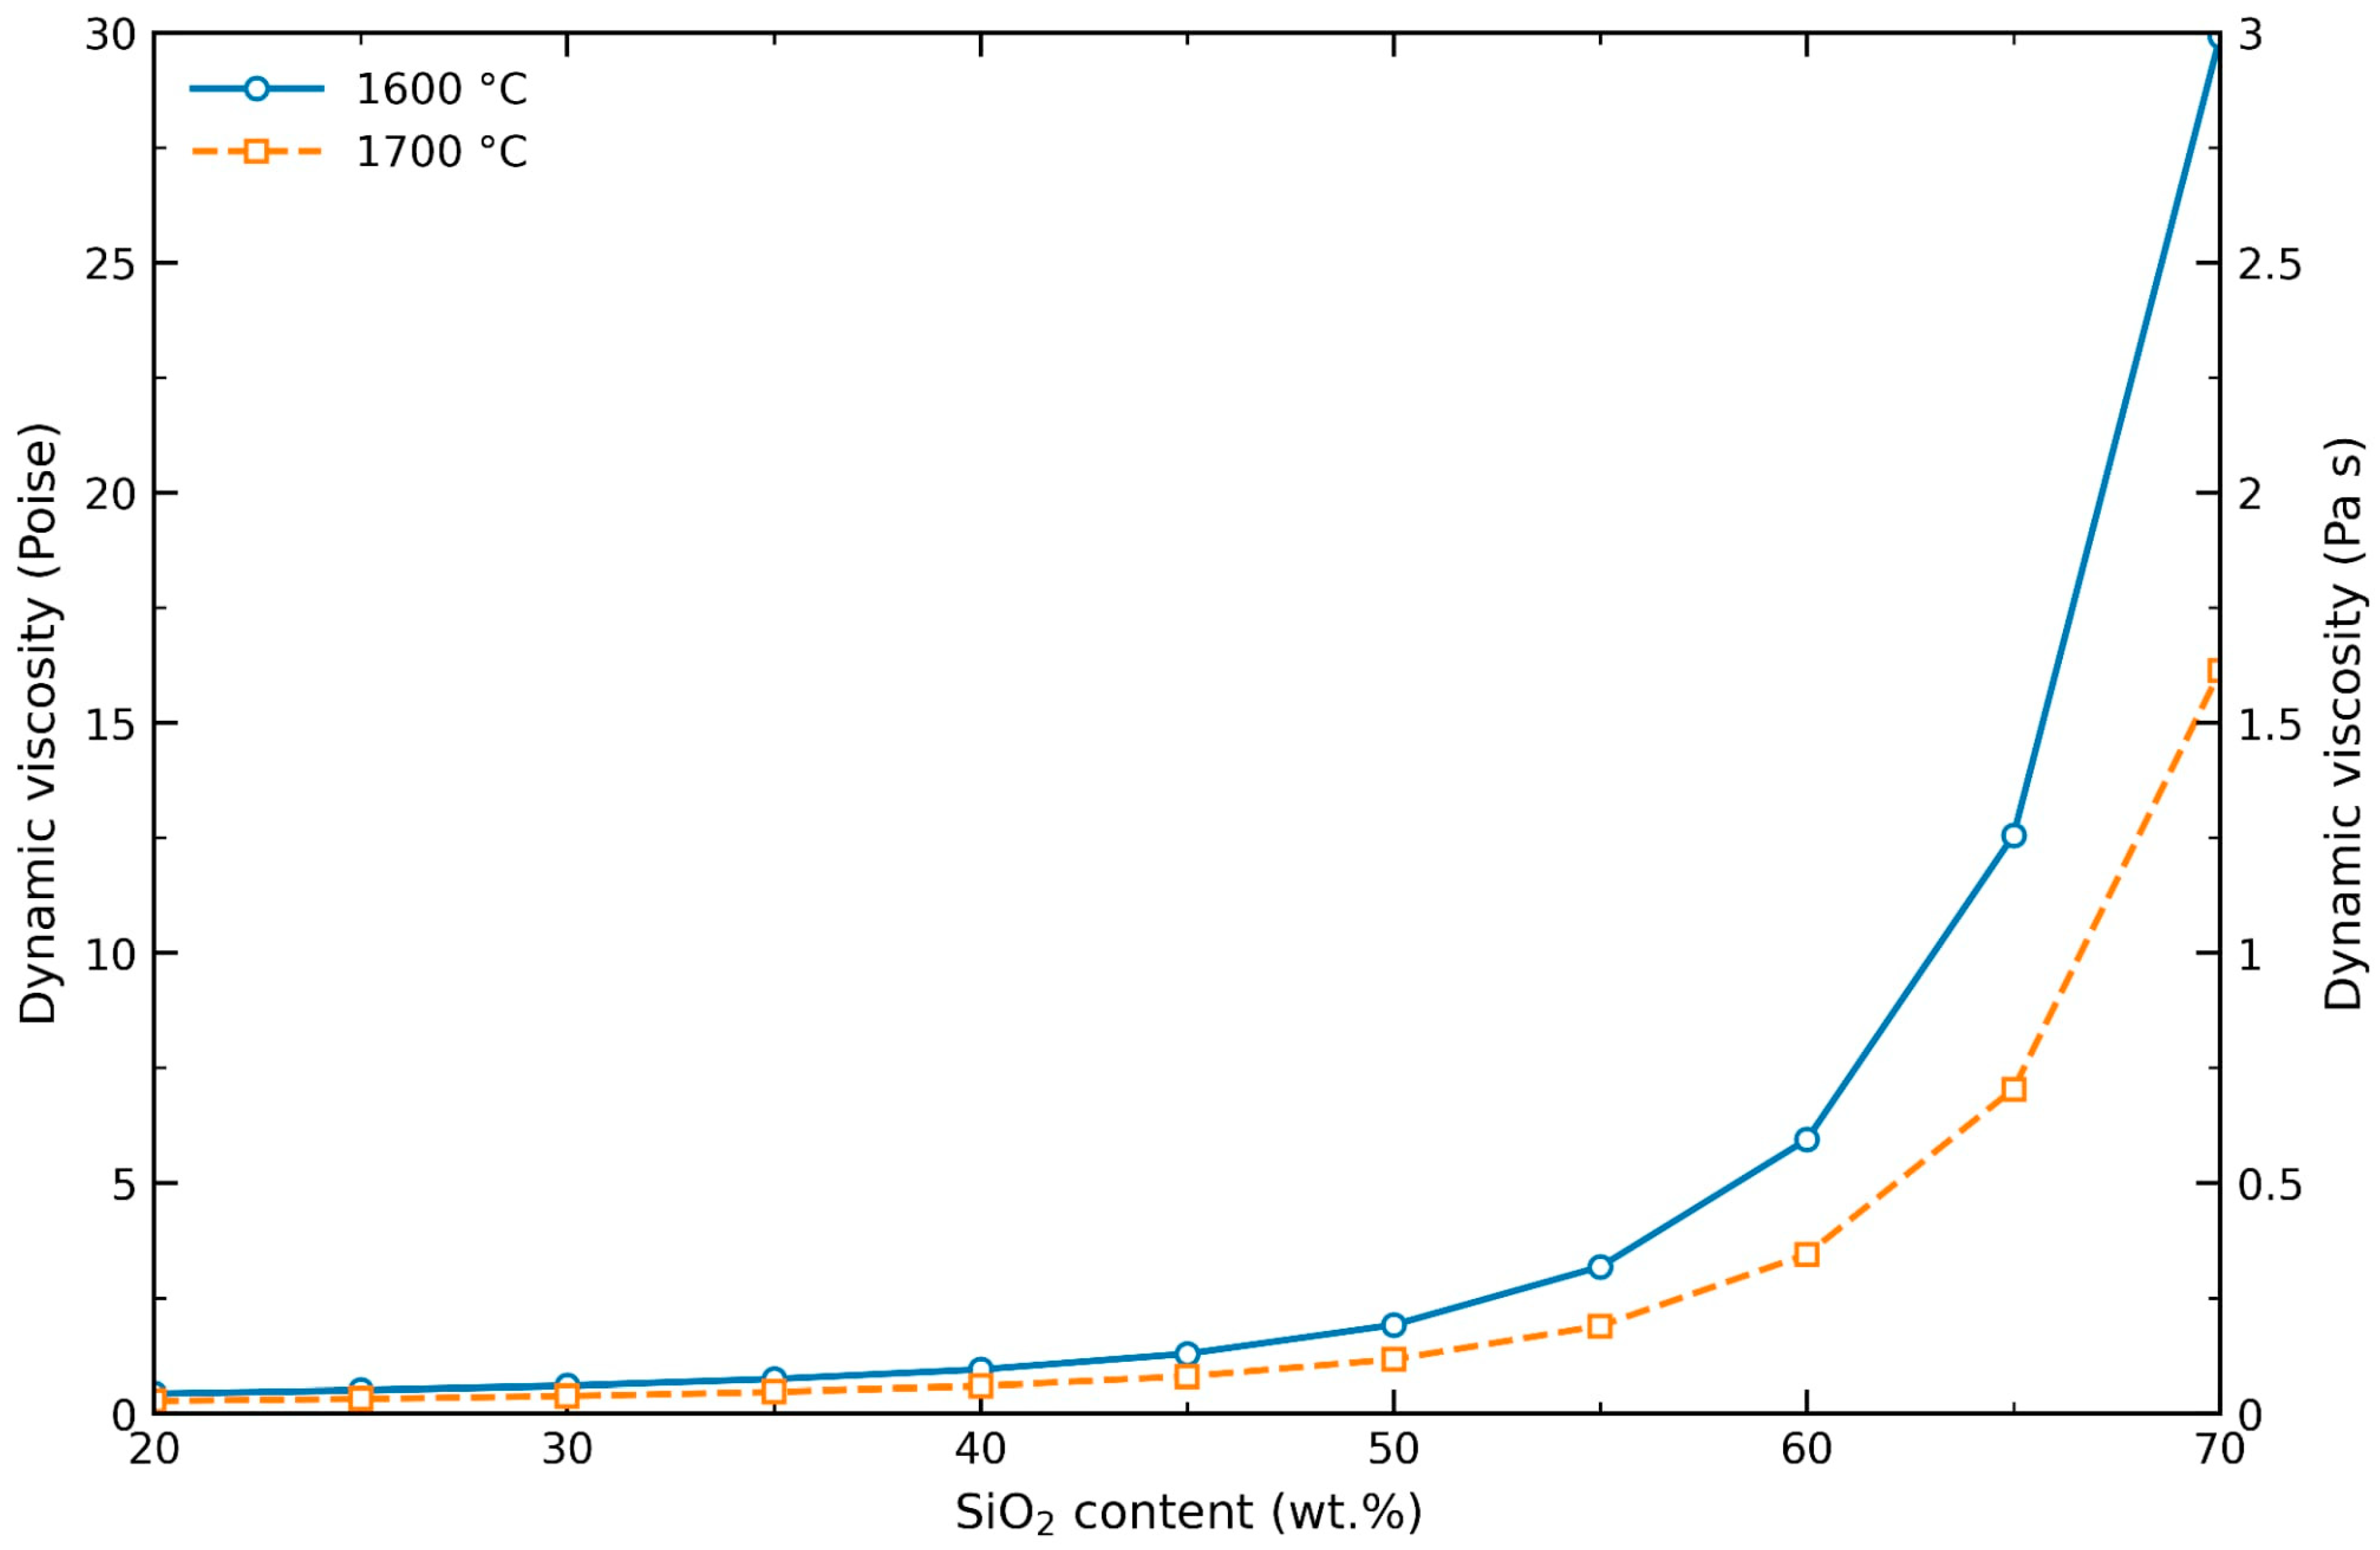
Additionally, the slag viscosity at this temperature is sufficiently low to allow for smooth handling of slag and alloy. This was not only predicted from viscosity calculations in FactSage 8.2 and research on slag viscosity of the SiO2-CaO system but also supported by observations during additional preliminary trials that are not included in this study. The viscosities of different CaO-SiO2 melts at 1600 °C and 1700 °C are shown in Figure 2 [13,15]. The slag viscosity stays relatively low between 40 and 50 wt.% SiO2 and increases exponentially with increasing SiO2 content.
Figure 2.
Calculated dynamic viscosities of CaO-SiO2 melts at 1600 °C and 1700 °C using the Viscosity module of FactSage 8.2 (melts database).
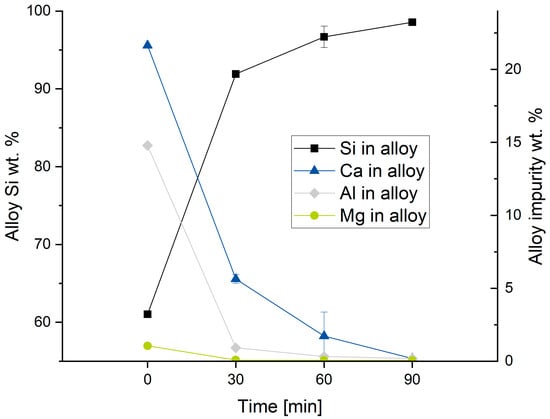
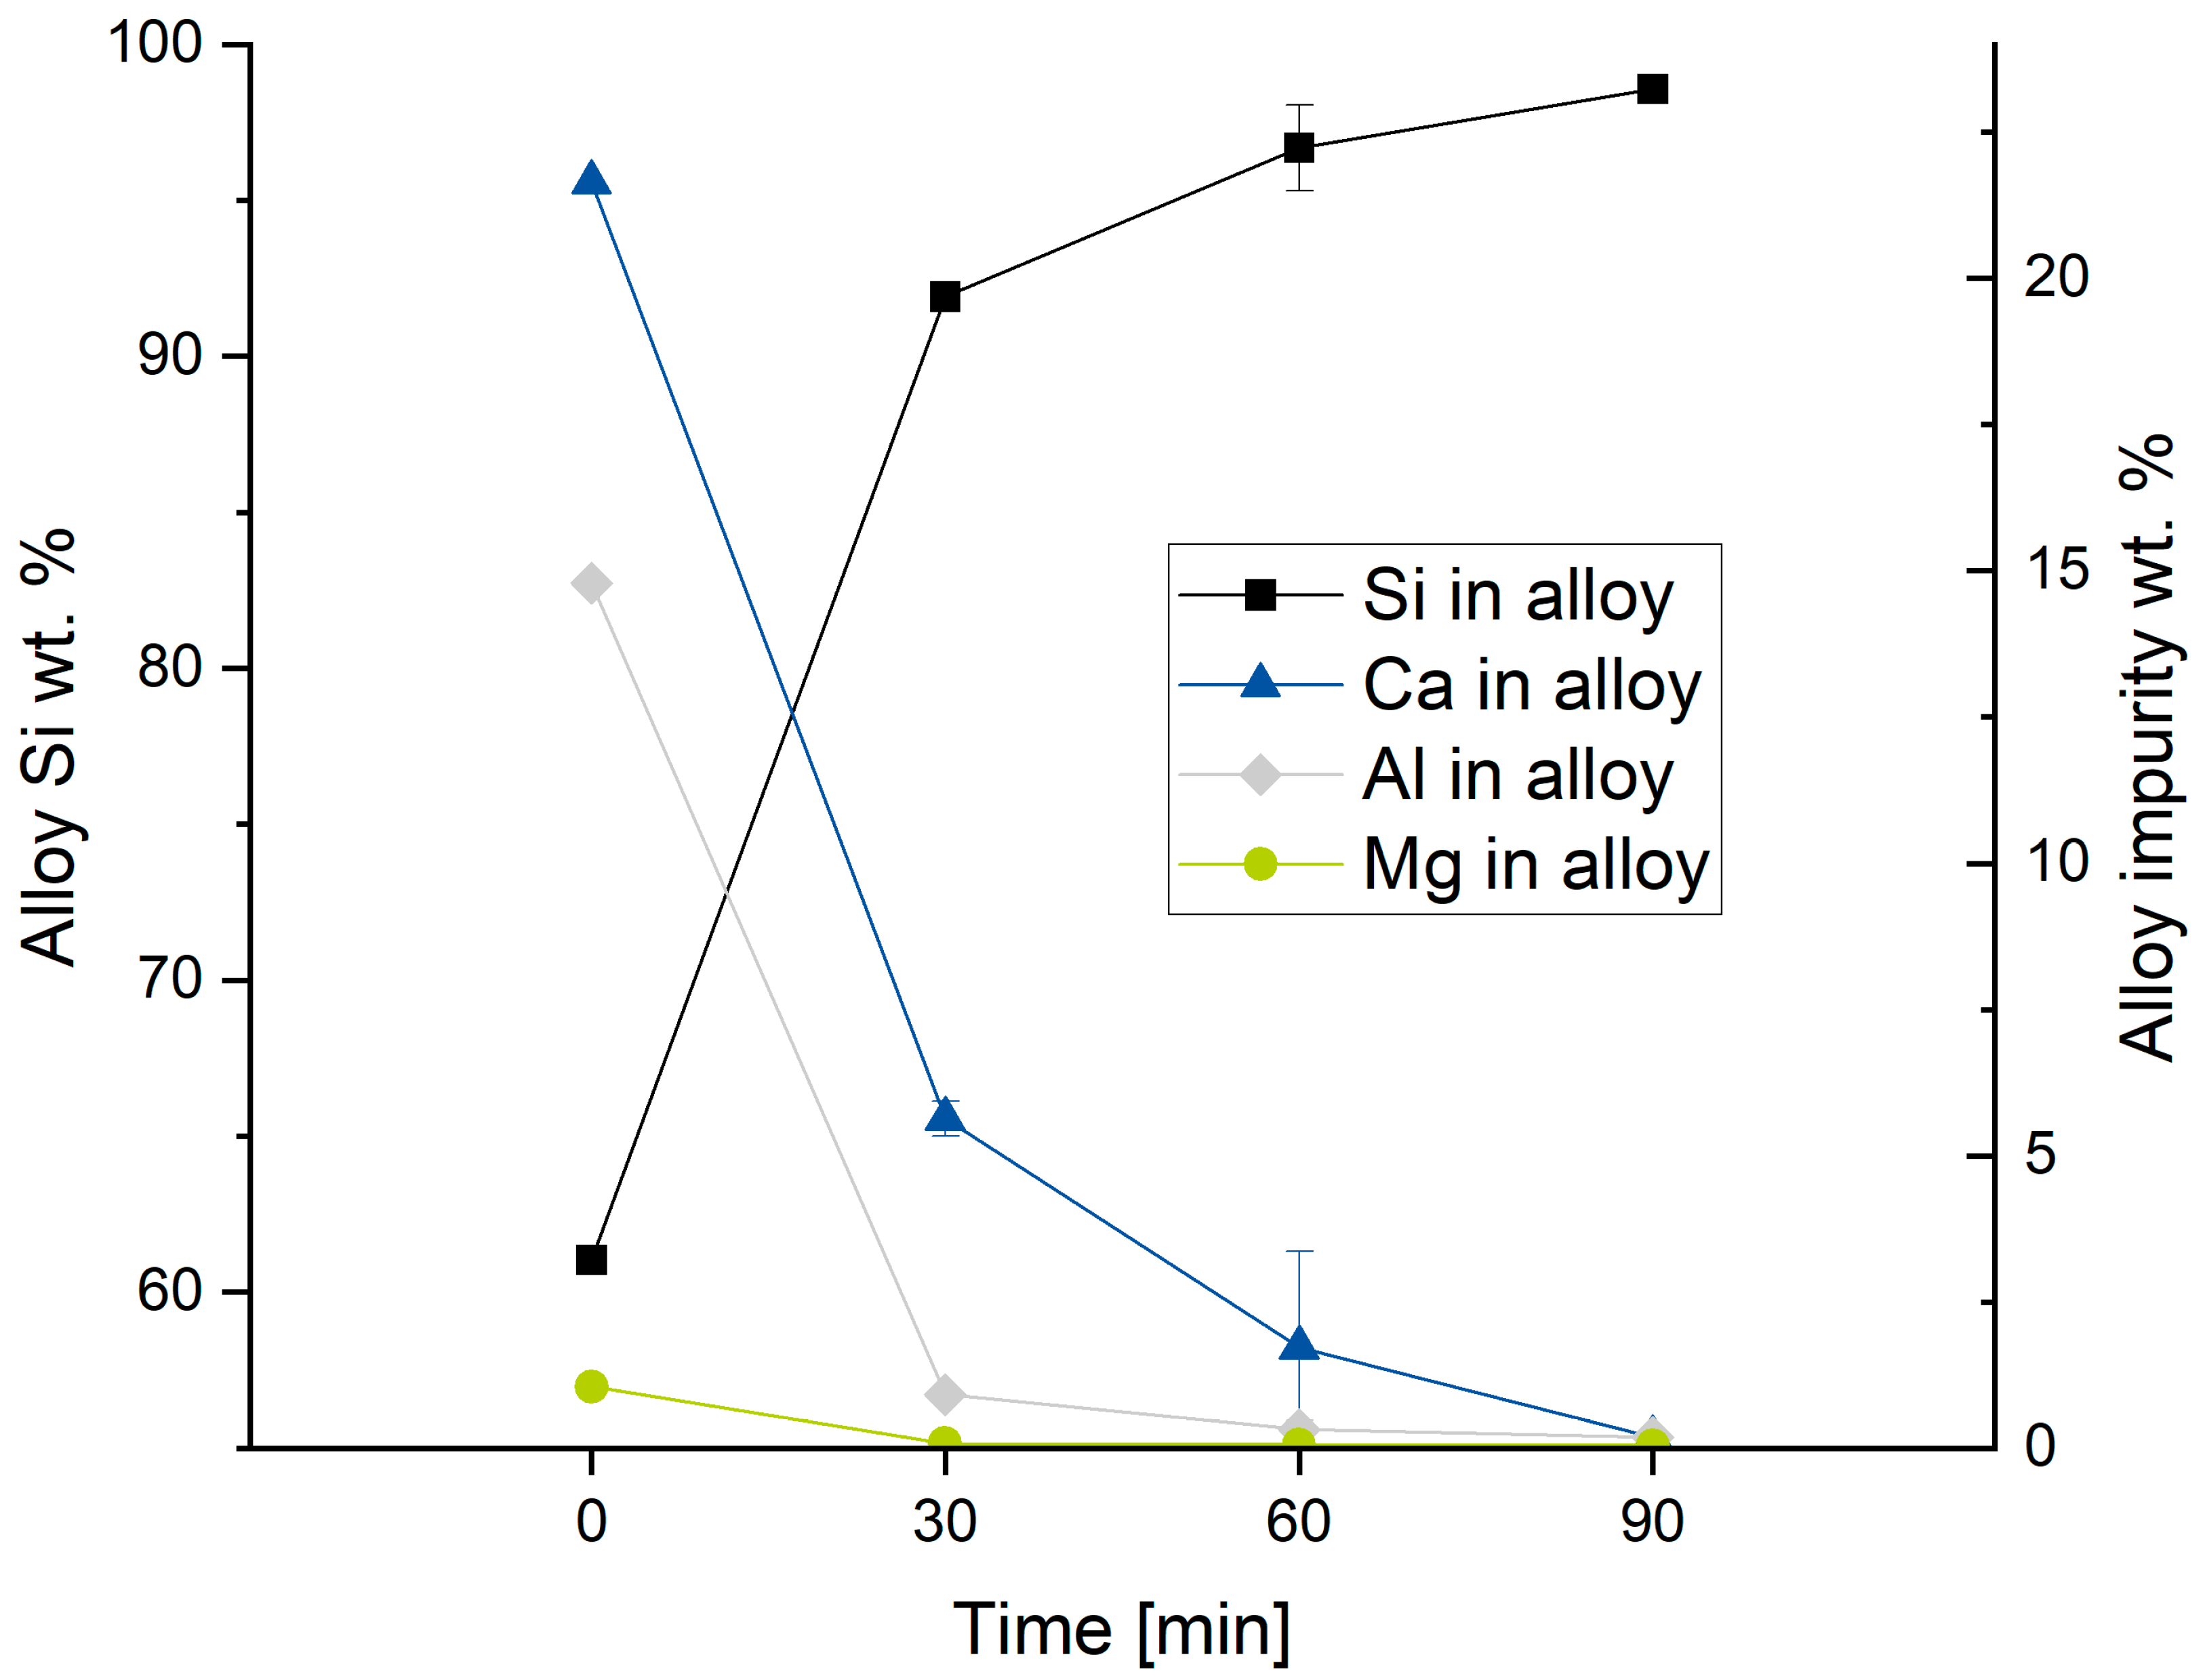
Since equilibrium calculations do not account for reaction kinetics, a set of preliminary trials with different holding times was executed to determine the holding time for the main trial campaign. The parameters for the preliminary trials using alloy T09 and the results are presented in Table 2. Additionally, the average alloy composition as a function of holding time is shown in Figure 3. The error whiskers give the standard deviation of the two distinct experiments per parameter combination.
Table 2.
Normalized alloy composition results for selected preliminary trial groups comparing holding times, measured with SPECTRO XEPOS XEP05 XRF.
Figure 3.
Normalized alloy compositional results from preliminary trials, for Si and impurity concentrations, dependent on holding time.
To determine the influence of the holding time on refining without possible reactions during simultaneous melting of the alloy and slag starting from ambient temperature, the following trial procedure was chosen. The premelted slag mixture was heated in a graphite crucible to the target temperature and was held for a sufficient time to homogenize the melt. The alloy was then added into the melt, indicating the start of the holding time. During the reaction, the melt was not stirred mechanically and at the end of the holding time, the melt was poured from the crucible into a precoated mold in which it quickly solidified. This procedure minimizes uncontrolled reactions between the alloy and slag during the heating stage.
The results of the preliminary campaign showed a substantial increase in the normalized Si concentration during the first 60 min of holding time, while the additional increase between 60 and 90 min was comparatively small. Therefore, a holding time of 60 min was selected as a practical operating condition for the main experimental campaign. This duration provided a reasonable compromise between the achieved reduction in impurity concentrations, experimental comparability, furnace and thermocouple wear, and process throughput.
The findings of the preliminary simulations and trials were used to define the main experimental parameters and can be summarized as follows:
- The normalized Si concentration increased with increasing SiO2 availability;
- This was achieved by using slags with the highest feasible SiO2 content;
- Since the melting point and viscosity of SiO2-CaO slags increase with increasing SiO2 concentration this parameter was limited to a SiO2 content of approximately 60 to 65 wt.%;
- Higher slag-to-alloy ratios provided another way to increase the total amount of SiO2 available for the refining reaction;
- The normalized Si concentration increased at lower temperatures and slag fuming decreased;
- A holding time of 60 min was selected as a practical operating condition, as longer holding times resulted in comparatively small additional increases in the normalized Si concentration of the recovered alloy.
2.3. Main Trial Parameters
The process parameters for each trial (V1–V18) of the main experimental campaign are listed in Table 3. Each parameter combination was conducted twice with alloy T10 as input alloy.
Table 3.
Main experimental campaign parameters.
Through the analysis of equilibrium calculations and viscosity calculations with FactSage 8.2 and through the results from the preliminary trials, the SiO2 concentration in the slag was set to 50–60 wt.%.
The theoretical minimal amount of SiO2 needed for full removal of aluminium and calcium from 100 g of T10 alloy is 39.974 g (15.29 g for Ca removal and 24.684 g for Al removal). Therefore, theoretically a 0.666 to 1 ratio of slag to metal would be suitable for full aluminium and calcium removal if the slag had a SiO2 concentration of 60 wt.%. Accordingly, with a 55 wt.% SiO2 slag a slag-to-alloy ratio of 0.727 to 1 and for a slag with 50 wt.% SiO2 a slag-to-alloy ratio of 0.799 to 1 would be sufficient. However, equilibrium calculations through FactSage 8.2 suggest an improved refining performance of the slag with increasing slag-to-alloy ratio, likely due to more total SiO2 which results in high SiO2 activity. Another advantage of using an excess of slag is that its composition changes to a lesser extent during the refining step compared to using only the stoichiometric amount required for impurity removal. Consequently, the spent refining slag retains a significant SiO2 content while containing only a relatively low amount of Al2O3. This supports its potential for reuse as an input material in a subsequent reduction step, thereby theoretically enabling a closed-loop process for the production of metallurgical-grade (MG) silicon. A potential downside of excess slag use, however, is the possibility of slag entrapment losses resulting in reduced alloy yield, higher energy consumption and a potential excess of spent refining slag.
This study focuses on the increase in normalized Si concentration in the alloy. As a result, the slag-to-alloy ratio for the main trial campaign was set to 3:1, 4:1 and 5:1. The theoretical excess factor of slag is shown in Table 3. The excess factor is defined as the added amount of slag versus the theoretically needed amount of slag. For example, for trials V1 and V10, the excess factor is 4.503. That means that 4.503 times the amount of theoretically needed slag with a SiO2 concentration of 60 wt.% was used in the trial, even though the slag-to-metal ratio is only 3.
All experiments in this study were conducted using a medium-frequency induction furnace. The furnace consisted of a water-cooled copper coil housed within a cold-wall stainless steel container. The coil, together with the crucible, can be tilted perpendicular to the cylinder axis.
Graphite was selected as the crucible material to enable efficient inductive heating, as it combines low heat capacity with high thermal conductivity. The graphite crucible served as the susceptor for induction heating, since the slag is non-conductive in its solid state and therefore cannot be inductively heated directly. Although graphite provides favorable thermal properties for this application, potential chemical interactions with the slag at the experimental temperature cannot be fully excluded.
The crucible was partially covered with a lightweight refractory brick lid, and a graphite lance was used to flush the freeboard with argon to prevent excessive oxidation of the crucible and the alloy by atmospheric oxygen. A narrow opening was intentionally maintained to allow continuous argon flow from the lance through the crucible interior into the exhaust system and to prevent the melt from boiling over. Consequently, the experimental setup was not hermetically sealed, and the oxygen partial pressure inside the crucible was neither directly measured nor controlled. Therefore, some air ingress and local variations in oxygen potential cannot be excluded.
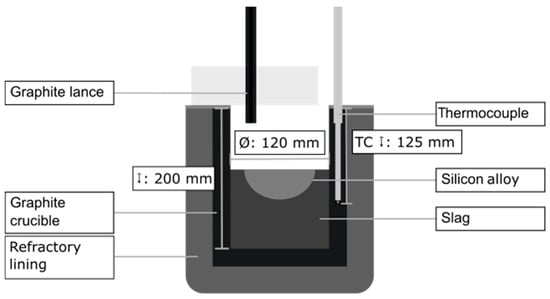
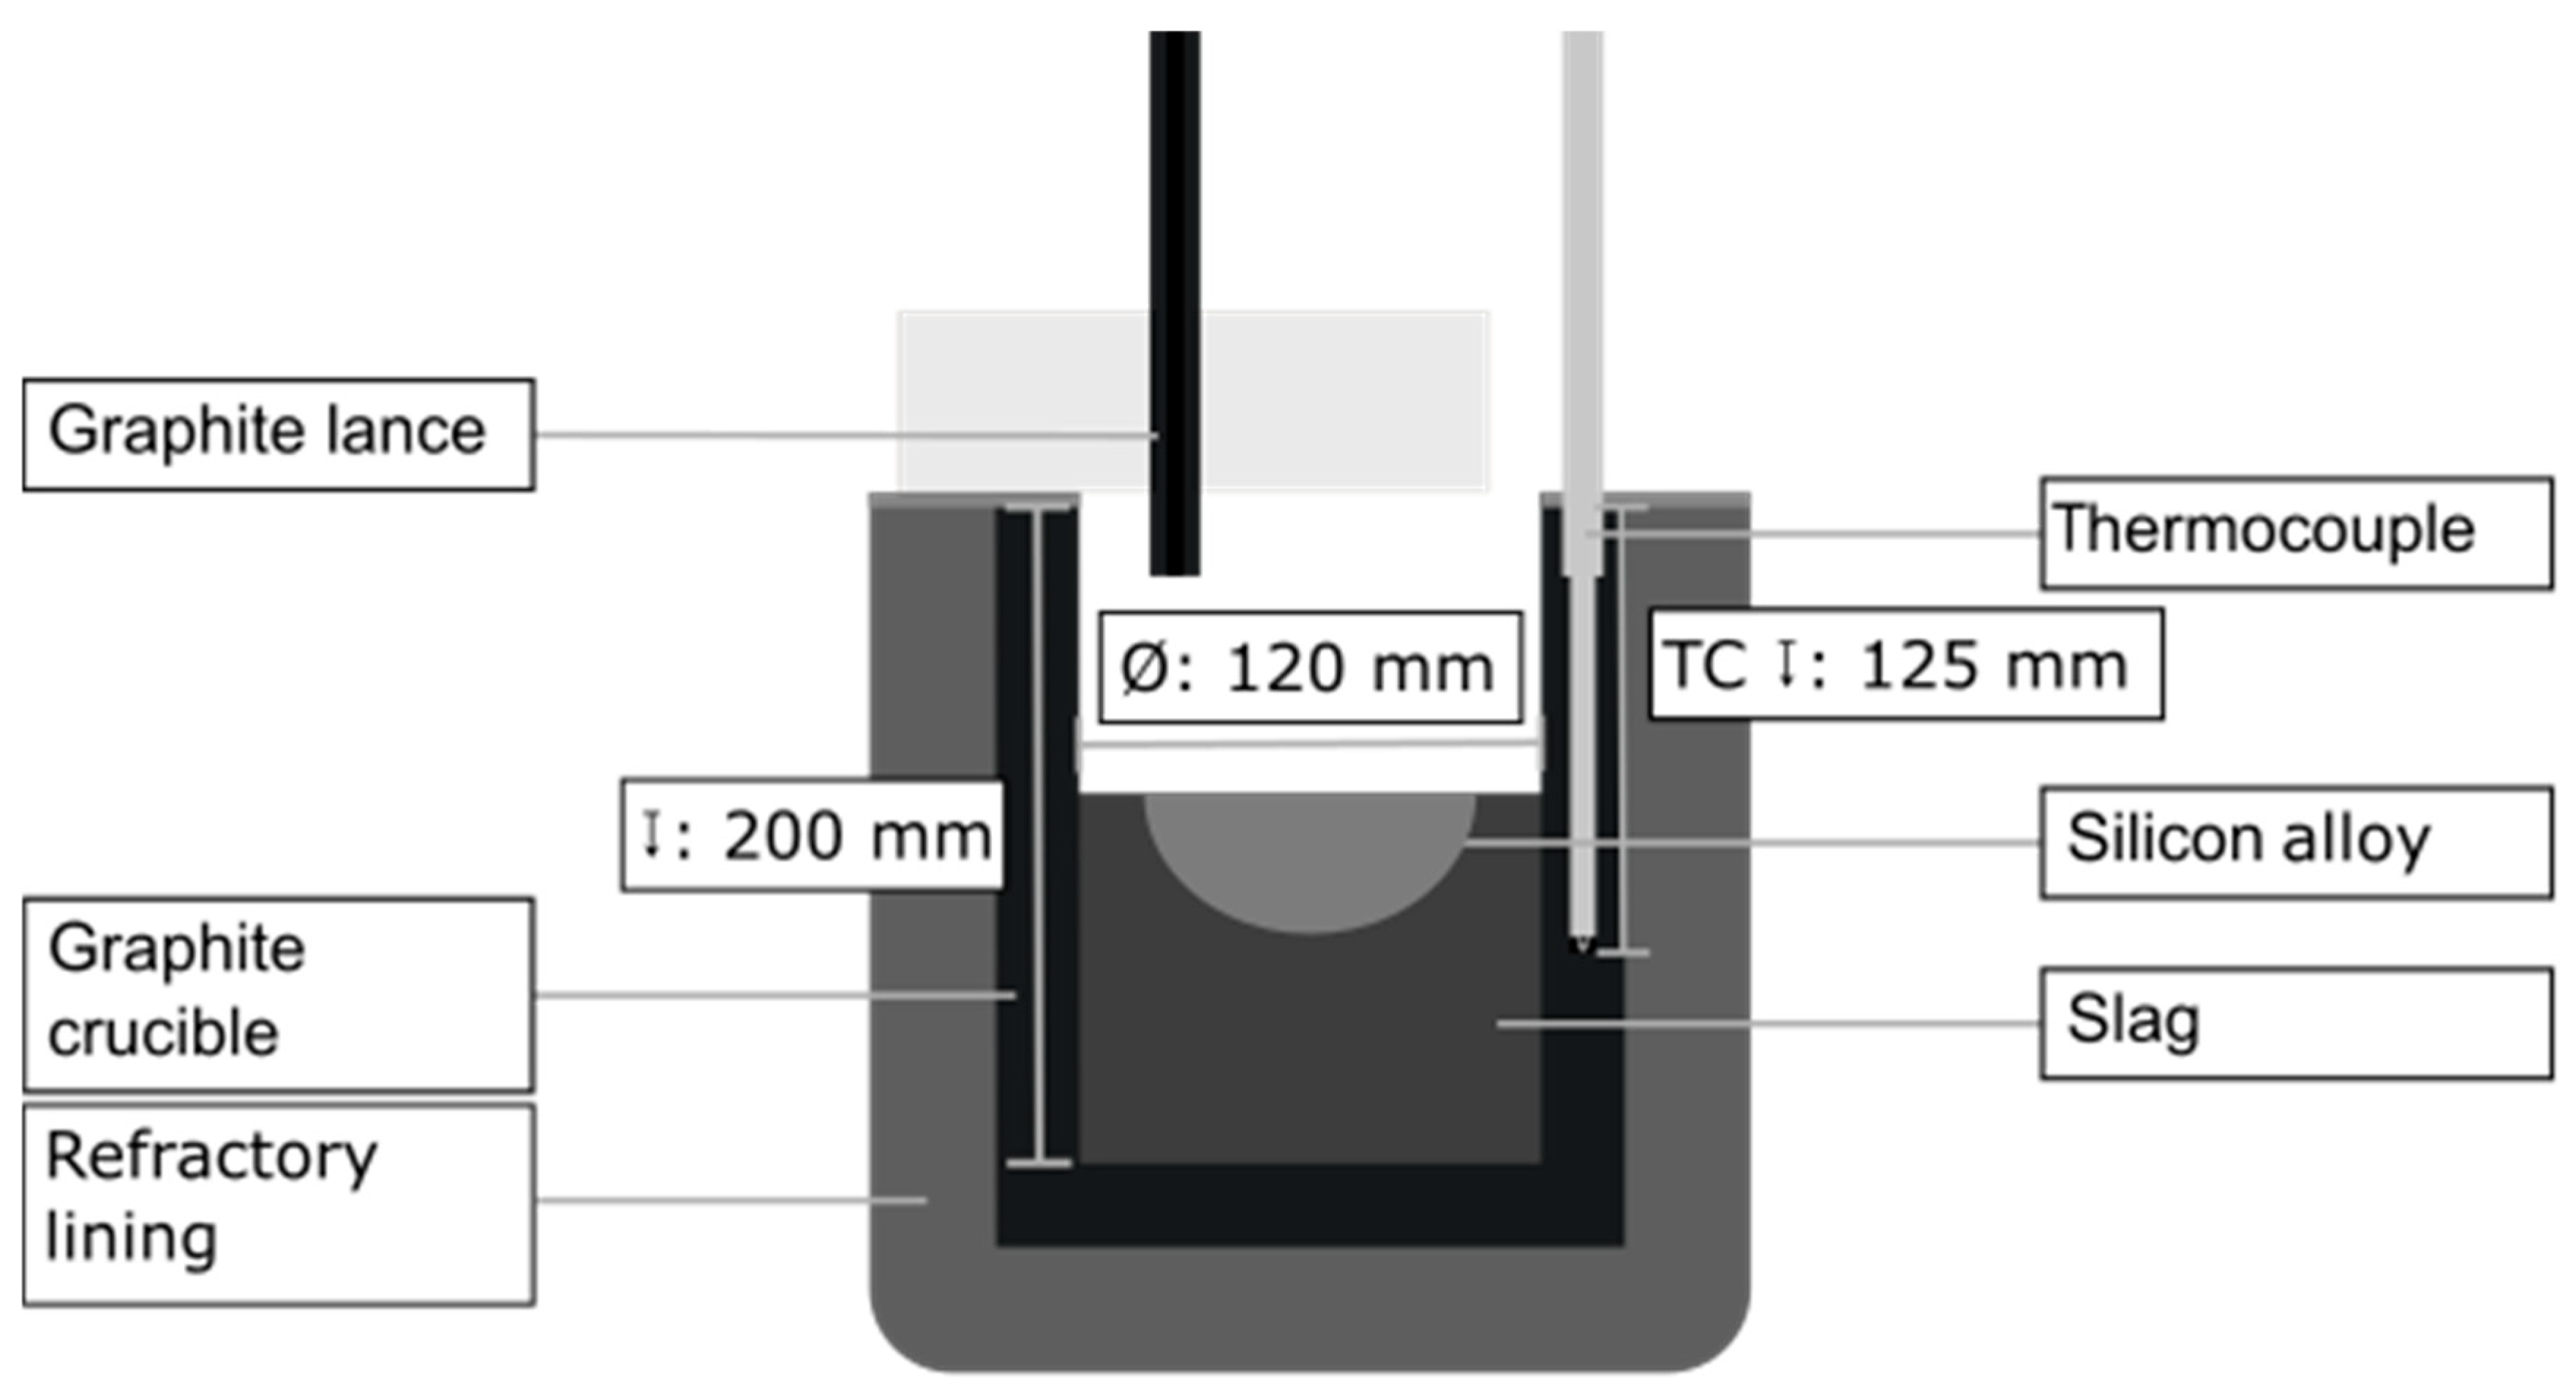
A type C thermocouple in a double alumina tube flushed with argon was used for continuous temperature measurement [16]. A technical drawing of the experimental setup is presented in Figure 4.
Figure 4.
Experimental setup at the Heraeus induction furnace, not to scale.
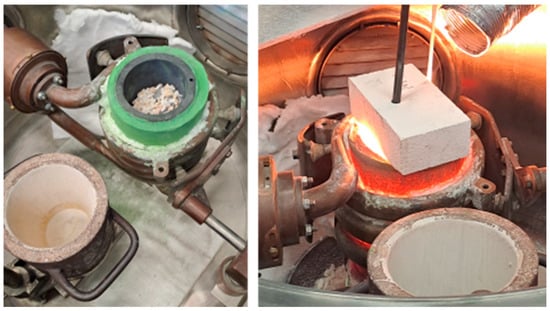
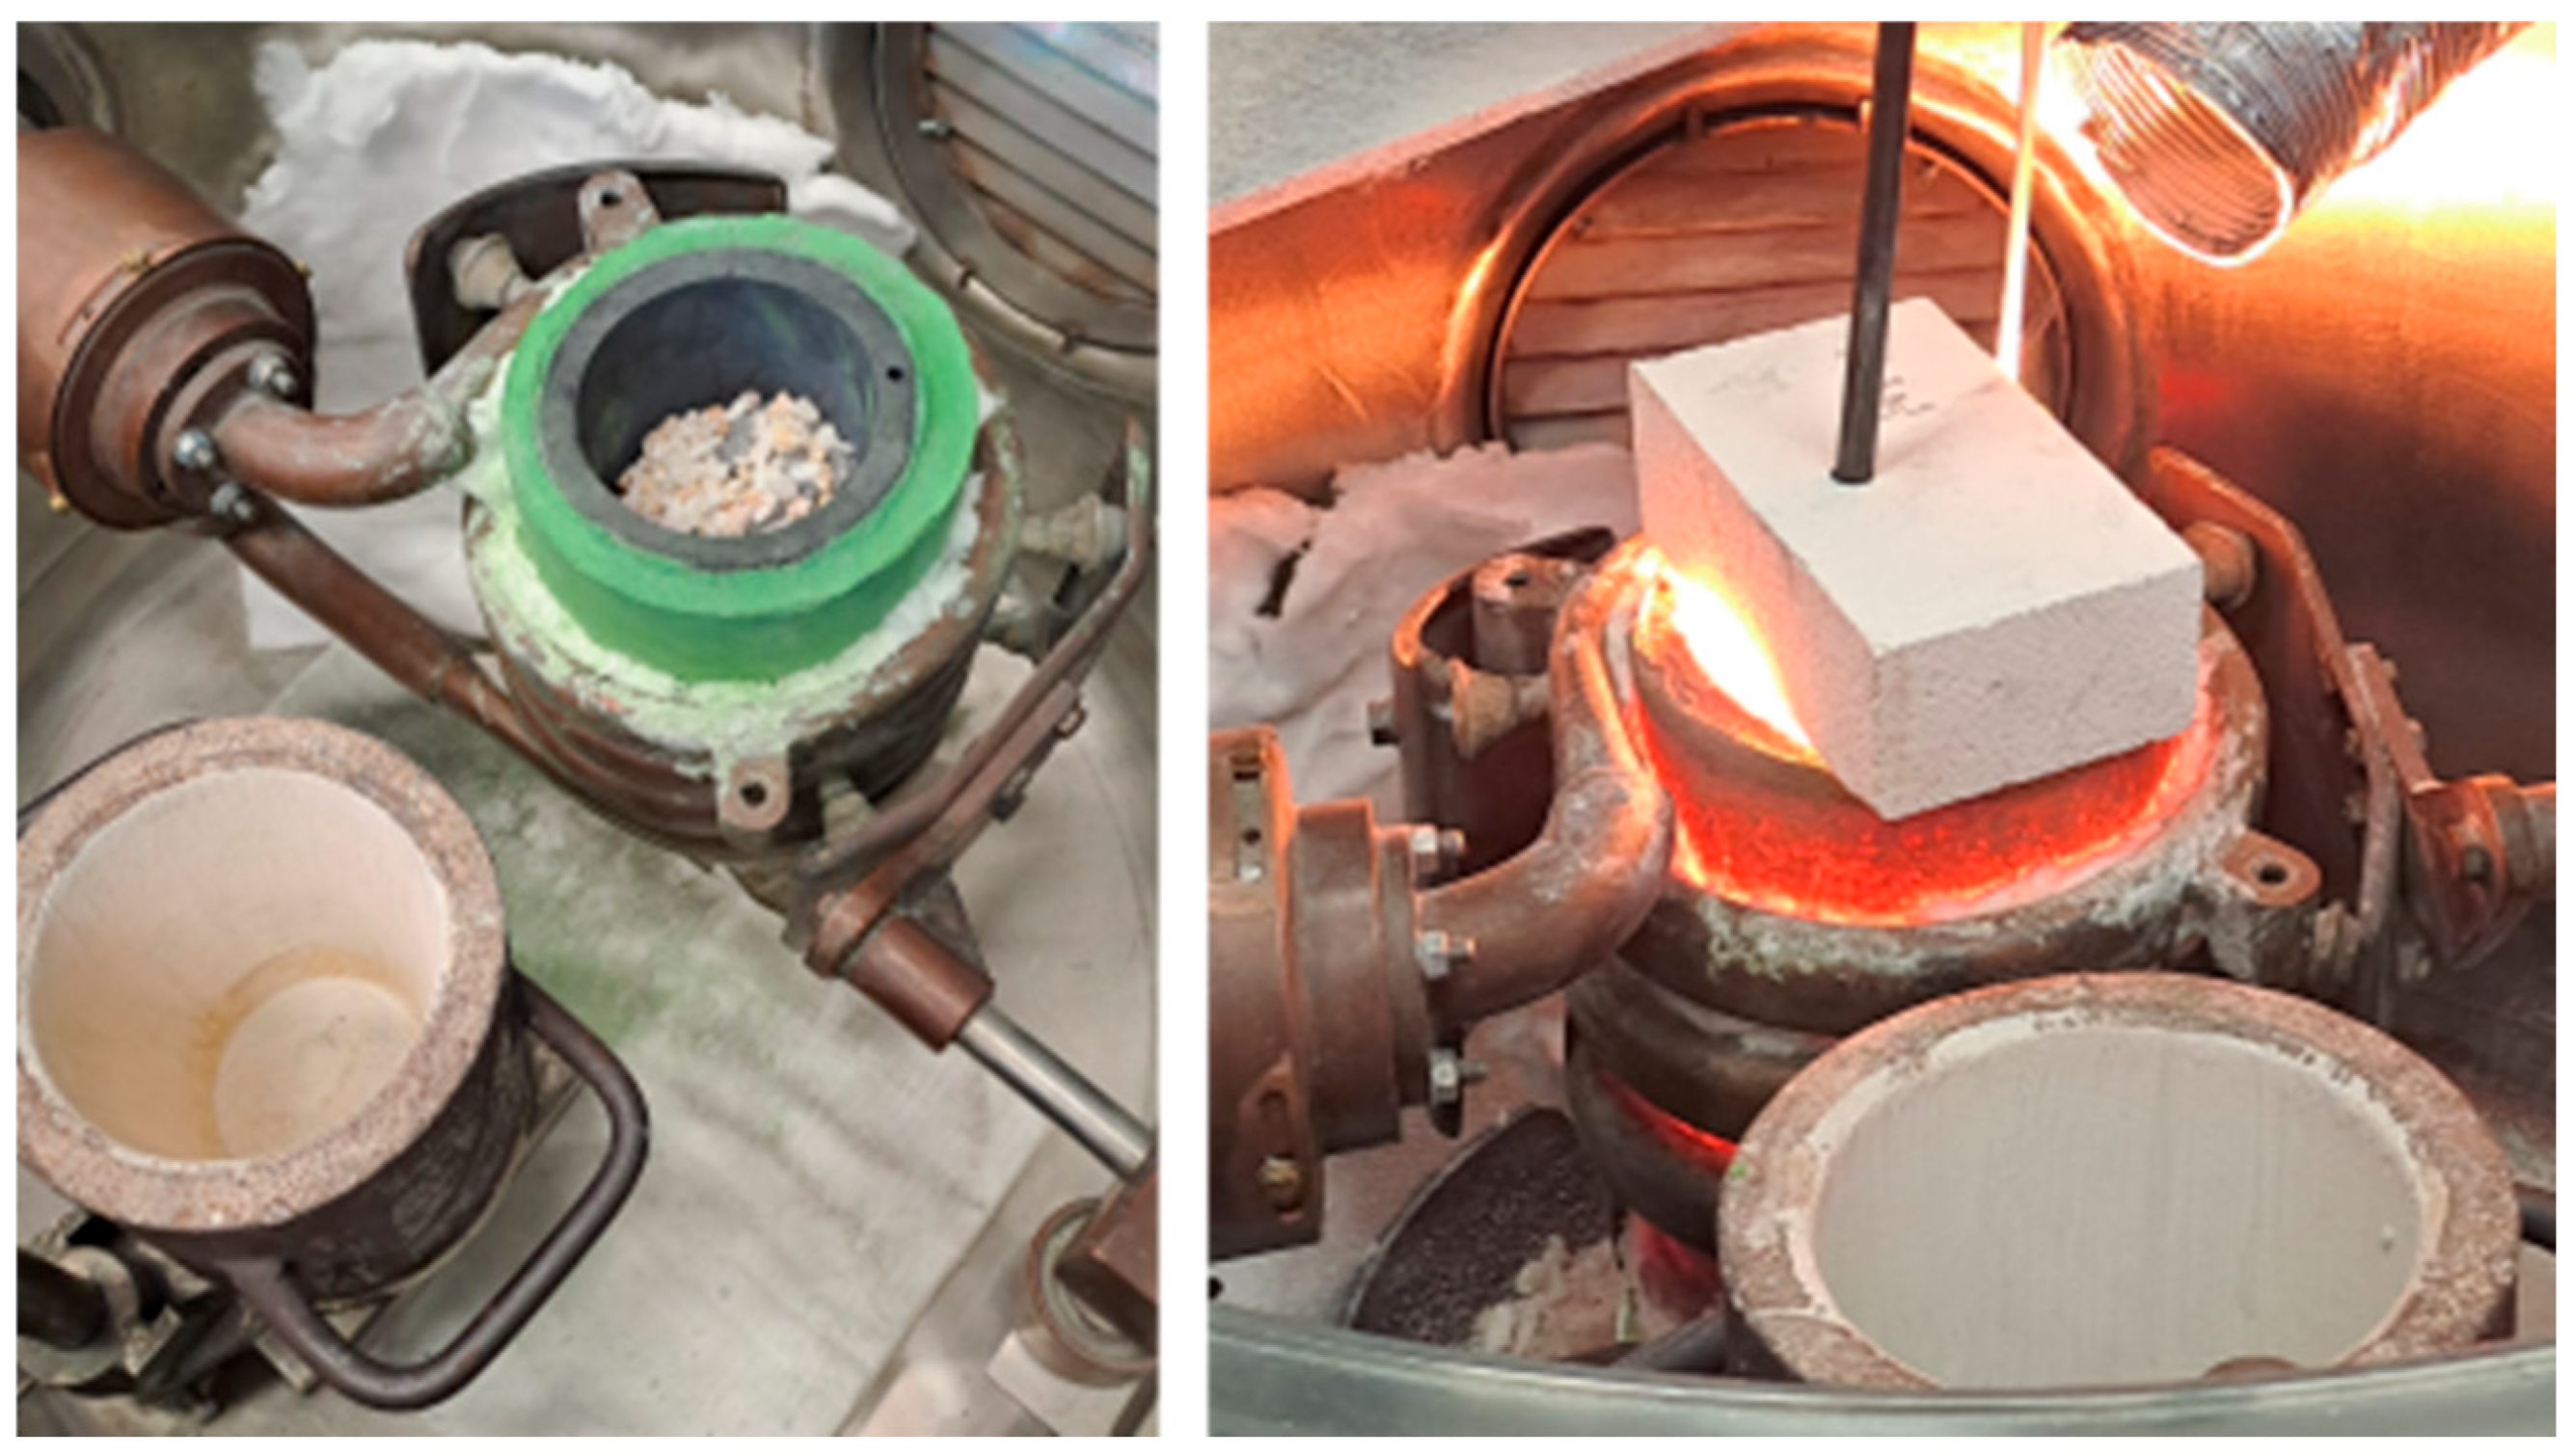
The furnace setup is shown in Figure 5. The left image depicts the configuration before trial start, with the thermocouple, graphite lance, and refractory brick lid removed. In front of the crucible, a pre-dried alumina-coated casting mold is visible. The right image shows the setup during experimental operation.
Figure 5.
Furnace setup before and during trials.
The experimental procedure was as follows: First, the furnace was filled with slag, the lid was closed and the slag was melted. Upon reaching 1650 °C during slag melting, the melt was held for at least five minutes to ensure homogenization. Before charging the silicon alloy to the melt, which marked the start of the holding time, the melt was stirred with a graphite rod to verify full melting of the slag and enhance homogenization. After alloy addition, the temperature was adjusted to the experimental temperature of 1600 °C. During the experiments, the Si-rich metallic phase was observed to be located predominantly near the center of the slag phase surface, without apparent direct contact between the bulk metallic phase and the graphite crucible wall. After the completion of the holding time, the melt was poured into an alumina lined mold and allowed to solidify. During the experiment, a constant argon flow was set to 3 L/min.
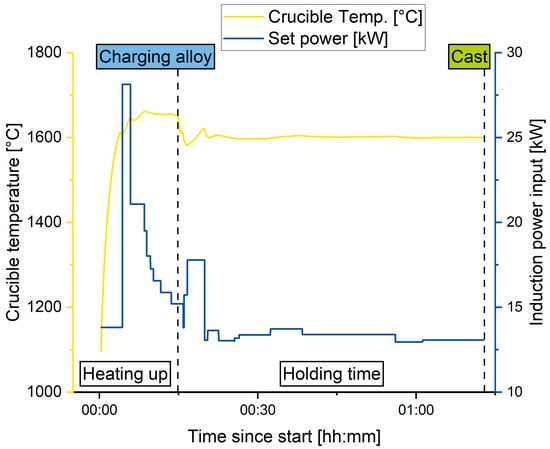
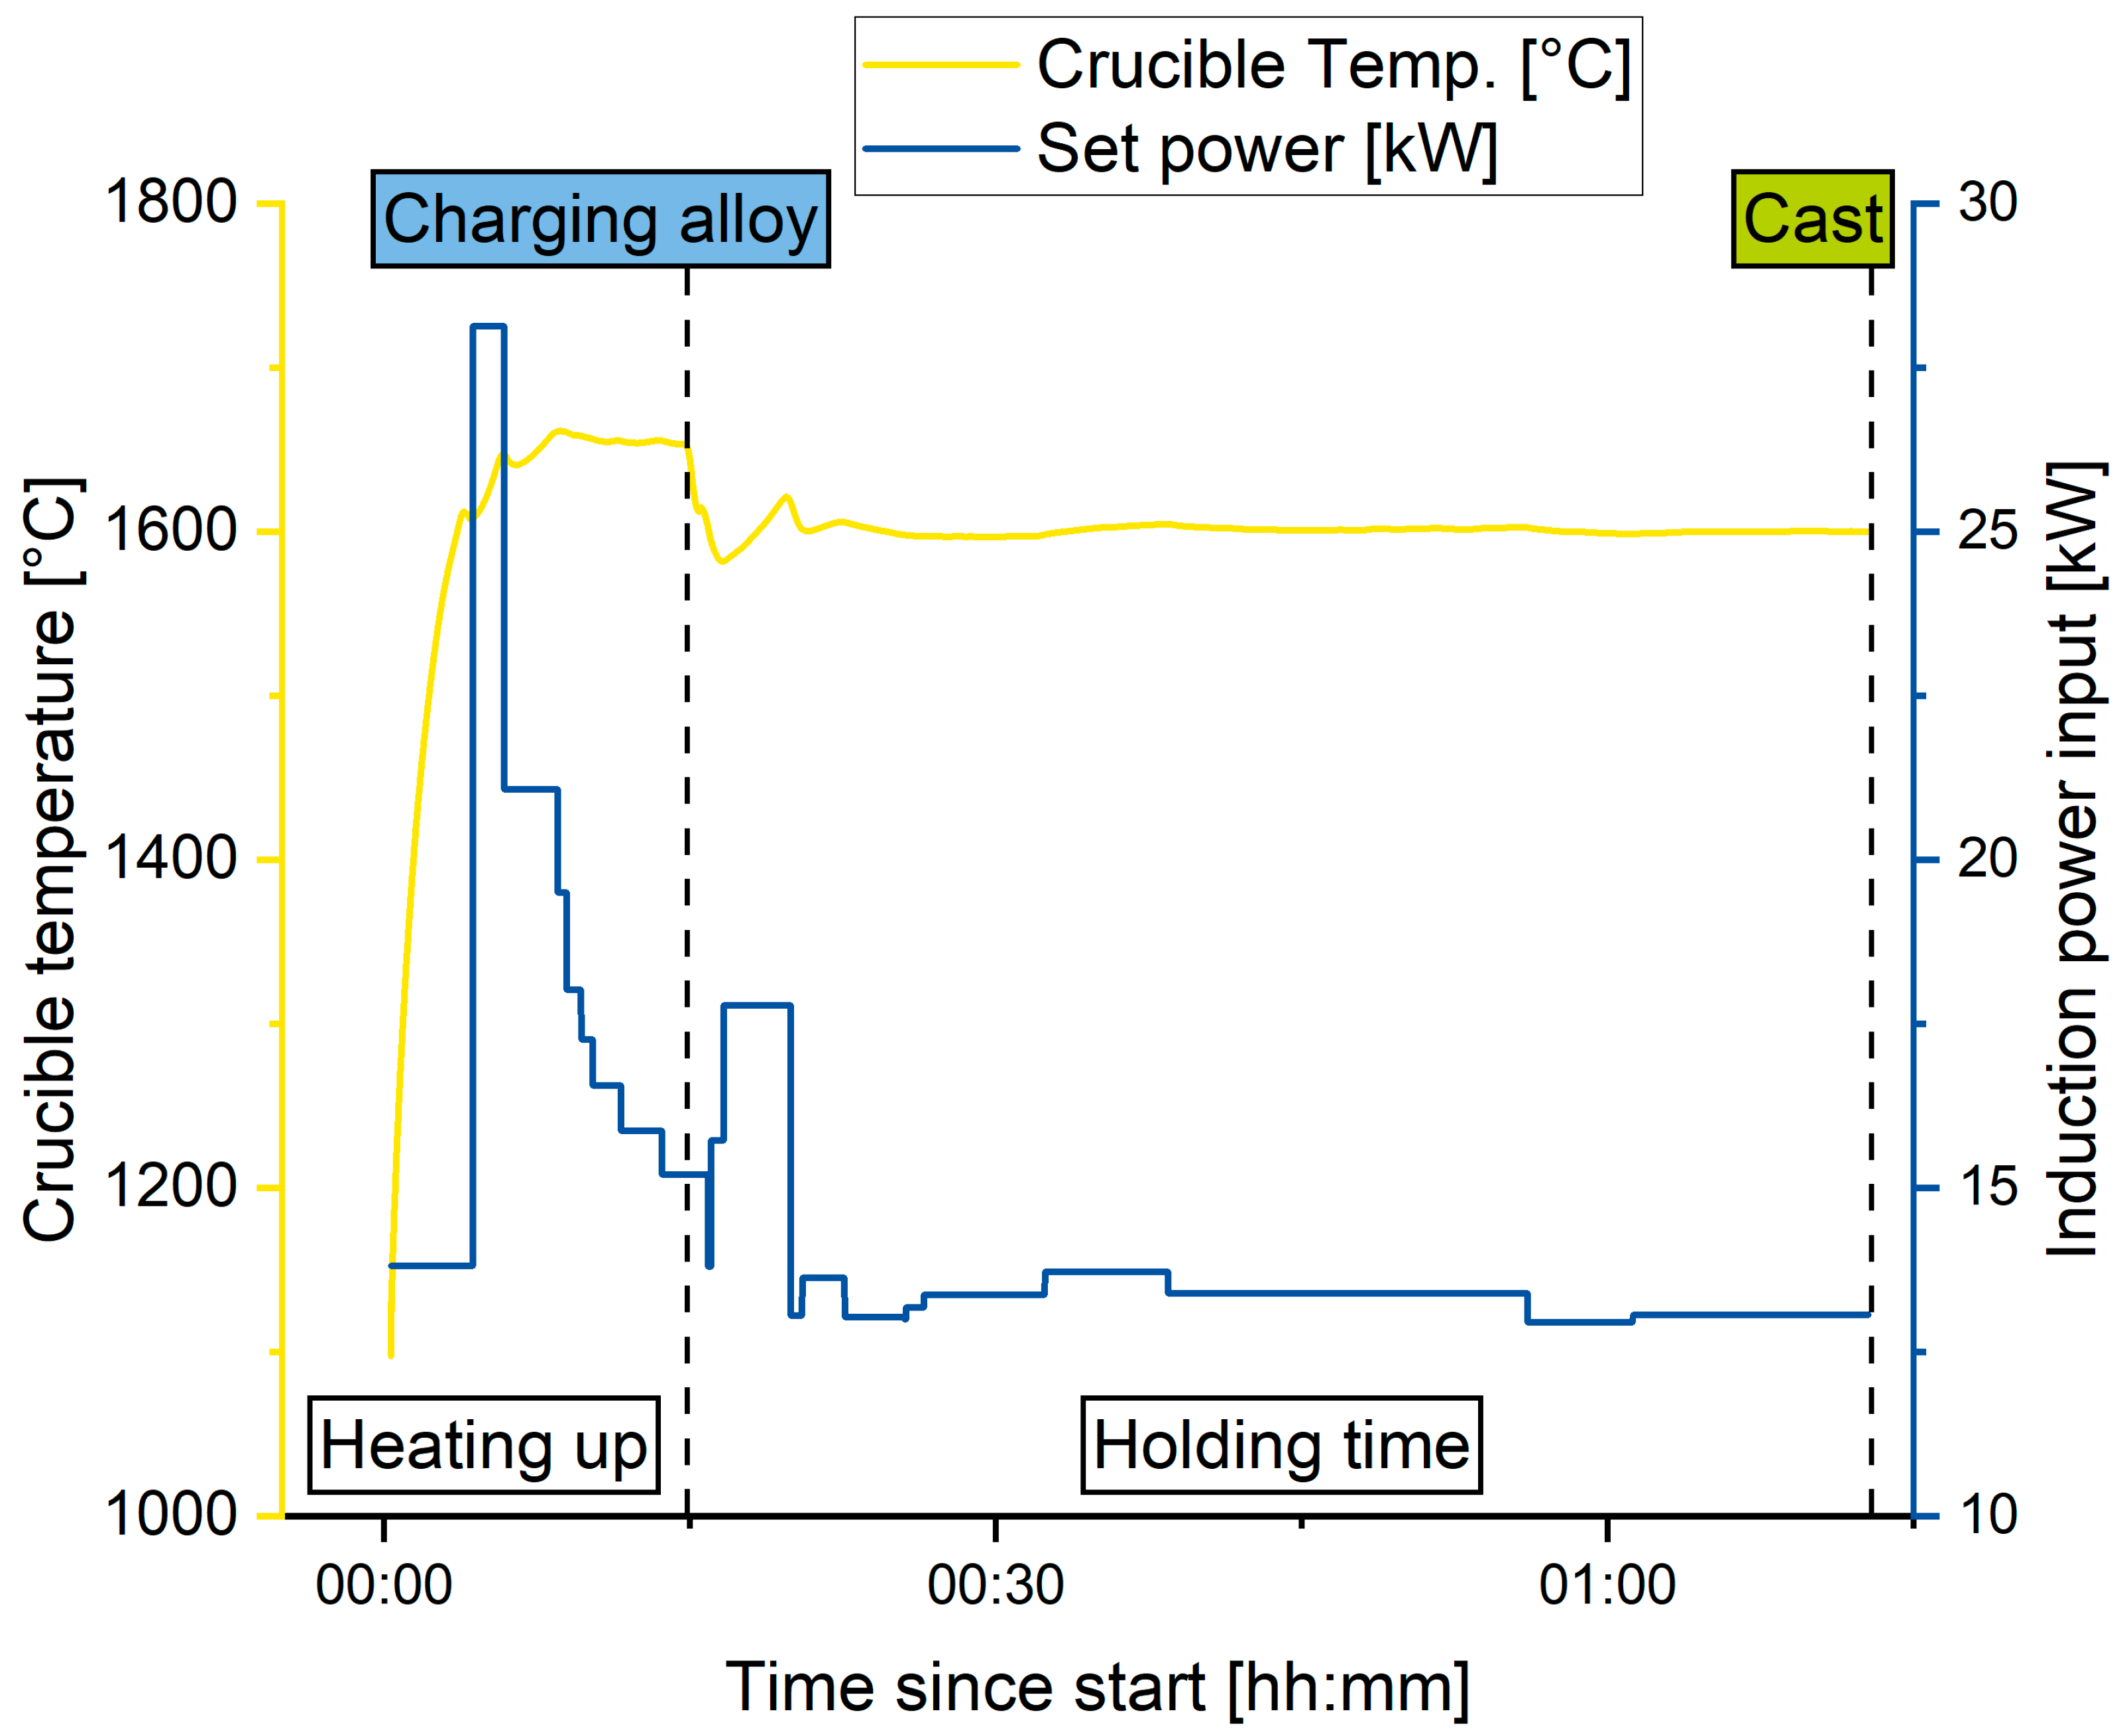
Both the alloy and the slag phase were cast at the same time, and the silicon alloy was mostly able to coagulate and settle above the slag. An exemplary temperature and power curve from trial V18 is shown in Figure 6.
Figure 6.
Exemplary furnace operating curves for V18.
After each trial, the crucible was cleaned using zirconia-coated tools to ensure a clean crucible for the following trials. By pouring the melt, several tests could be carried out with the same crucible, as it was already well preheated after pouring. This drastically reduced the time required to melt the slag.
After the trials, the slag and alloy phase were separated for analysis. To ensure representative chemical analysis, the phases were carefully separated and only material without cross-contamination was used. The material was then crushed and homogenized, and the samples were milled to a particle size below 63 µm using a vibratory disc mill. Subsequently, the samples were pressed into pellets using CEREOX wax (FLUXANA GmbH & Co. KG, Bedburg-Hau, Germany) as a binder.
The samples of the main experimental campaign were then analyzed using a SPECTRO XEPOS XEP05 energy dispersive XRF.
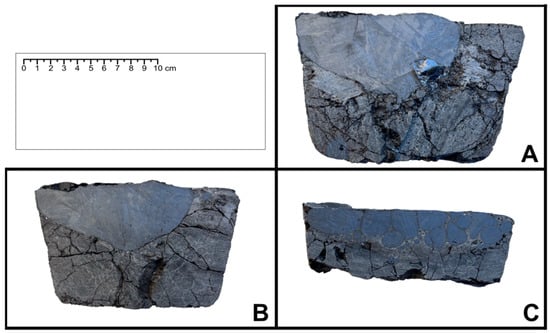
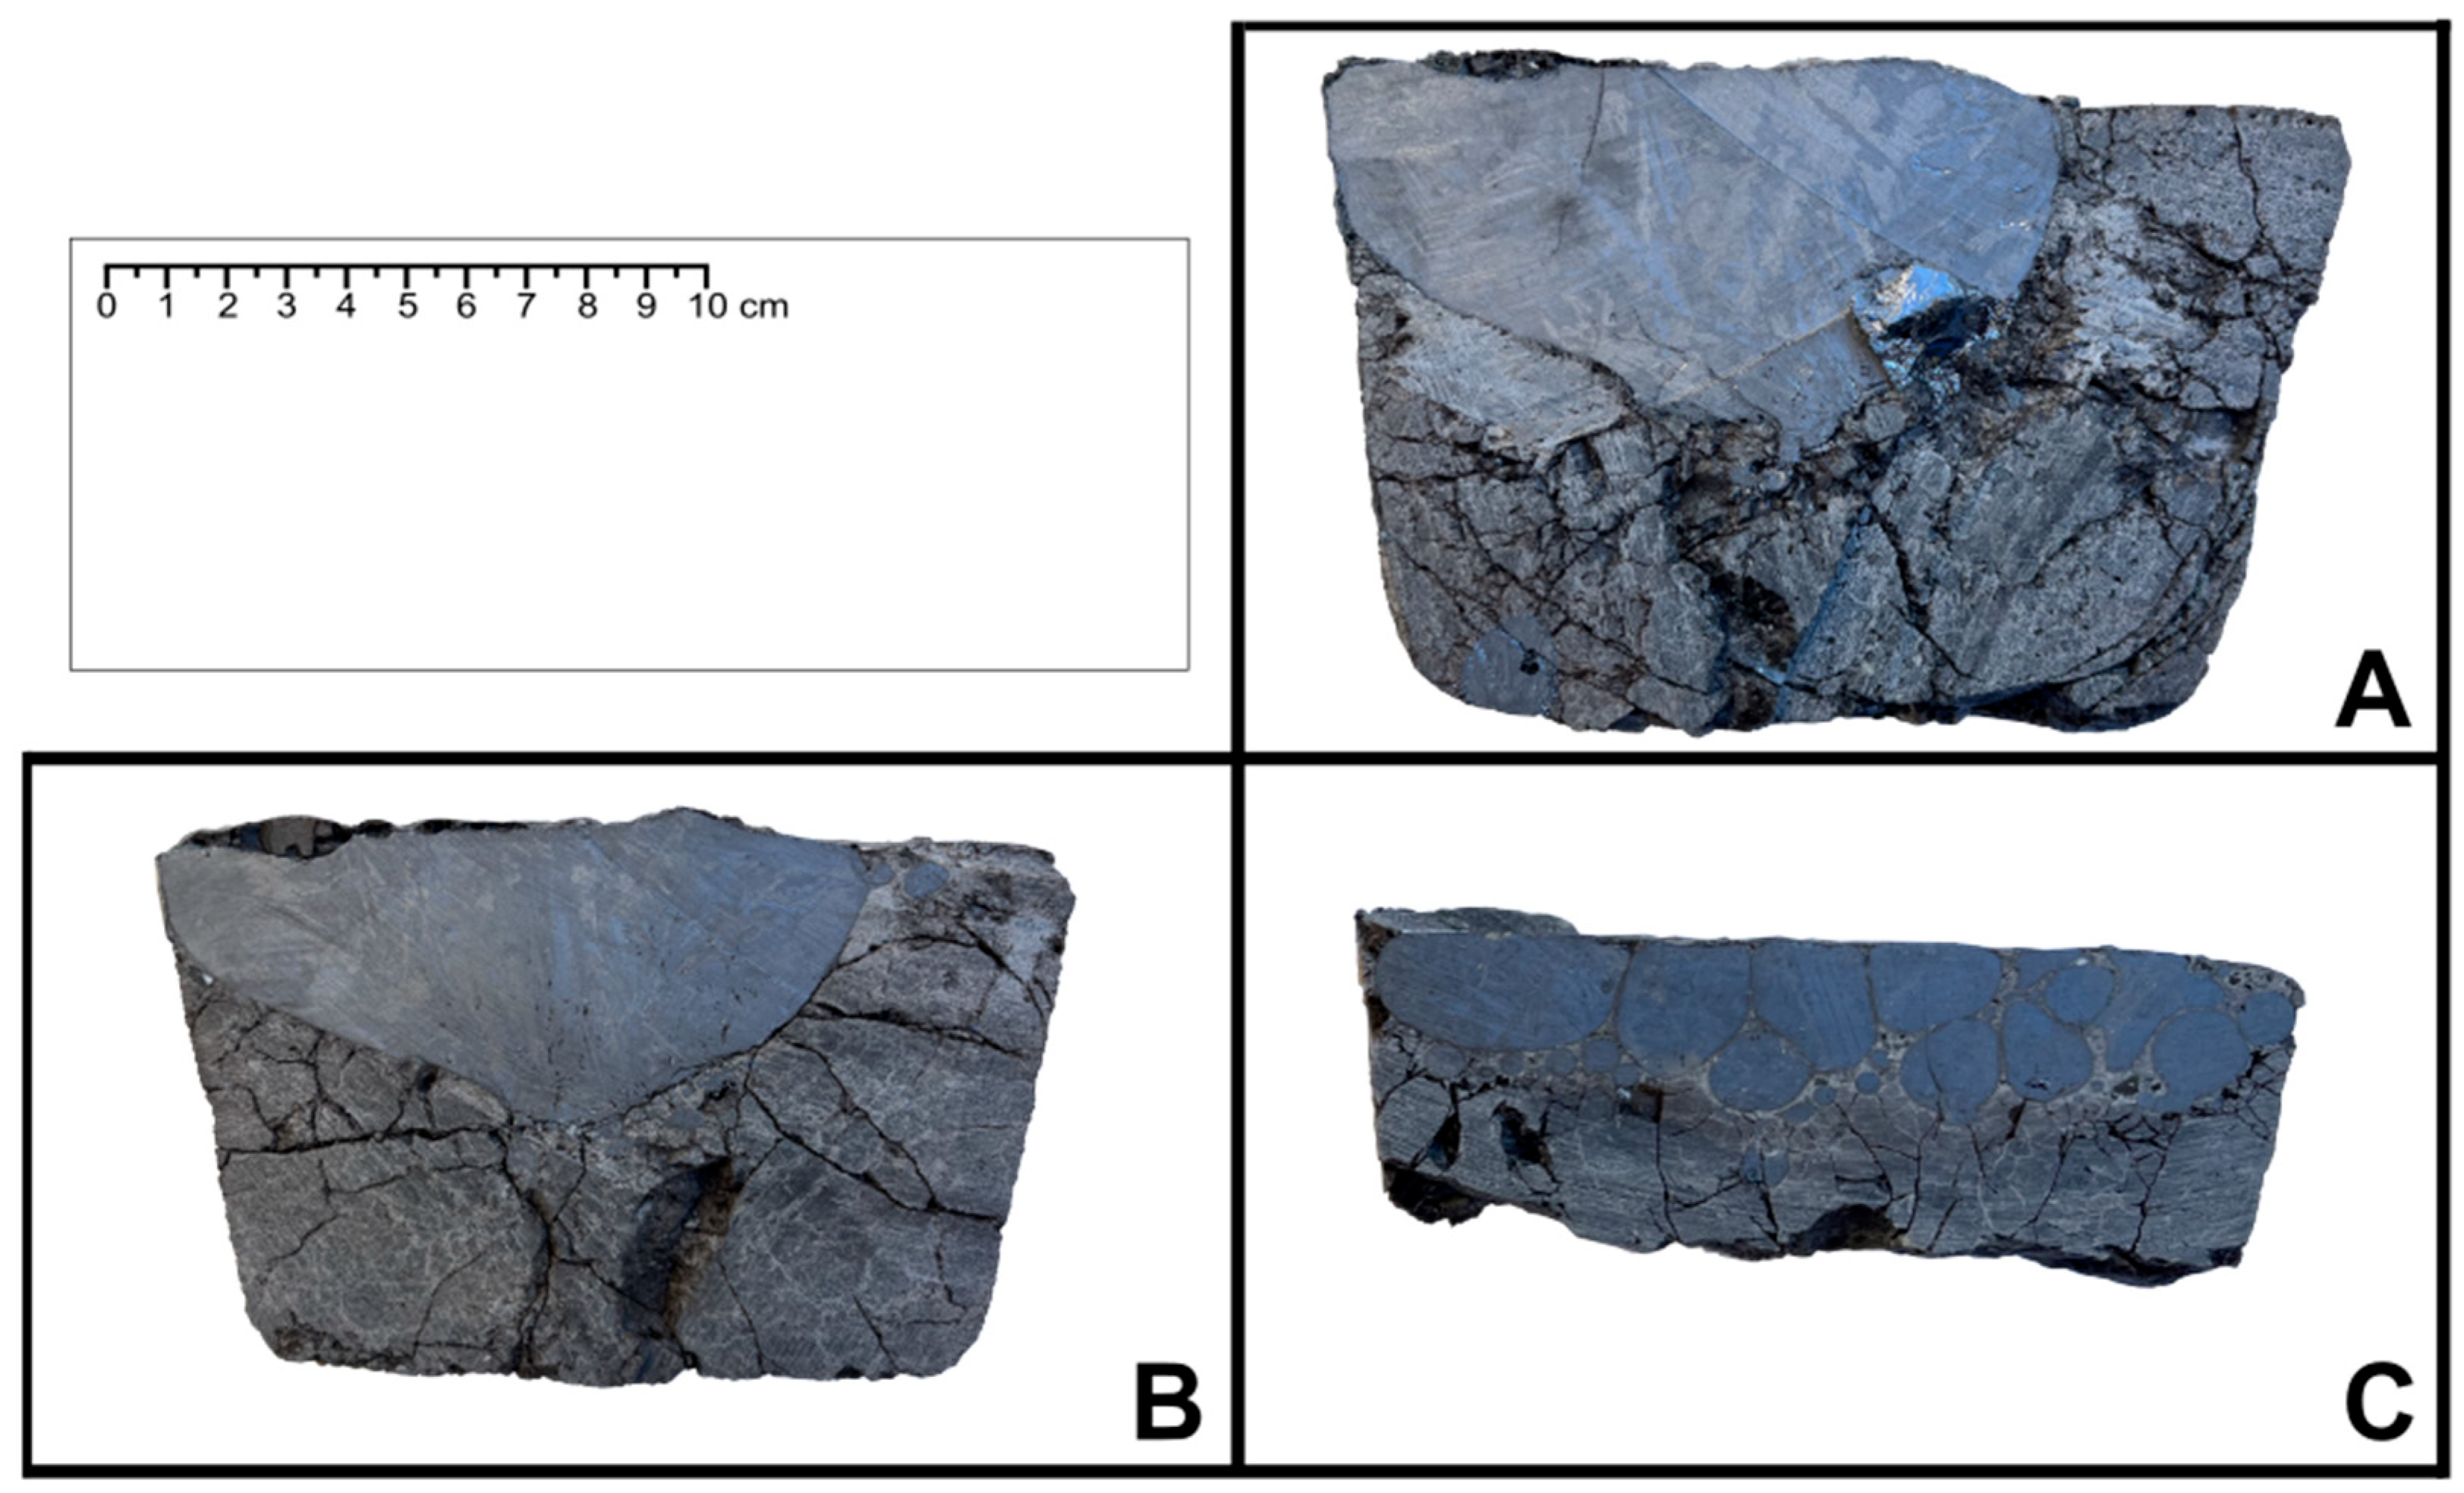
Three representative experiments were analyzed regarding phase separation and microstructure of the alloy. For these, the slag-to-alloy ratio was chosen to be as balanced as possible to ensure optical clarity and worst-case compositions based on simulations. Therefore, the three experiments with the slag-to-alloy-ratio set to 3:1 and a slag content of 60, 55 and 50 wt.% SiO2, respectively, were selected. For these experiments, the respective cast was cut axially with a water-cooled diamond cutting wheel to obtain a cross-section of the cast material. Images of these cross-sections are shown in Section 3.2.
3. Results
3.1. Chemical Analysis
ICP OES analysis of both silicon alloy and slag did not yield reproducible results. Therefore, XRF analysis was used to evaluate the trial results of the main experimental campaign. Because of physically based detection limits for XRF analysis and possible calibration inaccuracies, the sum of all elemental concentrations may deviate from 100%. Furthermore, XRF analysis does not determine carbon and oxygen concentrations. Although the presence of C and O in the alloy cannot be entirely ruled out, it was considered unlikely based on the experimental setup and the sample preparation procedure. Hence, the XRF analysis results were normalized. For better readability, only the following elements are listed: silicon, calcium, aluminium, iron, and titanium. Slag compositions were also normalized, and only the following compounds are given: SiO2, CaO, Al2O3, FeO, and MgO. For all other elements, only trace amounts were measured [17]. To further validate the trial results, additional combustion and inert-gas fusion methods are necessary to also determine possible trace amounts of C and O in the alloy.
For the main experimental campaign, the mean results of each parameter group are given in Table 4. The relative increase in normalized Si concentration was calculated according to Equation (3):
where wSi,initial and wSi,final represent the normalized Si concentrations of the initial and recovered alloys, respectively. This parameter describes the relative change in Si concentration. The variance and standard deviation were calculated based on the relative increase in normalized Si concentration using the sample variance (n − 1), with two replicate experiments per condition (n = 2). They are given in Table 4. The individual normalized alloy compositions determined by XRF can be found in Table S1 in the Supplementary Materials. A mass balance was established for the experiments. However, quantitative interpretation was limited by uncertainties associated with material losses during processing, including splashing and casting. Consequently, the mass balance did not provide a sufficiently reliable basis for a quantitative assessment of the refining process. Therefore, the evaluation focused primarily on the qualitative analysis of the experimental results. The mass balance results are provided in Supplementary Table S3.
Table 4.
Normalized alloy composition results for experimental groups of main experimental campaign, determined with SPECTRO XEPOS XEP05 XRF.
In Table 5, the averaged slag composition results for each experimental group are given.
Table 5.
Normalized slag composition results for experimental groups of main experimental campaign, determined with SPECTRO XEPOS XEP05 XRF.
3.2. Visual Observations and Phase Separation
Cross-sections of the casts from V10, V11, and V12 are used to evaluate the phase separation and solidification behavior for the tested slag SiO2 concentrations. The cross-sections are shown in Figure 7.
Figure 7.
Cast cross-sections of (A) V10, (B) V11 and (C) V12, with V12 only showing the upper part of the cast because of lower structural integrity of the slag phase.
The cross-sections of V10 and V11 show similar phase separation behavior, forming a coalescent oval alloy phase on top of the slag. In V10, only a small alloy inclusion is visible at the bottom of the cast, whereas in V11, a small alloy droplet is entrapped on the right side of the alloy phase near the slag surface. Overall, the phase separation between slag and alloy is comparatively good.
In contrast, the cross-section of V12 shows several differences. The alloy does not form one coalescent phase on top of the slag. Instead, multiple alloy droplets of varied sizes are visible. The larger droplets are located near the upper surface of the cast, while smaller droplets are located below them. Phase separation is incomplete in this case, and manual separation of the phases is considerably more difficult. The slag is also less robust during handling and cutting. In addition, the alloy shows smaller grains and a more pronounced microstructure than the alloys from V10 and V11.
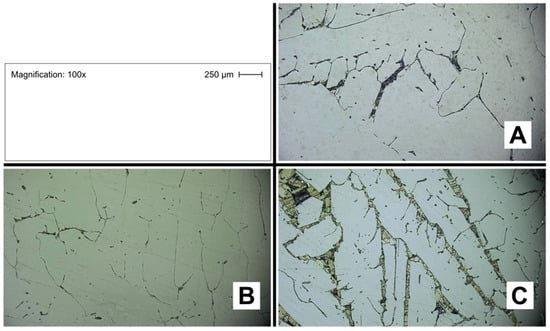
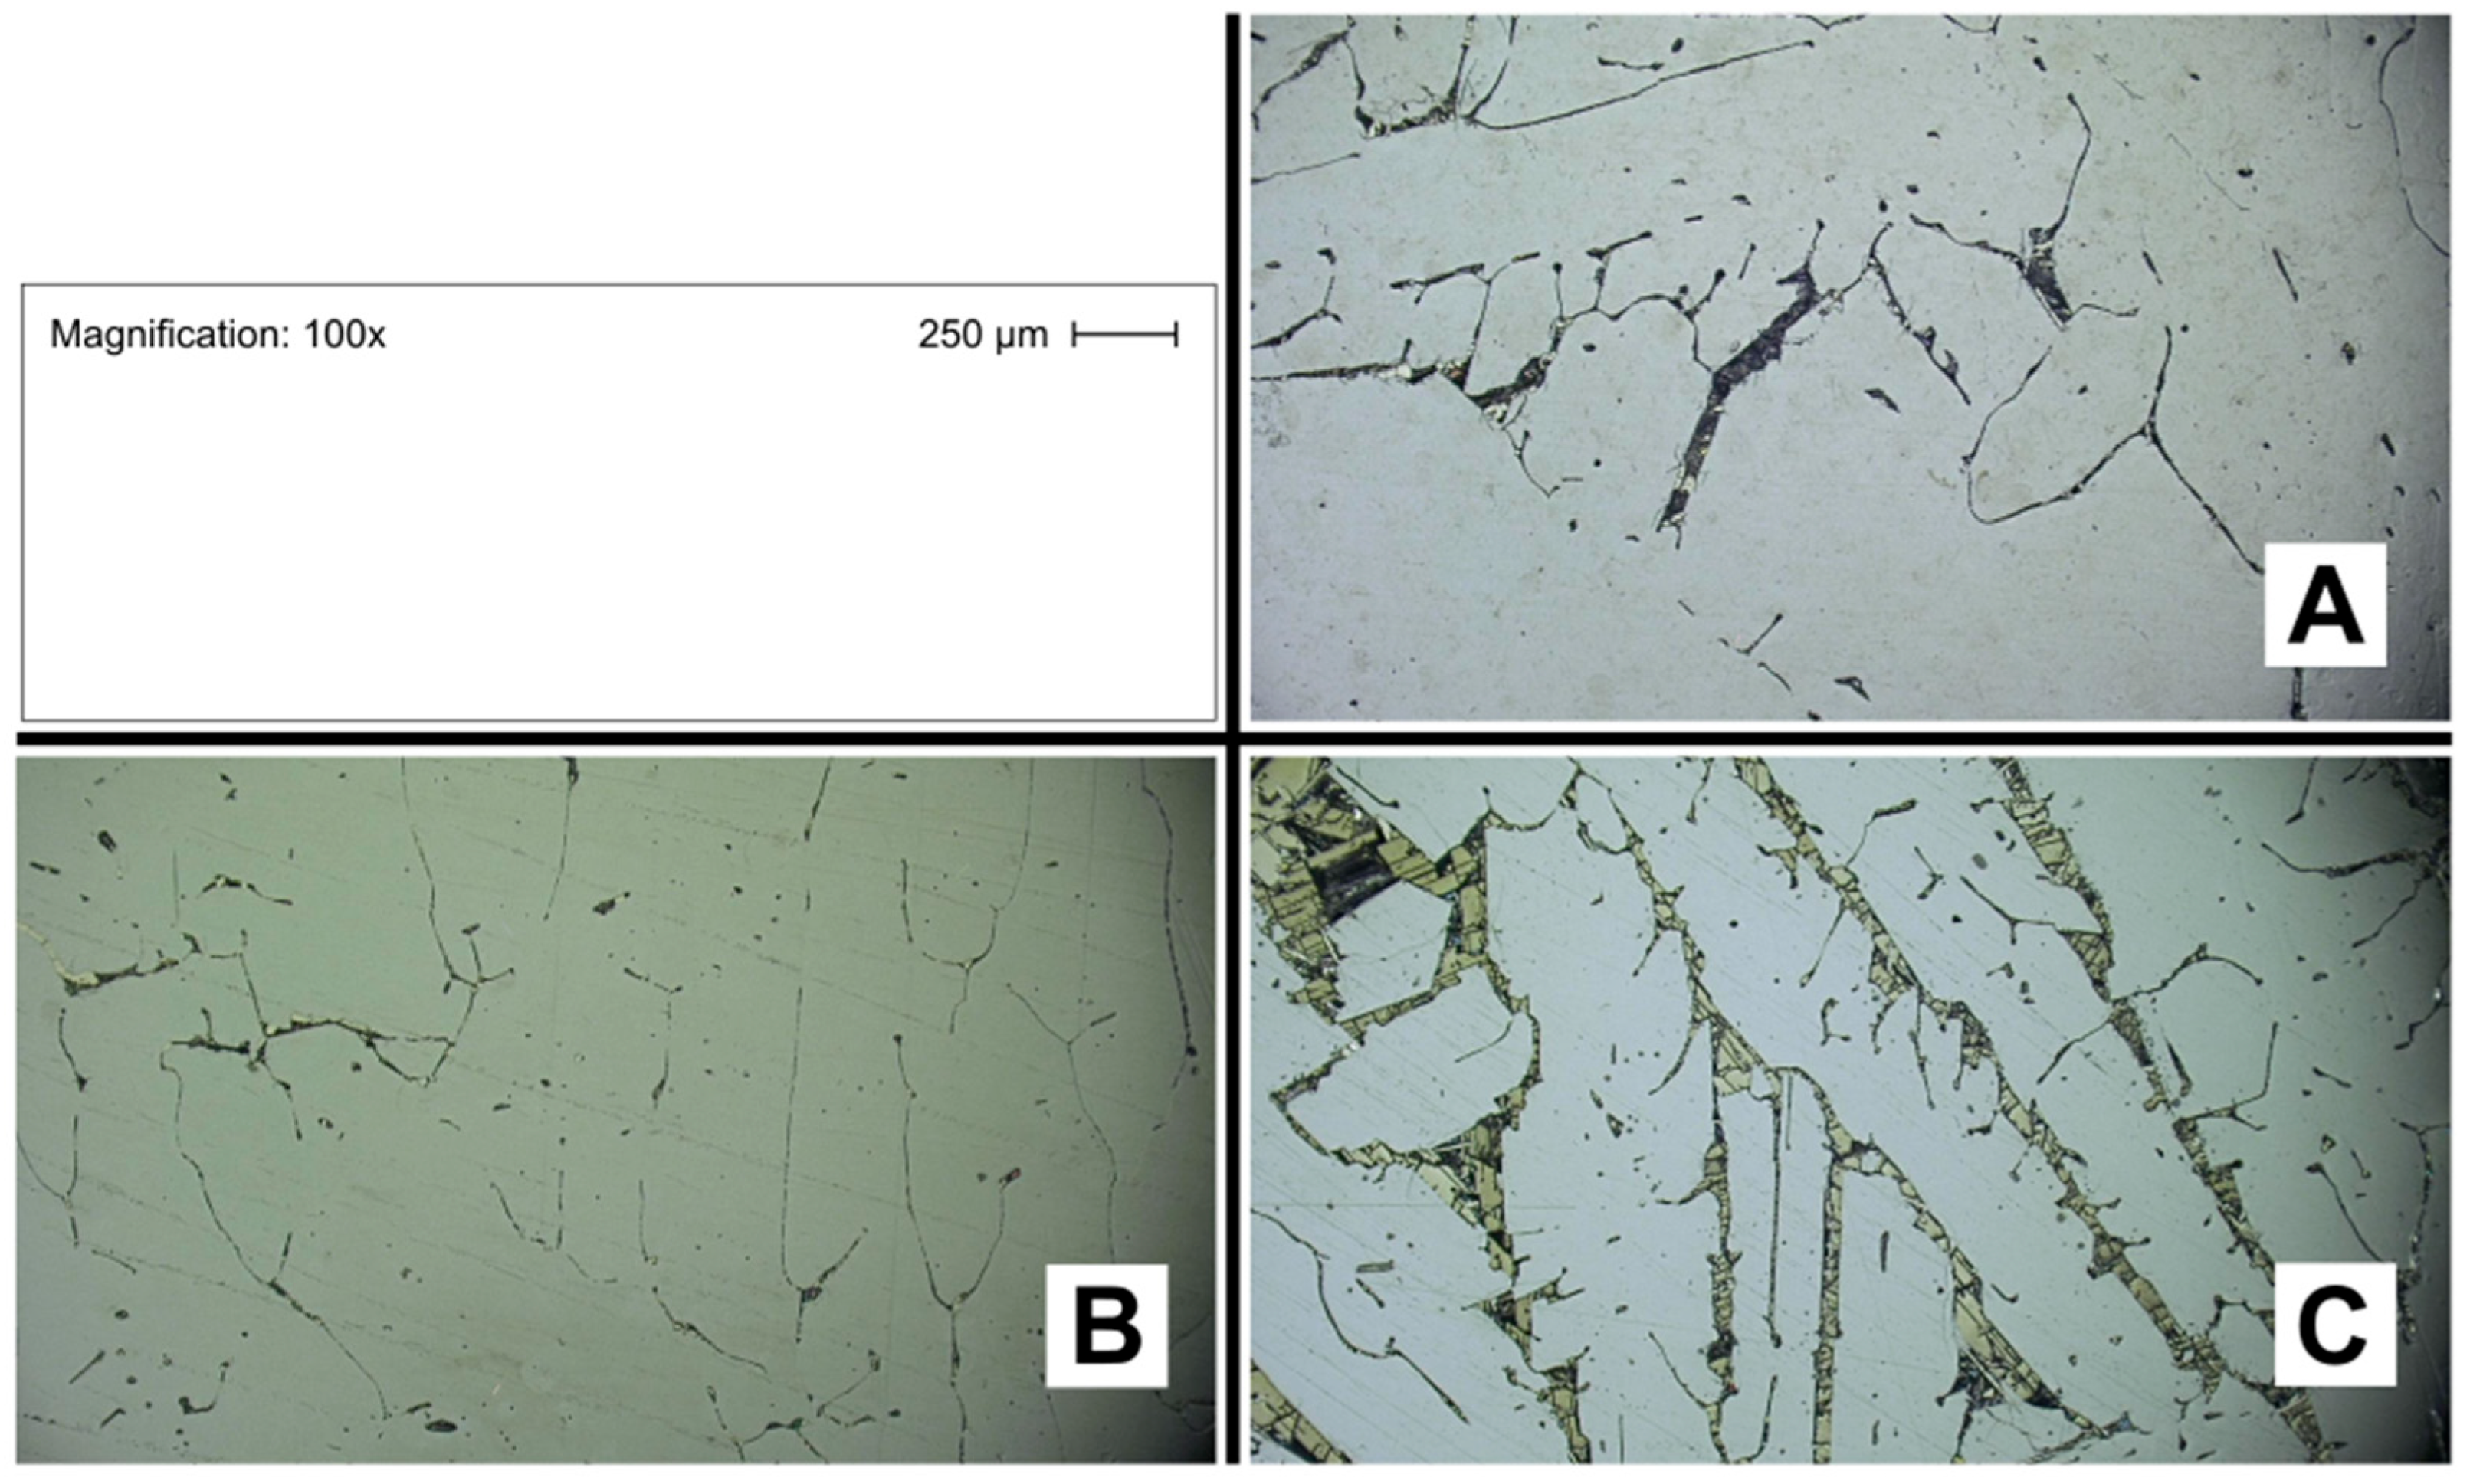
Images of the prepared etched surfaces recorded with a light microscope at 100× magnification are shown for V10, V11, and V12 in Figure 8.
Figure 8.
Microstructures of (A) V10, (B) V11 and (C) V12 under light microscope.
V10 and V11 again show similar appearances. Their surfaces are bright and light-colored, with some darker stripes and inclusions visible in the material. For V12, the microstructure appears different from those of V10 and V11. The bright alloy surface is more densely streaked with broader dark impurity phases, some of which show a triangular morphology. Since V12 also exhibits a lower normalized Si concentration determined by XRF and higher impurity concentrations than V10 and V11, the increased number of dark phases is consistent with the lower refining performance of the 50 wt.% SiO2 slag system. However, due to the poorer phase separation of these samples, partial contamination by entrapped slag phases cannot be excluded.
4. Discussion
4.1. Normalized Si Concentration in the Alloy
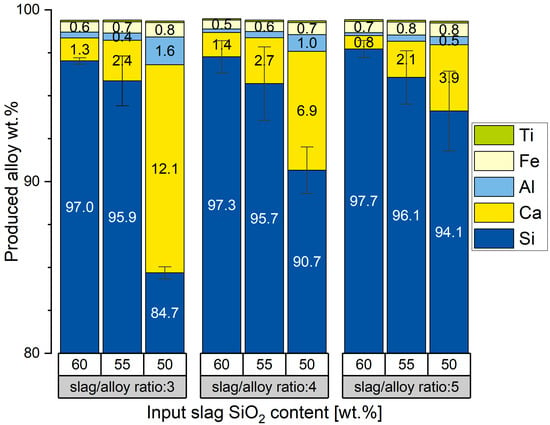
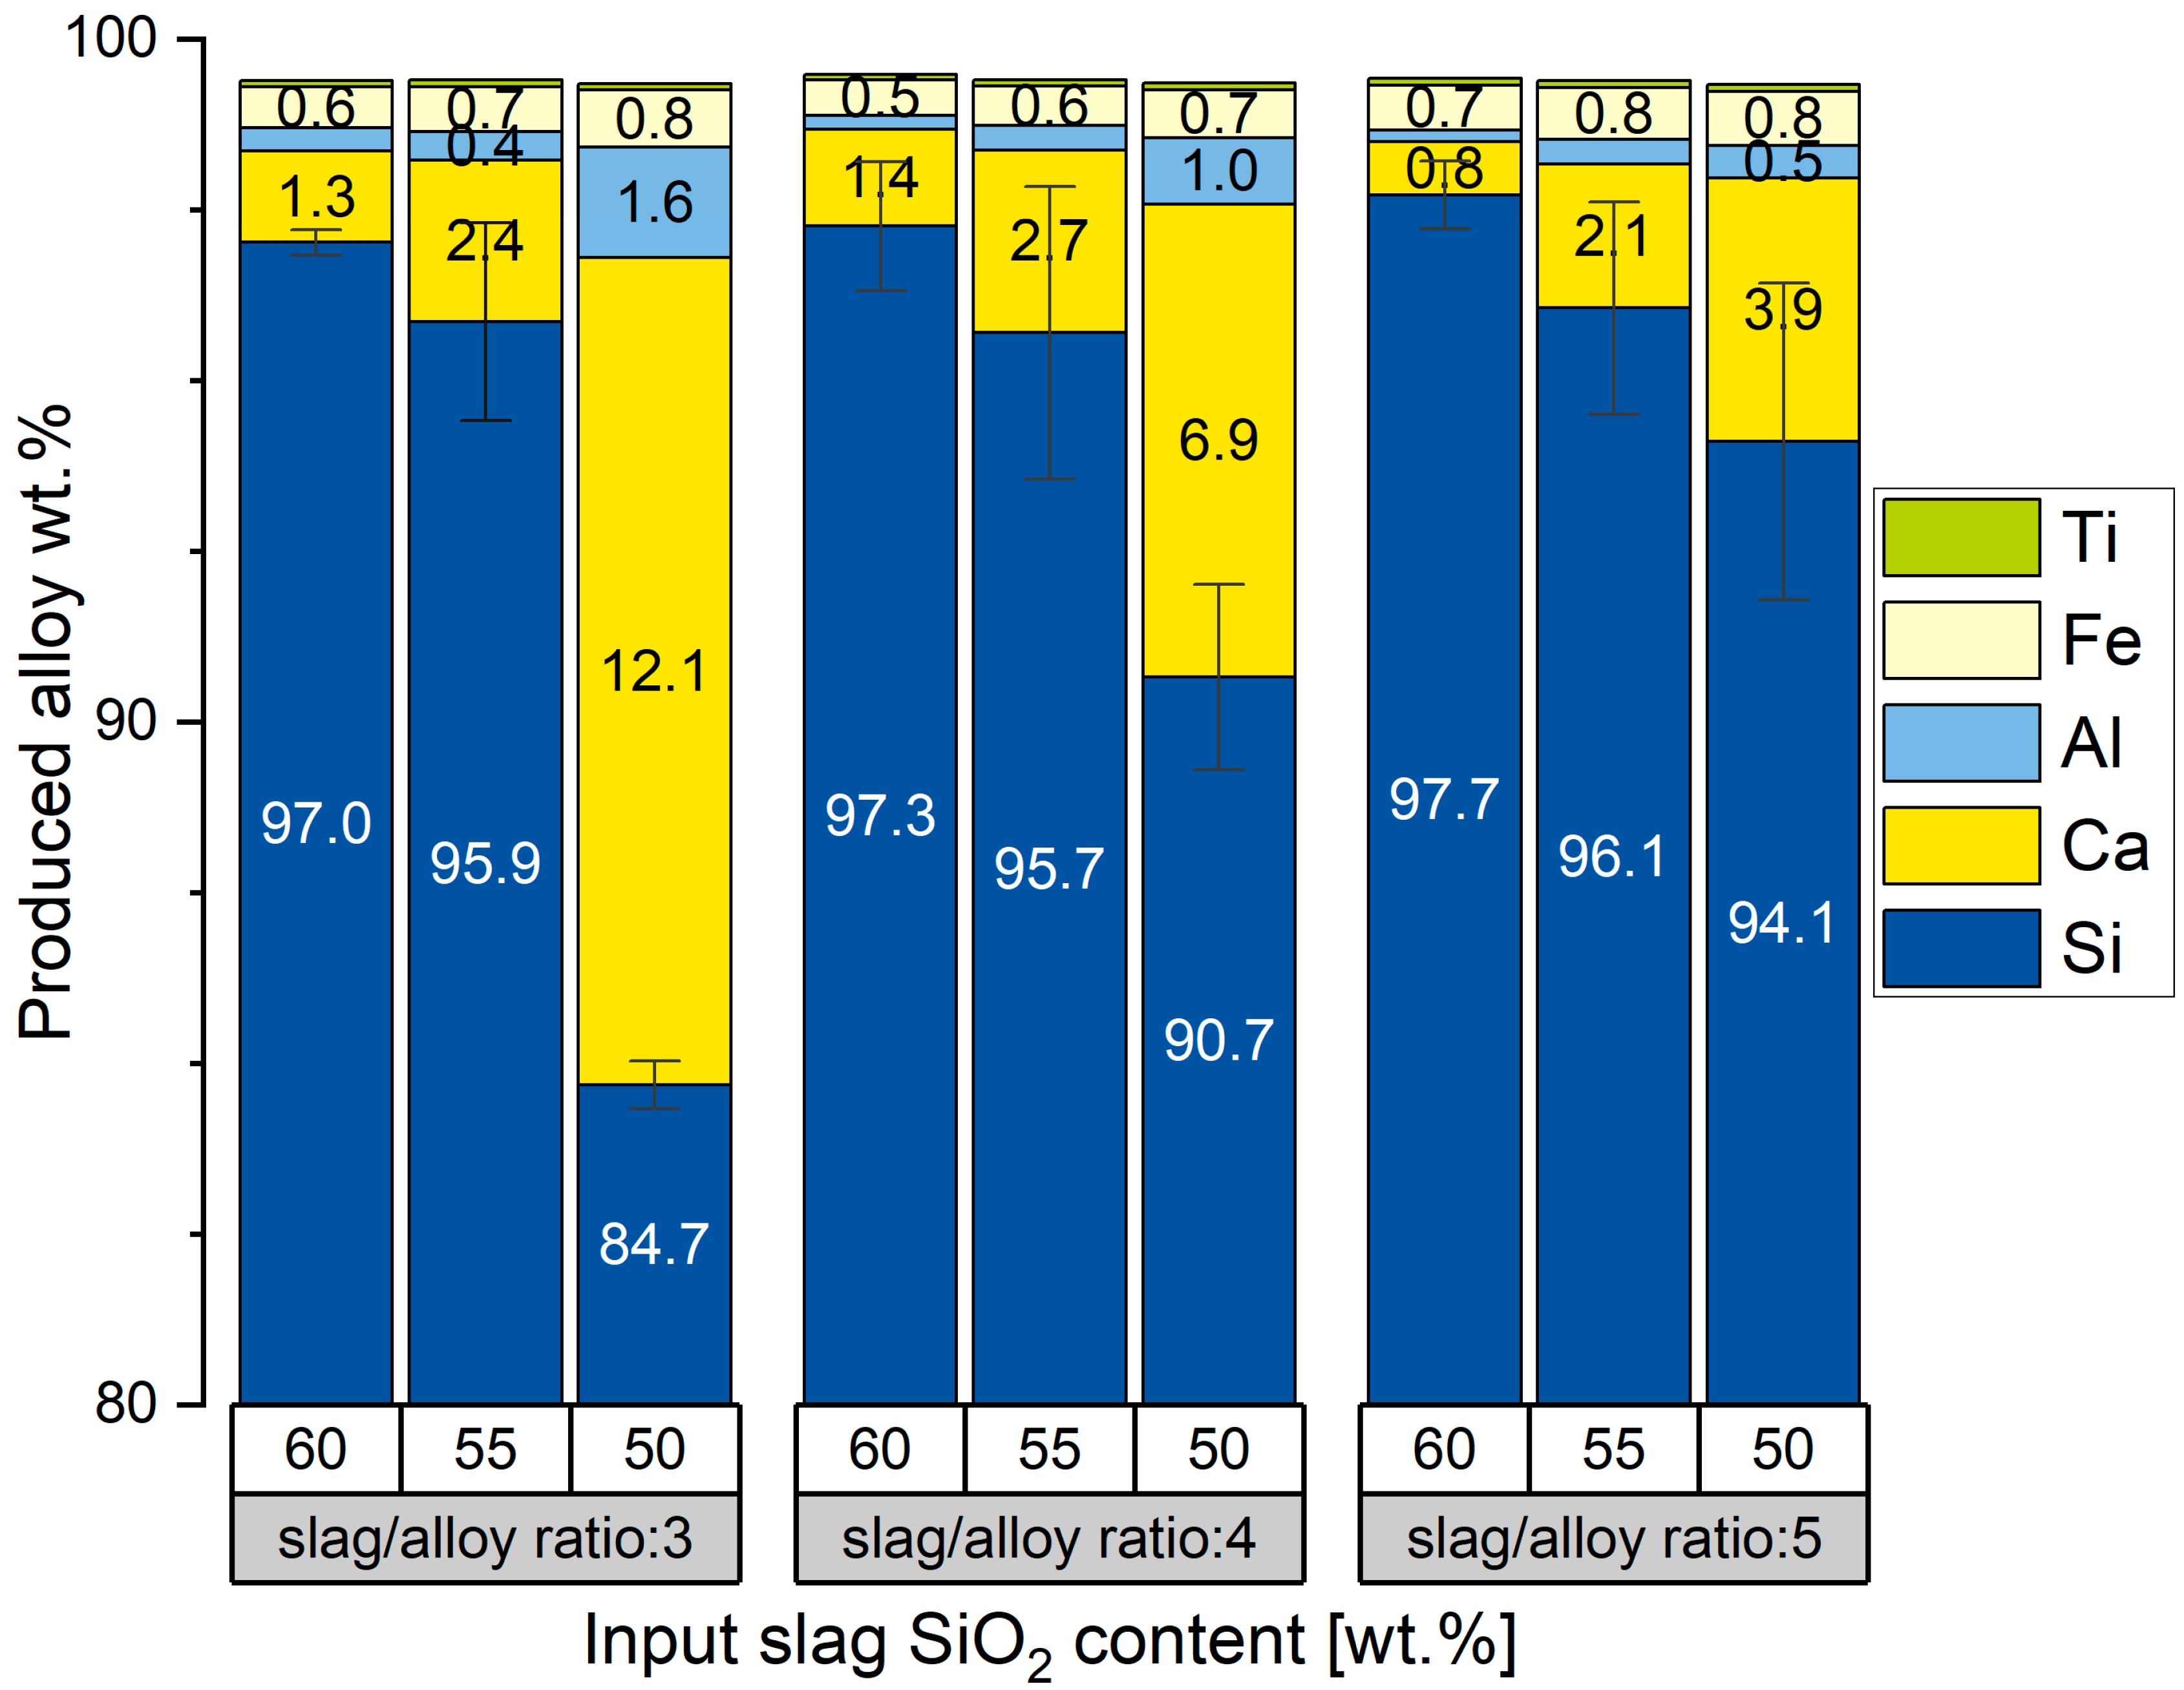
The two factors investigated in the study indicated an influence on the normalized Si concentration of the alloy. Since the main goal of this study was to determine favorable parameters for alloy refining, the discussion focuses on the normalized Si concentration in the alloy determined by XRF. Observable trends in experimental compositions are summarized and analyzed. The alloy compositions obtained for the different parameter combinations are shown in Figure 9.
Figure 9.
Normalized compositional analysis of all produced alloys via XRF, shown as the arithmetic means of two parallel trials for each parameter combination.
The whisker error bars in Figure 9 depict the standard errors of the normalized Si concentration of the produced alloys from the two parallel trials of each parameter combination. Across the investigated slag-to-alloy ratios, the normalized Si concentration of the recovered alloy increased with increasing initial SiO2 content of the refining slag. The increase in normalized Si concentration between initial slag compositions of 50 and 55 wt.% SiO2 was particularly pronounced for slag-to-alloy ratios of 3:1 and 4:1, whereas the corresponding difference was smaller at a ratio of 5:1. For the experiments with initial slag compositions of 55 and 60 wt.% SiO2, increasing the slag-to-alloy ratio had a comparatively smaller effect on the resulting normalized Si concentration.
The initial assumption that slag viscosities at SiO2 concentrations of 60 wt.% represent an upper limit for processing could not be confirmed, as all slags remained readily processable. Based on the predefined parameter range, the most favorable refining conditions regarding normalized Si concentration in the alloy can therefore be identified as follows:
- Initial SiO2 content in the slag of 60 wt.% or higher;
- Slag-to-alloy ratio of 5:1 or higher.
The highest purities in the main experimental campaign were achieved in the two single experiments V4 and V16, with normalized Si concentrations of 98.20 and 98.22 wt.%, respectively. For these experiments, the produced alloy corresponds to Grade A silicon according to standard ASTM A922 [18], or designation Si97 according to DIN 17560-2 [19].
In the following section, the average product alloy compositions are compared to the equilibrium calculations in FactSage 8.2 to determine if the preliminary simulation results were valid.
4.2. Experimental Results vs. Equilibrium Calculations for Alloys
In Table 6, the FactSage 8.2 calculations are compared with the experimental results. For experiments where the respective measured normalized elemental concentration in wt.% exceeds the value calculated in FactSage 8.2, a green arrow is depicted next to the measured normalized concentration and a red arrow next to the FactSage 8.2 value. For experiments where the measured normalized concentration is lower than the simulated value, a red arrow is depicted next to the measured normalized concentration and a green arrow next to the simulated value.
Table 6.
Comparison between normalized experimental alloy compositions and results of FactSage 8.2 simulations [13]. ▲ indicates the higher value, ▼ indicates the lower value, and ● indicates equal values when comparing experimental results with FactSage 8.2 calculations.
The comparison shows that the achieved normalized Si concentrations were equal or higher than predicted for all slag-to-alloy ratios at initial SiO2 contents of 55 wt.% or higher. Overall, normalized Si, Ca, and Al concentrations are higher than predicted, whereas normalized Fe concentrations are lower than predicted. While the deviations of aluminium and titanium from the simulations are comparatively small, calcium shows the highest residual concentration among the impurities in the trial results and, in some cases, does not approach the equilibrium concentration. This may indicate that metastable conditions were present, or that equilibrium was not reached due to incomplete reaction during the holding time. For the experiments with a slag SiO2 content of 50 wt.%, the predicted normalized Si concentration was not reached, regardless of the slag-to-alloy ratio. This could partly be explained by the observed incomplete phase separation, which may have led to contamination of the alloy samples by entrapped slag phases.
Another explanation for the reduced refining effect of the slags with an initial SiO2 content of 50 wt.% can be derived from the equilibrium simulations. In the FactSage 8.2 calculations, the resulting slag is in equilibrium with an additional solid phase, specified as α-Ca2SiO4. This solid phase would account for approximately 41% of the slag in experiments V3 and V12 and approximately 14% in experiments V6 and V15. For V9 and V18, the simulated liquidus temperature is slightly below 1600 °C. However, these calculations only describe the equilibrium state and do not provide direct information on the actual phase distribution during the experiments. Therefore, the possible presence of solid particles may have affected melt homogeneity and phase separation, but this cannot be confirmed from the present results.
In the equilibrium calculations, iron is the most abundant impurity by mass in the alloy phase. Since the other impurity elements exhibit higher oxygen affinities than iron, iron is expected to be reduced preferentially only after calcium and aluminium have largely reacted. However, the experimentally measured Fe concentrations are considerably lower than predicted by the simulations. This may indicate that iron reduction from the slag phase was kinetically inhibited or limited by mass transport. Overall, the deviations between the experimental results and the equilibrium calculations may indicate that equilibrium was not fully reached during the holding time, although effects of the experimental atmosphere and possible crucible interactions cannot be excluded. This is especially reflected by the higher residual Ca and Al concentrations in the alloy and the lower-than-predicted Fe concentrations. Since local slag composition, mixing behavior, and possible concentration gradients were not directly investigated, the exact reason for these deviations cannot be conclusively determined. Direct interactions between the Si-rich alloy and the graphite crucible were likely limited, as the metallic phase was predominantly surrounded by slag. Although SiO2 reduction at the slag–graphite interface cannot be excluded, the resulting SiO may be transported through the gas phase or react with graphite rather than directly enriching the alloy. Furthermore, possible carbon uptake and SiC formation cannot be entirely excluded, as carbon and oxygen were not independently quantified.
4.3. Spent Refining Slag
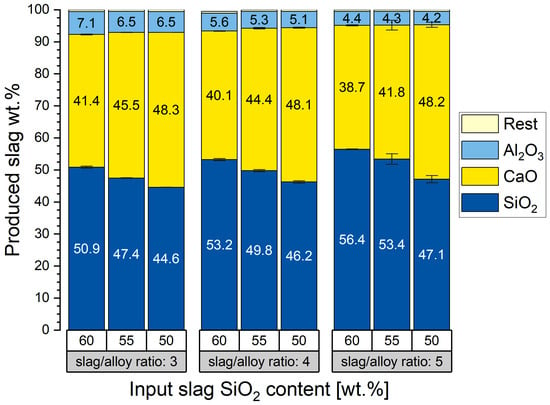
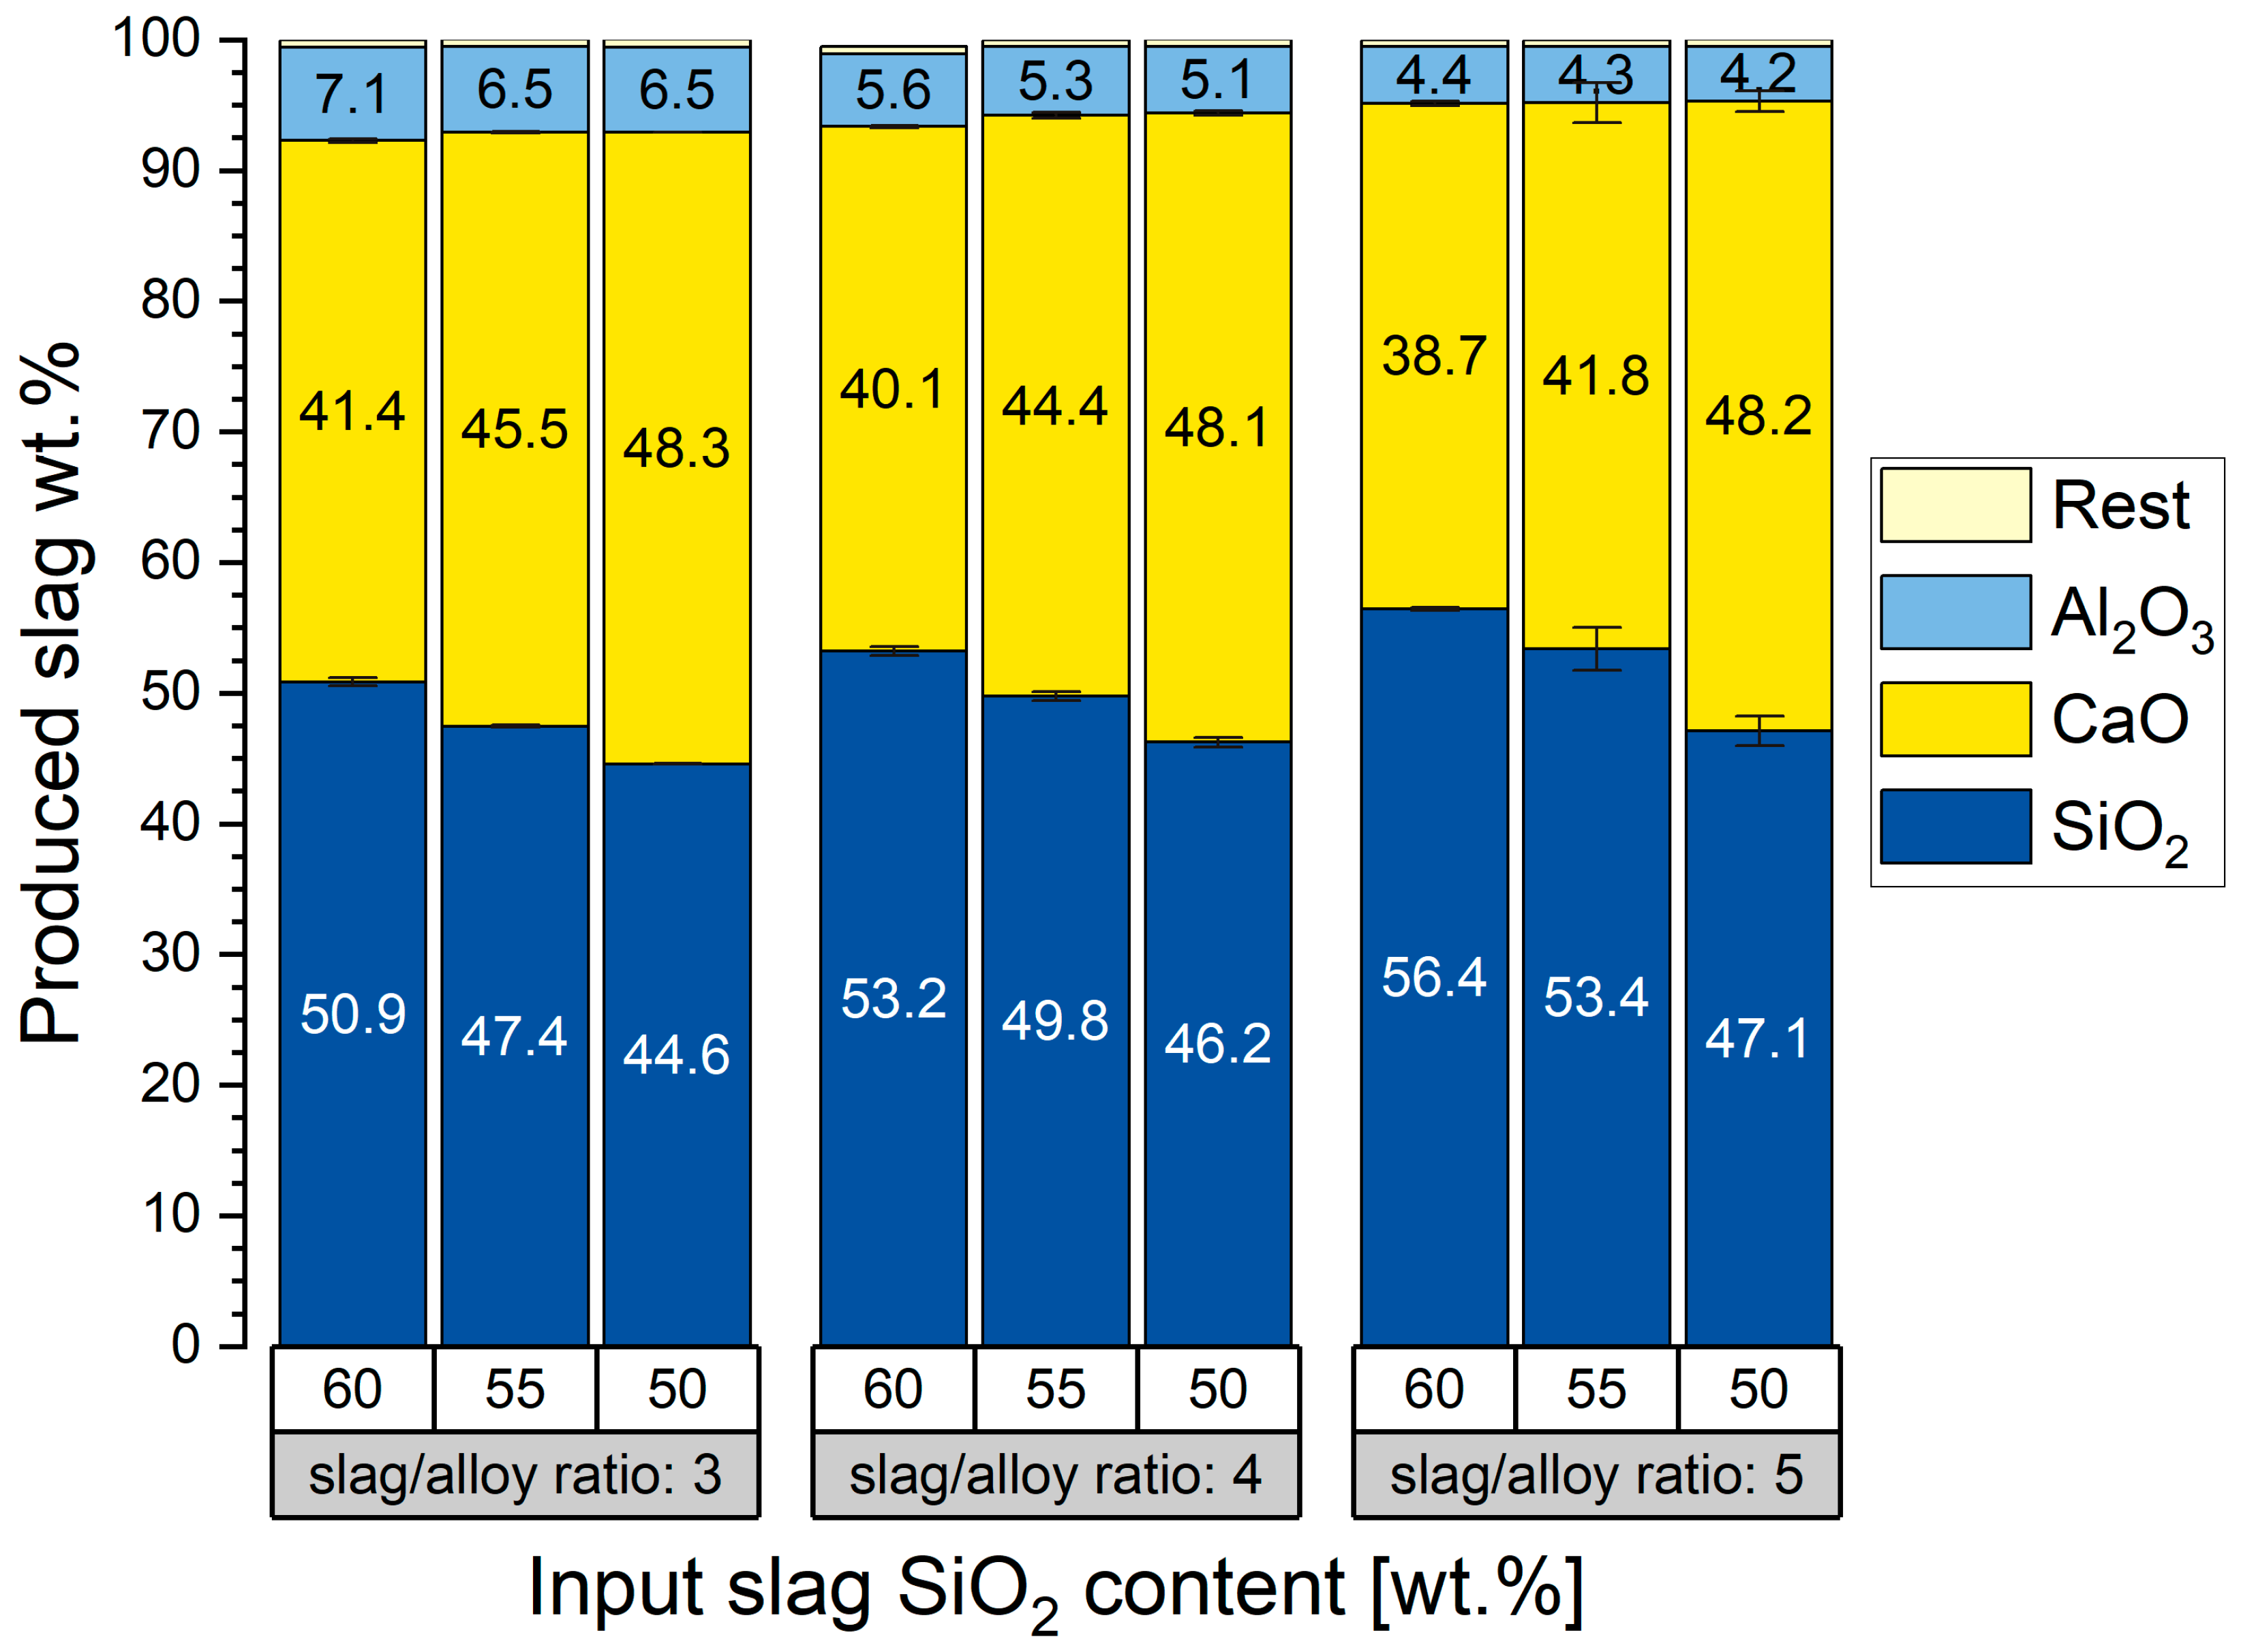
A graphical representation of the average slag compositions produced in the main experimental campaign is shown in Figure 10.
Figure 10.
Normalized compositional analysis of produced slags via XRF.
The error bars represent the standard errors of the mean for the normalized SiO2 and CaO concentrations of the produced slags. Because the slag was present in substantial excess relative to the alloy, with the lowest slag-to-alloy ratio in the main campaign being 3:1, compositional changes caused by the refining reactions represent only a comparatively small fraction of the total slag inventory. Consequently, the normalized spent slag compositions show less variation than the corresponding alloy compositions and therefore exhibit smaller standard errors. All produced slags contain substantial amounts of residual SiO2.
The viscosities of the spent refining slags were calculated using FactSage 8.2. With viscosities not exceeding 3.5 poise and liquidus temperatures not exceeding 1550 °C, the spent slags indicate sufficient processability at processing temperatures of around 1600 °C. The calculated thermophysical properties of experiments V10, V11, and V12 at 1600 °C using FactSage 8.2 can be found in Table S2 in the Supplementary Materials.
In the Equilib module of FactSage 8.2, viscosities and phase separation are not considered in compositional simulations. Only compositions in equilibrium are calculated by minimizing ΔG°. These properties may, however, still have a large influence on alloy purities. While lower slag viscosities and larger interfacial areas generally favor mass transfer and refining kinetics, these conditions do not necessarily promote subsequent phase separation. An enlarged interfacial area resulting from incomplete separation of slag and alloy after casting may complicate further processing, especially if separate tapping of the liquid phases is not possible.
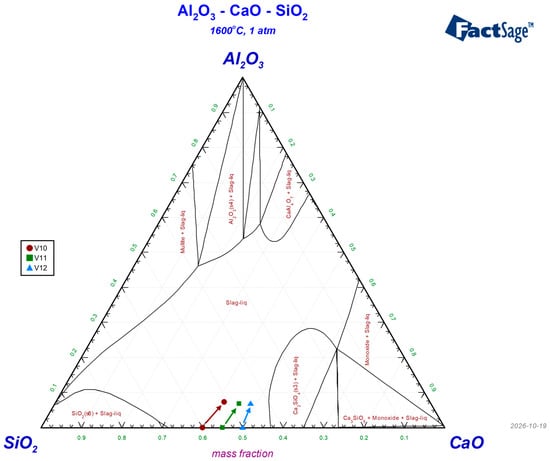
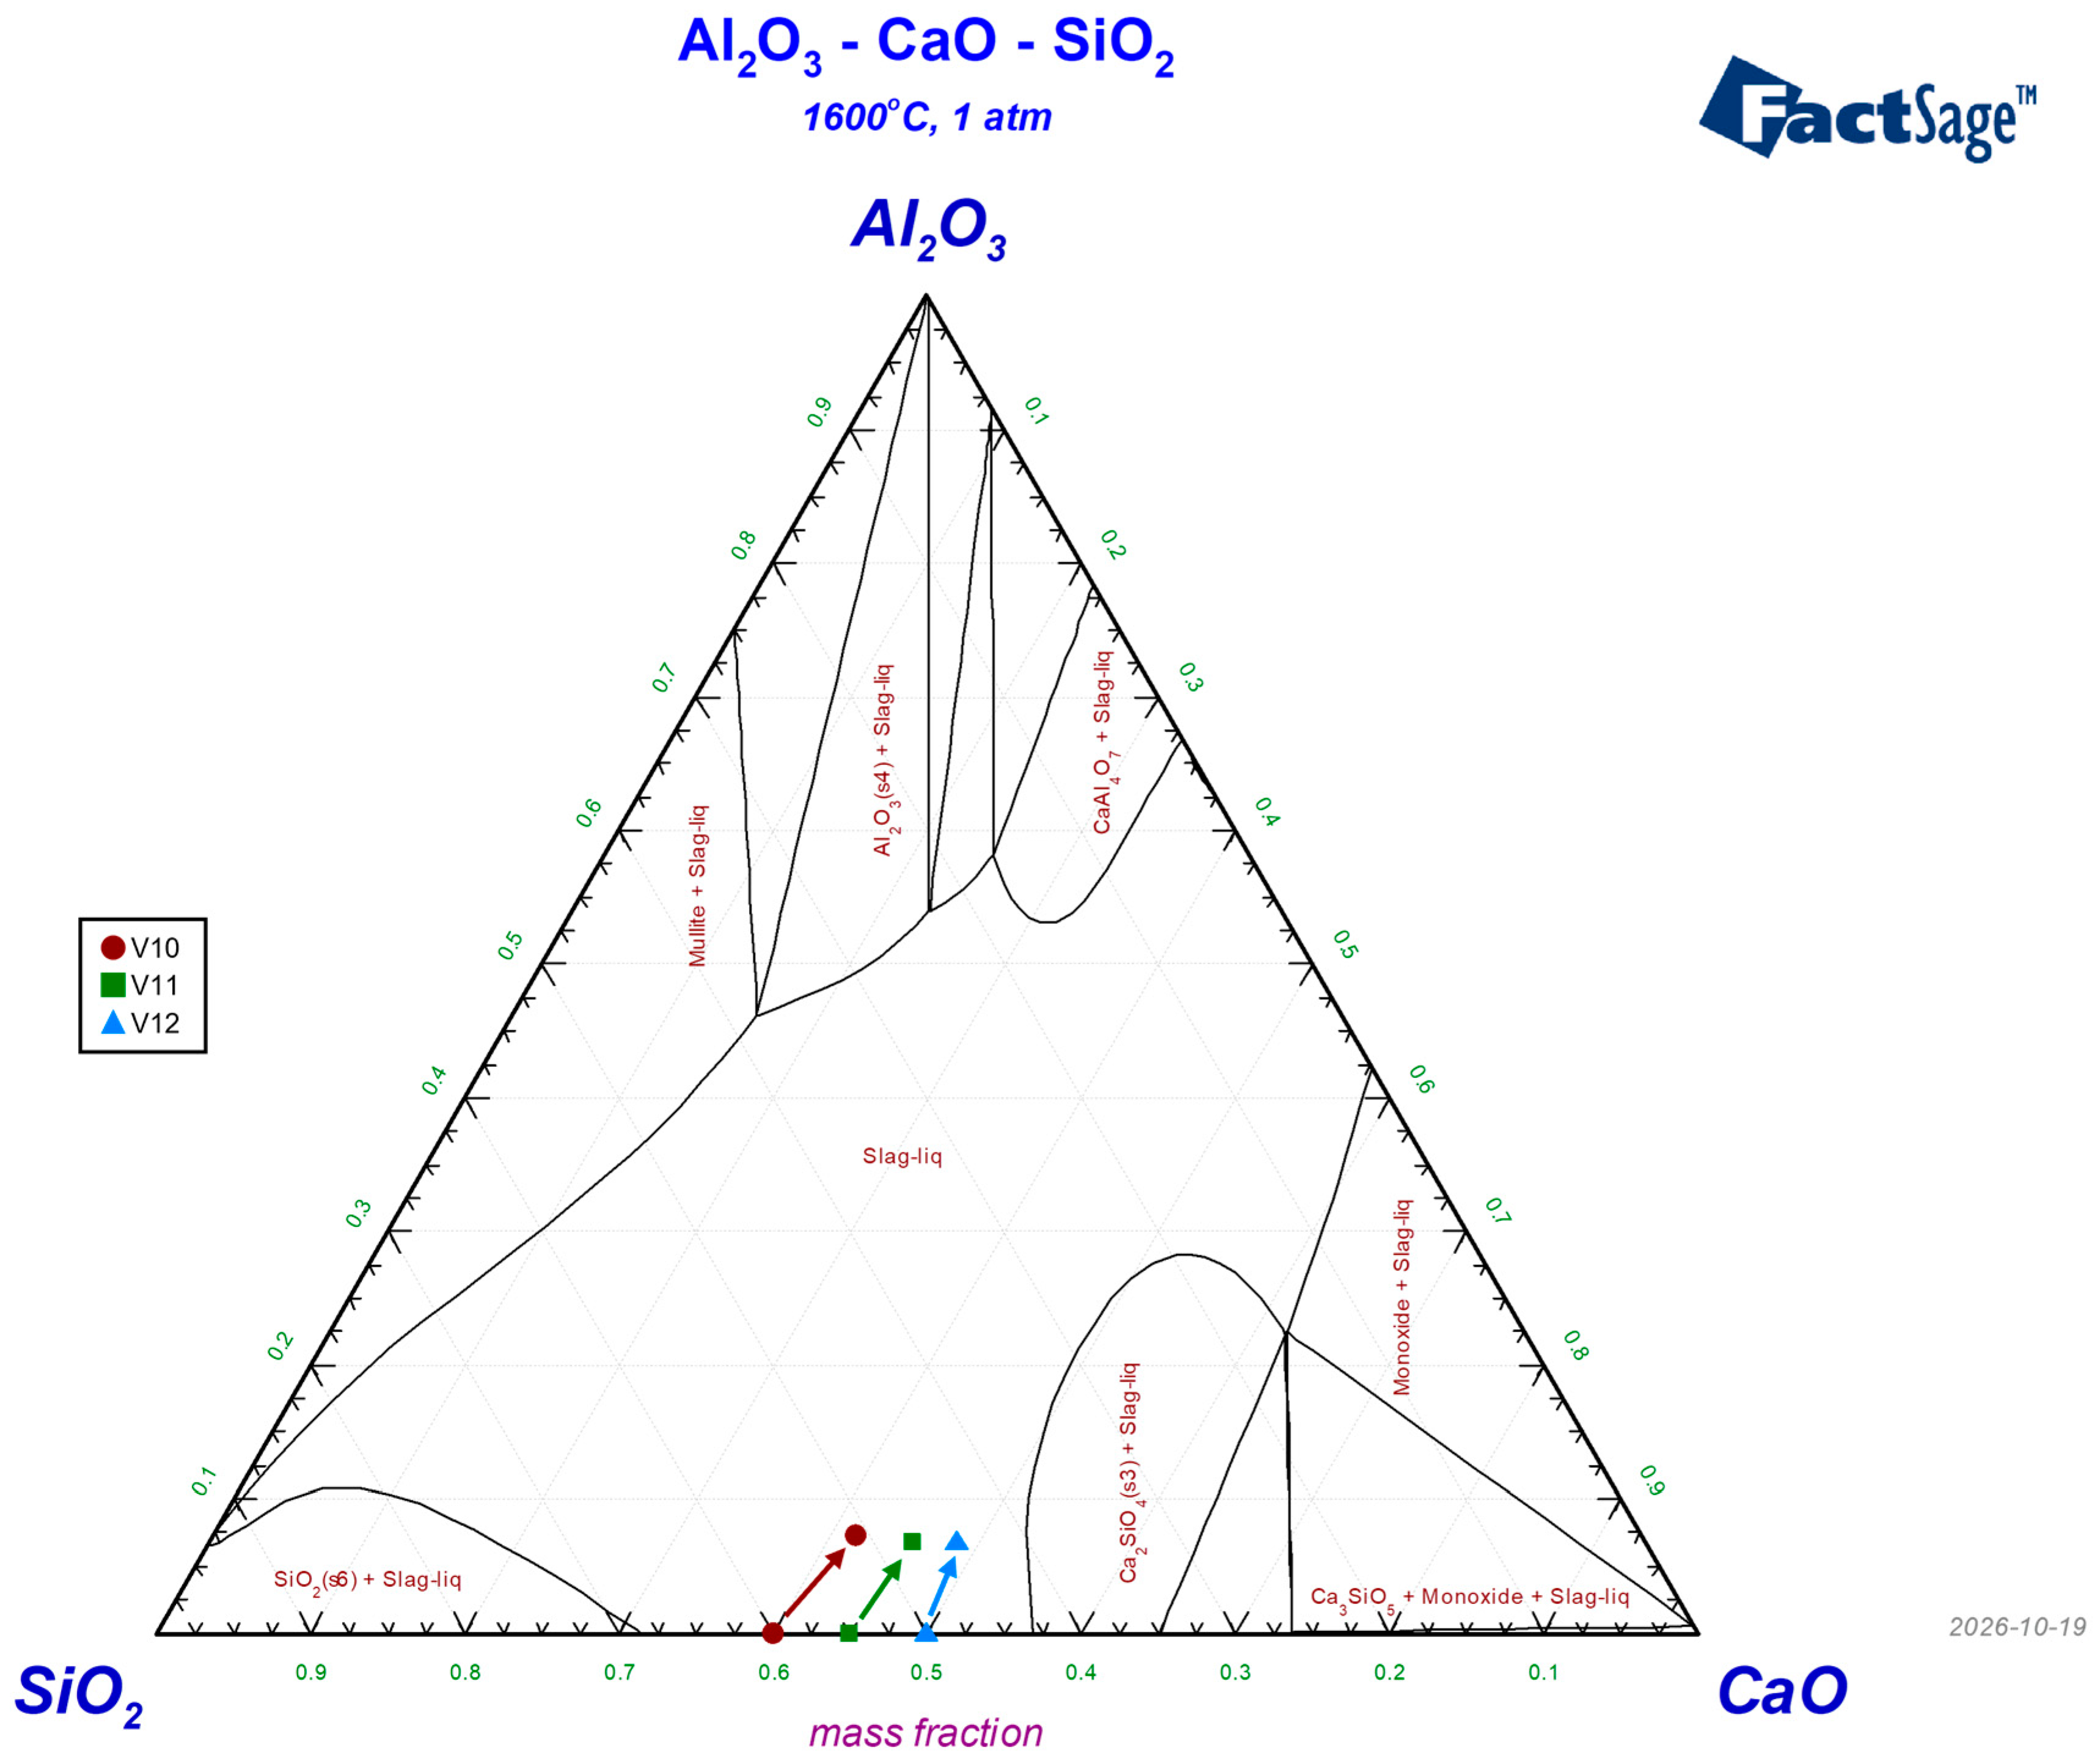
To further evaluate the influence of Al2O3 accumulation on slag phase stability, the initial and final slag compositions of experiments V10, V11, and V12 were plotted in the ternary CaO–SiO2–Al2O3 phase diagram calculated at 1600 °C using FactSage 8.2 in Figure 11.
Figure 11.
Calculated isothermal section of the CaO–SiO2–Al2O3 system at 1600 °C and 1 atm using FactSage 8.2, showing the initial and measured final slag compositions of experiments V10, V11, and V12. Created with FactSage 8.2 using the FToxid database [13].
The incomplete phase separation observed in the experiments with an initial slag SiO2 content of 50 wt.% may be related to both the residual alloy composition and the phase constitution of the slag. These alloys show lower normalized Si concentrations and higher residual impurity concentrations, particularly calcium and aluminium. During solidification, preferential crystallization of silicon may enrich these impurities in the residual liquid, potentially promoting the formation of impurity-rich grain-boundary phases. This may contribute to the more pronounced dark regions observed in the etched micrographs. However, without additional phase analysis, the composition and origin of these regions cannot be confirmed.
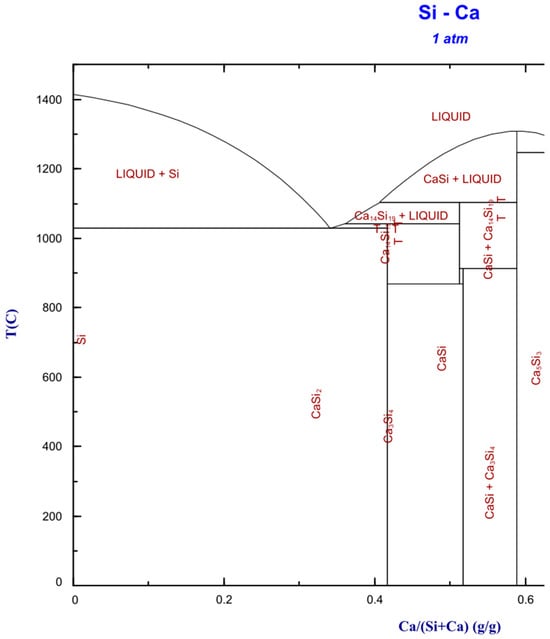
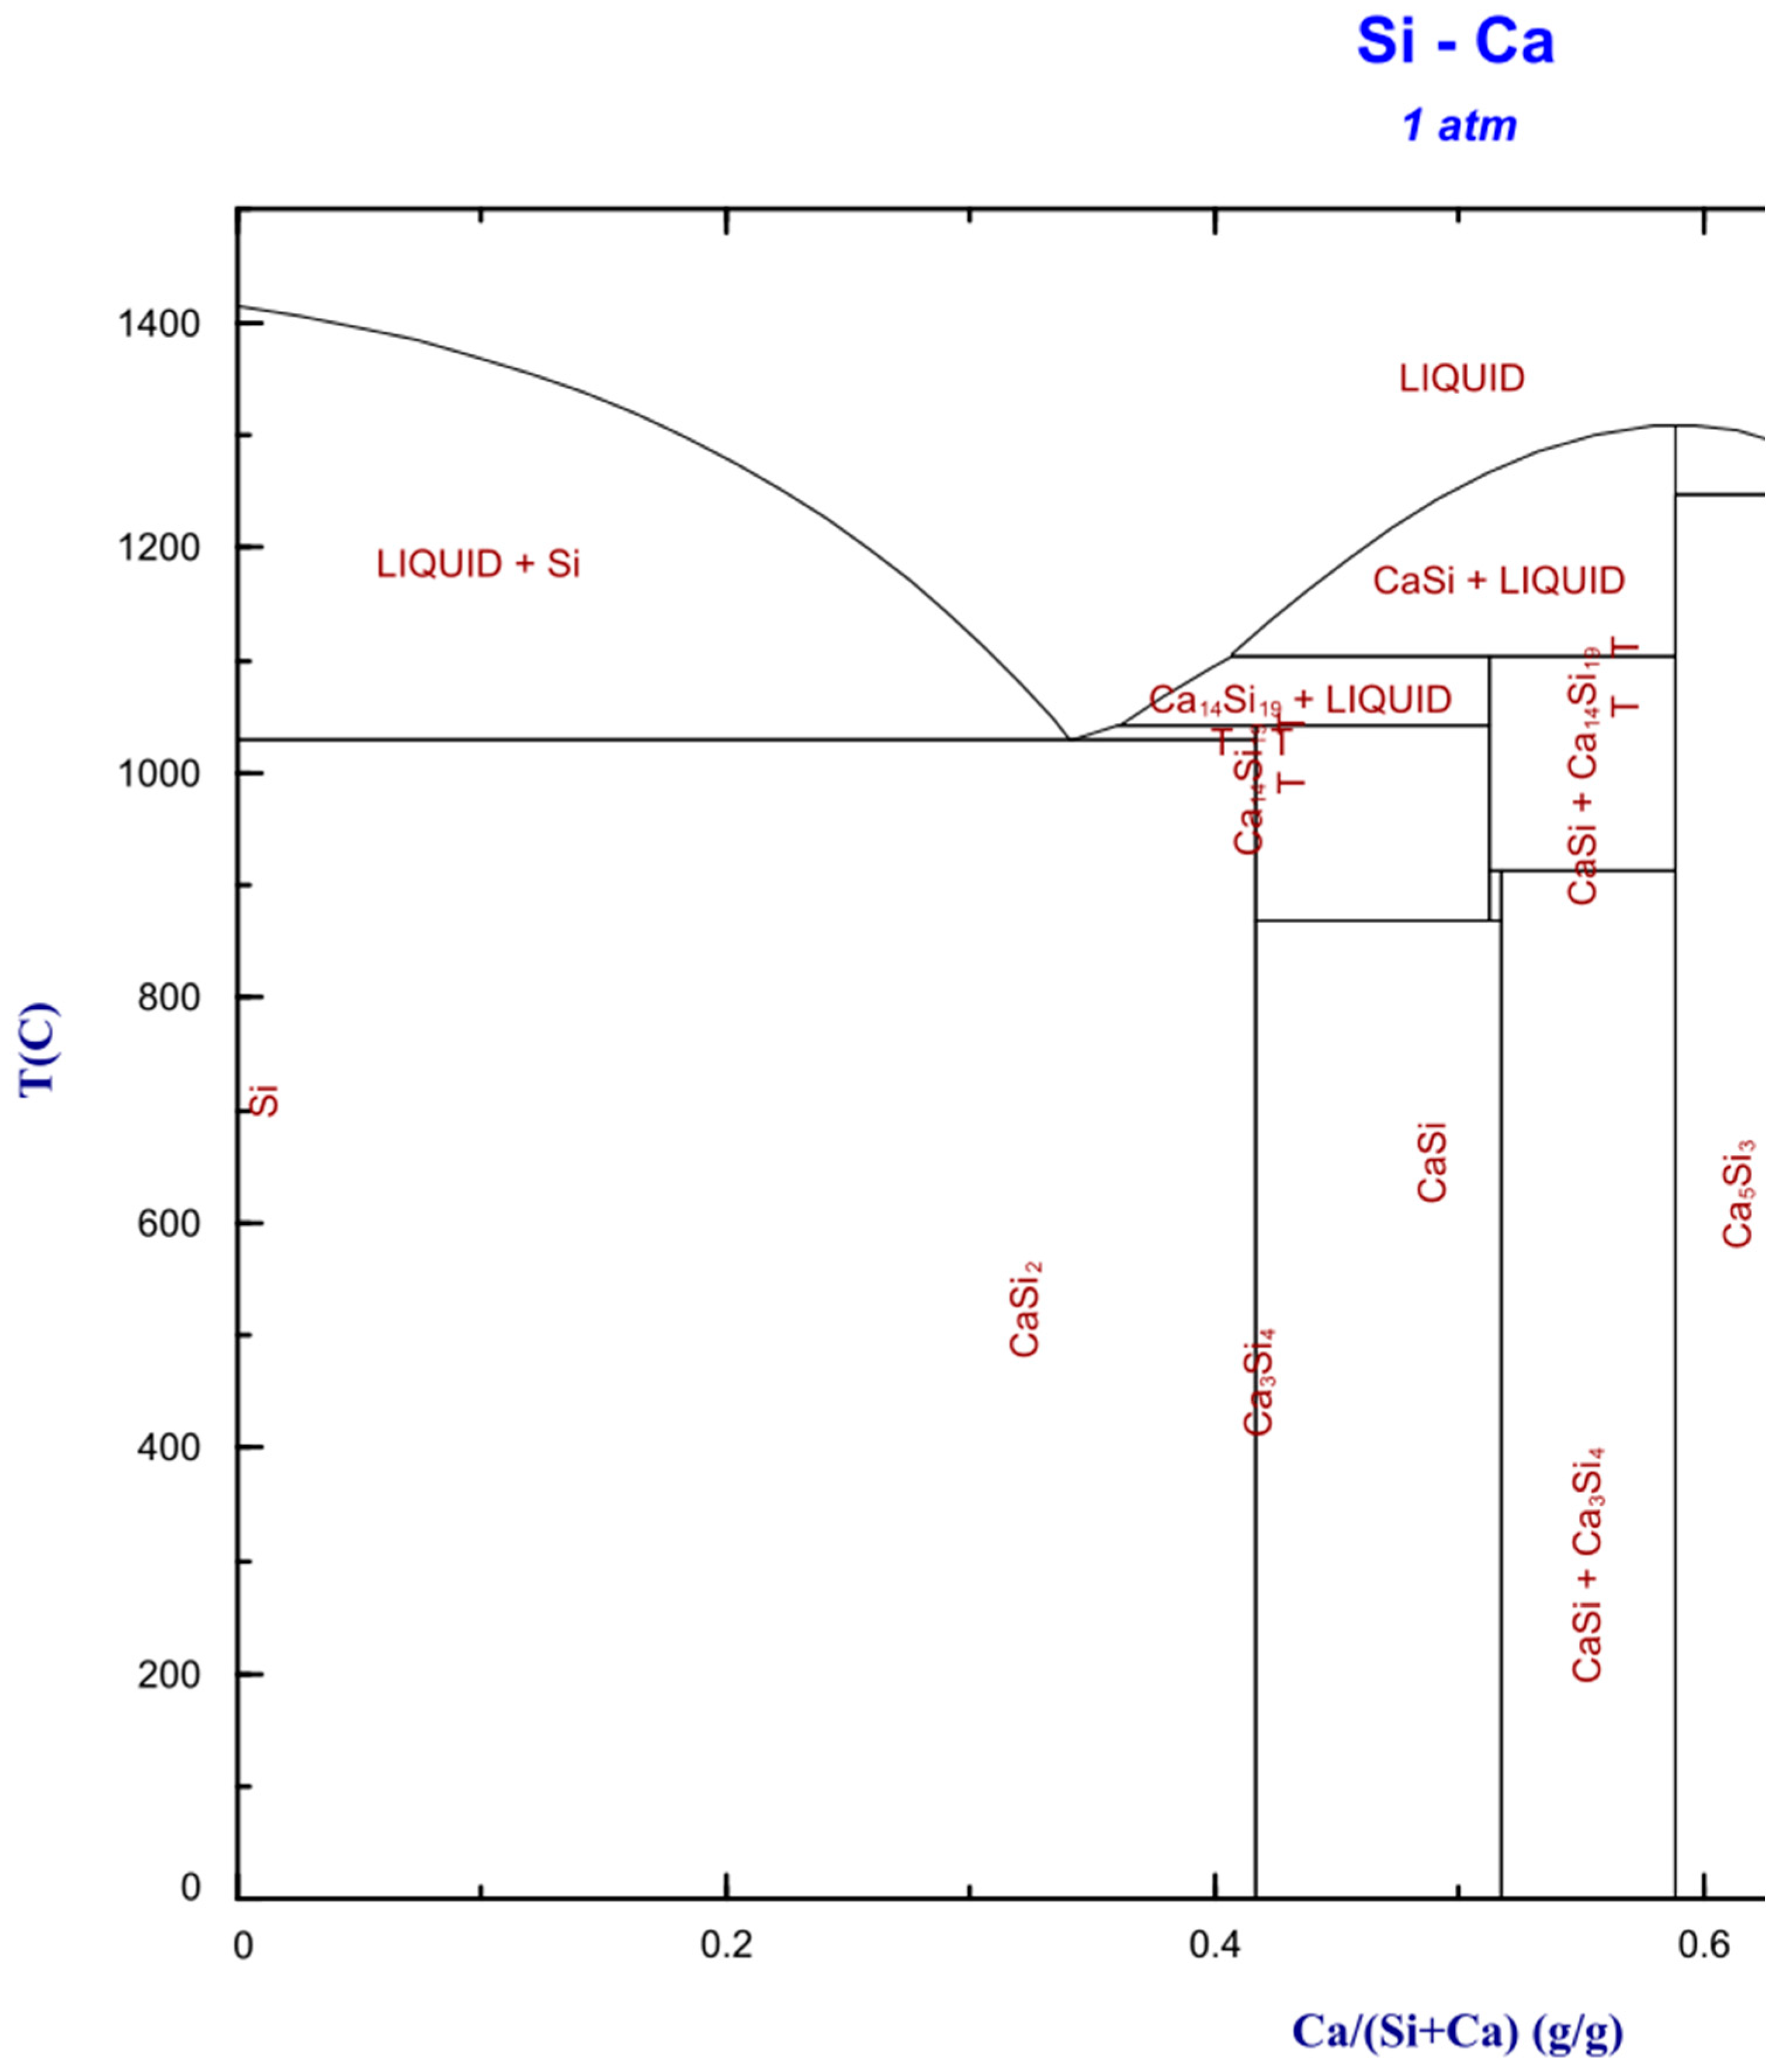
Calcium is the predominant residual impurity in the produced alloys. The silicon-rich section of the Si–Ca binary phase diagram, calculated in FactSage 8.2 using the SGTE alloy database, is shown in Figure 12. According to the calculated Si–Ca phase relations, calcium-rich phases such as CaSi2 may form from Ca-enriched residual liquid during solidification. This interpretation is consistent with the increased Ca concentrations measured for the samples treated with slags containing initially 50 wt.% SiO2 but remains a hypothesis that requires confirmation by further phase analysis.
Figure 12.
Silicon-rich section of the binary Si-Ca phase diagram, created with FactSage 8.2 using the SGTE alloy database [13].
Equilibrium calculations for slags with an initial SiO2 content of 50 wt.% and slag-to-alloy ratios of 3:1 and 4:1 predict the precipitation of α-Ca2SiO4 from the slag. The possible presence of such solid oxide phases may have affected melt homogeneity and phase separation during processing. For example, solid particles at or near the slag–alloy interface could hinder the coalescence and settling of alloy droplets. This provides a possible explanation for the particularly poor phase separation observed in the 50 wt.% SiO2 experiments compared with the more SiO2-rich slag systems. However, since the actual phase constitution and distribution within the slag during processing were not directly investigated, this interpretation remains tentative.
Overall, the poorer phase separation observed for the 50 wt.% SiO2 slag systems cannot be attributed to a single confirmed mechanism. The observations may result from a combination of less complete refining, impurity-rich residual alloy phases formed during solidification, and the possible presence of solid oxide phases in the slag.
5. Conclusions
The goal of this study was to evaluate the slag-refining step of the novel SisAl process for low-emission silicon production while focusing on normalized Si concentration increase in the alloy. This process represents a promising approach for the further development of more sustainable silicon production routes.
Equilibrium simulations using FactSage 8.2 were performed to obtain an initial understanding of suitable process parameters and to set a theoretical equilibrium benchmark to evaluate experimental results. Six preliminary trials and a main experimental campaign consisting of 18 experiments were planned and carried out in a medium-frequency induction furnace, using 2400 g input material for each experiment. The main parameters investigated were the slag-to-alloy ratio and the SiO2 concentration of the input CaO–SiO2-based slag. The experimental products, consisting of cast slag and alloy phases, were analyzed by XRF spectroscopy and metallographic preparation, and the results were evaluated regarding process optimization.
The highest normalized Si concentrations in the alloy were achieved for initial slag SiO2 concentrations of 60 wt.%. Higher slag-to-alloy ratios generally resulted in higher normalized Si concentrations, although the observed effect was smaller than the effect of the slag SiO2 concentration. At a slag-to-alloy ratio of 5:1, Ca and Al concentrations were reduced to low levels, resulting in a Si-rich alloy with a normalized Si concentration corresponding to the industrial Si97 designation.
During processing, iron co-reduction from the slag to the alloy was lower than predicted by the FactSage 8.2 equilibrium simulations. This may have resulted from kinetically hindered iron reduction, insufficient holding time, or mass-transport limitations in the slag. However, the lower Fe concentrations are beneficial if the goal is to produce a higher-quality MG Silicon. Further location-dependent phase and chemical analyses would be required to verify this assumption.
The spent slag compositions exhibited low viscosities and liquidus temperatures. In addition, the slags from the trials with the highest normalized Si concentrations in the alloy retained high residual SiO2 contents of above 50 wt.%. These slags therefore show potential as input materials for the reduction step of the SisAl process, offering considerable potential for process circularity.
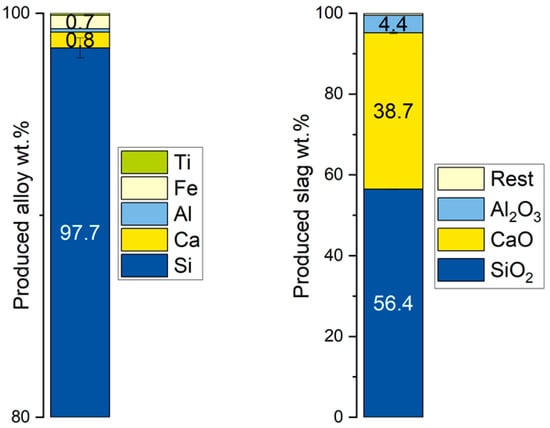
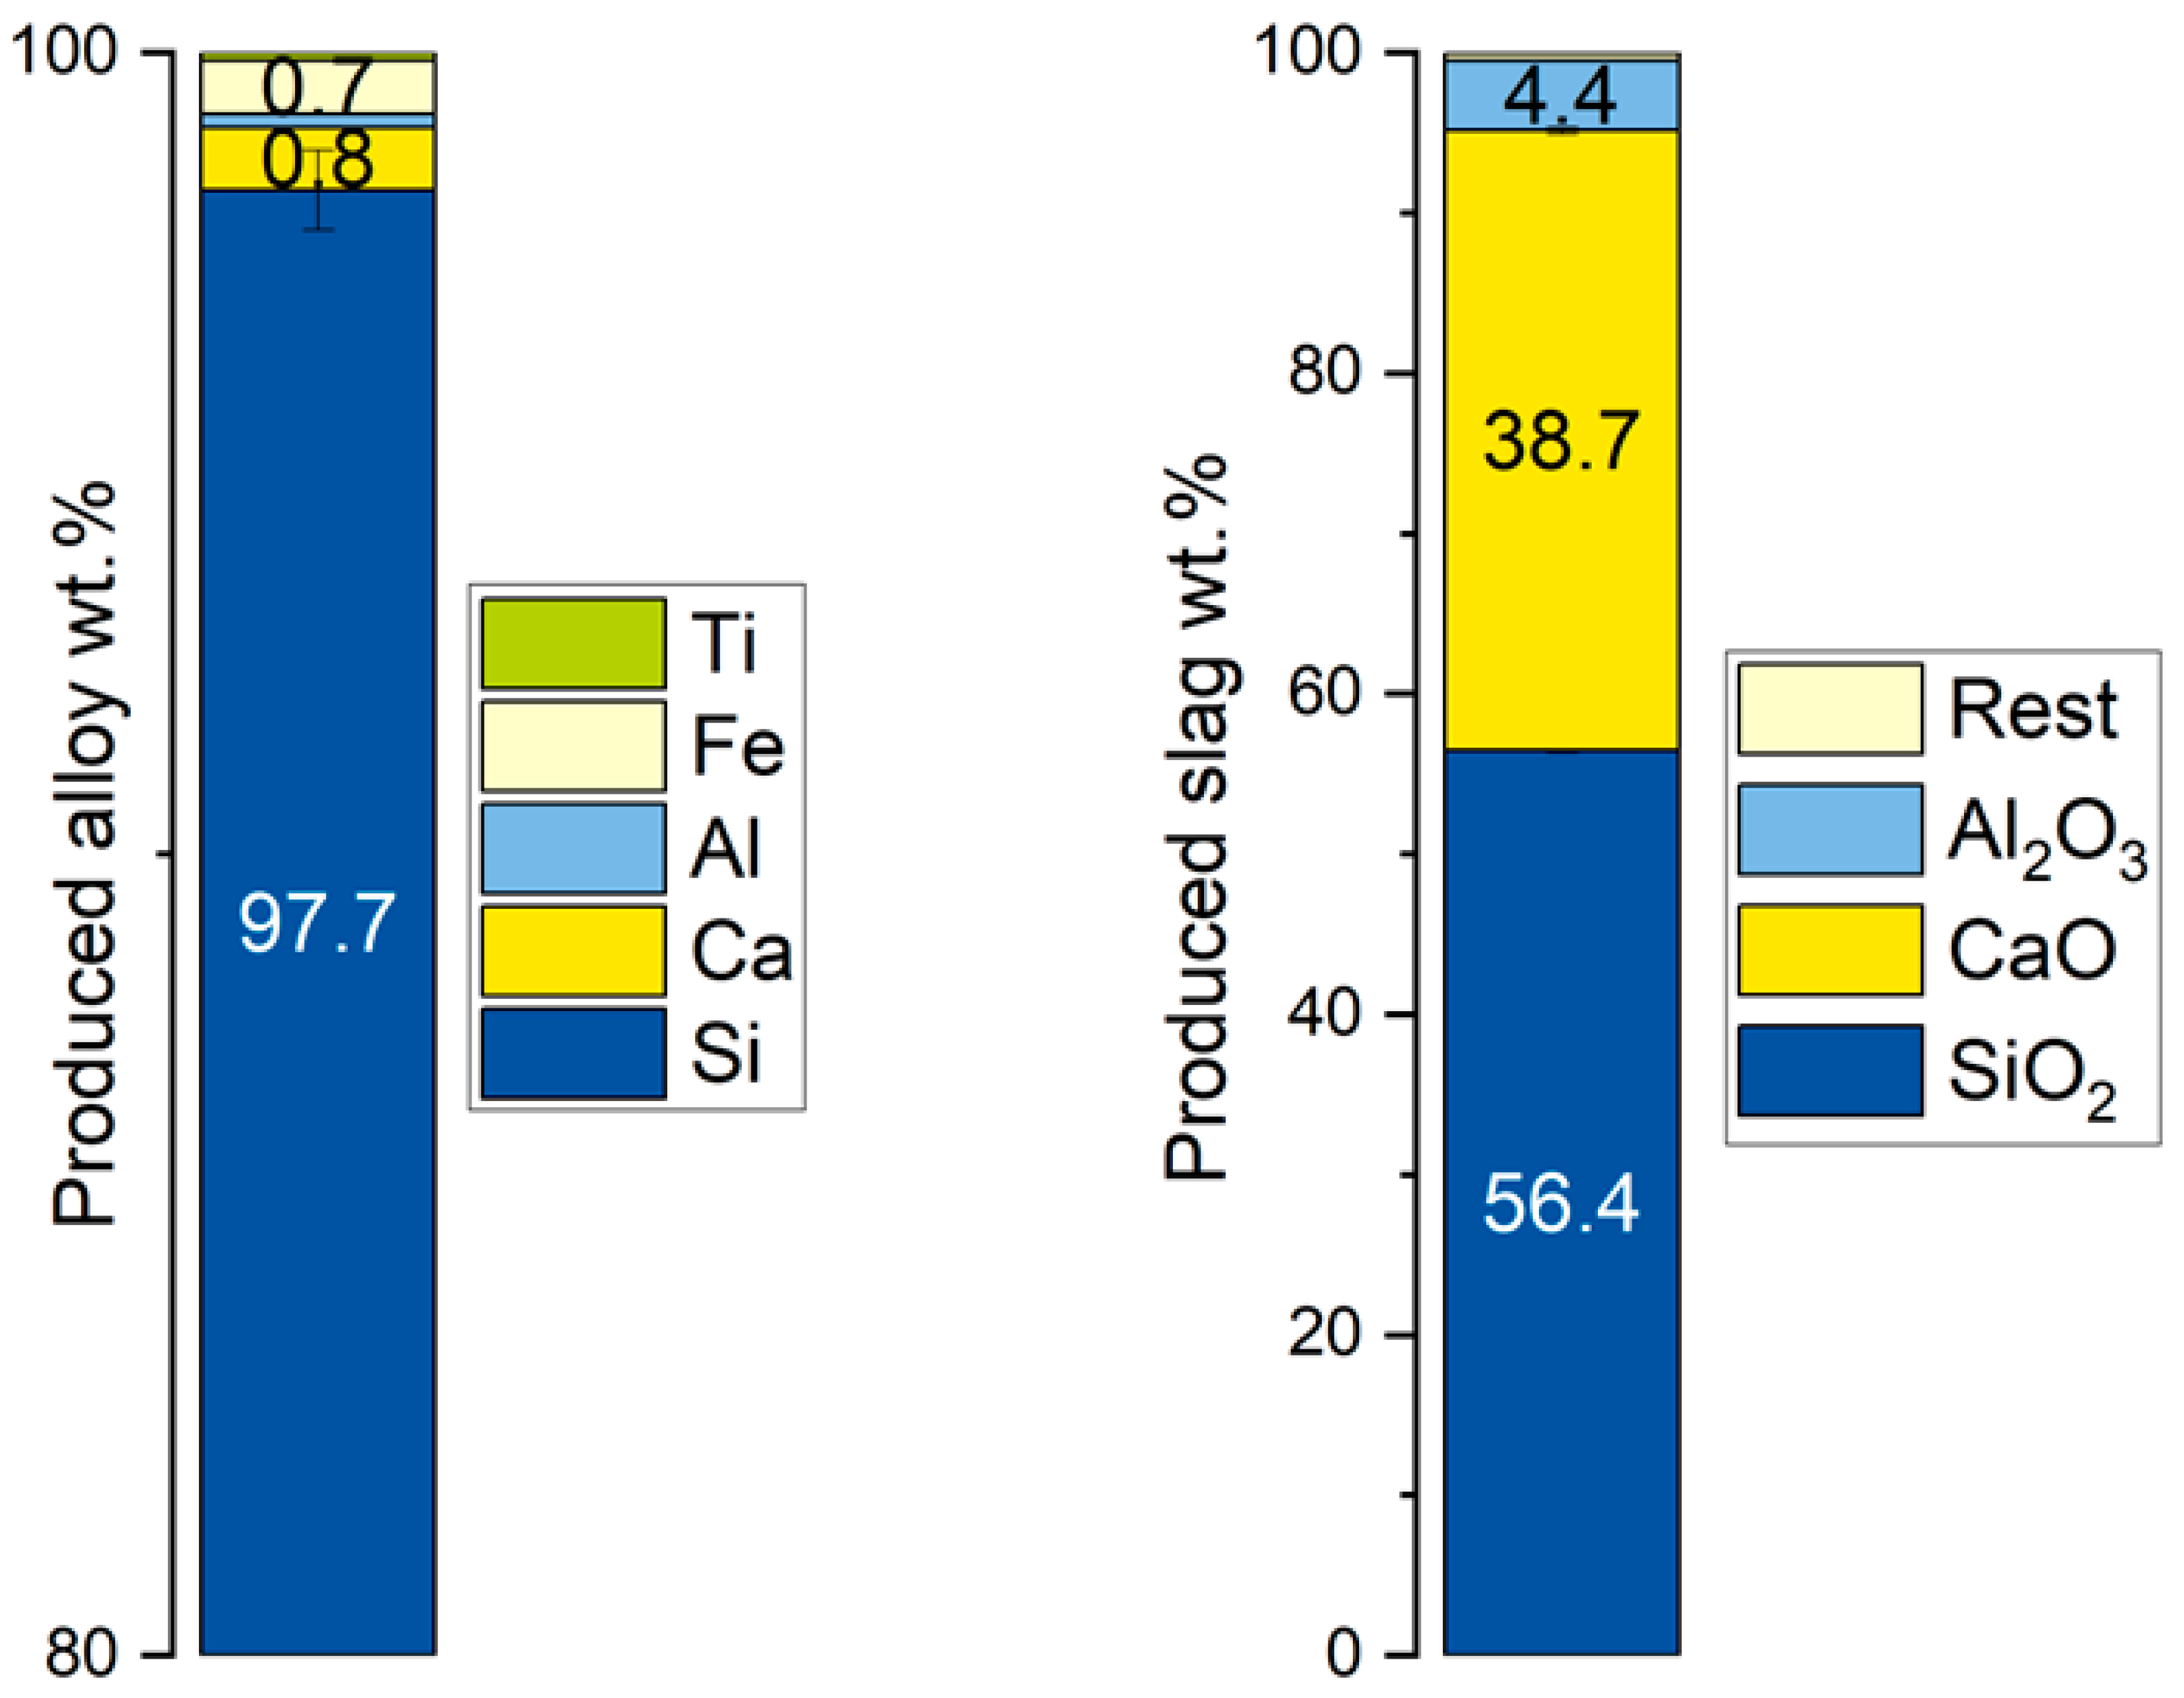
An initial slag SiO2 content of 60 wt.% and slag-to-alloy ratio of 5:1 resulted in the highest average normalized Si concentration within the investigated parameter range while also showing good processability. The experimental results for those parameters are summarized separately in Figure 13. The initial assumption that the slag viscosities at those SiO2 contents represent an upper limit for processing could not be confirmed. Further investigations into SiO2 concentrations higher than 60 wt.% are required to evaluate an upper SiO2 content limit.
Figure 13.
Alloy (left) and slag (right) compositions for initial slag SiO2 content of 60 wt.% and a slag-to-alloy ratio of 5:1.
Additional observations, such as alloy microstructures and phase separation quality, were evaluated, and possible explanatory approaches were proposed. Despite their lower theoretical viscosities, the slags with an initial SiO2 content of 50 wt.% showed incomplete phase separation, which may cause difficulties during processing.
Overall, the findings met the initial objectives by providing practical insights into the refining step of the SisAl process and by highlighting both its strengths and areas for further improvement.
6. Outlook
The focus of this study was to investigate the increase in normalized Si concentration in the alloy, while process design for future slag valorization was only a secondary objective. However, alloy refining represents only one part of the SisAl process. A circular process design is mandatory to ensure even higher normalized Si concentrations while enabling valorization of the spent refining slag.
Further research should therefore focus on both steps of the SisAl process, namely the aluminium-based reduction step and the subsequent refining of the intermediate alloy. Both process steps may benefit from high initial SiO2 contents in the slag. Therefore, a refining step using high slag-to-metal ratios and slag systems with SiO2 contents above the 60 wt.% investigated in this study may be a viable approach to further increase the Si concentration. Also, additional equilibrium calculations in which some CaO in the initial slag was replaced by Al2O3 showed a theoretical decrease in Ca concentration in the final alloy and could further improve refining performance.
Supplementary Materials
The following supporting information can be downloaded at: https://www.mdpi.com/article/10.3390/met16111212/s1, Table S1: Individual normalized alloy compositions determined by XRF for experiments V1–V18; Table S2: Measured final slag compositions and calculated thermophysical properties of experiments V10, V11, and V12 at 1600 °C using FactSage 8.2; Table S3: Input and recovered product masses, including process and separation losses, for experiments V1–V18; Table S4: Comparison of normalized chemical compositions determined by XRF using SPECTRO XEPOS XEP05 vs. chemical composition by ICP-OES determined by Analytical Services of Elektrowerk Weisweiler GmbH with a modified method according to DIN EN ISO 11885:2009.
Author Contributions
Conceptualization, M.S., M.T. and B.F.; methodology, M.S. and M.T.; software, M.S. and M.T.; validation, M.S. and M.T.; formal analysis, M.S. and M.T.; investigation, M.S. and M.T.; data curation, M.S. and M.T.; visualization, M.S. and M.T.; writing—original draft preparation, M.S. and M.T.; writing—review and editing, M.S. and M.T.; supervision, B.F.; project administration, B.F.; funding acquisition, B.F., M.S. and M.T. contributed equally to this work. All authors have read and agreed to the published version of the manuscript.
Funding
The research leading to these results has been performed within the SisAl Pilot project https://www.sisal-pilot.eu/ (accessed on 6 September 2026) and received funding from the European Community’s Horizon 2020 Programme (H2020/2014-2020) under grant agreement no. 869268. The article processing charge (APC) was funded by RWTH Aachen University.
Data Availability Statement
The original contributions presented in this study are included in the article/Supplementary Material. Further inquiries can be directed to the corresponding author.
Conflicts of Interest
The authors declare no conflicts of interest.
References
- Chigondo, F. From Metallurgical-Grade to Solar-Grade Silicon: An Overview. Silicon 2018, 10, 789–798. [Google Scholar] [CrossRef] [Scilit]
- Braga, A.; Moreira, S.P.; Zampieri, P.R.; Bacchin, J.; Mei, P.R. New processes for the production of solar-grade polycrystalline silicon: A review. Sol. Energy Mater. Sol. Cells 2008, 92, 418–424. [Google Scholar] [CrossRef] [Scilit]
- Wang, H.Y.; Tan, Y.; Li, J.Y.; Li, Y.Q.; Dong, W. Removal of silicon carbide from kerf loss slurry by Al–Si alloying process. Sep. Purif. Technol. 2012, 89, 91–93. [Google Scholar] [CrossRef] [Scilit]
- Safarian, J.; Tranell, G.; Tangstad, M. Processes for Upgrading Metallurgical Grade Silicon to Solar Grade Silicon. Energy Procedia 2012, 20, 88–97. [Google Scholar] [CrossRef] [Scilit]
- Saevarsdottir, G.; Magnusson, T.; Kvande, H. Reducing the Carbon Footprint: Primary Production of Aluminum and Silicon with Changing Energy Systems. J. Sustain. Metall. 2021, 7, 848–857. [Google Scholar] [CrossRef] [Scilit]
- Schei, A.; Tuset, J.K.; Tveit, H. Production of High Silicon Alloys; Tapir Forlag: Trondheim, Norway, 1998. [Google Scholar]
- Bjørnstad, E.L.; Tranell, G. Nucleation of SiO2-CaO-Al2O3 Slag in Oxidative Ladle Refining of Metallurgical Grade Silicon. Metall. Mater. Trans. B 2021, 52, 1392–1412. [Google Scholar] [CrossRef] [Scilit]
- Folstad, M.B.; Einarsrud, K.E.; Tangstad, M. Dissolution of CaO in SiO2-CaO-Al2O3 Slag in Si Production. Metals 2024, 14, 243. [Google Scholar] [CrossRef] [Scilit]
- Teixeira, L.A.V.; Morita, K. Removal of Boron from Molten Silicon Using CaO–SiO2 Based Slags. ISIJ Int. 2009, 49, 783–787. [Google Scholar] [CrossRef] [Scilit]
- Tranell, G.; Safarian, J.; Wallin, M. SisAl-A New Process for Production of Silicon. In Silicon for the Chemical and Solar Industry XV; Andresen, B., Rong, H., Tangstad, M., Tveit, H., Page, I., Eds.; The Norwegian University of Science and Technology: Trondheim, Norway, 2020; pp. 129–139. ISBN 978-82-997357-9-7. [Google Scholar]
- Emil Kaya, E.; Sørli, F.; Wallin, M.; Tranell, G. Refining of Si-Ca-Al alloys using slag treatments. In Presented at the 12th International Conference on Molten Slags, Fluxes and Salts (MOLTEN 2024), Brisbane, Australia, 17 June 2024. [Google Scholar]
- DIN EN ISO 11885:2009-09; Water Quality—Determination of Selected Elements by Inductively Coupled Plasma Optical Emission Spectrometry (ICP-OES). DIN Deutsches Institut für Normung e. V.: Berlin, Germany, 2009. Available online: https://www.dinmedia.de/en/standard/din-en-iso-11885/118931490 (accessed on 21 August 2026).
- Bale, C.W.; Bélisle, E.; Chartrand, P.; Decterov, S.A.; Eriksson, G.; Gheribi, A.E.; Hack, K.; Jung, I.-H.; Kang, Y.-B.; Melançon, J.; et al. FactSage thermochemical software and databases, 2010–2016. CALPHAD 2016, 54, 35–53. [Google Scholar] [CrossRef] [Scilit]
- GTT-Technologies. GTOx (GTT Oxides Database), Version 19; GTT-Technologies: Herzogenrath, Germany, 2025. [Google Scholar]
- Grundy, A.N.; Liu, H.; Jung, I.-H.; Decterov, S.A.; Pelton, A.D. A Model to Calculate the Viscosity of Silicate Melts. Part I: Viscosity of Binary SiO2–MeOx Systems (Me = Na, K, Ca, Mg, Al). Int. J. Mater. Res. 2008, 99, 1185–1194. [Google Scholar] [CrossRef] [Scilit]
- Engineering, O. Revised Thermocouple Reference Tables, Type C. Available online: https://sea.omega.com/temperature/Z/pdf/z239-240.pdf (accessed on 3 September 2024).
- Brouwer, P. Theory of XRF: Getting Acquainted with the Principles; PANalytical BV: Almelo, The Netherlands, 2006. [Google Scholar]
- ASTM A922-05(2025); Standard Specification for Silicon Metal. ASTM International: West Conshohocken, PA, USA, 2025. Available online: https://store.astm.org/a0922-05r25.html (accessed on 21 August 2026).
- DIN 17560-2:2004-02; Ferrosilicon and Silicon—Part 2: Technical Delivery Conditions for Silicon. DIN Deutsches Institut für Normung e. V.: Berlin, Germany, 2004. Available online: https://www.dinmedia.de/en/standard/din-17560-2/68530464 (accessed on 21 August 2026).

Disclaimer/Publisher’s Note: The statements, opinions and data contained in all publications are solely those of the individual author(s) and contributor(s) and not of MDPI and/or the editor(s). MDPI and/or the editor(s) disclaim responsibility for any injury to people or property resulting from any ideas, methods, instructions or products referred to in the content. |
© 2026 by the authors. Licensee MDPI, Basel, Switzerland. This article is an open access article distributed under the terms and conditions of the Creative Commons Attribution (CC BY) license.