


Abstract
This study investigates the evolution of initial solidification during the continuous casting of 230 mm × 1255 mm slabs by establishing a heat transfer inverse calculation model and a slab solidification heat transfer model, with the results of the former used as boundary conditions for the latter. The results show that at the thermocouple measurement positions, the average heat flux in the outer arc direction is greater than that in the inner arc direction, which causes the flow field inside the slab to deflect. Meanwhile, with increasing distance, the transverse distributions of temperature and solidified shell thickness become uneven. The lowest temperature occurs within 100 mm of the slab center, and the maximum difference in solidified shell thickness is 4.47 mm. A “reheat” phenomenon occurs in the shell at the mold outlet. Increasing casting speed and decreasing superheat both alleviate the flow deflection, but they do not reduce the uneven distribution. Specifically, for every 0.1 m/min increase in average casting speed, the solidified shell thickness decreases by 0.74 mm, and for every 5 °C increase in superheat, the solidified shell thickness decreases by 0.07 mm. Superheat has almost no effect on the growth of the solidified shell. However, when the slab enters the secondary cooling section, the solidified shell growth rate accelerates.
1. Introduction
Slab quality is central to process control in continuous casting. Internal cracks are common defects in continuously cast slabs: mild cases require conditioning, whereas severe cases lead to rejection. It is widely accepted that internal cracks are closely related to the initial solidification of molten steel in the mold [1], being influenced by factors such as chemical composition, solidification characteristics, and phase-transformation shrinkage [2,3]. Non-uniform initially solidified shells exhibit low high-temperature strength and are therefore prone to stress concentration at their weakest points. When the local stress exceeds the high-temperature strength of the shell, cracks initiate and propagate during subsequent cooling in the secondary cooling zone.
At present, neither the construction of numerical models for the mold nor the determination of thermophysical properties poses a fundamental challenge; rather, the accuracy of the heat-transfer boundary conditions has become the decisive factor governing the reliability of simulation results. The heat flux distribution and the associated thermal behavior within the slab mold have become key factors governing the productivity and quality of precision-blanking steel, and provide important insight into the evolution of initial solidification [4]. In parallel, based on heat-transfer theory, a growing number of studies have begun to account for the influence of molten steel flow on initial solidification [5,6,7]. Yang [8] developed a flow–heat transfer model using an average heat flux expression as the boundary condition, and investigated the effects of the solid/liquid slag film and copper plate thickness on initial solidification. Using ANSYS (2019 R1), Feng [9] established a mathematical model of heat transfer during solidification in a slab continuous casting mold, again adopting an average heat flux expression as the boundary condition, to examine the effects of casting speed and cooling water flow rate on solidification. Mosayebidorcheh [10] developed a two-dimensional solidification heat-transfer model to address surface defects in medium-thick slabs, assuming a uniform heat flux over the strand surface, and analyzed solidification under different casting speeds. Guo [11] formulated a solidification heat-transfer model based on the energy conservation equation and Fourier’s law of heat conduction, likewise built upon the mold average heat flux expression, to investigate the effects of cooling water flow rate and casting speed on initial solidification. Mostafa [12] simulated the solidification of a 20 mm-wide shell at the center of the wide face of a continuous casting mold, accounting for the thermal resistance of each interfacial layer and the phase-change characteristics of the specific steel composition used in production, and summarized the effects of carbon content and mold cooling conditions on initial solidification.
However, models based on the uniform heat flux assumption suffer from inherent deficiencies: they cannot capture the two-dimensional heat transfer effect at the mold corner or the steep gradient in the heat-flux peak region near the meniscus. As a result, predictions of the weak points of the shell (e.g., corner cracks and wide-face depressions) are severely distorted, making it difficult to establish a reliable theoretical basis for internal quality control. Furthermore, because most of these studies assume a uniform heat flux over the strand surface, their results cannot fully resolve the solidification state at different locations, and thus fail to provide reliable theoretical support for the analysis of internal slab defects. In recent years, thermocouples embedded in the mold copper plate have been used to measure temperatures at discrete locations, from which the heat flux distribution has been inversely determined—an approach that captures conditions near the strand corners more realistically [13]. Following Savage and Pritchard [14], Wu [15] established an inverse heat transfer model in which a nonlinear least-squares estimation scheme iteratively adjusted the boundary data, thereby obtaining a heat flux distribution on the mold copper plate that more closely matches actual operating conditions and refining the heat flux expression. Huang [16] performed a numerical investigation of the coupled flow, heat transfer, and solidification behavior in the mold for wide and thick slabs, prescribing a height-dependent heat flux through user-defined functions (UDFs) in Fluent, and examined the effects of submerged entry nozzle (SEN) immersion depth and port angle on solidification. Cai et al. [17,18] directly back-calculated the heat flux from temperatures measured on the copper plate and established a two-dimensional thermo-mechanical coupling model to analyze the heat flux distribution on the mold copper plate and at the strand corners. Although these advances have improved the understanding of local heat flux, most studies have treated the inverse heat transfer calculation and the flow–solidification coupling simulation as separate steps, thereby neglecting the nonlinear perturbation of molten steel flow on the initial heat flux.
To date, few studies have examined the initial solidification of 65Mn-Cr steel slabs by combining inverse heat transfer calculation with flow–solidification coupling simulation. This gap is particularly significant for this grade, in which the Cr addition markedly reduces thermal conductivity and the latent-heat release behavior differs from that of plain carbon steel. Accordingly, focusing on the continuous casting mold used to produce 230 mm × 1255 mm slabs, the present study establishes an inverse heat transfer model based on the temperatures recorded by thermocouples embedded in the mold copper plate during stable production, together with the actual operating conditions of the plate, in order to determine the non-uniform heat flux distribution along the casting direction and across the wide face. This heat flux is then imposed as a boundary condition—one that more faithfully represents actual operating conditions—on a fully coupled model of molten steel flow, heat transfer, and solidification, so as to simulate the flow, thermal, and solidification behavior within the mold. On this basis, the effects of the mold flow field on the non-uniform heat flux distribution, the slab temperature distribution, and the shell thickness characteristics are systematically analyzed. To the best of our knowledge, this is the first study to establish a fully coupled molten steel flow–heat transfer–solidification model with a non-uniform heat flux boundary obtained by inverse heat transfer calculation for 65Mn-Cr wide and thick slab continuous casting. The objective is to elucidate the evolution of initial solidification in this specific steel grade under wide and thick slab casting conditions, and to provide high-precision theoretical support for optimizing the mold taper, the secondary cooling water distribution, and on-site process parameters.
2. Mathematical Model
2.1. The Heat Transfer Inverse Calculation Model
2.1.1. Model Assumptions
Due to the single-point temperature measurement by thermocouples on the mold copper plate and the complex heat transfer among the solidified steel shell, the mold copper plate, and the cooling water, the following assumptions are made for the model [19,20,21]:
- (1)
- The heat transfer process among the mold cooling water, copper plate, and slab is assumed to be quasi-steady, and the temperature of the mold copper plate used in constructing the heat transfer model is the average value over a certain period.
- (2)
- The cooling water temperature is assumed to change linearly with height from the water channel inlet to the outlet.
- (3)
- This model does not separately consider the influence of mold vibration. However, the comprehensive macroscopic influence of the vibration on the interface thermal resistance and the behavior of the slag film has been inherently included in the thermal boundary conditions reflected by the measured copper plate temperature data. In addition, it is assumed that the thermophysical properties of the copper plate material do not change with temperature.
2.1.2. Conservation Equations
The heat flux distribution of the mold copper plate is simulated and calculated using the finite difference method. According to the heat transfer characteristics of the slab mold, the governing equation for unsteady solidification heat transfer can be obtained:
Usually, the thermal diffusivity is used to replace the physical parameters in the governing equation. The formula is as follows:
In the formula: T is temperature, °C; t is time, s; x, y are coordinates, m; ρ is liquid steel density, kg/m3; Cp is liquid steel specific heat capacity, J·(kg °C)−1; λ is liquid steel thermal conductivity, W·(m·°C)−1; α is the ratio of thermal conductivity to specific heat capacity and density in m2/s.
2.1.3. Computational Domain and Boundary Conditions
The physical property parameters of the mold cooling water are shown in Table 1.
Table 1.
Physical property parameters of the mold cooling water.
The physical parameters of the slab mold copper plate are shown in Table 2.
Table 2.
Parameters of the mold.
Heat transfer equation at the cold surface/cooling water interface of the mold:
Heat transfer equation at the hot surface/slab interface of the mold:
In the formula: T is temperature,°C; t is time, s; x, y are coordinates, m; ρ is liquid steel density, kg/m3; Cp is liquid steel specific heat capacity, J·(kg·°C)−1; λ is liquid steel thermal conductivity, W·(m·°C)−1; qc is the heat flux at the mold/cooling water interface, W·m−2; hw is the heat transfer coefficient of cooling water, W/(m2·°C)−1; Tmc is the cold surface temperature of the copper plate, °C; Tw is the cooling water temperature at different height positions, °C; qx is the heat flux at the hot surface/slab wide face interface of the mold, W·m−2; qy is the heat flux at the hot surface/slab narrow face interface of the mold, W·m−2.
The heat transfer coefficient of cooling water can be calculated by the following empirical formula:
In the formula: D is the equivalent diameter of the mold copper plate water channel, m; λw is the thermal conductivity of cooling water, W·(m·°C)−1; ρw is the density of cooling water, kg·m−3; Cw is the specific heat capacity of cooling water, J·(kg·°C)−1; uw is the flow velocity of cooling water, m·s−1; μw is the dynamic viscosity of cooling water, kg·(m·s)−1.
Meanwhile, it is assumed that the temperature Tw of the mold cooling water changes linearly with height, and the temperature at different positions can be obtained by the following Equation (6):
In the formula, Tw-out is the cooling water temperature at the outlet, °C; Tw-in is the cooling water temperature at the inlet, °C; h is the height from the mold meniscus to the bottom, m; z is the distance from the thermocouple at different heights to the meniscus, m;
Based on the governing equation of unsteady solidification heat transfer, the mathematical model for the inverse heat transfer problem of the slab mold copper plate established in this paper is a two-dimensional unsteady heat conduction problem. By deriving the difference quotient expression from Taylor’s formula, a difference equation approximating the time differential equation can be constructed. The second-order central difference scheme for approximating the two-dimensional heat transfer formula of the slab is:
The difference equation format for the mold contact interface is:
Therefore, the difference equations for representative points at different positions on the copper plate can be derived and combined from the above equations, although the resulting heat transfer difference equations take different forms.
In this study, the model was coded and solved in MATLAB R2024a.
2.1.4. Mold Copper Plate Temperature Data Acquisition
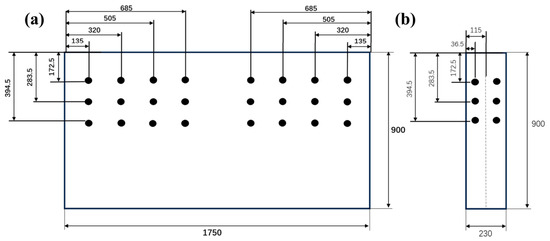
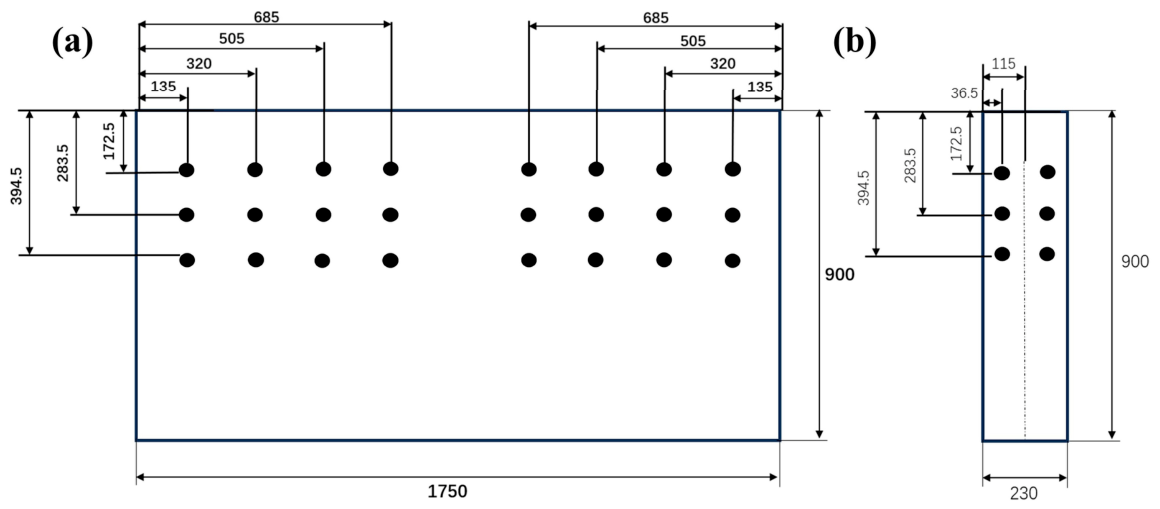
A slab continuous caster at a steel plant has a maximum adjustable section of 1750 mm × 250 mm, and the largest slab section it can produce is 1650 mm × 250 mm. The height of the mold is 900 mm. In the wide-face direction of the slab, 8 rows of thermocouples are embedded. The thermocouples are symmetrically distributed along the centerline. The positions of the first row and the eighth row of thermocouples are 135 mm away from the boundary of the copper plate. The spacing between adjacent rows of thermocouples is 185 mm, and the distance between the two middle rows of thermocouples is 380 mm. In the narrow-face direction of the slab, 2 rows of thermocouples are embedded, which are 36.5 mm away from the boundary of the copper plate. A total of 60 thermocouples are embedded in the mold copper plate, and the distribution is shown in Figure 1.
Figure 1.
Thermocouple distribution in the slab mold: (a) wide face of the copper plate; (b) narrow face of the copper plate.
The thickness of both the wide and narrow faces of the mold copper plate is 41 mm, and the top of the thermocouple is 21 mm away from the hot surface of the mold. Under the same working conditions, different temperatures correspond to specific heat flux values. However, the thermocouples embedded in the mold copper plate are affected not only by mold vibration but also by molten steel flow and the behavior of the mold flux film, resulting in fluctuating measured temperatures.
The test steel grade is 65Mn-Cr, and its chemical composition is given in Table 3.
Table 3.
Composition of 65Mn-Cr steel (mass percent).
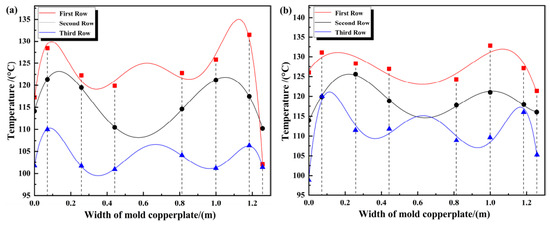
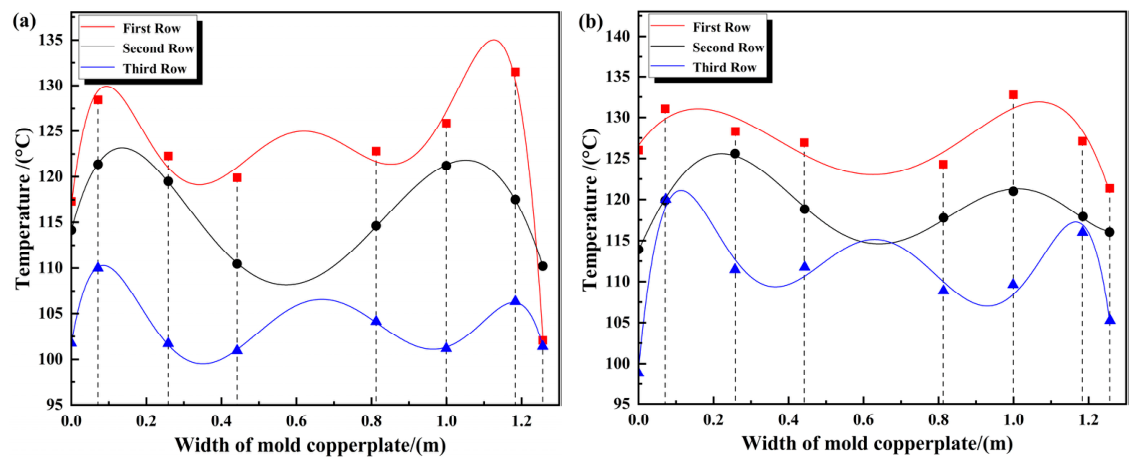
Table 4 shows the measured temperature data of the outer arc copper plate on the wide face, and Table 5 shows the measured temperature data of the inner arc copper plate on the wide face. Figure 2 compares the back-calculated, simulated, and measured temperatures. For the three rows of thermocouples on the outer-arc side of the mold copper plate, the back-calculated temperatures agree well with the measured values.
Table 4.
Temperature measurement results of thermocouples on the outer arc copper plate of the wide face of the slab.
Table 5.
Temperature measurement results of thermocouples on the inner arc copper plate of the wide face of the slab.
Figure 2.
Temperature distribution at the positions of thermocouples in each row on the wide face of the slab: (a) inner arc direction; (b) outer arc direction.
In Figure 2, the first, second, and third rows of thermocouples are located 172.5 mm, 283.5 mm, and 394.5 mm from the top of the mold, respectively. Since the total length of the mold is 900 mm and the effective height is 800 mm, the meniscus is 100 mm away from the top. Therefore, the distances from each row of thermocouples to the meniscus are 72.5 mm, 183.5 mm, and 294.5 mm, respectively.
2.1.5. Model Verification
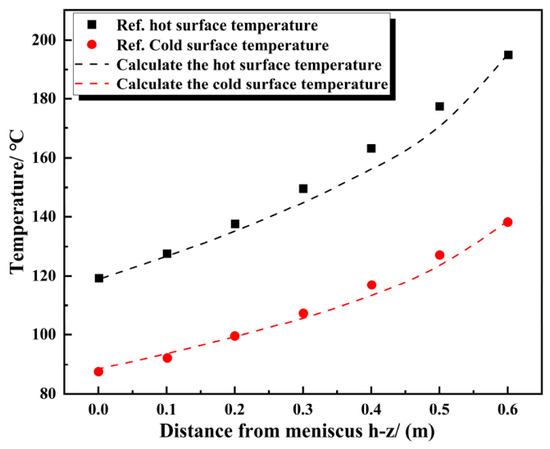
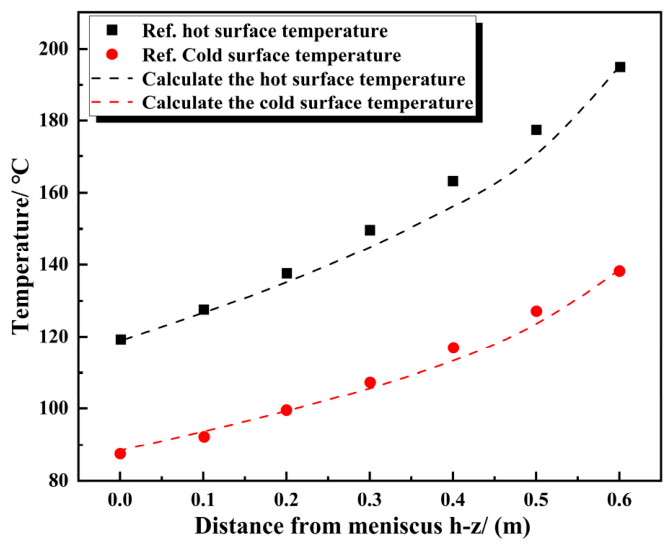
In this paper, the grid is divided into = = 1 mm2, and the physical parameters and the processed boundary results are imported into the MATLAB model. The comparison error between the calculation results and the references is shown in Table 6, and the verification model results are shown in Figure 3.
Table 6.
Comparison results between the simulation and the references.
Figure 3.
Model verification results.
The results show that the longitudinal temperature distribution on the hot and cold surfaces of the mold follows the same trend as that reported in the reference. The maximum temperature error on the hot surface over the region from 200 mm below the meniscus to the mold exit is 4.3%, and that on the cold surface over the region from 100 mm below the meniscus to the mold exit is 3.6%. The average temperature errors of the hot surface and the cold surface are 2.06% and 1.7%, respectively, and all errors are below 5%, which demonstrates that the model is reliable.
2.2. The Slab Solidification Heat Transfer Model
2.2.1. Model Assumptions
Considering the complexity of the solidification heat transfer process, the characteristics of the strand withdrawal process, and the objectives of this study, the following assumptions are made for the calculation of molten steel flow and heat transfer in the mold [22]:
- (1)
- Radiation heat transfer between the molten steel surface in the mold and the surrounding environment is ignored, and the influence of heat transfer from the slag layer on the meniscus surface is not considered.
- (2)
- The influence of mold vibration and taper on the model results is ignored.
- (3)
- The dimensional changes of the slab caused by solidification cooling shrinkage are neglected.
- (4)
- The flow and heat transfer of molten steel during continuous casting are assumed to reach a steady state.
- (5)
- The slab is assumed to be uniformly cooled within the same cooling zone; the cooling intensities on the inner- and outer-arc sides in the secondary cooling zone are governed by the spray water flow rate.
2.2.2. Conservation Equations
In this study, turbulence is modeled using the Reynolds-averaged Navier–Stokes (RANS) approach, and the standard k–ε two-equation model is used to solve for the turbulent kinetic energy and its dissipation rate. The governing equations for the coupled solidification problem are as follows:
Continuity equation:
where ρ is the density, kg·m−3; u is the fluid velocity, m·s−1.
Navier–Stokes equation:
where K is a function of the effective viscosity coefficient and the velocity components:
where is laminar viscosity, kg·m−1·s−1; is turbulent viscosity, kg·m−1·s−1.
where F is the source term, comprising the Darcy source term Fl and the thermal buoyancy FB.
The transport equations for the turbulent kinetic energy k and its dissipation rate ε of the standard k–ε model are given in Ref. [23]:
Energy conservation equation:
2.2.3. Computational Domain and Boundary Conditions
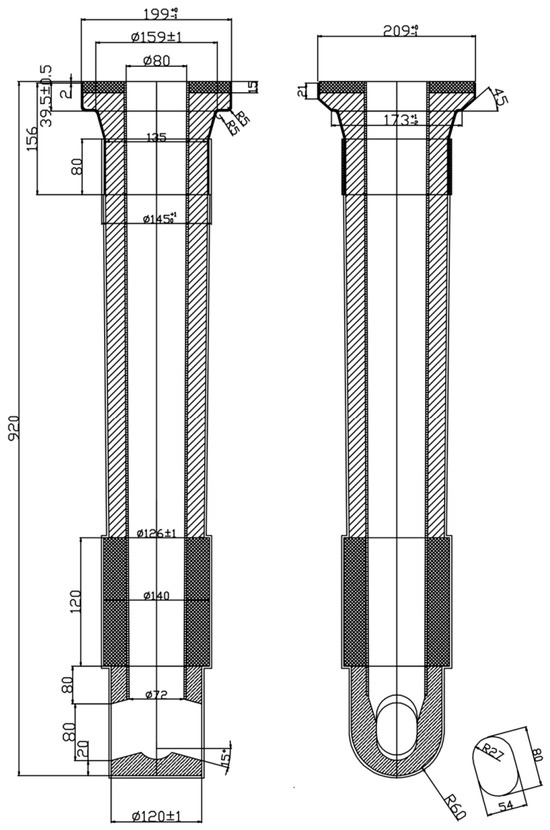
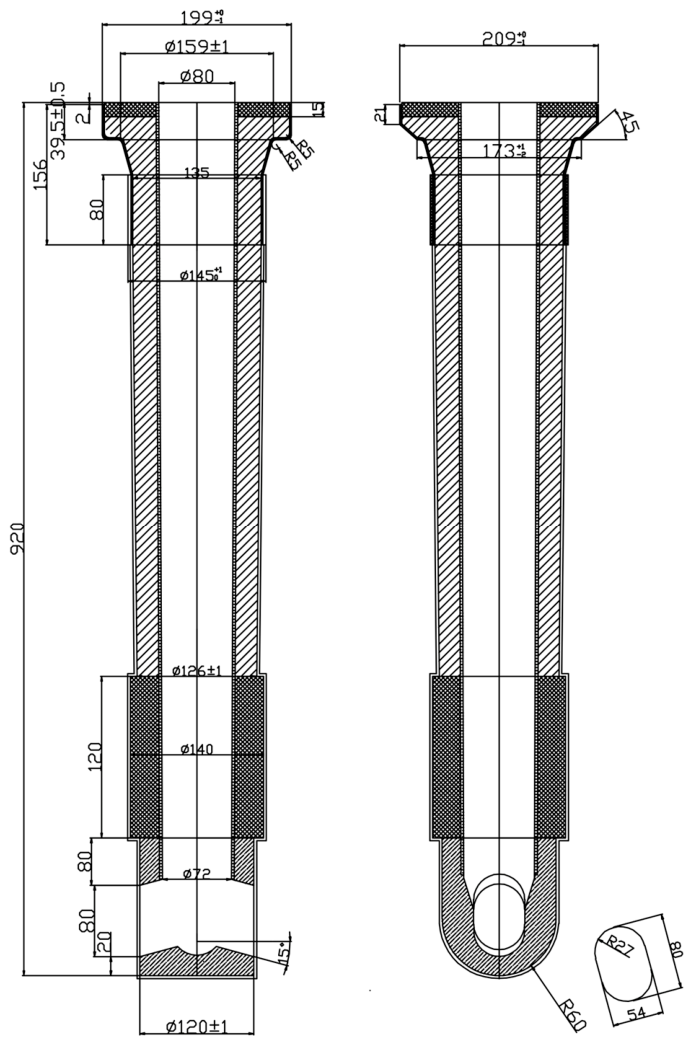
The mold and process parameters are listed in Table 7, and a schematic diagram of the submerged entry nozzle (SEN) is shown in Figure 4.
Table 7.
Geometric parameters and process parameters.
Figure 4.
Mold submerged nozzle schematic diagram.
The solidus and liquidus temperatures, calculated using JMatPro (UK; version 13.3, 2022), are 1475 °C and 1503 °C, respectively. The physical property parameters of solid and liquid phases are taken as constants, as shown in Table 8. The parameters in the two-phase region can be obtained through formula processing.
Table 8.
Constant value treatment of solid–liquidus lines.
The heat capacity treatment of the material within the phase transition interval can be expressed as:
In the formula: is the latent heat value, and is the mass fraction in the phase transition region. The formula is as follows:
In the formula: are the densities of the solid phase and liquid phase, respectively; are the solid phase fraction and liquid phase fraction, respectively.
The normal inflow velocity of the submerged entry nozzle is determined by the casting speed and the cross-sectional size of the produced slab. This velocity is denoted as, and is calculated as follows:
The turbulent kinetic energy and the turbulent kinetic energy dissipation rate at the inlet of the nozzle are calculated by the following formulas:
where D is the diameter of the nozzle, m; k is the turbulent kinetic energy, m2·s−2; Smold is the cross-sectional area of the mold, m2; Ssen is the cross-sectional area of the nozzle, m2; Vinlet is the inlet flow velocity of the nozzle, m·s−1; ε is the turbulent dissipation rate, m2·s−3.
(1) The heat flux distribution of the mold copper plate is obtained through inverse heat transfer calculation.
(2) The heat transfer in the secondary cooling zone can be obtained using the formula by M. Shimada et al. [24]:
Water mist zone:
In Equations (23) and (24), hw is the heat transfer coefficient, W·m−2·°C−1; W is the spray water flow rate, L·m−2·s−1; and Tw is the spray water temperature, °C.
(3) In the air-cooling zone, heat transfer mainly occurs through radiation to the surrounding air. The heat flux on its surface can be determined by the following equation:
where T0 is the ambient temperature, °C; ε is the emissivity of the slab surface, taken as 0.8; σ is the Boltzmann constant.
Based on the inverse heat transfer model, the heat flux distribution of the mold is calculated and applied as the boundary condition. The flow field, temperature field, and shell distribution of the three-dimensional continuous casting model are then simulated using COMSOL (Multiphysics® 6.3).
2.2.4. Model Verification
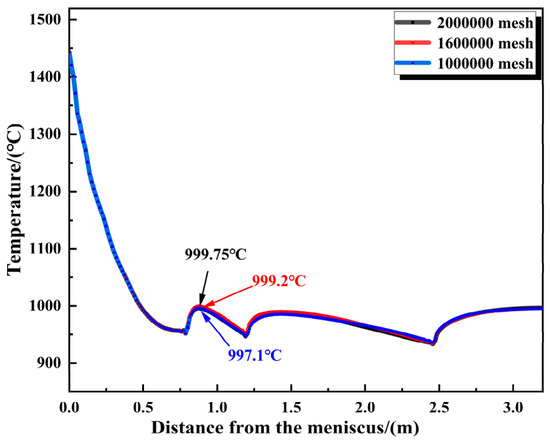
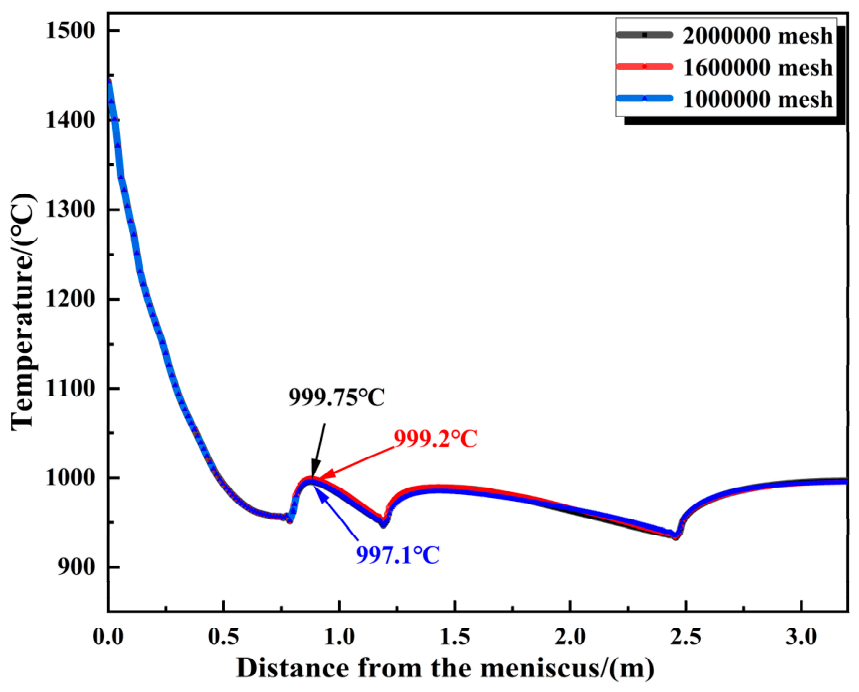
To verify grid independence, simulations were carried out using different mesh sizes, and the temperatures at the center of the wide face were compared. The comparison results are shown in Figure 5. At a position 0.9 m below the meniscus, the calculated temperature is 997.1 °C for a mesh of 1 million elements and 999.2 °C for 1.6 million elements. Increasing the mesh to 2 million gives 999.75 °C; further refinement changes the temperature by only 0.55 °C. Considering the computational cost of the workstation, a mesh of 1.6 million elements is adopted for the subsequent simulations, as it offers a good compromise between accuracy and computational time.
Figure 5.
Grid independence verification.
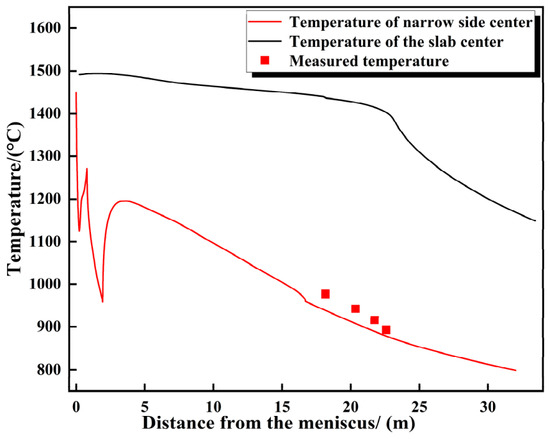
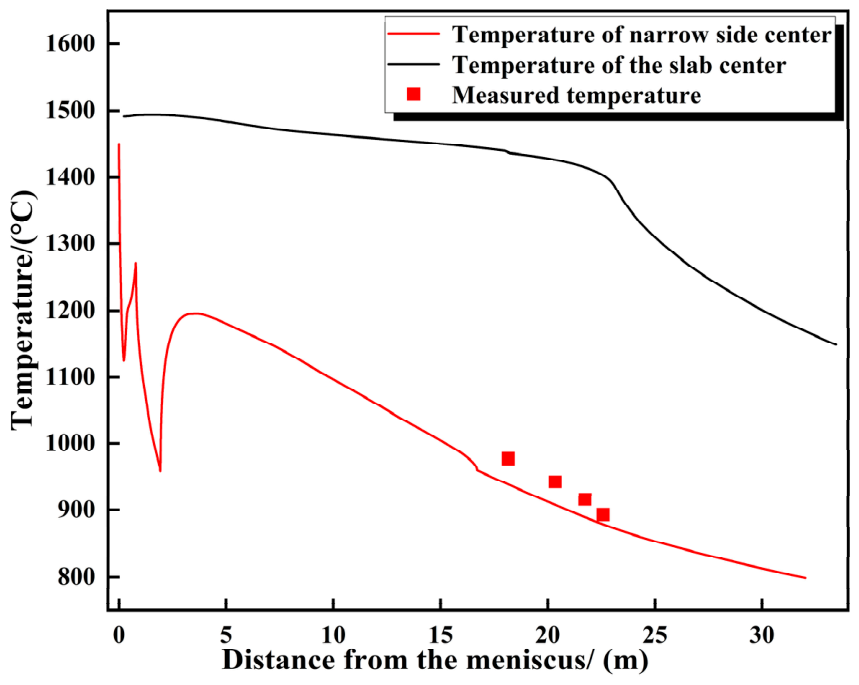
In the center of the narrow surface at the end of the 7th, 8th and 9# segments of the casting machine, the temperature measurement is carried out by using the on-site infrared thermometer. The average measured temperatures are 978 °C, 943.3 °C, 916.6 °C and 893.4 °C, respectively. The measured data are compared with the calculated temperature values of the model. The results show that the error between the two is controlled within 5%. Among them, the calculation error of the end position of the 7# segment reaches the maximum value of 3.4%; at the end of the 9# segment, the calculated temperature of the model is 884.7 ° C, and the error is very small, only 0.97%. The details of the relevant data are shown in Table 9, and the comparison between the calculated temperature and the measured temperature at the center of the slab narrow face is clearly shown in Figure 6. In view of the fact that the error between the calculated temperature of the model and the measured temperature in the field is always maintained within 5% from the end of the 7# segment to the end of the 9# segment, it is fully demonstrated that the calculation results of the model have high reliability and can provide reliable data support for related research and production practice.
Table 9.
Calculated temperature error values of each section.
Figure 6.
Comparison between the calculated and measured temperatures at the center of the narrow face of the slab.
3. Results and Discussion
3.1. Calculation Results of Heat Flux on Mold Copper Plate
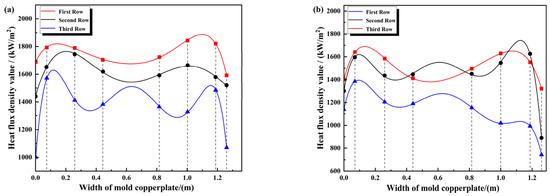
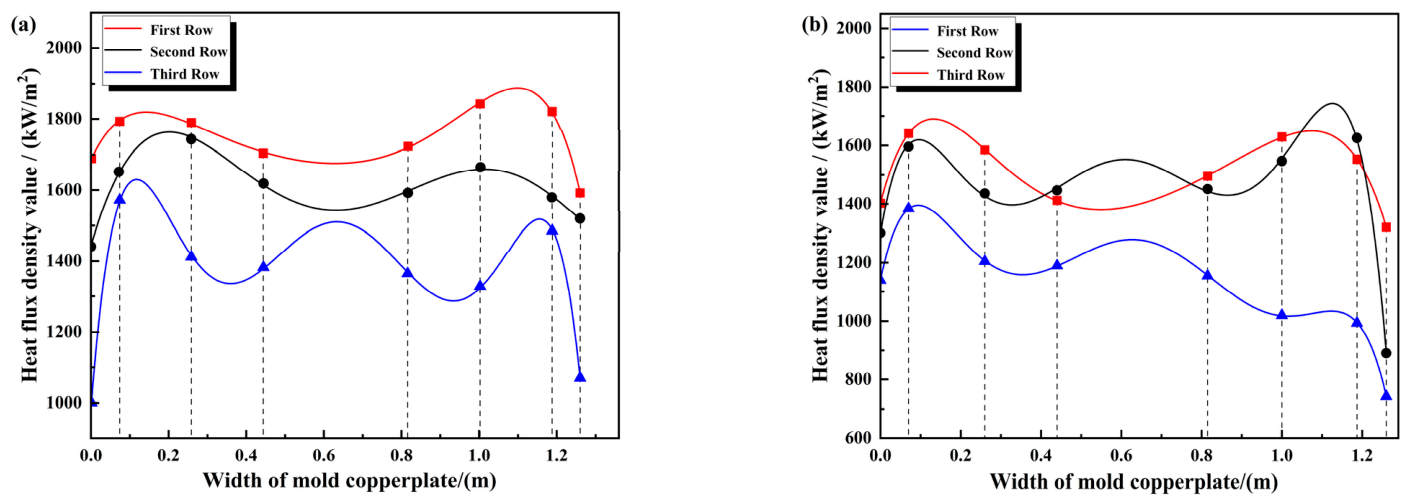
Through inverse heat transfer calculation, the transverse distribution of heat flux in each row on the mold copper plate during stable production is obtained. As shown in Figure 7, the heat flux exhibits a certain symmetrical distribution in the transverse direction of the copper plate, with peaks and valleys. At positions 72.5 mm and 183.5 mm from the meniscus, the lowest heat flux in the outer arc direction is at the centerline of the wide face, which are 1675.7 kW/m2 and 1542.9 kW/m2, respectively. The peaks appear at positions 200 mm away from the narrow face, with the maximum heat flux being 1887.8 kW/m2 and 1763 kW/m2, respectively. After optimizing the inverse heat transfer calculation for the position 72.5 mm from the meniscus, the distribution at the centerline changes to a peak, reaching 1550.2 kW/m2, and the maximum value at 168 mm away from the narrow edge is 1745 kW/m2. The heat flux at 183.5 mm from the meniscus is distributed similarly to that on the wide-face outer arc, with the maximum and minimum values being 1687.4 kW/m2 and 1389.1 kW/m2, respectively. At the position 294.5 mm from the meniscus, the peaks of heat flux in the outer arc and inner arc directions are mainly concentrated within 150 mm from the narrow face, with the maximum values being 1631.7 kW/m2 and 1397.2 kW/m2, respectively. However, the distribution at the centerline changes to a peak, reaching 1511 kW/m2 and 1281.1 kW/m2, respectively. Meanwhile, in the inner arc direction, there is a significant decrease in the area 1180 mm away from the left narrow-edge copper plate, with the minimum value reaching 734.8 kW/m2.
Figure 7.
Lateral distribution of heat flux in each row of the mold copper plate: (a) direction of the wide face of the outer arc; (b) direction of the wide face of the inner arc.
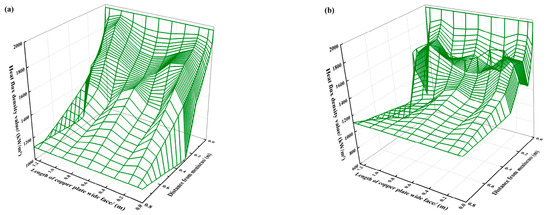
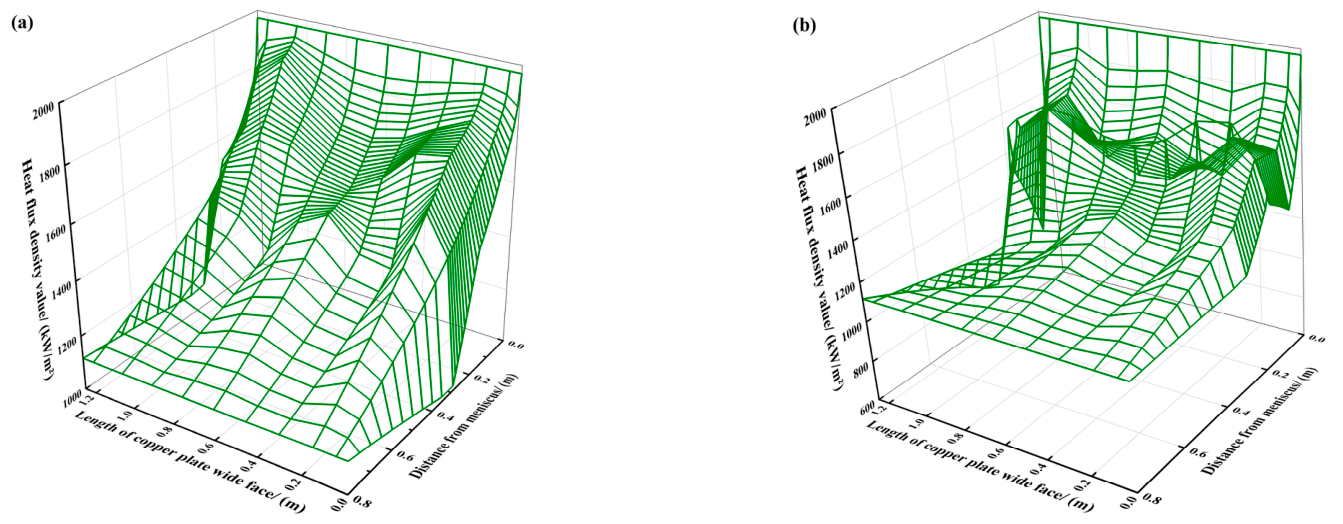
After fitting the longitudinal heat flux using Savage’s empirical formula, the distribution characteristics of the heat flux on the entire mold copper plate were obtained. As shown in Figure 8, the longitudinal variation of heat flux on the mold copper plate exhibits a trend of fast initial decline followed by a slow decrease. The average heat flux is the highest at 72.5 mm from the meniscus in the outer arc direction. When the distances from the meniscus in the outer arc direction of the mold wide face are 72.5 mm, 183.5 mm, and 294.5 mm, the average heat flux values are 1778 kW/m2, 1643 kW/m2, and 1413 kW/m2, respectively. In the inner arc direction, the heat flux at 183.5 mm from the meniscus is 1556 kW/m2, which exceeds the value of 1521 kW/m2 at 72.5 mm from the meniscus, and the average heat flux at 294.5 mm is 1163 kW/m2.
Figure 8.
Overall distribution of heat flux on the mold copper plate: (a) direction of the wide face of the outer arc; (b) direction of the wide face of the inner arc.
The average heat flux at the meniscus is 1973.1 kW/m2. At a distance of 294.5 mm from the meniscus, the largest change occurs in the inner arc direction, reaching 810 kW/m2. Meanwhile, at the mold exit, the heat flux is 1116.3 kW/m2, representing a decrease of 46.7 kW/m2, which further highlights the trend of longitudinal heat flux decreasing first rapidly and then slowly. Within the thermocouple measurement range, at the same distance from the narrow face, the heat flux in the outer arc direction is higher than that in the inner arc direction. However, due to the energy conservation requirement for heat transfer through the entire mold copper plate, the heat flux in the outer arc direction is lower than that in the inner arc direction near the mold exit.
3.2. Results of Coupled Flow, Heat Transfer and Solidification Calculation
3.2.1. Initial Solidification Flow Field Distribution in Mold
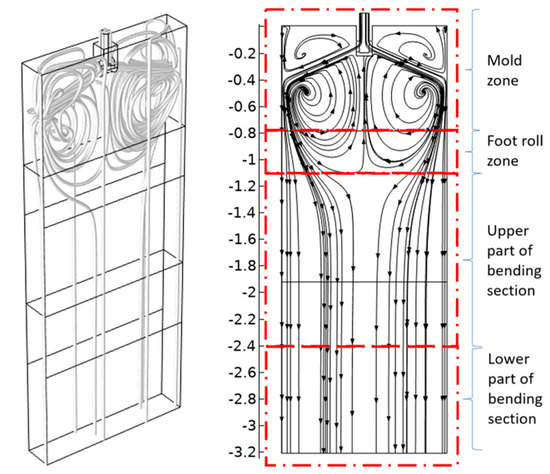
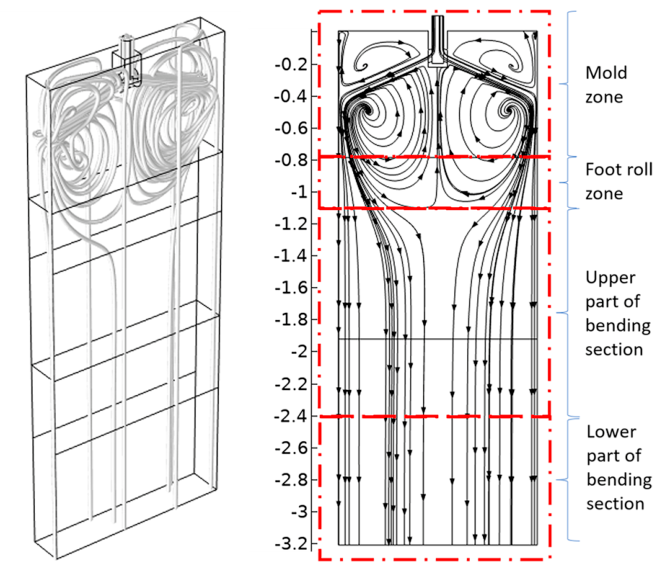
Figure 9 shows the distribution nephogram of the molten steel flow field on the wide face and the flow field distribution diagram of the central section in the slab mold under the working conditions of a casting speed of 1.05 m/min, an immersion depth of 140 mm, and an exit inclination angle of 15°. Molten steel is poured into the mold from the submerged entry nozzle and flows toward the narrow face at the inclination angle of the nozzle. When the molten steel impacts the narrow face of the mold, it is divided into upper and lower flow streams. The upward flow clings to the narrow face of the mold and climbs upward, generating a secondary recirculation near the meniscus at the narrow edge of the slab. At the same time, after the main flow reaches the meniscus, it continues to flow toward the nozzle direction. Under the entrainment effect of the jet flow at the nozzle exit, an upper recirculation zone is formed in the mold. The circulating flow of superheated molten steel in the upper recirculation zone directly affects the fluctuation of the free liquid surface, and excessive flow velocity can cause slag entrainment. Moreover, the flow of superheated molten steel on the liquid surface can provide essential heat for the melting of the protective slag, thereby ensuring efficient heat transfer from the slab to the mold.
Figure 9.
Schematic diagram of the flow field in the mold: on the left is the flow field distribution inside the mold; on the right is the flow field distribution at the central interface.
Most of the molten steel in the other flow stream flows downward along the narrow face of the mold. Part of the molten steel reaches the foot roller zone and is uniformly distributed throughout the slab section with the advancement of the casting process. Another part of the molten steel turns toward the nozzle direction after reaching the foot roller zone and converges with the main flow of molten steel from the nozzle to form a lower recirculation zone with a circulation direction opposite to that of the upper recirculation zone. The flow of molten steel in the lower recirculation zone further promotes the floating up and removal of inclusions in the mold, while the molten steel uniformly distributed throughout the slab section will affect the morphology of the solidification structure in the secondary cooling zone of the slab to a certain extent.
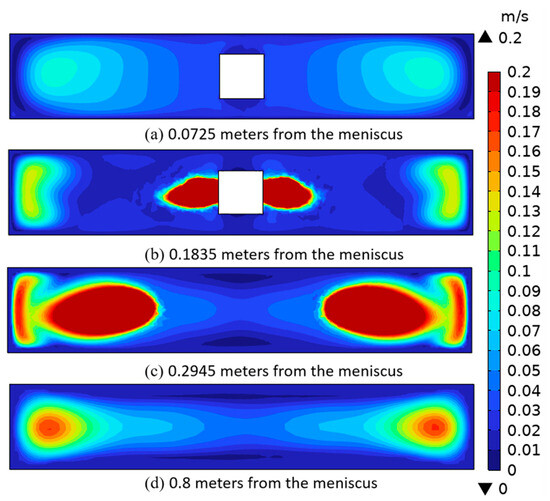
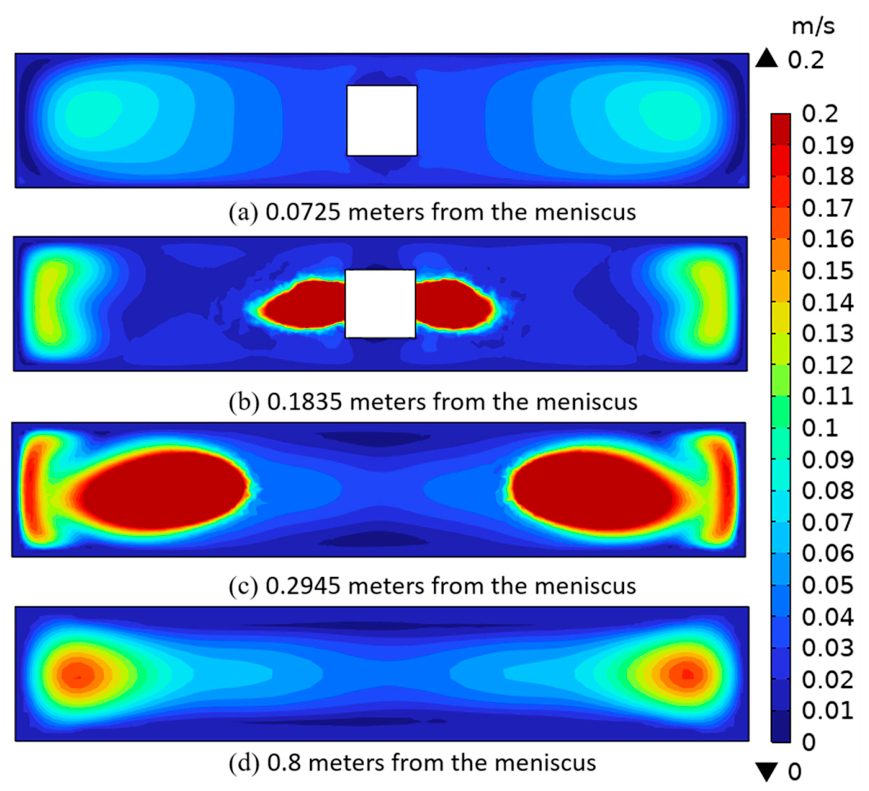
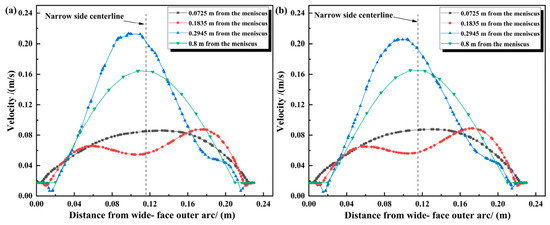
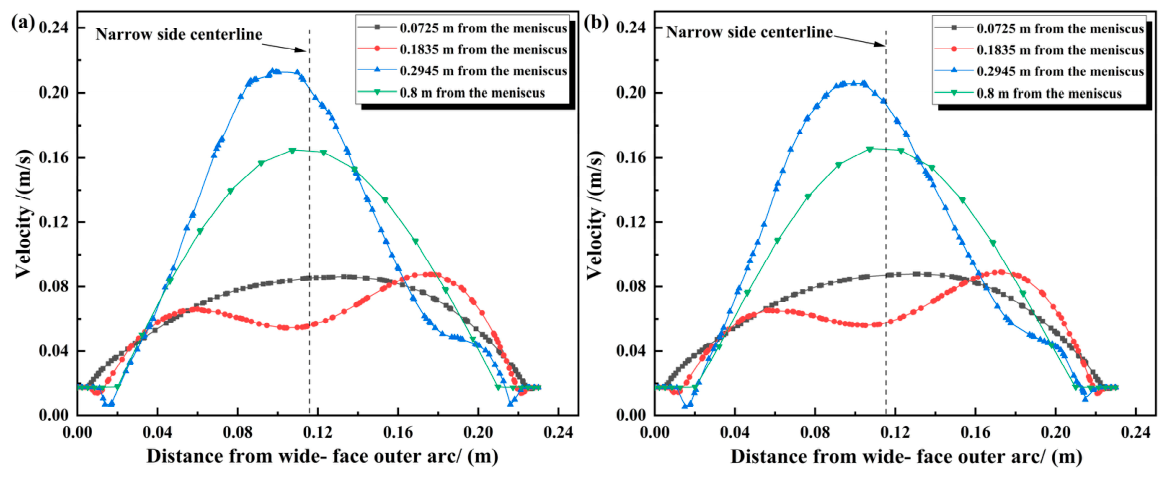
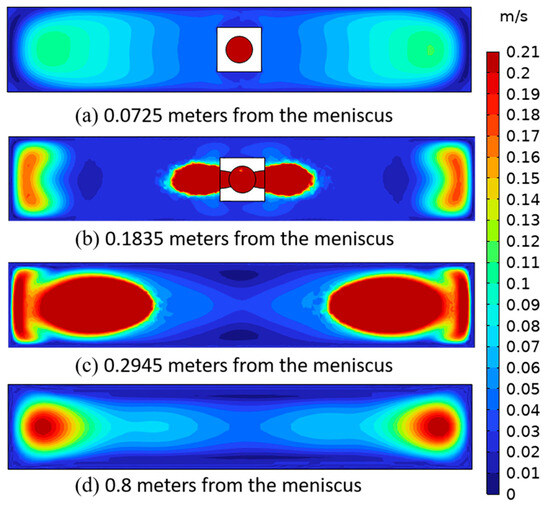
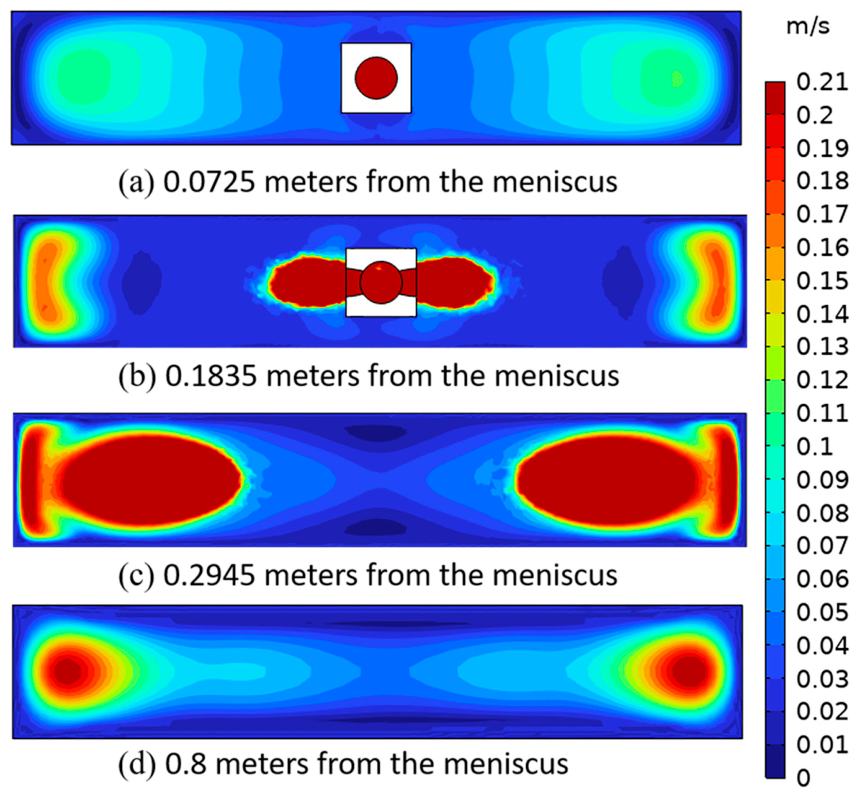
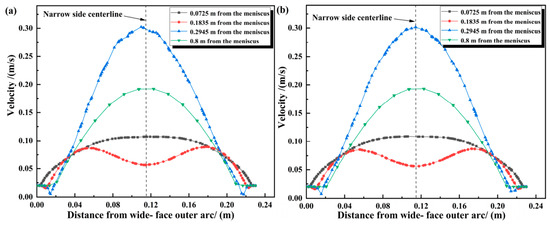
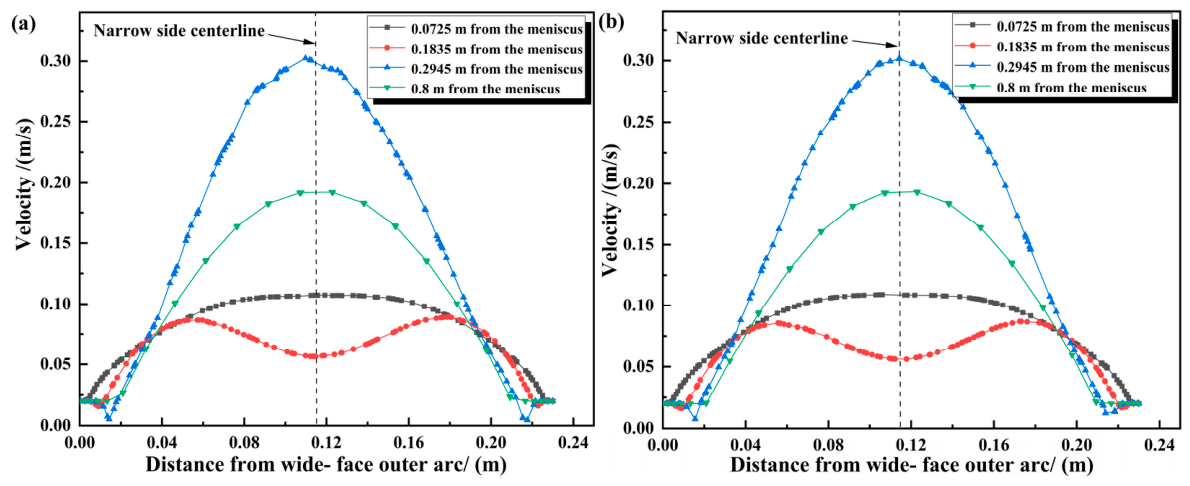
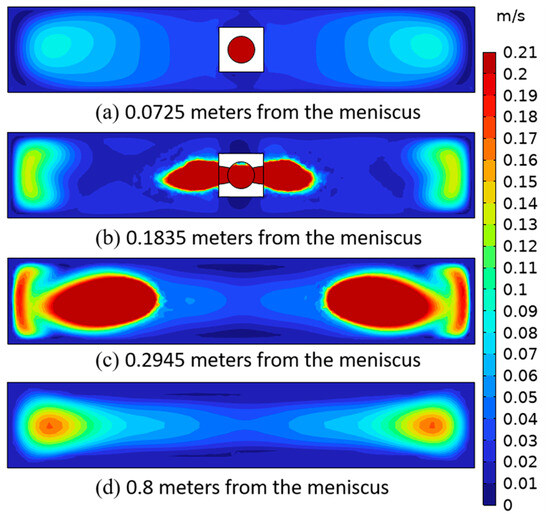
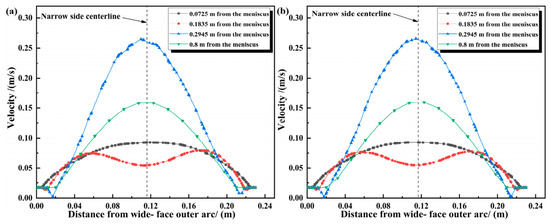
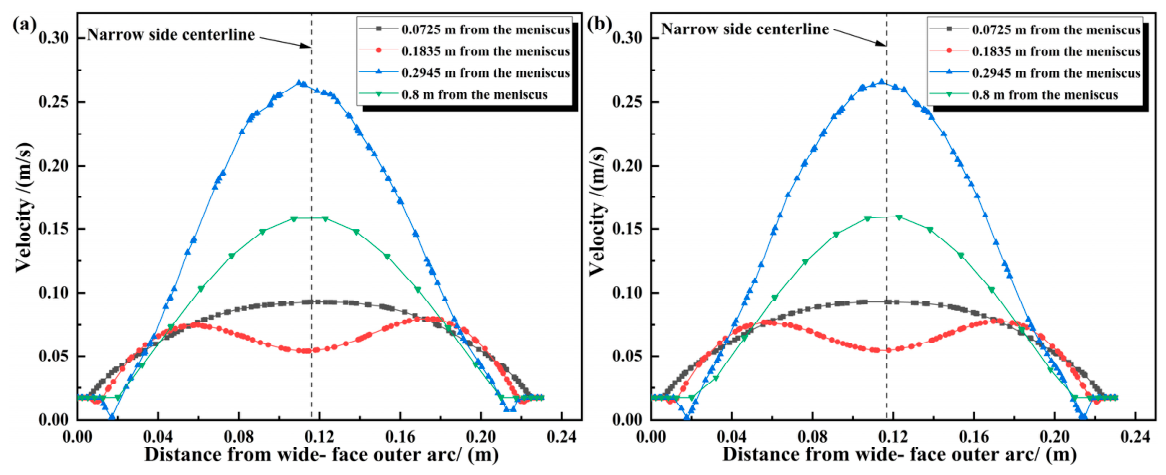
Figure 10 shows the cross-sectional velocity distribution nephograms at various positions in the slab mold at a casting speed of 1.05 m/min. Figure 11 presents the velocity distributions on the outer and inner arcs, where Figure 11a is at a position 100 mm from the left narrow face, and Figure 11b is at a position 100 mm from the right narrow face. At a distance of 72.5 mm from the meniscus, close to the top of the meniscus, the velocity distribution at each position in the cross-section is relatively uniform. Meanwhile, the velocity distributions on both sides are centrally symmetric with respect to the wide face, but there are differences in the velocity between the outer and inner arc directions—the area with high-speed molten steel flow is biased toward the outer arc of the wide face. At a distance of 183.5 mm from the meniscus, the velocity distributions on both sides are also centrally symmetric with respect to the wide face, but velocity differences exist between the outer and inner arc directions, with the high-speed molten steel flow area still biased toward the outer arc of the wide face. At a distance of 294.5 mm from the meniscus, the velocity distributions on both sides remain centrally symmetric with respect to the wide face. This position is located in the main path of molten steel flowing out from the submerged entry nozzle, but the velocity is biased toward the inner arc of the wide face. The velocity difference between the outer and inner arcs of the wide face decreases until reaching the mold exit.
Figure 10.
Contour map of the cross-sectional velocity distribution at various positions inside the slab mold at a speed of 1.05 m/min.
Figure 11.
Velocity distribution diagrams of the inner and outer arcs: (a) at the position 100 mm away from the narrow face on the left end; (b) at the position 100 mm away from the narrow face on the right end.
Combined with the heat flux calculation results, the maximum values of transverse heat flux at different distances from the meniscus are all located near the flow path of superheated molten steel. Meanwhile, the difference in heat flux boundary conditions between the outer and inner arcs leads to different velocity distributions in these two directions. At positions 72.5 mm and 183.5 mm from the meniscus, the heat flux in the outer arc direction is higher than that in the inner arc direction, but the main velocity direction at these positions is toward the inner arc. At the 294.5 mm position from the meniscus, the influence of the upper recirculation molten steel in the inner arc direction causes the main flow of molten steel from the nozzle to deflect toward the outer arc.
3.2.2. Initial Solidification Temperature Field Distribution in Mold
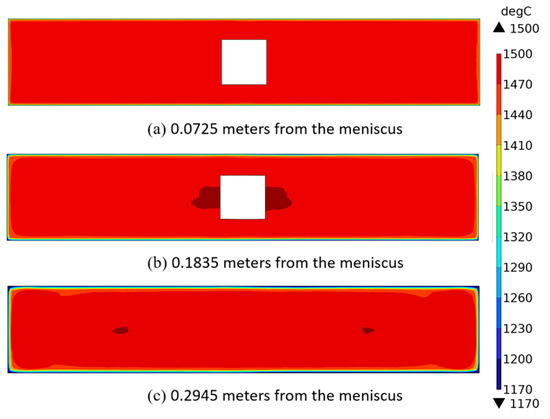
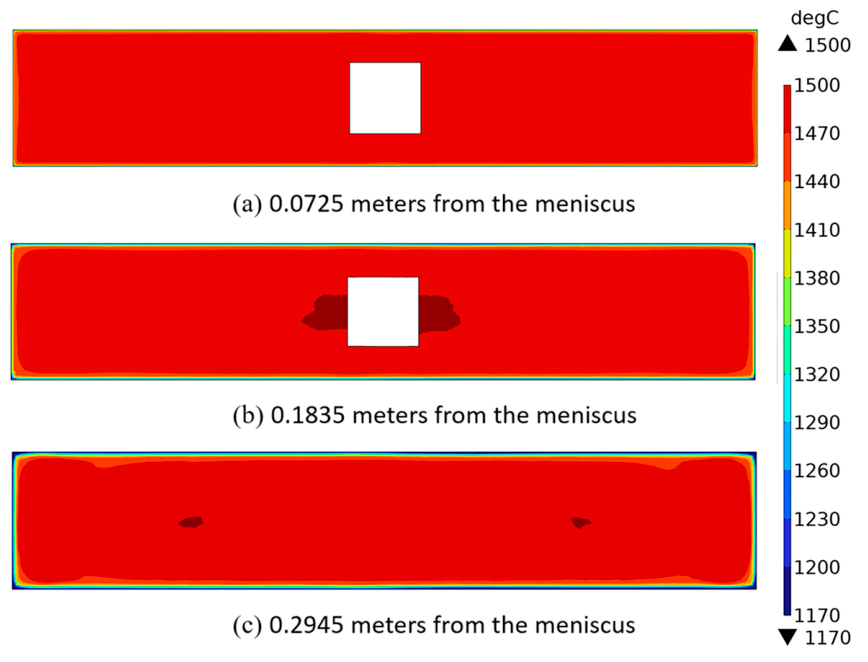
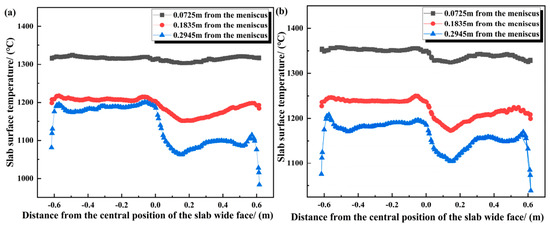
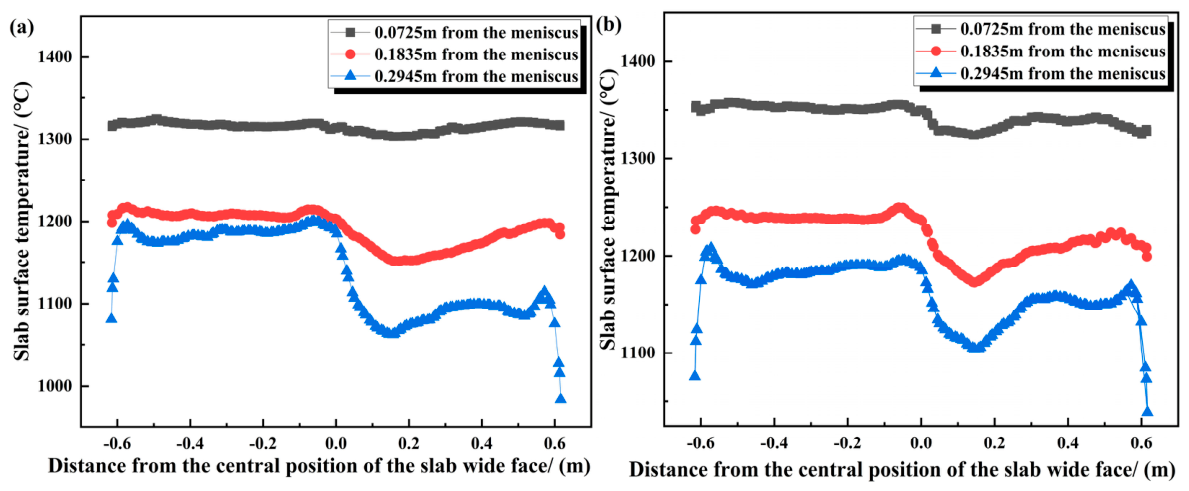
As shown in Figure 12, the temperature distribution of the cross-section of the fine-blanked steel slab at the thermocouple positions in the mold is presented, while Figure 13 shows the surface temperature distribution of the slab at the thermocouple positions. Figure 13a depicts the outer arc surface temperature distribution, and Figure 13b shows the inner arc surface temperature distribution. At the meniscus: The temperature at the center of the outer arc wide face is 1439 °C, and the lowest temperature is at the corner (1431.4 °C). The temperature at the inner arc center is approximately 1455.9 °C, with the lowest corner temperature being 1444.2 °C. Due to two-dimensional heat transfer at the corners, the temperature drops faster, but all temperatures remain above the solidus temperature, so no initial solidified shell is formed. At 72.5 mm from the meniscus: The initial solidified shell has formed, with the surface temperatures of both the outer and inner arcs of the wide face dropping below 1380 °C. The outer arc surface temperature distribution is relatively uniform, while the inner arc shows significant fluctuations. Within 50 mm from the center, the surface temperature reaches a low of 1324.3 °C. The average temperatures in the outer and inner arc directions at the first row of thermocouples are 1347.3 °C and 1326.1 °C, respectively. At 183.5 mm from the meniscus: As the superheat of the molten steel continues to dissipate, the shell thickness increases. Obvious low temperatures appear near the center of the slab surface within 100 mm from the center, with the minimum values on the outer and inner arcs of the wide face being 1172.3 °C and 1151.7 °C, respectively. The lowest values are mainly concentrated on the right narrow face side of the slab, caused by insufficient flow of high-temperature molten steel below the submerged entry nozzle, leading to low heat supply in the central area. At 294.5 mm from the meniscus: Figure 9 shows lower temperatures in the 1/4 position of the slab cross-section (i.e., within the downward recirculation range of molten steel). This is because the superheated molten steel forms a large recirculation zone as part of the flow moves toward the lower end of the submerged entry nozzle. Additionally, heat transfer from the upward recirculating molten steel to the shell further lowers the temperature, causing uneven temperature distribution in the recirculation core and central area of the slab. Figure 8 also indicates that the surface temperature unevenness of the slab increases further at this position. The minimum values within 100 mm from the center are 1104.6 °C (outer arc) and 1062.3 °C (inner arc), with the temperature on the right side of the center being significantly lower than the left side.
Figure 12.
Temperature distribution of the cross-section of the fine-blanking steel slab at the position of the thermocouple inside the mold.
Figure 13.
Surface temperature distribution of the slab at the thermocouple positions: (a) in the direction of the outer arc; (b) in the direction of the inner arc.
3.2.3. Initial Solidification Shell Distribution in Mold
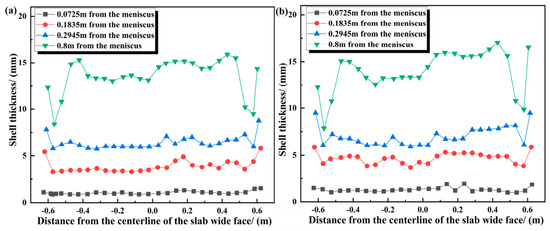
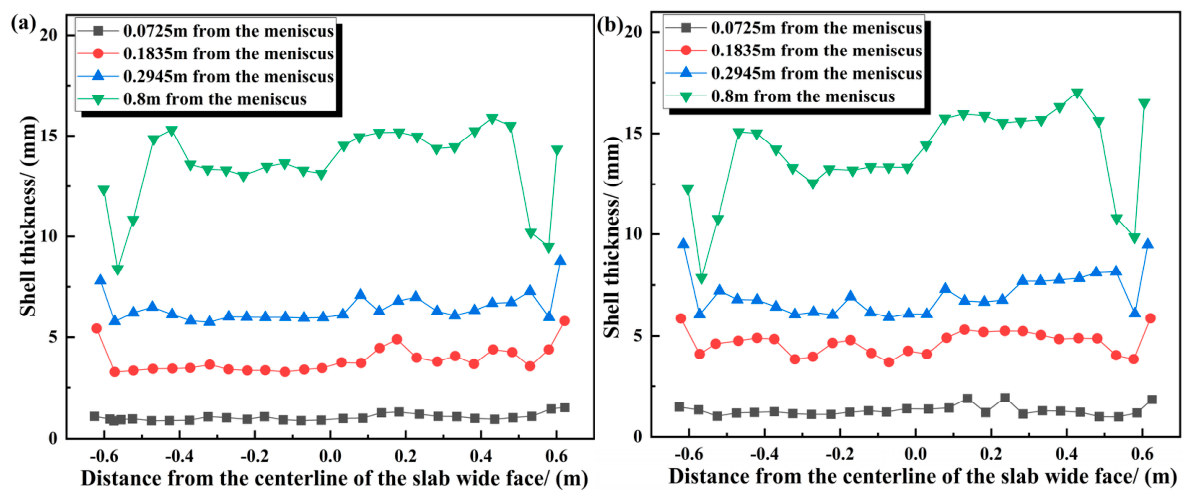
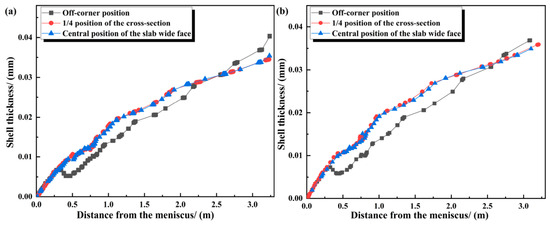
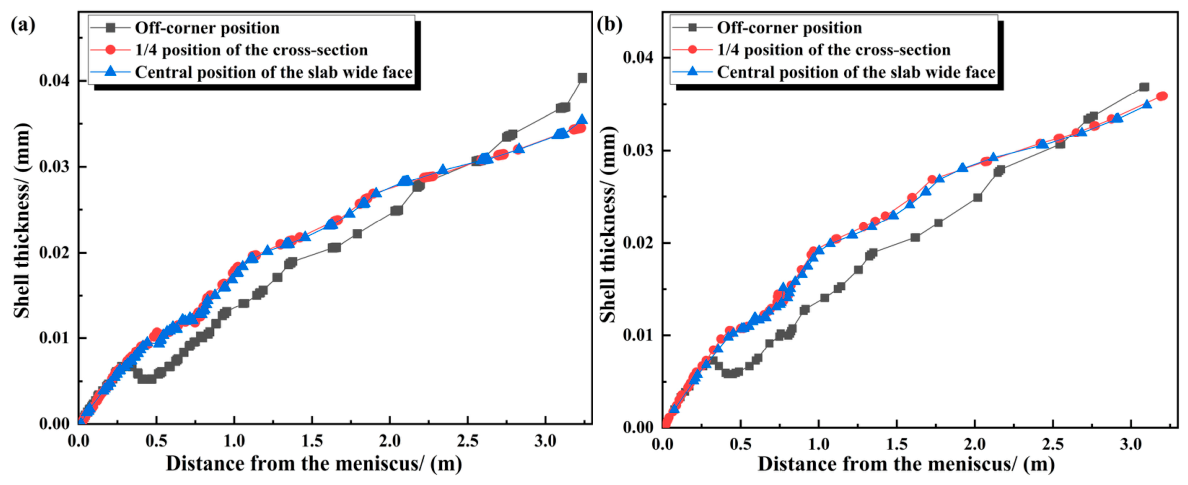
Figure 14 shows the thickness of the shell on the inner and outer arcs of the wide face at the mold exit under the working conditions of a casting speed of 1.05 m/min and a secondary cooling water distribution ratio of 0.86 L/kg, influenced by the molten steel flow and heat transfer in the mold. Figure 15a displays the shell thickness in the inner arc direction, while Figure 15b shows that in the outer arc direction. Figure 15 presents the longitudinal distribution of shell thickness. The formation of the slab shell is primarily affected by the heat flux distribution of the mold copper plate and the internal flow field distribution. Transverse Shell Variation: In the early solidification stage, the shell exhibits uniform transverse distribution. However, as the distance from the meniscus increases, the shell thickness fluctuates, with the thickness on the right side of the slab being greater than that on the left side. By the mold exit, the shell distribution is significantly uneven, with a maximum thickness difference of 4.47 mm in the outer arc direction. Along the casting direction, the shell thickness gradually increases. Notably, at positions approximately 100 mm from the narrow face, the shell thickness reaches its maximum value on the same cross-section, which coincides with the location of the maximum heat flux. Outer Arc Direction: Shell thicknesses at the corner-biased, 1/4 cross-section, and wide face center positions are 9.92 mm, 14.43 mm, and 14.64 mm, respectively. Inner Arc Direction: Shell thicknesses at the corresponding positions are 10.04 mm, 13.68 mm, and 13.3 mm, respectively.
Figure 14.
Shell thickness distribution on inner and outer arc sections: (a) inner arc direction; (b) outer arc direction.
Figure 15.
Longitudinal shell thickness distribution on inner and outer arcs: (a) inner arc direction; (b) outer arc direction.
Corner Region Behavior: In the initial stage, heat transfer in the corner region is two-dimensional, leading to the fastest shell thickness growth. However, as gas gaps gradually form, thermal resistance increases, and the growth rate of shell thickness slows down.
For different parts of the slab, the change rate of shell thickness varies due to differences in heat transfer conditions. For the wide edges of the inner and outer arcs of the slab: Initial Solidification Stage: Heat transfer is good, and the shell thickness increases rapidly. Subsequent Stage: As the heat flow between the mold and the slab gradually decreases, the growth rate of the shell thickness slows down. At the mold exit: The shell thickness in the right-side area is relatively thicker than that in the left-side area. The minimum shell thickness at the wide-face exit of the mold is mainly distributed near the narrow edges. This phenomenon may be caused by the remelting effect of superheated molten steel on the solidified shell during the downward recirculation process, leading to a “reheating” effect on the shell.
3.3. Influence of Process Parameters on Flow, Heat Transfer and Solidification
3.3.1. Effect of Casting Speed on Initial Solidification in Mold
Figure 16 shows the cross-sectional velocity distribution nephograms at various positions in the slab mold under a casting speed of 1.2 m/min. Figure 17 presents the velocity distributions on the outer and inner arcs, where Figure 17a is at a position 0.1 m from the left narrow face, and Figure 17b is at a position 0.1 m from the right narrow face. When the casting speed is increased from 1.05 m/min to 1.2 m/min: Velocity Distribution Symmetry: The velocity distributions on both sides exhibit central symmetry with respect to the wide face at all positions from the meniscus to the mold exit, and the velocity difference between the outer and inner arc directions disappears. Flow Impact Depth: Near the top of the meniscus, the velocity distribution remains relatively uniform. With the increase in flow velocity, the impact depth of molten steel from the nozzle increases, leading to an expansion of the high-speed impact area at the position 294.5 mm from the meniscus. Exit Velocity: The maximum flow velocity near the narrow face at the mold exit remains at 0.304 m/s.
Figure 16.
Contour map of the cross-sectional velocity distribution at various positions within the slab mold at a casting speed of 1.2 m/min.
Figure 17.
Velocity distribution diagrams of the inner and outer arcs: (a) at the position 100 mm away from the narrow face on the left end; (b) at the position 100 mm away from the narrow face on the right end.
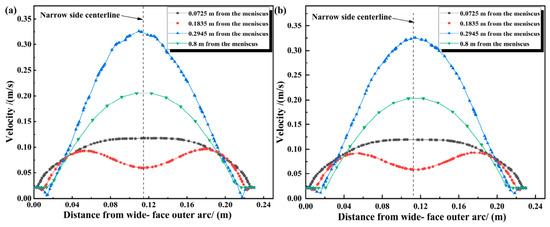
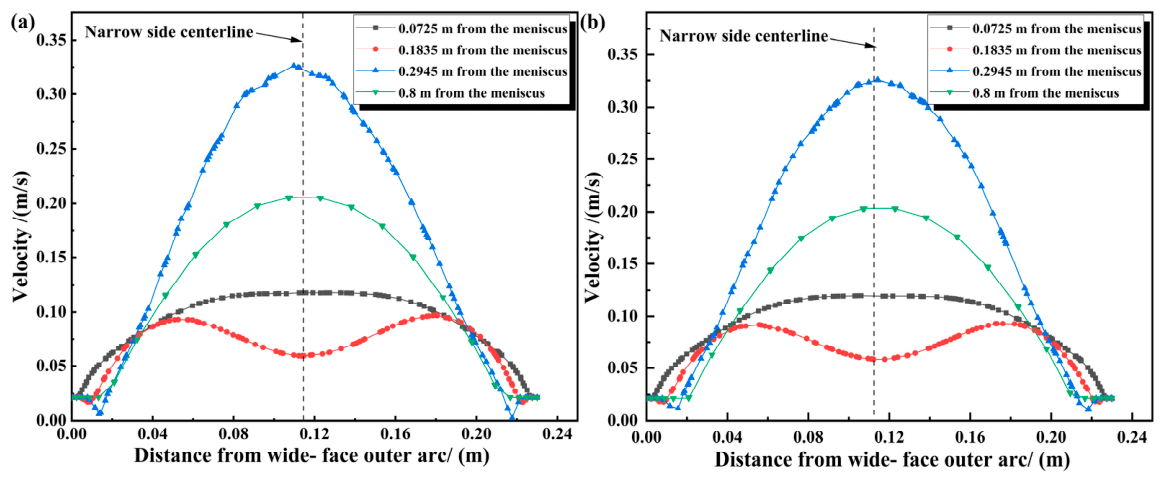
Figure 18 shows the velocity distributions on the outer and inner arcs at a casting speed of 1.3 m/min, where Figure 18a is at a position 100 mm from the left narrow face and Figure 18b is at a position 0.1 m from the right narrow face. Similar to the velocity distribution at a casting speed of 1.2 m/min: Symmetry of Velocity Distribution: From the meniscus to the mold exit, the velocity distributions on both sides are centrally symmetric with respect to the wide face, and the velocity difference between the outer and inner arc directions disappears. Uniformity Near Meniscus: The velocity distribution is relatively uniform near the top of the meniscus. As the flow velocity increases, the impact depth of molten steel from the nozzle further increases, leading to an expansion of the high-speed impact area at the position 294.5 mm from the meniscus and near the mold exit. Increased Exit Velocity: The maximum flow velocity at the mold exit reaches 0.329 m/s.
Figure 18.
Velocity distribution diagrams of the inner and outer arcs at a casting speed of 1.3 m/min: (a) at the position 100 mm away from the narrow face on the left end; (b) at the position 0.1 m away from the narrow face on the right end.
The above results indicate that changes in casting speed directly affect the flow field dynamics. The maximum values of transverse heat flux are consistently located near the flow path of superheated molten steel. Meanwhile, when the mold’s heat transfer efficiency is constant, increasing the casting speed can reduce the flow deflection of molten steel from the nozzle. However, in actual production, nozzle clogging may also cause molten steel deflection, meaning that increasing the flow rate could exacerbate this phenomenon.
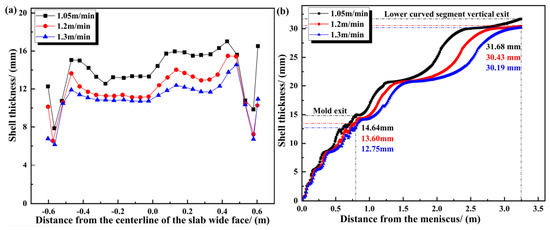
Figure 19 shows the variation in shell thickness distribution in the outer arc direction under different casting speeds with a secondary cooling water ratio of 0.86 L/kg and a superheat of 28 °C. Figure 19a presents the transverse distribution of the wide-face shell thickness at the mold exit, and Figure 19b shows the longitudinal distribution of the wide-face central shell thickness. When the casting speed changes, transverse unevenness in shell thickness persists. Additionally, the faster the casting speed, the thinner the shell at the wide-face center, which reduces the shell’s strength to resist the hydrostatic pressure of molten steel and may lead to breakout accidents.
Figure 19.
Variation of shell thickness distribution in outer arc direction under different casting speeds: (a) transverse distribution of wide-face shell thickness at mold exit; (b) longitudinal distribution of wide-face central shell thickness.
As the casting speed increases, the longitudinal shell thicknesses are 14.64 mm, 13.60 mm, and 12.75 mm, respectively. On average, for every 0.1 m/min increase in casting speed, the shell thickness decreases by 0.74 mm. This demonstrates that faster casting speeds result in slower shell solidification.
3.3.2. Effect of Superheat on Initial Solidification in Mold
Figure 20 shows the cross-sectional velocity distribution nephograms at various positions in the slab mold under a superheat of 10 °C. Figure 21 presents the velocity distributions on the outer and inner arcs, where Figure 21a is at a position 100 mm from the left narrow face, and Figure 21b is at a position 100 mm from the right narrow face. When the superheat is reduced from 28 °C to 10 °C: Velocity Distribution Symmetry: The velocity distributions on both sides exhibit central symmetry with respect to the wide face at all positions from the meniscus to the mold exit, and the velocity difference between the outer and inner arc directions is significantly reduced. Flow Impact Depth: Near the top of the meniscus, the velocity distribution remains relatively uniform. With the increase in flow velocity, the impact depth of molten steel from the nozzle increases, leading to an expansion of the high-speed impact area at the position 294.5 mm from the meniscus.
Figure 20.
Cross-sectional velocity distribution nephograms at various positions in the slab mold under a superheat of 10 °C.
Figure 21.
Velocity distribution diagrams of outer and inner arcs: (a) 100 mm from the left narrow face; (b) 100 mm from the right narrow face.
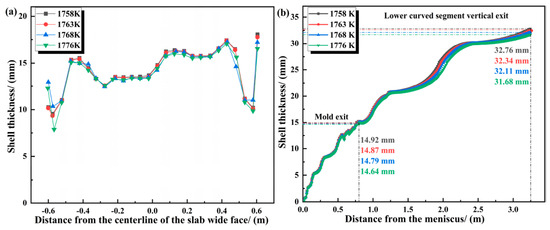
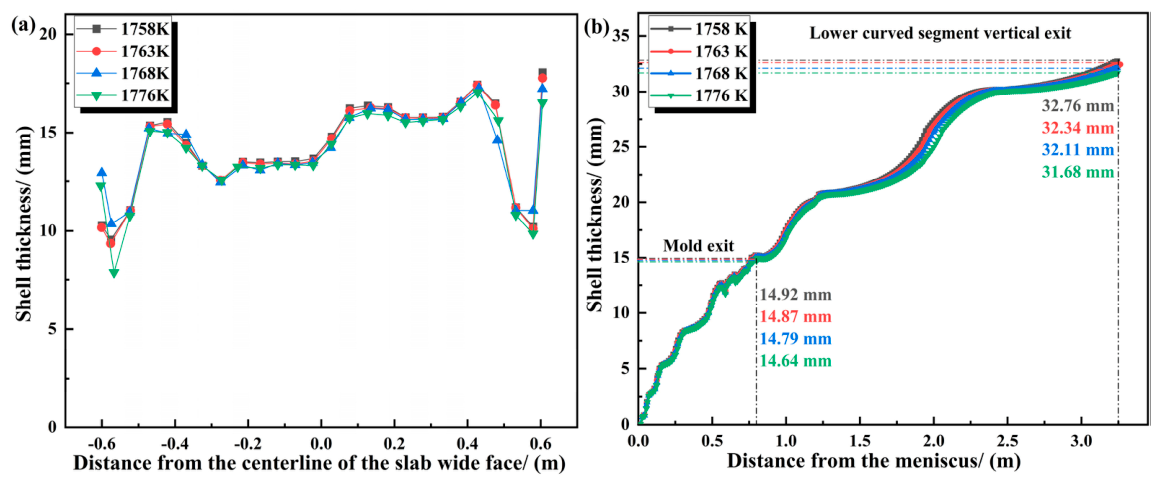
Figure 22 shows the variation of shell thickness distribution in the outer arc direction under different superheats with a secondary cooling water ratio of 0.86 L/kg and a casting speed of 1.05 m/min. Figure 22a presents the transverse distribution of the wide-face shell thickness at the mold exit, and Figure 22b shows the longitudinal distribution of the wide-face central shell thickness. When the superheat changes, the transverse unevenness of the shell thickness still exists. Meanwhile, the higher the superheat, the thinner the shell at the wide-face center. When the superheats are 10 °C, 15 °C, and 20 °C, the shell thicknesses are 14.92 mm, 14.87 mm, and 14.79 mm, respectively. For every 5 °C increase in superheat, the shell thickness decreases by 0.07 mm. It can be seen that when there is still superheat in the slab center, the superheat has little effect on the growth of the solidified shell. However, when the slab enters the secondary cooling zone and the superheat in the slab center disappears, the shell growth rate accelerates.
Figure 22.
Variation of shell thickness distribution in the outer arc direction under different superheats: (a) transverse distribution of wide-face shell thickness at the mold exit; (b) longitudinal distribution of wide-face central shell thickness.
4. Conclusions
This study investigates the evolution of initial solidification during the continuous casting of 230 mm × 1255 mm slabs by establishing an inverse heat transfer model and a slab solidification heat transfer model, the former providing the boundary conditions for the latter. The following main conclusions are obtained.
- (1)
- The calculation results of the heat flux of the mold copper plate show that the heat flux is symmetrically distributed to a certain extent in the transverse direction of the copper plate, with peaks and valleys. At the positions 72.5 mm and 294.5 mm away from the meniscus, the distribution at the centerline changes to a peak. At the same time, there is a significant decrease in the area 1180 mm away from the left narrow-side copper plate in the inner-arc direction, with the minimum value reaching 734.8 kW/m2. The change of the longitudinal heat flux on the mold copper plate shows a trend of decreasing rapidly first and then slowly. At the thermocouple temperature—measuring positions, the average heat flux in the outer-arc direction is greater than that in the inner-arc direction.
- (2)
- The results of the coupled calculation of fluid flow, heat transfer, and solidification show that a flow deviation phenomenon occurs in the internal flow field of the slab. At the same time, near the meniscus, the surface temperature of the shell and the thickness of the solidified shell are evenly distributed. However, as the distance increases, obvious deviations appear on the left and right sides of the wide-face. The minimum temperature value appears within 100 mm from the center position, and the maximum difference in the thickness of the solidified shell is 4.47 mm. The minimum shell thickness at the wide-face exit of the mold is mainly distributed at the narrow-side position. This phenomenon is due to the “re-melting” of the shell caused by the superheated molten steel during the downward recirculation process.
- (3)
- The results of the influence of process parameters on fluid flow, heat transfer, and solidification show that an increase in the casting speed and a decrease in the superheat can both reduce the flow deviation phenomenon of the flow field in the mold of the slab on the inner and outer arcs of the wide-face, but will not reduce the uneven transverse distribution of the solidified shell. At the same time, with the increase in the casting speed, for every 0.1 m/min increase in the average casting speed, the thickness of the shell distributed longitudinally decreases by 0.74 mm, and for every 5 °C increase in the superheat, the thickness of the shell decreases by 0.07 mm. When the casting speed is faster, the shell solidifies more slowly. When there is still superheat in the center of the slab, the superheat has almost no effect on the growth of the solidified shell. When the slab enters the secondary cooling section and the superheat in the center of the slab disappears, the growth rate of the shell becomes faster.
Author Contributions
Conceptualization and writing, Z.Z.; original draft preparation, Z.Z. and Y.Z.; methodology and formal analysis, Z.Z., J.Z., Z.L., Y.Z., L.Z. and L.X.; validation and formal analysis, Z.Z., Y.Z., L.Z. and L.X.; supervision, Z.Z. and Y.Z. All authors have read and agreed to the published version of the manuscript.
Funding
This work is supported by the National Science and Technology Major Project of Intelligent Manufacturing System and Robot (2025ZD1602200).
Data Availability Statement
The original contributions presented in this study are included in the article. Further inquiries can be directed to the corresponding author.
Conflicts of Interest
Authors Zhonghua Zhan, Jiawang Zhou, Zhiyuan Liu and Lijun Xu were employed by the company Central Iron & Steel Research Institute Co., Ltd., author Li Zhang was employed by the company Qinghai Xianghe Nonferrous Metals Co., Ltd. The remaining authors declare that the research was conducted in the absence of any commercial or financial relationships that could be construed as a potential conflict of interest.
References
- Lu, D.H.; Wang, Z.P.; Zhang, H. Development of production technology of micro-alloyed steel continuous casting billet without corner defects. Contin. Cast. 2020, 66–69. [Google Scholar] [CrossRef]
- Yuan, H.; Yang, S.F.; Wang, T.T. Research progress of transverse corner crack on hypo-peritectic micro-alloyed steel slab. China Metall. 2020, 30, 1. [Google Scholar] [CrossRef]
- Zhao, Z.H.; Wei, J.J.; Cai, L.Q. Thermal elastic viscoplastic modeling and analysis of continuous casting billet based on measured inverse problem. China Metall. 2021, 31, 39. [Google Scholar]
- Zhu, Z.Y.; Wang, X.H.; Wang, W.J. Influence of casting speed on average heat flux in mold. J. Iron Steel Res. 2001, 13, 14. [Google Scholar]
- Yang, J.; Cai, Z.; Zhu, M. Transient Thermo-fluid and Solidification Behaviors in Continuous Casting Mold: Evolution Phenomena. ISIJ Int. 2018, 58, 299–308. [Google Scholar] [CrossRef] [Scilit]
- Zhang, H.; Wang, W.; Zhou, D.; Ma, F.; Lu, B.; Zhou, L. A Study for Initial Solidification of Sn-Pb Alloy during Continuous Casting: Part I. The Development of the Technique. Metall. Mater. Trans. B 2014, 45, 1038–1047. [Google Scholar] [CrossRef] [Scilit]
- Zhou, D.; Wang, W.; Zhang, H.; Ma, F.; Chen, K.; Zhou, L. A Study for Initial Solidification of Sn-Pb Alloy During Continuous Casting: Part II. Effects of Casting Parameters on Initial Solidification and Shell Surface. Metall. Mater. Trans. B 2014, 45, 1048–1056. [Google Scholar] [CrossRef] [Scilit]
- Yang, L.; Chai, F.; Luo, X.B.; Su, H.; Erwin, W.; Dieter, S. Modeling and simulation of heat transfer and solidification behavior of slab in continuous casting mold. Contin. Cast. 2019, 44, 68–74. [Google Scholar]
- Feng, Y.P.; Zheng, N.; Tang, L. Simulation of solidification and heat transfer for steel in mold of thin slab continuous casting. Contin. Cast. 2021, 44–47. [Google Scholar] [CrossRef]
- Mosayebidorcheh, S.; Gorji-Bandpy, M. Local and averaged-area analysis of steel slab heat transfer and phase change in continuous casting process. Appl. Therm. Eng. 2017, 118, 724–733. [Google Scholar] [CrossRef] [Scilit]
- Guo, J.L.; Zou, J.; Yang, C.L. Method for Determining the Boundary Condition of Heat Transfer in Mold for Slab Casting. J. Phys. Conf. Ser. 2021, 10, 12–37. [Google Scholar]
- MOSTAFA, O.E. Transient Simulation of Mold Heat Transfer and Solidification Phenomena of Continuous Casting of Steel. Metall. Mater. Trans. B 2016, 47, 3013–3038. [Google Scholar] [CrossRef] [Scilit]
- Sheng, Y.P.; Kong, X.D. Study on heat transfer boundary conditions of continuous casting mold. China Mech. Eng. 2007, 18, 1615–1618. [Google Scholar]
- Savage, J.; Pritchard, W.H. The problem of rupture of the billet in the continuous casting of steel. J. Iron Steel Inst. 1954, 178, 269–277. [Google Scholar]
- Wu, B.S.; Fu, Y.M.; Tian, Q.Y. Heat Flux and Heat Analysis of Wide-Thick Slab Continuous Casting Mold. Contin. Cast. 2014, 23–27. [Google Scholar] [CrossRef]
- Huang, X. Numerical Simulation Study on Flow, Heat Transfer and Solidification Coupling Behavior of Molten Steel in Wide and Thick Slab Continuous Casting Mold; University of Science and Technology Liaoning: Anshan, China, 2020. [Google Scholar]
- Cai, Z.Z.; Zhu, M.Y. Thermal behavior of steel solidification in slab continuous casting mold I. Mathematical model. Acta Metall. Sin. 2011, 47, 669–675. [Google Scholar]
- Cai, Z.Z.; Zhu, M.Y. Thermal behavior of steel solidification in slab continuous casting mold II. Model verification and result analysis. Acta Metall. Sin. 2011, 47, 676–685. [Google Scholar]
- Jeong, H.; Hwang, J.Y. In-Depth Study of Mold Heat Transfer for the High Speed Continuous Casting Process. Met. Mater. Int. 2016, 22, 295–304. [Google Scholar] [CrossRef] [Scilit]
- Vaka, A.S.; Ganguly, S.; Talukdar, P. Novel inverse heat transfer methodology for estimation of unknown interfacial heat flux of a continuous casting mould: A complete three-dimensional thermal analysis of an industrial slab mould. Int. J. Therm. Sci. 2021, 160, 106648. [Google Scholar] [CrossRef] [Scilit]
- Chen, H.; Su, L.; Wang, G.; Wan, S.; Zhang, L.; Luo, Z. Fuzzy estimation for heat flux distribution at the slab continuouscasting mold surface. Int. J. Therm. Sci. 2014, 83, 80–88. [Google Scholar] [CrossRef] [Scilit]
- Shu, H.F.; Liu, L.; Liu, X.H. Numerical simulation of submerged entry nozzle for wide specification slab continuous casting mold. Spec. Steel 2013, 34, 1–4. [Google Scholar]
- Yang, G.; Li, B.K.; Yu, Y. Three dimensional heat transfer of cooling copper plate of thin slab continuous casting mold. Acta Metall. Sin. 2007, 332–336. [Google Scholar]
- Gan, Y. Modern Continuous Steel Casting Practical Handbook; Metallurgical Industry Press: Beijing, China, 2010. [Google Scholar]

Disclaimer/Publisher’s Note: The statements, opinions and data contained in all publications are solely those of the individual author(s) and contributor(s) and not of MDPI and/or the editor(s). MDPI and/or the editor(s) disclaim responsibility for any injury to people or property resulting from any ideas, methods, instructions or products referred to in the content. |
© 2026 by the authors. Licensee MDPI, Basel, Switzerland. This article is an open access article distributed under the terms and conditions of the Creative Commons Attribution (CC BY) license.