


Abstract
Titanium alloys are widely used in the manufacture of gas turbines’ compressor blades. Elucidating their mechanical behavior and strength under damaged conditions is the key to evaluating the equipment’s reliability. However, the conventional Johnson-Cook (J-C) constitutive model has limitations in describing the dynamic response of titanium alloy materials under the impact of a high strain rate. In order to solve this problem, the mechanical behavior of a TC4 titanium alloy under high strain rate and different temperature conditions was analyzed by combining experiments and numerical simulations. In this study, the parameters of the J-C model were analyzed in detail, and an improved J-C constitutive model is proposed, based on the new mechanism of the strain rate strengthening effect and the temperature softening effect, which improves the accuracy of the description of strain sensitivity and temperature dependence. Finally, the VUMAT subroutine of ABAQUS software was used for numerical simulation, and the predictive ability of the improved model was verified. The simulation results showed that the maximum prediction error of the traditional J-C model was 23.6%, while the maximum error of the improved model was reduced to 5.6%. This indicates that the improved J-C constitutive model can more accurately predict the mechanical response of a titanium alloy under an impact load and provides a theoretical basis for the study of the mechanical properties of titanium alloy blades under subsequent conditions of foreign object damage.
1. Introduction
Titanium alloy materials, distinguished by their favorable mechanical properties, superior strength, and high corrosion resistance, as well as their exceptional resistance to high-temperature oxidation [1], are extensively utilized in the aerospace and naval power sectors, among others. These materials are particularly prominent in the fabrication of compressor blades, which are integral to the functionality of engines. The operational environment, characterized by elevated temperatures, complex stress states, and the potential for external impact loads, renders the structural integrity of impact-damaged blades a topic of significant research interest. When subjected to impact loading, the blades may undergo plastic deformation or even sustain damage, thereby posing a substantial risk to the engine’s normal operation. Consequently, an accurate portrayal of the dynamic mechanical response and failure behavior of titanium alloy blades under impact loading is essential for engineering design and safety assessments. The fidelity of the material’s constitutive model and the precision of the failure criteria are paramount in determining the numerical simulation’s ability to accurately forecast the mechanical response of the structure under various loads.
Johnson and Cook [2] introduced an empirical model, the Johnson-Cook metal constitutive model (hereinafter referred to as the J-C model), which accounts for the effects of strain rate and temperature after synthesizing the outcomes of mechanical tests on metals conducted across a spectrum of strain rates and temperatures. It characterizes the flow behavior of metals by determining the stress–strain parameters under varying strain rates and temperatures. The model’s utility in impact and collision simulations is underscored by its simplicity and the distinctness of each parameter’s impact. Shokry [3] conducted a comprehensive review of the flow characteristics and mathematical modeling of different metals over a wide range of temperatures and strain rates. Holmquist [4] experimentally demonstrated that the strain rate’s influence on fatigue strength does not exhibit a linear relationship in logarithmic coordinates. Consequently, he proposed an exponential function to amend the strain rate term within the J-C model. Raut [5] compared the J-C model’s parameters derived from three computational methods, namely regression analysis, least squares, and logarithmic plots, thereby validating the efficacy and precision of these parameter extraction techniques. Zhang et al. [6] elucidated the softening behavior of nickel-based alloys at elevated temperatures by coupling the strain component of the J-C model with the temperature component. Martins [7] introduced a novel calibration approach that merged the virtual field method with nonhomogeneous thermomechanical tensile tests to refine the J-C model. Liu [8] advanced the J-C model by incorporating the temperature and strain rate dependencies of the material, calibrating the parameters with experimental data, to more precisely delineate the mechanical behaviors observed in high-speed cutting processes. Zhu [9] considered the impact of temperature increments due to adiabatic strain by devising a revised J-C model predicated on the strain rate enhancement factor through first-order differential equations and iterative methods. An induced temperature increase led to the construction of a modified J-C model based on the strain rate enhancement coefficient. This was achieved through the use of first-order differential equations and an iterative method, which enabled the modified J-C model to more accurately predict the cutting force and cutting deformation. Wang’s [10] modified J-C model was proposed to predict the plastic behavior of metals at high strain rates and temperatures. This was achieved by introducing a new temperature term to encapsulate the coupling effect of the mechanical behavior of metallic materials across a wide range of strain rates and temperatures. Furthermore, quantitative relationships linking temperature, the modulus of elasticity, constant-pressure specific heat capacity, and Poisson’s ratio were established. A multi-objective optimization approach, combined with advanced generic algorithm, was utilized to refine the model’s parameters. Shokry [11] improved the J-C model by taking the coupled effects of strain, strain rate, and temperature into account, enhancing the predictions of the alloy’s behavior under thermal deformation as well as dynamic loading. Building upon the foundational work of the Johnson-Cook (J-C) model, Shi [12] introduced refinements that address the interdependent effects of strain rate, temperature, and strain. These enhancements were achieved by employing a polynomial representation of the strain rate hardening coefficient C and the thermal softening exponent m, thereby advancing the predictive accuracy of the J-C model within the context of the material’s behavior under dynamic loading conditions. Jia [13] enhanced the J-C model by integrating the strain rate hardening factor with the strain rate. In comparison with the original J-C model, the enhanced model demonstrated superior performance in terms of accuracy in predicting flow stress and plastic deformation. The conventional J-C model posits a linear relationship between the material’s stress response and strain rate in semi-logarithmic coordinates. But in the domain of high-velocity impact, a large number of experimental and numerical simulation studies have found that [14,15,16,17,18] this linearity leads to computational predictions that diverge from the empirical observations, particularly when it comes to accurately forecasting the stress and plastic strain experienced by metals under impacts with a high strain rate.
Jiang [19] studied the optimization of the parameters of the Johnson-Cook constitutive model of 304 stainless steel, which could accurately reflect the cutting state under high strain rate conditions through the use of the genetic algorithm. The predicted value was very close to the experimental value; the error was small. He [20] developed an improved model for the description of steel at high temperatures and a wide range of strain rates. Alami [21] discussed the determination of the Johnson-Cook material parameters for steel and verified the accuracy of impact tests. After analyzing the dynamic tensile test data of high-strength steel, Borvik [22] adopted power function to improve the strain rate term of the model, and used numerical simulation to predict the notch feature size and residual velocity of the impact test. The prediction accuracy of the improved model was higher than that of the J-C constitutive model. Jiangwen [23] and Lin [24] studied the mechanical properties of a TC4 titanium alloy at low temperatures and the applicability of the constitutive model. Tian [25] studied the compression properties of titanium alloy materials with a large strain rate range at room temperature and analyzed the damage mode and fracture morphology of the materials at different strain rates. Some scholars [26,27,28] have also studied the applicability of titanium alloy materials to the J-C model at high temperatures, and found that the softening effect of the material is stronger at high temperatures, and the decline in the material’s strength exceeds the predictions of the J-C model.
In the studies above, some models were modified for individual factors, some were studied for the coupling effect between different factors, and some models were improved to consider some factors for a long time. However, for different metals, the relationship of the strain term, the strain rate term, and the temperature term is different. This study mainly focused on a TC4 titanium alloy, evaluated and improved all aspects of the J-C model, and improved the prediction ability of the J-C model for this metal.
Consequently, the tensile properties of a TC4 titanium alloy at different temperatures were studied by means of an electronic universal testing machine and a Hopkinson compression rod testing machine. On the basis of the test results, the J-C model was improved by improving the function relation. The accuracy of the improved model was confirmed by numerical simulation, ensuring that its predictions were closer to the strength and damage characteristics of the material under impact conditions. This provides a more reliable prediction and guidance for the engineering design and application of titanium alloy materials.
2. Materials and Methods
2.1. Material and Equipment
The subject of this investigation was the TC4 (Ti-6Al-4V) titanium alloy, utilized for fabricating gas turbines’ compressor blades. The specimens were sourced from China Aerospace Development Xi’an Aviation Engine Group and were derived from TC4 titanium alloy forgings. This alloy is characterized as a α + β two-phase titanium alloy, distinguished by its high specific strength, favorable thermal stability, and other excellent mechanical properties. The chemical composition and mechanical properties of the TC4 titanium alloy [29] are detailed in Table 1 and Table 2, respectively.
Table 1.
Chemical composition of the TC4 titanium alloy (mass fraction). Reprinted from Ref. [29].
Table 2.
Mechanical property indexes of the TC4 titanium alloy (room temperature). Reprinted from Ref. [29].
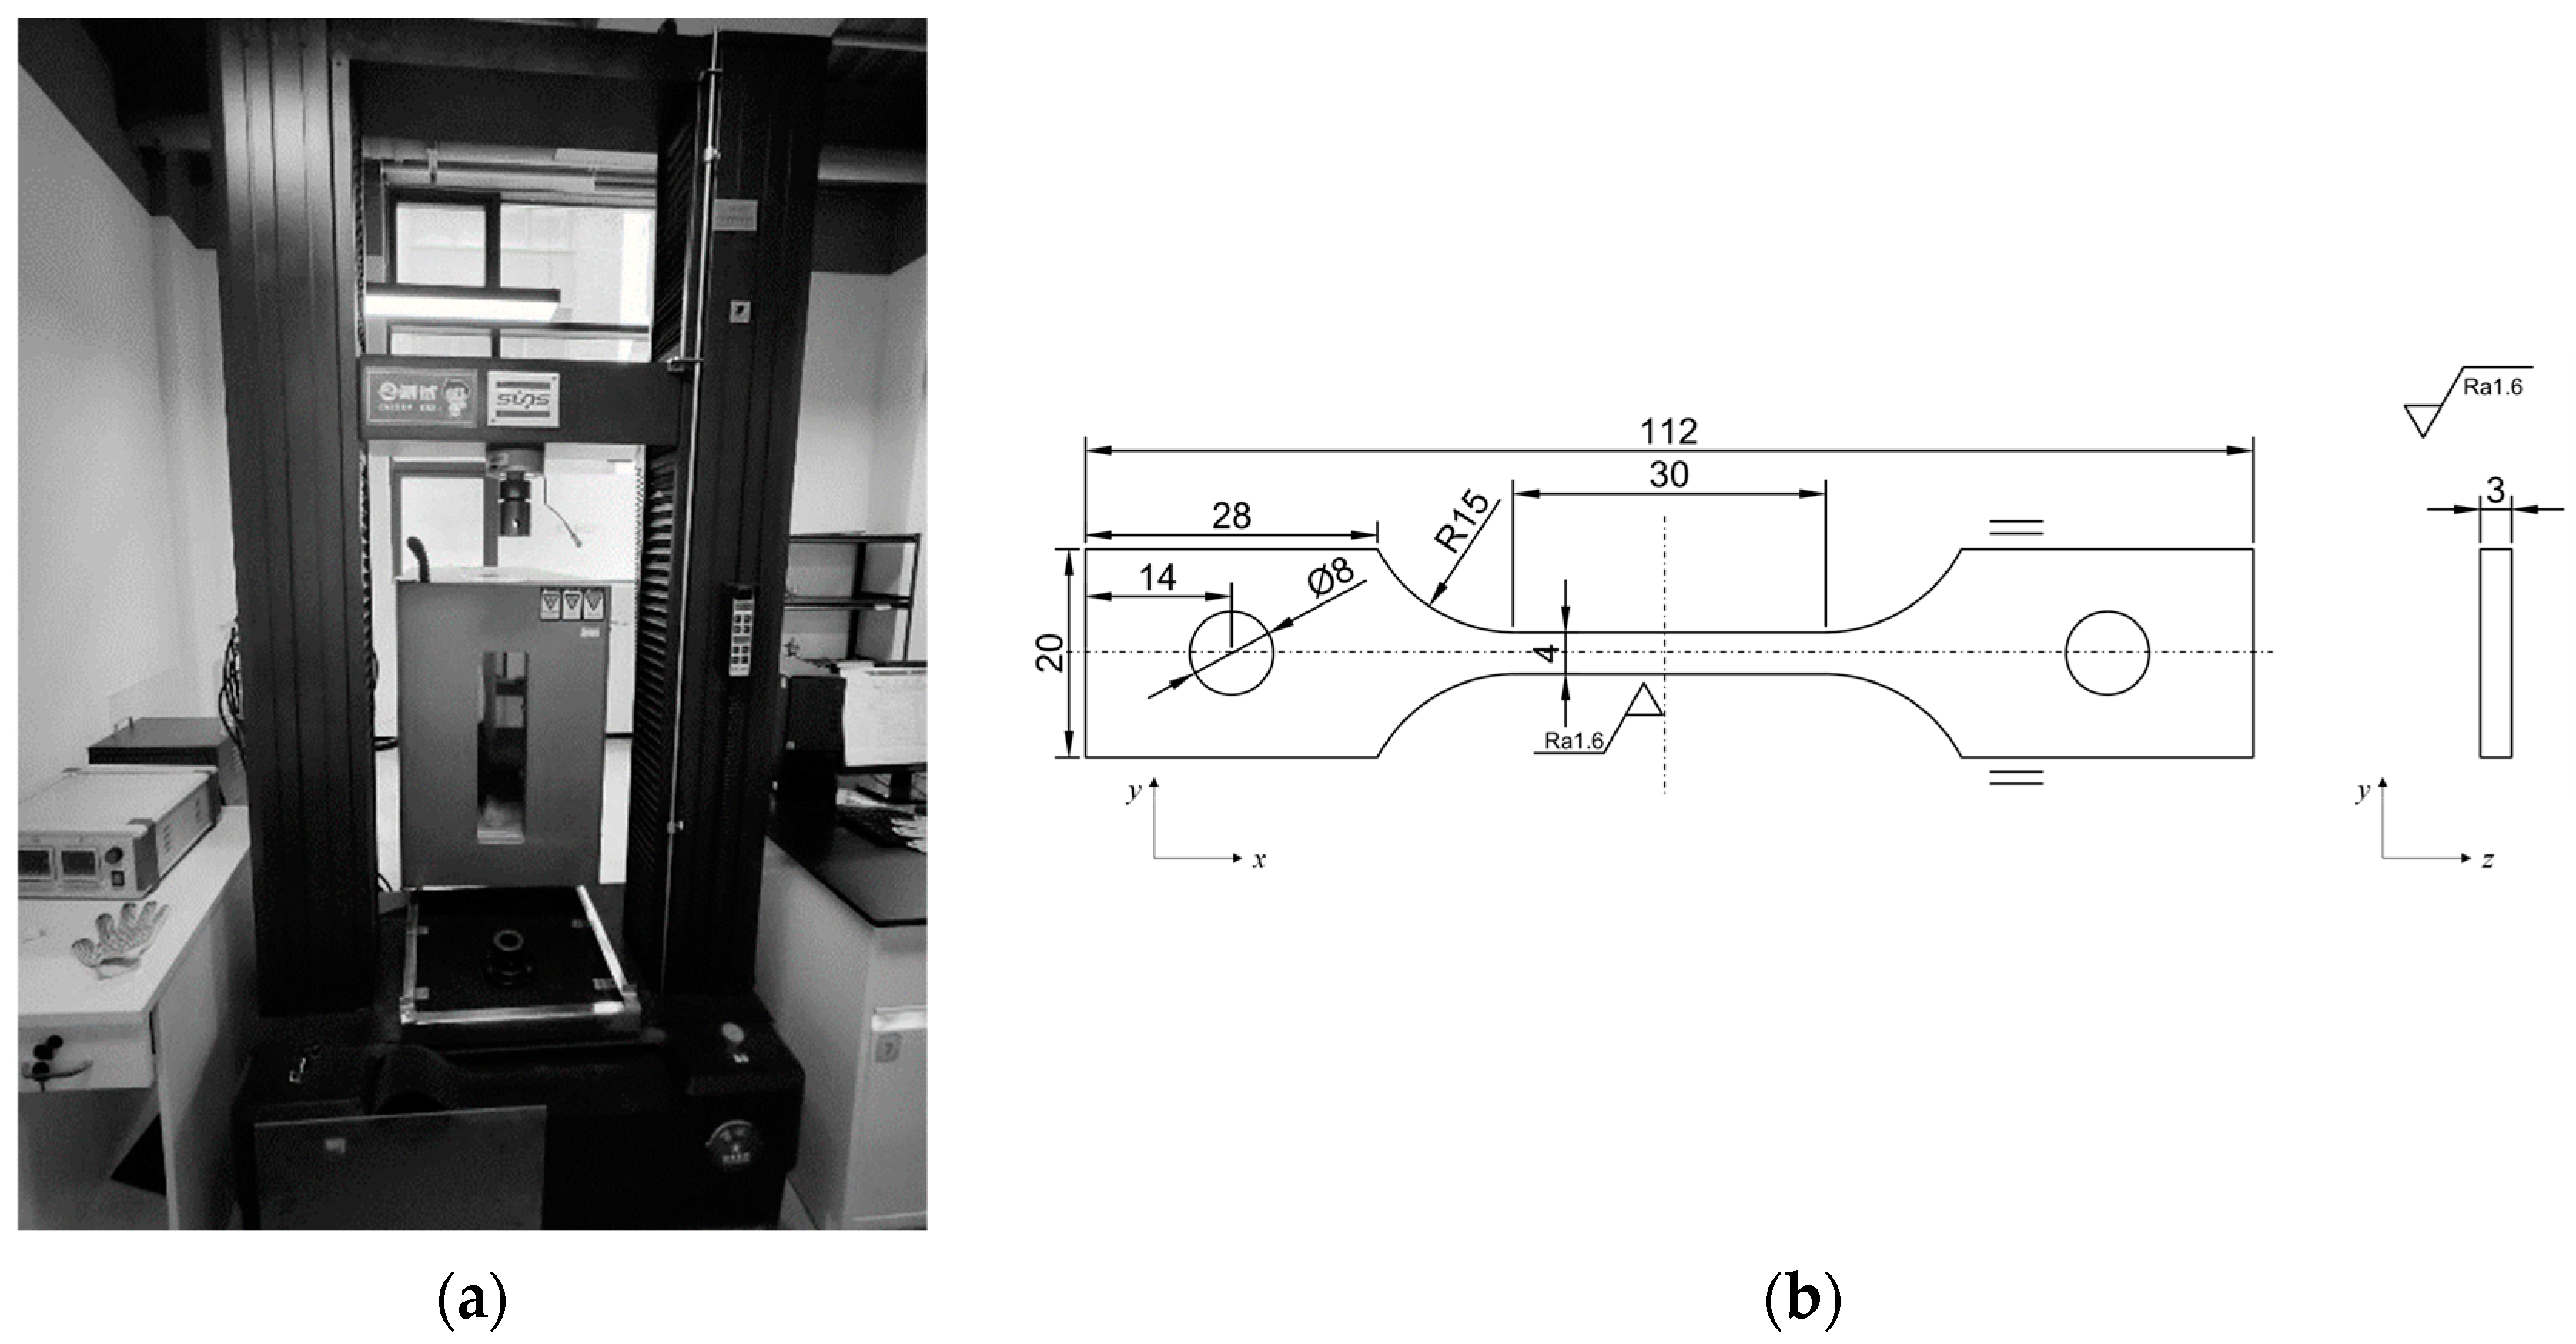
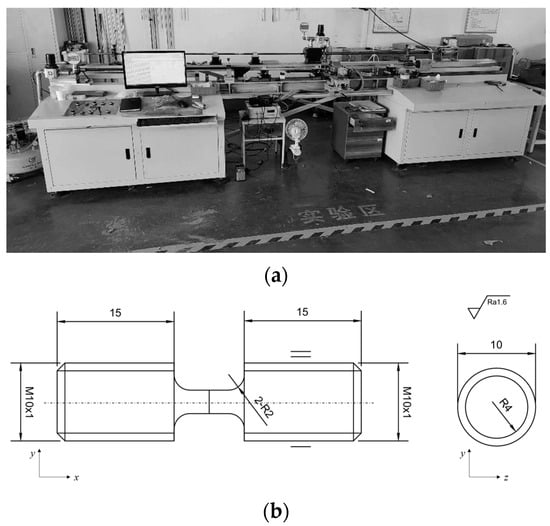
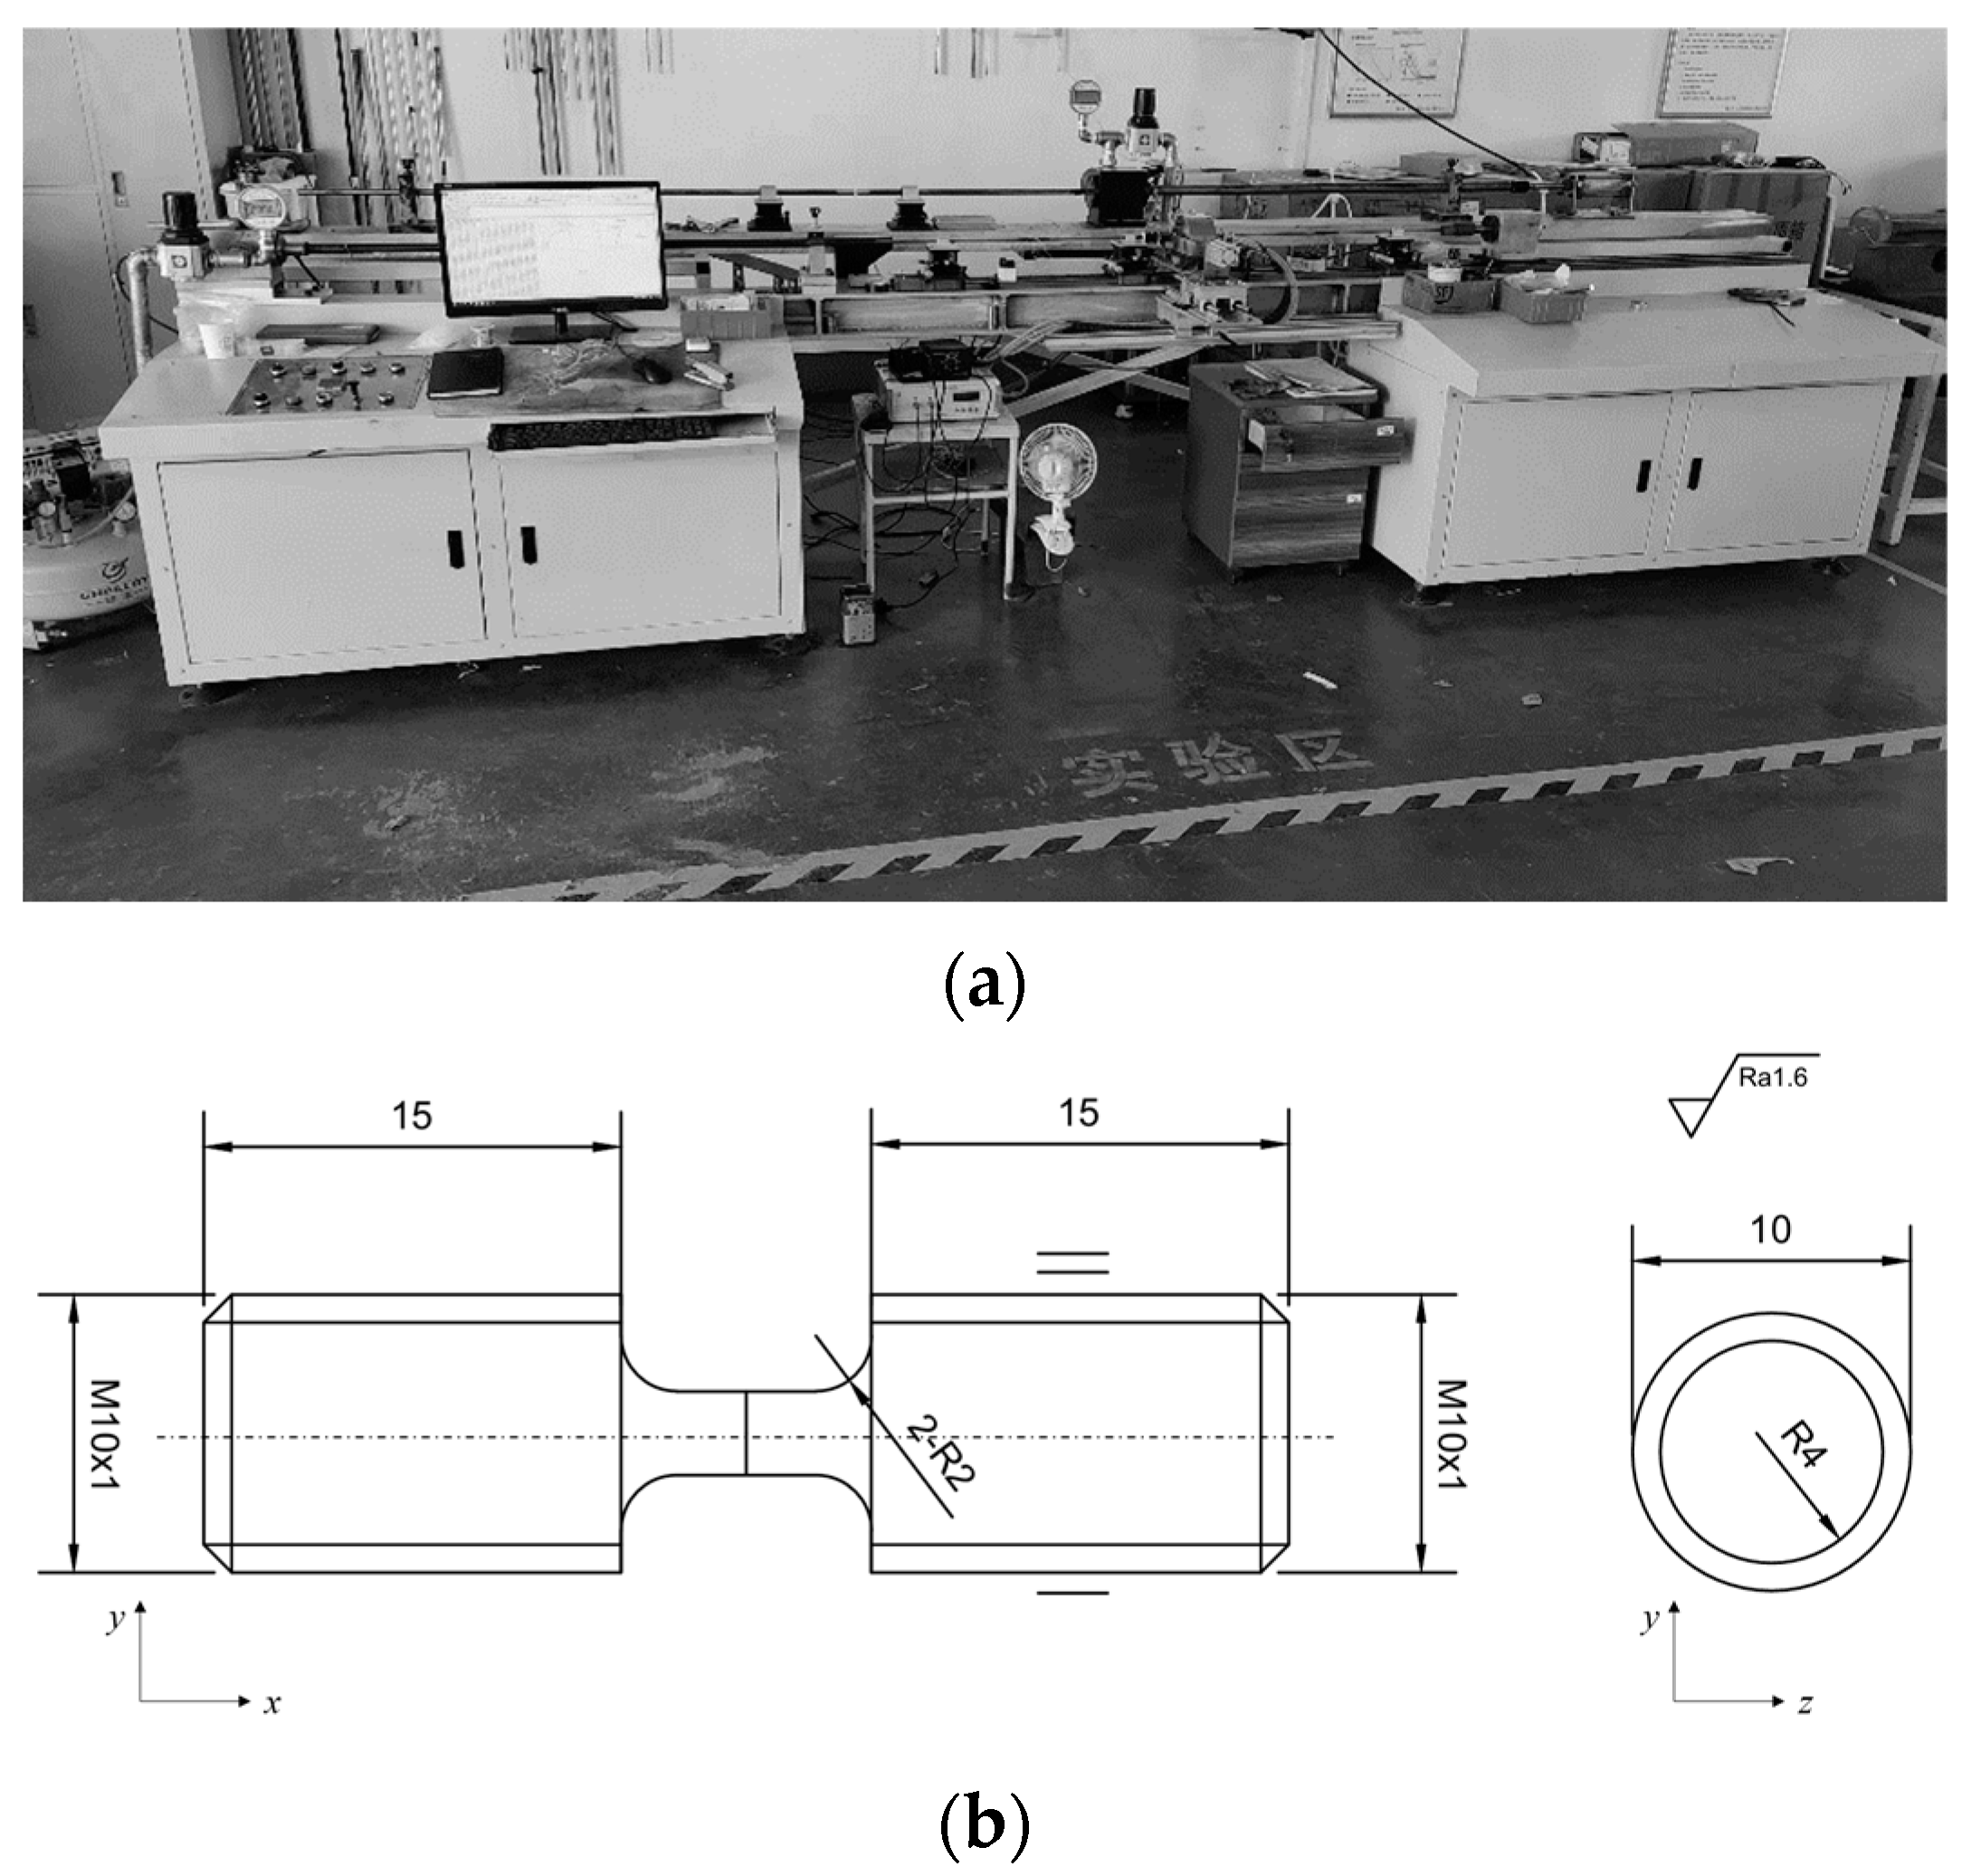
The low strain rate tensile tests were performed utilizing the UTM5105GD vertical universal electronic testing machine (Shenzhen, China), augmented with a high-temperature furnace, to conduct tensile examinations on TC4 titanium alloy specimens under quasi-static conditions and low strain rates at different temperatures, as depicted in Figure 1. The quasi-static assessment was executed at a tensile rate of 0.18 mm/min and a nominal strain rate of 10−4/s, as illustrated in Figure 1. The sample was kept in the furnace at a constant temperature for at least 30 min at each temperature point to ensure that the sample’s temperature was uniform.
Figure 1.
Tensile test equipment and specimens at low and medium strain rates. (a) The universal electronic testing machine. (b) Tensile specimens’ dimensions (unit: mm).
The mechanical attributes of the TC4 titanium alloy specimens were scrutinized at three distinct strain rates (10−4/s, 10−3/s, and 10−2/s) and five discrete temperatures (room temperature, 300 K, 400 K, 500 K, 600 K, and 700 K).
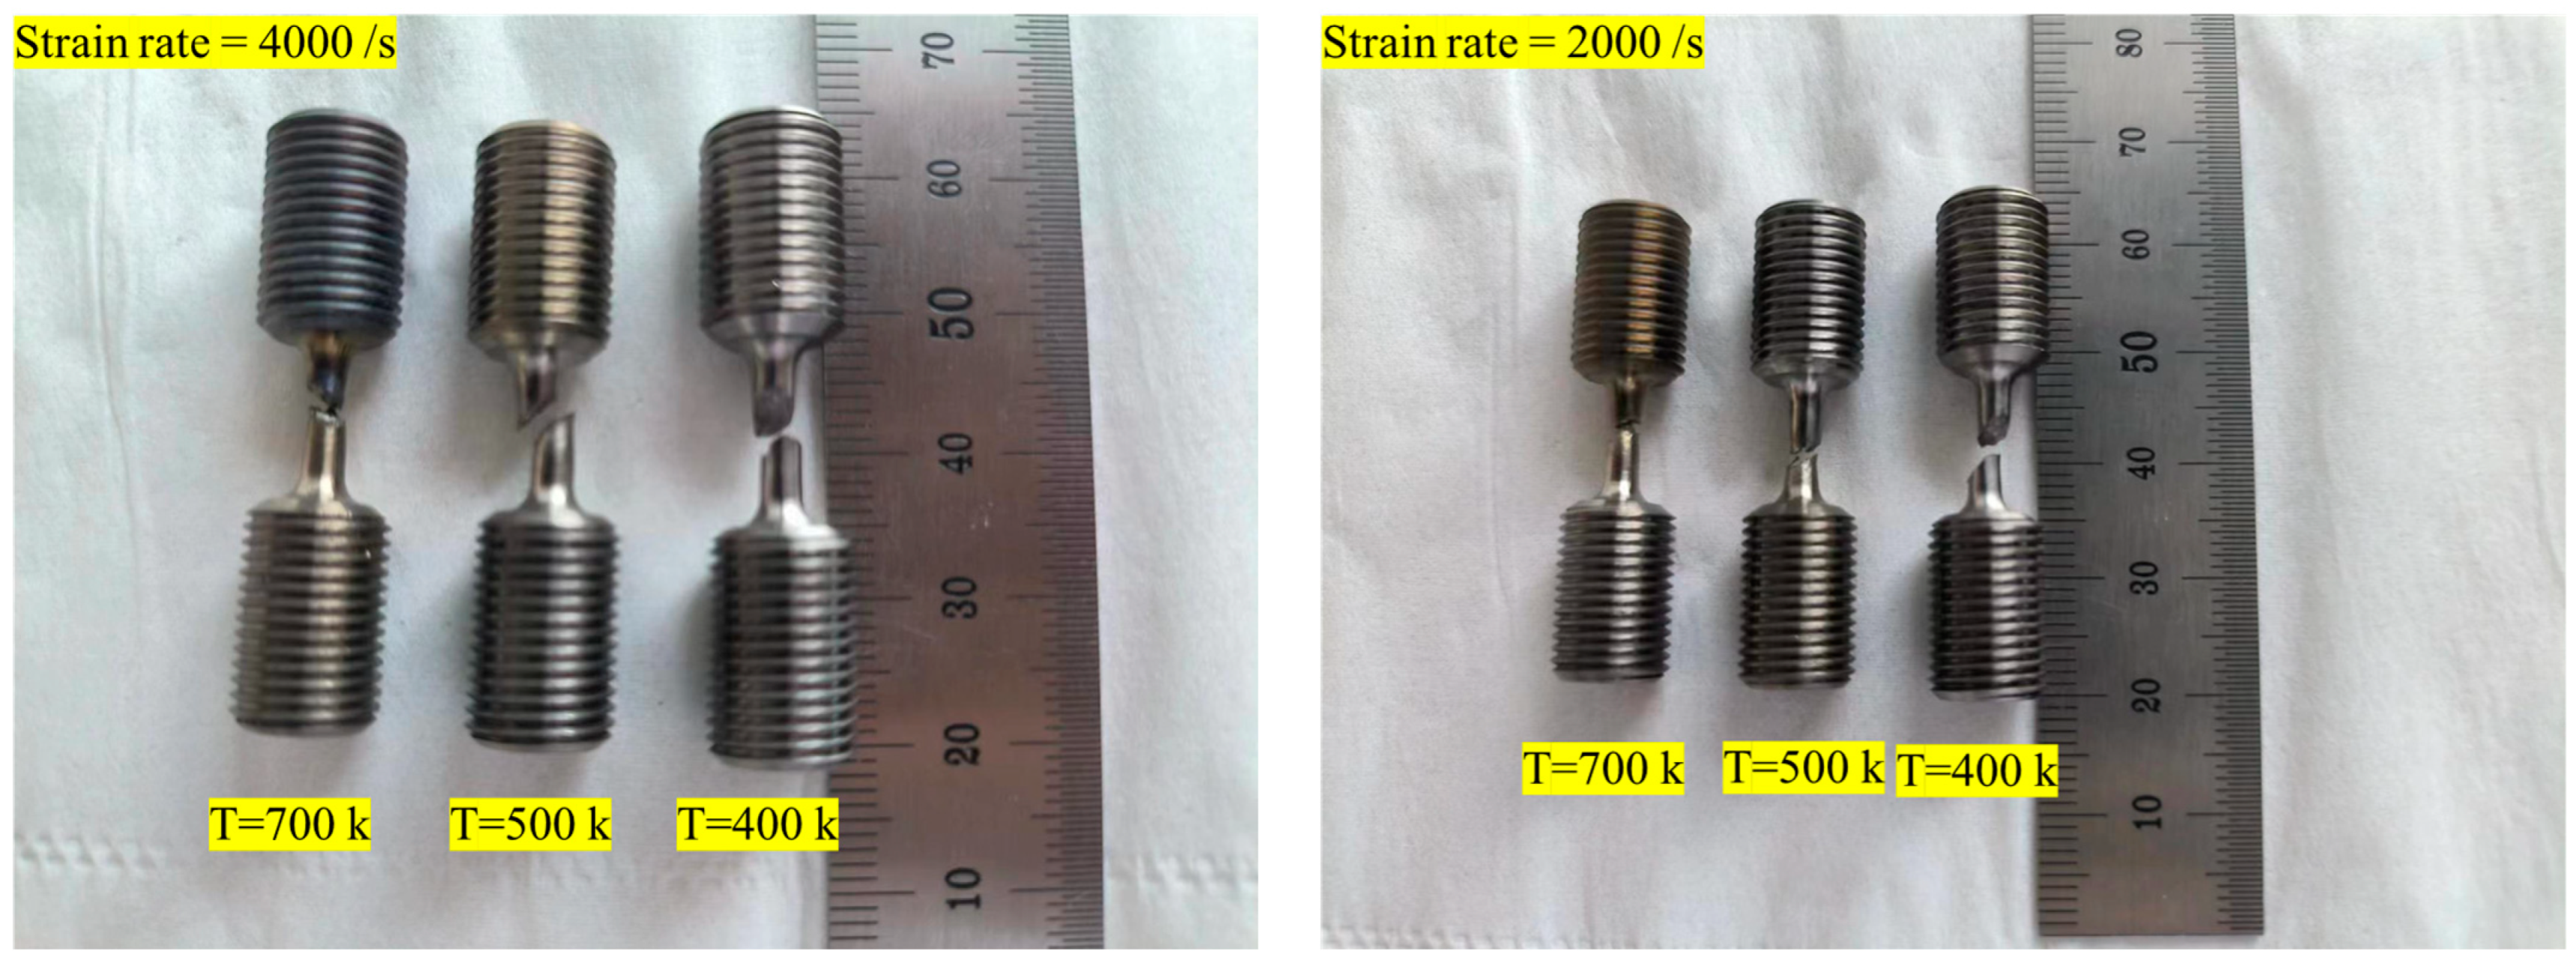
The high strain rate tensile test was conducted utilizing a ZDSHPB-20 Hopkinson impact rod testing machine (Jinan, China), which was coupled with a temperature-controlled furnace to conduct medium- and low-temperature tensile evaluations on the TC4 titanium alloy specimens under high strain rate conditions. The outcomes of these evaluations are depicted in Figure 2. The sample was clamped between the input rod and the output rod, and the impact rod was driven under the control of high-pressure gas to impact the incident rod at a specific speed to transfer the impact load to the sample. The propagation of the stress waves was recorded by the strain gauge pasted on the rod and analyzed by the high-speed data acquisition system. The stress–strain data of the specimen were calculated using the one-dimensional stress wave theory. The strain rate was controlled by adjusting the pressure of the high-pressure gas.
Figure 2.
Tensile test equipment and specimens under a high strain rate. (a) The Hopkinson impact bar test bench. (b) Impact tensile test specimens’ dimensions (unit: mm).
The mechanical characteristics of the TC4 titanium alloy specimens were examined across three different sets of strain rates (1000/s, 2000/s, and 4000/s) and four distinct temperature settings (room temperature (300 K, 400 K, 500 K, and 700 K). The manufacturing requirements of the specimens were implemented according to the GB/T 228.1-2010 standard [30] and the GJB 8374-2015 standard [31]. The residual stress was eliminated by heat treatment to prevent the influence of the experiment. The results of the specimens are shown in Appendix A.
2.2. Constitutive Model
The J-C model [2] was employed to elucidate the mechanical behavior of metallic materials under conditions of high strain rates. The model’s flow stresses are influenced by the strain, strain rate, and temperature, and can be expressed as follows
where is the equivalent stress, is the equivalent plastic strain, is the dimensionless equivalent plastic strain rate (; is the plastic strain rate; is the quasi-static strain rate; = 10−4/s was used in this study), is the dimensionless temperature , is the current temperature, represents room temperature, and denotes the melting temperature. A, B, C, n, and m are material parameters. A is the yield strength, B is the strain reinforcement coefficient, n is the strain strengthening index, C is the strain rate strengthening coefficient, and m is the temperature softening index.
In Equation (1), the first term on the right-hand side signifies the quasi-static stress–strain correlation of the material. The second term denotes the impact of the strain rate on the material’s strength, specifically, the strain rate strengthening phenomenon. The third term illustrates the impact of temperature on the material’s strength, referred to as the temperature-induced softening effect.
The J-C constitutive model is an empirical model, and the material’s parameters for each term can be determined by the corresponding mechanical tests. For the strain term’s parameters in Equation (1), A, B, and n can be obtained by fitting the tensile test under quasi-static tensile conditions. For the parameter of the strain rate, C can be obtained by fitting the tensile test under different loading rates. For the temperature parameter, m can be obtained by fitting the tensile test at different temperatures.
3. Results
In order to describe the mechanical response of metals more accurately, the J-C model can be improved according to the independent characteristics of the influencing factors of the J-C model, combined with the test data. First, the quasi-static stress–strain relationship of a metal under different stress states is described using a function containing the equivalent plastic strain. Secondly, the strain rate term of the nonlinear function is used to describe the effect of strain rate strengthening on the mechanical response of materials. Finally, the exponential function of dimensionless temperature is introduced to describe the effect of temperature effect on metal equivalent stress.
3.1. Strain-Based Model Improvement
According to Equation (1), at the reference strain rate as well as at room temperature, the equation can be simplified as follows
where A is the corresponding stress value at 0.2% plastic strain. Taking the logarithms on both sides of Equation (2) gives
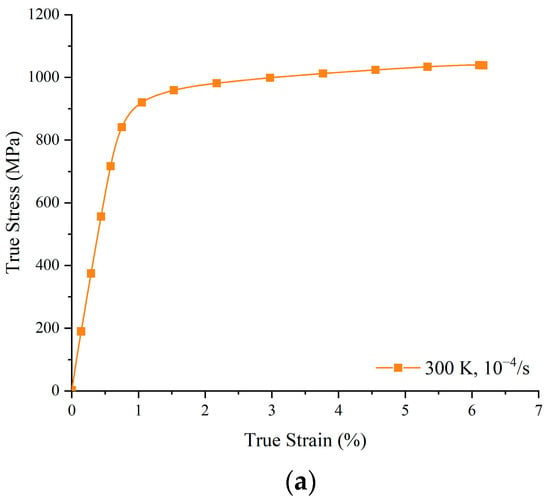
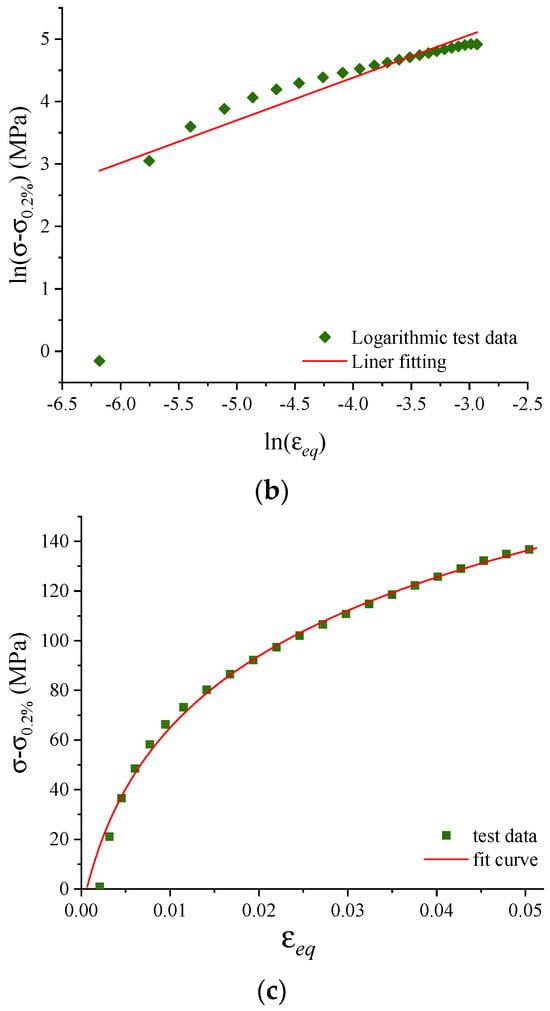
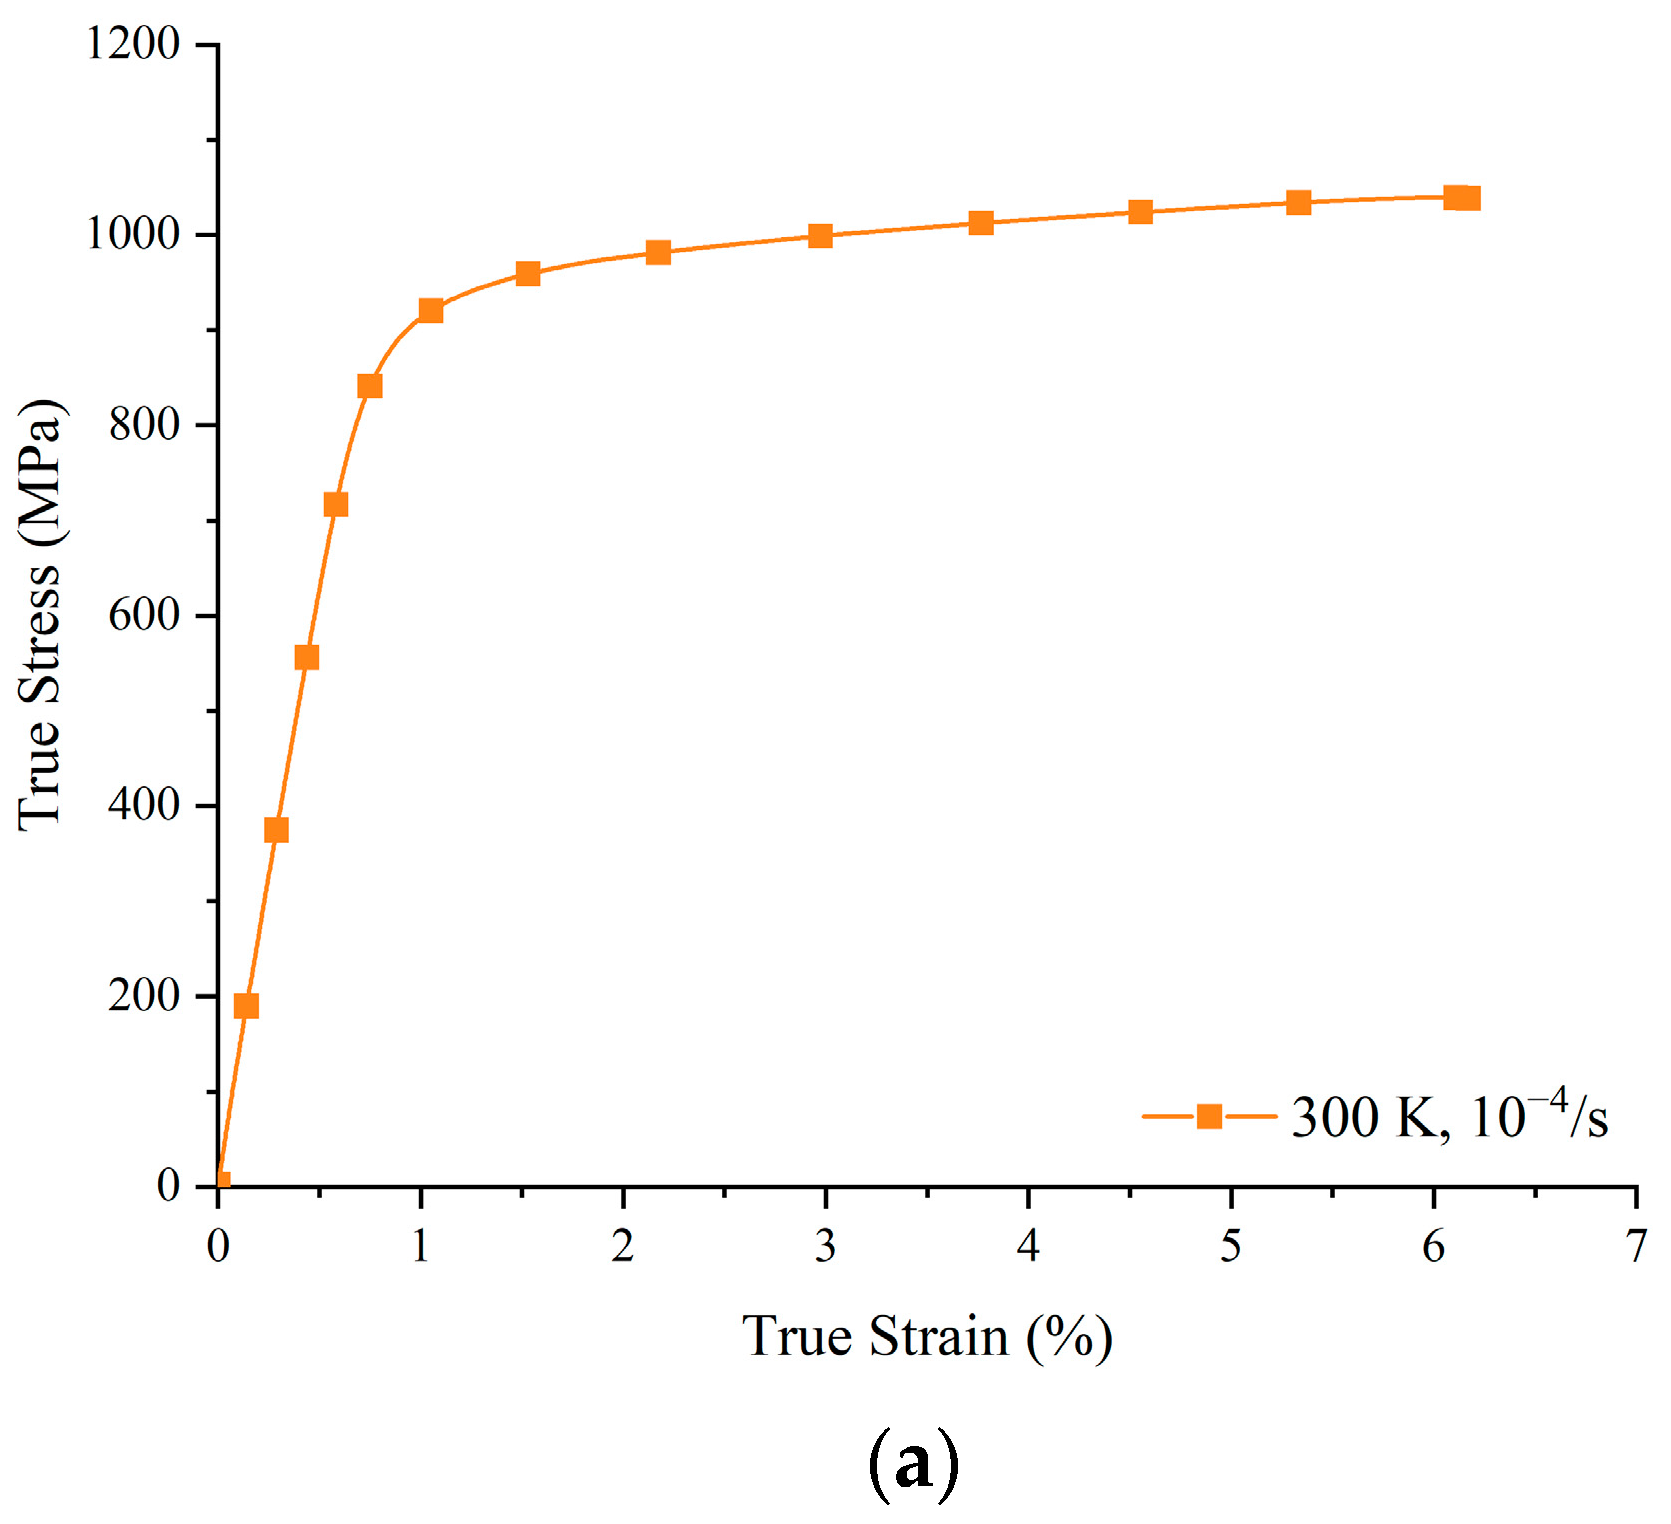
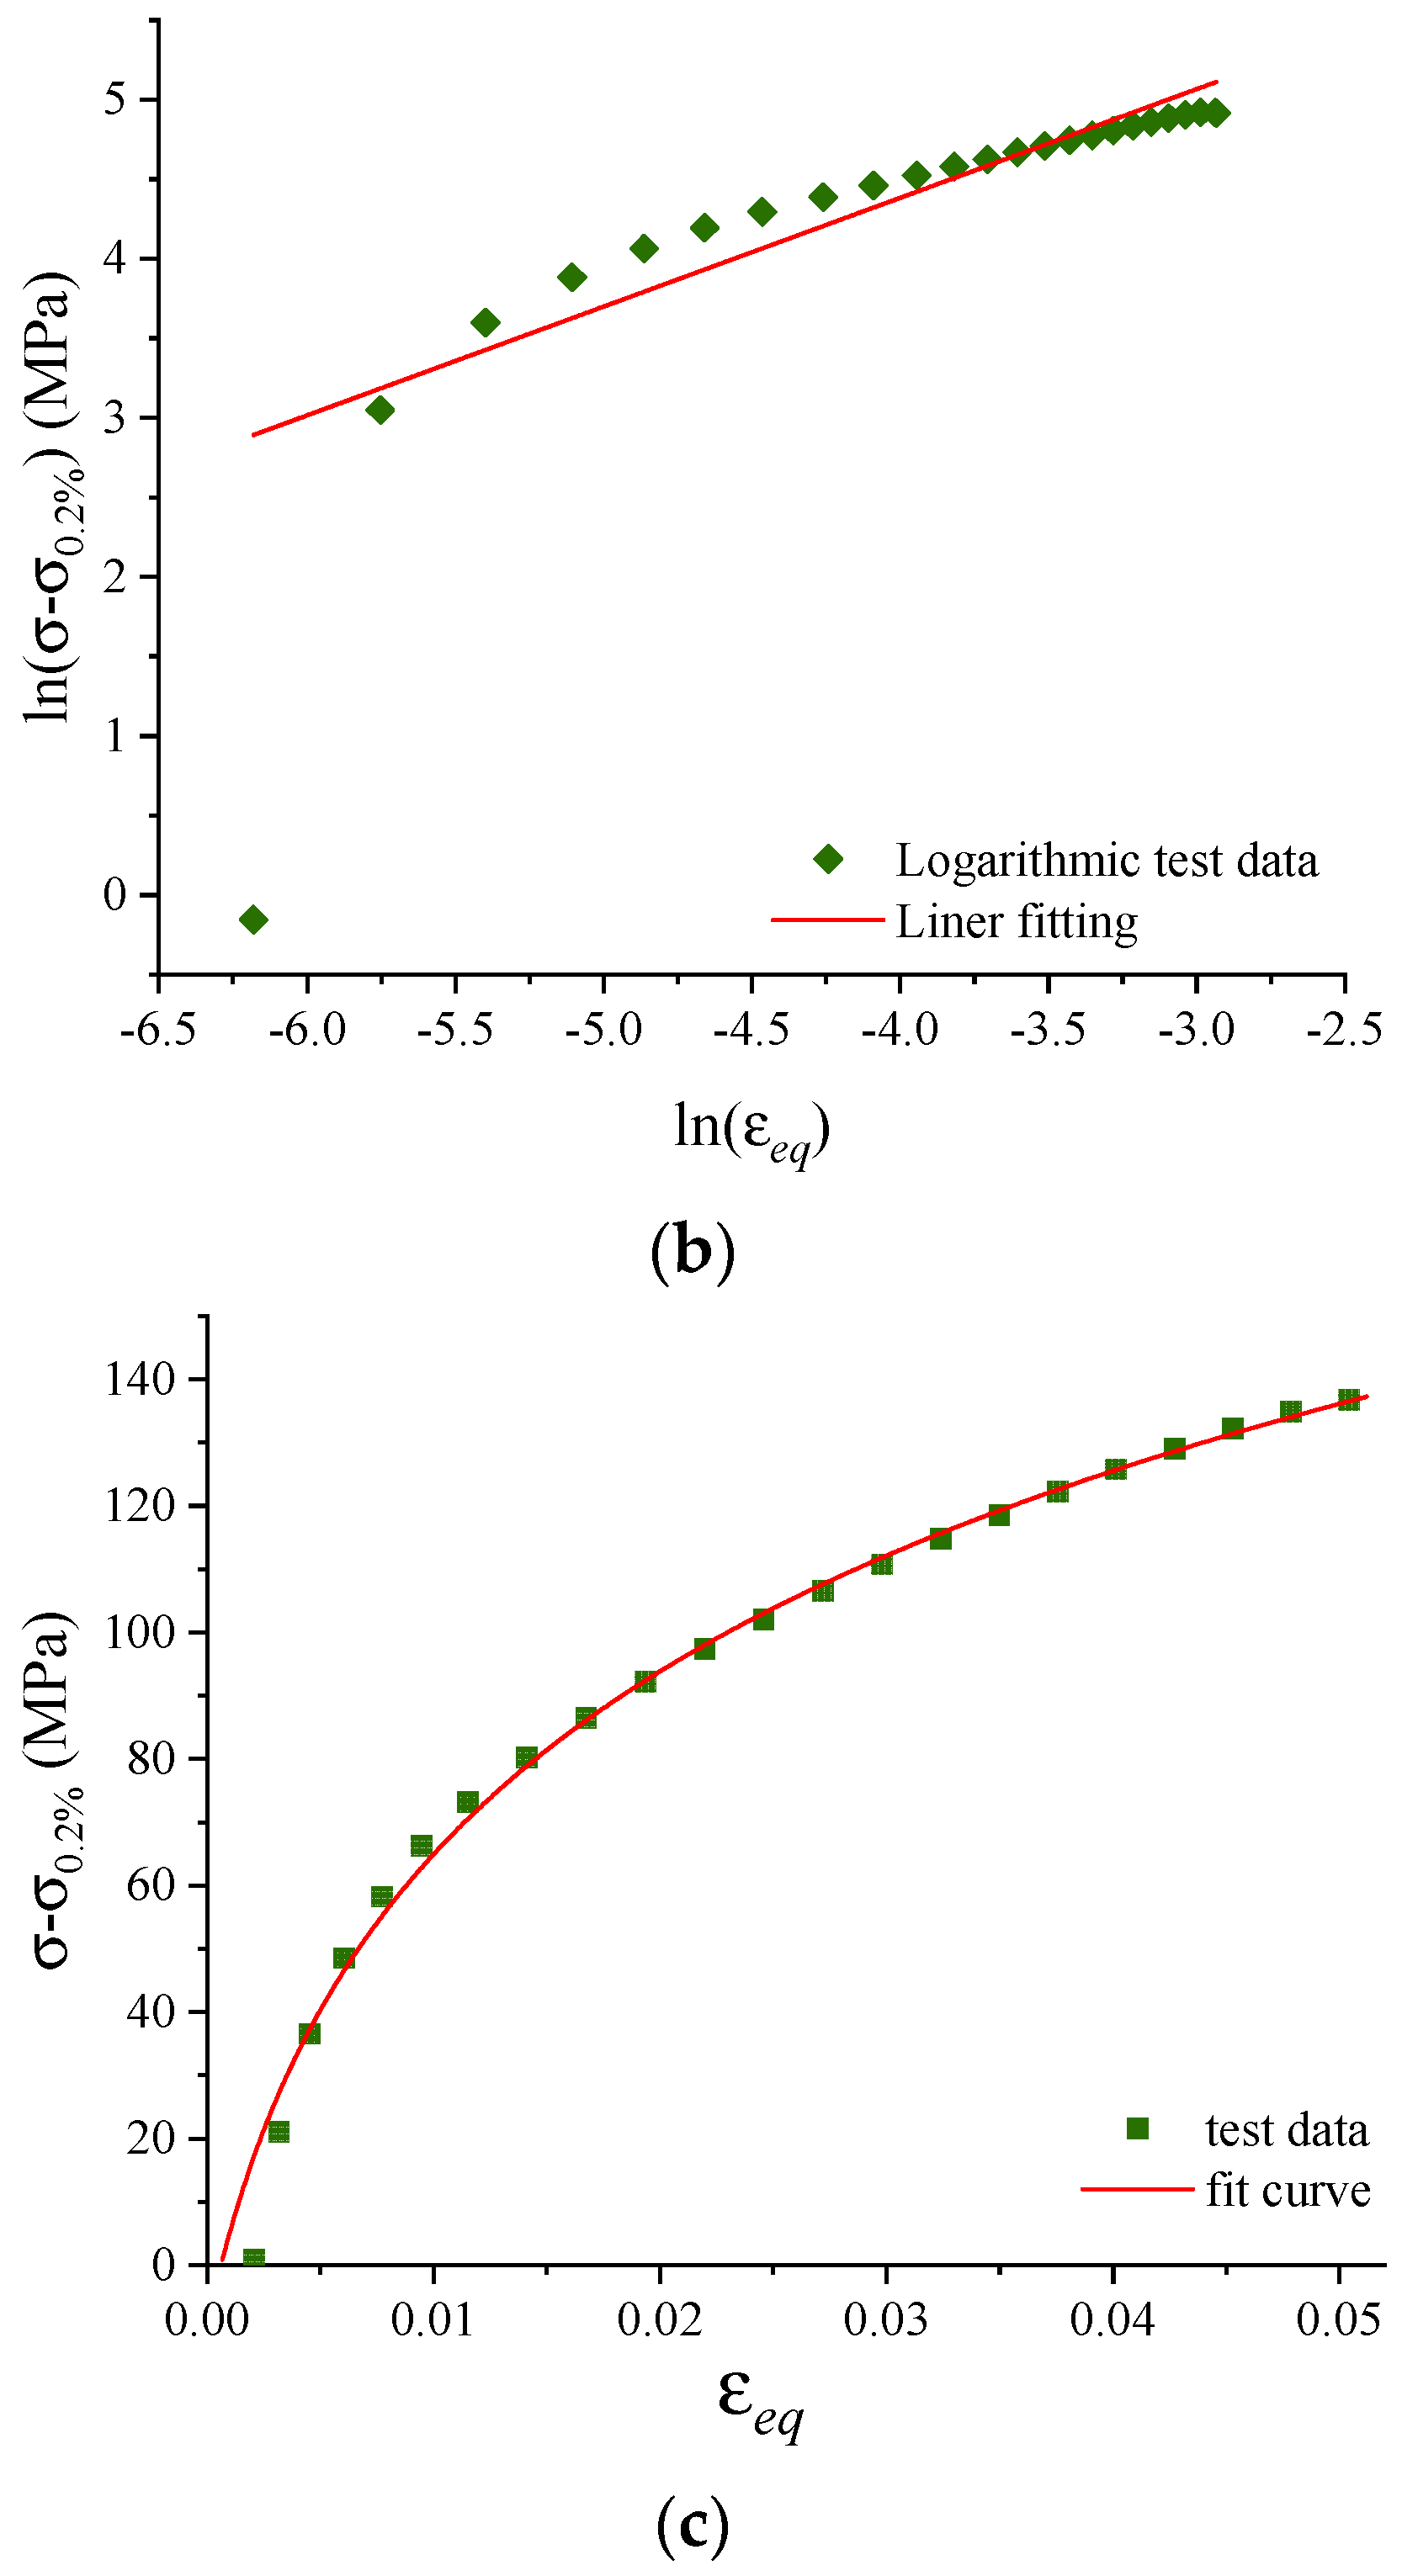
Figure 3a shows the stress–strain curve of the quasi-static (10−4/s) tensile TC4 material at room temperature. According to Equation (3), the stress–strain relationship is anticipated to manifest linearity when plotted in double logarithmic coordinates. However, as depicted in Figure 3b, the stress–strain correlation deviates from linearity at in logarithmic coordinates. Furthermore, the J-C constitutive equation yields a stress magnitude exceeding the actual value upon the initiation of plasticity.
Figure 3.
Fit of the J-C model’s strain term. (a) Quasi-static tensile stress–strain curve of TC4 material at room temperature. (b) Linear fitting of stress–strain in double logarithmic coordinates. (c) Single-phase exponential fitting of stress–strain.
Figure 3a shows the stress–strain curve of the TC4 material under quasi-static tension at room temperature, which has been converted into ln–ln coordinates (as shown in Figure 3b). However, in the ln–ln coordinate system, the stress–strain relationship is not linear, as shown in Formula (3). Therefore, there is a systematic error in using the original J-C equation to describe the stress–strain relationship, and the predicted stress value of the equation is greater than the actual value at the beginning of plasticity.
The stress term of this model was corrected to fit the stress–strain relationship using single-phase logarithmic growth, with the following equation
where A is the stress value at 0.2% plastic strain, i.e., yield strength; B is the strain hardening factor; and n is the strain hardening scale factor. For the TC4 material, A = 902 MPa, B = 50.66 MPa and n = 0.00361.
Formula (4) was used to fit the stress–strain curve. It can be seen from Figure 3c that the curve is well fitted, and the fitting effect is also good when the material initially enters the plasticity stage.
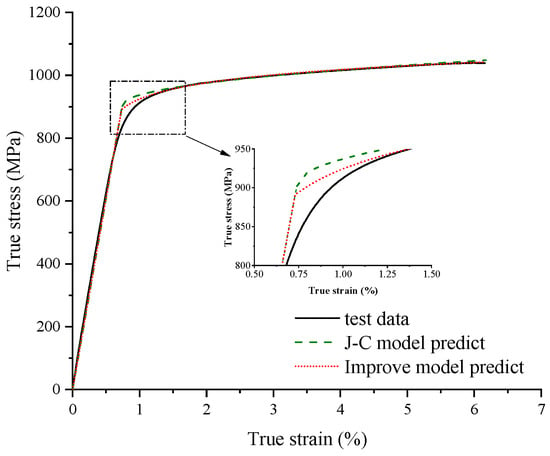
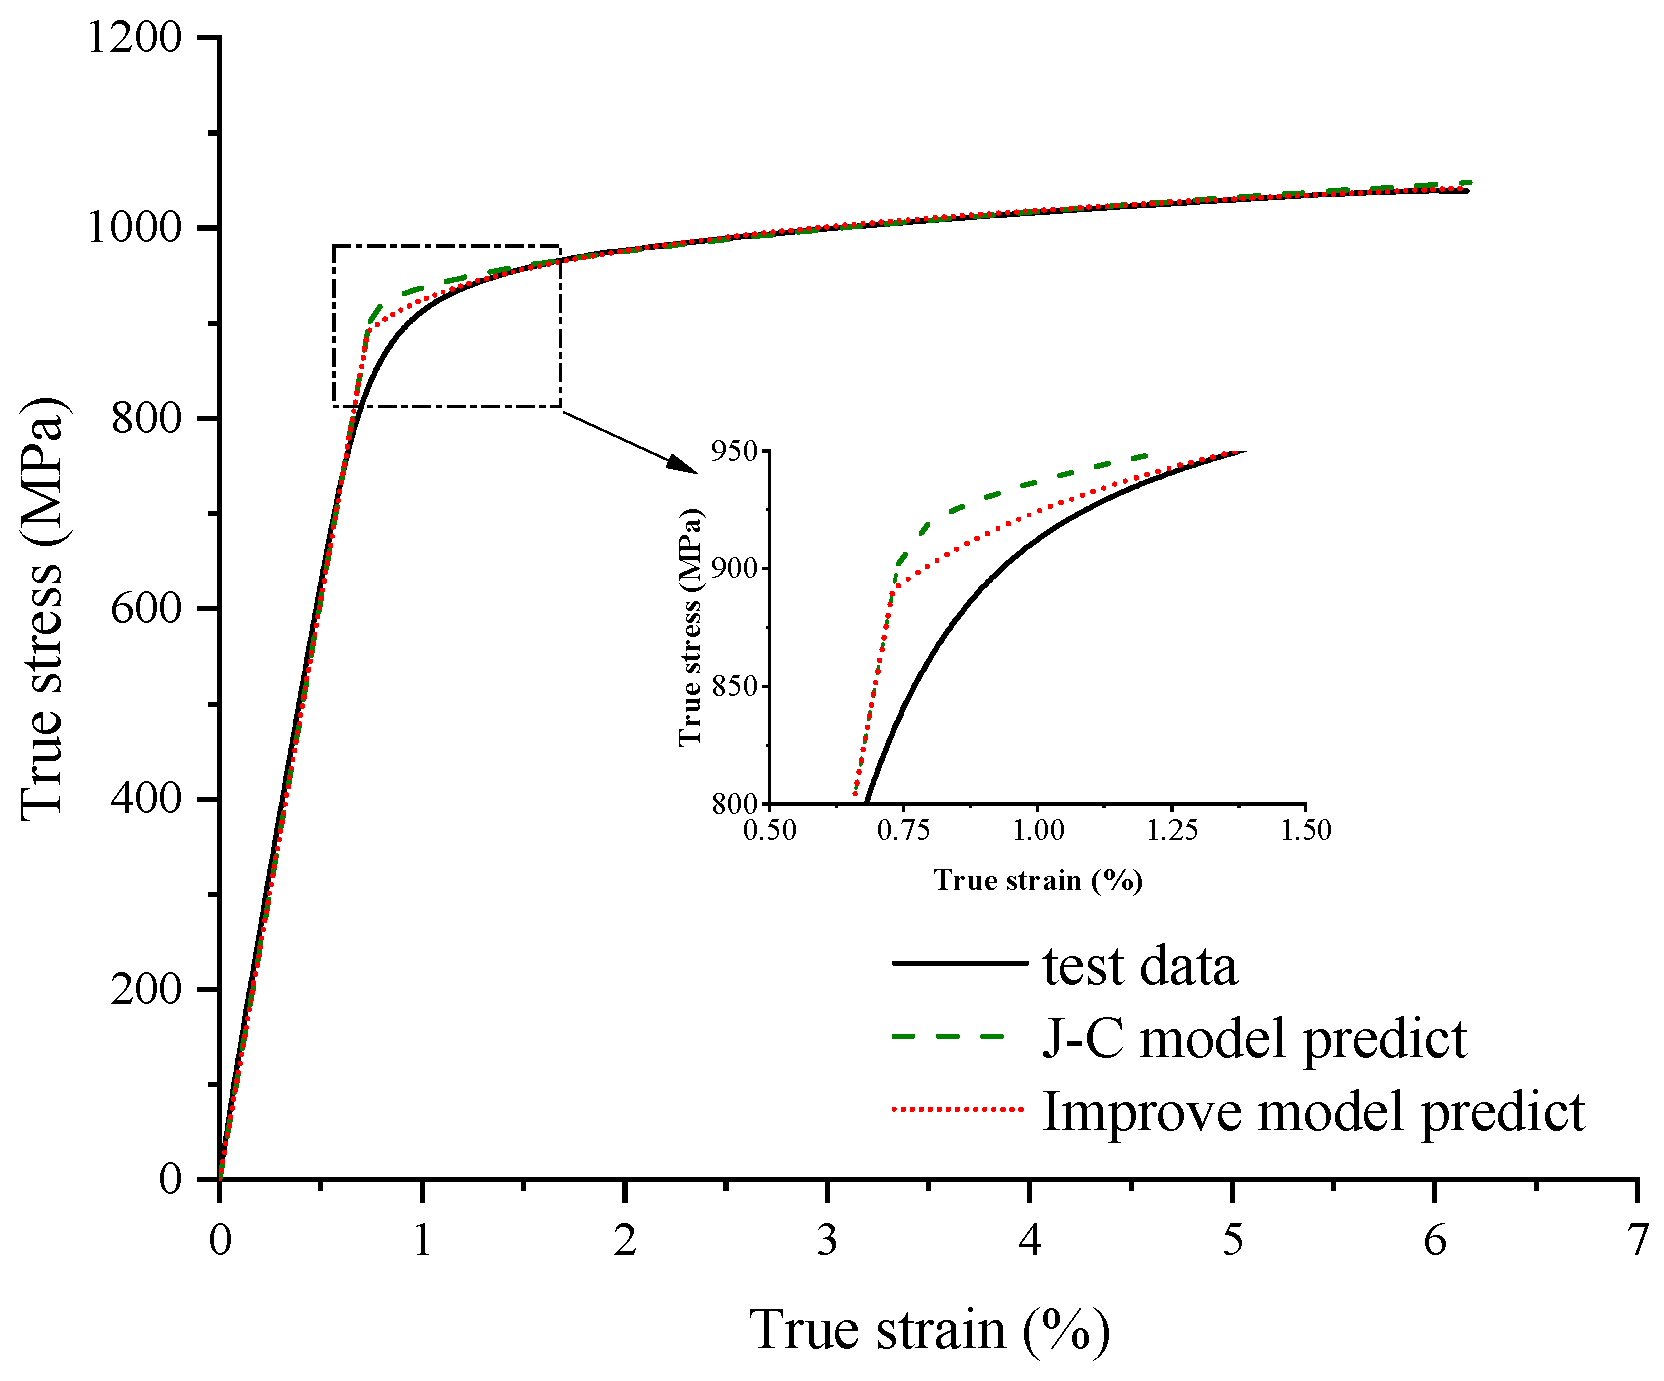
The original J-C constitutive model and its improved version were used to predict the stress–strain curves of quasi-static tensile at room temperature, and the results were compared with the experimental results. As shown in Figure 4, when the material enters the initial stage of plasticity, the constitutive model using the single-phase logarithm to improve the strain term predicts a smaller deviation, with the maximum deviation reduced from 5.6% to 3.7%.
Figure 4.
The improved model and J-C model were used to predict the stress–strain values of TC4 titanium alloy samples in a quasi-static tensile test.
The correlation coefficient R and the mean root mean square deviation RMSE were used to evaluate the predictive accuracy of the improved model. The expressions are
where and are the model’s predicted values and the test values, respectively; and are the average values of the model’s predictions and the test values, respectively; and n indicates the total number of samples collected.
Combined with the stress–strain data measured by the test, the predicted value of the improved model is calculated via Equation (4). According to Equations (5) and (6), it can be found that the mean square error (MSE) between the predicted value and the test value is 0.0673, and the correlation coefficient R2 is 0.998. The results show that there is good agreement between the prediction of the mechanical response and the plastic behavior of TC4 materials. Therefore, the single-phase exponential fitting model can better represent the correlation between plastic strain and stress under quasi-static conditions.
3.2. Strain Rate-Based Model Improvement
In the field of research on concrete materials, a dynamic load increases the strength of concrete with a high strain rate to a certain extent, compared with a quasi-static load, and this enhancement effect is expressed by the ratio of dynamic strength and static strength, namely, dynamic enhancement factor DIF (dynamic increasing factor). For the TC4 titanium alloy material, the strength under a high strain rate is also significantly higher than the static strength. Therefore, we propose a dynamic DSC (dynamic Strengthening coefficient) enhancement coefficient to describe the effects of the strain rate on metal materials’ enhancement effects.
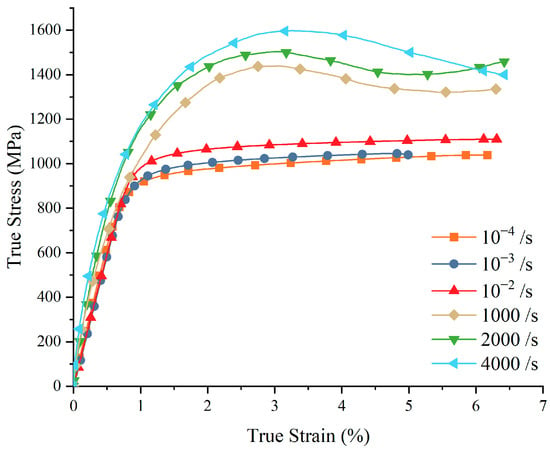
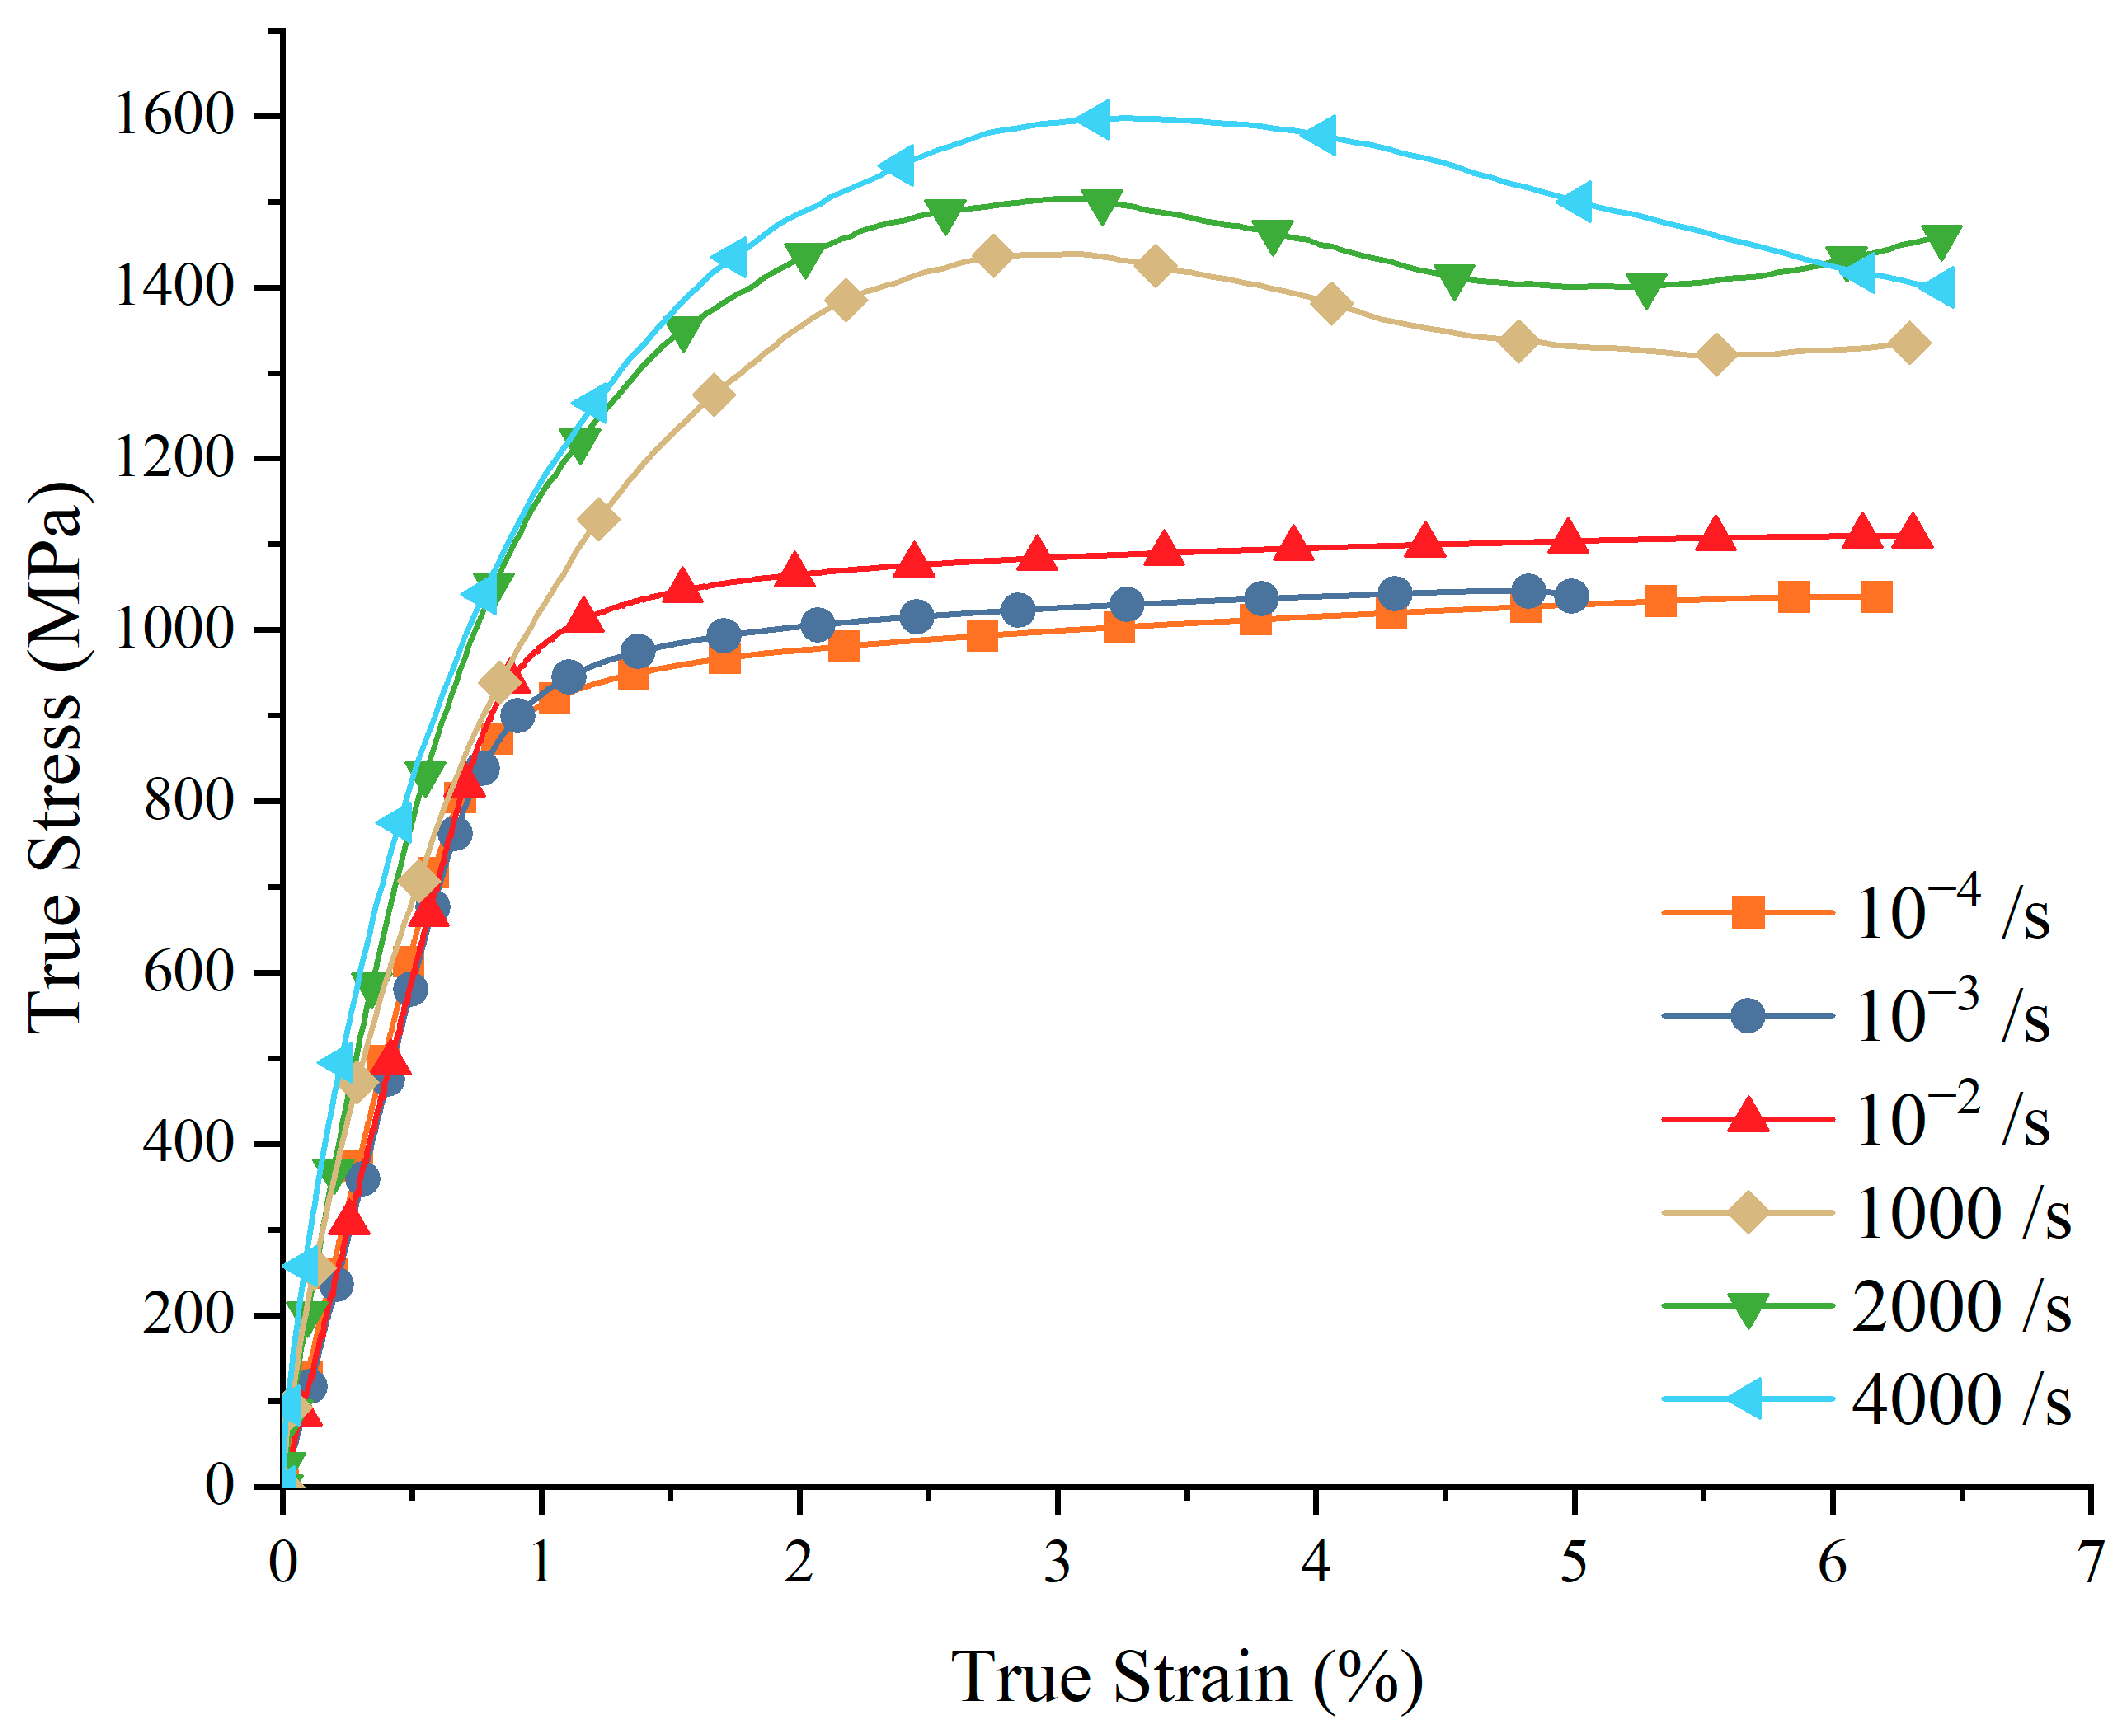
According to the stress–strain curves of tensile specimens with different strain rates at room temperature (as shown in Figure 4), it can be seen that with an increase in the strain rate, the strength of the material also increases.
The strengthening effect at different strain rates was represented by Formula (7), as shown in Figure 5. At a low strain rate (a strain rate less than 1/s), the dynamic strengthening effect of the material is weak. The dynamic strengthening effect of the material is obvious at high strain rate (a strain rate greater than 1000/s).
Figure 5.
Stress–strain curves at different strain rates at room temperature.
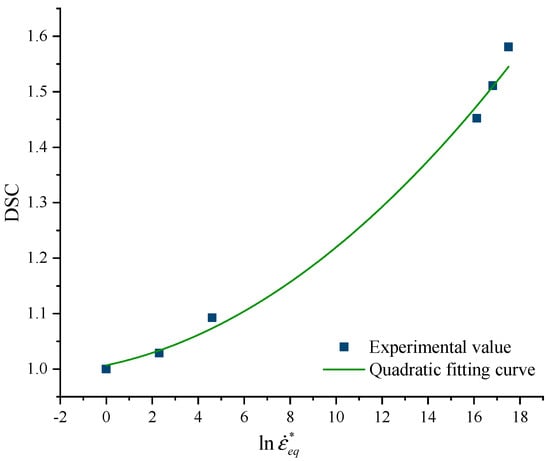
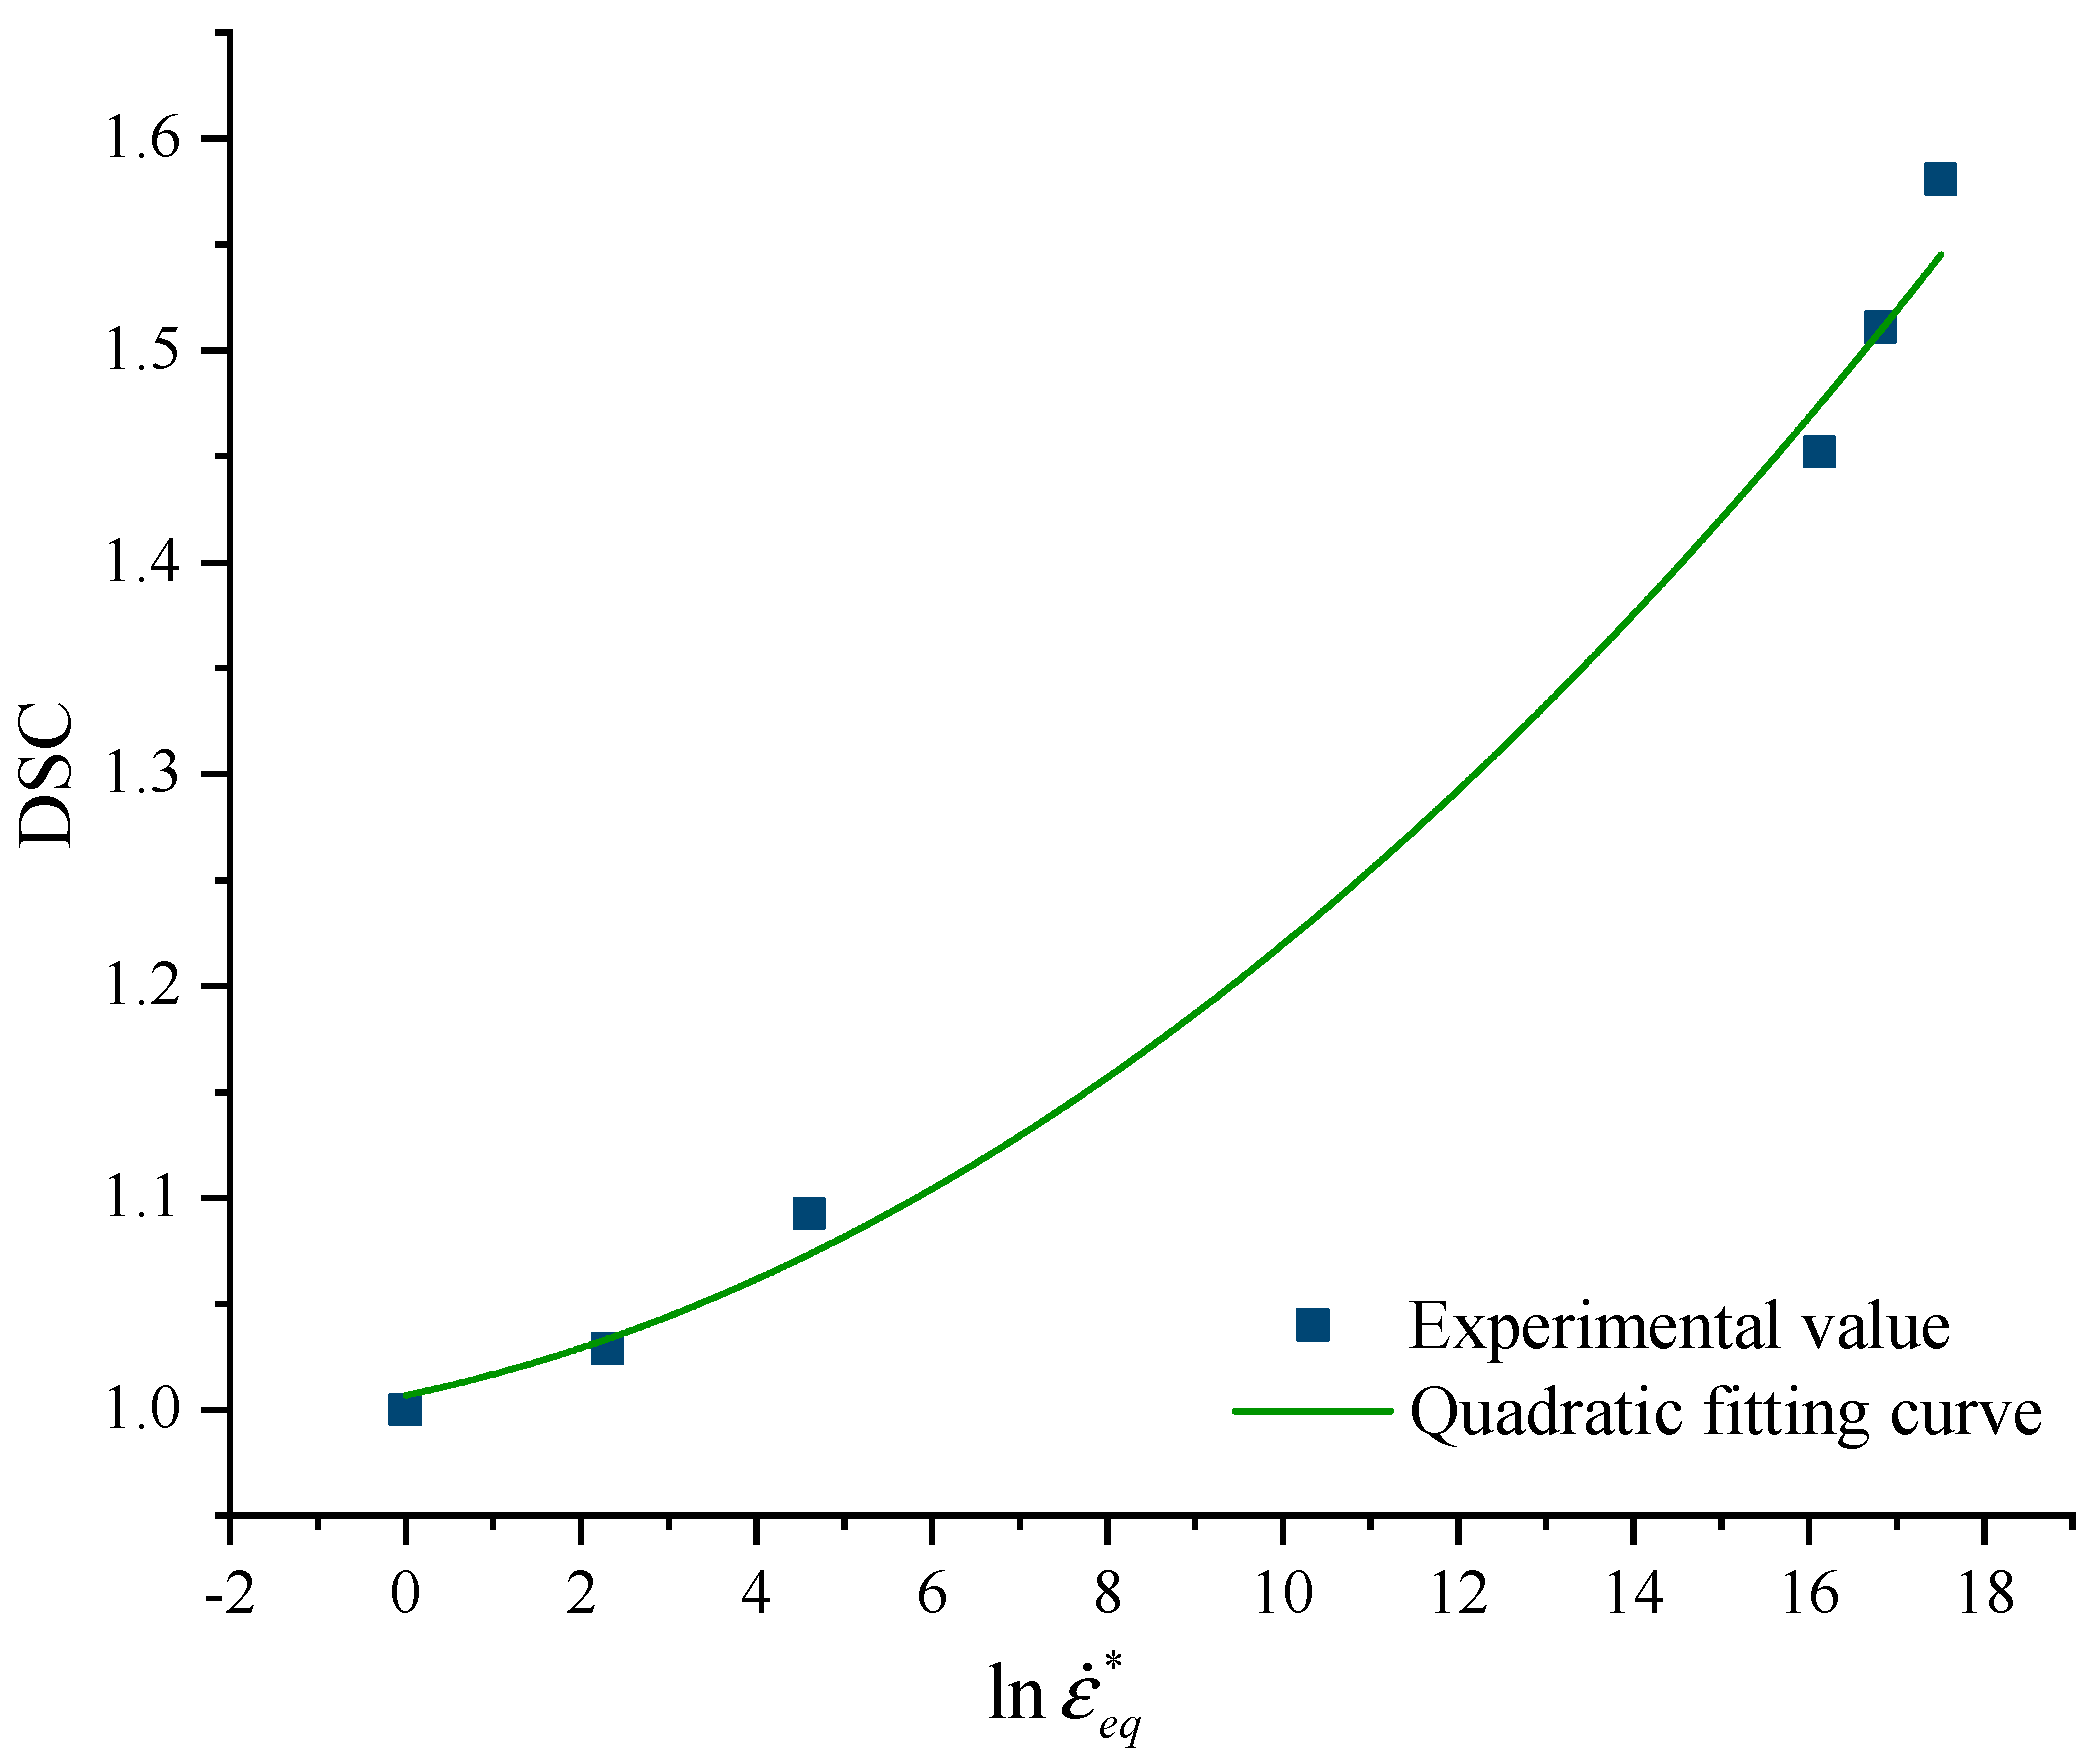
According to Equation (7), the DSC corresponding to each point can be calculated as shown in Figure 6. It can be seen that the relationship between DSC and is not a primary function, and DSC shows a trend of rapid growth with an increase in . Therefore, the function of DSC is fitted with a quadratic equation.
Figure 6.
Strength ratio of the material at a dynamic strain rate and a quasi-static strain rate.
In this formula, C1 and C2 are the primary and secondary coefficients of the strain rate term, respectively. For the TC4 titanium alloy, it can be calculated that C1 = 0.00864 and C2 = 0.001275 by fitting the test data.
The original J-C constitutive model and the improved strain term model were used to predict the stress–strain curves of quasi-static tensile tests at room temperature, and the results were compared with the experimental results. A comparison between the original and improved versions of the J-C model is shown in Figure 7. It can be seen that at a low strain rate (<1/s), the maximum predicted deviation of the nonlinear optimized model is 2.32%, and the maximum deviation of the original model is 2.98%, showing a slightly better predictive effect. A stronger difference between the two models is noticed at strain rates greater than 1000/s), where the maximum deviation of the nonlinear optimization model is 3.92% and the maximum deviation of the original model is 6.31%.
Figure 7.
Comparison of the model’s predicted values and the experimental values at different strain rates.
According to Equation (8), the mean square error (MSE) between the predicted value and the test value is 0.339, and the correlation coefficient R2 is 0.982. This shows that the predictive accuracy of the improved model is better.
3.3. Temperature-Based Model Improvement
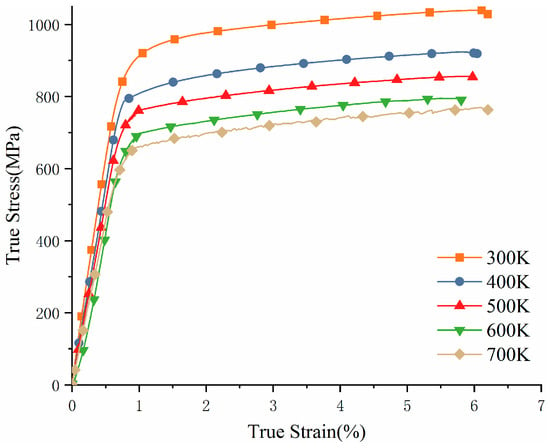
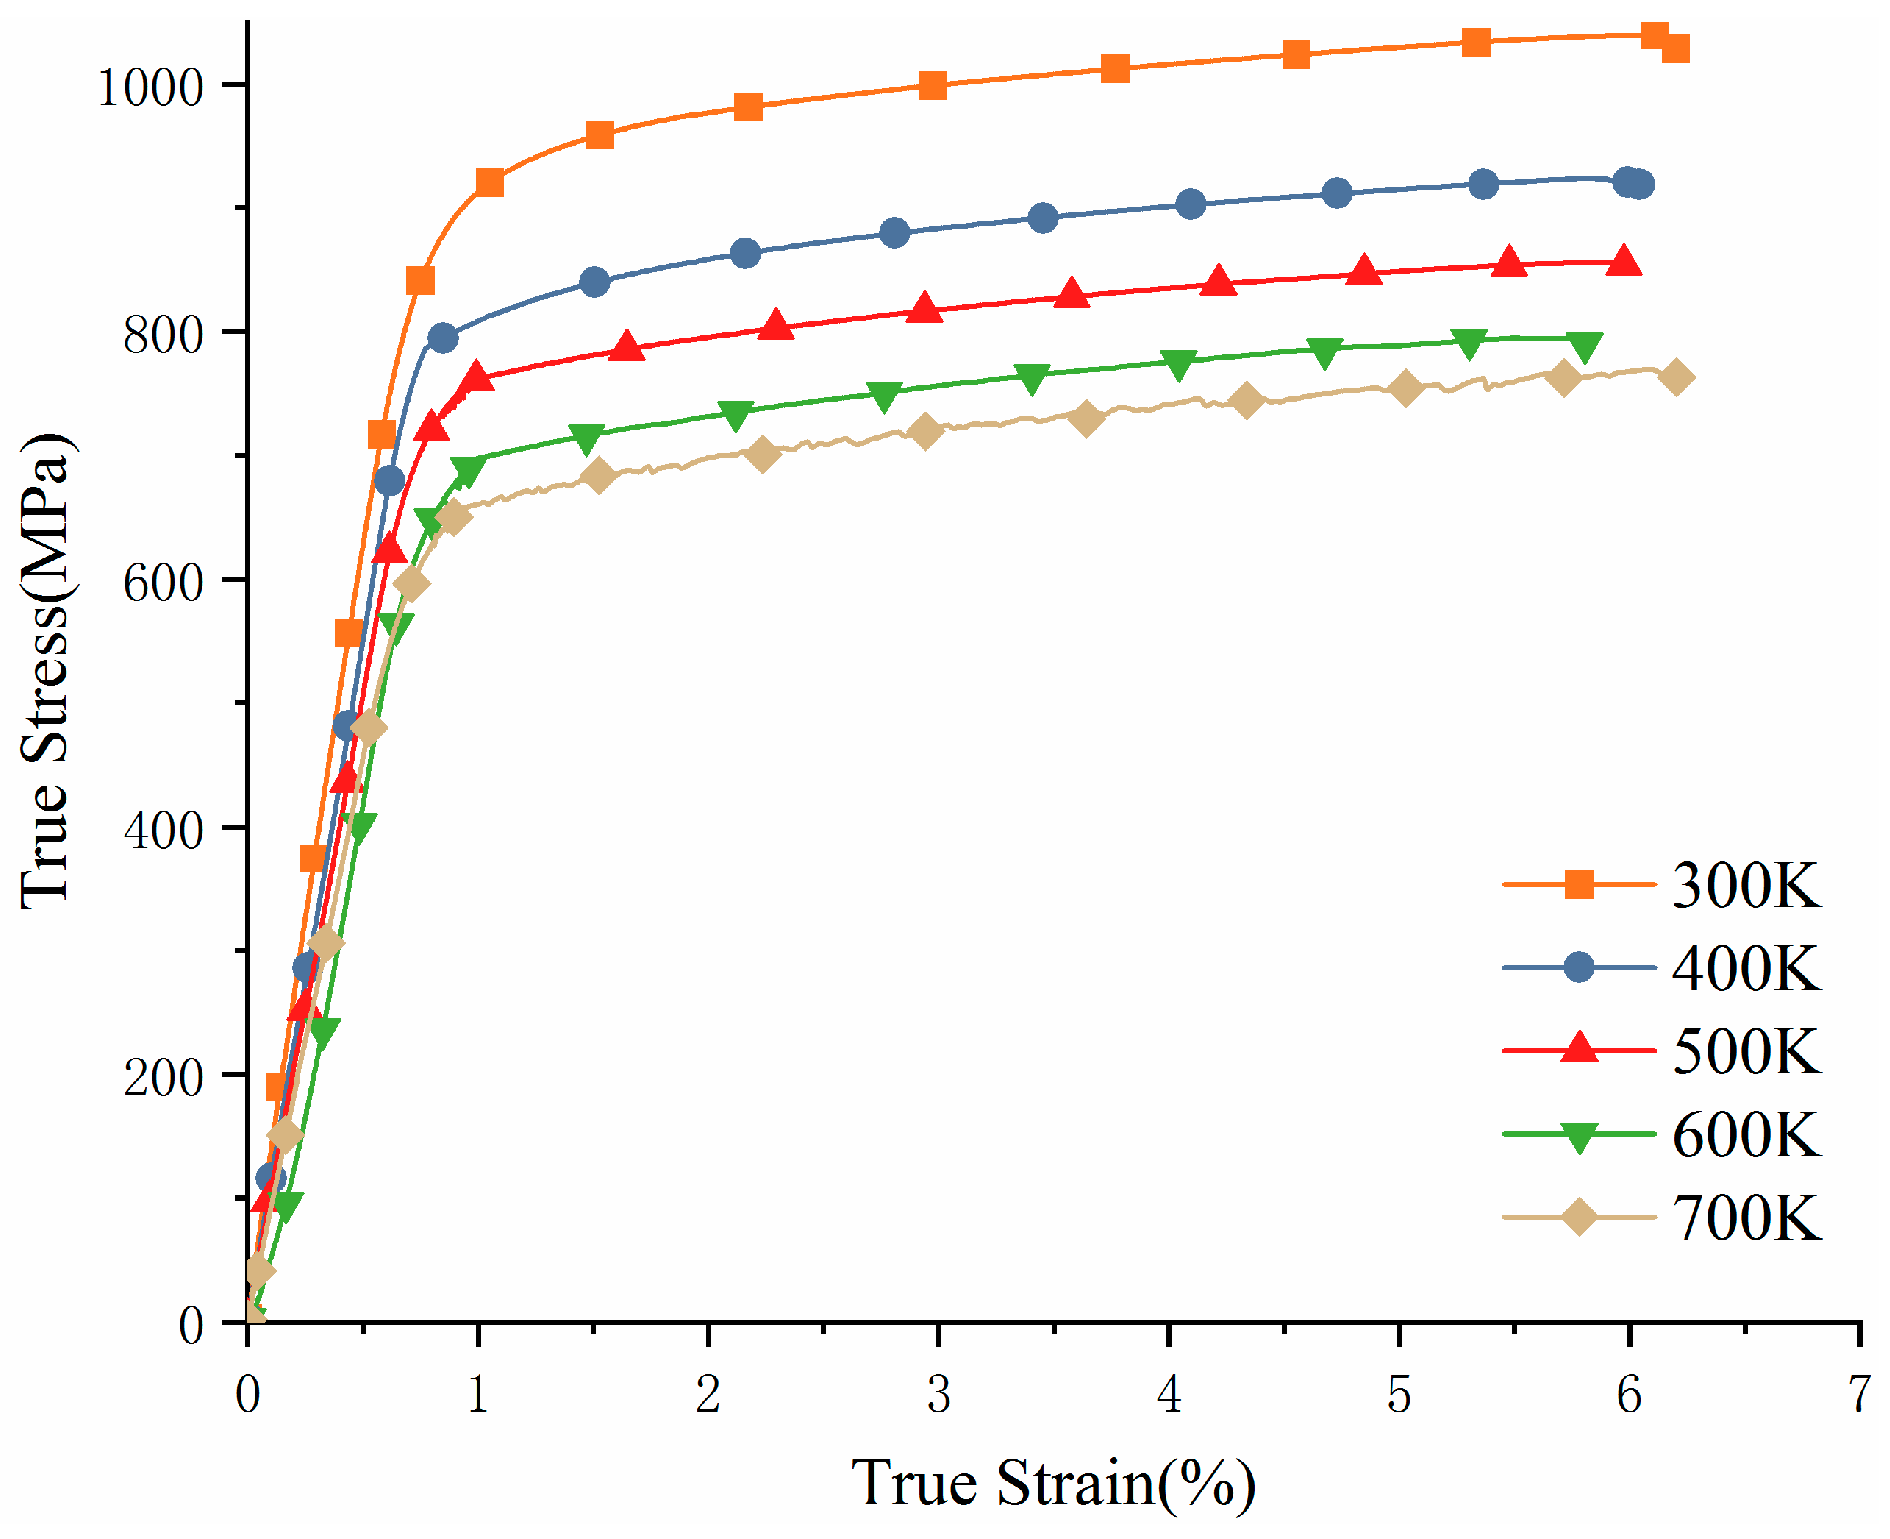
Upon examination of the quasi-static tensile test outcomes at varying temperatures, as illustrated in Figure 8, it becomes evident that both the Young’s modulus and yield strength exhibit a decrement with the escalation of dimensionless temperature, which is indicative of the temperature-induced softening effect. Furthermore, it can be observed that the stress–strain curves for quasi-static tensile samples during the elastic deformation phase demonstrate pronounced linearity. Concurrently, in the plastic deformation phase, these curves display a significant degree of parallelism. Consequently, it can be postulated that the influence of temperature on the stress response of the TC4 titanium alloy manifests a linear correlation with the yield strength, thereby implying a dependency of the temperature term on the material’s strength.
Figure 8.
Stress–strain curves at different temperatures under quasi-static tensile testing (10−4/s).
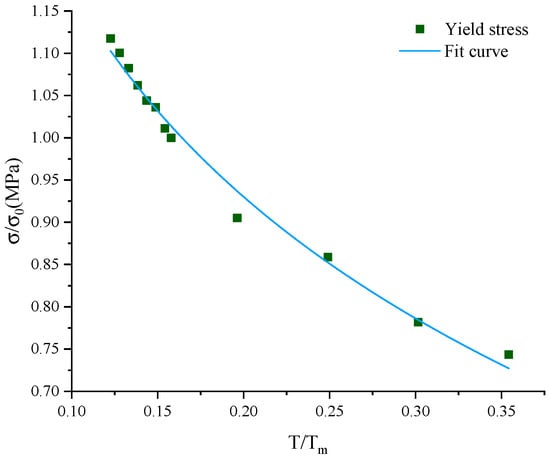
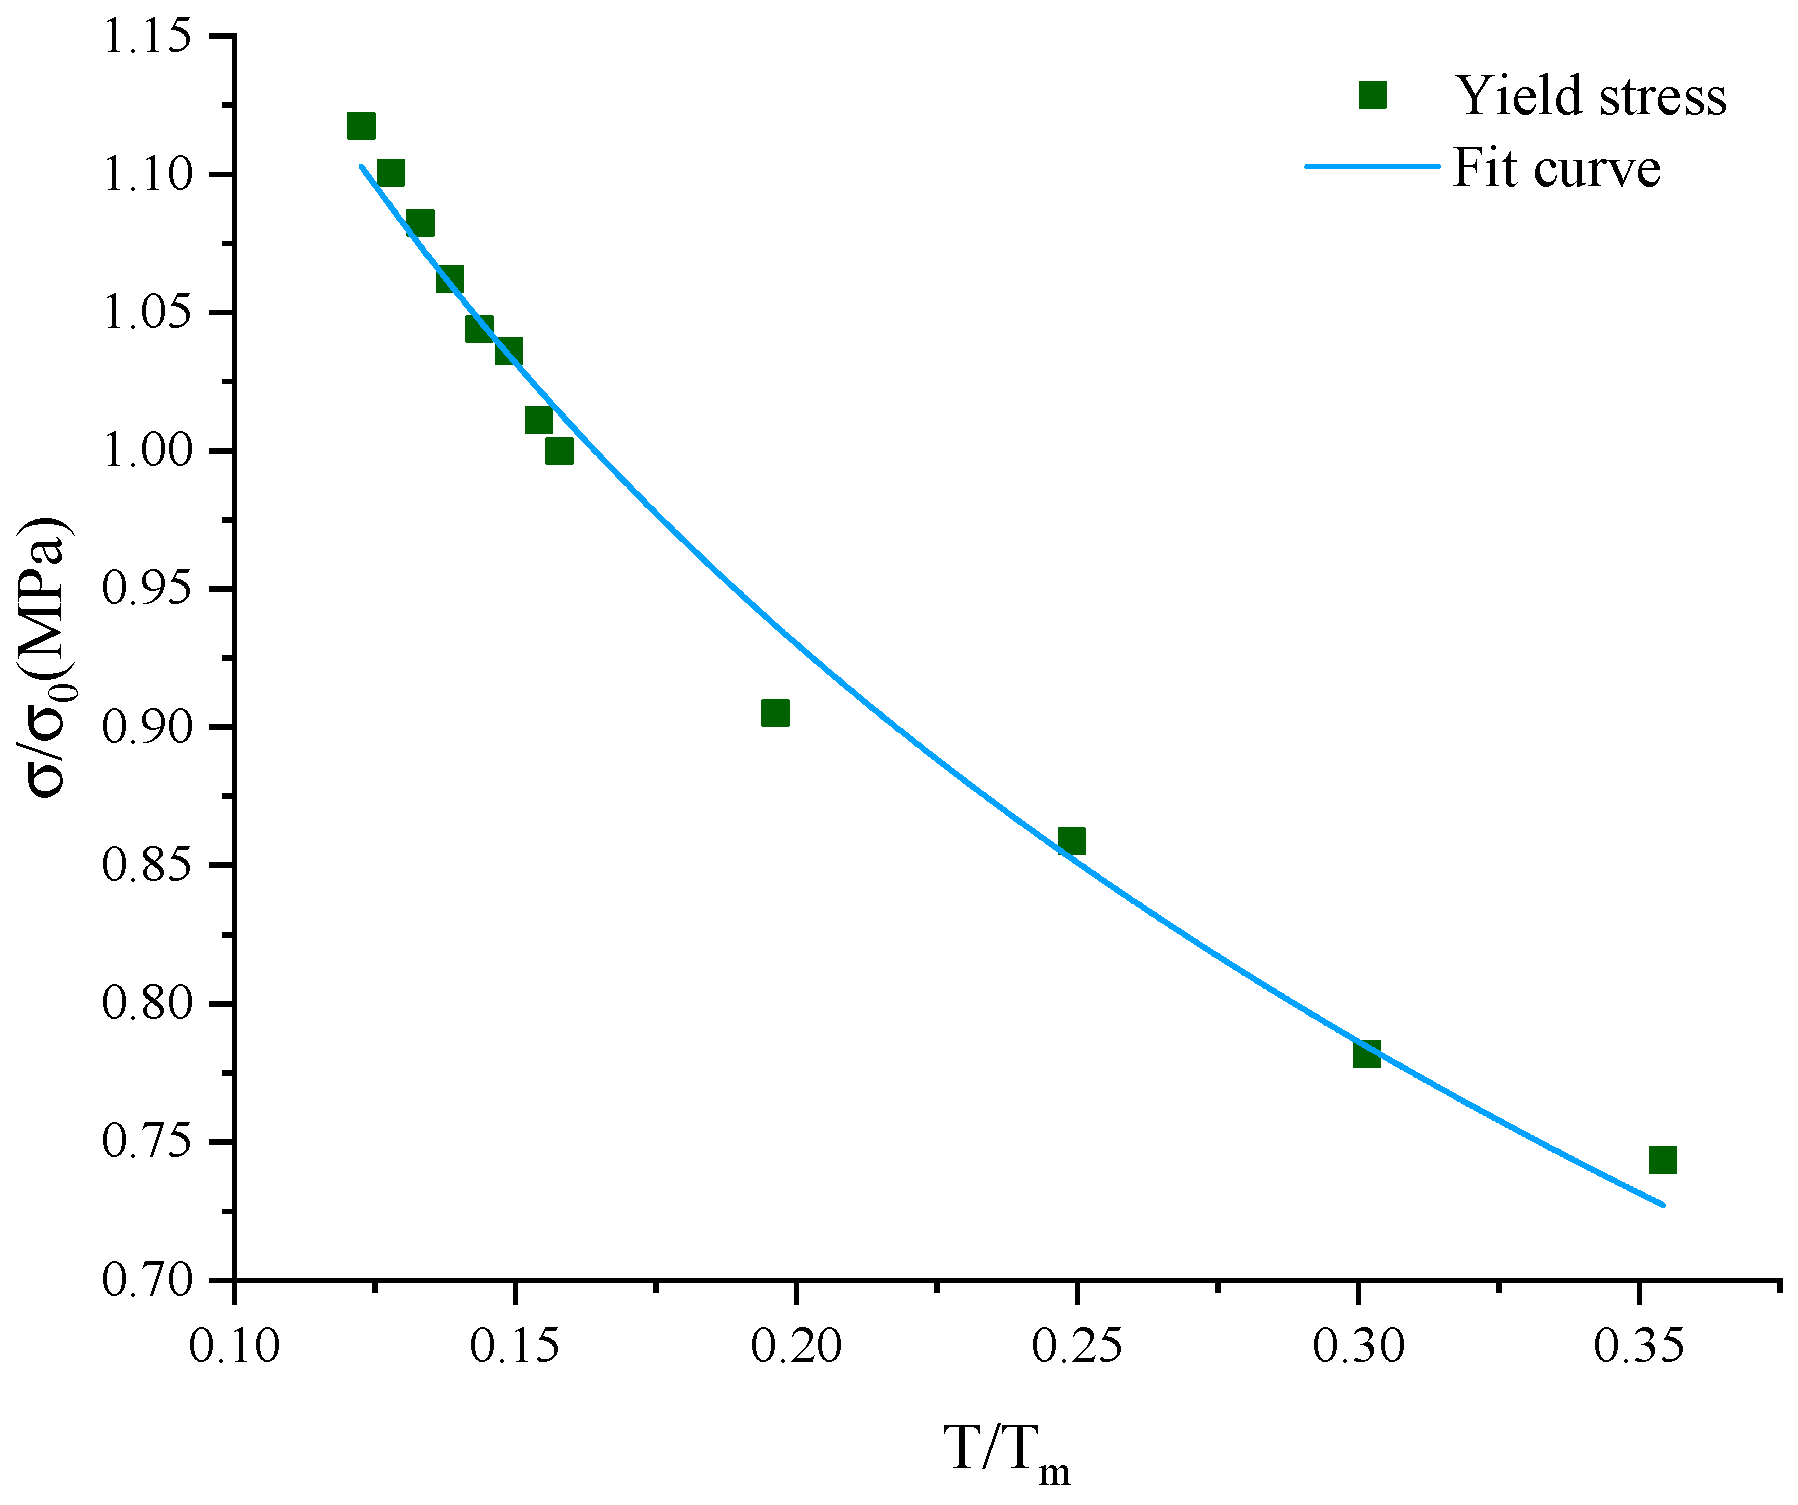
At the same time, Korkmaz [19,20] conducted experiments on the stress–strain curves of low-temperature titanium alloy materials, which showed that the temperature softening effect also exists in titanium alloy materials below room temperature. Since the yield strength of the TC4 titanium alloy decreases drastically at high temperatures and does not satisfy the exponential form in Equation (1), the expression of the temperature term of the J-C model is modified to make it also suitable for low-temperature conditions, taking the experimental data into account (Figure 9). The improved model is shown below
where is the yield strength of the material under quasi-static tension at room temperature, and t is the temperature softening factor. For the TC4 titanium alloy material, t = 1.2 and m = 0.119.
Figure 9.
Fitting correction to the temperature term.
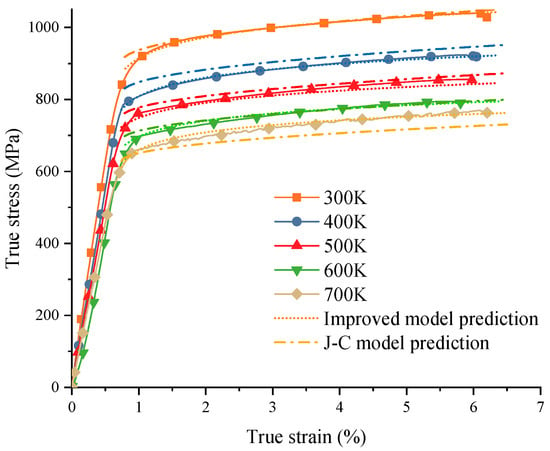
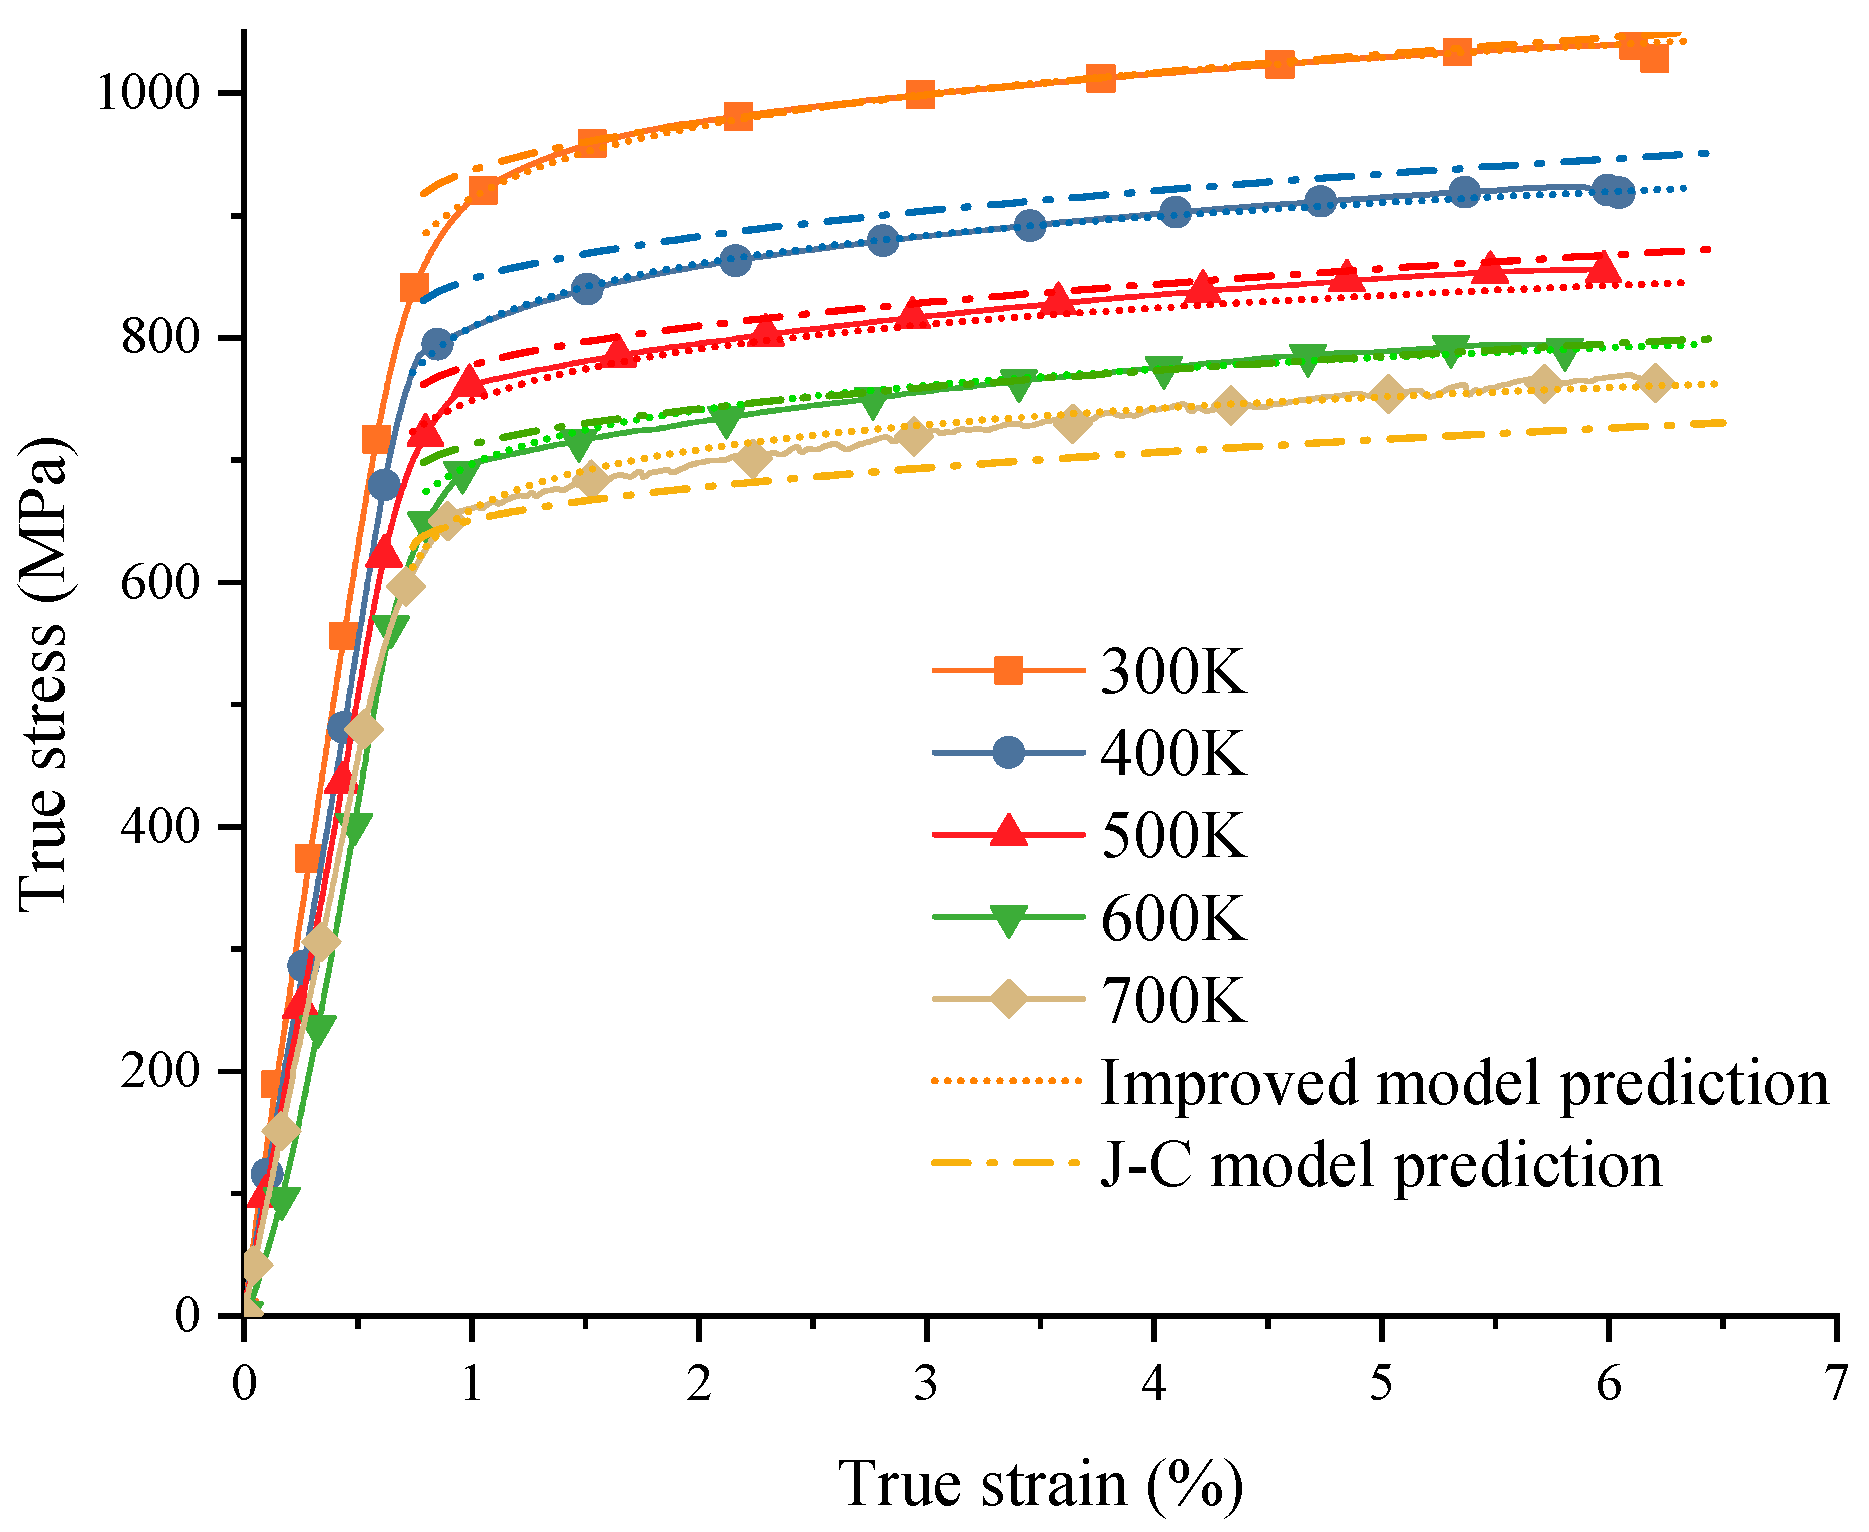
Combined with the stress–strain data measured by the test, the predicted value of the improved model was calculated by Equation (5). The original J-C constitutive model and the model with the improved temperature term were used to predict the stress–strain curves of quasi-static tension at different temperatures, and the results were compared with the test results. As shown in Figure 10, when the material enters the strain strengthening stage after plasticity, with an increase in temperature, the maximum predicted deviation of the original J-C constitutive model is 4.86%, while the maximum predicted deviation of the improved model is reduced to 1.46%.
Figure 10.
The predicted and experimental values of each model at different temperatures.
Through the enhancement of the temperature term’s formulation within the J-C model, the model’s applicability has been extended to encompass subambient temperatures. This modification encompasses low- and moderate-temperature environments, thereby broadening the scope of the model simulations, while concurrently enhancing the model’s predictive accuracy.
To sum up, Equation (11) is the improved J-C constitutive model proposed in this study combined with the test data. The model takes the influence of factors such as the strain, strain rate, and temperature into account, making the model’s predictions more accurate under the scenario of a high strain rate, the relevant parameters of TC4 titanium alloy are shown in Table 3. The specific equation is as follows:
Table 3.
The values of each parameter of the improved model.
4. Discussion
The improved J-C model was examined using numerical simulations. The improved J-C model described above was prepared by the ABAQUS VUAMT (version6.14) subroutine module, and numerical simulations of the improved J-C model and the original model were carried out by using the ABAQUS explicit dynamics module. The units set in ABAQUS were stress (MPa), length (mm) and time (s); the boundary conditions were set as unilaterally fixed; the analysis step was set as dynamic explicit; and the step of the entire analysis was set as 1 s. The set values of elastic modulus and Poisson’s ratio decreased with the increase in temperature. The strain rate was reflected by setting the displacement boundary and the step size of the analysis. For example, when the simulated strain rate was 10−4/s, the analysis step was 1 s and the displacement was 0.003 mm, which was the same at different temperatures. The mesh size was set to 1 mm globally, with the center section of the specimen set to 0.3 mm, and the mesh structure was set to C3D8R.
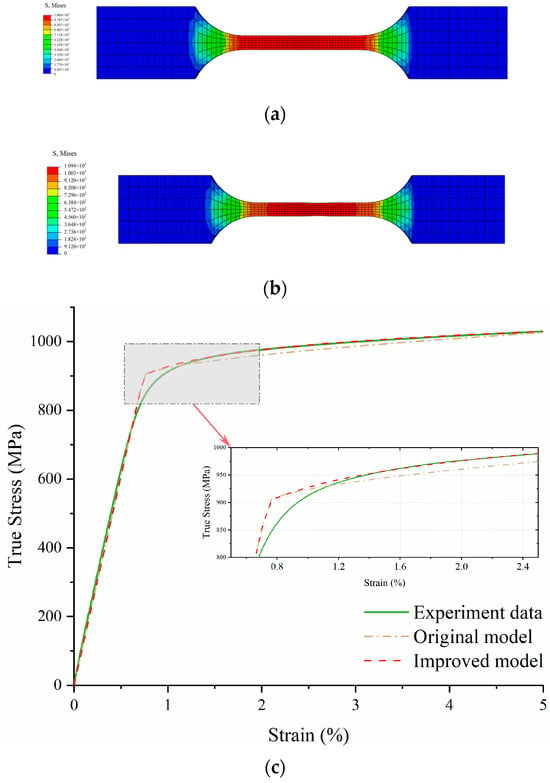
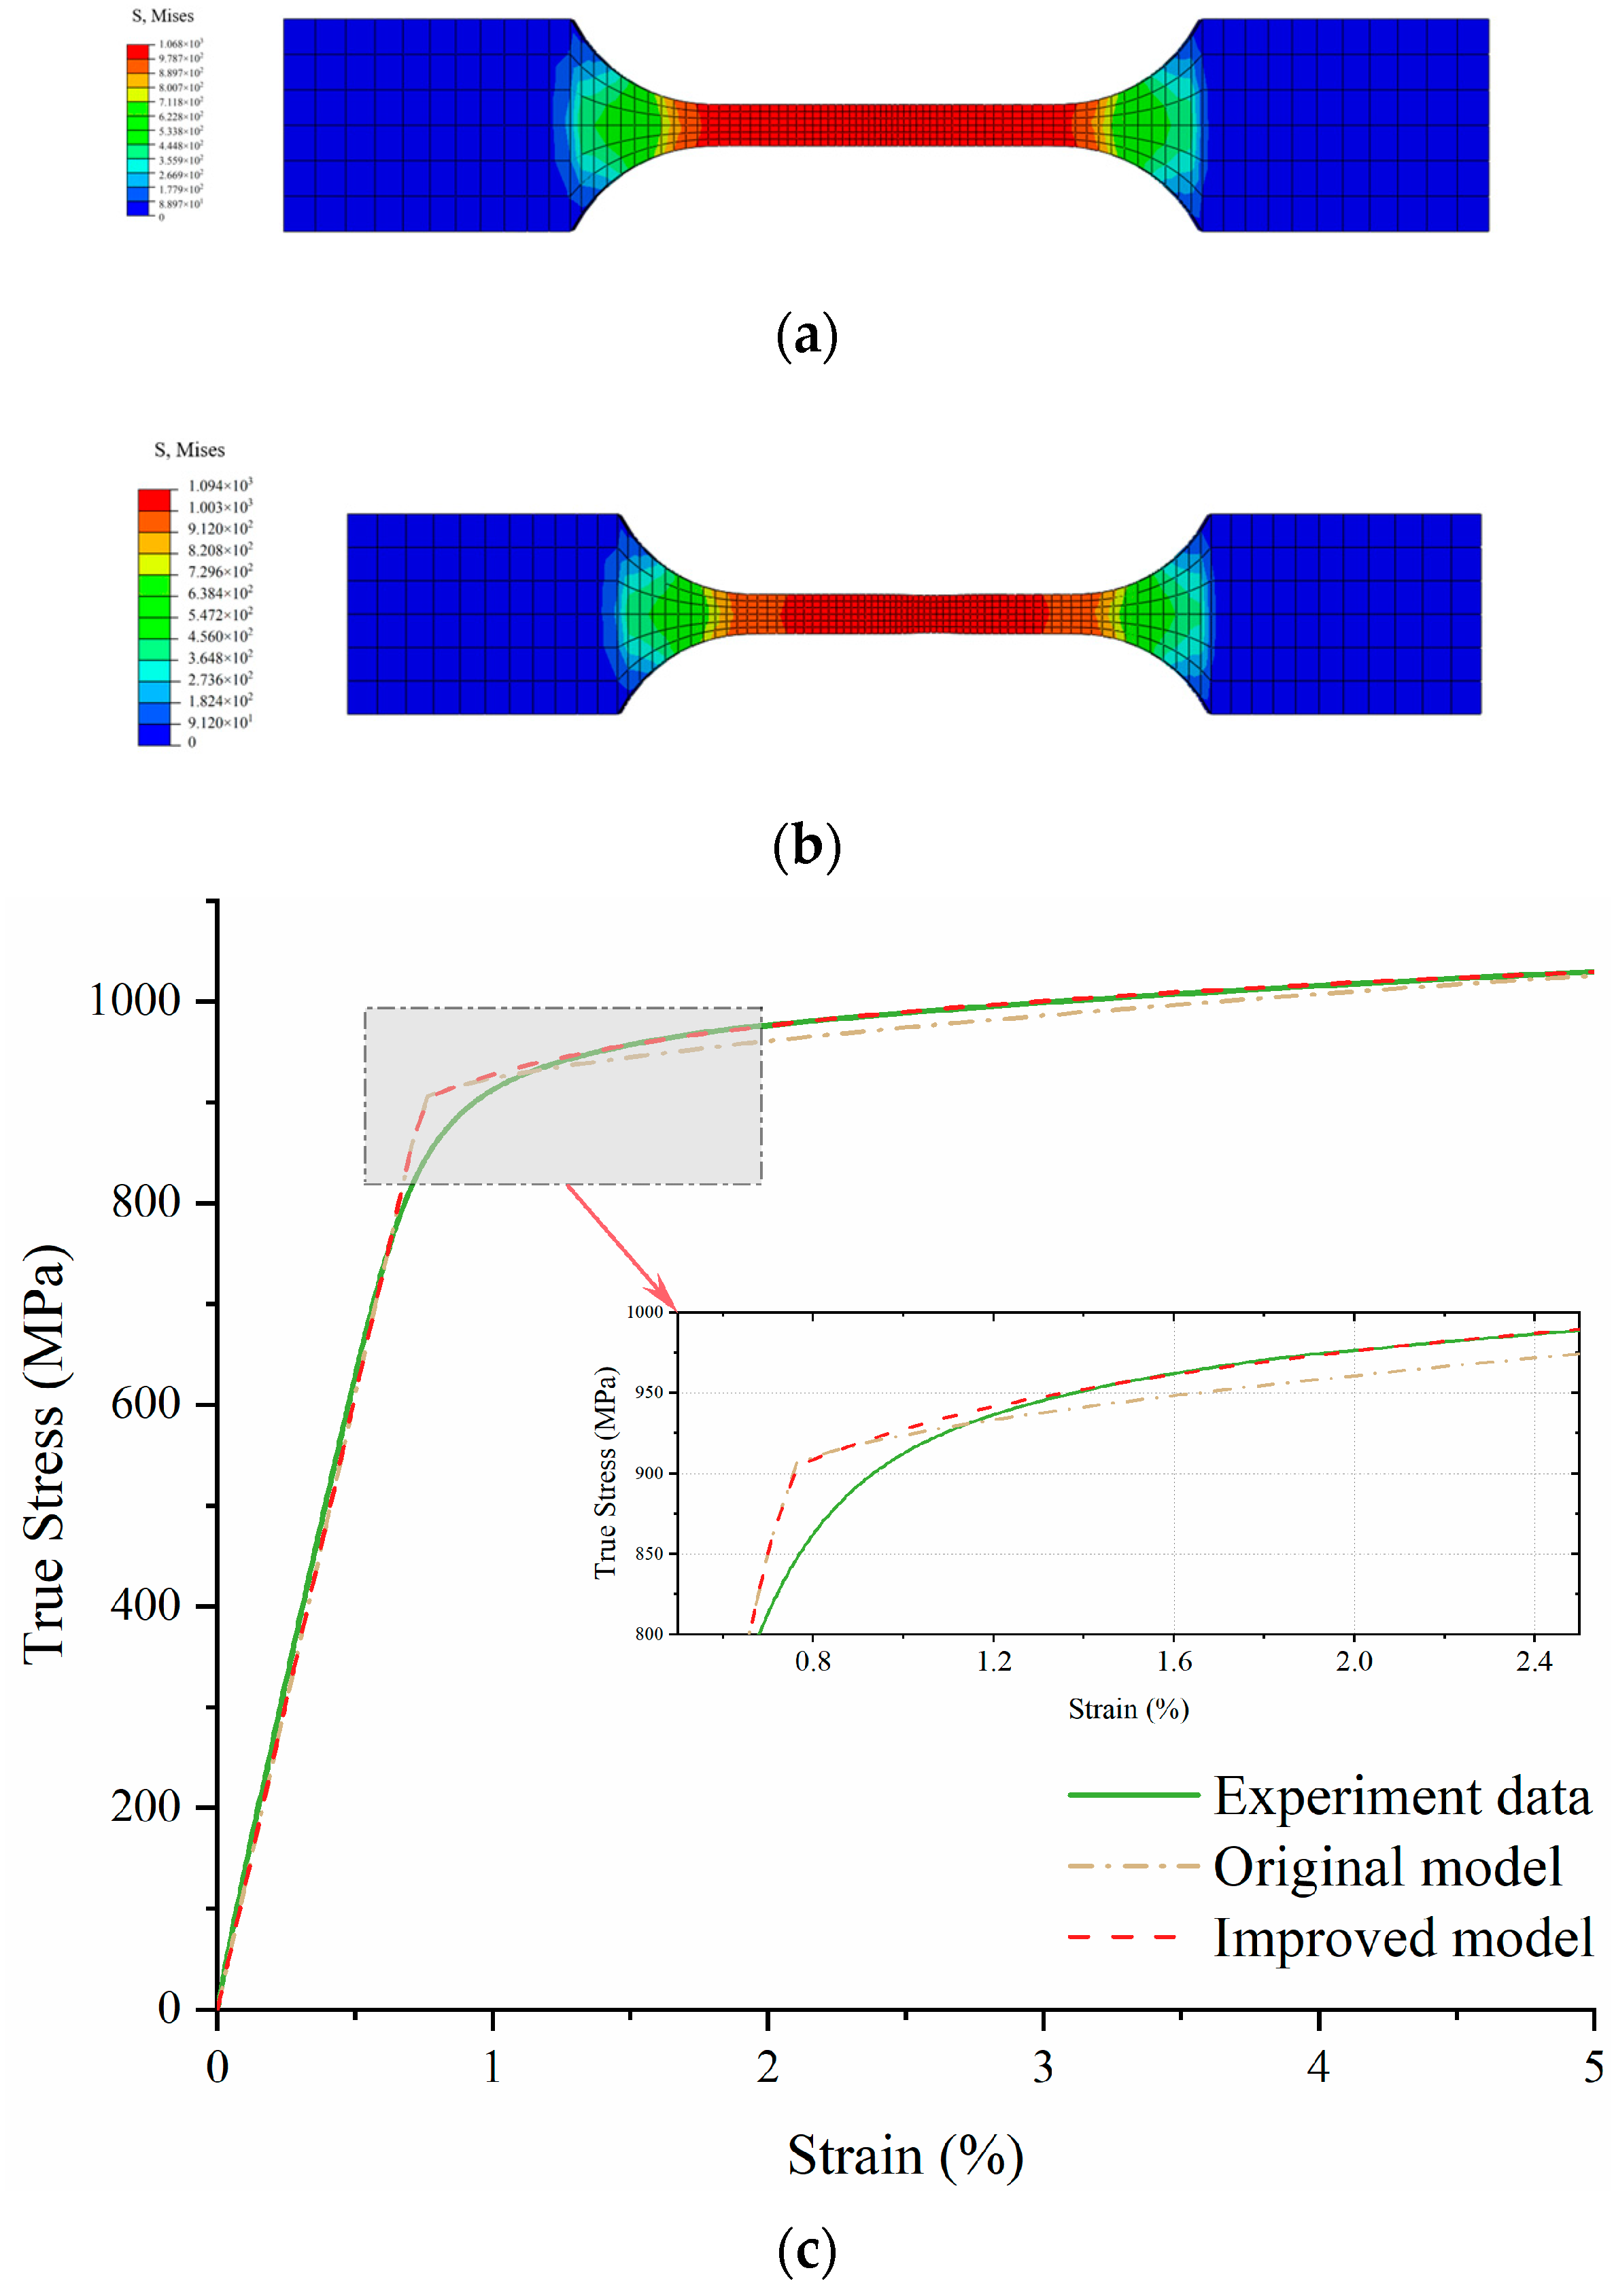
The stress nephograms of the original J-C constitutive model and the improved model are shown in Figure 11a,b, and the stress–strain curves of different models and tests are shown in Figure 11c.
Figure 11.
Comparison of the numerical simulation and experimental results between the improved J-C model and the original model. (a) Stress distribution maps for the improved J-C model. (b) Stress distribution maps for the original J-C model. (c) Comparison of stress–strain curves for different models (room temperature, the strain rate is 10−2/s).
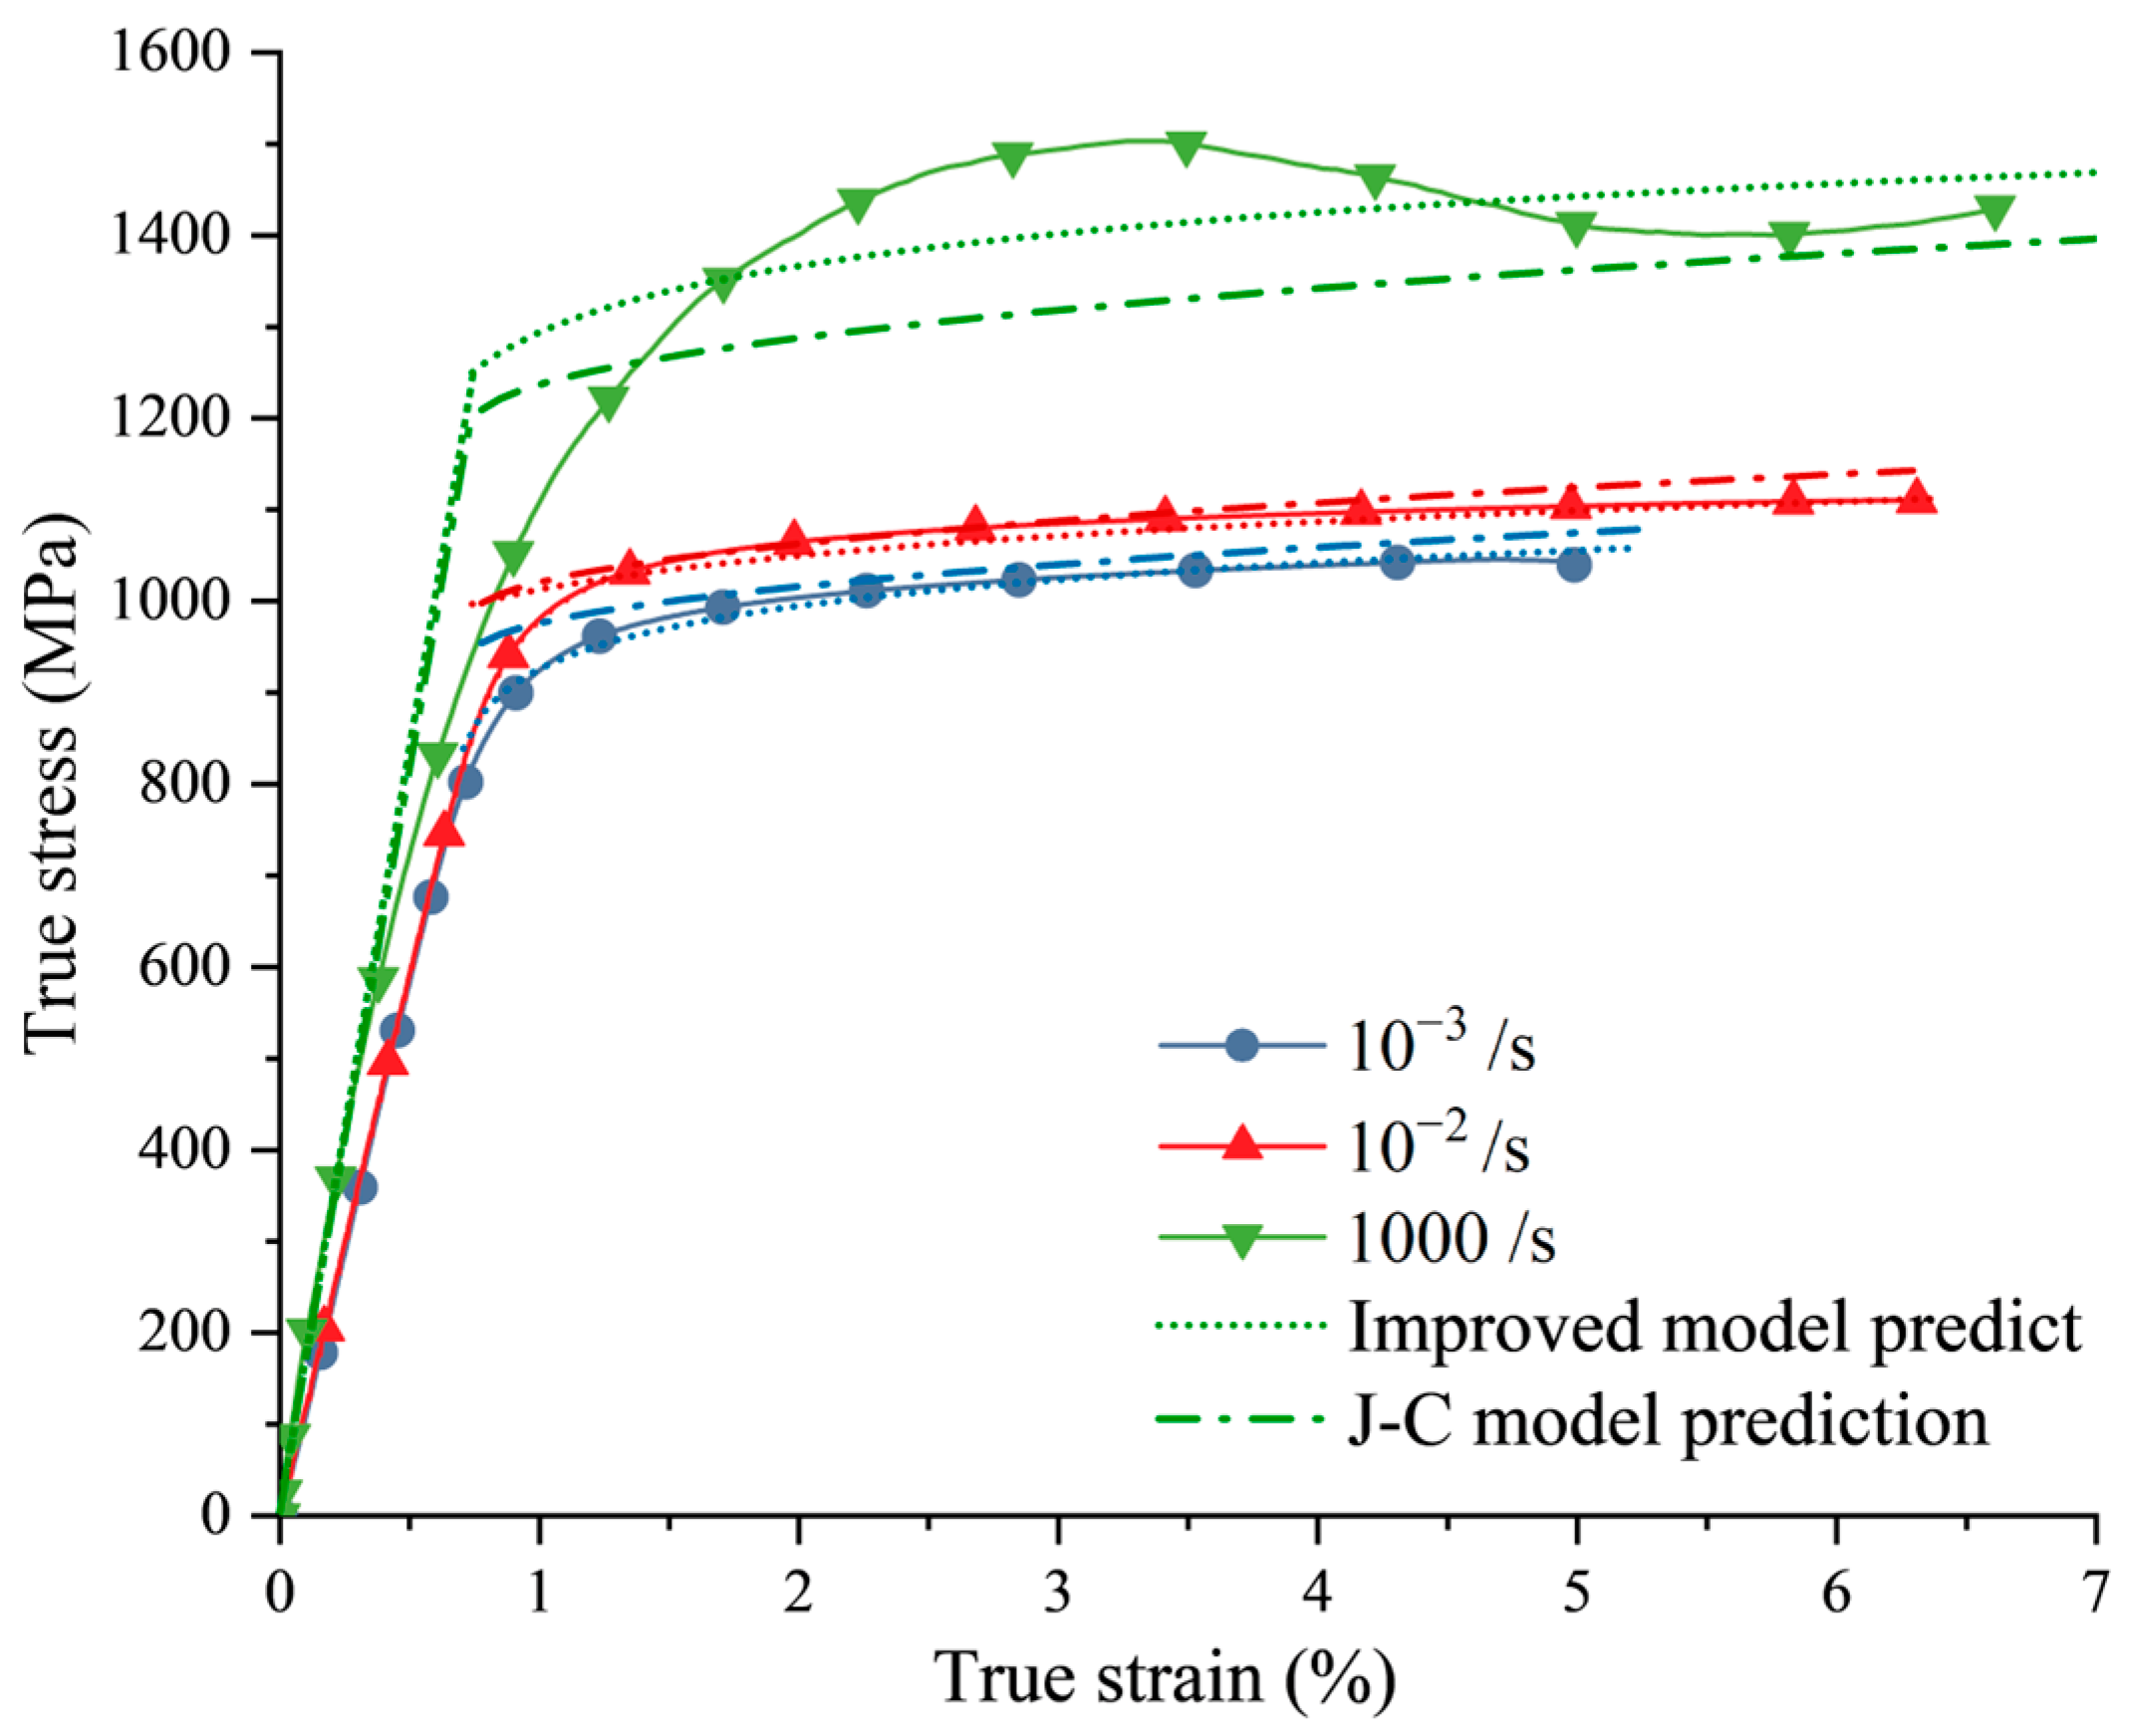
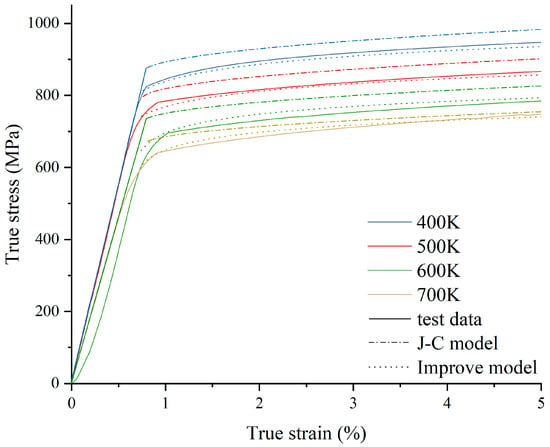
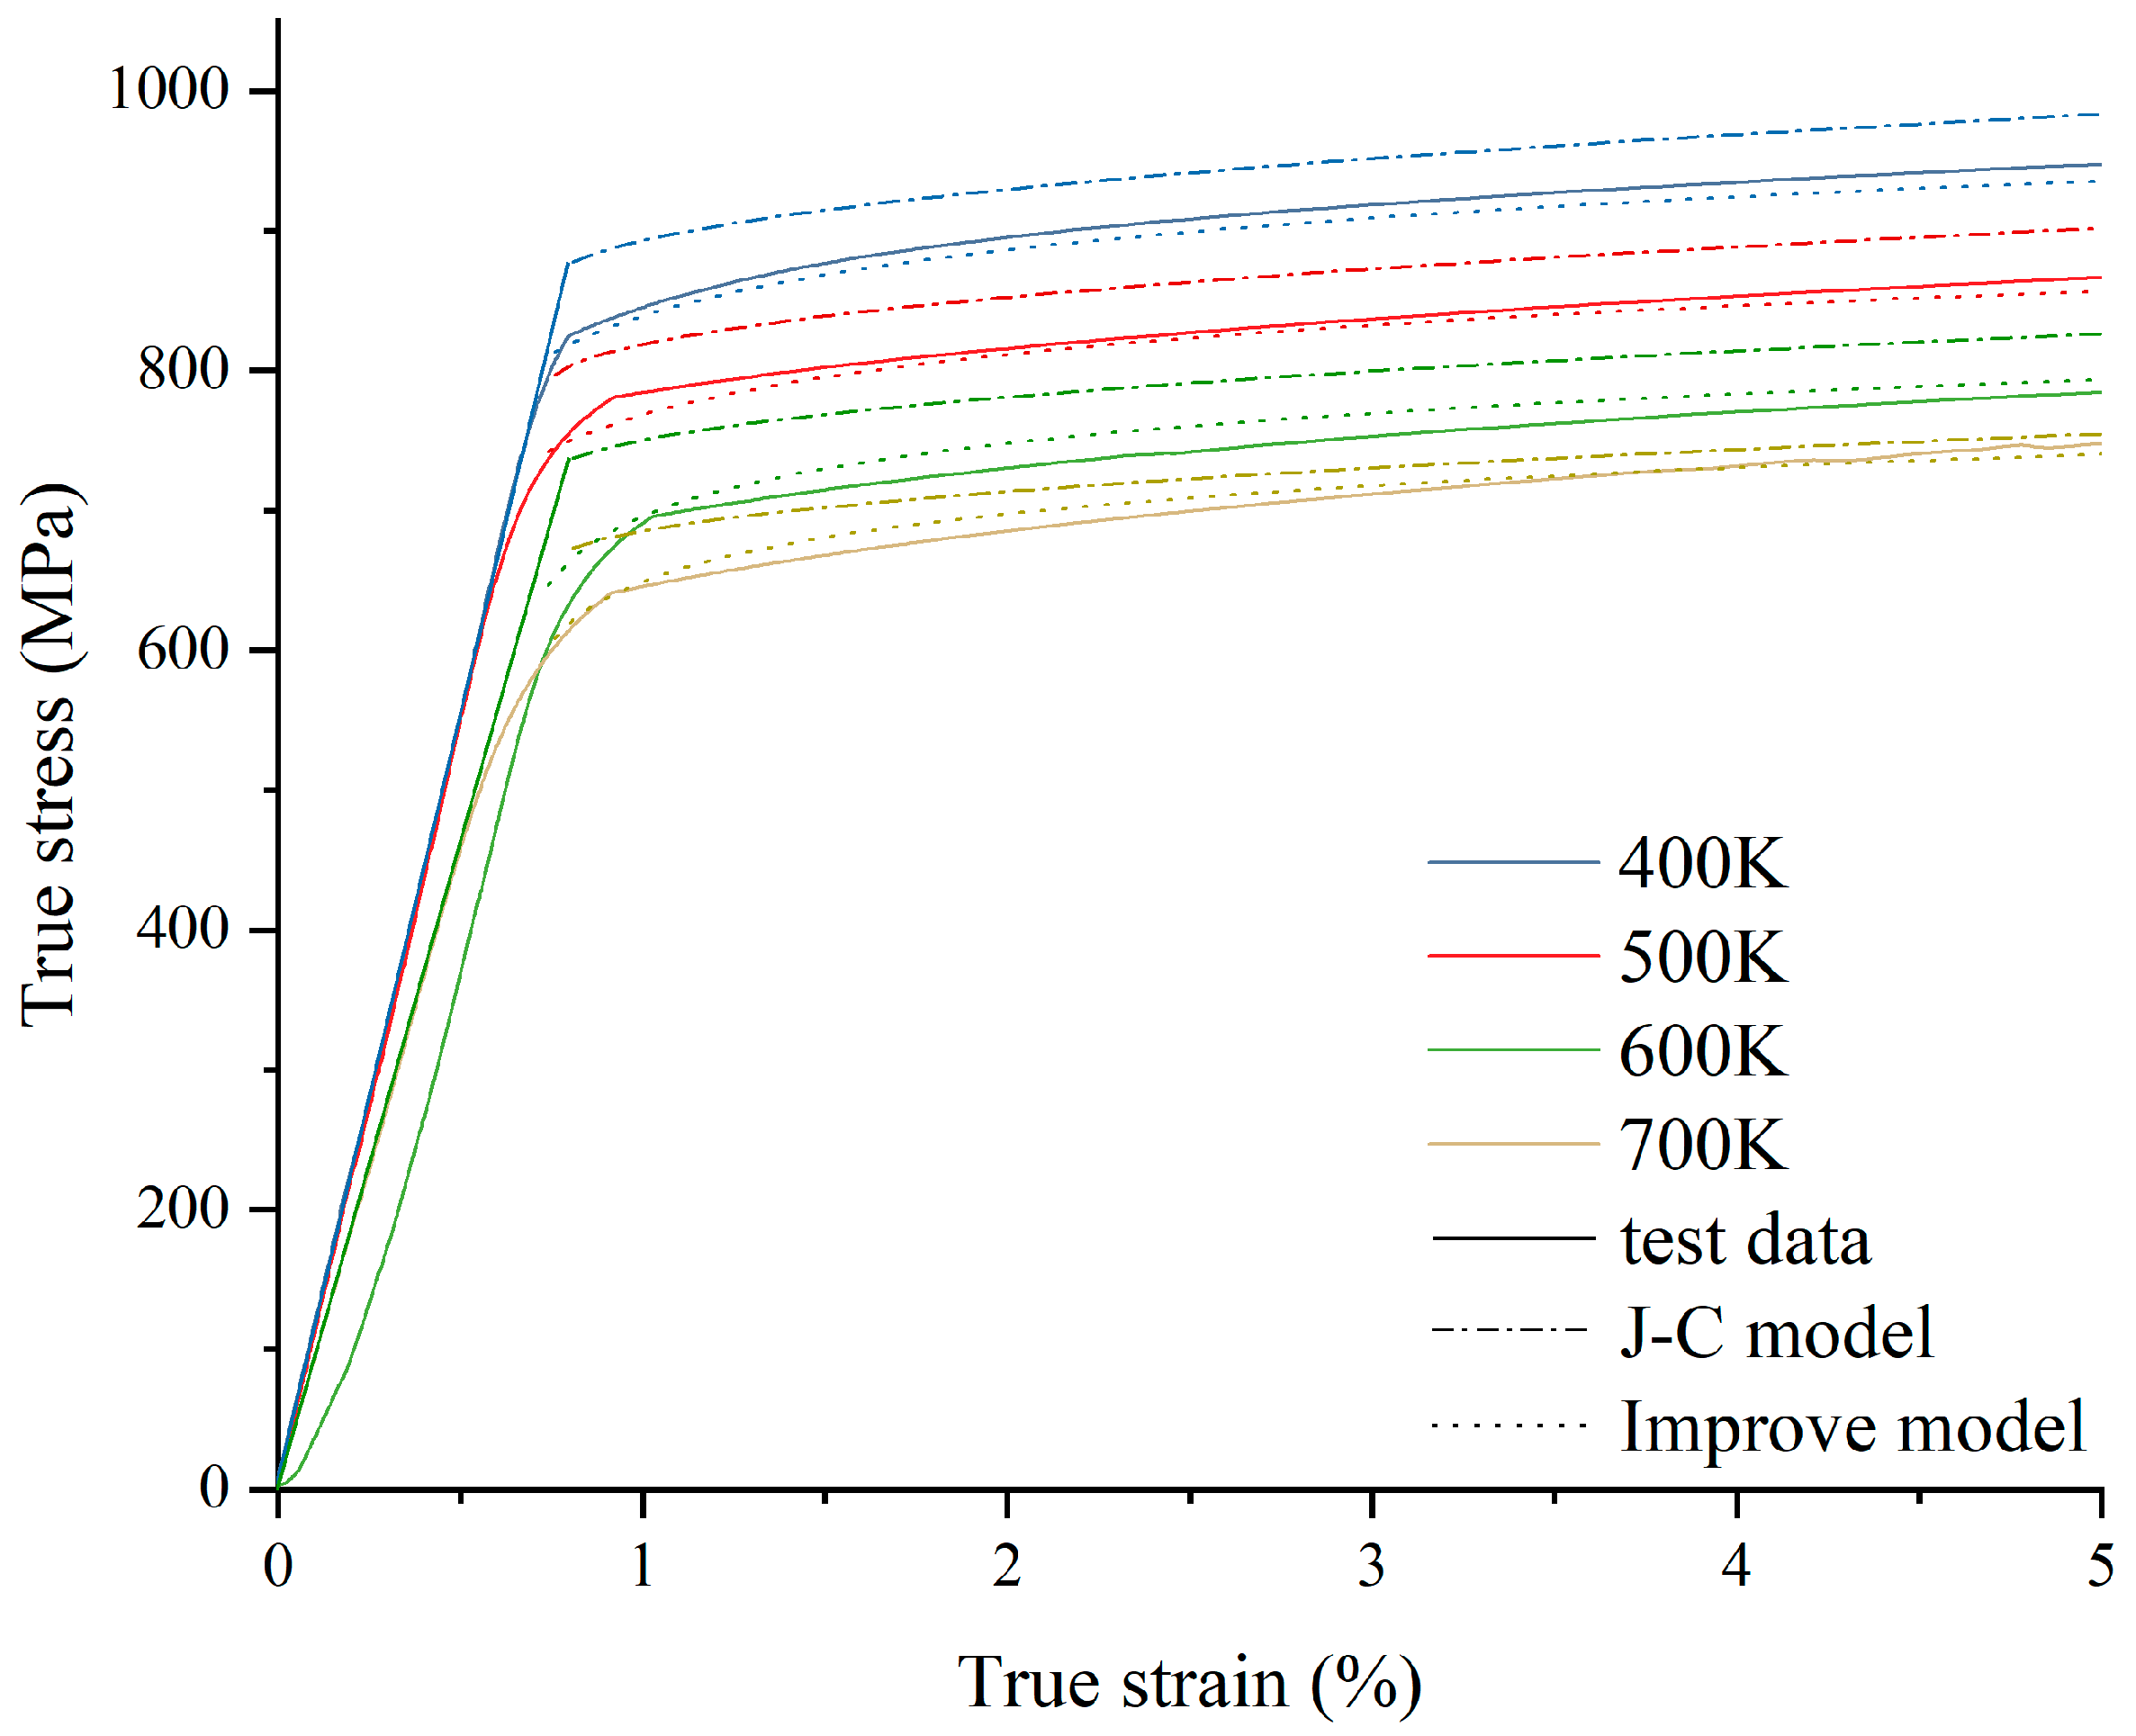
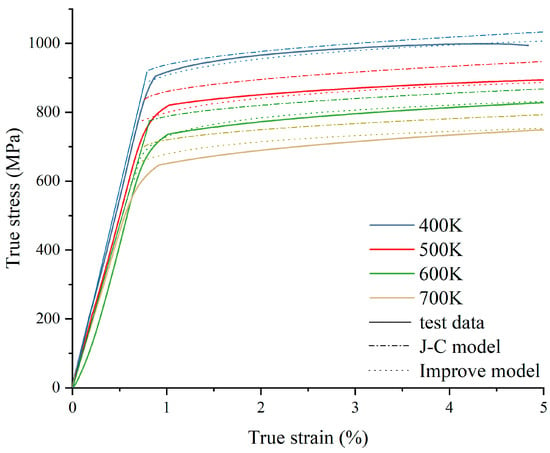
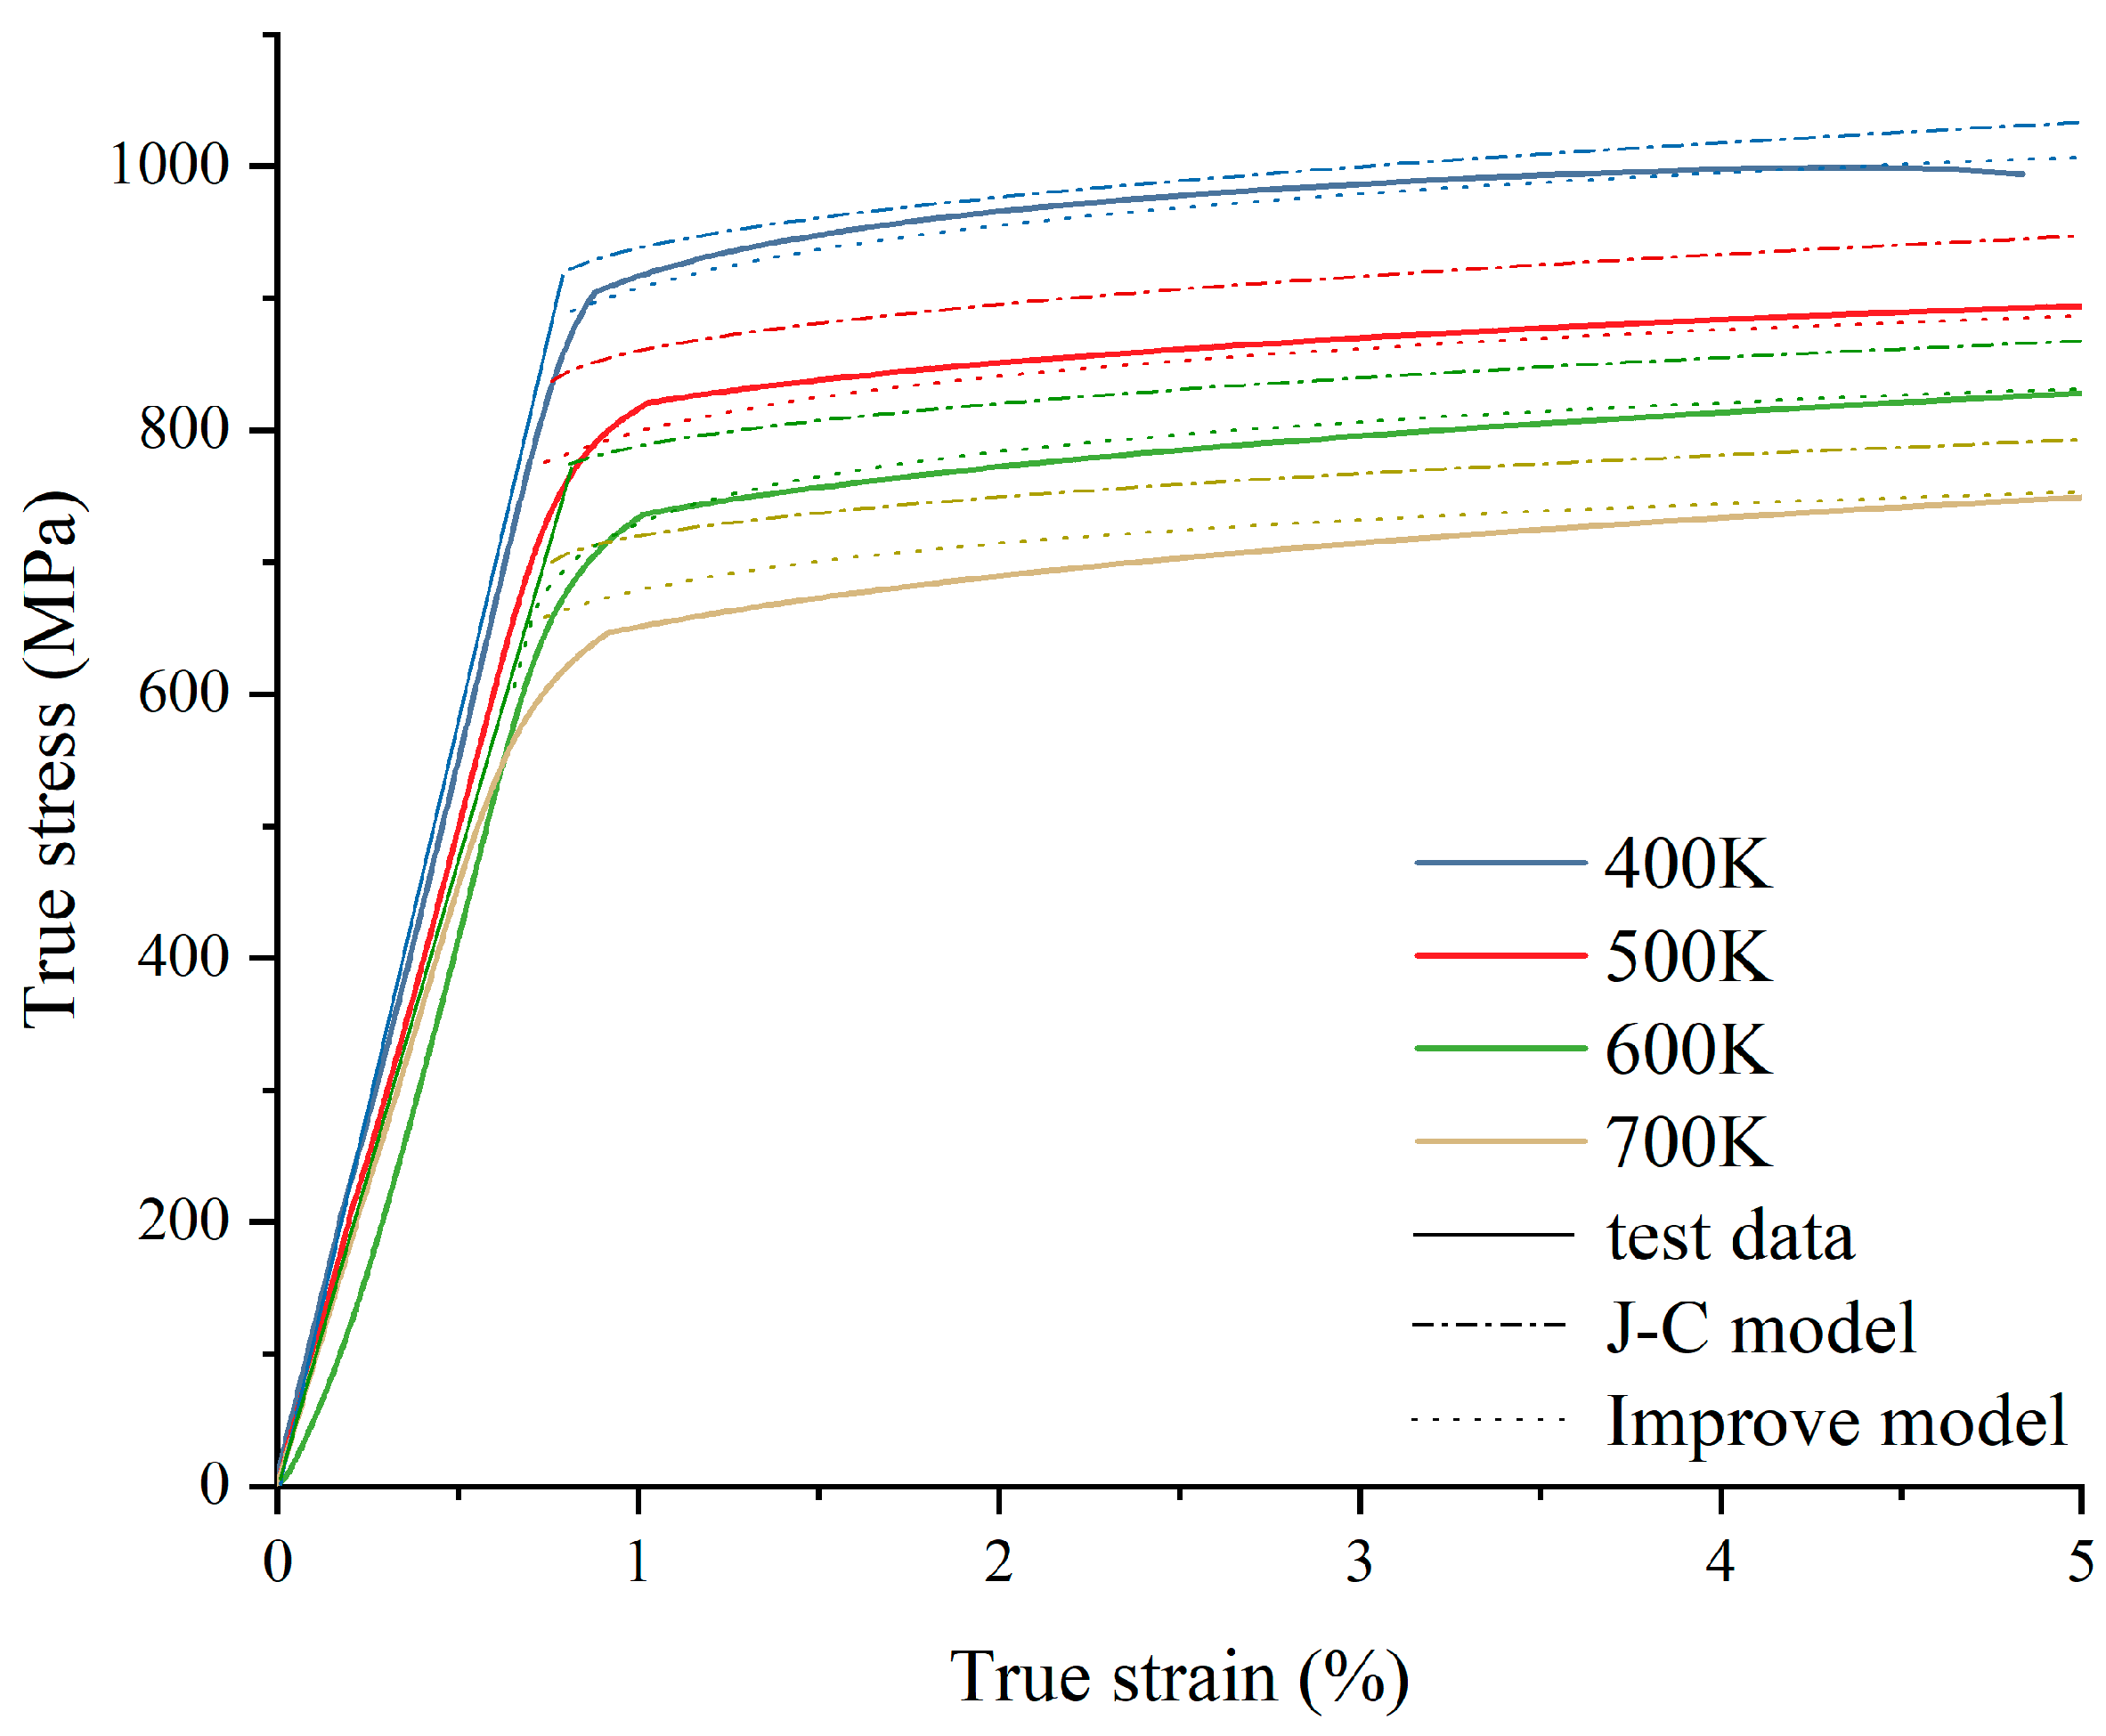
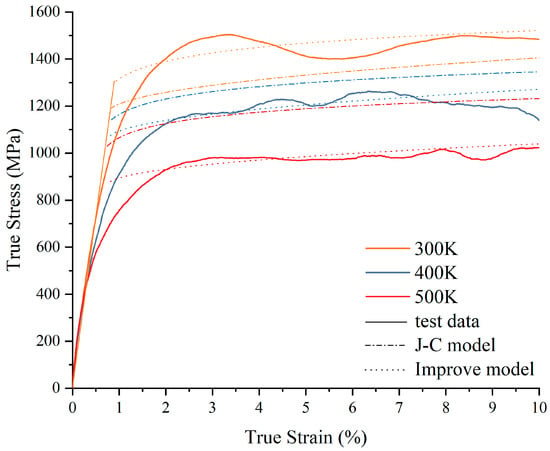
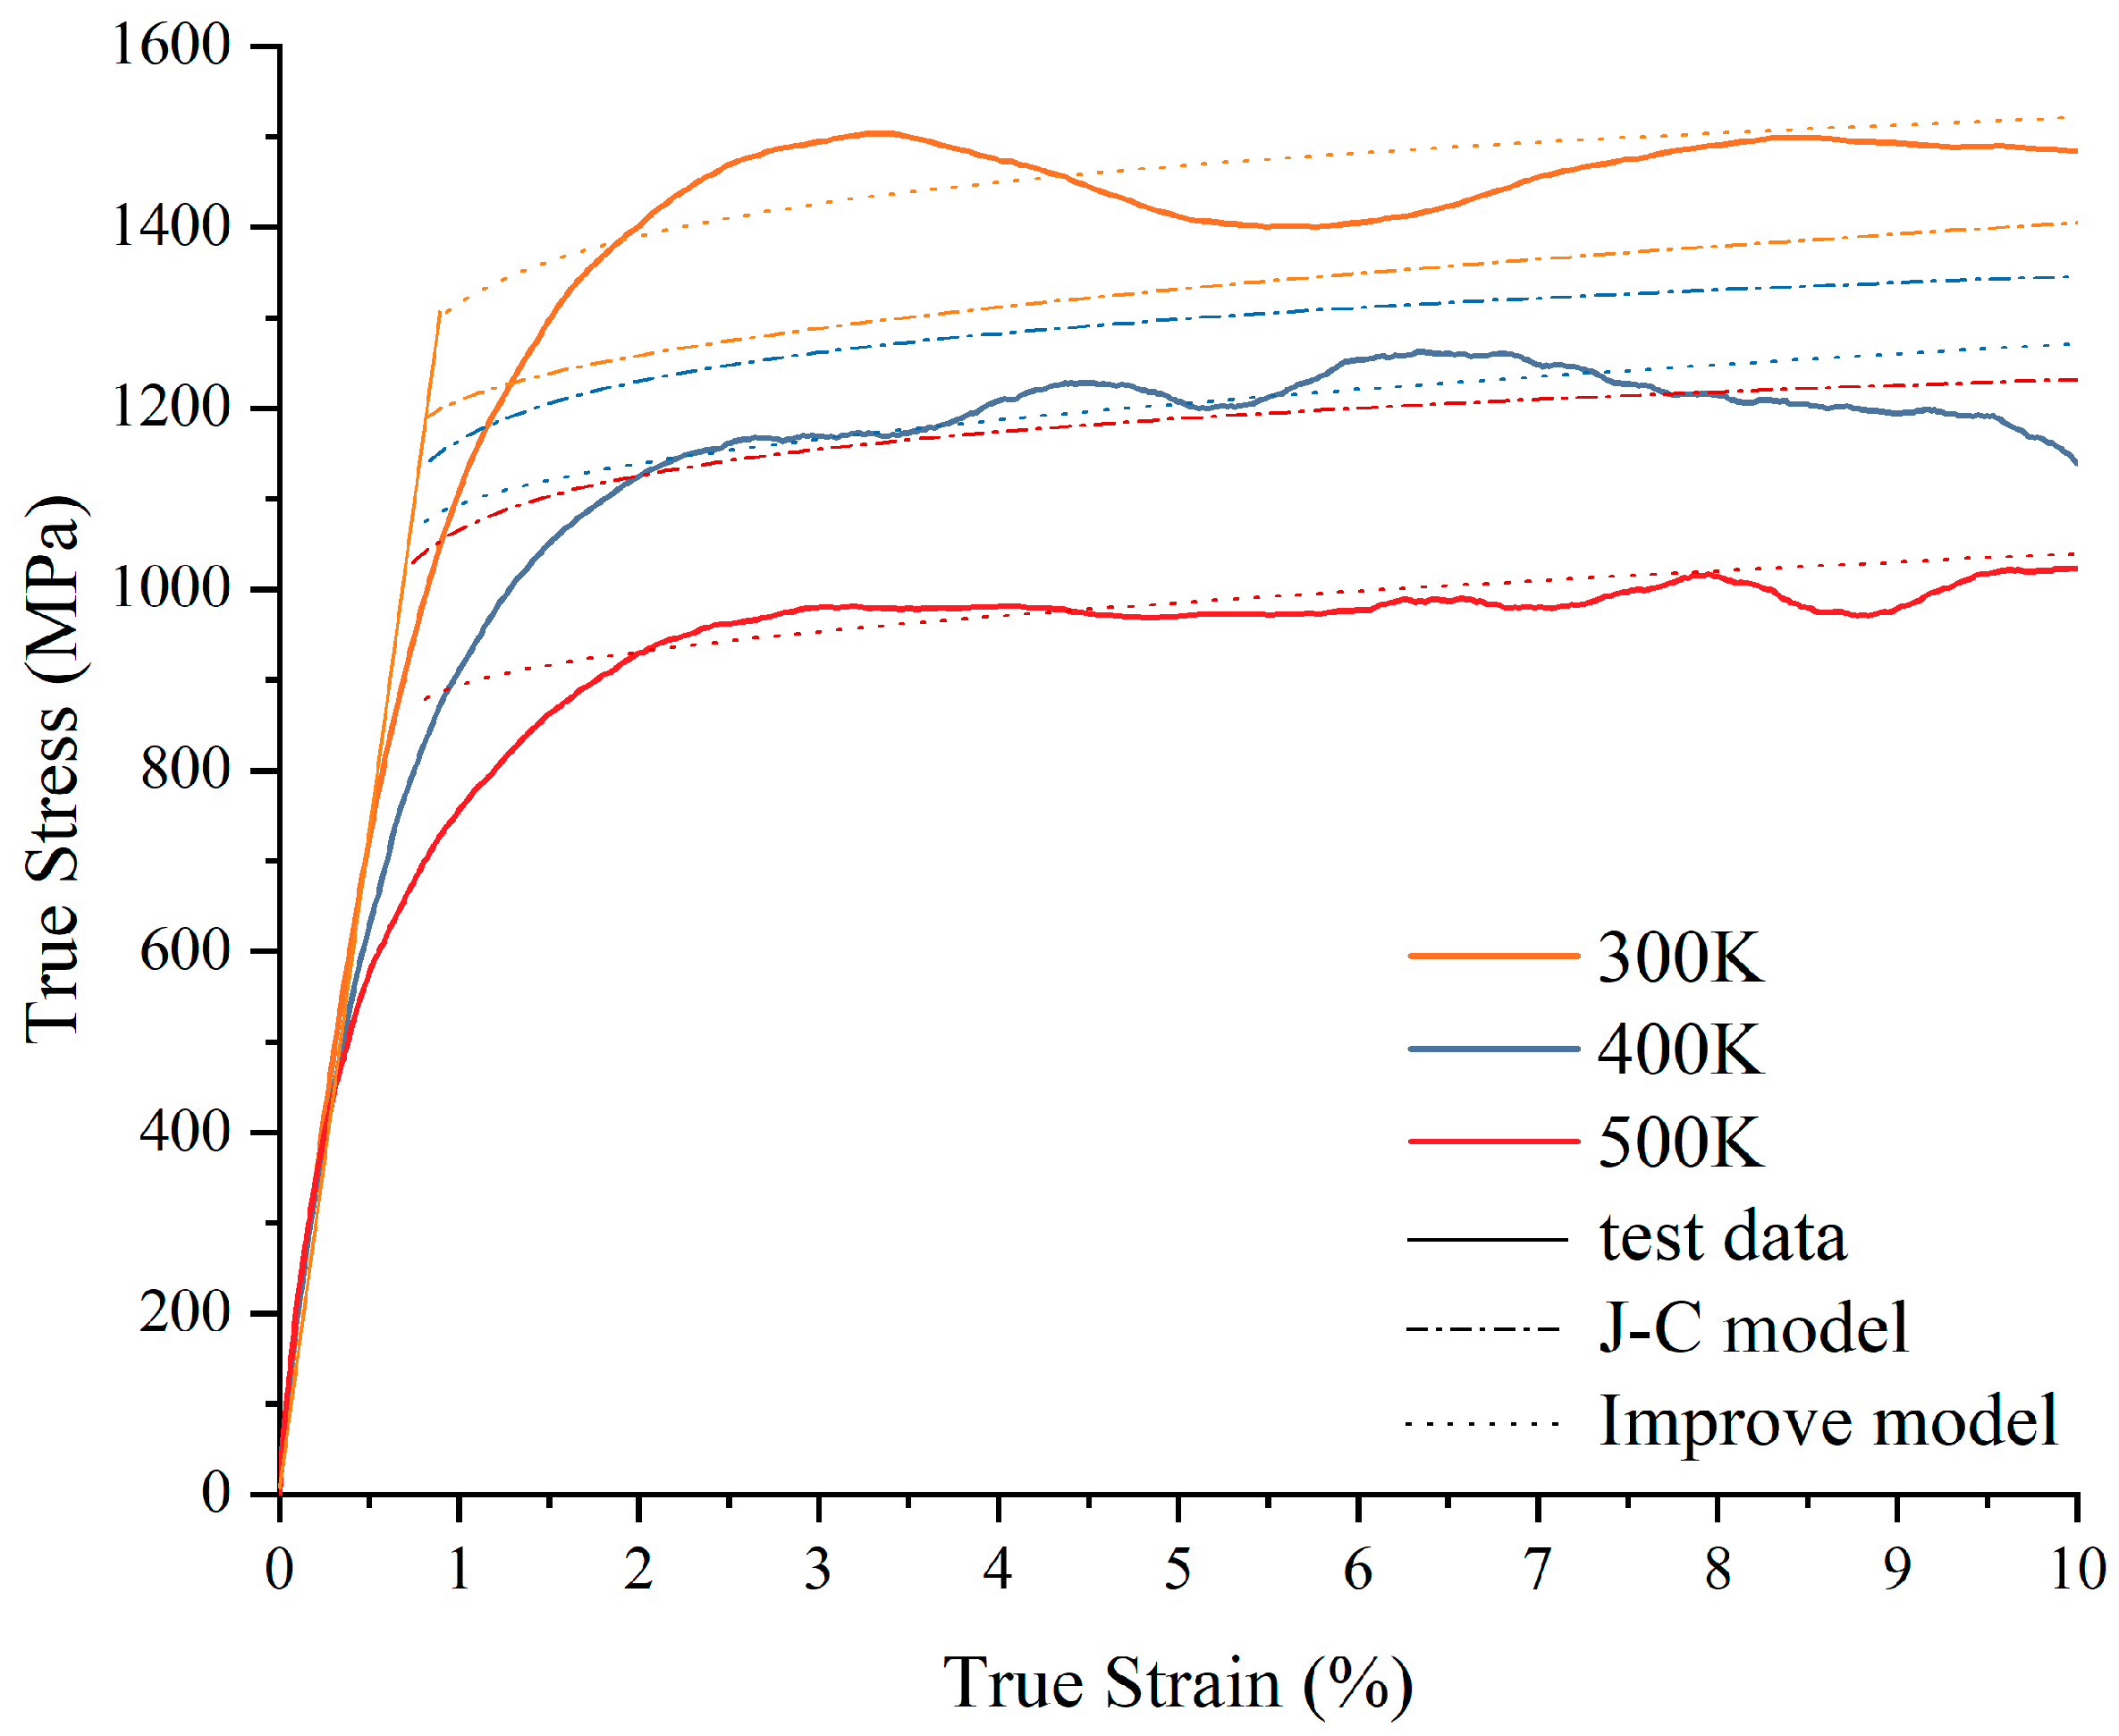
According to the same verification method, they were set at strain rates of 10−3/s, 10−2/s, and 1000/s, and at temperatures of 400 K, 500 K, and 600 K. Finite element software was used to numerically simulate the stretching process, and the predicted values of the improved model and J-C model were compared with the test values, as shown in Figure 12, Figure 13 and Figure 14.
Figure 12.
Comparative verification of the model at a 10−3/s strain rate. The dotted line is the predicted value of the improved model, and the solid line is the predicted value of the J-C model.
Figure 13.
Comparative verification of the model at a 10−2/s strain rate. The dotted line is the predicted value of the improved model, and the solid line is the predicted value of the J-C model.
Figure 14.
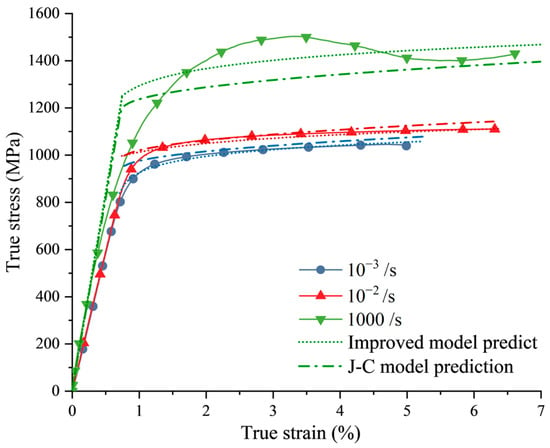
Comparative verification of the model at a 1000/s strain rate. The dotted line is the predicted value of the improved model, and the solid line is the predicted value of the J-C model.
It can be seen that the maximum error of the improved model reduced from 10.5% to 4% at a low strain rate. At high strain rates, the maximum error of the improved model reduced from 23.6% to 5.6%.
By comparing the predicted values of the improved model and the J-C model under different conditions, it can be found that the description of the deviation of the softening effect of the J-C model increases with an increase in temperature. At high strain rates, the prediction value of J-C model also has a large error. The improved model can predict the mechanical response of the TC4 titanium alloy at high temperatures and high strain rates.
5. Conclusions
The mechanical behavior and characteristics of TC4 titanium alloy materials were investigated through normal and high-temperature tensile tests, as well as dynamic Hopkinson impact rod tests. Subsequently, the J-C model was refined in light of these experimental outcomes, and the improved model’s validity was confirmed through numerical simulations, leading us to draw the following conclusions.
- The quasi-static tensile test conducted at room temperature revealed that the TC4 titanium alloy material does not conform to the double logarithmic linear relationship postulated by the J-C model during the initial stages of the onset of plasticity. In this study, the initial stage was corrected by using a single logarithm relative to the fit, which resulted in a more accurate representation of the stress–strain relationship under the quasi-static tensile conditions.
- The mechanical response of metals under a dynamic strain rate is different. The strengthening effect of the strain rate term on the titanium alloy is more accurately described by constructing DSC function and using a quadratic function.
- The tensile test results at different temperatures show that the TC4 titanium alloy has an obvious temperature softening effect. For analyzing the test data, an exponential function is used to describe the softening effect of temperature, and the applicable temperature range of the model is expanded, so that the model is also applicable when the temperature is lower than room temperature.
- The tensile load curve calculated by the finite element method was compared with the stress–strain curve of the material, and the calculated results were in good agreement with the experimental results. The results show that the improved J-C model can accurately reflect the mechanical properties of the TC4 titanium alloy at different strain rates.
Next, we will study the applicability of other metal materials of compressor blades to the improved model and expand the scope of use of the model.
Author Contributions
Conceptualization, Y.L. and X.H.; investigation, Y.L., W.Y. and X.H.; data curation, Z.T.; writing—original draft preparation, W.Y.; writing—review and editing, Y.L., X.H. and Z.T. All authors have read and agreed to the published version of the manuscript.
Funding
This research received no external funding.
Data Availability Statement
The data presented in this study are available on request from the corresponding author. The data are not publicly available due to privacy.
Acknowledgments
The authors wish to thank the reviewers for their careful, unbiased, and constructive suggestions, which led to this revised manuscript.
Conflicts of Interest
The authors declare no conflicts of interest.
Appendix A
Figure A1.
Sample pictures of tensile tests at different temperatures.
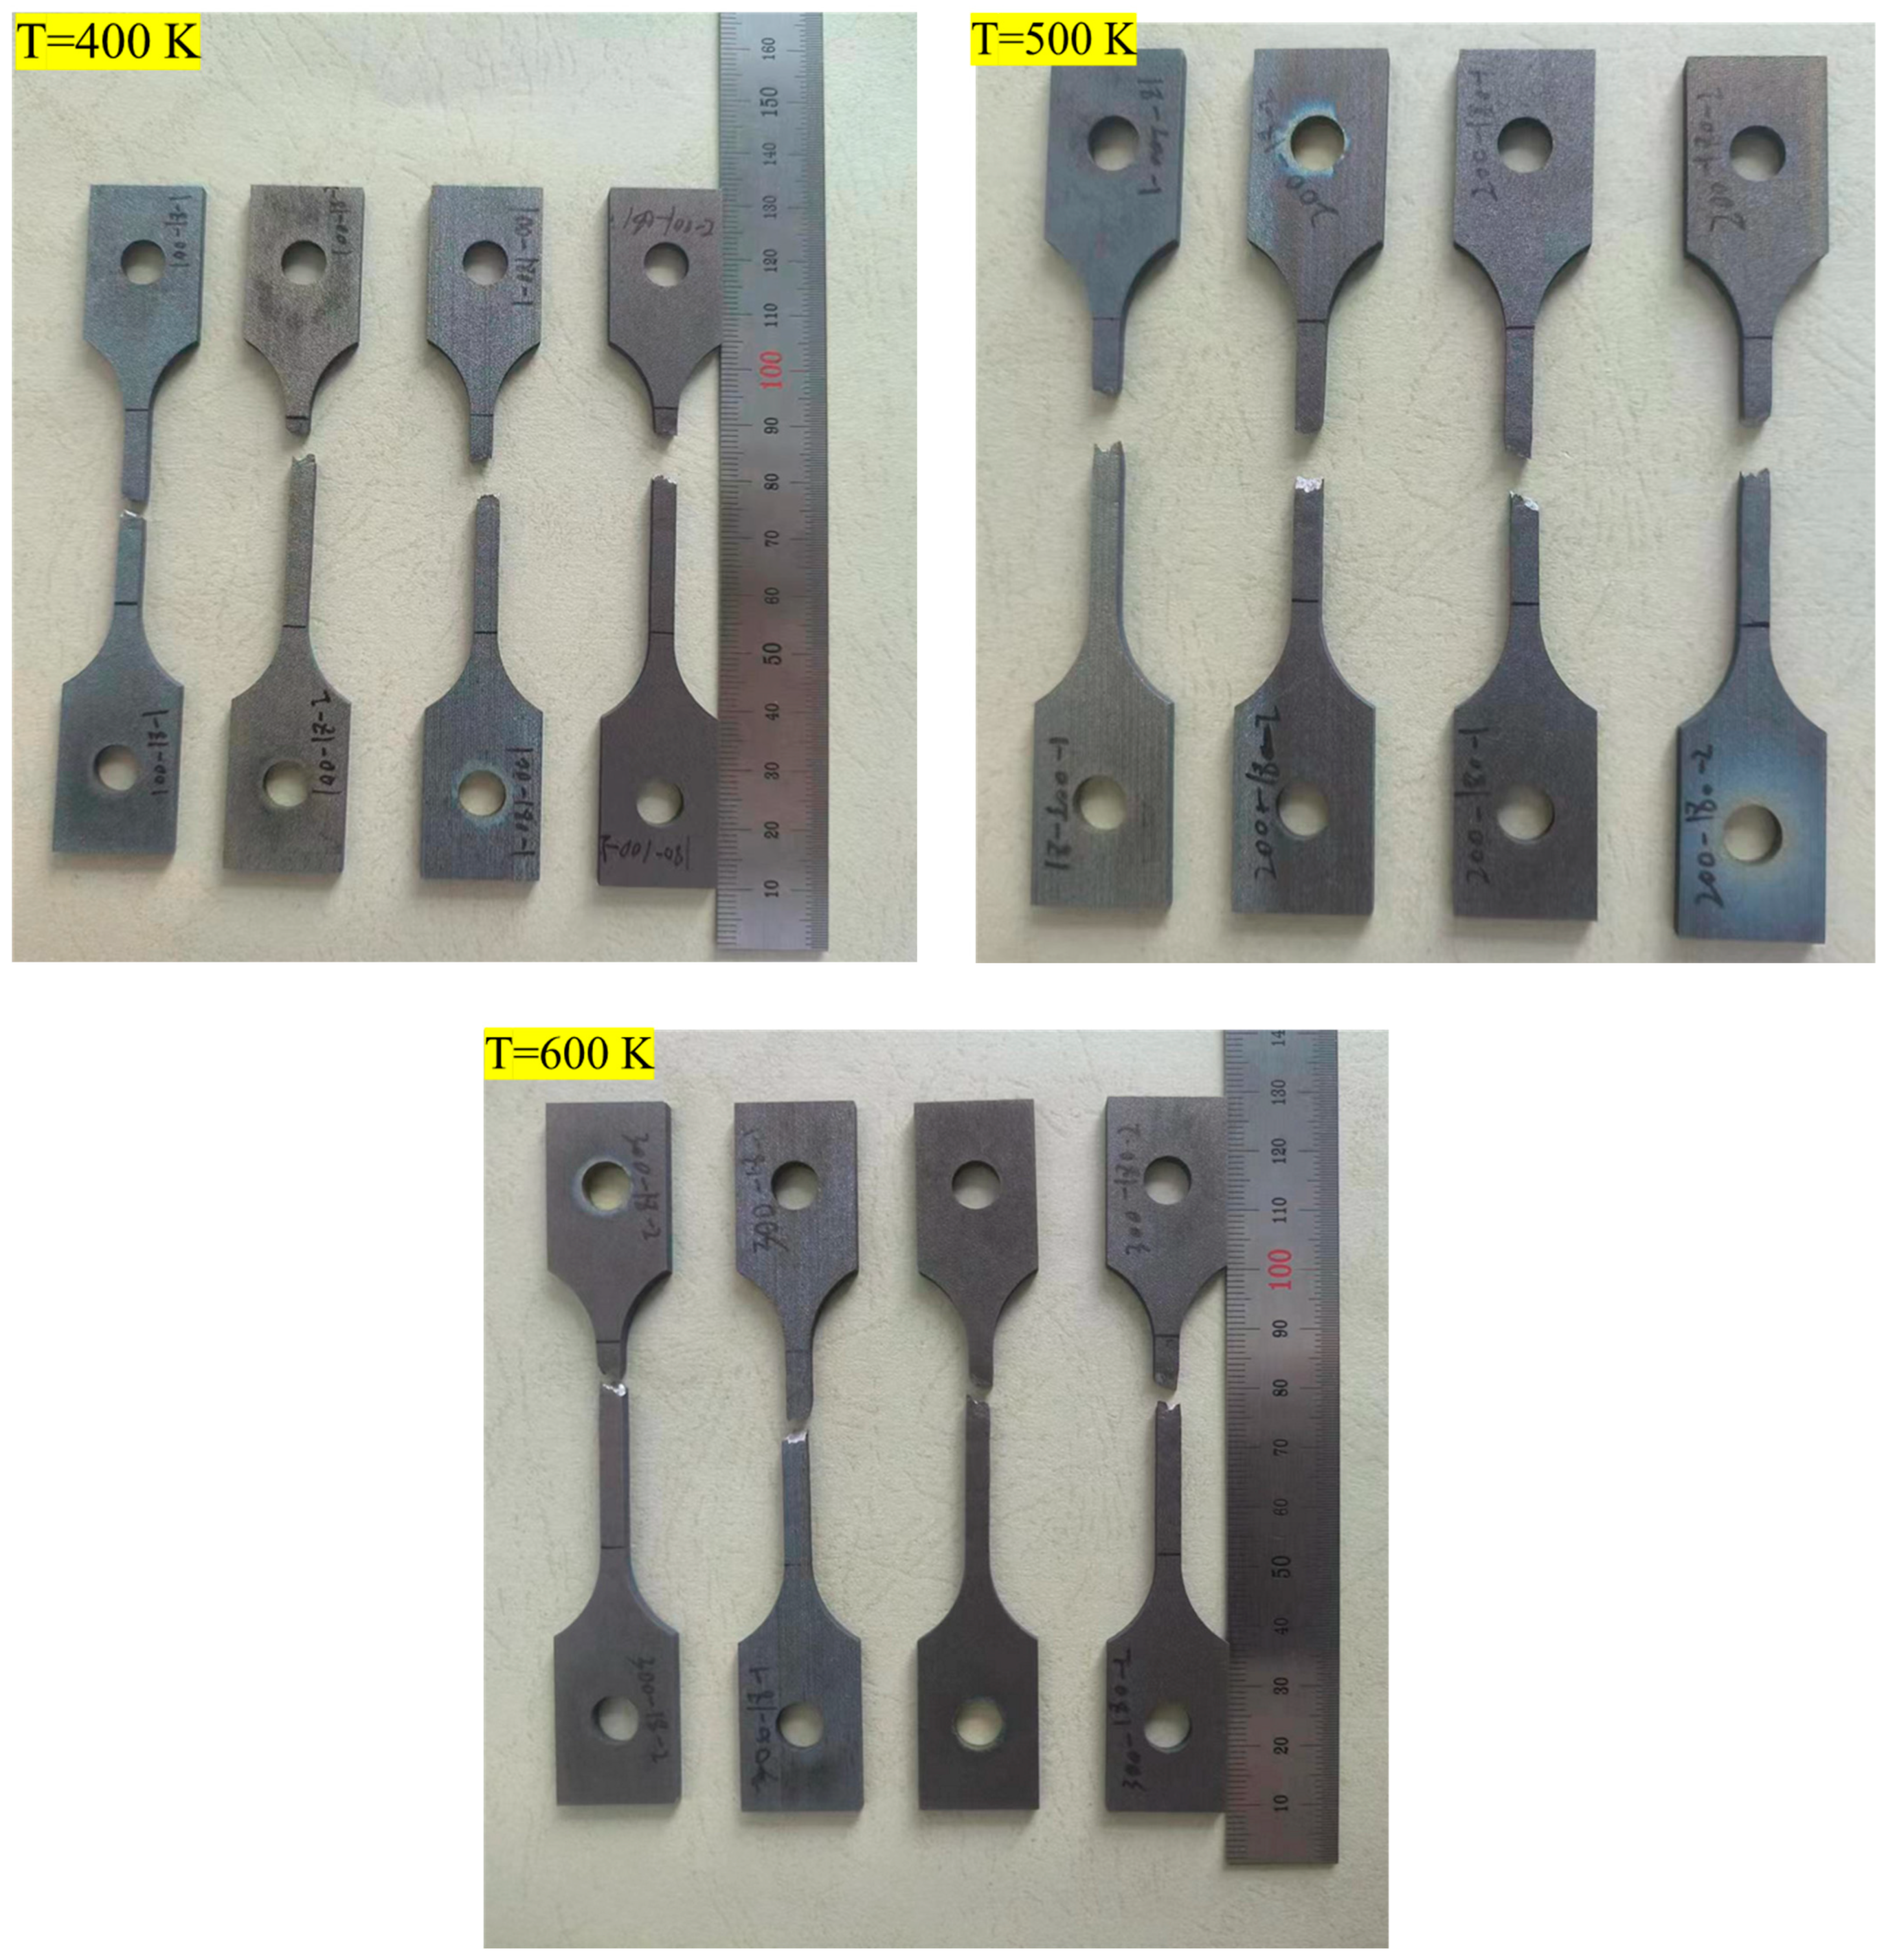
Figure A2.
Examples of the Hopkinson pull bar test at different strain rates.
References
- Li, H.M.; Li, M.Q.; Liu, Y.G.; Liu, H.J. Research Progress in Nanocrystalline Microstructure, Mechanical Properties and Nanocrystallization Mechanism of Titanium Alloys via Surface Mechanical Treatment. Zhongguo Youse Jinshu Xuebao/Chin. J. Nonferrous Met. 2015, 25, 641–651. [Google Scholar] [CrossRef]
- Johnson, G.R.; Cook, W.H. A Constitutive Model and Data for Metals Subjected to Large Strains, High Strain Rates and High Temperatures. Eng. Fract. Mech. 1983, 21, 541–548. [Google Scholar]
- Shokry, A.; Gowid, S.; Mulki, H.; Kharmanda, G. On the Prediction of the Flow Behavior of Metals and Alloys at a Wide Range of Temperatures and Strain Rates Using Johnson-Cook and Modified Johnson-Cook-Based Models: A Review. Materials 2023, 16, 1574. [Google Scholar] [CrossRef] [Scilit] [PubMed]
- Holmquist, T.J.; Templeton, D.W.; Bishnoi, K.D. Constitutive Modeling of Aluminum Nitride for Large Strain, High-Strain Rate, and High-Pressure Applications. Int. J. Impact Eng. 2001, 25, 211–231. [Google Scholar] [CrossRef] [Scilit]
- Raut, N.; Shinde, S.; Yakkundi, V. Determination of Johnson Cook Parameters for Ti-6Al-4 v Grade 5 Experimentally by Using Three Different Methods. Mater. Today Proc. 2021, 44, 1653–1658. [Google Scholar] [CrossRef] [Scilit]
- Zhang, F.; Liu, Z.; Wang, Y.; Mao, P.; Kuang, X.; Zhang, Z.; Ju, Y.; Xu, X. The Modified Temperature Term on Johnson-Cook Constitutive Model of AZ31 Magnesium Alloy with {0002} Texture. J. Magnes. Alloys 2020, 8, 172–183. [Google Scholar] [CrossRef] [Scilit]
- Martins, J.M.P.; Thuillier, S.; Andrade-Campos, A. Calibration of a Modified Johnson-Cook Model Using the Virtual Fields Method and a Heterogeneous Thermo-Mechanical Tensile Test. Int. J. Mech. Sci. 2021, 202–203, 106511. [Google Scholar] [CrossRef] [Scilit]
- Liu, P.; Quan, Y.; Wan, J. Finite Element Simulations of Rail Milling Based on the Modified Johnson-Cook Constitutive Model. J. Phys. Conf. Ser. 2021, 1759, 012025. [Google Scholar] [CrossRef] [Scilit]
- Zhu, S.; Liu, J.; Deng, X. Modification of Strain Rate Strengthening Coefficient for Johnson-Cook Constitutive Model of Ti6Al4V Alloy. Mater. Today Commun. 2021, 26, 102016. [Google Scholar] [CrossRef] [Scilit]
- Wang, Y.; Zeng, X.; Chen, H.; Yang, X.; Wang, F.; Zeng, L. Modified Johnson-Cook Constitutive Model of Metallic Materials under a Wide Range of Temperatures and Strain Rates. Results Phys. 2021, 27, 104498. [Google Scholar] [CrossRef] [Scilit]
- Shokry, A.; Gowid, S.; Kharmanda, G. An Improved Generic Johnson-Cook Model for the Flow Prediction of Different Categories of Alloys at Elevated Temperatures and Dynamic Loading Conditions. Mater. Today Commun. 2021, 27, 102296. [Google Scholar] [CrossRef] [Scilit]
- Shi, L.; Wang, T.; Wang, L.; Liu, E. Research on Johnson-Cook Constitutive Model of γ-TiAl Alloy with Improved Parameters. Materials 2023, 16, 6715. [Google Scholar] [CrossRef] [Scilit]
- Jia, Z.; Guan, B.; Zang, Y.; Wang, Y.; Mu, L. Modified Johnson-Cook Model of Aluminum Alloy 6016-T6 Sheets at Low Dynamic Strain Rates. Mater. Sci. Eng. A 2021, 820, 141565. [Google Scholar] [CrossRef] [Scilit]
- Qian, X.; Peng, X.; Song, Y.; Huang, J.; Wei, Y.; Liu, P.; Mao, X.; Zhang, J.; Wang, L. Dynamic Constitutive Relationship of CuCrZr Alloy Based on Johnson-Cook Model. Nucl. Mater. Energy 2020, 24, 100768. [Google Scholar] [CrossRef] [Scilit]
- Chao, Z.L.; Jiang, L.T.; Chen, G.Q.; Zhang, Q.; Zhang, N.B.; Zhao, Q.Q.; Pang, B.J.; Wu, G.H. A Modified Johnson-Cook Model with Damage Degradation for B4Cp/Al Composites. Compos. Struct. 2022, 282, 115029. [Google Scholar] [CrossRef] [Scilit]
- Korkmaz, M.E.; Günay, M.; Verleysen, P. Investigation of Tensile Johnson-Cook Model Parameters for Nimonic 80A Superalloy. J. Alloys Compd. 2019, 801, 542–549. [Google Scholar] [CrossRef] [Scilit]
- Niu, L.; Cao, M.; Liang, Z.; Han, B.; Zhang, Q. A Modified Johnson-Cook Model Considering Strain Softening of A356 Alloy. Mater. Sci. Eng. A 2020, 789, 139612. [Google Scholar] [CrossRef] [Scilit]
- Wang, X.; Shi, J. Validation of Johnson-Cook Plasticity and Damage Model Using Impact Experiment. Int. J. Impact. Eng. 2013, 60, 67–75. [Google Scholar] [CrossRef] [Scilit]
- Jiang, X.; Ding, J.; Wang, C.; Shiju, E.; Hong, L.; Yao, W.; Wang, H.; Zhou, C.; Yu, W. Parameter identification of Johnson-Cook constitutive model based on genetic algorithm and simulation analysis for 304 stainless steel. Sci. Rep. 2024, 14, 21221. [Google Scholar] [CrossRef] [Scilit]
- He, J.; Chen, F.; Wang, B.; Zhu, L.B. A modified Johnson-Cook model for 10% Cr steel at elevated temperatures and a wide range of strain rates. Mater. Sci. Eng. A 2018, 715, 1–9. [Google Scholar] [CrossRef] [Scilit]
- Alami, M.; Laazizi, A.; Fri, K. Numerical analysis EF of resilience impact test behavior for X80 steel. Int. J. Adv. Manuf. Technol. 2024, 131, 4107–4128. [Google Scholar] [CrossRef] [Scilit]
- Børvik, T.; Hopperstad, O.S.; Berstad, T.; Langseth, M. A computational model of viscoplasticity and ductile damage for impact and penetration. Eur. J. Mech. -A/Solids 2001, 20, 685–712. [Google Scholar] [CrossRef] [Scilit]
- Hu, J.; Chen, X.; Wang, Y.; Yang, C. Mechanical Properties and Flow Stress Constitutive Relationship of Ti–6Al–4V Alloy with Equiaxed Microstructure at Cryogenic Temperatures. Chin. J. Aeronaut. p. 2024, in press.
- Lin, H.; Jin, G.; Zhan, Q.; Wang, G.; Han, J. Mechanical Properties and Constitutive Model of TC4 Titanium Alloy at Cryogenic. J. Mater. Eng. Perform. 2023, 1–13. [Google Scholar] [CrossRef] [Scilit]
- Tian, Z.; Wu, H.; Tan, C.; Dong, H.; Li, M.; Huang, F. Dynamic mechanical properties of TC11 titanium alloys fabricated by wire arc additive manufacturing. Materials 2022, 15, 3917. [Google Scholar] [CrossRef] [Scilit]
- Hu, Y.; Huo, Y.; He, T. Mechanical behavior and microstructure evolution of TC4 alloy during high temperature plastic deformation. Procedia Manuf. 2020, 50, 642–646. [Google Scholar] [CrossRef] [Scilit]
- Wen, D.; Zhang, M.; Xiong, Y.; Wang, W.; Li, J. Constitutive modeling hot tensile behavior of Ti6Al4V alloy by considering phase transformation and damage mechanisms. Mater. Sci. Eng. A 2024, 890, 145887. [Google Scholar] [CrossRef] [Scilit]
- Li, C.M.; Huang, L.; Li, C.L.; Hui, S.X.; Yu, Y.; Zhao, M.J.; Guo, S.Q.; Li, J.J. Research progress on hot deformation behavior of high-strength β titanium alloy: Flow behavior and constitutive model. Rare Met. 2022, 41, 1434–1455. [Google Scholar] [CrossRef] [Scilit]
- Editorial Committee of the Chinese Aeronautical Materials Manual. China Aeronautical Materials Manual; Standards Press of China: Beijing, China, 2001; Volume 4. [Google Scholar]
- GB/T 228.2-2015; Metallic Materials—Tensile Test: High Temperature Test Methods. Standards Press of China: Beijing, China, 2015.
- GJB 8374-2015; Methods for Dynamic Tensile Test of Metallic Materials. General Equipment Department Equipment Publishing and Distribution Department: Beijing, China, 2015.

Disclaimer/Publisher’s Note: The statements, opinions and data contained in all publications are solely those of the individual author(s) and contributor(s) and not of MDPI and/or the editor(s). MDPI and/or the editor(s) disclaim responsibility for any injury to people or property resulting from any ideas, methods, instructions or products referred to in the content. |
© 2024 by the authors. Licensee MDPI, Basel, Switzerland. This article is an open access article distributed under the terms and conditions of the Creative Commons Attribution (CC BY) license (https://creativecommons.org/licenses/by/4.0/).