Article

Current and Projected Caregiver Support Ratios Across Europe and Italy

Faculty of Education, Università Cattolica del Sacro Cuore, Largo A. Gemelli 1, 20123 Milano, Italy
Societies 2026, 16(5), 136; https://doi.org/10.3390/soc16050136
Submission received: 31 December 2025 / Revised: 7 April 2026 / Accepted: 21 April 2026 / Published: 23 April 2026

Abstract

Growth in the elderly population will inevitably increase the demand for care and assistance, which must be matched by a sufficient number of individuals capable of providing the care and assistance required. This study aims to estimate the present and future caregiver support ratio (CSR) at the national level across Europe and at the Italian subnational level. Italy was selected due to its higher proportion of elderly citizens compared with other EU countries. The CSR is defined as the number of potential caregivers aged 45–64 years (the age range most commonly involved in caregiving) per citizen aged 80 and over (the most likely to require long-term caregiving). Data were obtained from Eurostat for the EU-level analysis, whereas those pertaining to Italy were sourced from the Italian National Institute of Statistics. CSR projections were made for the decades spanning 2030 to 2080. The findings show that the ratio of potential caregivers aged 45–64 to individuals aged 80 or over will steadily decline over the coming decades, implicating challenges for gerontological social policies. The results reveal variation in the CSR for the 27 European countries—with a decline from 5:1 in 2025 to 2:1 by 2050—and across the 20 Italian regions, as well as differences in the projected trends in CSR variations over the medium (until 2050) and long term (until 2080). Technology may offer possible solutions to address some of the challenges associated with the aging demographic.

1. Introduction

In addition to a shift in the European Union’s demographics towards older ages, life expectancy is also increasing [1,2]. These changes will pose significant challenges for European society, necessitating the enhancement of health, welfare, and long-term care (LTC) systems [3]. Moreover, increases in the proportion of elderly people are projected to continue, making this an issue of growing concern. Greater resources will be required to address the challenges posed by an aging population, which include day-to-day care, health care support, and assistance in creating home safety.
The extant literature has mainly focused on formal ‘visible’ resources requiring investment [4,5,6], whereas informal ‘invisible’ resources, such as informal caregiving, have received much less research attention, except regarding associated difficulties such as burnout. Informal caregiving involves aspects such as ‘(1) routine activities of daily living (e.g., bathing, toileting and eating); (2) instrumental activities of daily living (e.g., housework, transportation and managing finances); (3) companionship and emotional support; and (4) medical and nursing tasks, such as injections and colostomy care’ [7] (p. 1906).
The availability of informal caregivers is strictly related to the population’s structure: if the size of the population of young people decreases while that of the elderly increases, then the number of people available to care for the most elderly in society will decline. This relationship is captured by the caregiver support ratio (CSR), a proxy measure of the number of potentially available caregivers [8].
The aim of this paper was to estimate the CSR for the coming decades at the national level across Europe and at the Italian subnational level to address gaps in the literature on recent demographic trends.
The article is divided into six sections. Section two presents a review of the literature on informal caregiving at the European level. Section three presents the research questions and methodology. Section four presents the study’s results, and section five discusses its findings. The final section presents some concluding reflections.

2. Literature Review

According to the findings in the literature—derived from official survey statistics—the role of the caregiver is predominantly carried out by women, who commonly form part of the so-called ‘sandwich generation’ of caregivers. The term ‘sandwich generation’ was coined to describe ‘the middle-aged generation who have both elderly parents and dependent children’ [9] (p. 3), who thus have to balance the demands of supporting their dependent children whilst simultaneously taking care of their aging parents [9]. With that said, the term is broad, and other definitions are also present in the literature [10].
Research conducted in the United States [9,11,12,13,14] and Europe [15,16] has attempted to determine the number of individuals engaged in informal caregiving. However, as emphasized by one research group investigating the prevalence of informal caregivers in Europe, exact figures are difficult to determine due to differences in the definitions and data sources being used and the absence of an official register for collecting information on caregivers [15]. They stated that ‘there seems to be some convergence for the US towards a prevalence rate of informal caregivers reaching approximately 17% of the entire adult population, which drops to 7% among those aged 50 years or older’ [15] (p. 4). Whereas the authors, considering European data collected in 2016 and 2019 for different age groups of caregivers, found that the proportion of individuals acting as informal caregivers appeared to increase with age, the overall prevalence of adult informal caregiving was 17.0%, as seen in the US. However, among the over-50s, the rate ranged from 13.5 to 25.6% (data based on surveys conducted in 2016, from 2004 to 2013, and in 2017) [15].
Figures from the European Union Labour Force Survey (EU-LFS),1 referring to data collected in 2018, showed that more than 12 million people in the EU-28 (aged at least 15) were responsible for caring for a partner or relative who was sick, elderly, or disabled. For an example of a non-EU member country (Norway) that is nonetheless geographically part of Europe, see [17].
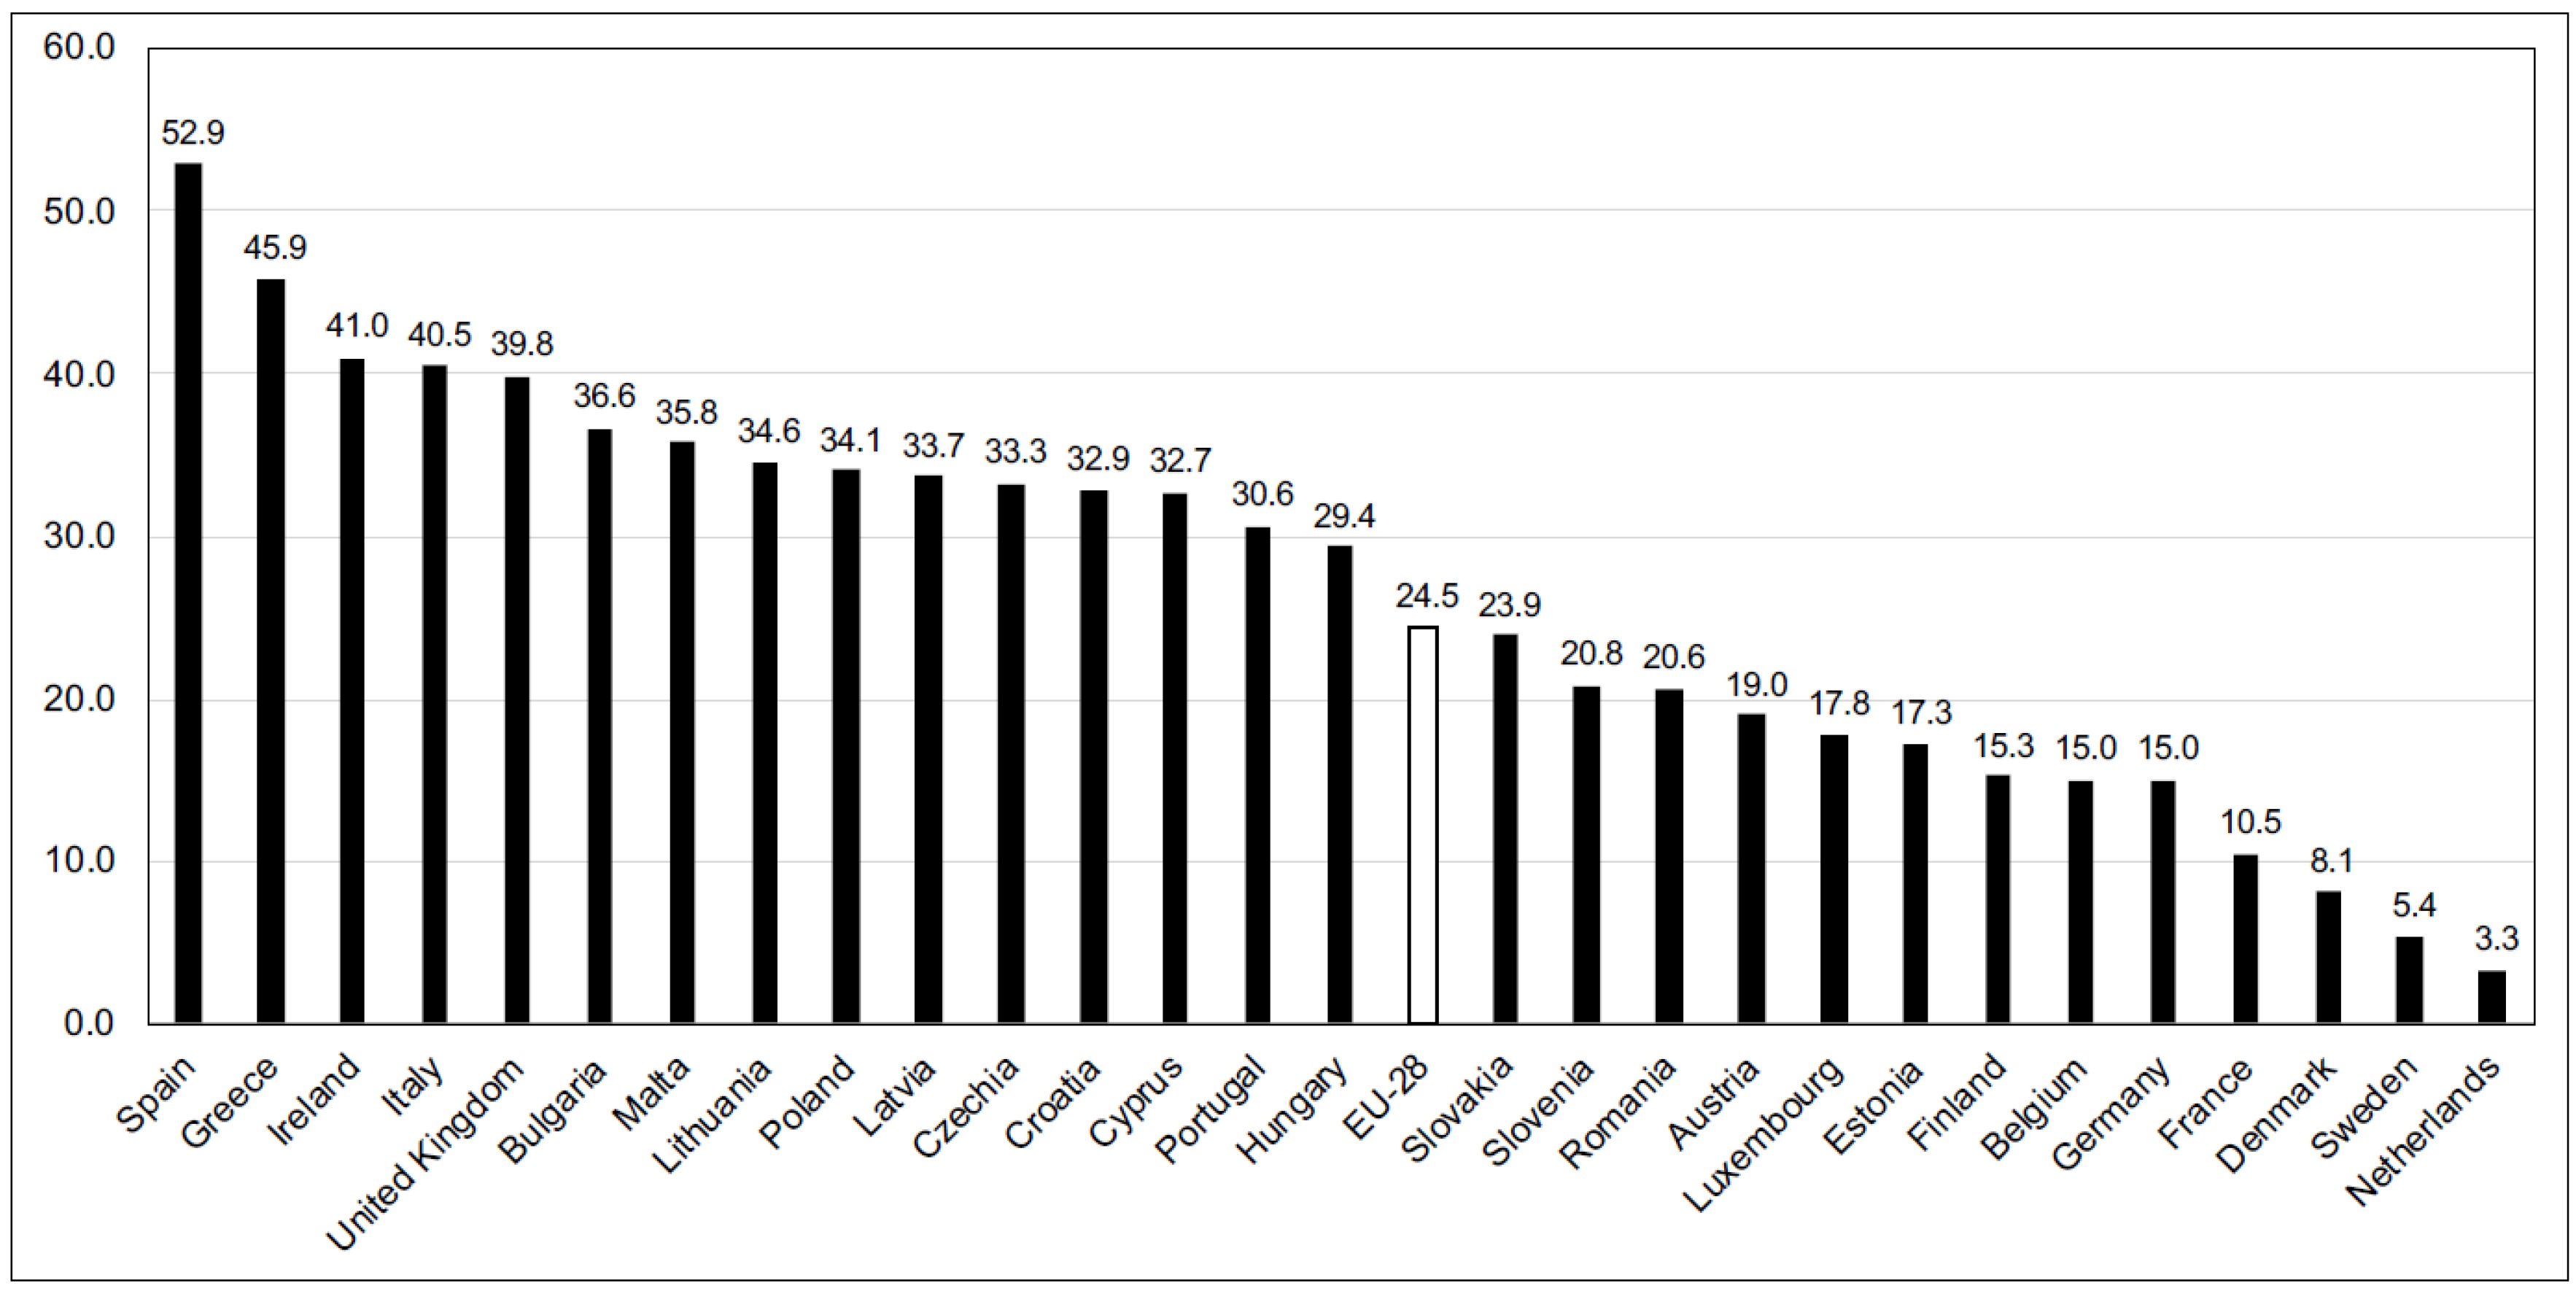
The data from the 2019 Gender Equality Index also confirm that women tend to take on more active care roles than men. According to the EIGE calculation, women will shoulder more responsibilities when it comes to providing informal LTC several (if not seven) days a week. According to EU data collected in 2016, women account for 62% of all individuals providing informal LTC to older people or those with activity limitations. According to 2016 Eurostat data2 (represented in Figure 1), the percentages of people providing informal care or assistance for twenty hours or more per week are highest in Spain, Greece, Ireland, Italy, and the United Kingdom. The percentages of people dedicating this amount of time to informal care were lowest in the Netherlands, Sweden, and Denmark (3.3, 5.4, and 8.1% resp.), all of which were way below the EU mean value (24.5%). Fifteen countries had figures that stood above the EU-28 mean value, whereas thirteen were below it.
Figure 1. Percentage of persons providing informal care or assistance twenty hours or more per week (year 2016). Source: personal elaboration from Eurostat data. Note: EU-28 represents the EU mean.
Societies 16 00136 g001
The total number of hours dedicated to caregiving can be analyzed in relation to various factors, such as population structure (specifically, the proportion of young and elderly people) and the availability of public services supporting the youngest and oldest members of society [18,19].
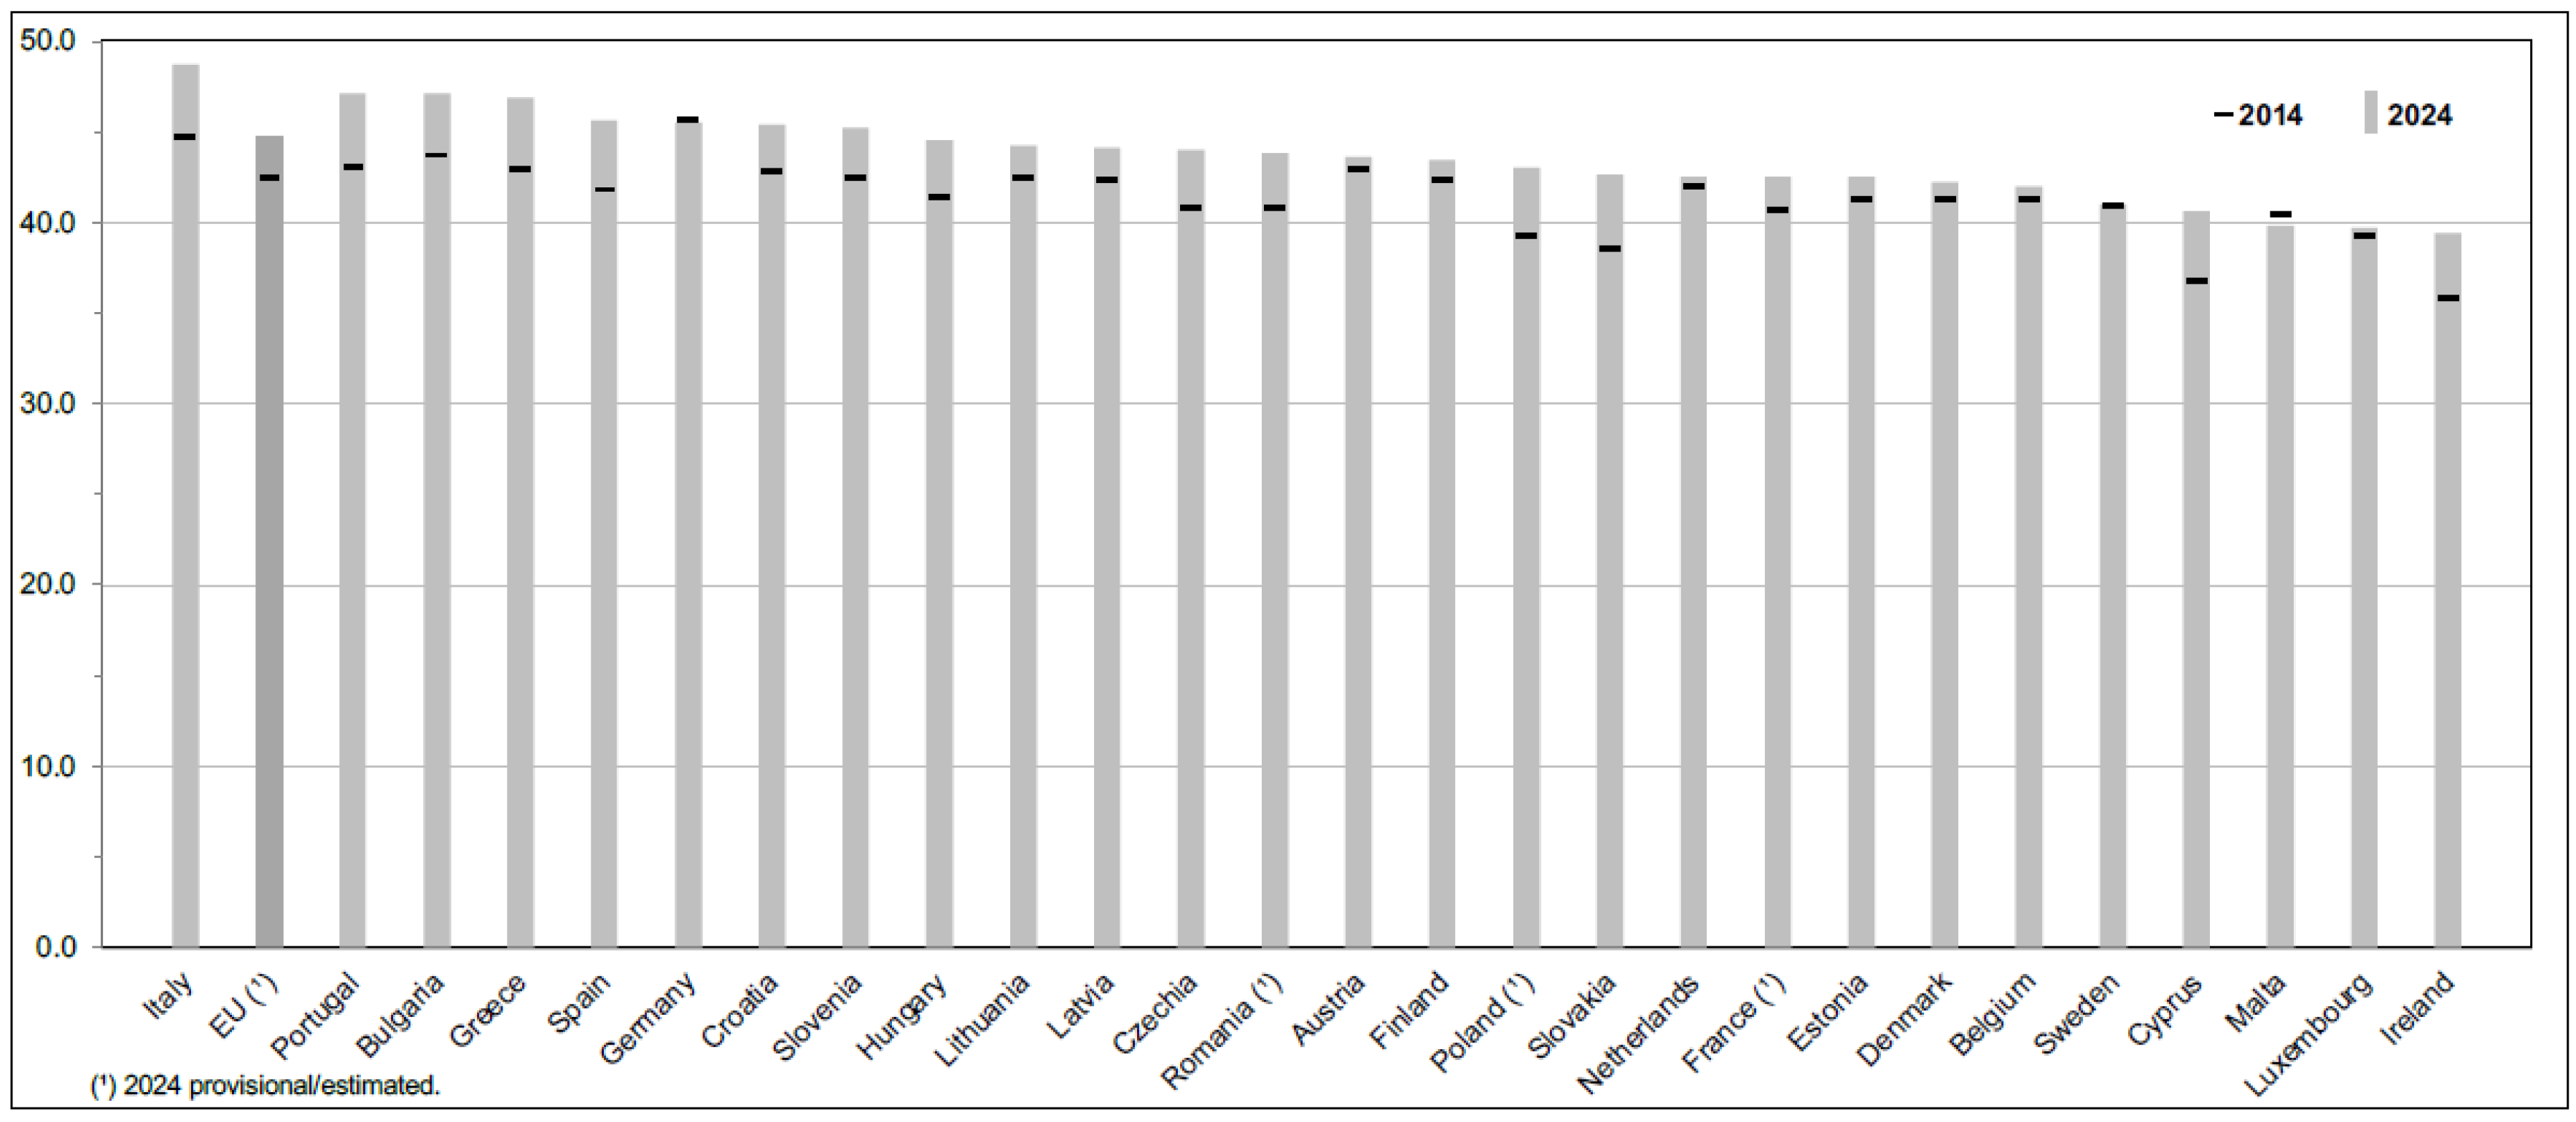
Official statistics report the median age of the EU population to be 42.4 years in 2014, rising to 44.7 years in 2024 (Figure 2; data refer to 1 January in both years). The median age among EU member states ranged from 39.4 years in Ireland to 48.7 years in Italy, suggesting comparatively young and elderly populations in these countries, respectively. Italy is one of the countries in which the population’s mean age has increased the most over the last ten years, reaching 48.7 years in 2024 (versus 44.7 years in 2014)3. Indeed, the high proportion of older people in Italy makes the country a distinct case [20]. The National Institute of Statistics (ISTAT) data relating to caregivers in this country indicate there to be approximately 7 million informal caregivers [21,22]. The population aged over 65 years old is predicted to increase from 24.0% to 34.5% by 2050, while that over 85 years is predicted to increase from 3.8% to 7.2%. Consequently, there will be an increase in the demand for formal and informal resources, including both health and social care, for the aging population [23].
From the caregiver’s perspective, having to provide care for others often comes with significant consequences. The care load obviously depends on the needs of the person being cared for. For example, caregivers may face significant practical challenges and experience psychological stress [24], worsening health [25], and financial problems—especially those unable to work due to the time their caregiving role requires [26]—and a general negative impact on their well-being [16,27]. Additionally, caregivers may have less time to invest in maintaining social ties, resulting in a decrease in their social capital [28].
Figure 2. Median age of the population in EU countries in 2014 and 2024 (on 1 January). Source: personal elaboration of Eurostat data. Note: the label ‘EU’ indicates the EU mean.
Societies 16 00136 g002
The level of support that informal carers receive from public policies also varies between European countries and is thus another factor impacting these individuals. Although informal care is often viewed as a means to alleviate the demands placed on public care services, it constitutes a weighty economic cost for the caregivers themselves. Only a few countries have implemented cash benefit schemes to compensate for lost employment income [29]. Many researchers have estimated the cost of providing informal care for older adults: for example, in the USA, it was estimated to correspond to 1.36–3.95% of US GDP in the year 2012 [30]; in Australia, it was estimated at 0.80–4.00% of Australia’s GDP [31]; and in Europe, estimates place it at 3.63% of the European GDP [32]. The study by researchers from the Universities of Groningen and Vrije Universiteit Amsterdam analyzed the costs of informal care in the Netherlands, comparing it with other countries [33]. According to the authors, the annual social cost of informal care in 2019 was equivalent to 2.15–3.71% of the Dutch GDP, depending on the method of valuation used. The figure was comparable to the amount spent by the government on LTC in the same year, and more than half (53–57%) of these costs were associated with female carers—mainly due (57–88% of that sum) to their necessity to reduce time at work in order to fulfil their informal care duties. Indeed, cessation of work was found to be the primary cause of indirect expenditures borne by the government, accounting for 12–17% overall.
Considering the data on the aging population and the economic value produced by informal caregivers, through the care they provide, as well as changes in family composition [34,35], and the increase in demand for LTC, it is important to identify possible future scenarios relating to caregivers, in particular, with regard to their projected availability.
One study focused on the future need for informal caregivers, considering the expected increase in the number of older adults [8]. The authors followed the methodology reported in [36] to identify the future availability of caregivers, which entailed looking at the ratio of the adult population aged 45–64 years to those aged 80 years and above (the CSR). A previous attempt to calculate the CSR was made in 1976 [37]. The empirical analysis by Ribeiro and colleagues considered the European context and covered the period from 2011 to 2050 [8]. The authors concluded that the CSR ‘is projected to shrink from six potential caregivers per older person (as in 2011) to just four per person in 2030′ [8] (p. 5). Across all time periods included in their analysis, the Mediterranean nations—Spain, Portugal, Greece, and Italy—presented the lowest CSR. Therefore, it is particularly important to recognize the challenges these countries will face in meeting the increase in demand for formal and informal care, as well as the investment required to support informal family carers [8].
Considering the limited data available in the literature at the European level, more research is required to extend our knowledge to more recent years and consider longer projections. The aim of the present paper was to fill this gap. It analyzes the trends in CSR at both the European level and in a specific European country, namely, Italy—one of the EU countries characterized by a high median age [20].
The research questions addressed were the following:
-
What are the current CSR values (as of 1 January 2025) for the EU-27 countries?
-
Given that Italy had the highest median age in Europe in 2024, that family composition is undergoing considerable transformation [38] and that the twenty Italian regions exhibit marked differences in social care and healthcare policies [39], welfare services [40], and social capital [41], are CSR estimates for the Italian regions expected to change over the medium and long term (until 2050 and 2080, respectively)?
These research questions will be investigated in the following sections.

3. Materials and Methods

3.1. Data Sources

The data used to estimate the CSR for the 27 countries in the EU were sourced from the Eurostat Database (access data: 29 September 2025): database ‘EUROPOO2023—Population projection at national level (2022–2100)’, file ‘Population on 1 January by age, sex and type of projection’ reference year 2022 (Baseline projection)4. The EUROPOP2023 database comprises the most recent long-term population projections for 30 countries, spanning the period 2022 to 2100. Population projections are hypothetical scenarios designed to illustrate potential changes in population size and structure based on assumptions about birth (‘fertility’) and death rates and net migration. The datasets comprise the baseline population predictions and five ‘sensitivity analyses’, as detailed on the Eurostat website. They are (i) no migration—which assumes net migration to be zero for each year within the 2023–2100 time horizon; (ii) lower migration—which assumes net migration to be lower due to a 33% reduction in non-EU immigration flows for each year within the 2023–2100 time horizon; (iii) higher migration—which assumes net migration to be higher due to a 33% increase in non-EU immigration flows for each year within the 2023–2100 time horizon; (iv) lower fertility—which assumes fertility rates to be 20% lower than the baseline assumptions for each year within the 2023–2100 time horizon; and (v) lower mortality—which assumes mortality rates to be lower, implying a 2-year increase in life expectancy at birth by 2070 compared with baseline assumptions.
The assumptions for the year 2022 were consistent with those employed in the baseline projections for each of the five sensitivity tests mentioned above (i.e., i–v). The reason for this can be attributed to a combination of projections, information from national agencies, and observed statistics for that year (i.e., the beneficiaries of temporary protections at the end of December 2022)5. The data and derived indicators require meticulous consideration because (as underlined in the methodology section of the Eurostat website) ‘The projections should not be considered as forecasts. They show what would happen to the resulting population structure if the set of assumptions are held constant over the entire time horizon under consideration; in other words, the projections are ‘what-if’ scenarios that track population developments under a set of assumptions6.’
The data downloaded for each country indicate population sizes for the age ranges 45–64 years and 80 years and over.
The regional data used to estimate the CSR for the twenty Italian regions were downloaded from the thematic platform ‘Demo’ (‘Demographics in numbers’; access data: 12 September 2025) for the project ‘Population and household projections—Base 1 January 2024’ of the National Statistical Program, promoted by the ISTAT7. The project’s objective is to predict future population sizes and composition by taking into account the inherent uncertainties surrounding demographic behavior (fertility, survival, and migration). As was the case with the data relating to the population projections of European countries, it is again imperative to exercise caution when interpreting data pertaining to the future developments of the regional population, particularly in the context of long-term projections. As the temporal distance from the initial point increases, the reliability of demographic projections decreases.
For the present study, data were downloaded for each of the twenty Italian regions, which were then summed to generate those for the total population.

3.2. Calculation Procedures

The projected CRS was then calculated for each decade up to 2080—the maximum timespan considering the data available at both the EU country level and the Italian regional level. It is important to bear in mind that longer projections have a greater potential for inaccuracy, making those beyond 2080 less meaningful. The values for both levels (national and regional) were calculated for every ten years, in accordance with previous studies [8,36].
The CSR for 2025 was calculated for the EU-27 at the national level, and in the case of Italy, at the regional level by dividing the number of persons (as of 1 January) aged 45–64 years old by the number of persons aged 80 or more. CSR projections were calculated for the decades spanning 2030–2080.
The line charts (Figure 1, Figure 2, Figure 4, and Figure 7) were produced using Excel, version 16.101.1 (Microsoft Corporation, 2025), whereas the maps (Figure 3, Figure 5, Figure 6, and Figure 8) were generated using R Statistical Software (version 4.2.2; [42]). The shapefile data related to the EU countries were obtained via the ‘Eurostat’ R package (v4.0.0; [43,44]), while data for the Italian regions came from ISTAT8.

4. Results

4.1. Present (2025) and Projected Trends in CSR (Until 2080) Across the EU-27

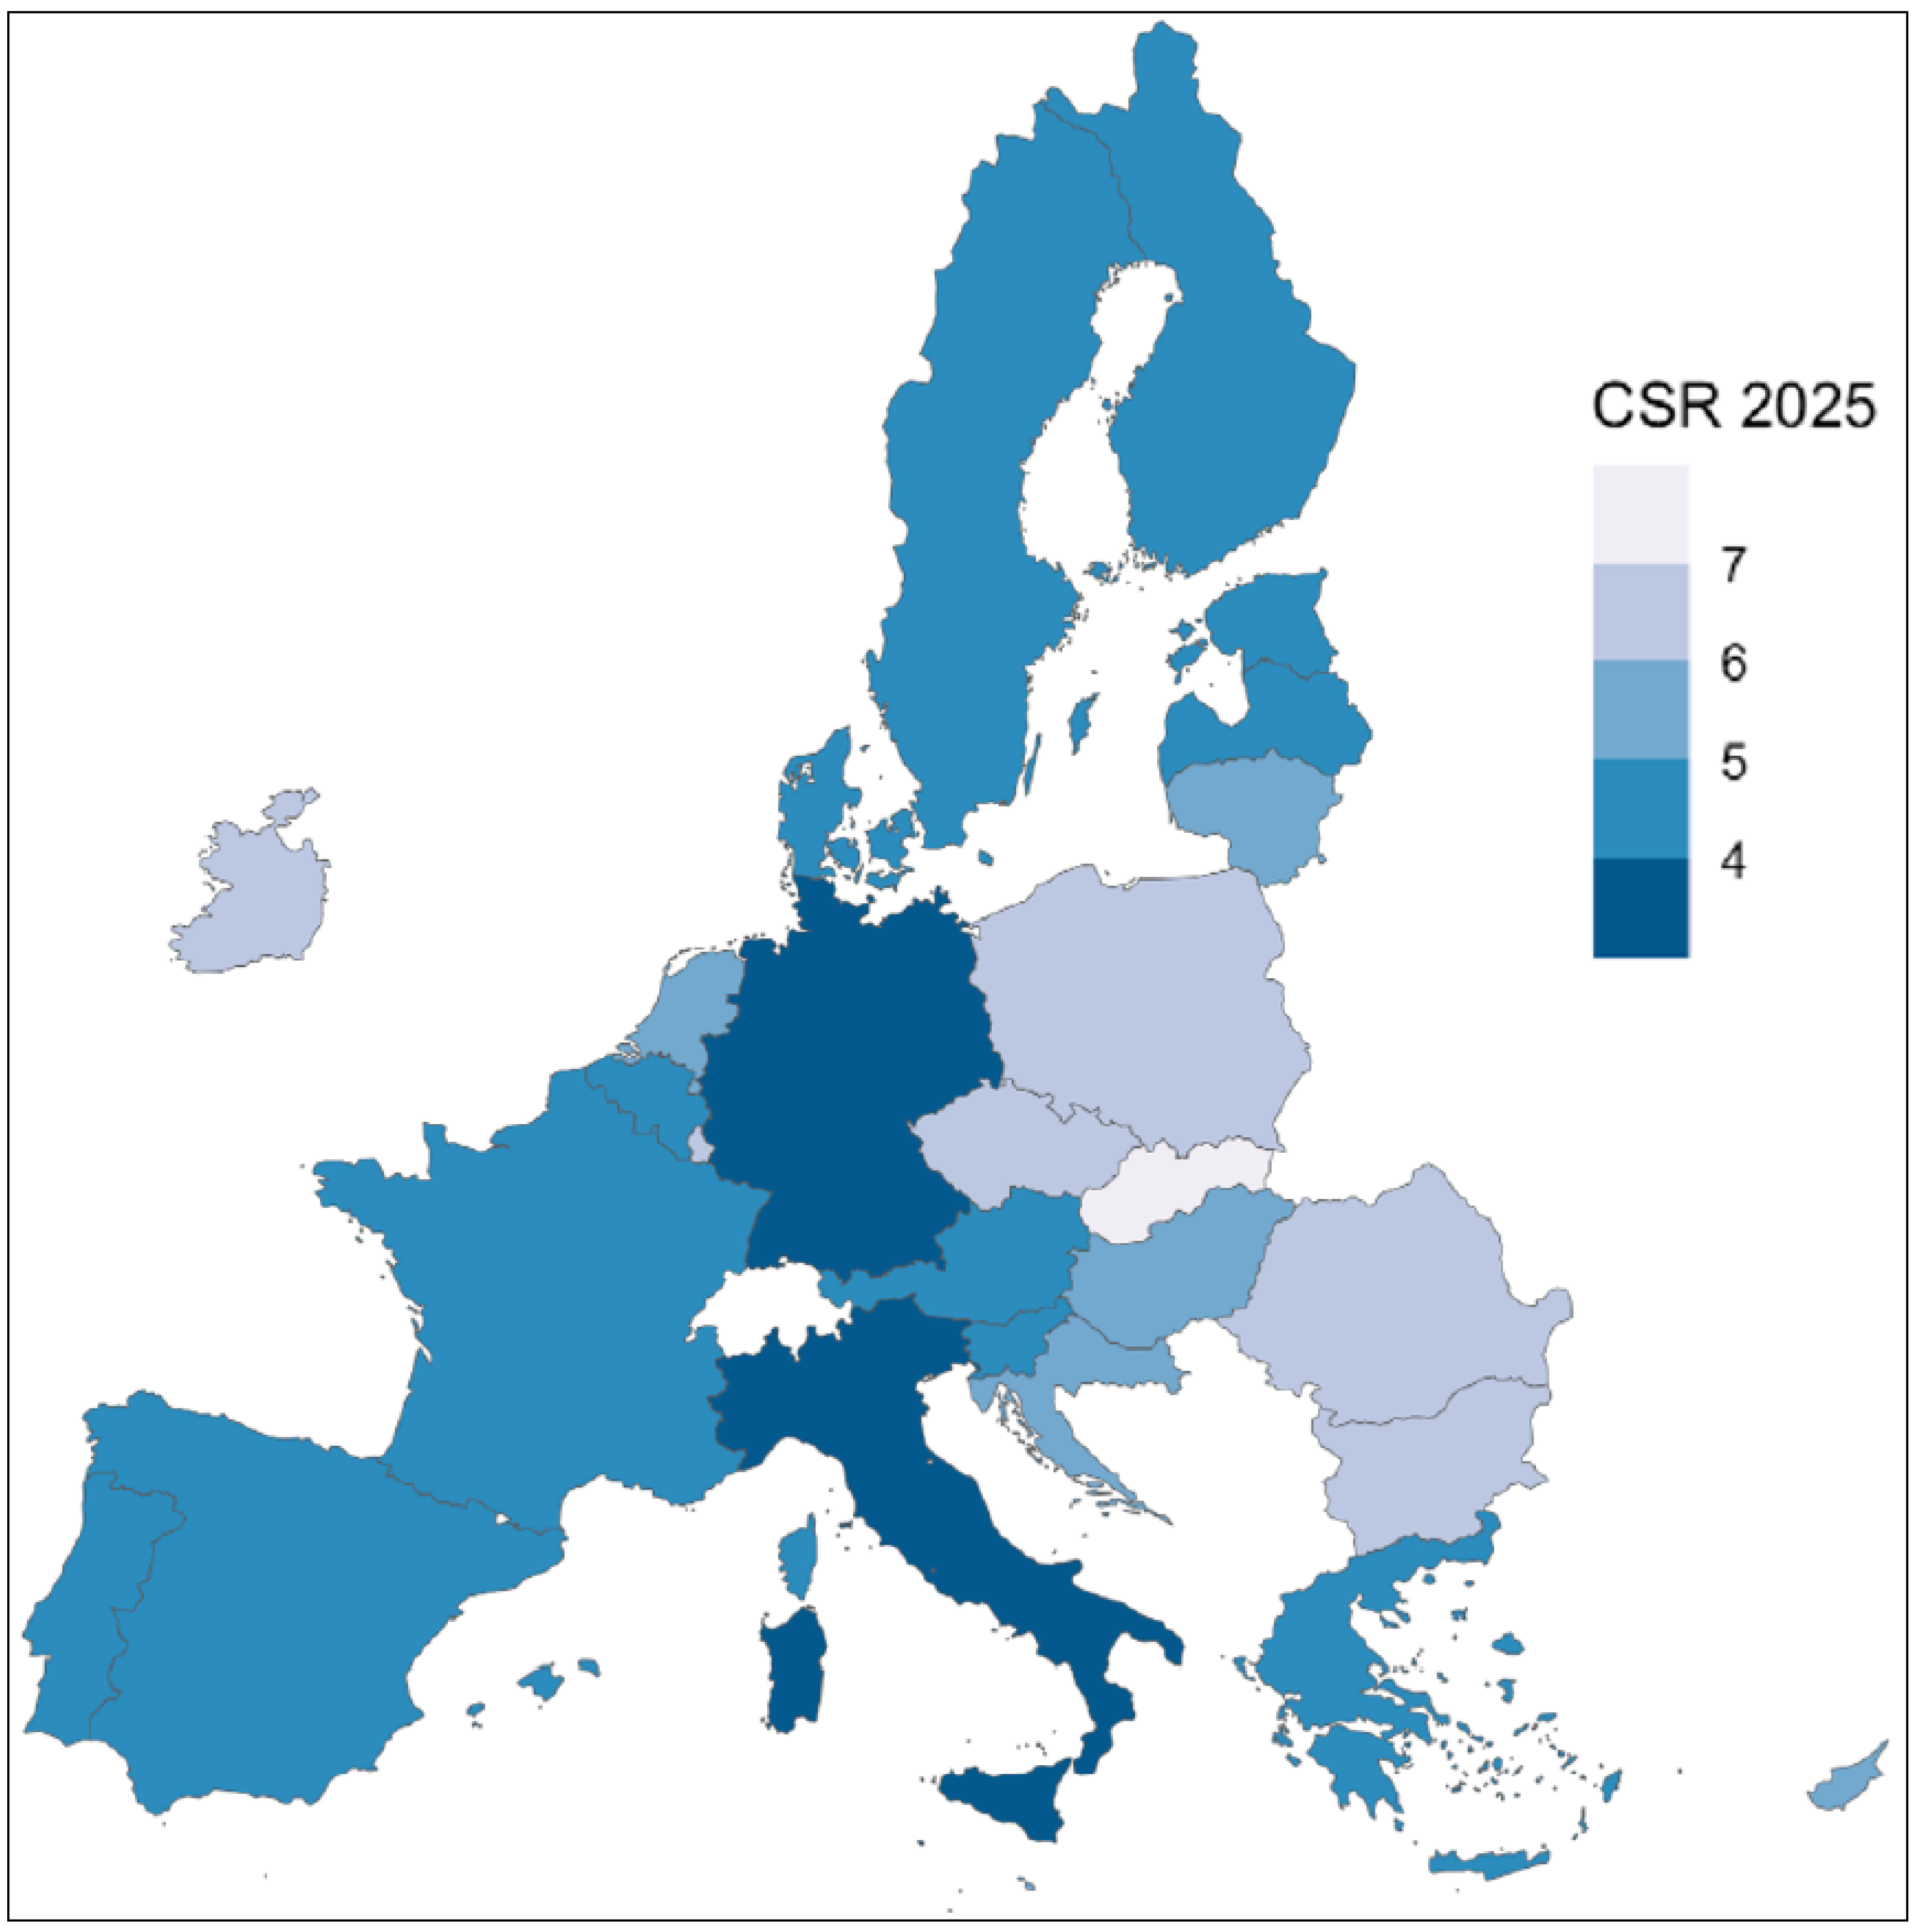
The color-coded map in Figure 3 provides a visual representation of the actual CSRs for the EU-27 (as of 1 January 2025). Individual values are reported in Table 1. Germany and Italy had the lowest values (3.84 and 3.98, respectively), indicating the fewest people in the 45–64 years age range in relation to those aged 80 or over compared with other countries. Slovakia had the highest value (7.68). Other countries characterized by a high CSR were Luxembourg (6.82) and Ireland (6.68), followed by Romania (6.36), Poland (6.21), the Czech Republic (6.05), and Bulgaria (6.01).
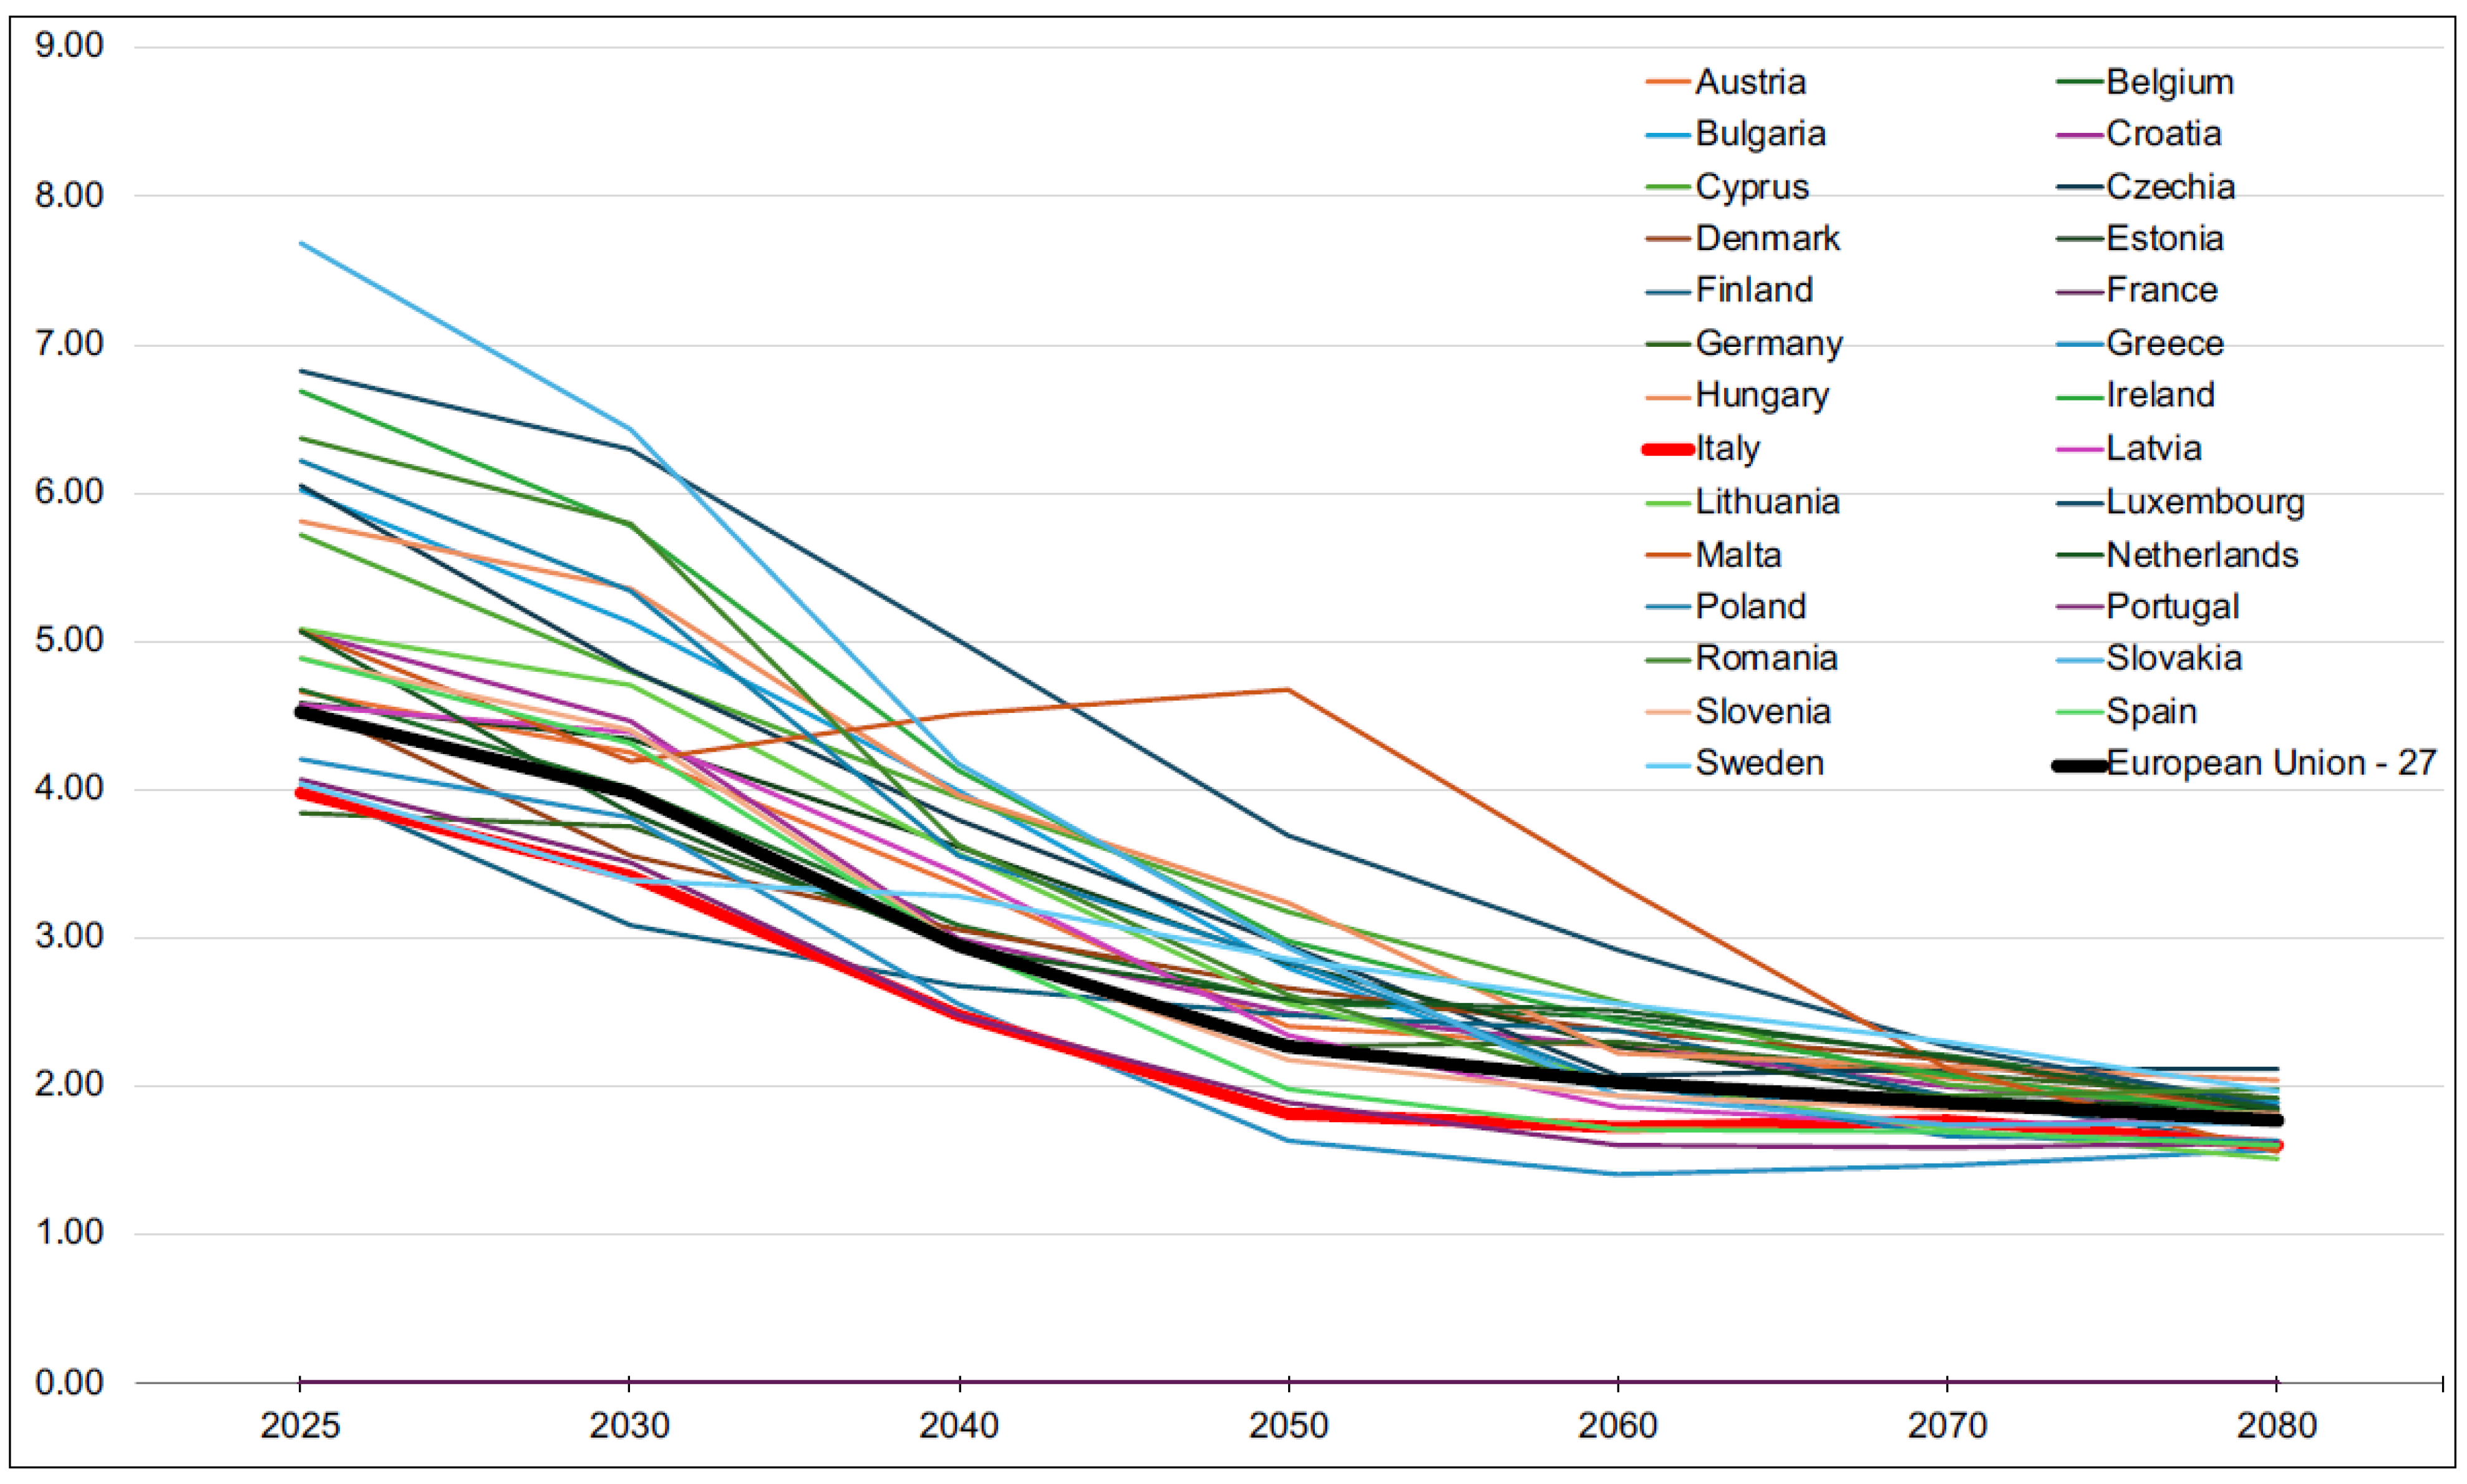
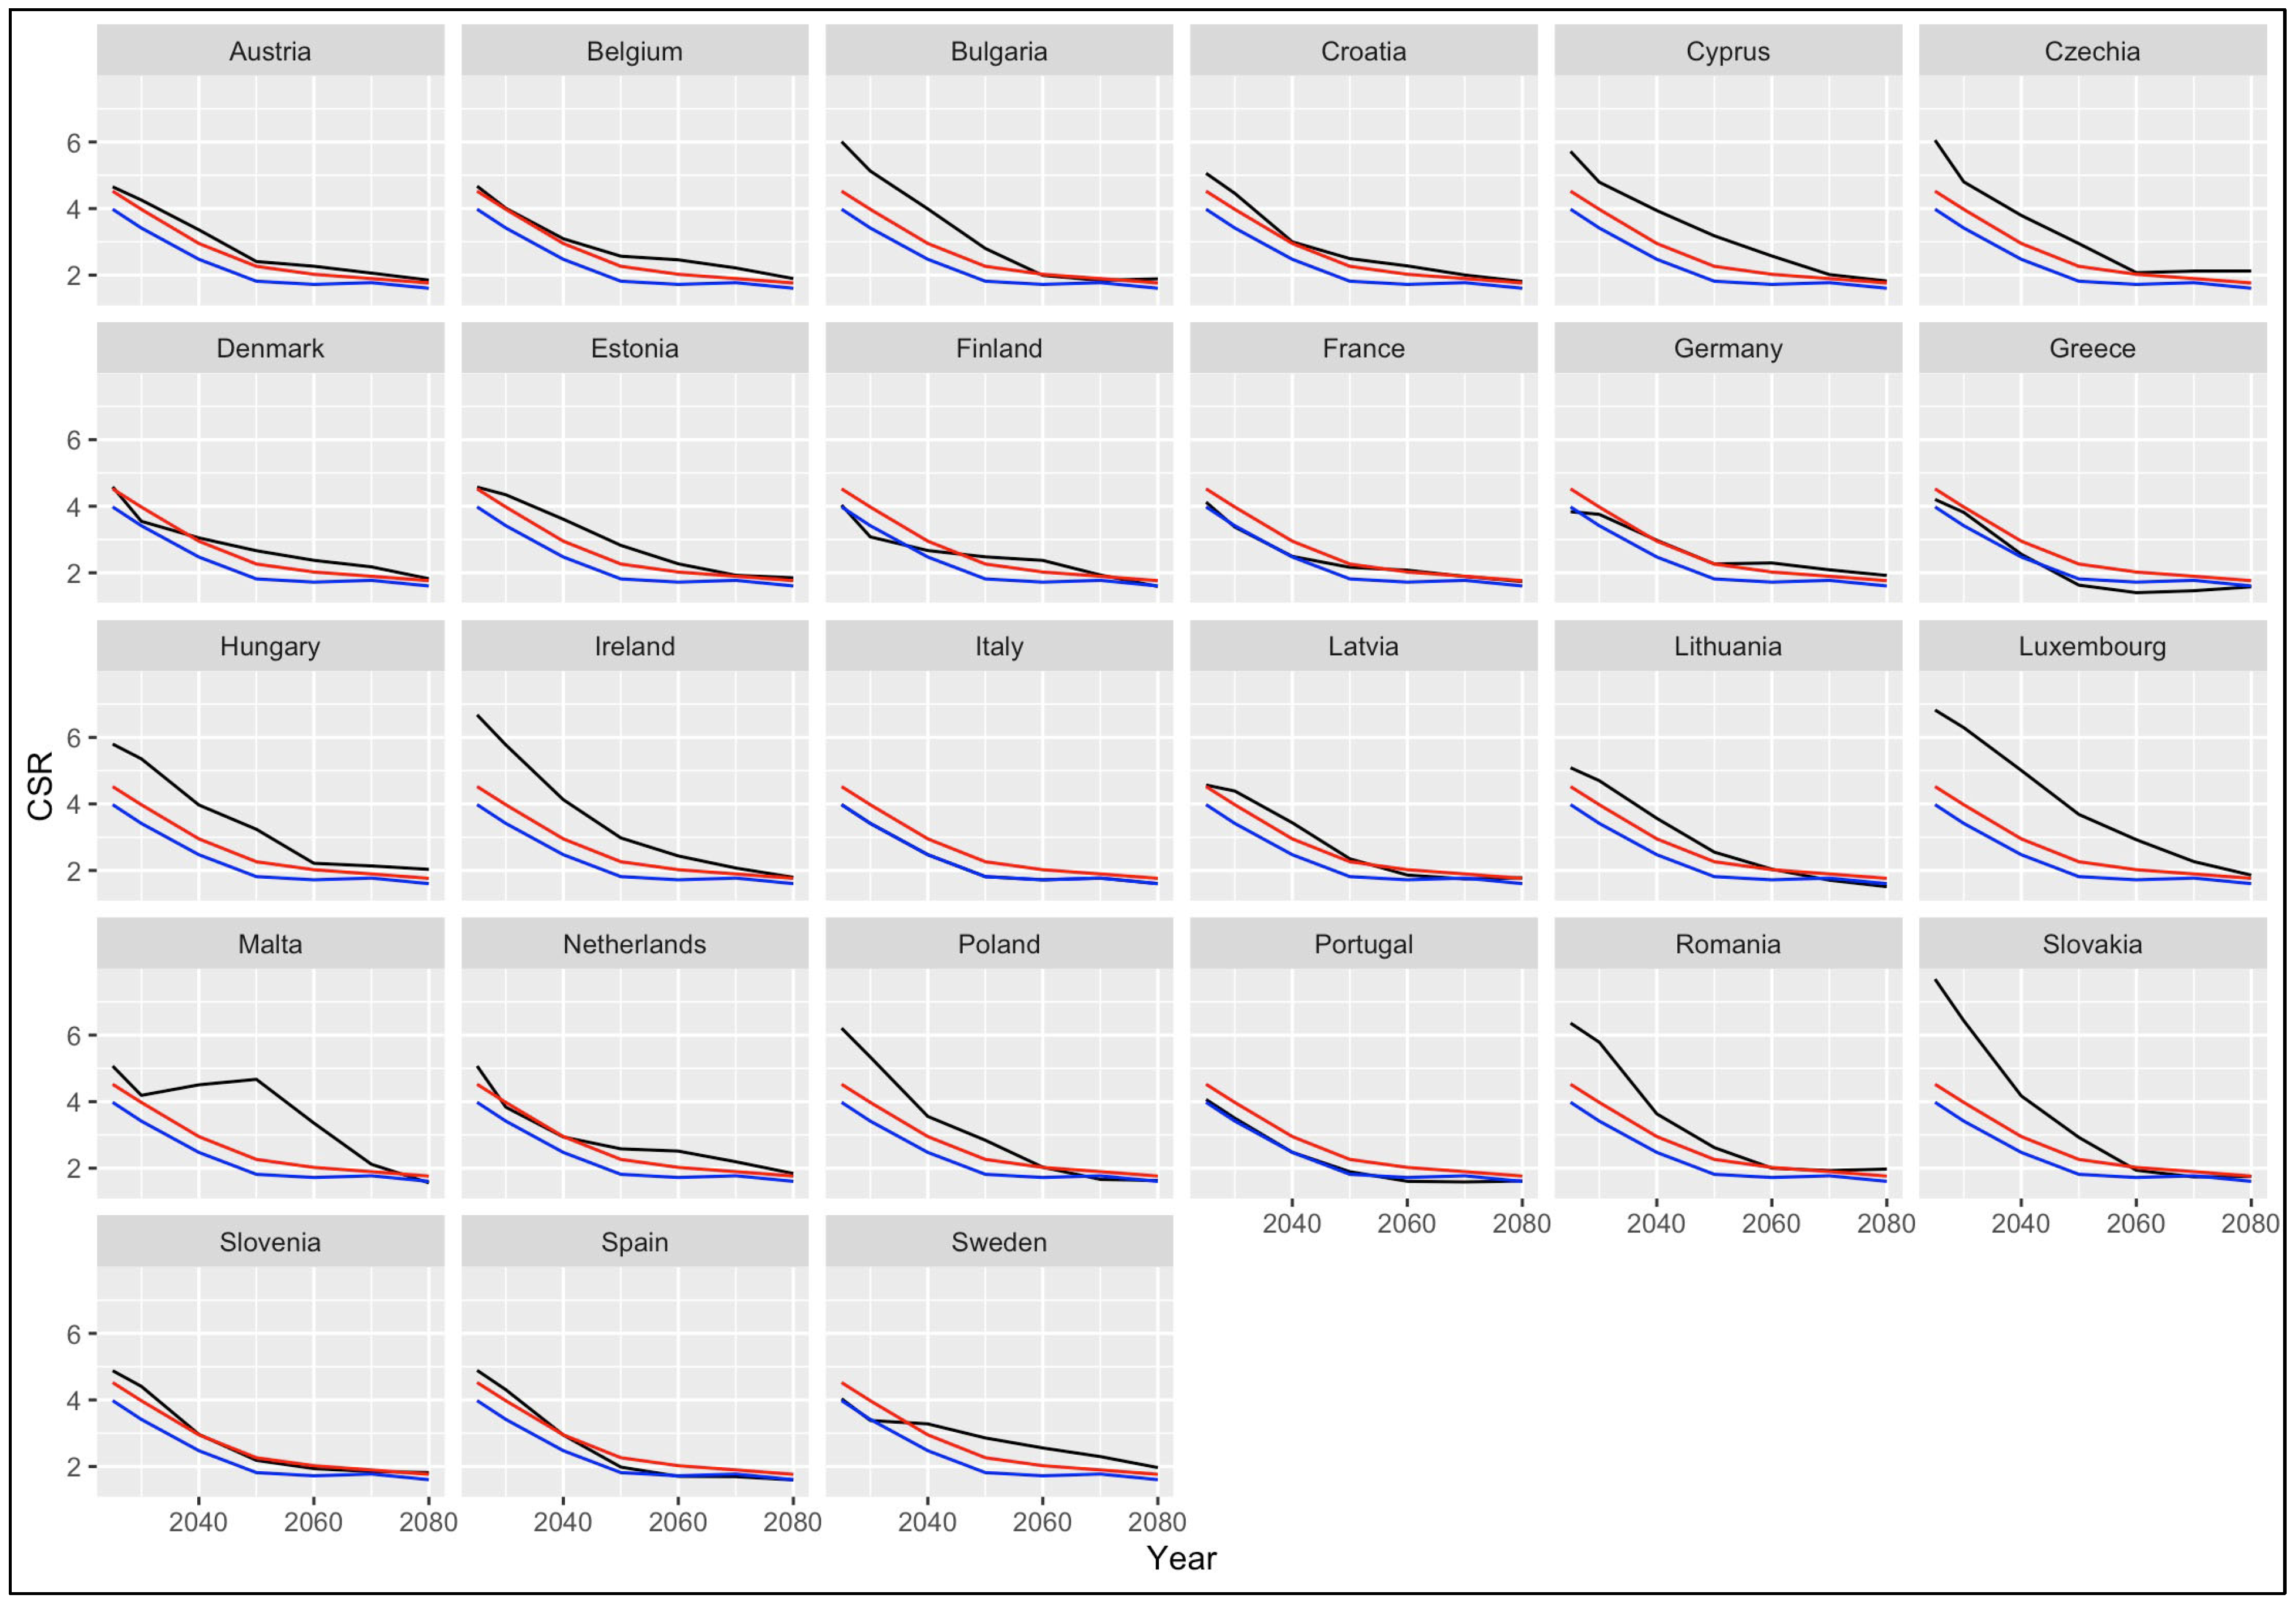
Figure 4 shows the CSR projections until the year 2080 for the EU-27 plus the EU mean (bold red line). The individual projections per country are shown in Figure 5 (arranged in alphabetical order), together with the value for Italy (blue line) and the EU mean (red line). The projected EU mean value for 2080 is 1.76, which is a dramatic reduction compared with the 2025 value of 4.52. The results reveal a sharp decrease in estimates of CSR until 2050, followed by a continual, steady decline in the years that follow. The projected reduction in CSR was evident for all countries without any exceptions. This means that the number of older people will continue to rise in relation to the number of adults aged 45–65, in line with the projections of demographic transformation. However, while all countries tend to converge towards the European average in the projections beyond 2060, there are some differences between them. In 2025, the CSR values for Austria, Belgium, Denmark, Estonia, Greece, Latvia, Slovenia, and Spain were all very similar to the EU mean value, whereas those for Bulgaria, Cyprus, the Czech Republic, Hungary, Ireland, Luxembourg, Poland, Romania, and Slovakia were all higher than the EU mean value by at least one point, and by more than two in the case of Slovakia. However, some of the projections show a reversal in this trend by 2080, with the values falling to around the EU average in Bulgaria and to below the EU average in Poland and Slovakia.
Figure 3. The values of the CSR for the EU countries in the year 2025. Source: personal elaboration of Eurostat data. Note: the label ‘EU’ indicates the EU mean.
Societies 16 00136 g003
The CSR projection for Malta shows a slight increase from 2030 to 2050, a trend not observed in any other country, followed by a sharp decline from 2050 to 2070 and overlapping with the EU mean in 2080.
Figure 4. CSR projections for the EU-27. Source: personal elaboration of Eurostat data. Reference base for the projection of the population on 1 January 2022.
Societies 16 00136 g004
Figure 5. CSR projection for each EU country (presented in alphabetical order) compared with the EU mean and Italy. Source: personal elaboration of Eurostat data. Reference base for the projection of the population on 1 January 2022. Legend: the black line indicates the estimated CSRs for the individual countries; the red line indicates the EU mean estimates; and the blue line shows the estimated CSR for Italy.
Societies 16 00136 g005
The projected trajectory in CSR for Italy is always below that of the EU average, and indeed of most countries examined, with the exception of Portugal, which is very similar, and Greece, which drops below Italy after 2040.
The analysis also reveals a distinct pattern in the projections for Sweden and Finland: until 2030, the CSR values are projected to remain similar to or lower than those for Italy and below the EU average, after which the estimated CSRs appear to undergo a shift (around 2040), rising momentarily above the EU average, but then declining once more.
Figure 4 and Figure 5 reveal a certain degree of fluctuation in the projected CSR trends for each country rather than a continuous decrease. The key fluctuations are reflected in the EU average around the years 2030 and 2050, when the projected EU mean drops to 3.98 and 2.26, respectively (from 4.52 in 2025), a reduction of more than 1.5 points, as reported in Table 1.
However, it should be noted that the changes in the trends occur at different times in different countries. For instance, a significant fluctuation in trend is projected for around 2040 in Croatia, but between the years 2040 and 2060 in Slovakia.

4.2. CSR Trends Across the Subnational Level in Italy

Italy presents an interesting case to study in greater depth for two reasons: it had the lowest CSR value in Europe as of 2025, together with Portugal, and the welfare system in this country presents significant differences at the regional level, which will have important implications in terms of disparities in the social and health services offered to citizens (for example, see [39,40]).
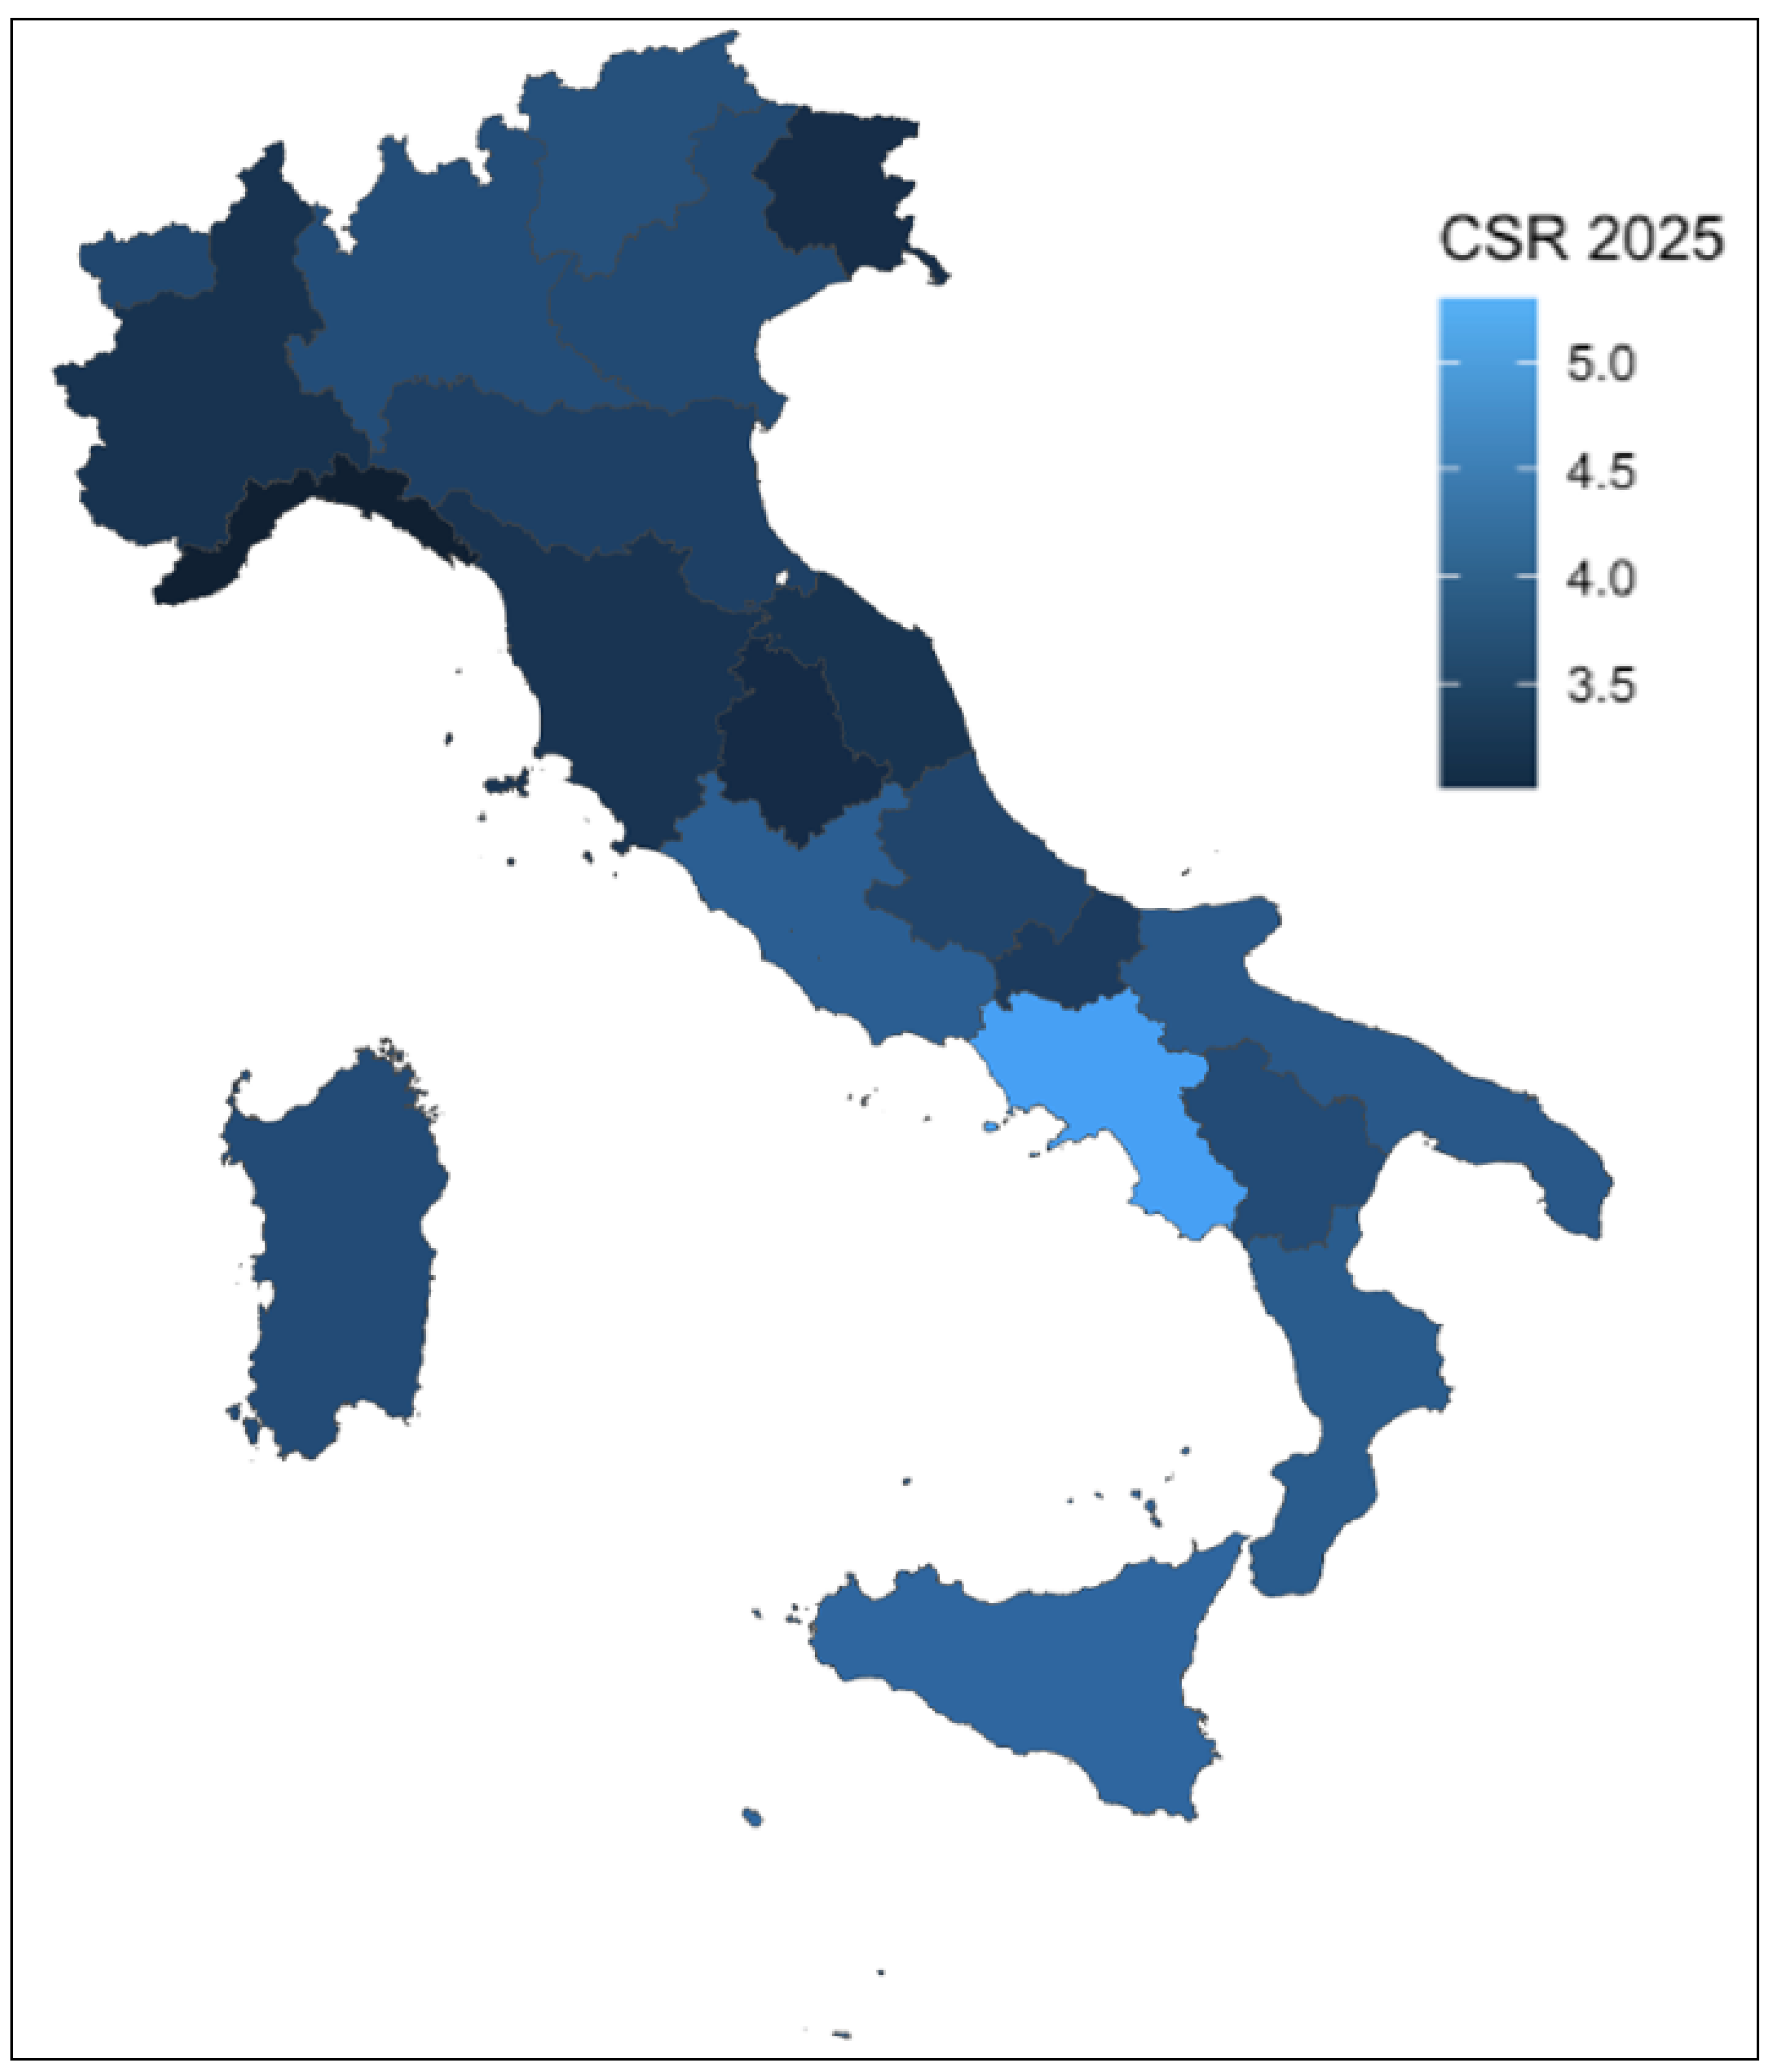
In 2025, the CSRs for all Italian regions were lower than the EU mean (4.52), with the exception of Campania, which was higher (5.30). The analysis also revealed a marked disparity in the CSR values among the Italian regions. However, the magnitude of these variations diminished over time as the CSR estimates across all regions decreased. Figure 6 depicts the values of CSR across the twenty Italian regions in 2025. As expected, the country is characterized by a greater prevalence of darker colors compared to those across the EU (Figure 1). Figure 6 and Table 2 show the estimated CSRs for each region projected until the year 2080.
Figure 6. The Italian subnational variations in CSR for the year 2025 (median scenario). Source: personal elaboration of ISTAT data. Reference base for the projection of the population: 1 January 2024.
Societies 16 00136 g006
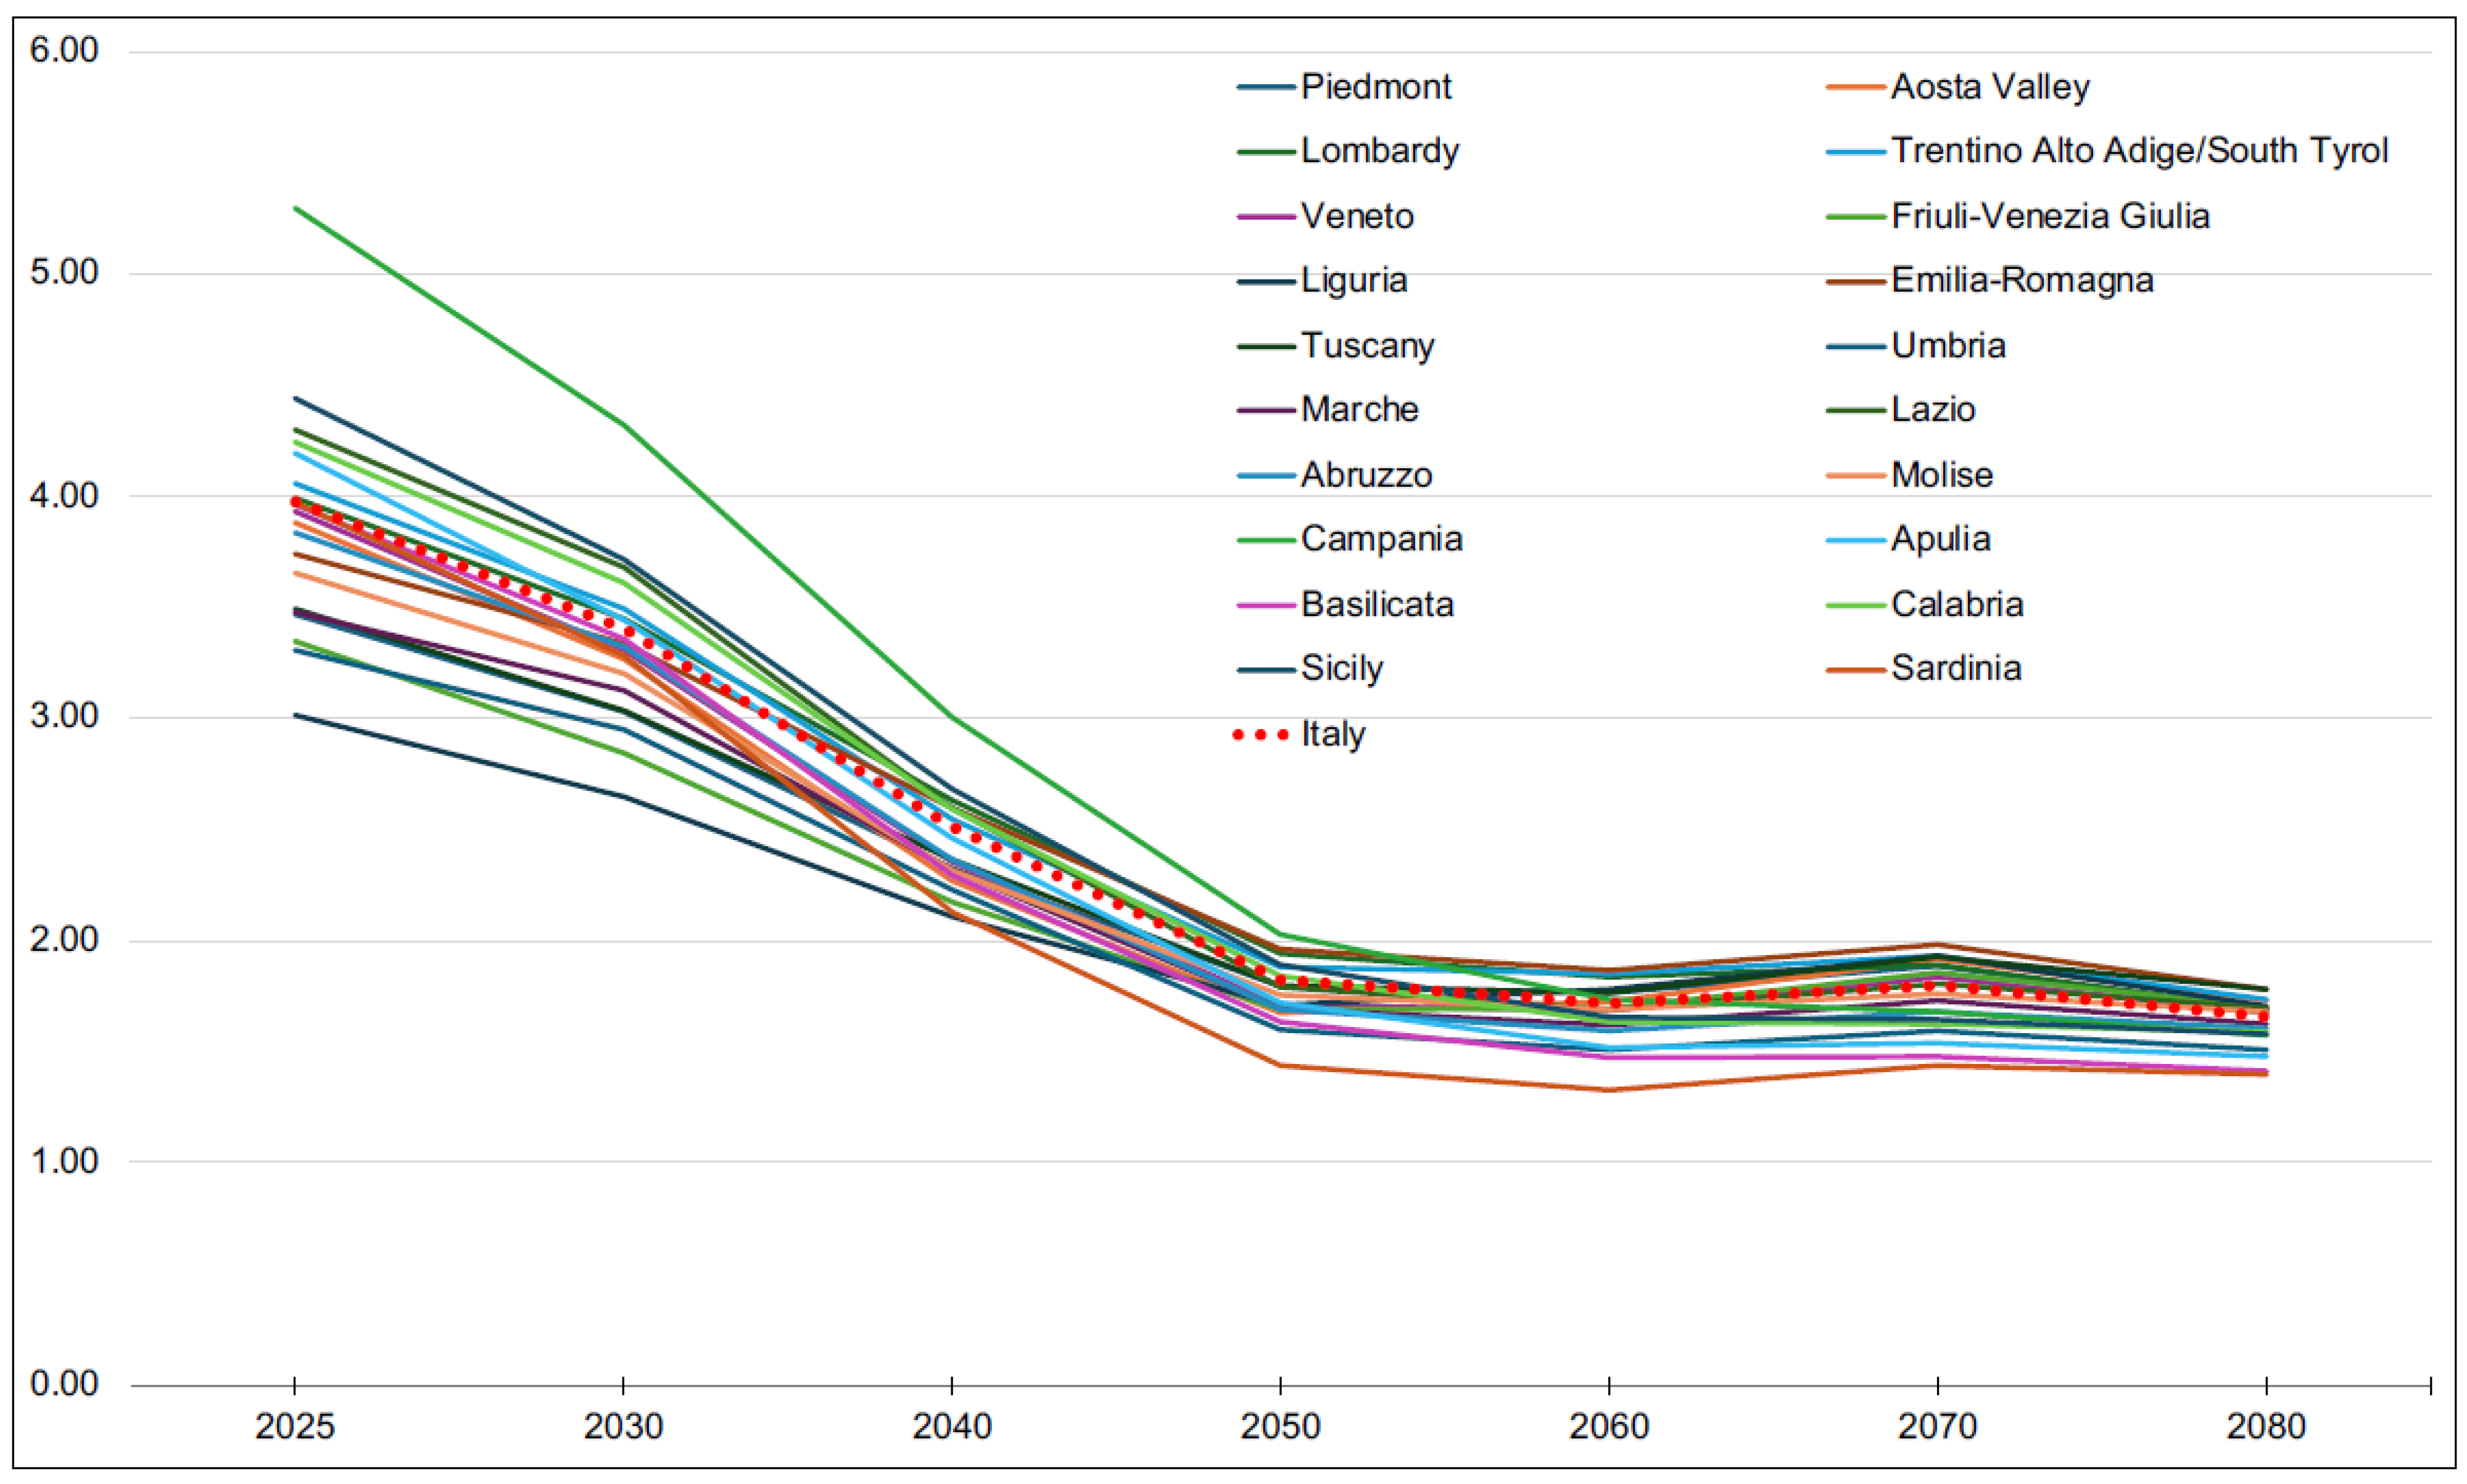
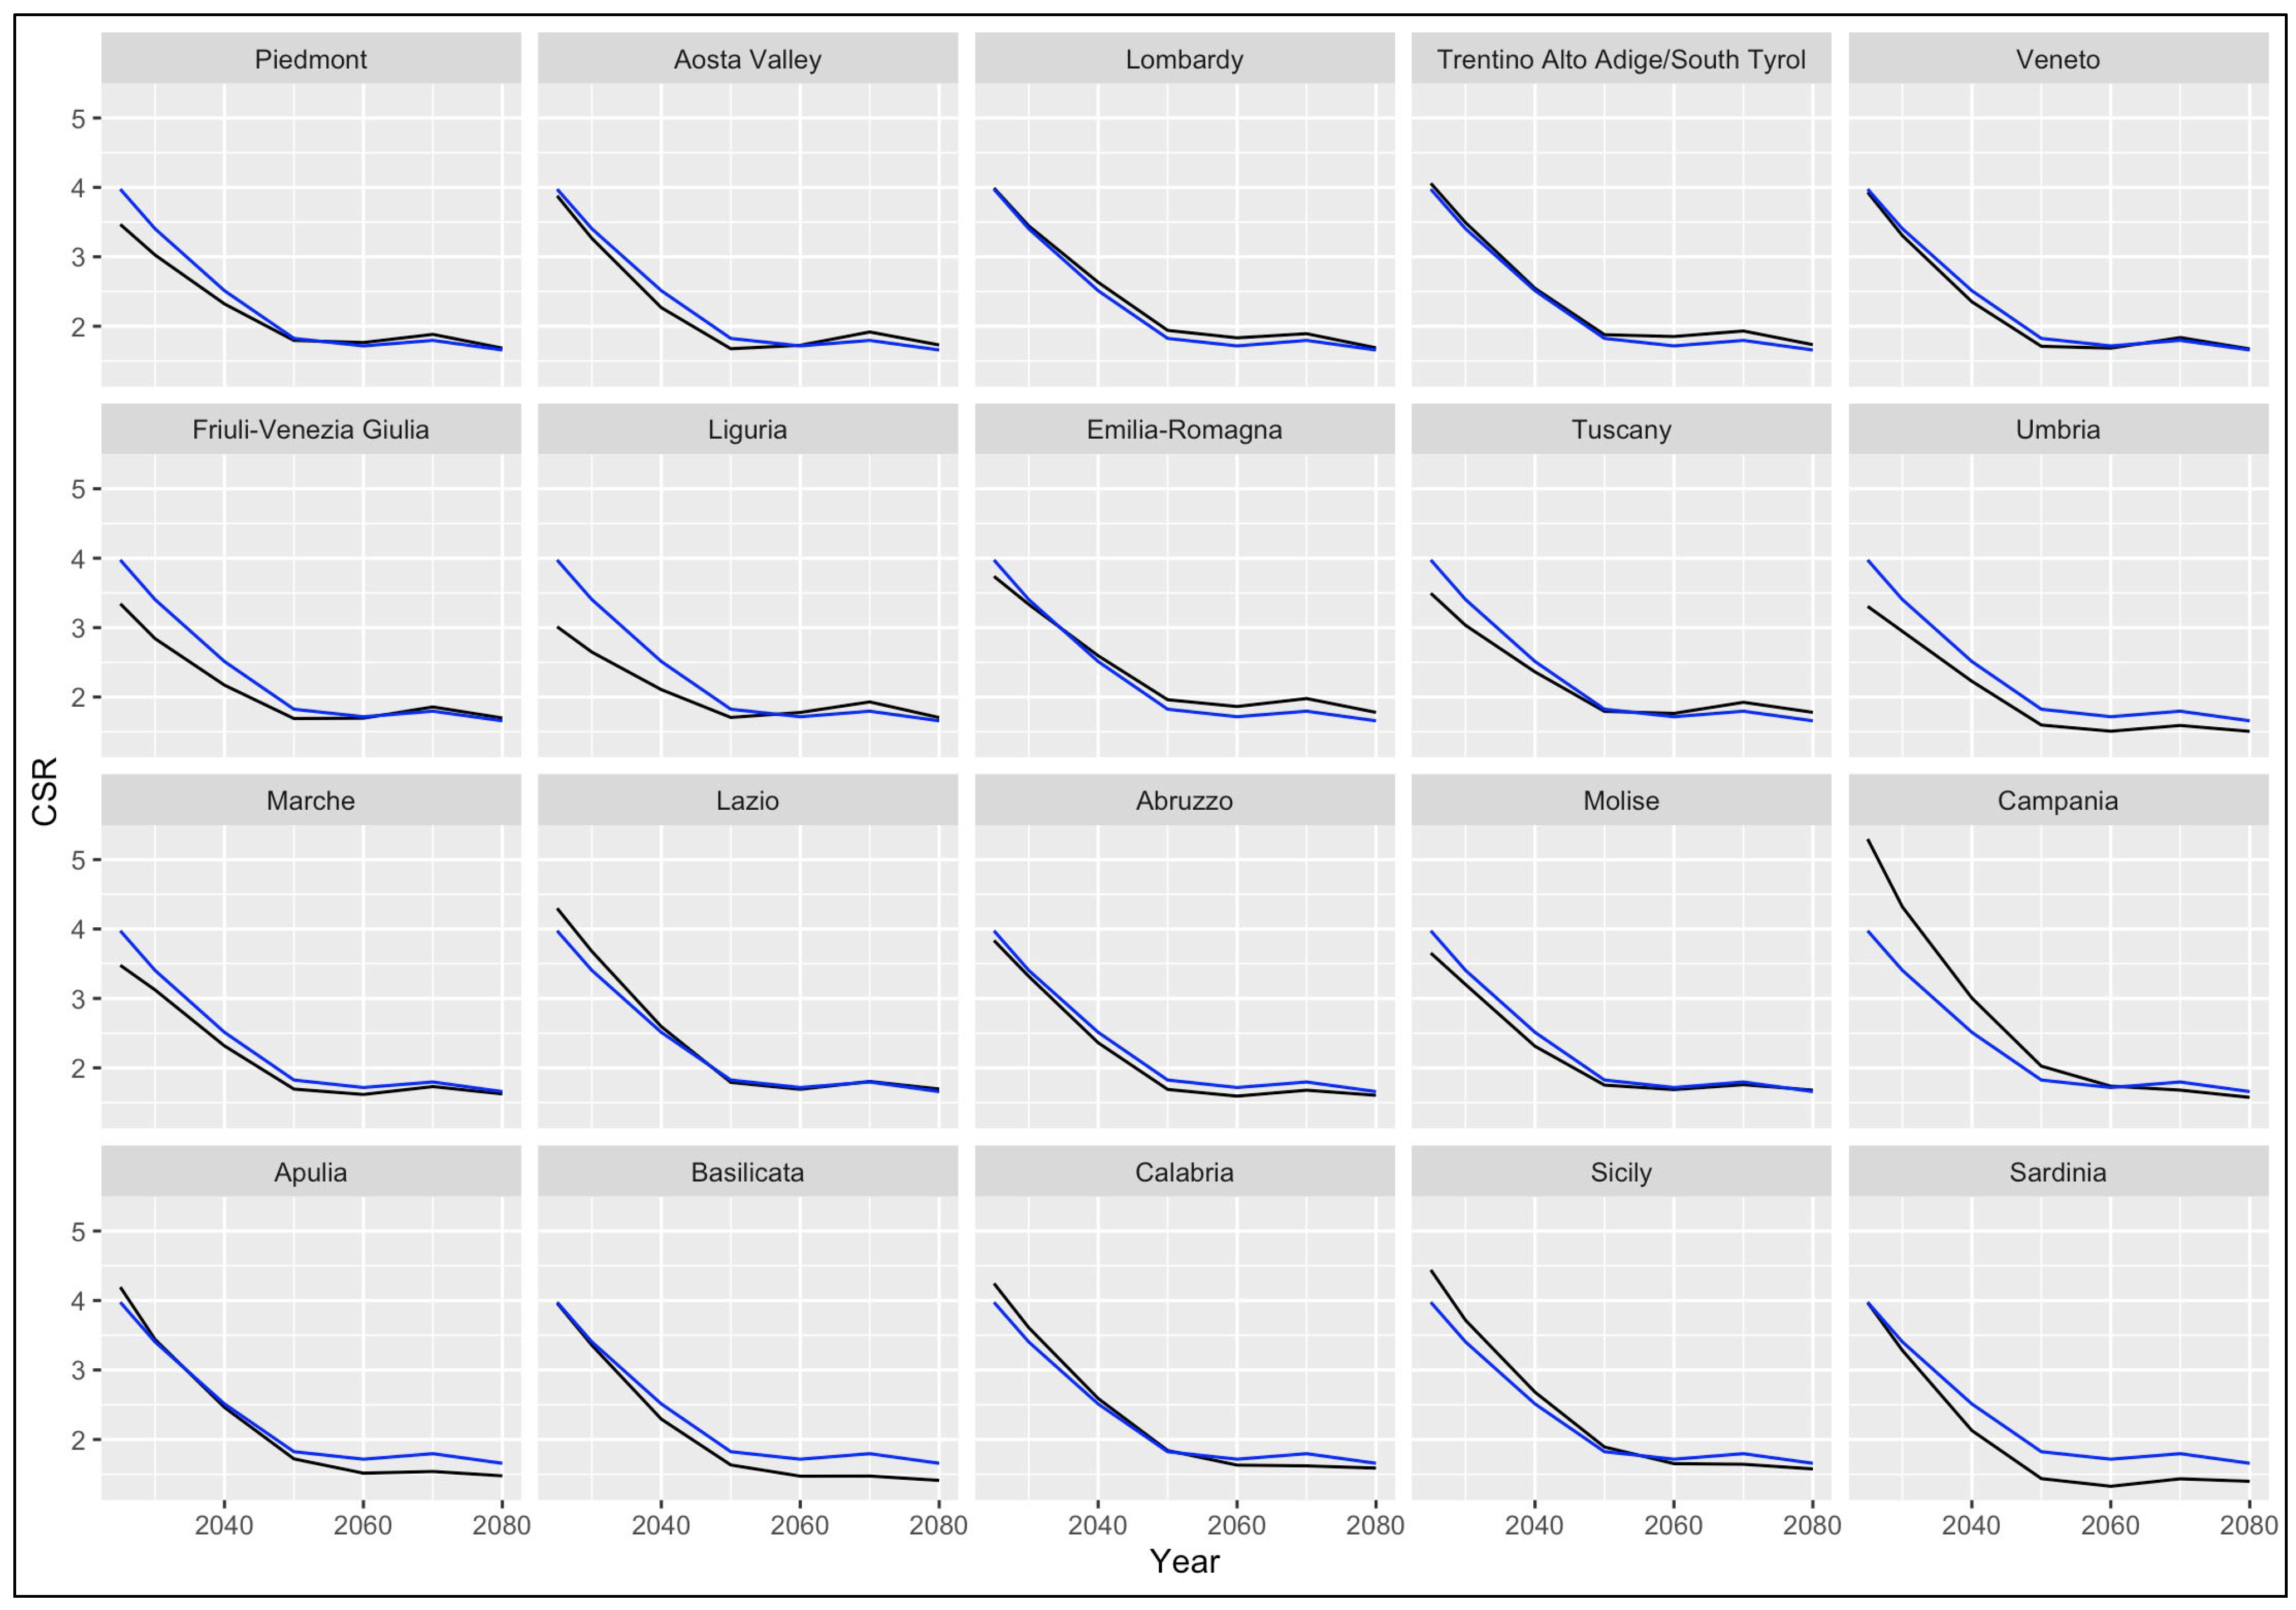
At the regional level (Figure 7 and Figure 8), we can observe a general disparity in the CSR values for 2025 between Northern/Central Italy and the South, with the former characterized by lower values. The CSR is lowest in Liguria (3.01), Friuli–Venezia Giulia (3.31), and Umbria (3.34), followed by Piedmont (3.47), Marche (3.48), and Tuscany (3.49). The CSR projections (Figure 7) also remain below the national CSR average in these regions. The regions with the highest CSR values for 2025 are Campania (5.30), Sicily (4.44), Lazio (4.30), Calabria (4.25), Apulia (4.19), and Trentino Alto Adige/South Tyrol (4.06). These regions have a CSR value above the Italian mean. The remaining regions have CSR values similar to the mean.
Analysis of the trend projections (Figure 7) informs us that Liguria is predicted to remain the region with the lowest CSR until around 2040, whereas Campania is projected to remain the region with the highest CSR until around 2050. However, the projections also inform us that the present Italian situation will undergo changes over the long term, since the region with the lowest CSR value is predicted to become Sardinia (1.40) in 2080, whereas the highest values are predicted for Tuscany and Emilia–Romagna (both 1.78).
As observed at the European level, we can observe the presence of some fluctuations in the trend projections for the twenty Italian regions. Once again, the main fluctuation, involving all regions, is forecast to occur around 2050, followed by further smaller fluctuations thereafter. For example, Aosta Valley, Liguria, and Tuscany all present a second change in the projection trend around 2070. However, we must bear in mind the cumulative effect of small errors in assumptions about future fertility, mortality, and migration rates, which makes long-term projections inherently less reliable.
Figure 7. Projected CRSs for the twenty Italian regions (median scenario). Source: personal elaboration of ISTAT data. Reference base for the projection of the population: 1 January 2024.
Societies 16 00136 g007
Figure 8. Projected estimates of CRSs across the twenty Italian regions (median scenario). Source: personal elaboration of ISTAT data. Reference base for the projection of the population: 1 January 2024. Legend: the black line indicates the estimated trend in CSR for the individual regions, whereas the blue line indicates the estimated trend for Italy as a whole.
Societies 16 00136 g008
While a sharp decline in the CSR estimates is noted for all regions over the medium term (i.e., until around 2050), the estimates predict greater changes in some regions than others. For example, in Campania, it drops from 4.19 (2025) to 2.02 (2050), resulting in a loss of more than 3 points. In Sicily, it drops from 4.44 (2025) to 1.89 (2050). In Sardinia, it drops from 3.97 (2025) to 1.44 (2050), and in Lazio, it drops from 4.30 (2025) to 1.79 (2050). In all these cases, the reduction exceeds 2.5 points. We can also note that the CSR projections from 2050 to 2080 do not show any further major changes, apart from the cases of Tuscany and Sardinia, as already described.
Another aspect that emerged from the analysis of the CSR projections is that some regions remain below the Italian mean for the whole period analyzed. This was the case for Marche, Abruzzo, Basilicata, and Sardinia, with Sardinia showing the largest variation from the Italian mean: 0.48 points for 2050 and 0.28 points for 2080.
Finally, several regions present CSR values that are above the national mean (3.98) for 2025 but projected to fall below it (estimated CSR for Italy in 2080: 1.68) by 2080 (Figure 7). These regions are Campania, projected to fall below the national mean around 2060 (from a CSR of 5.30 in 2025 to a CSR of 1.57 in 2080); Apulia, projected to fall below the national mean around 2030 (from a CSR of 4.19 in 2025 to a CSR of 1.48 in 2080); Calabria, whose CSR is projected to drop from 4.2 5 in 2025 to 1.59 in 2080; and Sicily, projected to fall below the national mean in the 1950s (from a CSR of 4.44 in 2025 to a CSR of 1.58 in 2080).

5. Discussion

The results of the analysis of the most up-to-date demographic and the estimated CSR data confirm the trend identified by Ribeiro and colleagues, specifically, that the CSR is set to decline over the coming decades [8].
In the EU in 2025, the average number of potential caregivers per person aged 80 years or older is 4.5, indicating a proportion of 5:1. This ratio is estimated to decrease to 4:1 by 2030, 3:1 by 2040, and 2:1 by 2050, and then remain stable until 2080. Our findings over the medium term—i.e., until the 2050s—are similar to those of [8]. These authors projected a CSR of 2.09 for 2050 based on the data available in 2011, whereas the present analysis estimated a CSR of 2.26, considering the data presently available, implying a similar proportion of 2:1.
In agreement with [8], the highest CSR value in 2025 was found for Slovakia (7.68, implying a proportion of 8:1). Note, however, that these values have already dropped below those estimated for 2025 based on 2011 data (9.42, and a proportion of 9:1) and on 2020 data (8.24). As projected by Ribeiro and colleagues, Slovakia is expected to maintain its position as a country with a high CSR over the medium term (until 2050) [8]. However, the study also predicted that it may lose its top ranking over the longer term to countries such as the Czech Republic, Luxembourg, and Hungary, which are projected to exhibit the highest CSR over the long term (until 2080). As in all of the EU-27, a decrease in the CSR is projected to characterize Slovakia over the long term.
The 2011 CSR classification by Ribeiro and colleagues ranked Cyprus and Ireland after Slovakia (with proportions of 8:1), followed by Poland, Malta, the Czech Republic, Croatia, Romania, and the Netherlands (all 7:1) [8]. Considering the 2025 data, the ranking changed to Slovakia, followed by Luxembourg, Ireland, Romania, Poland, the Czech Republic, and Bulgaria. The ratio for the first two countries is 7:1, and that for all others is 6:1.
Italy was the European country with the lowest CSR (4.51) in 2011, confirmed in 2025 (3.98), with proportions of 5:1 and 4:1 in 2011 and 2025, respectively.
The results from the present study can only be compared over the medium term with those of Ribeiro and colleagues (i.e., until 2050) [8], remembering to bear in mind the methodological differences between the two studies. Both projections found Southern European countries, namely Greece, Italy, Portugal, and Spain, to be the nations with the lowest CSR projections (the mean CSR for these four countries in 2050 was 1.83), and this trend persists over the long term (2080), when they will likely be joined by other countries (for example, Lithuanian, Finland, and Poland). The projected trend estimated in this study for Malta differs from that in [8]. In particular, Ribeiro and colleagues show a faster decline in CSR, especially after 2040, and a disparity between the estimated values for 2030 and 2040, although the magnitude of the difference is less than one point [8].
The present work is the first to estimate future variations in CSR at the subnational level in Italy. While the evidence presented here confirms a unanimous downward trend in CSR across all regions, the data also reveal significant heterogeneity between the areas, as noted between countries at the EU level. This may present a challenge in terms of determining the most efficacious strategies for problem mitigation.
The decline in CSR must also be interpreted within the context of other social phenomena (e.g., changes in family dynamics, marriage statuses, birth rates, etc.) that may be directly or indirectly correlated with CSR. This consideration is valid at both the EU and subnational levels. Social phenomena include changes in family composition, the fertility rate, and immigration levels. Recent studies have indicated a decline in specific family structures within the EU, including couples with children, and an increase in single-person households [45,46,47]. Subsequently, the rise in divorce rates among older couples [48] will lead to an increase in the number of elderly individuals living alone, and if these people have limited informal care resources, it may result in a rise in the demand for formal care services, whether they be provided publicly or privately, thus an increase in living costs for these individuals. Moreover, the decline in the number of prospective informal caregivers is anticipated to engender an increase in the care burden for individual caregivers, most likely family members, fostering elevated levels of stress and burnout [49,50]. A high care burden can also impact employment conditions, especially for women, potentially forcing them to abandon their jobs, affecting their economic condition and psychological and general well-being [51].
The projected decrease in the availability of informal caregivers, coupled with an aging population, particularly those aged 90 and over (who are at greater risk of physical dependency due to long-term conditions, disabilities, or frailty), has implications for policymaking and future public services. The projections predict a greater demand for services and long-term support in the future, and this will have to be dealt with by the different types of welfare systems present at the national [52,53] and sub-national levels [40]. Increasing service provision will require greater public investment, and this will also impact future generations and the caregivers themselves. However, investments in this sector should already be in place at both levels, with greater investment injected into the geographic areas presenting a lower CSR. This is necessary to plan for the challenges of tomorrow. Prepaid financing mechanisms should also be considered in order to address the impending long-term care crisis, which is being exacerbated by an aging population with increasingly limited personal savings.
Furthermore, as already underlined by Ribeiro and colleagues, the regulations on informal caregiving need to be reviewed, with policies varying greatly throughout Europe [8]. The specifics of how caregiver roles are formally recognized by individual nations are highly heterogeneous, as highlighted in the literature [54,55,56]. This ranges from contexts in which the state is required to offer assistance to caregivers, as in Sweden, where municipalities provide support and respite services to individuals caring for a close relative requiring LTC, to contexts in which the family is simply expected to carry the care burden, as in Spain and Italy [54,56]. Reframing LTC systems as an economic driver rather than merely a financial burden could enable investment in caregivers, generating returns while relieving family members from caregiving responsibilities and enabling their participation in the labor market.
As suggested by Ribeiro and colleagues, technologies could provide one possible solution to the problems arising from a reduction in the CSR [8]. Robots, specifically ‘humanoid’ and/or ‘social’ robots, could help provide elements of assistance. Indeed, research into the potential roles of social robots in providing social assistance or care for older persons is progressing fast and receiving increasing interest [57,58]. However, if ‘humanoid’ and/or ‘social’ robots are to be considered, further research is needed to deepen our understanding of the associated ethical principles and the cultural and end-user acceptance of such technologies. Indeed, present evidence suggests that many may be opposed to the idea of substituting a human caregiver with a robot due to the lack of a genuine relationship and because of bad personal experiences with robotics [59,60].

6. Conclusions

The CSR provides an estimate of the potential availability—or unavailability—of informal caregivers in a population [8]. Using the most recent demographic data available for the EU-27 and regional data pertaining to Italy, this research contributes to the existing body of knowledge by providing updated figures for the present situation in Europe for medium- and long-term projections. Furthermore, this paper adds to the literature by analyzing projected trends at the subnational level in Italy—the country with the lowest CSR in Europe.
The findings corroborate the trends identified by preceding researchers [8,15]. Specifically, the CSR is projected to decline over the coming decades, which will likely have a negative impact on both the quality of care being provided and the wellbeing of the caregivers themselves, as responsibilities will have to be borne by fewer individuals. The distribution of this shrinking cohort of adults aged 45 to 64 years also varies at both the EU and subnational level, as demonstrated for Italy. It will place considerable pressure on the public sector’s LTC system in terms of both financing and service provision, necessitating greater resource allocation for expanded structural services, respectively [61]. Policy makers should also address the factors influencing the availability of informal caregivers, such as birth rates, family structures, and migration policies.
Welfare systems must recognize the key role of informal carers and provide them with ongoing support services. Technological and information and communication technologies-based solutions could provide a way of addressing these challenges. However, their implementation requires economic investment, as well as careful consideration of the ethical and cultural dimensions.
Further research should consider the confidence intervals of the median scenarios that were used to calculate the actual and estimated corporate social responsibility (CSR) in this study. Confidence intervals were not considered, as their inclusion would introduce numerous methodological complexities that may be unsuitable for less-experienced users. Demographic projections are subject to variability. Therefore, these results should not be considered strictly deterministic.

Limitations

Several limitations affect the interpretation of this paper’s findings. As underlined by Ribeiro and colleagues, the CSR is an over-simplified measure, which assumes (i) that the entire population aged 45 to 64 has the capacity to provide care, and (ii) that all people aged 80 or over require care [8]. The level of care required by the elderly will also vary greatly. Consequently, CSR estimates require cautious interpretation. A strategy of continuous monitoring offers one way of addressing this issue. This would involve comparing forecasts with the observed demand and, in turn, refining the prediction models [62].
The results of this study are not directly comparable with those of [8], since the latter included the United Kingdom, which was excluded here due to its withdrawal from the European Union on 31 January 2020.
A further limitation is that the CSR does not account for the work done by young caregivers [63,64], a group frequently overlooked in research into informal caregiving [65,66] and by policy makers [67]. To estimate the proportions of young people engaged in caregiving, more accurate data on the amount of time they dedicate to caring for family members is required. Considering the downward trend in CSR and the importance of both paid and unpaid caregivers, in addition to formal health care provision, continuous monitoring of the CSR remains essential for aligning social policy with the needs of an aging population [8]. Improving the quality of the data used to calculate the CSR and integrating key contextual indicators into its formulation are necessary to improve its robustness, particularly in the context of regional forecasts [68].
Despite its limitations and inability to capture the full complexity of real-world conditions, the CSR remains a useful indicator for analyzing and planning the future care scenarios of an aging society.

Funding

PRIN2022 Project Funded by the European Union—NextGenerationEU—PNRR M4C2I1.1. Project: “Social capital as resource of care practice in Italy: Caregiving and social support in pandemic time”. Università Cattolica del Sacro Cuore (Prof.ssa Donatella Bramanti: 2022B58JHF—CUP: J53D23011290008).

Institutional Review Board Statement

Not applicable.

Informed Consent Statement

Not applicable.

Data Availability Statement

No new data were created or analyzed in this study.

Conflicts of Interest

The authors declare no conflict of interest.

Notes

1
2
3
4
5
6
7
https://demo.istat.it/app/?i=PPR&l=it (accessed on 12 September 2025).
8

References

  1. Novotný, V. Europe’s demography and what to do about it. Eur. View 2023, 22, 205–212. [Google Scholar] [CrossRef]
  2. Rees, P.; Van Der Gaag, N.; De Beer, J.; Heins, F. European Regional Populations: Current trends, future pathways, and policy options. Eur. J. Popul. Rev. Eur. Démographie 2012, 28, 385–416. [Google Scholar] [CrossRef]
  3. Rechel, B.; Grundy, E.; Robine, J.; Cylus, J.; Mackenbach, J.P.; Knai, C.; McKee, M. Ageing in the European Union. Lancet 2013, 381, 1312–1322. [Google Scholar] [CrossRef]
  4. Connolly, M.P.; Postma, M.J. Health care as an investment: Implications for an era of ageing populations. J. Med. Mark. Device Diagn. Pharm. Mark. 2010, 10, 5–14. [Google Scholar] [CrossRef]
  5. Khan, H.T.A.; Addo, K.M.; Findlay, H. Public health challenges and responses to the growing ageing populations. Public Health Chall. 2024, 3, e213. [Google Scholar] [CrossRef] [PubMed]
  6. Lindh, T. Social investment in the ageing populations of Europe. In Towards a Social Investment Welfare State? Morel, N., Palier, B., Palme, J., Eds.; Ideas, Policies and Challenges; Bristol University Press: Bristol, UK, 2011; pp. 261–284. [Google Scholar][Green Version]
  7. Li, J.; Song, Y. Formal and informal care. In Encyclopedia of Gerontology and Population Aging; Gu, D., Dupre, M.E., Eds.; Springer International Publishing: London, UK, 2021; pp. 1–8. [Google Scholar]
  8. Ribeiro, O.; Araújo, L.; Figueiredo, D.; Paúl, C.; Teixeira, L. The Caregiver Support Ratio in Europe: Estimating the future of potentially (Un)Available caregivers. Healthcare 2022, 10, 11. [Google Scholar] [CrossRef] [PubMed]
  9. Pierret, C.R. The sandwich generation: Women caring for parents and children. Mon. Lab. Rev. 2006, 129, 3–9. [Google Scholar]
  10. Happ, M.B.; Moss, K.O.; Dabbs, A.D.; Narby, E.; Song, M. Defining informal caregiving and caregivers for persons living with dementia. J. Gerontol. Nurs. 2024, 50, 41–45. [Google Scholar] [CrossRef]
  11. Friedman, E.M.; Park, S.S.; Wiemers, E.E. New estimates of the sandwich generation in the 2013 panel Study of Income Dynamics. Gerontologist 2017, 57, 191–196. [Google Scholar] [CrossRef][Green Version]
  12. Spillman, B.C.; Pezzin, L.E. Potential and active family caregivers: Changing networks and the ‘Sandwich Generation’. Milbank Q. 2000, 78, 347–374. [Google Scholar] [CrossRef]
  13. Suh, J. Measuring the “Sandwich”: Care for Children and Adults in the American Time Use Survey 2003–2012. J. Fam. Econ. Issues 2016, 37, 197–211. [Google Scholar] [CrossRef]
  14. Lei, L.; Leggett, A.N.; Maust, D.T. A national profile of sandwich generation caregivers providing care to both older adults and children. J. Am. Geriatr. Soc. 2023, 71, 799–809. [Google Scholar] [CrossRef]
  15. Tur-Sinai, A.; Teti, A.; Rommel, A.; Hlebec, V.; Lamura, G. How Many Older Informal Caregivers Are There in Europe? Comparison of Estimates of Their Prevalence from Three European Surveys. Int. J. Environ. Res. Public Health 2020, 17, 9531. [Google Scholar] [CrossRef]
  16. Verbakel, E.; Tamlagsrønning, S.; Winstone, L.; Fjær, E.L.; Eikemo, T.A. Informal care in Europe: Findings from the European Social Survey (2014) special module on the social determinants of health. Eur. J. Public Health 2017, 27, 90–95. [Google Scholar] [CrossRef]
  17. Skinner, M.S.; Sogstad, M. Social and Gender Differences in Informal Caregiving for Sick, Disabled, or Elderly Persons: A Cross-Sectional Study. SAGE Open Nurs. 2022, 8, 23779608221130585. [Google Scholar] [CrossRef]
  18. Savard, J.; Leduc, N.; Lebel, P.; Béland, F.; Bergman, H. Caregiver satisfaction with support services. J. Aging Health 2006, 18, 3–27. [Google Scholar] [CrossRef]
  19. Whittier, S.; Scharlach, A.; Santo, T.S.D. Availability of caregiver support services. J. Aging Soc. Policy 2005, 17, 45–62. [Google Scholar] [CrossRef] [PubMed]
  20. Rosina, A.; Impicciatore, R. The end of a growing Italy. What are the conditions for well-being and development in an aging population? Riv. Ital. Econ. Demogr. Stat. 2023, 77, 5–18. [Google Scholar] [CrossRef]
  21. Istat. Invecchiamento Attivo E Condizioni Di Vita Degli Anziani in ITALIA; Istat: Roma, Italy, 2020.
  22. Istat. Rapporto Annuale 2022: La Situazione Del Paese; Istat: Roma, Italy, 2020.
  23. OECD. Is Care Affordable for Older People? OECD Health Policy Studies; OECD Publishing: Paris, France, 2024. [Google Scholar] [CrossRef]
  24. Chiao, C.; Wu, H.; Hsiao, C. Caregiver burden for informal caregivers of patients with dementia: A systematic review. Int. Nurs. Rev. 2015, 62, 340–350. [Google Scholar] [CrossRef] [PubMed]
  25. Longobardo, L.M.P.; Rodríguez-Sánchez, B.; Oliva, J. Does becoming an informal caregiver make your health worse? A longitudinal analysis across Europe. Econ. Hum. Biol. 2023, 50, 101264. [Google Scholar] [CrossRef]
  26. Vicente, J.; McKee, K.J.; Magnusson, L.; Johansson, P.; Ekman, B.; Hanson, E. Factors associated with experiencing informal caregiving as demanding and ability to work among working carers: A national survey from Sweden. Community Work Fam. 2025, 1–21. [Google Scholar] [CrossRef]
  27. Krämer, M.D.; Bleidorn, W. The Well-Being Costs of informal caregiving. Psychol. Sci. 2024, 35, 1382–1394. [Google Scholar] [CrossRef]
  28. Eberl, A. The effect of informal caregiving on social capital investments. Soc. Sci. Res. 2020, 85, 102319. [Google Scholar] [CrossRef]
  29. Da Roit, B.; Bihan, B.L. Similar and yet so different: Cash-for-Care in six European countries’ Long-Term Care policies. Milbank Q. 2010, 88, 286–309. [Google Scholar] [CrossRef]
  30. Chari, A.V.; Engberg, J.; Ray, K.N.; Mehrotra, A. The Opportunity Costs of Informal Elder-Care in the United States: New Estimates from the American Time Use Survey. Health Serv. Res. 2015, 50, 871–882. [Google Scholar] [CrossRef] [PubMed]
  31. Carers Australia. Deloitte Access Economics: The Value of Informal Care in 2020; Carers Australia: Turner, Australia, 2020; Available online: https://www.carersaustralia.com.au/wp-content/uploads/2020/07/FINAL-Value-of-Informal-Care-22-May-2020_No-CIC.pdf (accessed on 15 October 2025).
  32. Peña-Longobardo, L.M.; Oliva-Moreno, J. The economic Value of Non-professional care: A Europe-Wide analysis. Int. J. Health Policy Manag. 2021, 11, 2272–2286. [Google Scholar] [CrossRef] [PubMed]
  33. Elayan, S.; Angelini, V.; Buskens, E.; De Boer, A. The Economic Costs of Informal Care: Estimates from a National Cross-Sectional Survey in The Netherlands. Eur. J. Health Econ. 2024, 25, 1311–1331. [Google Scholar] [CrossRef]
  34. Jamieson, L.; Simpson, R. Living Alone: Globalization, Identity and Belonging; Palgrave Macmillan: London, UK, 2013; pp. XV, 305. [Google Scholar] [CrossRef]
  35. Esteve, A.; Pohl, M.; Becca, F.; Fang, H.; Galeano, J.; García-Román, J.; Reher, D.; Trias-Prats, R.; Turu, A. A global perspective on household size and composition, 1970–2020. Genus 2024, 80, 2–22. [Google Scholar] [CrossRef]
  36. Redfoot, D.; Feinberg, L.; Houser, A. The Aging of the Baby Boom and the Growing Care Gap: A Look at Future Declines in the Availability of Family Caregivers; Insight on the Issues 85; AARP Public Policy Institute: Washington, DC, USA, 2013. Available online: http://resource.nlm.nih.gov/101624602 (accessed on 15 October 2025).
  37. Moroney, R.M. The Family and the State: Considerations for Social Policy; Longman: Harlow, UK, 1976. [Google Scholar]
  38. Bramanti, D.; Bosoni, M.L.; Nanetti, S. The Sociology of the Family in Italy: Its contribution to public debate and social policies. Am. Sociol. 2025, 56, 171–197. [Google Scholar] [CrossRef]
  39. Bertin, G.; Pantalone, M. Comparing hybrid welfare systems: The differentiation of health and social care policies at the regional level in Italy. Ital. Sociol. Rev. 2018, 8, 1–23. [Google Scholar] [CrossRef]
  40. Bertin, G.; Carradore, M. Differentiation of welfare regimes: The case of Italy. Int. J. Soc. Welf. 2016, 25, 149–160. [Google Scholar] [CrossRef]
  41. Carradore, M. Social capital in the Italian regions at the time of the COVID-19 pandemic: A comparison of different composite indicators. Int. Rev. Sociol. 2025, 35, 89–106. [Google Scholar] [CrossRef]
  42. R Core Team. R: A Language and Environment for Statistical Computing; R Foundation for Statistical Computing: Vienna, Austria, 2022; Available online: https://www.R-project.org/ (accessed on 8 October 2025).
  43. Lahti, L.; Huovari, J.; Kainu, M.; Biecek, P. Retrieval and Analysis of Eurostat Open Data with the eurostat Package. R J. 2017, 9, 385–392. [Google Scholar] [CrossRef]
  44. Lahti, L.; Huovari, J.; Kainu, M.; Biecek, P.; Hernangomez, D.; Antal, D.; Kantanen, P. Eurostat: Tools for Eurostat Open Data [Computer Software], R Package Version 4.0.0; Comprehensive R Archive Network (CRAN): Vienna, Austria, 2023; Available online: https://github.com/rOpenGov/eurostat (accessed on 8 October 2025).
  45. Cohen, P.N. The rise of One-Person households. Socius Sociol. Res. A Dyn. World 2021, 7, 23780231211062315. [Google Scholar] [CrossRef]
  46. Benassi, F.; Naccarato, A.; Vellucci, P. Exploring the territorial unevenness of one-person households and contextual factors of vulnerability: Evidence from the Italian context. Socio-Econ. Plan. Sci. 2024, 95, 102014. [Google Scholar] [CrossRef]
  47. Sandström, G.; Brändström, A. Long-term changes in the characteristics of one-person households in Sweden, 1960–2018. Hist. Fam. 2024, 29, 662–691. [Google Scholar] [CrossRef]
  48. Brown, S.L.; Lin, I. The Gray Divorce Revolution: Rising Divorce among Middle-Aged and Older Adults, 1990–2010. J. Gerontol. Ser. B 2012, 67, 731–741. [Google Scholar] [CrossRef]
  49. Cejalvo, E.; Martí-Vilar, M.; Gisbert-Pérez, J.; Badenes-Ribera, L. Stress as a risk factor for informal caregiver burden. Healthcare 2025, 13, 731. [Google Scholar] [CrossRef]
  50. Honda, A. Caregiver burden, job stress, and coping strategies in work–family conflict among sandwiched caregivers in long-term care settings: A cross-sectional study. Arch. Gerontol. Geriatr. Plus 2025, 2, 100208. [Google Scholar] [CrossRef]
  51. Bongelli, R.; Busilacchi, G.; Pacifico, A.; Fabiani, M.; Guarascio, C.; Sofritti, F.; Lamura, G.; Santini, S. Caregiving burden, social support, and psychological well-being among family caregivers of older Italians: A cross-sectional study. Front. Public Health 2024, 12, 1474967. [Google Scholar] [CrossRef]
  52. Arts, W.; Gelissen, J. Three worlds of welfare capitalism or more? A state-of-the-art report. J. Eur. Soc. Policy 2002, 12, 137–158. [Google Scholar] [CrossRef]
  53. Powell, M.; Barrientos, A. Welfare regimes and the welfare mix. Eur. J. Political Res. 2004, 43, 83–105. [Google Scholar] [CrossRef]
  54. Pesaresi, F. Il Manuale Dei Caregiver Familiari: Aiutare Chi Auta; Maggioli Editore: Sant’Arcangelo di Romagna, Italy, 2021. [Google Scholar]
  55. Pickard, L.; King, D. Modelling the future supply of informal care for older people in Europe. In Long-Term Care Use and Supply in Europe: Projections for Germany, The Netherlands, Spain and Poland; Geerts, J., Willemé, P., Mot, E., Eds.; ENEPRI research report (116); ANCIEN: Brussels, Belgium, 2012; pp. 76–106. [Google Scholar]
  56. UNECE. The Challenging Roles of Informal Carers; UNECE Policy Brief on Ageing No. 22; UNECE: Geneva, Switzerland, 2019; Available online: https://unece.org/fileadmin/DAM/pau/age/Policy_briefs/ECE_WG1_31.pdf (accessed on 15 October 2025).
  57. Amabili, G.; Cucchieri, G.; Margaritini, A.; Benadduci, M.; Barbarossa, F.; Luzi, R.; Riccardi, G.; Pelliccioni, G.; Maranesi, E.; Bevilacqua, R. Social Robotics and Dementia: Results from the eWare Project in Supporting Older People and Their Informal Caregivers. Int. J. Environ. Res. Public Health 2022, 19, 13334. [Google Scholar] [CrossRef]
  58. Andtfolk, M.; Nyholm, L.; Eide, H.; Fagerström, L. Humanoid robots in the care of older persons: A scoping review. Assist. Technol. 2021, 34, 518–526. [Google Scholar] [CrossRef]
  59. Wang, J.; Dong, X.; Chen, S.; Lu, X.; Chen, X.; Liu, H.; Wen, S.; Tang, S.; Zhao, T.; Hou, C.; et al. Informal caregivers’ attitudes towards care robots: A mixed methods systematic review. Ageing Res. Rev. 2025, 110, 102778. [Google Scholar] [CrossRef]
  60. Carradore, M. People’s Attitudes Towards the Use of Robots in the Social Services: A Multilevel Analysis Using Eurobarometer Data. Int. J. Soc. Robot. 2022, 14, 845–858. [Google Scholar] [CrossRef]
  61. Pickard, L. A growing care gap? The supply of unpaid care for older people by their adult children in England to 2032. Ageing Soc. 2015, 35, 96–123. [Google Scholar] [CrossRef]
  62. Vanella, P.; Deschermeier, P.A. probabilistic Cohort-Component model for population forecasting—The case of Germany. J. Popul. Ageing 2020, 13, 513–545. [Google Scholar] [CrossRef]
  63. Lam, L.T.; Lam, M.K. The Prevalence of Caregiving among Young People. Int. J. Environ. Res. Public Health 2024, 21, 621. [Google Scholar] [CrossRef] [PubMed]
  64. Kavanaugh, M.S.; Stamatopoulos, V. Young Carers, the overlooked caregiving population: Introduction to a special issue. Child Adolesc. Soc. Work J. 2021, 38, 487–489. [Google Scholar] [CrossRef]
  65. Saragosa, M.; Frew, M.; Hahn-Goldberg, S.; Orchanian-Cheff, A.; Abrams, H.; Okrainec, K. The Young Carers’ Journey: A Systematic Review and Meta Ethnography. Int. J. Environ. Res. Public Health 2022, 19, 5826. [Google Scholar] [CrossRef] [PubMed]
  66. Hendricks, B.A.; Kavanaugh, M.S.; Bakitas, M.A. How far have we come? An updated scoping review of young carers in the U.S. Child Adolesc. Soc. Work J. 2021, 38, 491–504. [Google Scholar] [CrossRef]
  67. Kalvesmaki, A.F.; Miller, K.E.; Armstrong-Carter, E.; Lewis, F.; Shih, R.A.; Olson, E.; Kavanaugh, M.S. The challenge of identifying young carers in the US: How state laws put families at risk for separation. Int. J. Care Caring 2024, 9, 188–195. [Google Scholar] [CrossRef]
  68. Vanella, P.; Deschermeier, P.; Wilke, C.B. An Overview of Population Projections—Methodological Concepts, international data availability, and use cases. Forecasting 2020, 2, 346–363. [Google Scholar] [CrossRef]
Table 1. Projected CRS estimates for the EU-27 until 2080 *.
CountryYear
2025203020402050206020702080
Austria4.654.263.362.412.272.061.85
Belgium4.674.013.092.572.462.211.89
Bulgaria6.015.133.992.801.991.841.89
Croatia5.064.463.002.502.282.001.81
Cyprus5.724.793.943.182.572.021.82
Czechia6.054.803.792.952.072.122.12
Denmark4.583.553.052.662.372.181.82
Estonia4.574.353.612.822.271.931.85
Finland4.033.082.672.482.371.931.59
France4.123.372.492.162.081.891.74
Germany3.843.762.982.272.302.091.92
Greece4.203.822.561.631.401.461.58
Hungary5.805.363.973.242.222.142.03
Ireland6.685.774.132.982.442.071.79
Italy3.983.412.471.821.721.771.60
Latvia4.574.393.432.351.861.751.78
Lithuania5.094.703.572.552.041.711.51
Luxembourg6.826.295.013.692.932.271.86
Malta5.074.194.514.673.362.121.56
The Netherlands5.073.832.942.582.512.191.84
Poland6.215.343.562.842.031.661.63
Portugal4.073.502.481.891.611.591.62
Romania6.365.783.632.622.001.931.97
Slovakia7.686.434.172.931.941.741.75
Slovenia4.884.412.962.181.941.851.82
Spain4.894.312.941.981.701.691.60
Sweden4.043.383.282.862.562.301.97
European Union Mean4.523.982.952.262.021.901.76
* Note: Reference base for the projection of the population: 1 January 2022.
Table 2. Projected CRS estimates across the Italian regions until 2080 *.
Italian RegionsYear
2025203020402050206020702080
Piedmont3.473.032.321.801.771.881.68
Aosta Valley3.883.272.271.681.731.921.73
Lombardy3.993.452.631.941.831.891.69
Trentino Alto Adige/South Tyrol4.063.492.551.881.851.931.73
Veneto3.933.312.351.711.681.841.67
Friuli–Venezia Giulia3.342.842.171.691.701.861.70
Liguria3.012.652.111.711.781.931.70
Emilia–Romagna3.743.342.591.961.861.981.78
Tuscany3.493.032.361.791.761.921.78
Umbria3.312.952.231.601.511.591.51
Marche3.483.122.321.691.621.731.62
Lazio4.303.682.591.791.691.801.70
Abruzzo3.843.322.361.691.591.681.60
Molise3.653.202.311.751.691.761.68
Campania5.304.323.012.021.741.681.57
Apulia4.193.442.461.721.521.541.48
Basilicata3.963.362.291.631.471.471.41
Calabria4.253.612.591.841.631.621.59
Sicily4.443.722.681.891.651.641.58
Sardinia3.973.282.131.441.331.431.40
Italy3.983.462.621.911.801.881.68
* Note: Reference base for the projection of the population: 1 January 2024.
Disclaimer/Publisher’s Note: The statements, opinions and data contained in all publications are solely those of the individual author(s) and contributor(s) and not of MDPI and/or the editor(s). MDPI and/or the editor(s) disclaim responsibility for any injury to people or property resulting from any ideas, methods, instructions or products referred to in the content.