


Simple Summary
Pygmy grasshoppers (Tetrigidae) are small ground-living grasshoppers that feed on mosses, algae and decaying plant material on damp soil and along streams, a way of life unlike that of the familiar leaf-feeding locusts. Which genes allow them to detect food and to cope with the chemicals in such a diet is unknown. We sequenced complete messenger RNA molecules from the Chinese pygmy grasshopper Hyboella guangxiensis with nanopore technology and used them to check and correct the computer-predicted genes of its genome, focusing on nine families of chemosensory and detoxification genes. The long reads corrected about one in sixteen predicted gene models in these families and showed that many predicted genes are not recovered as complete transcripts. By comparing the corrected genes with those of ten other grasshopper and cricket genomes, we found a burst of gene duplication that happened in the ancestor of all pygmy grasshoppers and identified five gene groups that occur only, or in much larger numbers, in Tetrigidae. These groups encode enzymes linked to cuticle formation and to the breakdown of plant and moss compounds and small proteins that bind odours and tastes. All five were detected as transcripts in adults, and tests of selection supported some of them but not all.
Abstract
Tetrigidae is an early-branching family of Caelifera whose species live on damp ground, feed largely on mosses, algae and detritus, and often show wing and pronotum polymorphism. Which chemosensory and detoxification genes underlie this lifestyle is unknown. We generated an Oxford Nanopore PCR-cDNA transcriptome from a pooled sample of adult Hyboella guangxiensis (4.25 million full-length reads) and used it, together with protein homology, to filter the 17,996 machine-learning gene models of its chromosome-level genome to 15,338 supported genes without loss of BUSCO completeness. For nine families (OBP, CSP, IR, SNMP, P450, CCE, GST, UGT, ABC), full-length transcripts corrected 28 of 447 loci, including split and fused models, and brought protein lengths into agreement with orthologs of the sister species Bolivaritettix circocephalus (paired Wilcoxon p = 0.00066). Only 251 loci were supported by complete-ORF transcripts, and 101 had no full-length reads at all. Reconciliation of family phylogenies across eleven orthopteran genomes assigned 119 well-supported duplications to the Tetrigidae stem branch, dominated by P450 (42), UGT (27) and ABC (22) genes, and identified 63 homologous groups restricted to Tetrigidae. Five lineage-specific groups detected as transcripts in adults were validated at the genome level in four non-tetrigid outgroups: a CYP301A-like array, a Tetrigidae-specific UGT clade, two Tetrigidae-specific chemosensory proteins, a CYP9E2-like array and an esterase FE4-like array. Branch-site tests found episodic selection on some members of the UGT and CYP301A-like groups and in 7 of 28 recent paralog pairs, but not in the CYP9E2-like, FE4-like or CSP groups. These genes are candidates for the cuticular, chemosensory and dietary adaptations of pygmy grasshoppers to be tested with tissue-resolved data, whereas no family member could be linked to wing polymorphism.
1. Introduction
Pygmy grasshoppers (Orthoptera: Tetrigidae) form one of the earliest-diverging lineages of Caelifera, with more than 2000 described species concentrated in tropical and subtropical regions [1,2]. Unlike the graminivorous locusts and grasshoppers of Acrididae, tetrigids are small, cryptic insects of damp ground, leaf litter, moss cushions and stream margins [3], and their diet is dominated by mosses, algae, lichens and detritus, a pattern that appears to be conserved across the family [4,5,6]. Many species also show pronounced polymorphism of wing length and pronotal shape [7,8]. Hyboella Hancock is a metrodorine genus of southern China and Southeast Asia [9], and H. guangxiensis Zheng & Jiang occurs as long- and short-winged adults in Guangxi.
Genomic resources for Tetrigidae have grown rapidly, from a de novo transcriptome of Tetrix japonica [10] to chromosome-level assemblies of Eucriotettix oculatus [11], Zhengitettix transpicula [12], Gibbotettix parvipulvillus [13], Tetrix species [14,15] and Bolivaritettix circocephalus [16]. These genomes are about one gigabase in size, several times smaller than those of the locusts [17,18]. We assembled a 1.05 Gb chromosome-level genome of H. guangxiensis (seven chromosomes; NCBI BioProject PRJNA1535534), in which B. circocephalus is the closest sequenced relative, with a median synonymous divergence of 0.119. As in most tetrigid genomes, however, the gene set was produced by a machine-learning (ML) predictor with a single transcript per gene and without species-specific RNA evidence. Such annotations are least reliable in tandemly duplicated gene families, where neighbouring paralogs are easily split, fused or mis-bounded, and they say nothing about which models are recovered as transcripts. Long-read cDNA sequencing captures entire transcripts, including start, splice junctions and polyadenylation site and therefore provides a direct test of every predicted model [19].
Chemosensory and detoxification gene families are the natural place to look for the genetic basis of a specialised habitat and diet. Odorant-binding proteins (OBPs), chemosensory proteins (CSPs), ionotropic receptors (IRs) and sensory neuron membrane proteins (SNMPs) mediate the detection of volatile and contact chemicals [20,21,22], whereas cytochrome P450 monooxygenases (P450s), carboxyl/cholinesterases (CCEs), glutathione S-transferases (GSTs), UDP-glycosyltransferases (UGTs) and ATP-binding cassette (ABC) transporters metabolise and export xenobiotics, hormones and cuticular lipids [23,24,25,26]. Family sizes track feeding ecology across insects [27], and most of the variation arises from tandem duplication followed by divergence or loss of the copies [28]. Member-level comparisons of these families across Tetrigidae have not been attempted, and an ML annotation alone is a poor basis for them.
Here, we combined a nanopore full-length transcriptome of H. guangxiensis with the ML annotation of its genome and with ten other orthopteran genomes to ask three questions: which family members are real and correctly structured; which members arose on the Tetrigidae stem or within the Hyboella lineage and show signs of selection; and which of them can plausibly be linked to the damp-ground habitat, the bryophagous diet and the wing polymorphism of pygmy grasshoppers. Because the transcriptome derives from a single pooled sample of adults, we use transcript abundance only descriptively, and we rely on genome-level validation in outgroups rather than on annotation presence to support claims of lineage specificity.
2. Materials and Methods
2.1. Insects and Nanopore cDNA Sequencing
Adults of H. guangxiensis were collected in Fangchenggang, Guangxi, China, in May 2025 and maintained in the Zoology Laboratory of Hechi University; species identity was confirmed from pronotal and wing characters. The individuals used here came from the same colony as those used for genome sequencing but were different animals. Whole bodies of long- and short-winged adults were pooled into a single sample without biological replicates. Total RNA was extracted with TRIzol reagent (Invitrogen, Carlsbad, CA, USA) and poly(A) RNA was reverse-transcribed. A PCR-cDNA library was prepared with the SQK-PCB114.24 kit (Oxford Nanopore Technologies, Oxford, UK) and sequenced on an R10.4.1 flow cell; reads were basecalled with the super-accuracy model (v5.2.0). Raw reads are available in the NCBI Sequence Read Archive (BioProject PRJNA1556956, BioSample SAMN64677678, run SRR41548219).
2.2. Read Processing, Alignment and Annotation Filtering
Pychopper v2.7.10 (Oxford Nanopore Technologies; PCB114 kit) identified reads carrying both primers, trimmed them and oriented them to the transcript strand; only these full-length reads were used further. Reads were aligned to the chromosome-level assembly with minimap2 v2.30 (-ax splice -uf -k14 -G 500000 --secondary = no) [29], and unmapped, secondary and supplementary records were removed with SAMtools v1.23 (-F 2308) [30]. The genome annotation comprised 17,996 ML gene models (AnnEvo; one transcript per gene). Each model was scored for (i) transcript support, defined as at least two reads confirming at least one annotated splice junction (tolerance 5 nt) or covering at least 30% of the CDS; (ii) homology support, defined as a DIAMOND v2.1 blastp hit against a local copy of NCBI nr (January 2025; E ≤ 1 × 10⁻⁵, query coverage ≥ 30%) [31]; and (iii) transposable-element content, with models whose CDS overlapped repeats over more than 50% of its length and that had only one line of evidence classed as TE-derived. Models with neither transcript nor homology support and TE-derived models, were removed. Completeness of the original and filtered gene sets was assessed with BUSCO v6.0.0 in protein mode against insecta_odb12 [32]. Genomic tracks in 1 Mb windows were computed with BEDTools [33] and drawn with circlize [34].
2.3. Transcript Reconstruction and Functional Annotation
Transcripts were assembled from the alignments with StringTie v3.0.3 in long-read mode (-L, minimum coverage 3, minimum isoform fraction 0.05) [35]. StringTie converts coverage to FPKM and rescales it so that values sum to 106 over all assembled transcripts, which gives transcript-level TPM; the TPM of a locus is the sum over all transcripts overlapping its CDS on the same strand. Open reading frames (ORFs) of at least 50 codons were predicted from the oriented transcripts, and alternative splicing events were classified with SUPPA2 [36]. Retained genes and transcripts were annotated with eggNOG-mapper v2.1.4 [37].
2.4. Identification of Chemosensory and Detoxification Gene Families
Nine families were screened in the ML proteome, in the full-length transcript ORFs and in the proteomes of ten other orthopterans: the tetrigids T. japonica, T. grossus, Z. transpicula, G. parvipulvillus, E. oculatus and B. circocephalus; the acridids Locusta migratoria and Schistocerca gregaria; and the ensiferans Anabrus simplex and Gryllus longicercus. Sixteen Pfam profiles were searched with hmmsearch (HMMER 3; sequence and domain E ≤ 1 × 10⁻⁵, domain coverage ≥ 0.5) [38,39]: PF01395 (OBP), PF03392 (CSP), PF00060 and PF10613 (IR), PF01130 (SNMP), PF00067 (P450), PF00135 (CCE), PF02798, PF00043, PF13417, PF13409, PF13410, PF14497 and PF01124 (GST), PF00201 (UGT) and PF00005 (ABC). Candidates also had to fall within a family-specific length window (e.g., 90–300 aa for OBP, 80–250 aa for CSP, 350–700 aa for P450, 250–3500 aa for ABC) and to be confirmed by their ten best nr hits (DIAMOND blastp, E ≤ 1 × 10⁻¹⁰, --max-target-seqs 10): the majority of hit titles had to contain family keywords and none of the exclusion keywords (listed in the deposited code). Subgroups were assigned twice. First, P450 clans, CCE classes, ABC subfamilies and GST classes were read from nr titles and, for P450s, CYP family numbers. Second, subgroups were assigned from phylogeny: each H. guangxiensis protein was aligned with curated reference proteins (all reviewed insect entries of Swiss-Prot and the Drosophila melanogaster proteome [40], 601 sequences retained after the same Pfam and length criteria) using MAFFT, trimmed with trimAl and analysed with IQ-TREE v3.1.1 (model selection among LG, WAG, JTT and Q.insect; 1000 ultrafast bootstrap replicates). The subgroup of the nearest clade containing reference sequences was taken as the tree-based assignment; where no clade with reference sequences contained the locus without outgroup contamination, the majority label of the three nearest references was used and flagged as less certain. Both assignments are reported (Table S2D,E; Figure S5). Odorant and gustatory receptors were not analysed because their transcripts are too rare in whole-body cDNA for full-length coverage.
2.5. Full-Length Correction of Gene Models
Correction was rule based, with no manual editing of gene models. Corrected loci were named HgOBP_01, HgCSP_01 and so on in order of chromosome and start position within each family. At every family locus, full-length transcripts overlapping the ML model were compared with it exon by exon by script. Loci were classed as consistent; structure corrected (altered start, stop or splice sites); split by ML (ML had incorrectly split one gene; one transcript spanning two models, which were merged); fused by ML (ML had incorrectly merged two genes; one model spanning two non-overlapping transcripts, which were separated); full-length 5′-truncated with the ML model kept; ML model failing the family criteria once the transcript ORF was used; transcribed without a complete ORF; or without full-length reads. The representative protein of each locus was the complete ORF of the most abundant transcript, and locus TPM was the sum over all its transcripts. Additional transcripts were classed as complete, domain altered, premature termination codon (PTC, more than 50 nt upstream of the last junction, a nonsense-mediated decay target) or non-coding. Tandem clusters were defined as runs of same-family loci separated by less than 100 kb. This threshold was chosen empirically: the number of clusters rose from 56 at 10 kb to 69 at 50 kb, stayed at 70–71 between 100 and 200 kb and rose only slowly beyond, so the cluster set is stable over a fourfold range around 100 kb (Table S4D,E). The effect of correction was quantified as the ratio of protein length to the B. circocephalus ortholog before and after correction.
2.6. Orthology with the Sister Species and Duplication Timing
Corrected H. guangxiensis proteins were compared with B. circocephalus family members by reciprocal DIAMOND searches and classed as 1:1 orthologs, co-orthologs, H. guangxiensis in-paralogs or species-specific; B. circocephalus members without a counterpart were listed separately. Codon alignments were built by back-translating MAFFT v7.526 protein alignments [41], and Ka, Ks and Ka/Ks were computed by the Nei–Gojobori method [42]. For each H. guangxiensis member the nearest paralog was identified, and the pair was dated as post-speciation when its Ks was below 0.119, the median Ks of 3340 single-copy orthologs between H. guangxiensis and B. circocephalus. Pairs for which Ks could not be estimated because of saturation (pS ≥ 0.75; 174 of 328 pairs) were classed as pre-speciation since only old pairs reach saturation, and therefore none were excluded from the post-speciation count.
2.7. Family Phylogenies and Reconciliation Across Eleven Genomes
For each family (or clan for P450, class for CCE and subfamily for ABC) all members of the eleven species, with the corrected H. guangxiensis proteins, were aligned with MAFFT (--localpair --maxiterate 1000, or --auto for more than 250 sequences), trimmed with trimAl (-automated1) [43] and analysed with IQ-TREE v3.1.1 under the best-fit model with 1000 ultrafast bootstrap and SH-aLRT replicates [44,45]; sequences shorter than 60% of the family median were excluded. Each tree was rooted by reconciliation with the species tree [2] ((A. simplex, G. longicercus), ((L. migratoria, S. gregaria), ((T. japonica, T. grossus), (Z. transpicula, (G. parvipulvillus, (E. oculatus, (B. circocephalus, H. guangxiensis))))))) so as to minimise the number of duplications, and every duplication node was assigned to a species-tree branch and counted as supported when its ultrafast bootstrap was at least 95. Tetrigidae-level homologous groups (HOGs) were obtained by cutting each tree at duplications older than the Tetrigidae stem. A HOG was called Tetrigidae-only when present in at least three tetrigids and absent from all four outgroups, Tetrigidae-expanded when the median tetrigid copy number exceeded the outgroup maximum, lost in Tetrigidae when absent from all tetrigids, and H. guangxiensis-absent when present in B. circocephalus but not in H. guangxiensis; these categories overlap partly and are distinct from the counts of duplication events. Every absence call was checked by DIAMOND blastx (--very-sensitive, E ≤ 1 × 10⁻⁵) of 1 Mb genome windows (100 kb overlap) and of the full-length transcripts against the missing proteins. A genome hit with at least 80% identity and 70% query coverage was called intact, a hit with 50–80% identity or lower coverage a relic, and no hit above 50% identity absent. Trees were drawn with ggtree [46].
2.8. Validation of Key Genes and Tests of Selection
HOGs were ranked by lineage pattern, number of tetrigid species, number of full-length-supported H. guangxiensis members and summed TPM, and the five highest-ranking groups with a plausible link to the biology of Tetrigidae were retained. To exclude annotation gaps in the outgroups, four representative H. guangxiensis proteins from each group and four conserved 1:1 orthologs as controls, were searched against the genome sequences (blastx, windows as above) and the annotated proteomes (blastp) of A. simplex, G. longicercus, L. migratoria and S. gregaria. A genome locus was taken as evidence of an unannotated ortholog when its identity to the query exceeded that of the best annotated protein by more than ten percentage points. For display, the smallest subtree containing all key members was extracted from the eleven-species tree. Selection was tested in the 18 HOGs that contain the five key groups or at least 1 of the 28 post-speciation paralog pairs. For each HOG the subtree was extracted from the family tree, and protein alignments (MAFFT --auto) were back-translated to codon alignments with columns of more than 50% gaps removed. The adaptive branch-site random effects model (aBSREL) [47] in HyPhy v2.5.86 [48] was run on all branches with Holm correction within each HOG (corrected p ≤ 0.05). Gene-wide episodic selection on the H. guangxiensis terminal branches of recent pairs was tested with BUSTED [49]. A pair was counted as under episodic selection when either copy was significant in aBSREL. These tests detect episodic positive selection at a subset of sites and do not measure function.
3. Results
3.1. Full-Length Reads Identify Unsupported Gene Models Without Loss of Completeness
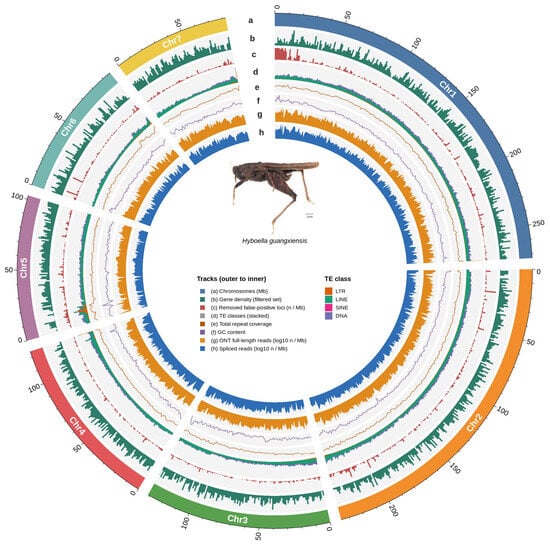
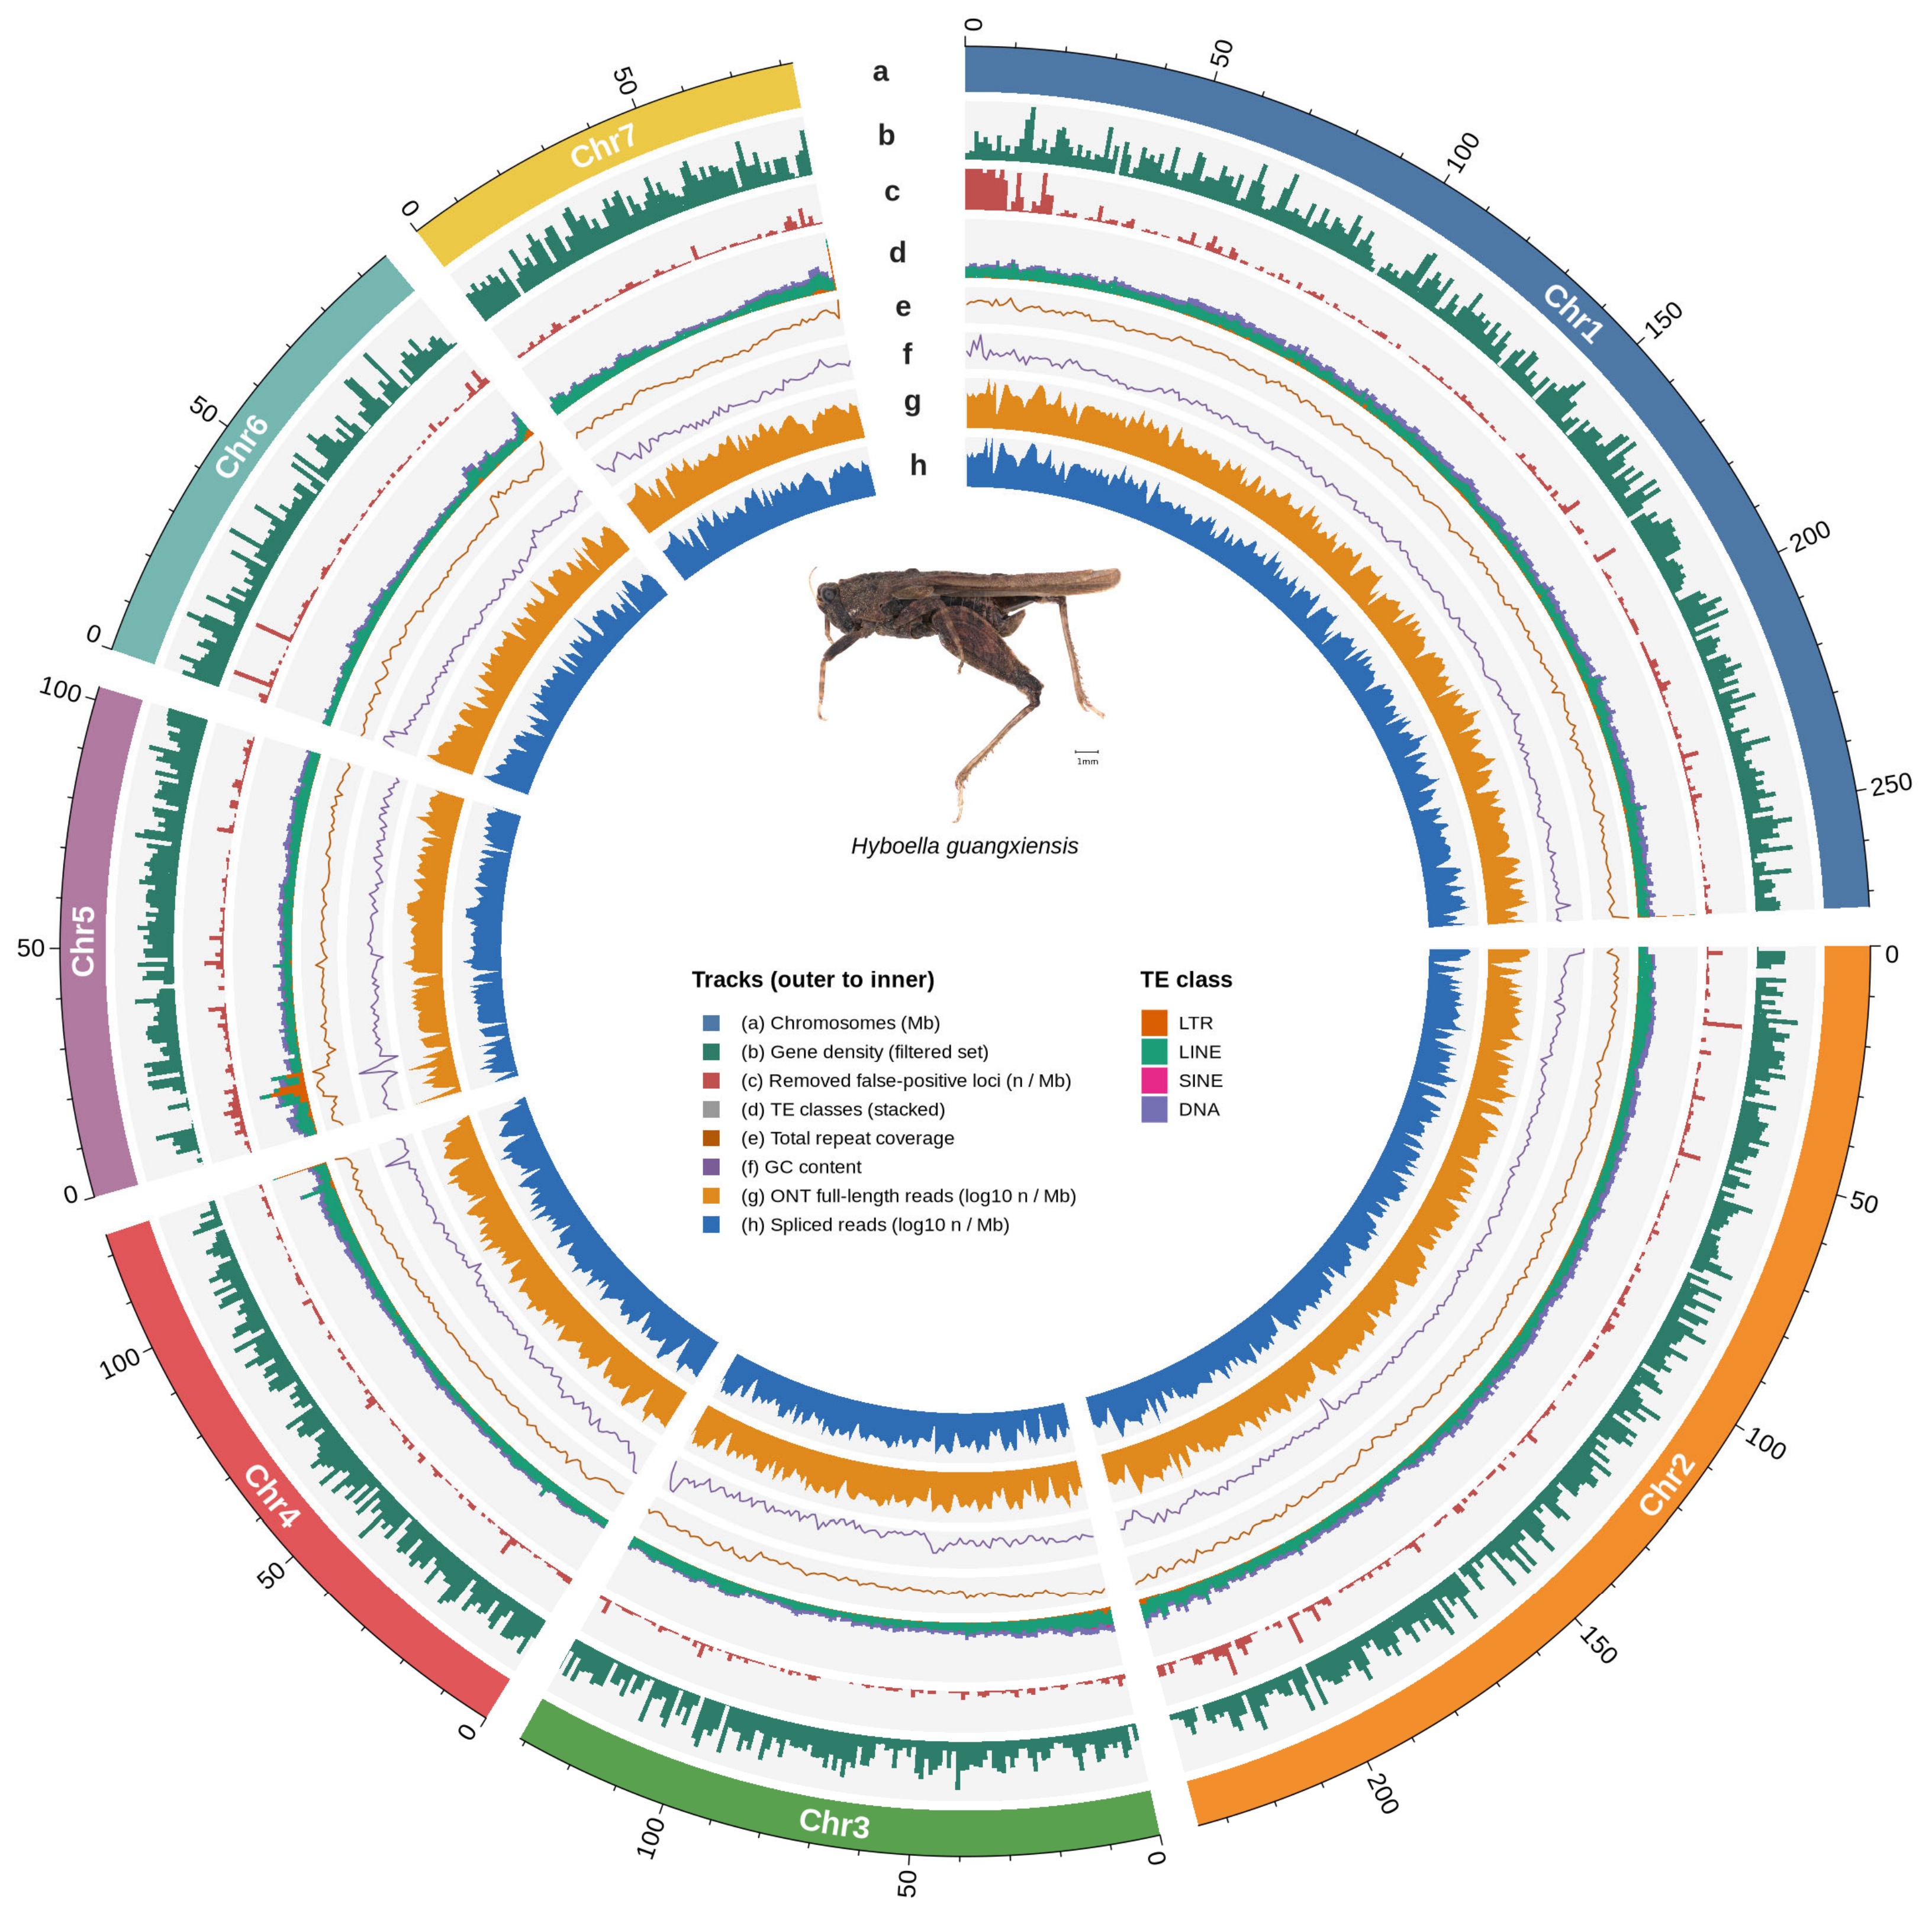
Of 4,834,007 nanopore reads, 4,252,583 (88.0%) carried both primers and were classed as full-length, and 4,226,813 of these (99.4%) aligned to the genome. Transcript and homology evidence overlapped only partly among the 17,996 ML models: 11,499 had both, 1675 transcript support only, 2164 homology support only, 803 TE-derived with a single line of evidence and 1855 neither (Table S1). The filtered set of 15,338 genes (85.2%) retained exactly the BUSCO score of the original annotation (96.4% complete, 95.4% single-copy, 1.0% duplicated, n = 3114), showing that the 2658 removed models contributed nothing to conserved gene content. The removed models were not randomly placed: they concentrated in repeat-rich, gene-poor chromosome segments, whereas full-length reads and spliced reads followed gene density (Figure 1). StringTie reconstructed 19,611 transcripts with coverage of at least three reads, 17,413 of which encoded an ORF of at least 50 codons, and eggNOG-mapper annotated 13,615 of the retained genes.
Figure 1.
The genomic landscape of the seven chromosomes of Hyboella guangxiensis in 1 Mb windows. Tracks from the outside inward: (a) chromosomes (Mb); (b) density of retained genes; (c) removed unsupported or TE-derived gene models (loci per Mb); (d) transposable-element classes (stacked); (e) total repeat coverage; (f) GC content; (g) full-length nanopore reads (log10 reads per Mb); (h) spliced reads (log10 reads per Mb). The photograph shows a long-winged adult male of H. guangxiensis (scale bar, 1 mm).
3.2. Full-Length Transcripts Correct Gene Models in Nine Gene Families
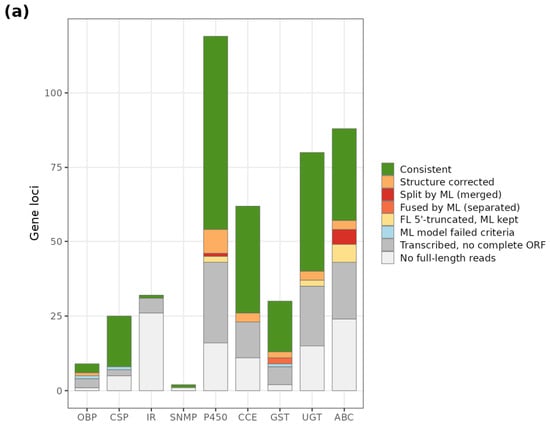
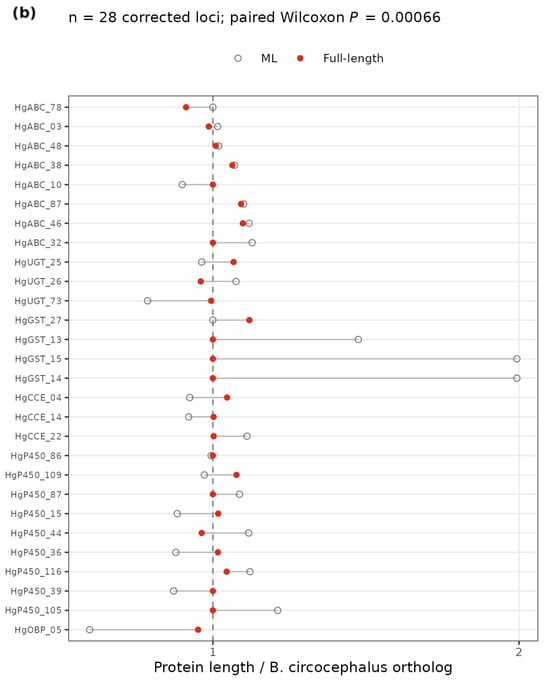
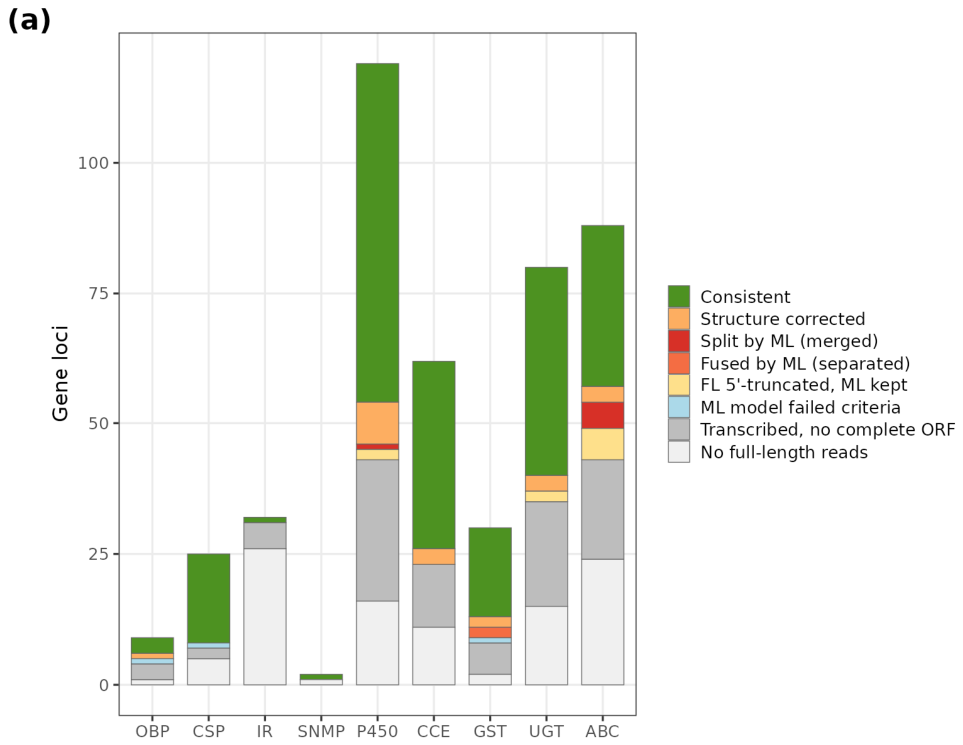
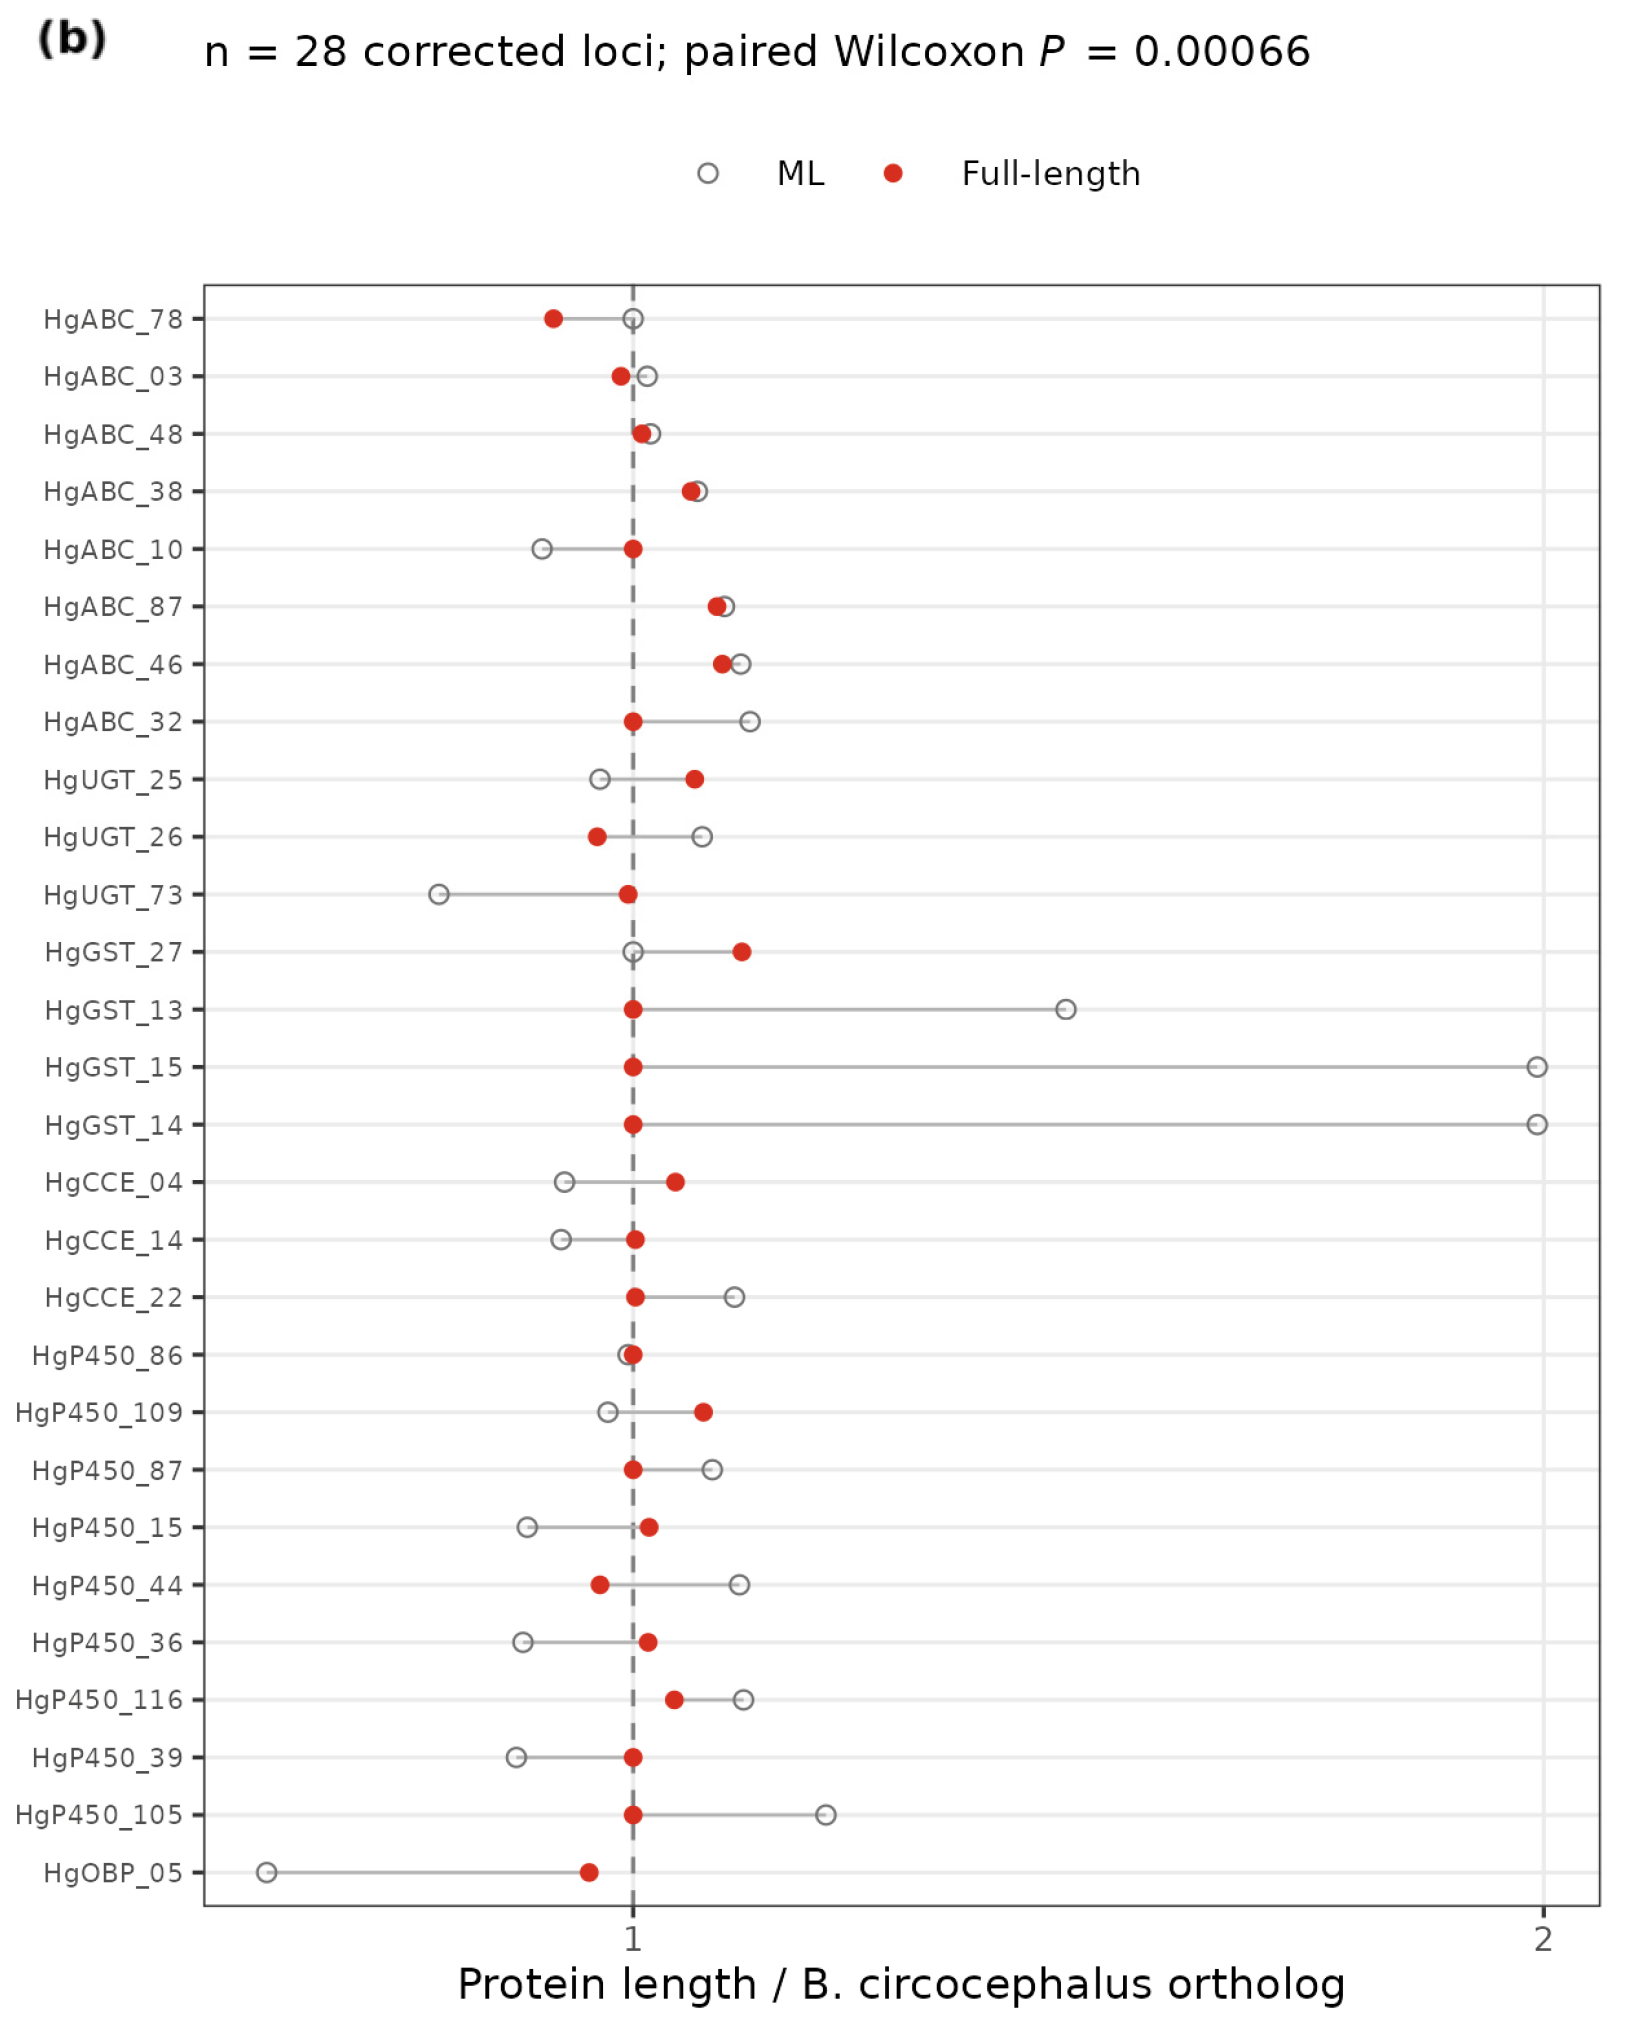
The nine families comprised 442 ML members and, after correction, 447 loci: 9 OBPs, 25 CSPs, 32 IRs, 2 SNMPs, 119 P450s, 62 CCEs, 30 GSTs, 80 UGTs and 88 ABC transporters (Table S2). Only 211 loci (47%) were both covered by full-length reads and consistent with the ML model (Figure 2a). Full-length transcripts changed the structure of 20 models, merged 6 pairs of models that the predictor had split (one P450, five ABC transporters) and separated 2 GST models that it had fused; at 10 further loci the ML model was kept because the transcript was 5′-truncated, and 3 models failed the family criteria once the transcript ORF was used (Table S2). A large part of the annotation was simply untested: 101 loci (23%) had no full-length reads, including 26 of the 32 IRs, and 94 (21%) were transcribed but yielded no complete ORF. The 28 corrected loci were the ones whose ML proteins deviated most in length from their B. circocephalus orthologs; for all of them, correction reduced the median absolute log2 length ratio from 0.106 to 0.015 (paired Wilcoxon test, p < 0.001; Figure 2b). The split and fused cases illustrate the two typical failure modes of ML prediction in tandem arrays: a single 1285 aa ABC transporter (HgABC_03) predicted as two models of 797 and 514 aa (Figure S1a) and two adjacent 204 aa GSTs (HgGST_14 and HgGST_15) predicted as one 406 aa model (Figure S1b).
Figure 2.
The correction of machine-learning (ML) gene models by full-length transcripts. (a) The classification of the 447 loci of nine gene families by agreement between the ML model and full-length transcripts. (b) The ratio of protein length to the Bolivaritettix circocephalus ortholog for the 28 corrected loci, before (open) and after (filled) correction.
Subgroup labels derived from nr titles were compared with labels derived from phylogeny against curated reference proteins (Figure S5; Table S2D,E). All 447 loci were placed in a clade with reference sequences: 377 by the nearest clade and 70 (32 ABC transporters, 18 IRs and 10 GSTs among them) only by their three nearest references. The two schemes agreed for 118 of 119 P450s, all 25 CSPs, 49 of 62 CCEs, 24 of 30 GSTs and 52 of 88 ABC transporters, but for only 6 of 32 IRs. Most ABC disagreements (36 loci) were loci labelled ABCC by nr titles that grouped with ABCB references with ultrafast bootstrap support of only 52–67, and the nr-based split of IRs into conserved and divergent receptors is poorly supported by the few reference IRs. We therefore base the following analyses on family, P450 clan and CCE class and do not interpret ABC subfamily or IR subclass counts.
3.3. Chemosensory Families Are Small and Conserved in Tetrigidae
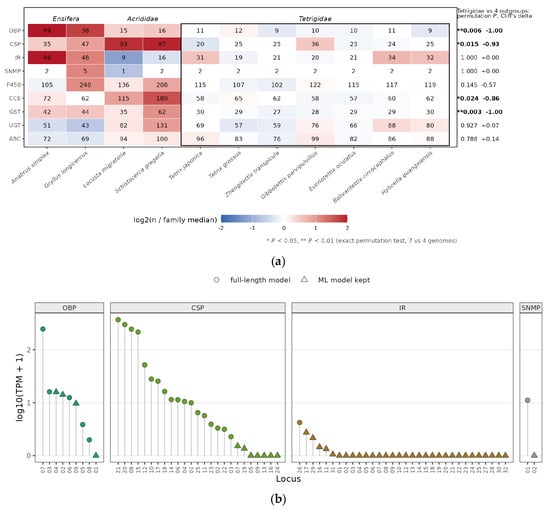
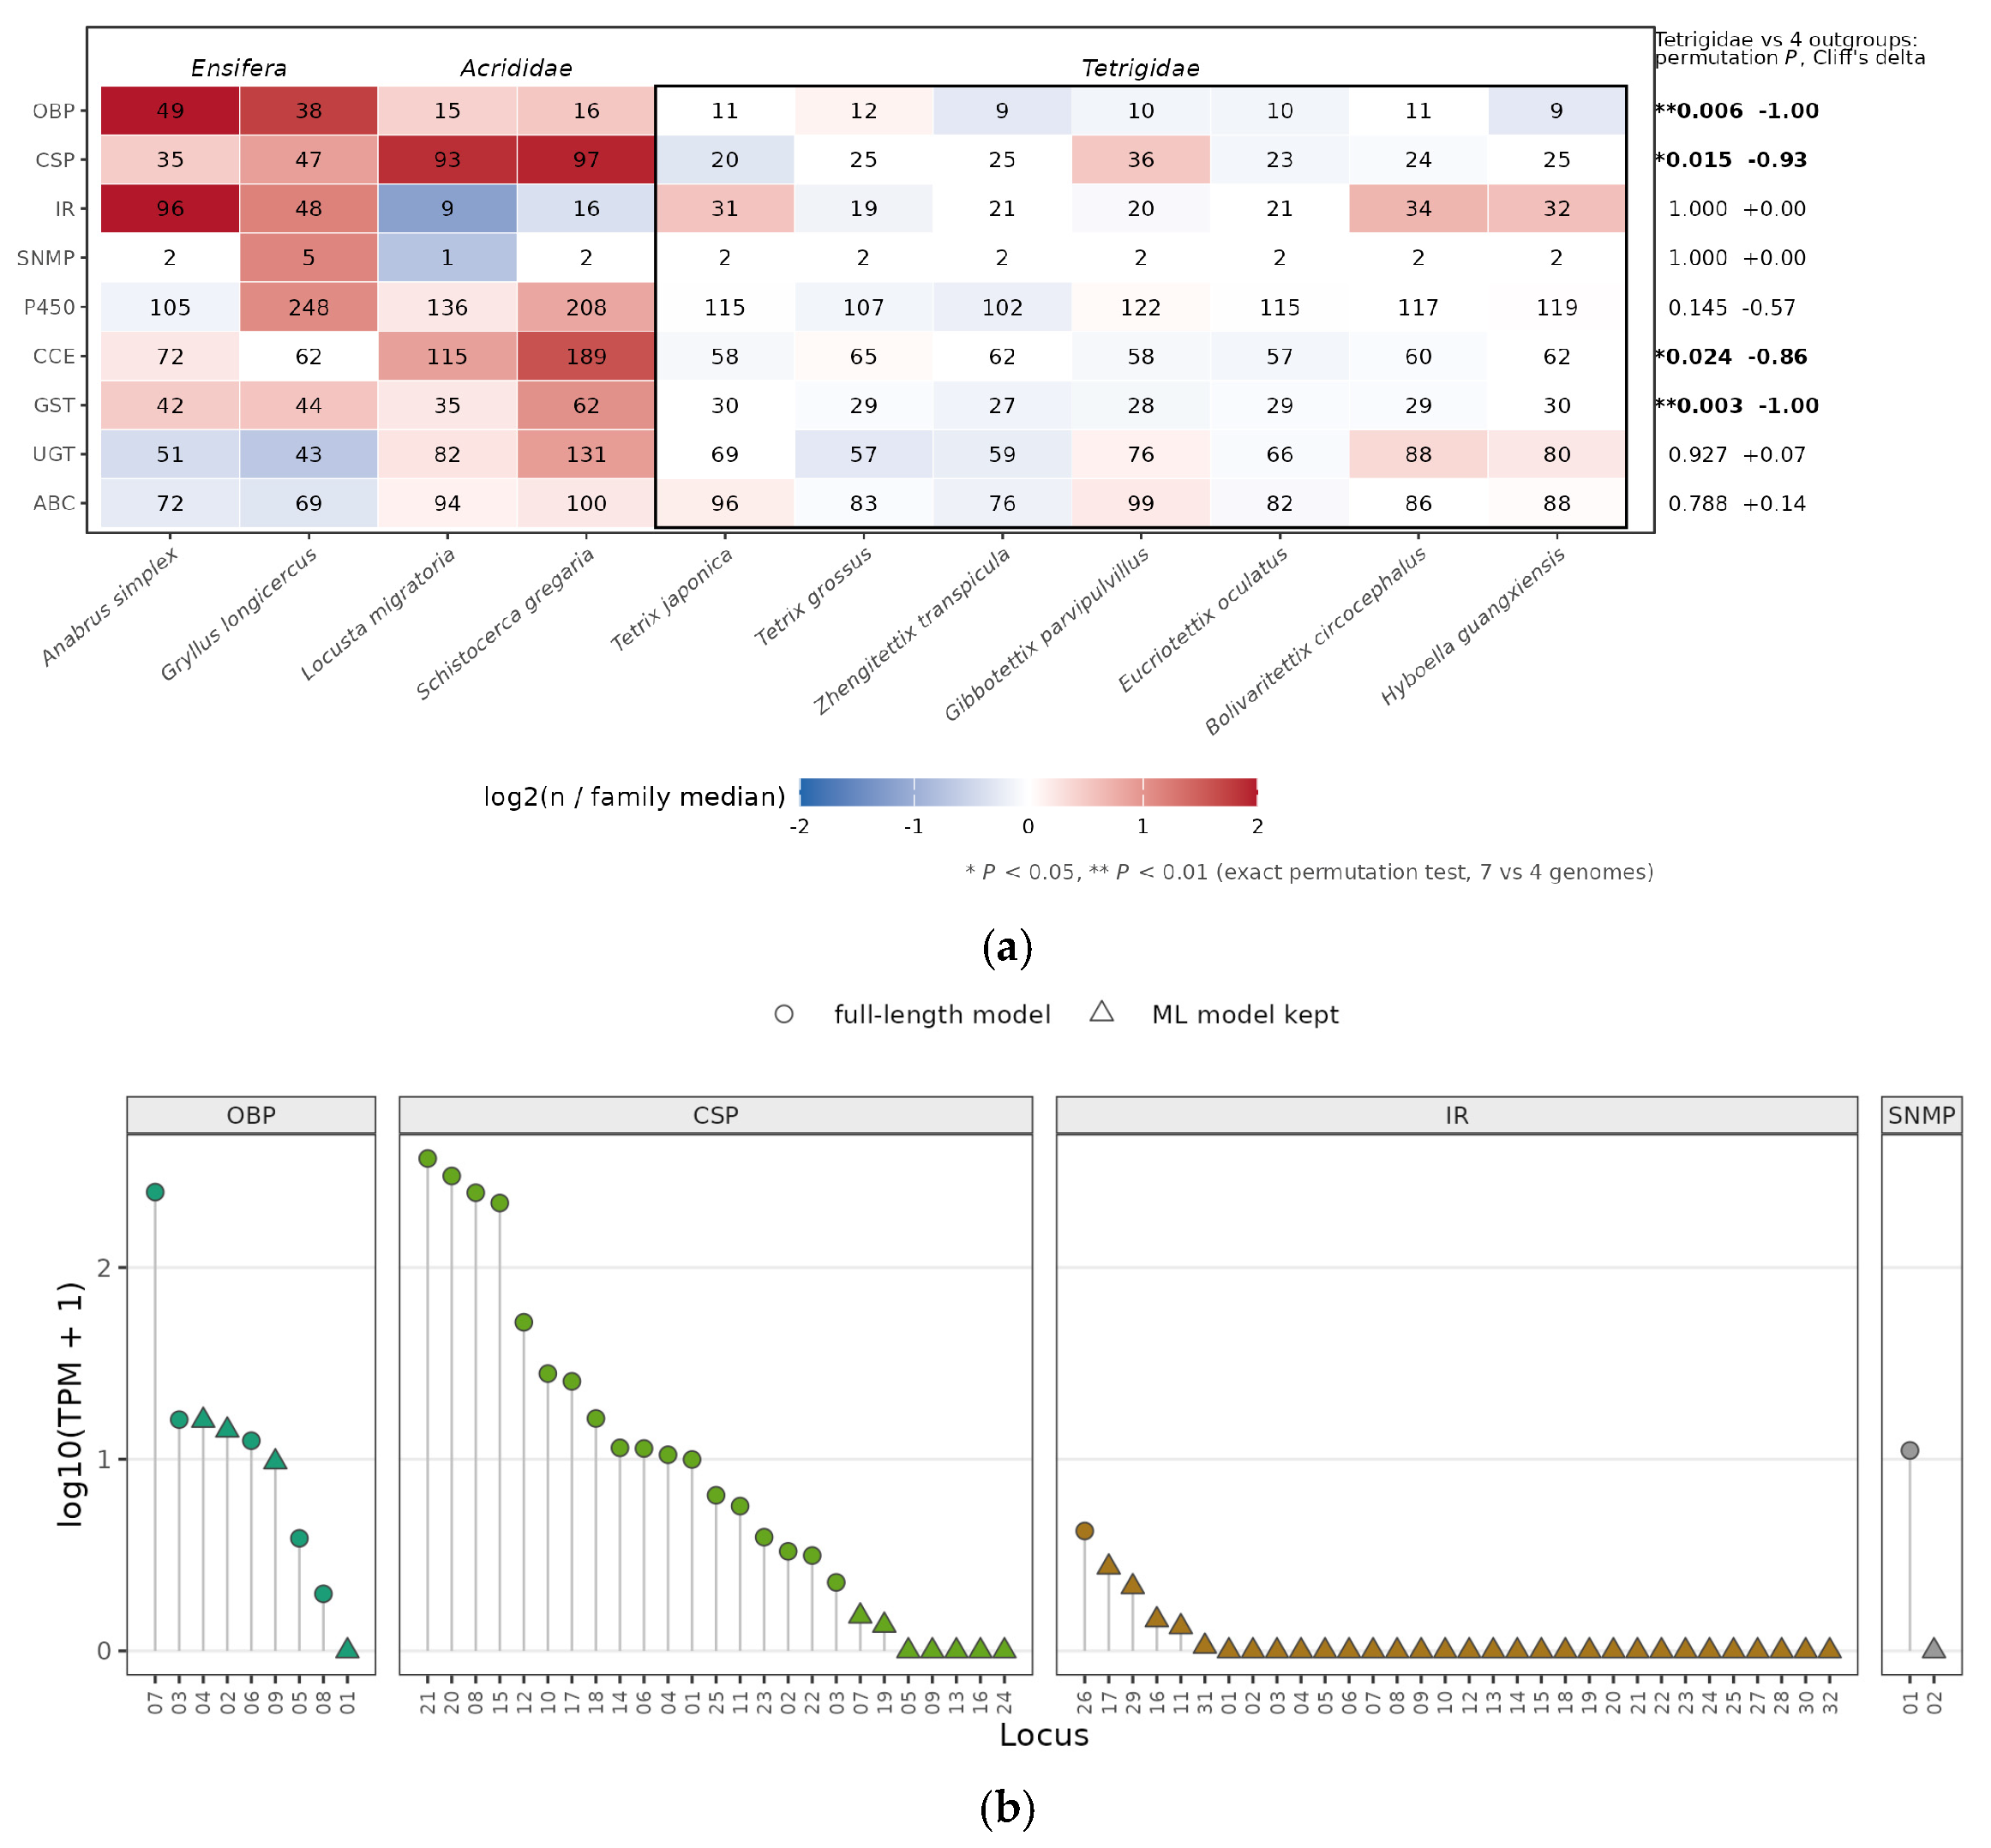
Copy numbers of the nine families across the eleven genomes, determined with identical criteria, separated Tetrigidae from the other orthopterans mainly in the chemosensory families (Figure 3a; Table S3). Tetrigids possessed 9–12 OBPs against 15–49 in acridids and ensiferans (Wilcoxon test, p = 0.010; exact permutation p = 0.006, Cliff’s δ = −1.00), 20–36 CSPs against 35–97 (permutation p = 0.015, δ = −0.93) and 19–34 IRs against 9–96 (no difference). Because the four outgroups differ in annotation quality, we also compared tetrigids with the two best-annotated acridids, Locusta migratoria and Schistocerca gregaria: tetrigids again had fewer OBPs, CSPs, CCEs and P450s (δ = −1.00), but with only two outgroups the smallest attainable permutation p is 0.028, so these comparisons are descriptive. The detoxification families were of similar size in all seven tetrigids (P450 102–122, CCE 57–65, GST 27–30, UGT 57–88, ABC 76–99). Almost every H. guangxiensis chemosensory member had a 1:1 ortholog in B. circocephalus (Table S4). Transcript abundance within families was highly uneven (Figure 3b): the five OBPs with full-length support were all detected (locus TPM 1–246), four of the eighteen full-length CSPs exceeded 200 TPM and HgCSP_21 had the highest TPM of all nine families (369 TPM), whereas only one IR had a complete full-length transcript and most IR loci were below 1 TPM. The ML annotation had missed one OBP: the B. circocephalus OBP without an annotated H. guangxiensis counterpart was recovered as an intact, unannotated 146 aa gene on chromosome 2 (89% identity), and the same applied to one IR on chromosome 6, so no chemosensory gene was lost in H. guangxiensis.
Figure 3.
Chemosensory gene families in Tetrigidae. (a) Copy numbers of nine families in eleven orthopteran genomes; colour shows log2 of the count relative to the family median, and the box encloses the seven tetrigids (gxc, Hyboella guangxiensis; boci, Bolivaritettix circocephalus; Eocu, Eucriotettix oculatus; GiPa, Gibbotettix parvipulvillus; hczz, Zhengitettix transpicula; ctz, Tetrix grossus; Tjap, Tetrix japonica; lomi, Locusta migratoria; sg, Schistocerca gregaria; grlo, Gryllus longicercus; ansi, Anabrus simplex). Right-hand columns give the exact permutation p and Cliff’s δ for the seven tetrigids against the four non-tetrigid outgroups (p < 0.05; p < 0.01). (b) Transcript abundance (log~10~(TPM + 1)) of every OBP, CSP, IR and SNMP locus of H. guangxiensis * in the pooled sample, ordered by abundance within each family; circles, loci with a full-length transcript model; triangles, loci retained as ML models.
3.4. Recent Duplication Is Concentrated in Tandem UGT and P450 Arrays
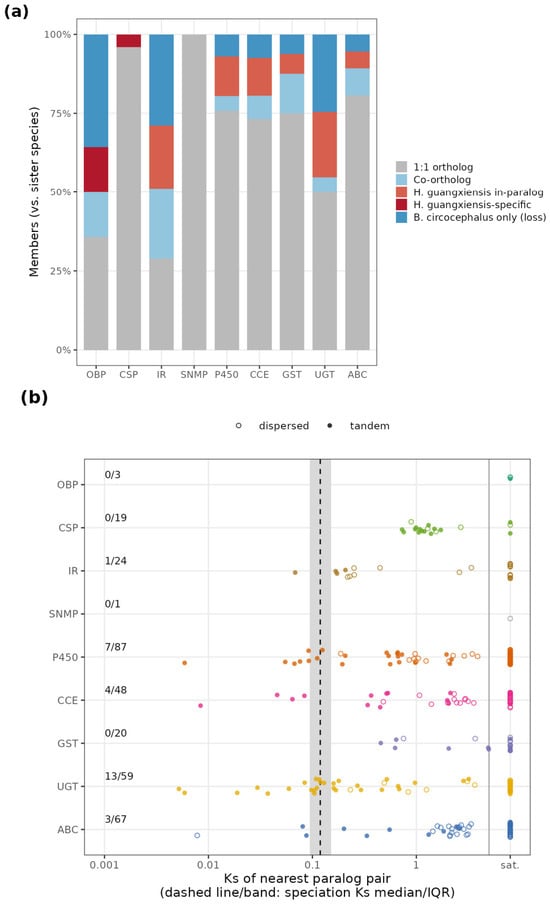
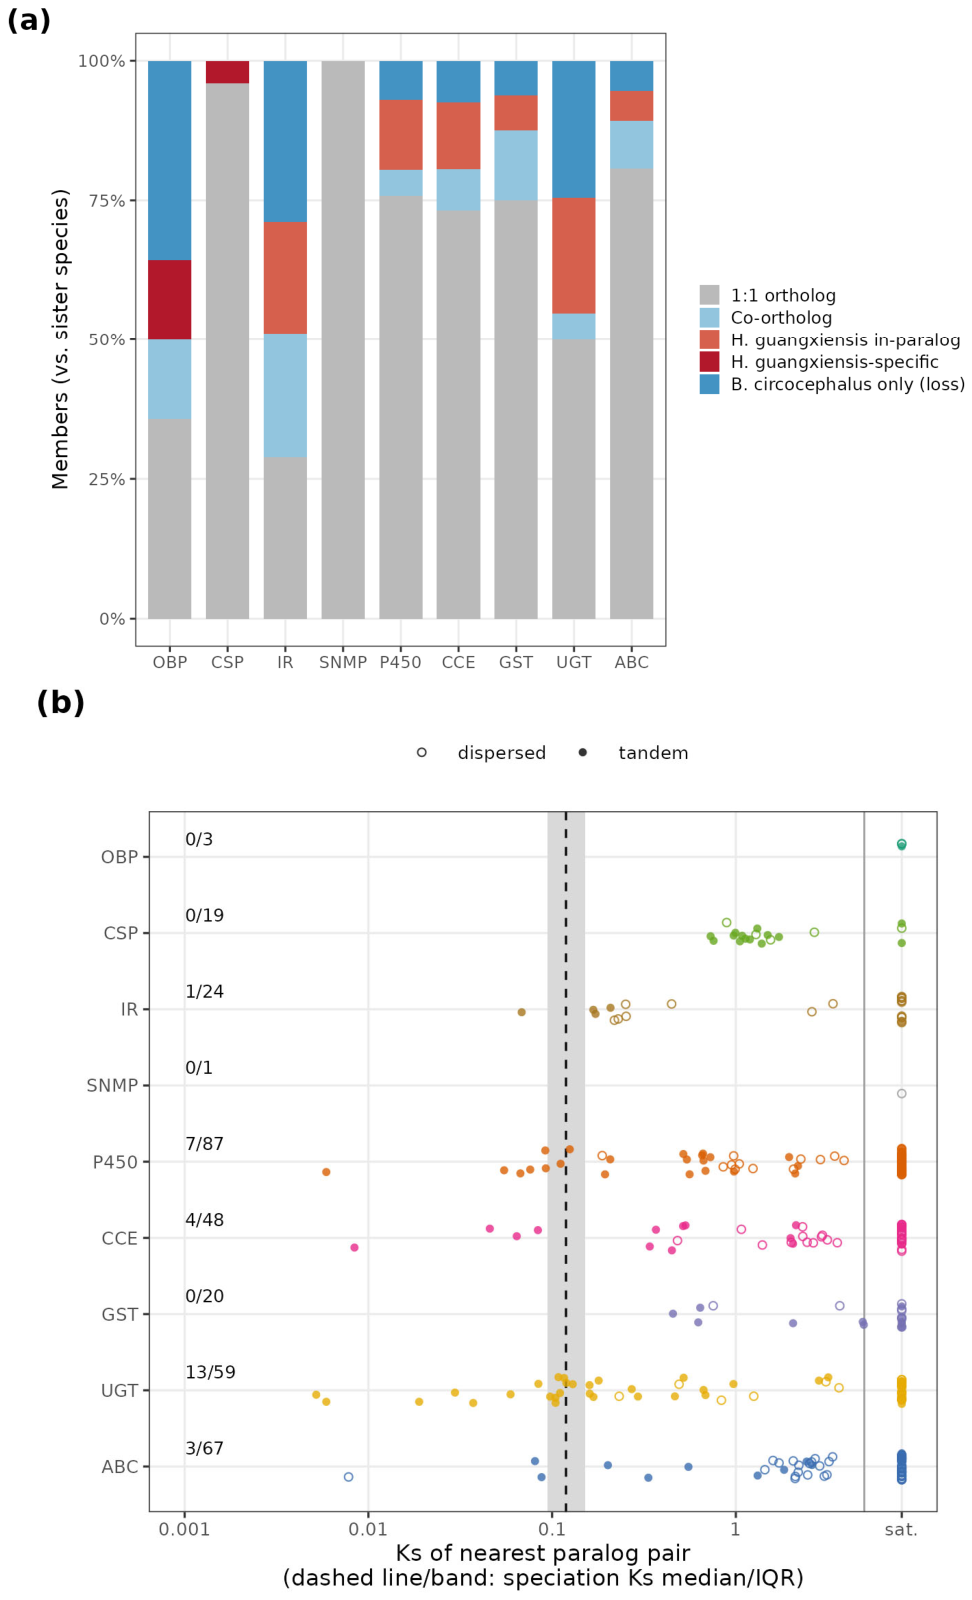
Of the 447 loci, 342 (77%) had a 1:1 ortholog in B. circocephalus, 40 were co-orthologs, 62 were H. guangxiensis in-paralogs and 3 had no sister-species hit; 65 B. circocephalus members lacked a counterpart (Figure 4a; Table S4). In-paralogs were most frequent among UGTs (26% of members) and IRs, and the B. circocephalus-only members were concentrated in OBP, IR and UGT. Dating of the 329 nearest-paralog pairs against the speciation Ks of 0.119 placed 28 pairs after the split from B. circocephalus: 13 UGTs, 7 P450s, 4 CCEs, 3 ABC transporters and 1 IR, and 27 of the 28 were tandem (Figure 4b; Table S4). The tandem clusters were robust to the distance threshold: 71 clusters containing 255 of the 447 loci (57%) at 100 kb, against 56 clusters and 37% of loci at 10 kb and 79 clusters and 65% at 1 Mb. GST, UGT and CSP loci were strongly clustered (median distance between neighbouring loci 8–17 kb), whereas ABC transporters and IRs were dispersed (Table S4E). Ten of the thirteen recent UGT pairs lay in a single 153 kb array of 16 genes on chromosome 1 (HgUGT_01–16; Figure S2b), in which every gene but one has its nearest paralog within the array and younger than the speciation event; this array is thus the most actively duplicating region of all nine families. Its members are detected at low to moderate levels (summed TPM 64) and 9 of the 16 lack a complete full-length ORF. Ka/Ks of the 1:1 orthologs was below 0.3 in every family (medians: OBP 0.097, CSP 0.255, IR 0.245, SNMP 0.057, P450 0.140, CCE 0.177, GST 0.095, UGT 0.211, ABC 0.141; Figure S2a), with the highest values in CSPs, IRs and UGTs, consistent with relaxed constraint rather than with positive selection on the family as a whole.
Figure 4.
Orthology, duplication timing and selection in nine gene families. (a) Relation of each Hyboella guangxiensis locus to Bolivaritettix circocephalus, including B. circocephalus members with no counterpart. In (a), grey indicates 1:1 orthologs, light blue co-orthologs (best hit shared with another locus or not reciprocal, without a closer paralog in H. guangxiensis), orange-red H. guangxiensis in-paralogs, dark red H. guangxiensis-specific members and blue B. circocephalus members with no counterpart (loss). (b) Ks of the nearest paralog pair for every member; point colour indicates the gene family (as in the rows), open circles dispersed and filled circles tandem pairs; the dashed line marks the H. guangxiensis–B. circocephalus speciation Ks (0.119, grey band = interquartile range); numbers give post-speciation pairs over all pairs; sat., saturated.
3.5. Transcript Abundance and Isoform Structure of Family Members
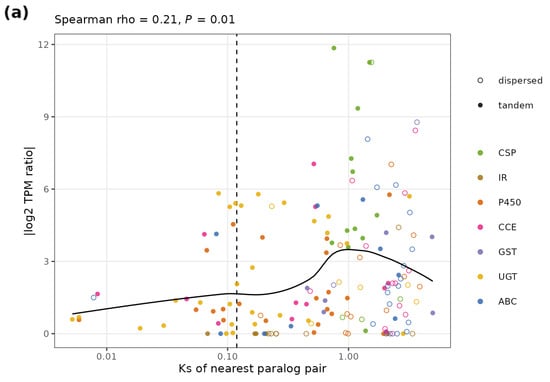
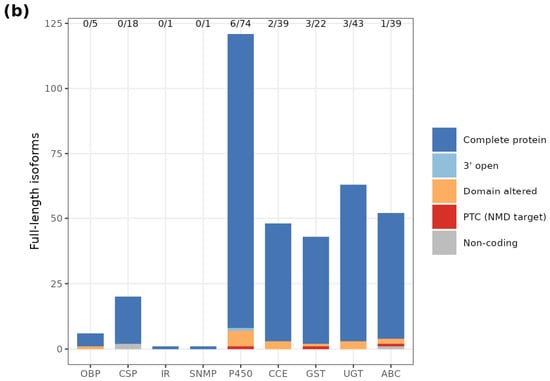
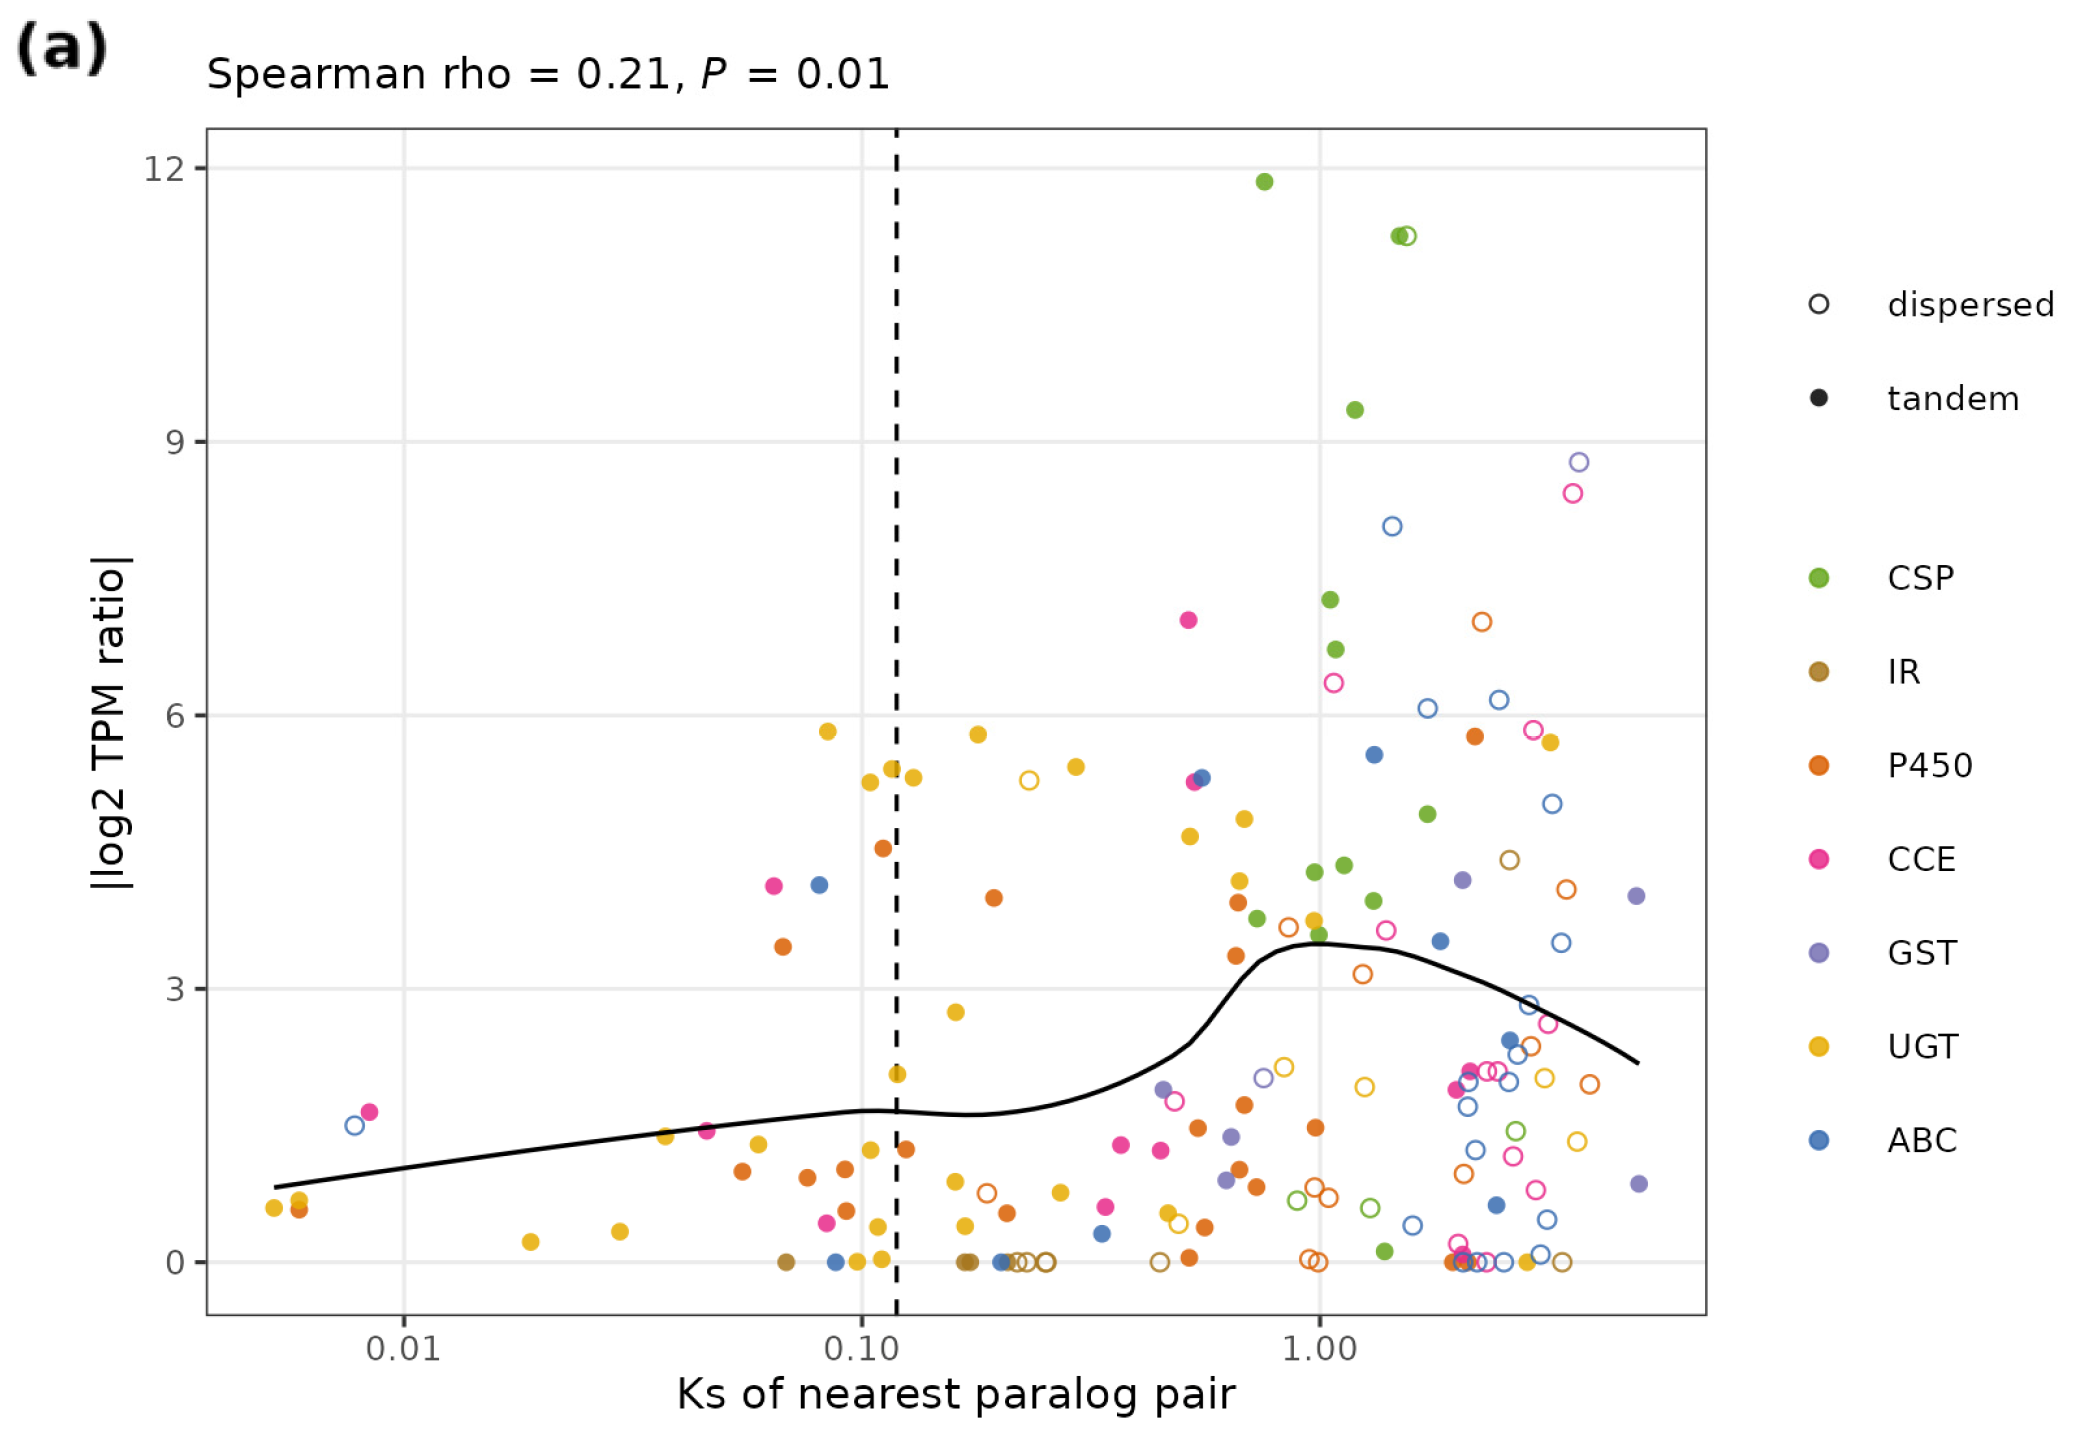
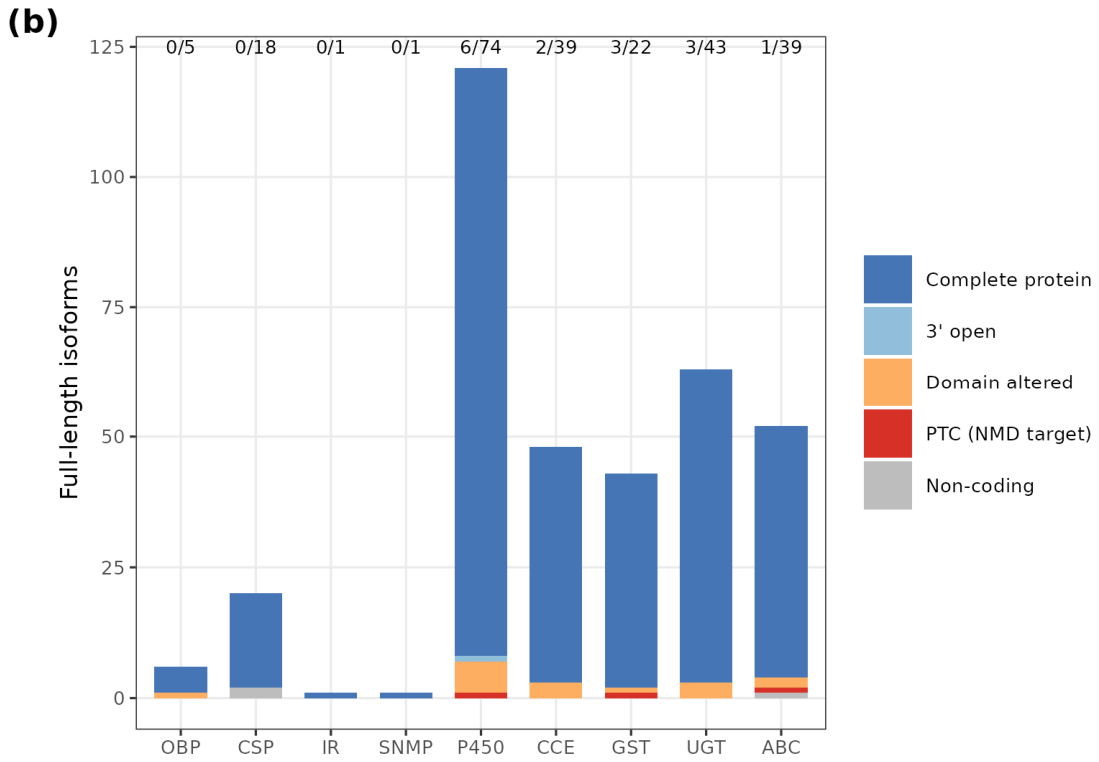
Transcript abundance in the pooled sample differed by family and by model class (Figure S1c). GSTs and CSPs had the highest TPM. Full-length P450 and CCE loci spanned more than two orders of magnitude, and three-quarters of the loci retained only as ML models (157 of 205) were below 1 TPM, so such models are either silent in adults or expressed in tissues and conditions not sampled. The difference in TPM between nearest paralogs increased with their age (Spearman ρ = 0.21, p = 0.010; Figure 5a): pairs younger than the speciation event differed by a median of 1.0 log2 unit in TPM, older pairs by about 2 units, and a quarter of the older pairs by more than 4 units. The 252 loci with full-length-derived ORFs produced 355 isoforms, 332 of them encoding the complete domain; 16 isoforms altered the domain. Three carried a PTC. One had an open 3′ end, and three were non-coding (Table S2C). Alternative splicing was detected at 63 loci, mostly alternative first exons, exon skipping and alternative 3′ sites, but only 15 loci (6 P450, 2 CCE, 3 GST, 3 UGT, 1 ABC) produced more than one distinct complete protein (Figure 5b). Protein diversity in these families therefore arises mainly from gene duplication rather than from splicing.
Figure 5.
Divergence in transcript abundance of paralogs and isoform structure. (a) Absolute log2 TPM ratio between nearest paralogs against their Ks; dashed line, speciation Ks; filled, tandem; open, dispersed; curve, loess fit. (b) Full-length isoforms per family by coding class; numbers give loci with more than one distinct complete protein over all full-length-supported loci.
3.6. A Burst of Duplication on the Tetrigidae Stem and Five Lineage-Specific Gene Groups
Reconciliation of the eleven-species family trees with the species tree placed 119 well-supported duplications on the stem branch of Tetrigidae, against 114 on the stem of Acrididae, 68 on the branch leading to Orthoptera as sampled and 25 on the terminal H. guangxiensis branch (Table S3). The Tetrigidae-stem events were dominated by P450 (42), UGT (27) and ABC (22), followed by CCE (10), CSP (8), GST (4), IR (4) and OBP (2). The 550 HOGs included 63 restricted to Tetrigidae, 42 expanded in Tetrigidae and 25 absent from all tetrigid annotations (Table S3); the number 42 thus refers to expanded HOGs here and to P450 duplication events above. Genome-level checks of the 25 absent HOGs found no credible sequence for 17, fragmentary relics for 6, and in 2 cases (an acetylcholinesterase and ABCE1) an annotated locus that had been assigned to a neighbouring HOG so that no essential gene was missing; the ecdysteroid-pathway P450s CYP302A1, CYP306A1 and CYP18A1 were all present as intact loci.
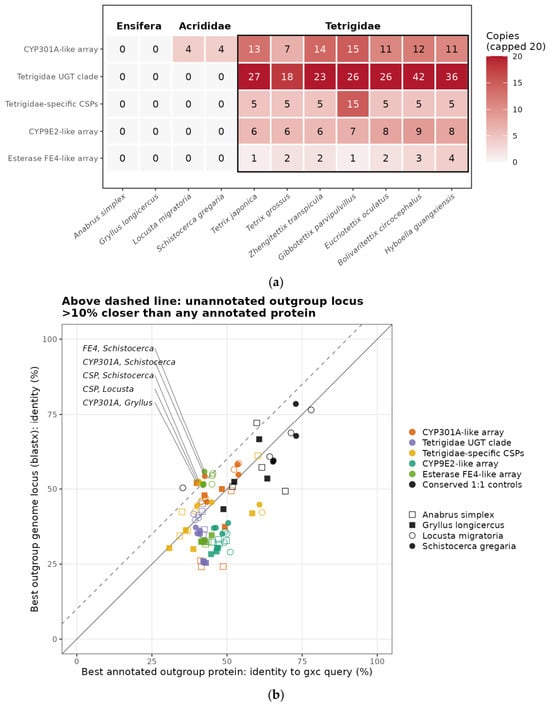
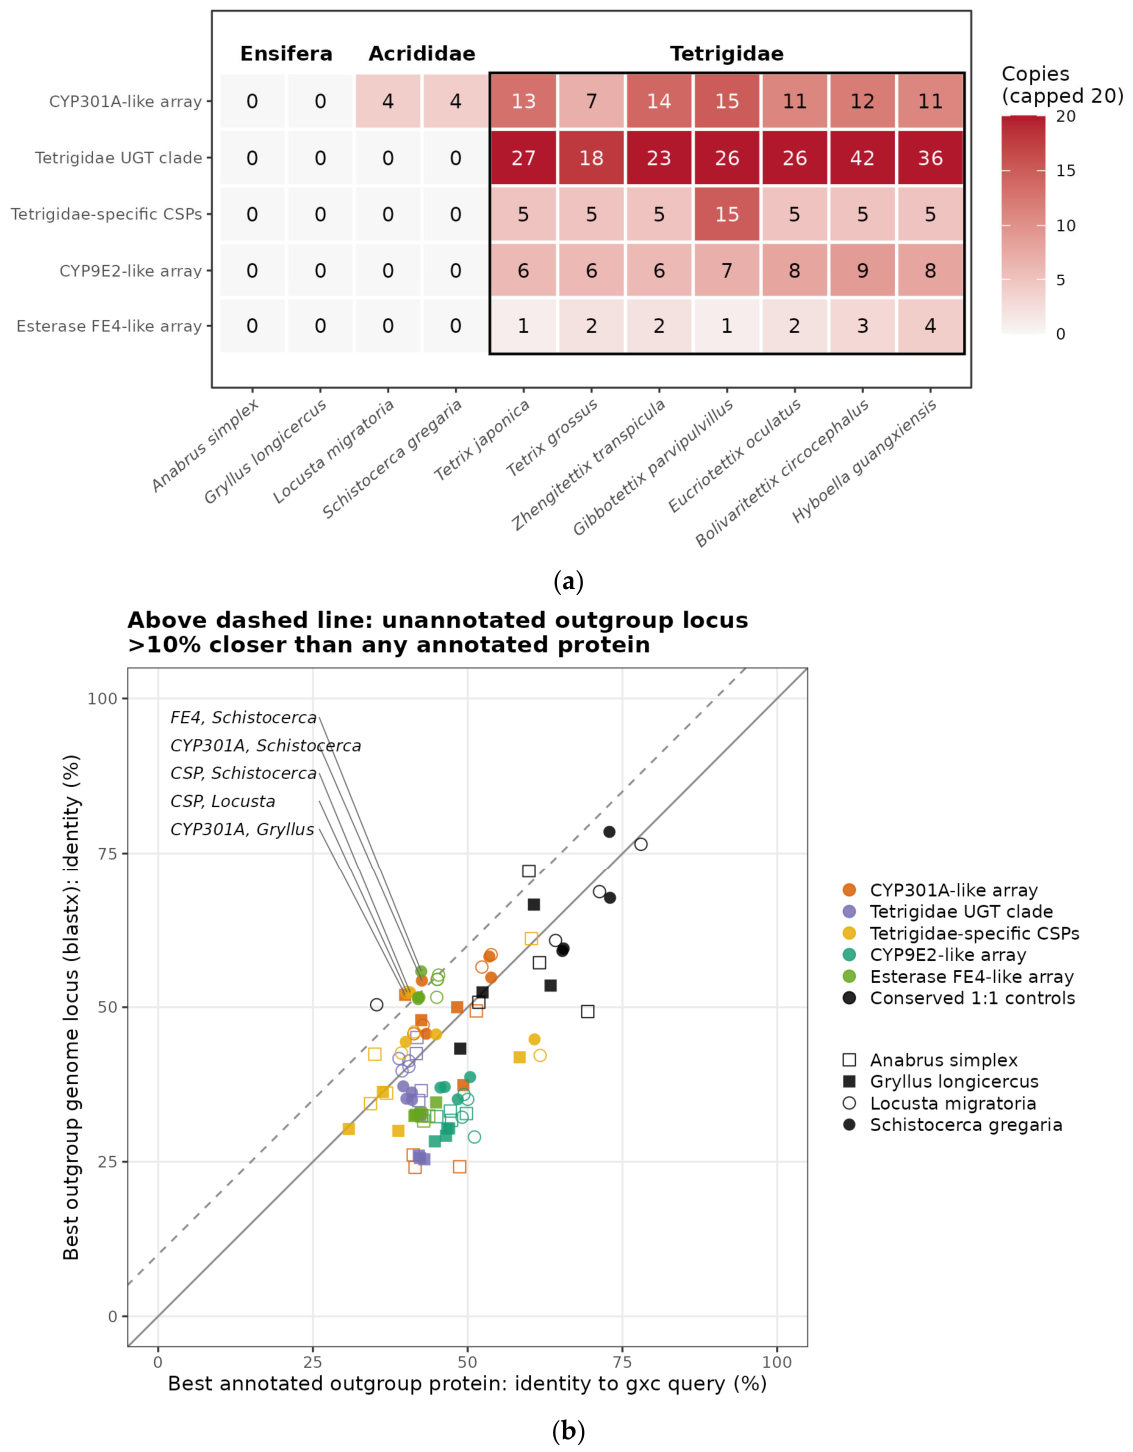
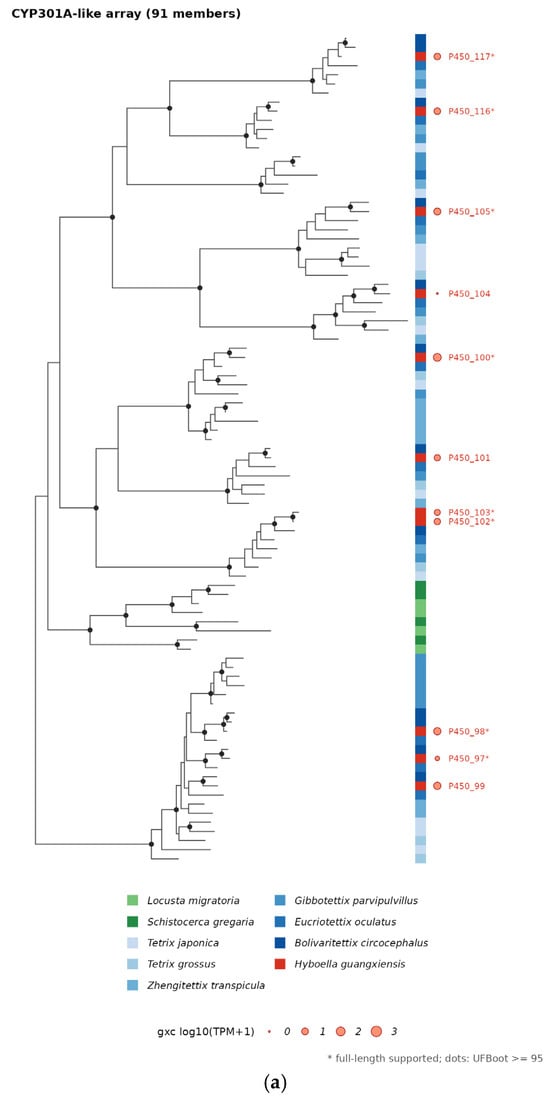
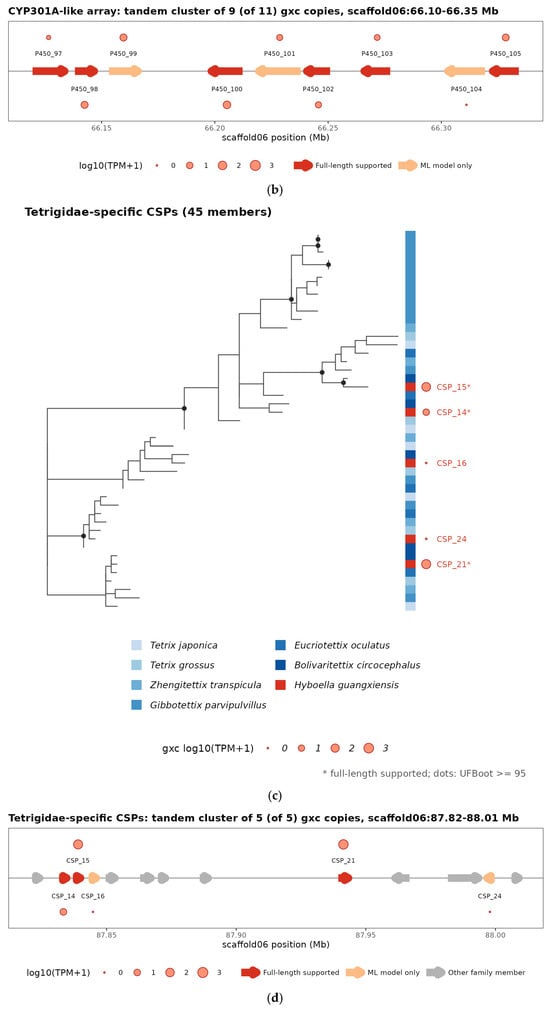
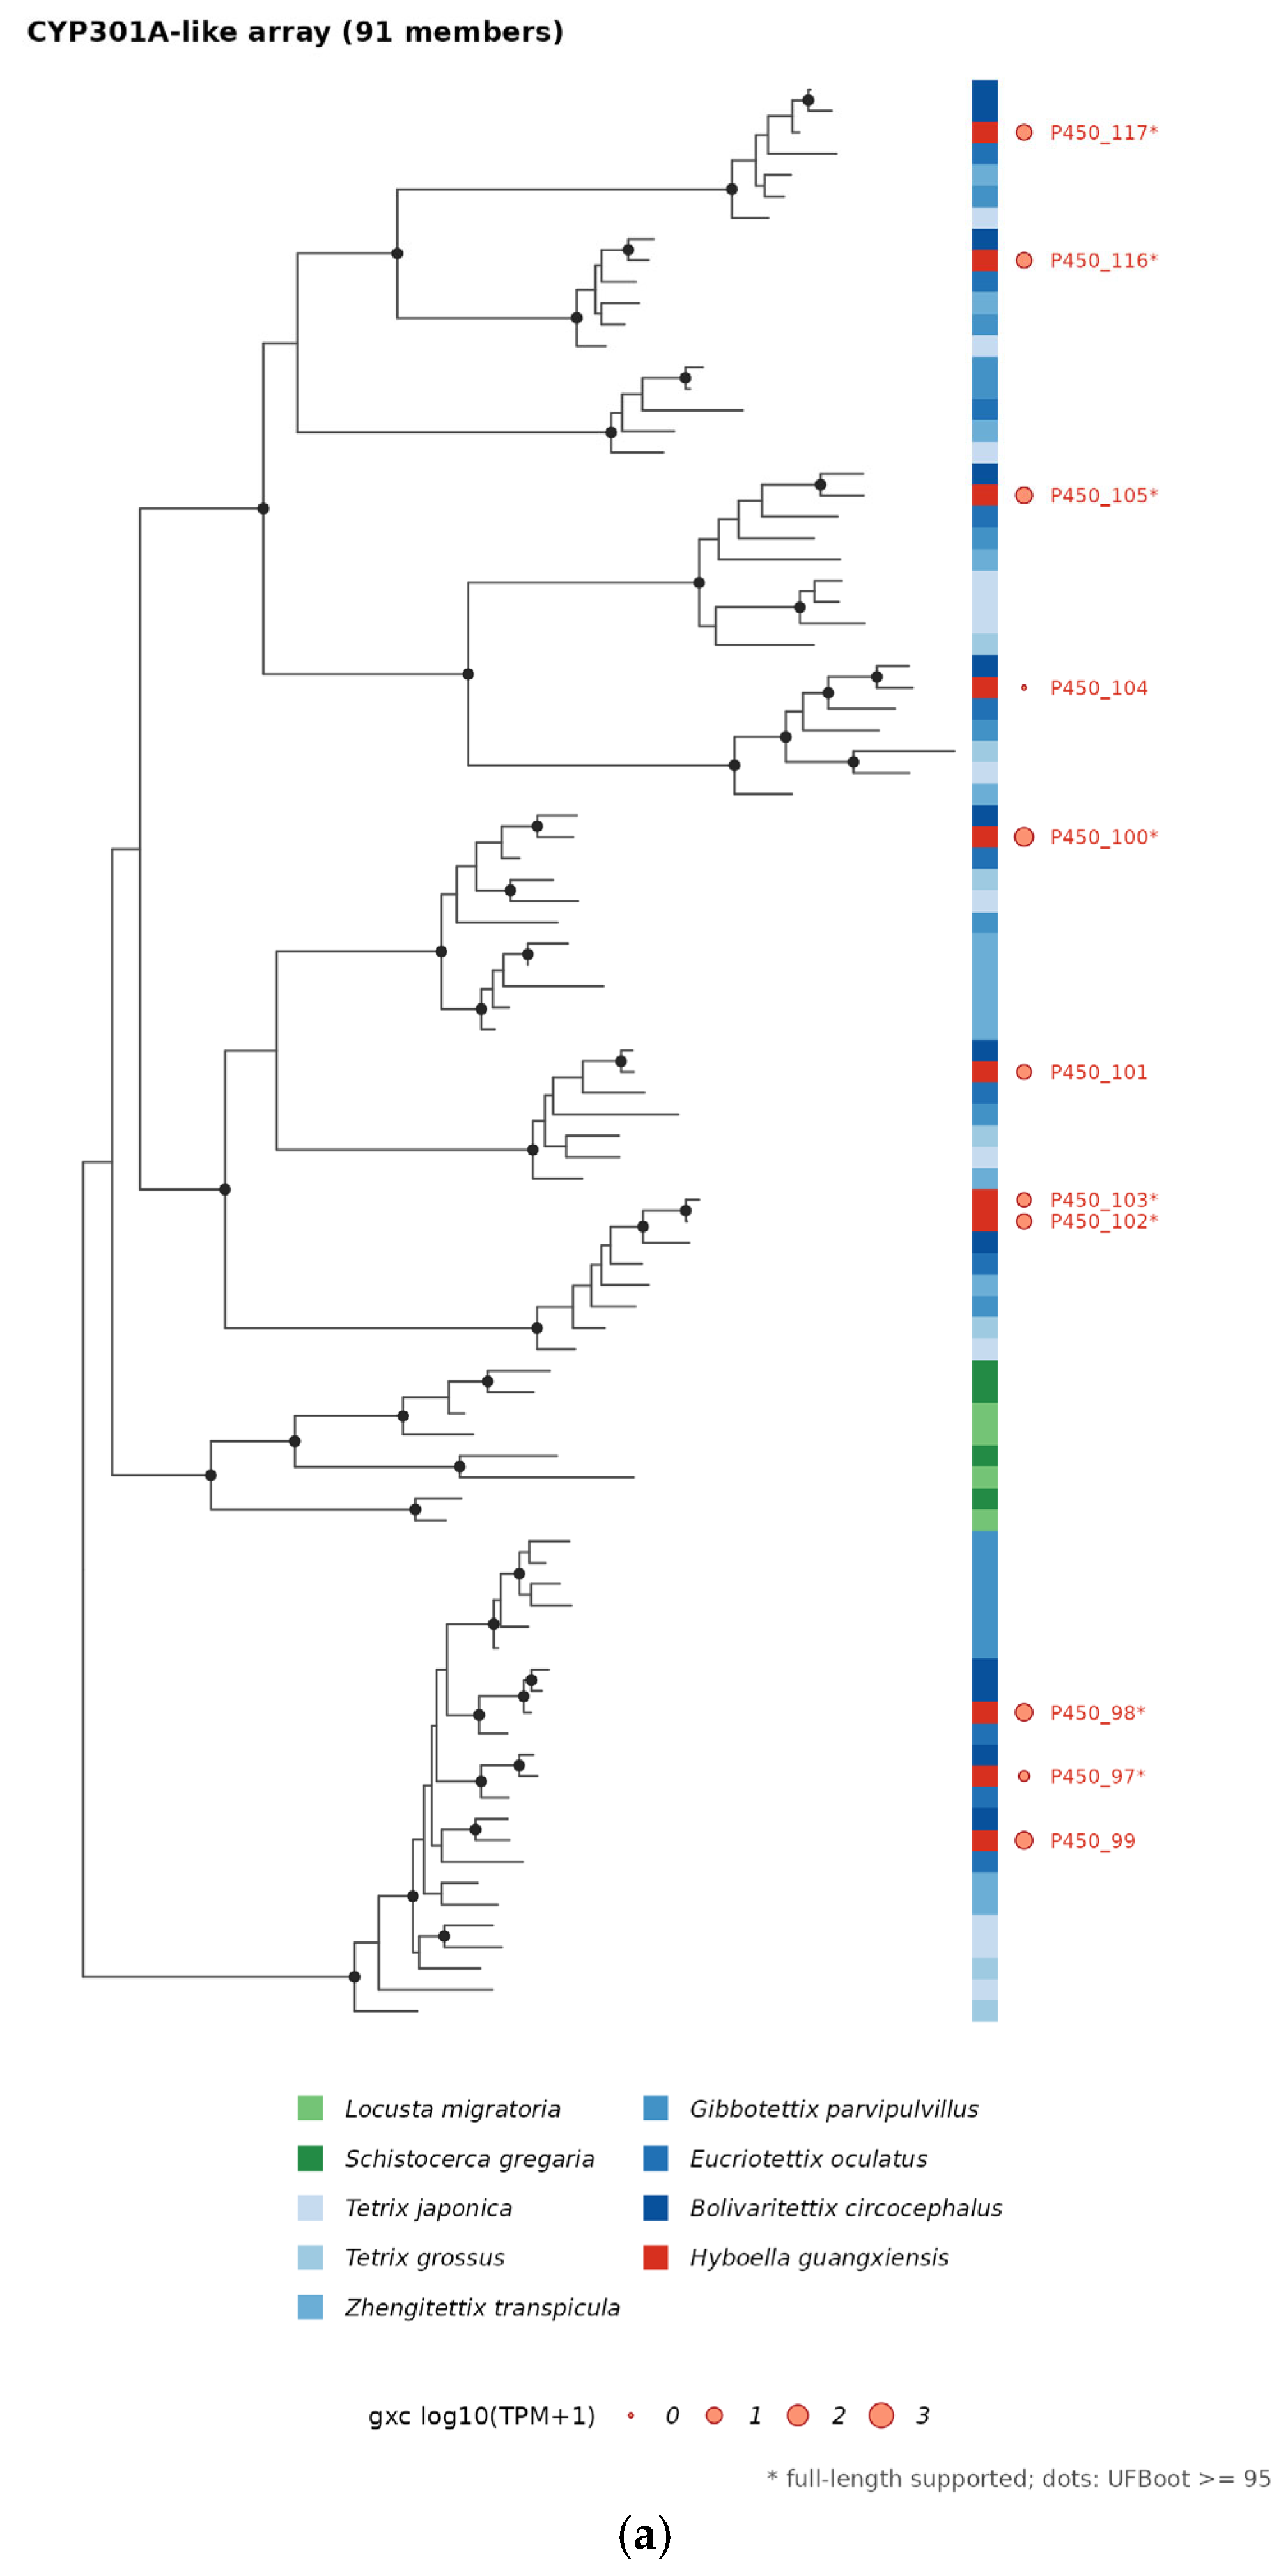
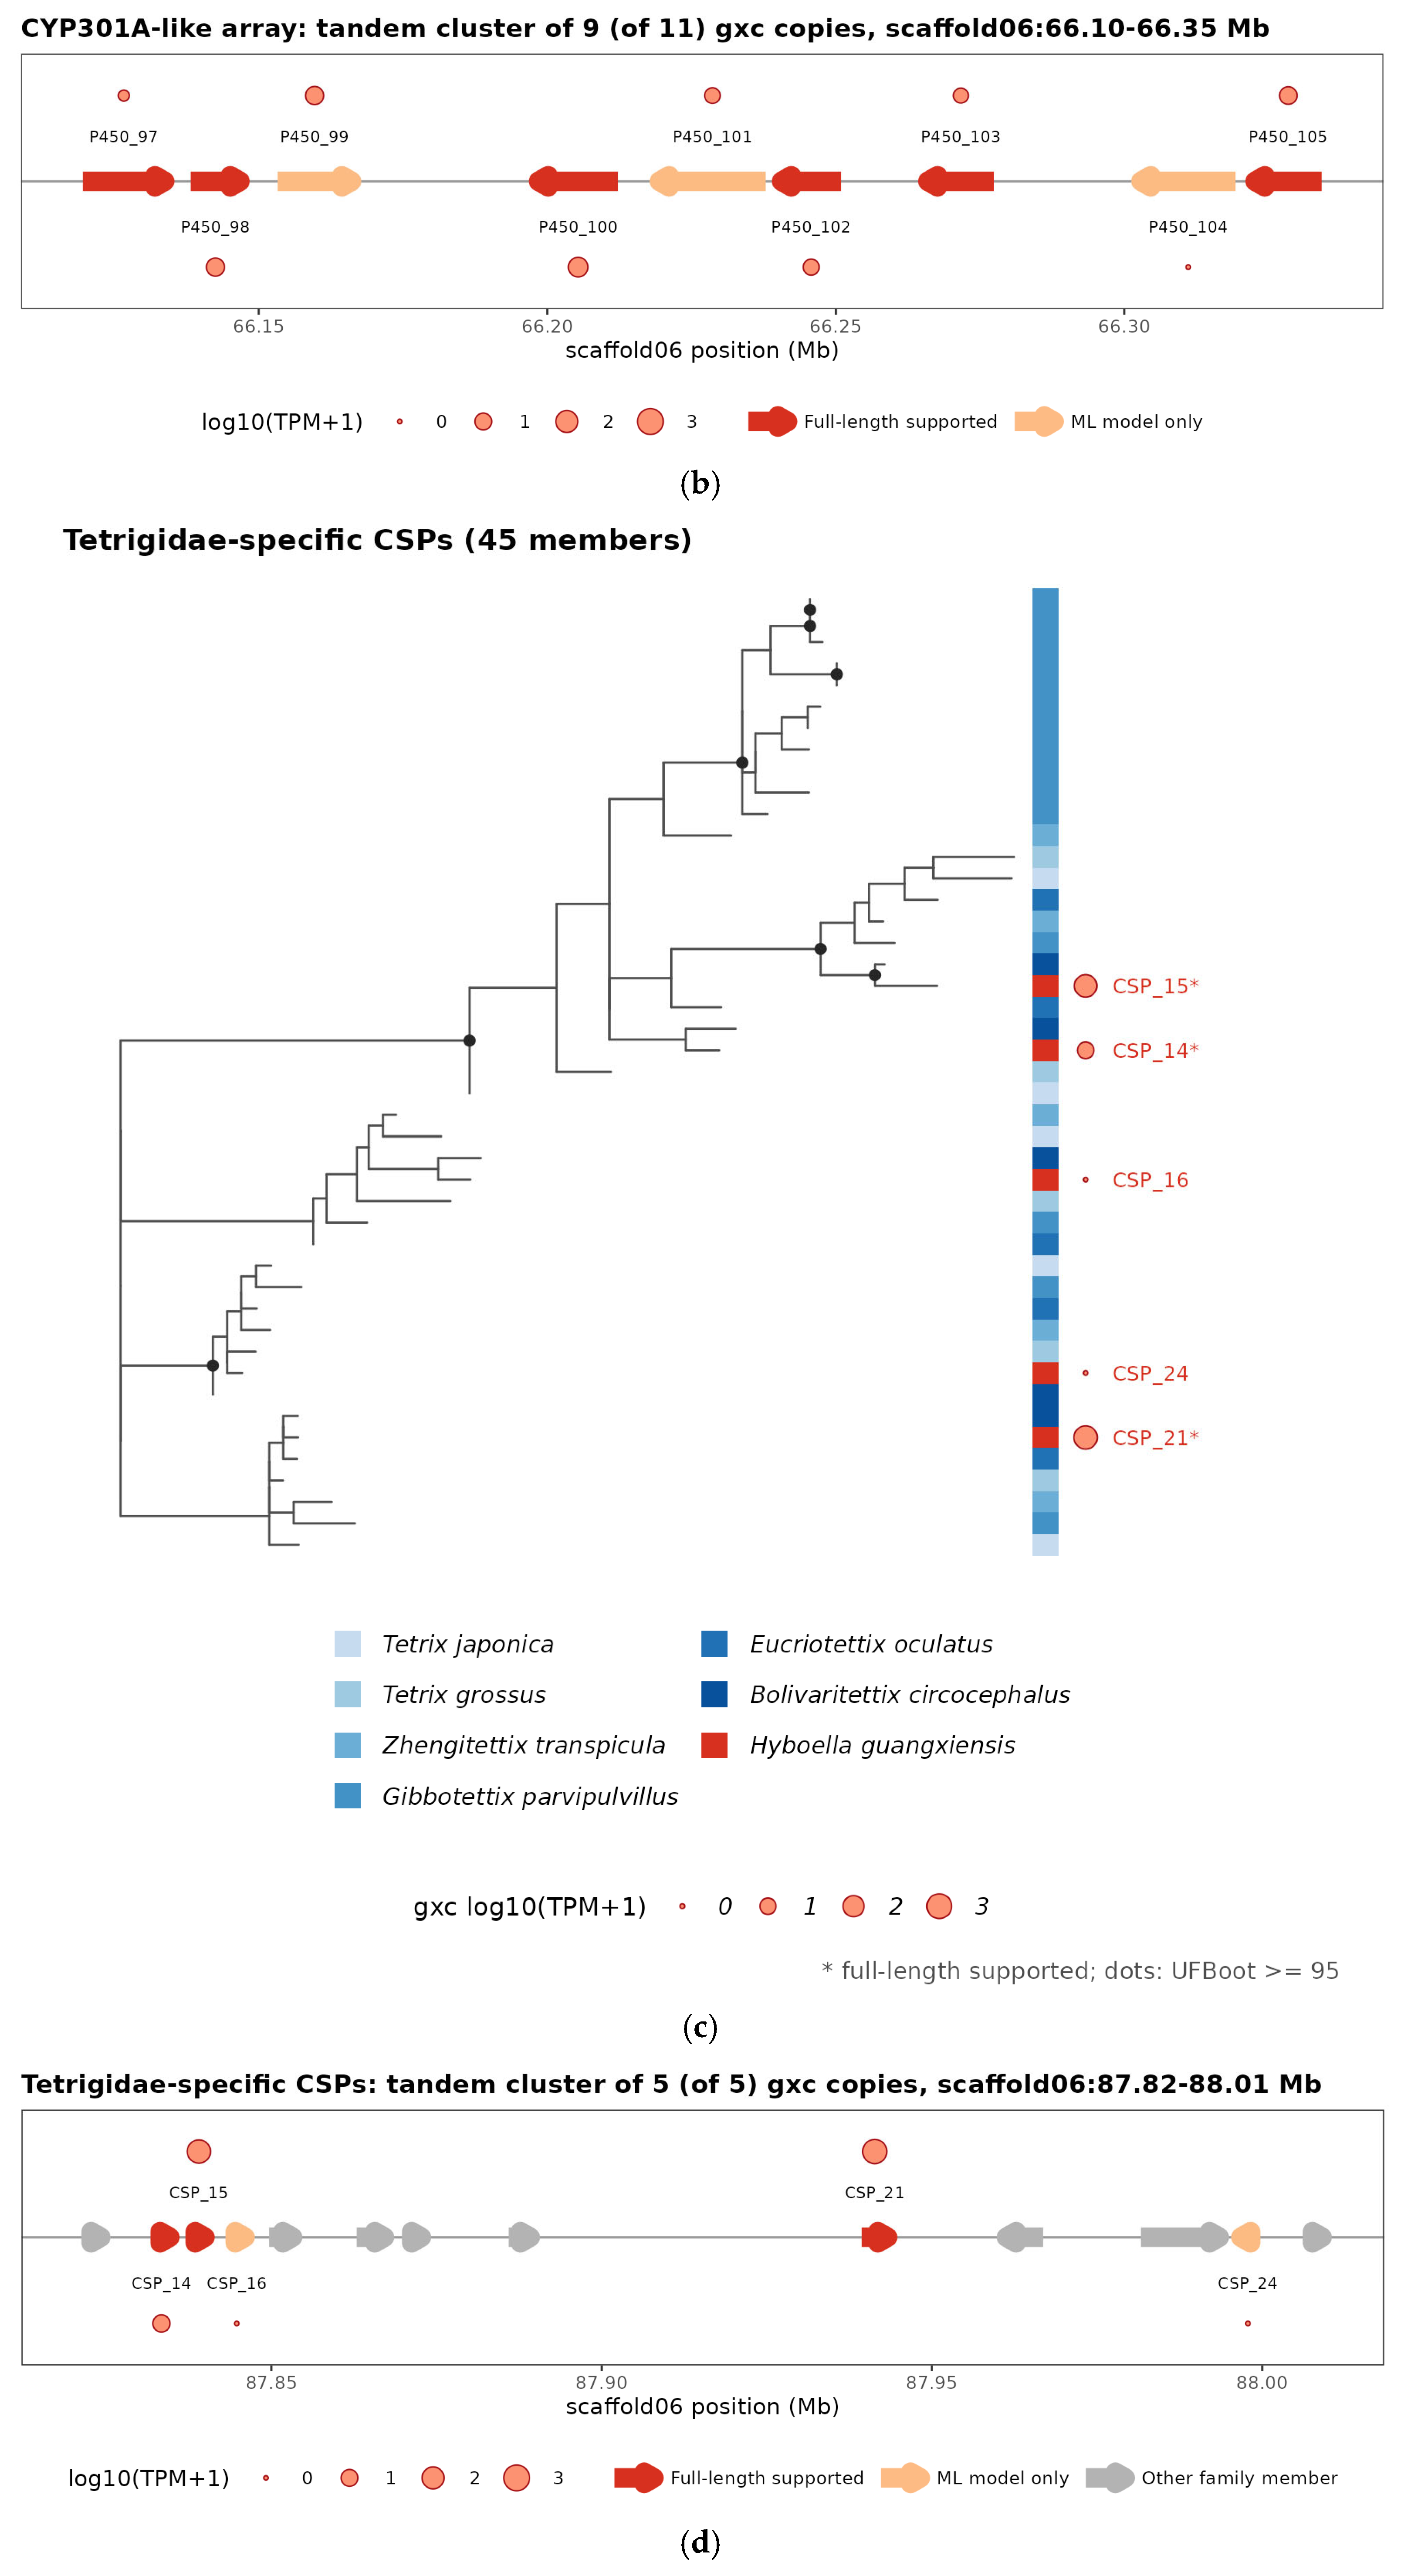
Five groups met the criteria of lineage specificity, multi-species occurrence, full-length support and detection as transcripts (Figure 6a; Table S5). (1) A CYP301A-like array of the mitochondrial clan has the following: 4 copies in each locust, none in the crickets and 7–15 in every tetrigid. In H. guangxiensis, nine of the eleven copies form a 250 kb tandem cluster on chromosome 6 (Figure 7a,b); eight are detected (summed TPM 108), and HgP450_100 has the highest TPM. (2) A UGT clade is absent from all four outgroups and present with 18–42 copies in every tetrigid; the 36 H. guangxiensis members include the recently duplicating chromosome 1 array (Figure S3), and 12 are supported by full-length transcripts. (3) Two CSP HOGs are absent from the outgroups and present in all tetrigids (5 copies each except 15 in G. parvipulvillus), sitting in the largest CSP cluster of the genome on chromosome 6 (Figure 7c,d); HgCSP_21 (369 TPM) and HgCSP_15 (216 TPM) are among the highest-TPM loci of the whole family set. (4) A CYP9E2-like array of the CYP3 clan is absent from the outgroups and present with 6–9 copies in all tetrigids; its eight H. guangxiensis copies form a 130 kb cluster on chromosome 4 (Figure S4a,b), and all are detected (summed TPM 142). (5) An esterase FE4-like group of the dietary/detoxification CCE class, absent from the outgroups, with 1–3 copies in other tetrigids and four tandem copies in H. guangxiensis (HgCCE_23–26, chromosome 4; Figure S4c,d), of which HgCCE_24–26 duplicated within the Hyboella–Bolivaritettix lineage and are all detected (summed TPM 57). In every case the tetrigid members formed a clade with ultrafast bootstrap ≥ 95 nested among outgroup paralogs (Figure 7a,c; Figures S3 and S4).
Figure 6.
The lineage specificity of five key gene groups. (a) The copy numbers of each group in eleven orthopteran genomes (box, Tetrigidae). (b) The genome-level check in four non-tetrigid outgroups: identity of each Hyboella guangxiensis query to the best annotated outgroup protein (x) against the identity of the best blastx locus in the outgroup genome (y); points above the dashed line would indicate an unannotated closer homolog; black symbols are conserved 1:1 control genes. The five labelled points lie above the dashed line.
Figure 7.
The phylogeny and genomic arrangement of the two key gene groups linked to habitat and chemosensation. (a,b) CYP301A-like P450s: (a) maximum-likelihood subtree extracted from the eleven-species P450 tree, (b) the tandem cluster on chromosome 6 of Hyboella guangxiensis. (c,d) Tetrigidae-specific CSPs: (c) subtree, (d) the cluster on chromosome 6. In the trees the colour strip gives the species of each tip. H. guangxiensis members are labelled (asterisk, full-length support) with circle size proportional to log10(TPM + 1), and dots mark ultrafast bootstrap ≥ 95. In the cluster plots arrows show gene orientation, red for full-length-supported and orange for ML-only models, and grey for other family members, and circles show log10(TPM + 1). The corresponding plots for the UGT, CYP9E2-like and FE4-like groups are given in Figures S3 and S4.
Because absence from an annotation can reflect annotation failure, the 20 representative proteins of the five groups were searched directly against the genome sequences of the four outgroups. For 79 of the 80 query–genome combinations the best genome locus was no closer to the query than the best annotated outgroup paralog (median genome identity 37%, median protein identity 43%), and the single exception (a CYP301A query in G. longicercus, genome identity 10 points above the best protein) is explained by the four CYP301A-like copies already annotated in locusts rather than by a hidden member of the tetrigid clade. The 16 control combinations behaved as expected for conserved 1:1 genes (median genome identity 59%; Figure 6b). The five groups are therefore genuinely restricted to, or expanded in, Tetrigidae at the genome level.
Tests of selection gave a mixed picture (Table S5C–E). Of the 28 post-speciation pairs, 7 had at least one copy under episodic selection (corrected p ≤ 0.05): 4 UGT pairs, 1 CCE pair (HgCCE_03/04; HgCCE_04 p = 1.6 × 10⁻⁵) and 2 ABC pairs; none of the P450, CSP or IR pairs was significant, and 21 pairs showed no evidence of selection. Among the key groups, the UGT clade had 31 of 392 branches significant, including six H. guangxiensis copies (HgUGT_01, 03, 13, 15, 24 and 28), and BUSTED detected gene-wide episodic selection (p < 0.001). In the CYP301A-like array, 13 of 133 branches were significant, among them HgP450_104 (BUSTED p = 0.015). In contrast, no H. guangxiensis branch was significant in the CYP9E2-like array (BUSTED p = 0.44), the FE4-like group (0 of 27 branches; BUSTED p = 0.44) or either CSP group. Episodic selection thus acted on individual copies of two of the five groups, whereas the CYP9E2-like, FE4-like and CSP groups are explained by duplication and retention without detectable adaptive change in coding sequence.
4. Discussion
The first outcome of this study is a corrected, evidence-graded gene set for nine families that matter for the ecology of a pygmy grasshopper. Full-length reads tested every model directly: they removed 2658 unsupported or TE-derived models from the genome annotation at no cost in BUSCO completeness, and within the nine families they repaired 28 loci, among them split ABC transporters and fused GSTs that an ML predictor cannot resolve from sequence alone. The length comparison with B. circocephalus orthologs shows that the corrected models are closer to the biological truth, not merely different. Equally important is what the reads did not support. Nearly a quarter of the family loci, and almost all IRs, had no full-length read, and a further fifth were transcribed without a complete ORF. Previous surveys of chemosensory and detoxification genes in insects have often relied on genome annotations or assemblies and have reported family sizes without this distinction; short-read transcriptomes remain a valid and well-tested basis for expression surveys, but they rarely resolve tandem paralogs. Our results argue that member-level claims, in particular about lineage-specific expansions, should be based on transcript-validated models, and that the graded set presented here (Table S2) is the appropriate reference for future work on Hyboella.
The second outcome is a clear picture of when the family repertoire of Tetrigidae was shaped. The chemosensory families are small and stable: tetrigids carry fewer OBPs and CSPs than the two well-annotated acridids (the ensiferan genomes are less refined and are treated as supporting evidence only). Most members have a 1:1 ortholog in the sister species, and Ka/Ks values are uniformly low. The detoxification families, by contrast, were remodelled by a burst of duplication on the Tetrigidae stem branch, with 42 P450, 27 UGT and 22 ABC events, a burst as large as the better-known expansion in locusts and larger than the events on any younger branch. Only 25 supported duplications are specific to H. guangxiensis, and 27 of the 28 post-speciation paralog pairs are tandem, with half of them in a single UGT array. This suggests that the shared ancestor of pygmy grasshoppers, rather than any individual species, acquired much of the enzymatic repertoire for its habitat and diet and that subsequent change has been slow and local. Branch-site tests found episodic selection in only a quarter of the recent pairs, mainly in the UGT array, so most recent copies are retained without detectable adaptive change of the coding sequence. The difference in TPM between paralogs increased with their age, as expected if duplicates are first retained with similar expression and then subfunctionalise or decay [28], although a single pooled sample cannot separate such divergence from tissue-specific expression.
Five lineage-specific groups stand out, and each has a possible connection to the distinctive biology of Tetrigidae that remains to be tested. CYP301A1 is a conserved mitochondrial P450 required for cuticle formation in Drosophila [50]; its single-copy status in most insects [24] contrasts with 7–15 tandem copies in every tetrigid, 9 of them clustered on chromosome 6 of H. guangxiensis, 8 detected as transcripts in adults, and 1 (HgP450_104) with signs of episodic selection. Pygmy grasshoppers are small-bodied insects that live permanently on wet substrates, often submerge, and rely on a heavily sculptured, hydrophobic cuticle; an amplified cuticle-forming P450 is a candidate for this adaptation, and its function in cuticle hydrocarbon or lipid metabolism deserves direct biochemical study. The UGT clade and the CYP9E2-like array are both absent from the outgroup genomes and both present in every tetrigid. Together with the FE4-like esterases they are candidate components of the metabolic machinery for a diet of mosses, algae and detritus, which is rich in phenolics, terpenoids and microbial metabolites [5,6]. UGTs glycosylate phenolic and terpenoid aglycones for excretion [25]; CYP9 enzymes oxidise plant allelochemicals and insecticides [23], and FE4-type esterases hydrolyse ester-containing xenobiotics [26]. The selection tests support this view for the UGT clade, where six H. guangxiensis copies show episodic selection, but not for the CYP9E2-like and FE4-like groups, whose expansion may reflect dosage or regulatory rather than coding change [27]. Finally, the two Tetrigidae-specific CSP groups include the locus with the highest TPM of all nine families. CSPs are secreted small binding proteins with roles ranging from contact chemoreception to lipid transport and cuticle maturation [21,22], and several have recently been shown to bind and probably sequester insecticides [51,52,53]; whether these tetrigid-specific CSPs serve to detect substrate-borne cues in a moist microhabitat, or carry cuticular lipids, cannot be decided from transcript abundance, and their coding sequences show no sign of positive selection. Their restricted distribution makes them a target for tissue-level localisation. None of these functional links has been tested here, and all are hypotheses.
We did not find a family member that could be tied to wing or pronotum polymorphism. The ecdysteroid-pathway P450s are present and intact; no Tetrigidae-specific group has an obvious endocrine role, and a single pooled sample of both morphs cannot reveal morph-biased expression. Recent transcriptome comparisons of wing morphs in B. circocephalus and T. grossus implicate lipid and energy metabolism rather than detoxification genes [15,16]. Our pooled data cannot test this directly, but they are compatible with it in that no detoxification or chemosensory group stood out as a candidate for morph differences. Several limitations apply. The transcriptome comes from one pooled sample of whole-body adults of both wing morphs, without replicates, tissue resolution or independent validation such as qPCR. We therefore use TPM only to show that a locus yields transcripts in adults and to rank loci within this sample, not to compare genes quantitatively, and we make no claim about tissue, stage or morph specificity. PCR-cDNA libraries also favour short transcripts, so long genes such as ABC transporters may be under-represented. Loci without full-length reads may be expressed in tissues or stages that were not sampled and are not necessarily pseudogenes, and detection of a transcript does not show that the encoded enzyme is active or adaptive. Selection tests on small codon alignments of recent paralogs have limited power, so non-significant results do not exclude selection. Finally, the ML annotations of the ten comparison genomes were used as deposited so that copy numbers in those species are less certain than in H. guangxiensis. The genome-level search mitigates the last problem for the five key groups, but the exact copy numbers in other tetrigids remain provisional until their annotations are validated in the same way.
5. Conclusions
A nanopore full-length transcriptome of H. guangxiensis converted an ML genome annotation into an evidence-graded gene set and corrected 28 of 447 chemosensory and detoxification loci, including split and fused models in tandem arrays. The chemosensory repertoire of Tetrigidae is small and conserved, whereas the detoxification repertoire was expanded by 119 duplications on the Tetrigidae stem, with later change confined to a few tandem arrays. Five lineage-specific groups detected as transcripts in adults and validated against outgroup genomes rather than annotations are candidates for the cuticular, chemosensory and dietary adaptations of pygmy grasshoppers: a CYP301A-like array, a Tetrigidae-specific UGT clade, two Tetrigidae-specific CSPs, a CYP9E2-like array and an FE4-like esterase array. Episodic selection was detected on individual members of the UGT and CYP301A-like groups but not in the other three. None of the families studied offers a candidate for wing polymorphism. These genes and the corrected models provide concrete targets for tissue-resolved expression and functional studies in this neglected but ecologically distinctive group of Orthoptera.
Supplementary Materials
The following supporting information can be downloaded at https://www.mdpi.com/article/10.3390/insects17111189/s1. Figure S1: Full-length transcript support of ML gene models; Figure S2: Ka/Ks of 1:1 orthologs and the UGT tandem array on chromosome 1; Figure S3: Subtree and tandem cluster of the Tetrigidae UGT clade; Figure S4: Subtrees and tandem clusters of the CYP9E2-like and FE4-like arrays; Figure S5: Reference-anchored phylogenies of nine gene families; Table S1: Filtering of the machine-learning gene annotation; Table S2: Loci of nine gene families in H. guangxiensis, correction of ML models, isoforms and subgroup assignment; Table S3: Family copy numbers, homologous groups and duplications across eleven orthopteran genomes; Table S4: Orthology to B. circocephalus, Ka/Ks, nearest paralog pairs and tandem cluster definition; Table S5: Key gene groups, genome-level checks in outgroups and tests of selection; Supplementary Data (Supplementary_Data.zip): corrected protein and coding sequences, gene annotation, alignments, trees, selection-test files and analysis scripts.
Author Contributions
Conceptualisation, R.Z.; methodology, R.Z. and D.G.; software, T.X.; validation, T.X.; formal analysis, R.Z. and D.G.; investigation, D.G.; resources, R.Z.; data curation, D.G.; writing—original draft preparation, R.Z.; writing—review and editing, R.Z., T.X. and D.G.; visualisation, R.Z.; supervision, R.Z.; project administration, R.Z.; funding acquisition, R.Z. All authors have read and agreed to the published version of the manuscript.
Funding
This study was funded by the National Natural Science Foundation of China (32560123) and the Guangxi Natural Science Foundation (2025GXNSFAA069743).
Institutional Review Board Statement
Not applicable.
Informed Consent Statement
Not applicable.
Data Availability Statement
The nanopore cDNA reads generated in this study are available in the NCBI Sequence Read Archive under BioProject PRJNA1556956 (BioSample SAMN64677678; run SRR41548219). The locus table of the corrected gene models, subgroup assignments, orthology and selection results are provided as Tables S2–S5. The corrected protein and coding sequences of the 447 loci, the filtered gene annotation, the full-length transcript annotation, trimmed alignments, maximum-likelihood trees, input and output files of the selection tests and all analysis scripts are provided as Supplementary Data (Supplementary_Data.zip). The chromosome-level genome used for the analyses is deposited at NCBI under BioProject PRJNA1535534 (BioSample SAMN63606789; WGS accession JCERQK000000000).
Acknowledgments
We thank the members of the Hechi University insect laboratory for maintaining the H. guangxiensis colony.
Conflicts of Interest
The authors declare no conflicts of interest.
References
- Song, H.; Amédégnato, C.; Cigliano, M.M.; Desutter-Grandcolas, L.; Heads, S.W.; Huang, Y.; Otte, D.; Whiting, M.F. 300 million years of diversification: Elucidating the patterns of orthopteran evolution based on comprehensive taxon and gene sampling. Cladistics 2015, 31, 621–651. [Google Scholar] [CrossRef] [Scilit] [PubMed]
- Song, H.; Béthoux, O.; Shin, S.; Donath, A.; Letsch, H.; Liu, S.; McKenna, D.D.; Meng, G.; Misof, B.; Podsiadlowski, L.; et al. Phylogenomic analysis sheds light on the evolutionary pathways towards acoustic communication in Orthoptera. Nat. Commun. 2020, 11, 4939. [Google Scholar] [CrossRef] [Scilit] [PubMed]
- Musiolek, D.; Kočárek, P. Weather-dependent microhabitat use by Tetrix tenuicornis (Orthoptera: Tetrigidae). Sci. Nat. 2016, 103, 68. [Google Scholar] [CrossRef] [Scilit] [PubMed]
- Hochkirch, A.; Gröning, J.; Loos, T.; Metzing, C.; Reichelt, M. Specialized diet and feeding habits as key factors for the habitat requirements of the grasshopper species Tetrix subulata (Orthoptera: Tetrigidae). Entomol. Gen. 2000, 25, 39–51. [Google Scholar] [CrossRef] [Scilit]
- Kuřavová, K.; Šipoš, J.; Wahab, R.A.; Kahar, R.S.; Kočárek, P. Feeding patterns in tropical groundhoppers (Tetrigidae): A case of phylogenetic dietary conservatism in a basal group of Caelifera. Zool. J. Linn. Soc. 2017, 179, 291–302. [Google Scholar] [CrossRef] [Scilit]
- Kuřavová, K.; Šipoš, J.; Kočárek, P. Energy balance of food in a detrito-bryophagous groundhopper (Orthoptera: Tetrigidae). PeerJ 2020, 8, e9603. [Google Scholar] [CrossRef] [Scilit] [PubMed]
- Roff, D.A. The evolution of wing dimorphism in insects. Evolution 1986, 40, 1009–1020. [Google Scholar] [CrossRef] [Scilit] [PubMed]
- Steenman, A.; Lehmann, A.W.; Lehmann, G.U.C. Morphological variation and sex-biased frequency of wing dimorphism in the pygmy grasshopper Tetrix subulata (Orthoptera: Tetrigidae). Eur. J. Entomol. 2013, 110, 535–540. [Google Scholar] [CrossRef] [Scilit]
- Deng, W.A.; Zheng, Z.M.; Wei, S.Z. The genus Hyboella Hancock (Orthoptera: Tetrigidae: Metrodorinae) in China. Zootaxa 2009, 2064, 57–68. [Google Scholar] [CrossRef] [Scilit]
- Qiu, Z.; Liu, F.; Lu, H.; Huang, Y. Characterization and analysis of a de novo transcriptome from the pygmy grasshopper Tetrix japonica. Mol. Ecol. Resour. 2017, 17, 381–392. [Google Scholar] [CrossRef] [Scilit] [PubMed]
- Li, R.; Qin, Y.; Rong, W.; Deng, W.A.; Li, X. Chromosome-level genome assembly of the pygmy grasshopper Eucriotettix oculatus (Orthoptera: Tetrigoidea). Sci. Data 2024, 11, 431. [Google Scholar] [CrossRef] [Scilit] [PubMed]
- Guan, D.L.; Chen, Y.Z.; Qin, Y.C.; Li, X.D.; Deng, W.A. Chromosomal-level reference genome for the Chinese endemic pygmy grasshopper, Zhengitettix transpicula, sheds light on Tetrigidae evolution and advancing conservation efforts. Insects 2024, 15, 223. [Google Scholar] [CrossRef] [Scilit] [PubMed]
- Deng, W.A.; Zheng, B.W.; Teng, C.L.; Guan, D.L. Chromosome-level genome assembly and annotation of the pygmy grasshopper Gibbotettix parvipulvillus. Sci. Data 2025, 12, 1119. [Google Scholar] [CrossRef] [Scilit] [PubMed]
- Li, X.; Chen, Y.; Liu, Y.; Lin, L. A genome survey of Tetrix japonica (Insecta, Orthoptera) reveals a comparatively small Tetrigidae genome. ZooKeys 2025, 1254, 191–205. [Google Scholar] [CrossRef] [Scilit] [PubMed]
- Zhang, R.; Xu, T.; Guan, D.; Deng, W. Comparative genomics and full-length transcriptome profiling of wing morphs in Tetrix grossus (Orthoptera: Tetrigidae). Comp. Biochem. Physiol. D Genom. Proteom. 2026, 60, 101949. [Google Scholar] [CrossRef] [Scilit] [PubMed]
- Deng, W.A.; Li, Z.; Teng, C.L.; Guan, D.L. Chromosome-level genome assembly, genome-wide association and developmental transcriptomics converge on lipid and energy metabolism as the regulatory core of wing polyphenism in Bolivaritettix circocephalus. Insect Biochem. Mol. Biol. 2026, 194, 104636. [Google Scholar] [CrossRef] [Scilit] [PubMed]
- Wang, X.; Fang, X.; Yang, P.; Jiang, X.; Jiang, F.; Zhao, D.; Li, B.; Cui, F.; Wei, J.; Ma, C.; et al. The locust genome provides insight into swarm formation and long-distance flight. Nat. Commun. 2014, 5, 2957. [Google Scholar] [CrossRef] [Scilit] [PubMed]
- Verlinden, H.; Sterck, L.; Li, J.; Li, Z.; Yssel, A.; Gansemans, Y.; Verdonck, R.; Holtof, M.; Song, H.; Behmer, S.T.; et al. First draft genome assembly of the desert locust, Schistocerca gregaria. F1000Research 2021, 9, 775. [Google Scholar] [CrossRef] [Scilit] [PubMed]
- Amarasinghe, S.L.; Su, S.; Dong, X.; Zappia, L.; Ritchie, M.E.; Gouil, Q. Opportunities and challenges in long-read sequencing data analysis. Genome Biol. 2020, 21, 30. [Google Scholar] [CrossRef] [Scilit] [PubMed]
- Leal, W.S. Odorant reception in insects: Roles of receptors, binding proteins, and degrading enzymes. Annu. Rev. Entomol. 2013, 58, 373–391. [Google Scholar] [CrossRef] [Scilit] [PubMed]
- Pelosi, P.; Iovinella, I.; Zhu, J.; Wang, G.; Dani, F.R. Beyond chemoreception: Diverse tasks of soluble olfactory proteins in insects. Biol. Rev. 2018, 93, 184–200. [Google Scholar] [CrossRef] [Scilit] [PubMed]
- Ban, L.; Scaloni, A.; Brandazza, A.; Angeli, S.; Zhang, L.; Yan, Y.; Pelosi, P. Chemosensory proteins of Locusta migratoria. Insect Mol. Biol. 2003, 12, 125–134. [Google Scholar] [CrossRef] [Scilit] [PubMed]
- Feyereisen, R. Insect CYP genes and P450 enzymes. In Insect Molecular Biology and Biochemistry; Gilbert, L.I., Ed.; Academic Press: London, UK, 2012; pp. 236–316. [Google Scholar] [CrossRef] [Scilit]
- Dermauw, W.; Van Leeuwen, T.; Feyereisen, R. Diversity and evolution of the P450 family in arthropods. Insect Biochem. Mol. Biol. 2020, 127, 103490. [Google Scholar] [CrossRef] [Scilit] [PubMed]
- Ahn, S.J.; Vogel, H.; Heckel, D.G. Comparative analysis of the UDP-glycosyltransferase multigene family in insects. Insect Biochem. Mol. Biol. 2012, 42, 133–147. [Google Scholar] [CrossRef] [Scilit] [PubMed]
- Ranson, H.; Claudianos, C.; Ortelli, F.; Abgrall, C.; Hemingway, J.; Sharakhova, M.V.; Unger, M.F.; Collins, F.H.; Feyereisen, R. Evolution of supergene families associated with insecticide resistance. Science 2002, 298, 179–181. [Google Scholar] [CrossRef] [Scilit] [PubMed]
- Rane, R.V.; Walsh, T.K.; Pearce, S.L.; Jermiin, L.S.; Gordon, K.H.; Richards, S.; Oakeshott, J.G. Are feeding preferences and insecticide resistance associated with the size of detoxifying enzyme families in insect herbivores? Curr. Opin. Insect Sci. 2016, 13, 70–76. [Google Scholar] [CrossRef] [Scilit] [PubMed]
- Lynch, M.; Conery, J.S. The evolutionary fate and consequences of duplicate genes. Science 2000, 290, 1151–1155. [Google Scholar] [CrossRef] [Scilit] [PubMed]
- Li, H. Minimap2: Pairwise alignment for nucleotide sequences. Bioinformatics 2018, 34, 3094–3100. [Google Scholar] [CrossRef] [Scilit] [PubMed]
- Danecek, P.; Bonfield, J.K.; Liddle, J.; Marshall, J.; Ohan, V.; Pollard, M.O.; Whitwham, A.; Keane, T.; McCarthy, S.A.; Davies, R.M.; et al. Twelve years of SAMtools and BCFtools. GigaScience 2021, 10, giab008. [Google Scholar] [CrossRef] [Scilit] [PubMed]
- Buchfink, B.; Reuter, K.; Drost, H.G. Sensitive protein alignments at tree-of-life scale using DIAMOND. Nat. Methods 2021, 18, 366–368. [Google Scholar] [CrossRef] [Scilit] [PubMed]
- Manni, M.; Berkeley, M.R.; Seppey, M.; Simão, F.A.; Zdobnov, E.M. BUSCO update: Novel and streamlined workflows along with broader and deeper phylogenetic coverage for scoring of eukaryotic, prokaryotic, and viral genomes. Mol. Biol. Evol. 2021, 38, 4647–4654. [Google Scholar] [CrossRef] [Scilit] [PubMed]
- Quinlan, A.R.; Hall, I.M. BEDTools: A flexible suite of utilities for comparing genomic features. Bioinformatics 2010, 26, 841–842. [Google Scholar] [CrossRef] [Scilit] [PubMed]
- Gu, Z.; Gu, L.; Eils, R.; Schlesner, M.; Brors, B. circlize implements and enhances circular visualization in R. Bioinformatics 2014, 30, 2811–2812. [Google Scholar] [CrossRef] [Scilit] [PubMed]
- Kovaka, S.; Zimin, A.V.; Pertea, G.M.; Razaghi, R.; Salzberg, S.L.; Pertea, M. Transcriptome assembly from long-read RNA-seq alignments with StringTie2. Genome Biol. 2019, 20, 278. [Google Scholar] [CrossRef] [Scilit] [PubMed]
- Trincado, J.L.; Entizne, J.C.; Hysenaj, G.; Singh, B.; Skalic, M.; Elliott, D.J.; Eyras, E. SUPPA2: Fast, accurate, and uncertainty-aware differential splicing analysis across multiple conditions. Genome Biol. 2018, 19, 40. [Google Scholar] [CrossRef] [Scilit] [PubMed]
- Cantalapiedra, C.P.; Hernández-Plaza, A.; Letunic, I.; Bork, P.; Huerta-Cepas, J. eggNOG-mapper v2: Functional annotation, orthology assignments, and domain prediction at the metagenomic scale. Mol. Biol. Evol. 2021, 38, 5825–5829. [Google Scholar] [CrossRef] [Scilit] [PubMed]
- Eddy, S.R. Accelerated profile HMM searches. PLoS Comput. Biol. 2011, 7, e1002195. [Google Scholar] [CrossRef] [Scilit] [PubMed]
- Mistry, J.; Chuguransky, S.; Williams, L.; Qureshi, M.; Salazar, G.A.; Sonnhammer, E.L.L.; Tosatto, S.C.E.; Paladin, L.; Raj, S.; Richardson, L.J.; et al. Pfam: The protein families database in 2021. Nucleic Acids Res. 2021, 49, D412–D419. [Google Scholar] [CrossRef] [Scilit] [PubMed]
- The UniProt Consortium. UniProt: The Universal Protein Knowledgebase in 2025. Nucleic Acids Res. 2025, 53, D609–D617. [Google Scholar] [CrossRef] [Scilit] [PubMed]
- Katoh, K.; Standley, D.M. MAFFT multiple sequence alignment software version 7: Improvements in performance and usability. Mol. Biol. Evol. 2013, 30, 772–780. [Google Scholar] [CrossRef] [Scilit] [PubMed]
- Nei, M.; Gojobori, T. Simple methods for estimating the numbers of synonymous and nonsynonymous nucleotide substitutions. Mol. Biol. Evol. 1986, 3, 418–426. [Google Scholar] [CrossRef] [Scilit] [PubMed]
- Capella-Gutiérrez, S.; Silla-Martínez, J.M.; Gabaldón, T. trimAl: A tool for automated alignment trimming in large-scale phylogenetic analyses. Bioinformatics 2009, 25, 1972–1973. [Google Scholar] [CrossRef] [Scilit] [PubMed]
- Minh, B.Q.; Schmidt, H.A.; Chernomor, O.; Schrempf, D.; Woodhams, M.D.; von Haeseler, A.; Lanfear, R. IQ-TREE 2: New models and efficient methods for phylogenetic inference in the genomic era. Mol. Biol. Evol. 2020, 37, 1530–1534. [Google Scholar] [CrossRef] [Scilit] [PubMed]
- Hoang, D.T.; Chernomor, O.; von Haeseler, A.; Minh, B.Q.; Vinh, L.S. UFBoot2: Improving the ultrafast bootstrap approximation. Mol. Biol. Evol. 2018, 35, 518–522. [Google Scholar] [CrossRef] [Scilit] [PubMed]
- Yu, G.; Smith, D.K.; Zhu, H.; Guan, Y.; Lam, T.T.Y. ggtree: An R package for visualization and annotation of phylogenetic trees with their covariates and other associated data. Methods Ecol. Evol. 2017, 8, 28–36. [Google Scholar] [CrossRef] [Scilit]
- Smith, M.D.; Wertheim, J.O.; Weaver, S.; Murrell, B.; Scheffler, K.; Kosakovsky Pond, S.L. Less is more: An adaptive branch-site random effects model for efficient detection of episodic diversifying selection. Mol. Biol. Evol. 2015, 32, 1342–1353. [Google Scholar] [CrossRef] [Scilit] [PubMed]
- Kosakovsky Pond, S.L.; Poon, A.F.Y.; Velazquez, R.; Weaver, S.; Hepler, N.L.; Murrell, B.; Shank, S.D.; Magalis, B.R.; Bouvier, D.; Nekrutenko, A.; et al. HyPhy 2.5—A customizable platform for evolutionary hypothesis testing using phylogenies. Mol. Biol. Evol. 2020, 37, 295–299. [Google Scholar] [CrossRef] [Scilit] [PubMed]
- Murrell, B.; Weaver, S.; Smith, M.D.; Wertheim, J.O.; Murrell, S.; Aylward, A.; Eren, K.; Pollner, T.; Martin, D.P.; Smith, D.M.; et al. Gene-wide identification of episodic selection. Mol. Biol. Evol. 2015, 32, 1365–1371. [Google Scholar] [CrossRef] [Scilit] [PubMed]
- Sztal, T.; Chung, H.; Berger, S.; Currie, P.D.; Batterham, P.; Daborn, P.J. A cytochrome P450 conserved in insects is involved in cuticle formation. PLoS ONE 2012, 7, e36544. [Google Scholar] [CrossRef] [Scilit] [PubMed]
- Xu, H.; Pan, Y.; Li, J.; Yang, F.; Chen, X.; Gao, X.; Wen, S.; Shang, Q. Chemosensory proteins confer adaptation to the ryanoid anthranilic diamide insecticide cyantraniliprole in Aphis gossypii Glover. Pestic. Biochem. Physiol. 2022, 184, 105076. [Google Scholar] [CrossRef] [Scilit] [PubMed]
- Li, Y.; Ni, S.; Wang, Y.; Li, R.; Sun, H.; Ye, X.; Tian, Z.; Zhang, Y.; Liu, J. The chemosensory protein 1 contributes to indoxacarb resistance in Plutella xylostella (L.). Pest Manag. Sci. 2023, 79, 2456–2468. [Google Scholar] [CrossRef] [Scilit] [PubMed]
- Gao, P.; Tan, J.; Peng, X.; Song, Y.; Qu, M.; Chen, M. Expression pattern of RpCSP6 from Rhopalosiphum padi and its binding mechanism with deltamethrin: Insights into chemosensory protein-mediated insecticide resistance. J. Agric. Food Chem. 2024, 72, 17847–17857. [Google Scholar] [CrossRef] [Scilit] [PubMed]
Disclaimer/Publisher’s Note: The statements, opinions and data contained in all publications are solely those of the individual author(s) and contributor(s) and not of MDPI and/or the editor(s). MDPI and/or the editor(s) disclaim responsibility for any injury to people or property resulting from any ideas, methods, instructions or products referred to in the content. |
© 2026 by the authors. Licensee MDPI, Basel, Switzerland. This article is an open access article distributed under the terms and conditions of the Creative Commons Attribution (CC BY) license.