


Simple Summary
Stoneflies of the family Leuctridae are small aquatic insects whose larvae inhabit clean streams, yet how its roughly 400 species are related to one another, when the family originated, and how it came to inhabit the Northern Hemisphere has long remained unclear. Using mitochondrial DNA from 30 species representing nine of the twelve currently recognized genera, our analyses suggest that the family originated in the Late Triassic, about 206 million years ago, and that its early diversification may have taken place in western North America, a hypothesis favored by our ancestral-range reconstructions, with subsequent dispersal events shaping the present disjunct distributions between East Asia and North America. We also clarified the family’s internal tree, confirming that the genus Megaleuctra branched off first. These results provide an evolutionary framework for future studies on the diversity and conservation of stoneflies.
Abstract
The family Leuctridae is a species-rich group of Holarctic stoneflies whose phylogenetic relationships, diversification timeline, and biogeographic history remain poorly resolved. We assembled a mitochondrial dataset comprising 30 species representing nine of the twelve currently recognized genera, combining complete and nearly complete mitogenomes with mitochondrial genes extracted from transcriptomes, and nine outgroups, to reconstruct the phylogeny, divergence times, and ancestral ranges of the family. Analyses strongly supported the monophyly of Leuctridae and recovered Megaleuctra as the earliest-diverging lineage, followed by two major Leuctrinae clades: (Despaxia + Leuctra) + Moselia and (Paraleuctra + Pomoleuctra) + (Perlomyia + Rhopalopsole + Zealeuctra). Molecular dating placed the crown origin of the family in the Late Triassic at 205.9 Ma (95% HPD: 178.1–237.0 Ma), with extant genera diversifying from the Late Cretaceous to the Late Eocene. Ancestral-range reconstruction under the DIVALIKE + J model favors western North America as the ancestral area at the crown node (relative probability 0.59) and at most deep nodes, although with substantial uncertainty. The present disjunct distributions between East Asia and North America are most consistent with deep-time range persistence and repeated founder-event colonization, possibly combined with ancient vicariance. Our results provide a novel mitogenome-based framework for further studies of leuctrid diversification.
1. Introduction
Stoneflies (Insecta: Plecoptera) are among the most ancient lineages of winged insects, with a fossil record extending back to the Permian and a worldwide distribution centred on cool, well-oxygenated running waters [1,2,3]. The family Leuctridae Klapálek, 1905, commonly known as rolled-winged stoneflies or needleflies, belongs to the superfamily Nemouroidea and is one of the five nemouroidean families currently recognised (Leuctridae, Capniidae, Nemouridae, Notonemouridae and Taeniopterygidae) [1,3]. With approximately 400 described species distributed among 12 genera, it is one of the most species-rich Nemouroidea families [3,4]. The family is essentially Holarctic in distribution, with major centres of diversity in the mountains of East Asia, the European Alpine system and eastern North America, while several leuctrine genera, such as Rhopalopsole and Perlomyia, extend southwards into subtropical and tropical Southeast Asia [1,3,5]. The larvae are shredders of conditioned leaf litter in headwater streams, and the reduced flight capacity of many brachypterous or apterous adults restricts dispersal; this tight association with small, isolated cold-water habitats renders the family highly sensitive to environmental change and of considerable value in freshwater bioassessment and conservation [2,3].
Traditional morphology-based taxonomy divides Leuctridae into two subfamilies, Leuctrinae and the monogeneric Megaleuctrinae (Megaleuctra), a long-standing classification that has recently been challenged by molecular phylogenetic evidence [1,3,6,7]. Multiple intrinsic limitations of morphological traits hinder systematic resolution within Leuctridae: widespread homoplastic wing reduction and recurrent wing loss across independent lineages limit the utility of wing venation and terminalia characters for generic delimitation and phylogenetic inference [8,9,10]. At the species level, overlapping intra- and interspecific morphological variation and cryptic speciation further obscure species boundaries, making molecular data indispensable for accurate taxonomic and evolutionary analyses [10,11,12]. Most critically, molecular datasets have challenged the monophyly of Leuctridae: a multi-locus Sanger phylogeny recovered Megaleuctra as the sister group of Capniidae rather than of other leuctrid genera, consistent with Illies’s hypothesis based on male genitalia [7,13], whereas transcriptome data placed Megaleuctra as the sister lineage to all remaining leuctrids [14], and morphological analyses favoured Megaleuctrinae as sister to all other Leuctridae [1,6]. These conflicting results cast fundamental doubt on the validity of the classical subfamilial framework [3,7]. To date, few molecular datasets have been specifically applied to resolve intra-familial phylogenetic relationships of Leuctridae, and the efficacy of complete mitochondrial genomes for clarifying these contentious evolutionary relationships remains underexplored [5].
Higher-level phylogenetic placement of Leuctridae also remains poorly resolved, with conflicting topological results among previous molecular studies. Early mitogenome-based analyses placed Leuctridae as the earliest-diverging lineage of Euholognatha or Nemouroidea, albeit with weak nodal support [15,16]. Subsequent analyses based on expanded molecular sampling yielded conflicting topologies: a divergence-time analysis placed Leuctridae as the sister group of the Scopuridae + Taeniopterygidae clade [7], whereas a recent mitogenome phylogeny under site-heterogeneous models recovered Scopuridae as the earliest-diverging lineage of Euholognatha, with Taeniopterygidae as the sister group of Leuctridae [17]. Transcriptomic data similarly failed to produce a robustly resolved backbone for euholognathan family-level phylogeny [14]. Emerging evidence indicates that pronounced mitochondrial compositional heterogeneity in Leuctridae may introduce systematic biases in phylogenetic reconstruction, partially accounting for these pervasive topological incongruences [18]. Furthermore, existing leuctrid molecular datasets suffer from severe sampling limitations, with most genera and geographic regions unsampled [5]. To date, no mitogenome-based assessment with dense generic sampling has comprehensively verified the monophyly of the two traditional subfamilies or clarified genus-level phylogenetic relationships within the family; the recent four-genus analysis of Yang and Du [5] excluded Megaleuctra and left subfamilial monophyly untested.
Beyond phylogenetic relationships, the evolutionary and biogeographic history of Leuctridae remains poorly characterised due to the lack of time-calibrated, dense-scale molecular phylogenies. Molecular divergence-time estimates suggest that crown-group Leuctridae originated in the Laurasian realm approximately 164 Ma (million years ago; 95% highest posterior density [HPD]: 133–193 Ma) during the Middle Jurassic [7], and fossil records from Eocene Baltic amber demonstrate that the family had already diversified into multiple genera, including both extant and extinct lineages, by the Eocene [19,20]. However, key evolutionary questions persist and can be addressed via mitogenome-based phylogenetic inference and divergence time estimation. First, the temporal framework and geological mechanisms driving the current Holarctic and Oriental disjunct distribution of Leuctridae remain untested at the family and genus levels; order-level analyses favour long-distance dispersal over vicariance [7], whereas regional studies in the Mediterranean highlight vicariance-driven patterns [11]. Second, the spatiotemporal origin and colonisation process of the species-rich Oriental Rhopalopsole lineage, a core component of East Asian leuctrid diversity, lacks robust molecular calibration [5]. Third, the evolutionary origin of the disjunct Megaleuctra distribution and its controversial phylogenetic affinity require rigorous verification based on sufficient mitogenome sampling [7,20,21]. Collectively, these knowledge gaps severely restrict our understanding of the diversification dynamics and evolutionary history of Leuctridae.
In this study, we assembled a comprehensive mitochondrial genome dataset of Leuctridae to reconstruct robust intra-familial phylogenetic relationships. With carefully selected outgroups from closely related euholognathan families for tree rooting and fossil-calibrated divergence dating, we aimed to (1) resolve the long-standing phylogenetic controversies regarding the monophyly and internal generic-level classification of Leuctridae; (2) explore the phylogenetic placement of Leuctridae within Euholognatha based on mitochondrial evidence; and (3) unravel the temporal diversification pattern and biogeographic evolutionary history of this ecologically important stonefly family. This study provides a novel mitogenome-based evolutionary framework for understanding the diversification and biogeographic radiation of Leuctridae.
2. Materials and Methods
2.1. Taxon Sampling
In this study, a total of 30 Leuctridae species, representing 9 of the 12 currently recognized genera of the family, were included in the analyses. Eleven of these species were newly sequenced herein, 12 were represented by mitogenomes retrieved from GenBank, and 7 by raw transcriptomic data downloaded for mitochondrial gene extraction. In addition, 9 species from closely related euholognathan families were selected as outgroups (Table S1). All newly collected specimens were identified to species level by Dávid Murányi based on adult morphology and preserved in 100% ethanol. Voucher specimens and extracted DNA were deposited at the Entomological Museum of Henan Institute of Science and Technology (HIST), Henan Province, China. Collection information for all taxa is provided in Table S2.
2.2. DNA Extraction and Mitochondrial Genome Sequencing
Total genomic DNA of each newly sampled specimen was extracted from the thoracic muscle using the DNeasy Blood & Tissue Kit (Qiagen, Hilden, Germany) according to the manufacturer’s instructions. The voucher specimens and extracted DNA were stored at −20 °C until use. Genomic DNA with qualified concentration and quality was submitted to Frasergen Bioinformatics (Wuhan, China) for library construction and high-throughput sequencing. An Illumina TruSeq library with an average insert size of approximately 350 bp was generated for each sample and then sequenced as 150 bp paired-end runs on the Illumina NovaSeq 6000 platform, yielding approximately 10 Gb of raw data per library.
2.3. Genome Assembly and Annotation
The mitogenome assembly strategy followed our previous studies [16,18]. Raw reads were filtered using Trimmomatic v0.30 [22] with default parameters to remove adapter sequences and low-quality reads. The clean reads were then subjected to de novo assembly using IDBA_UD v1.1.1 [23] with the minimum and maximum k-mer values set to 41 and 141, respectively. All 22 transfer RNA (tRNA) genes were annotated using the MITOS web server [24], whereas the protein-coding genes (PCGs) and two ribosomal RNA (rRNA) genes were identified by comparison with their homologues in published leuctrid mitogenomes, with gene boundaries determined manually according to adjacent genes. The complete mitogenomes sequenced in this study have been deposited in GenBank under accession numbers listed in Table S1.
We downloaded the transcriptomic raw data of seven species from the Sequence Read Archive (SRA) at NCBI (Table S1). Using the 13 mitochondrial PCGs and 2 rRNAs of the closely related species Leuctra fusca as references, we assembled the corresponding mitochondrial genes of these seven species from the SRA data with GeneMiner2 [25] under default parameters. In all seven species, the 13 PCGs were recovered nearly full-length, with intact open reading frames verified under genetic code 5. All recovered sequences were validated as mitochondrial in origin, and their completeness, read support and homology to the reference were verified; per-gene statistics are provided in Supplementary Materials, and the underlying verification data have been deposited in Zenodo (DOI: 10.5072/zenodo.624575).
2.4. Phylogenetic Analyses
The 13 PCGs and two rRNA genes of the 30 leuctrid taxa and 9 outgroup mitogenomes were used for phylogenetic reconstruction. Scopuridae served as the distant outgroup, while Taeniopterygidae, Capniidae, Nemouridae, and Notonemouridae served as close outgroups. Each PCG was aligned at the amino acid level using the MAFFT algorithm as implemented in TranslatorX [26], and the two rRNA genes were aligned individually using the G-INS-I strategy in MAFFT online [27], with ambiguously aligned regions masked using Gblocks [28]. All alignments were imported into MEGA 7.0 [29] and concatenated into two datasets: (1) PCGR, including all codon positions of the 13 PCGs plus the two rRNA genes, with a concatenated length of 12,971 nucleotides; and (2) PCG12R, including the first and second codon positions of the 13 PCGs plus the two rRNA genes, with a concatenated length of 9328 nucleotides. The best-fit partitioning schemes and substitution models for each dataset were selected using ModelFinder [30] according to the Akaike Information Criterion (AIC). Maximum likelihood (ML) analyses were performed with IQ-TREE v1.6.1 [31] under the edge-linked partition model, and nodal support was estimated using 1000 ultrafast bootstrap replicates together with SH-aLRT tests. Bayesian inference (BI) analyses were conducted with MrBayes 3.2.6 [32] under the partition schemes selected by ModelFinder, with two simultaneous runs of 10 million generations each, sampling one tree every 1000 generations, and the first 25% of samples discarded as burn-in. Convergence was considered to be reached when the average standard deviation of split frequencies fell below 0.01.
Compositional heterogeneity was diagnosed with two complementary χ2 assessments: (i) per-taxon composition χ2 statistics reported by IQ-TREE (each sequence against the alignment-wide mean; df = 3), and (ii) a global χ2 test of base-frequency homogeneity evaluated from the taxon × nucleotide contingency table (df = 3[n − 1]). Substitution saturation was assessed with Xia’s index in DAMBE [33]. Base-frequency structure was further visualised by principal component analysis (PCA) of the standardized A, C, and G frequencies of each taxon, with T omitted to avoid compositional closure; scores were obtained after z-score standardization of the three retained frequencies.
2.5. Divergence Time Estimation
Divergence times were estimated with the MCMCTree program implemented in PAML v4.10.10 [34], using the Bayesian consensus tree of the PCGR dataset as a fixed topology. Node ages were calibrated with five fossil calibration points. The root node (crown Euholognatha) was constrained with a soft maximum age of 316.9 Ma, following the Westphalian B–C occurrence of the stem-plecopteran †Gulou carpenteri [35]. The crown Nemouridae + Notonemouridae and Taeniopterygidae lineages were calibrated with a minimum age of 165.3 Ma and a soft maximum of 316.9 Ma, based on †Paranotonemoura zwicki and †Jurataenionema, respectively [36,37]. The Eocene Baltic amber fossils of †Megaleuctra neavei and †Leuctra spp. (Priabonian, 37.71–33.9 Ma) were selected to calibrate Megaleuctra and Leuctra, respectively [19,20,21,38,39]. In the MCMCTree analyses, these two nodes employed joint minimum–maximum bounds of 33.9–37.71 Ma (B(0.339, 0.3771) in MCMCTree notation), i.e., a uniform prior on this interval with soft bounds (2.5% tail probabilities at each margin). The younger margin (33.9 Ma) is treated as the crown minimum: because a congeneric fossil could in principle lie on the crown-group stem rather than within the crown proper, the true crown divergence is logically permitted to be older than the fossil horizon, making the minimum a conservative choice. The older margin (37.71 Ma) is instead a stratigraphic bound derived from the independently constrained age of the Priabonian Baltic amber unit, not a biological inference from the fossil’s phylogenetic position. For crown Euholognatha, the 316.9 Ma soft maximum is justified because the plecopteran stem lineage is already documented from the late Carboniferous, requiring all extant family crowns to postdate this bound; the constraint is softened to accommodate uncertainty in †G. carpenteri’s position relative to the extant radiation [17,35]. Stratigraphic ages and occurrence data were drawn from the primary descriptive literature and cross-checked against the Paleobiology Database (https://paleobiodb.org/, accessed on 10 September 2026); full calibration parameterization is given in Table 1.
Table 1.
Fossil calibration points used in the MCMCTree divergence-time analyses.
Divergence times were estimated using the approximate-likelihood method, in which the sequence likelihood is calculated from the gradient and Hessian matrix estimated with baseml. All calibration points were implemented as soft bounds with 2.5% tail probabilities. We used the correlated-rates clock model (clock = 3), the GTR substitution model (model = 7) with no among-site rate variation (alpha = 0), and cleandata = 0. The birth–death–sampling prior was specified as BDparas = 1 1 0 M, corresponding to a birth rate of 1, death rate of 1, and sampling fraction of 0 under a multiplicative construction. Gamma-Dirichlet priors were set as rgene_gamma = 2 10 1, sigma2_gamma = 1 10 1, and kappa_gamma = 6 2. Three independent MCMC chains were run from different seeds. Each chain was run for 5,200,000 generations, discarding the first 200,000 generations as burn-in and sampling every 50 generations to yield 100,000 posterior samples per chain. The robustness of the MCMCTree results was checked by comparing the consistency of the three independent chains, with effective sample sizes (ESS) ≥ 200 for all parameters. To assess the dependence of the age estimates on the calibration scheme, two additional analyses were performed with identical model, prior, and MCMC settings: (i) a prior-only run with the sequence likelihood disabled, sampling from the joint prior of times and substitution rates, and (ii) a calibration-sensitivity analysis in which the two Baltic amber calibrations (crown Megaleuctra and crown Leuctra) were removed and the analysis repeated.
2.6. Ancestral Area Reconstruction
To infer ancestral ranges, we delimited six discrete areas based on the distributions of the 30 sampled Leuctridae species, compiled from GBIF (https://www.gbif.org/, accessed on 14 September 2026, country-level occurrence records) and the Plecoptera Species File (plecoptera.speciesfile.org, state/province-level distributions), supplemented by type localities in the original descriptions: (A) Western North America (WNA); (B) the Oriental region, i.e., southern China south of the Qinling–Huai Line, Taiwan, and mainland Southeast Asia (SWC); (C) the Western Palaearctic, i.e., Europe and Anatolia (EUR); (D) the Eastern Palaearctic, i.e., Russia east of the Ural Mountains, the Japanese archipelago, the Korean Peninsula, and northeastern China (NEA); (E) the Central Asian–East Asian transition zone, i.e., Mongolia and northern/central China north of the Qinling–Huai Line, including Inner Mongolia, Ningxia, Shaanxi, and Xinjiang–Qinghai–Gansu (CEN); and (F) Eastern North America (ENA). Because no meridian cleanly separates the ranges of the sampled species in North America—eastern species (e.g., Zealeuctra claasseni) extend into the Great Plains, whereas the western Megaleuctra stigmata reaches Manitoba—WNA and ENA were delimited along the eastern foothills of the Rocky Mountains (~103 °W), the boundary minimizing the number of widespread (multi-area) species. Similarly, China was subdivided along the Qinling–Huai Line and Russia along the Urals (60 °E). Species recorded in more than one area were coded as widespread (e.g., Rhopalopsole subnigra: Japan and Taiwan = NEA + SWC; Paraleuctra zapekinae: NEA + CEN; Perlomyia smithae: CEN + NEA). The full area-by-species coding matrix is provided in Table S3.
Ancestral ranges were reconstructed using the R package BioGeoBEARS [40], run on the MCMCTree consensus tree with outgroups removed. The six discrete areas defined above were coded as a binary presence–absence matrix (Table S3), allowing widespread (multi-area) ranges. Six models were compared: the dispersal–extinction–cladogenesis model (DEC) [41], the dispersal–vicariance analysis model (DIVALIKE) [42], and the BAYAREALIKE model [43], each with and without the founder-event speciation parameter (+J). All model parameters were estimated under default settings. Given the limited vagility of most plecopteran species, the maximum number of areas per ancestral range was constrained to four, following Letsch et al. [7]. Model fit was compared using the second-order Akaike Information Criterion (AICc) and relative AICc weights, and ancestral ranges under the best-fitting model were visualized on the time tree. To assess the sensitivity of our conclusions to area delimitation, the entire procedure was repeated under the five-area scheme with CEN merged into NEA.
3. Results
3.1. Phylogenetic Analysis
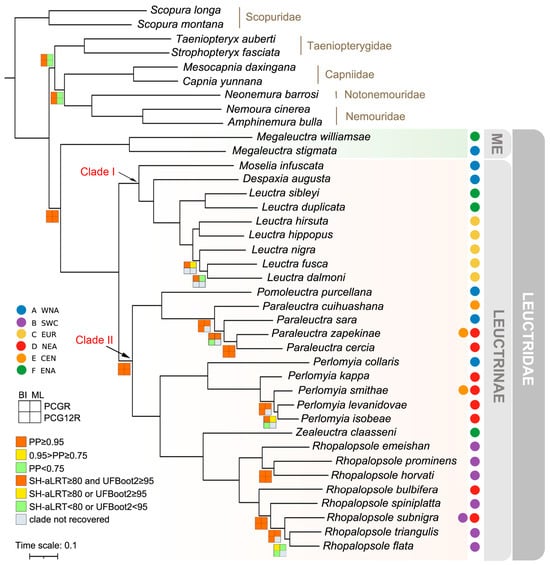
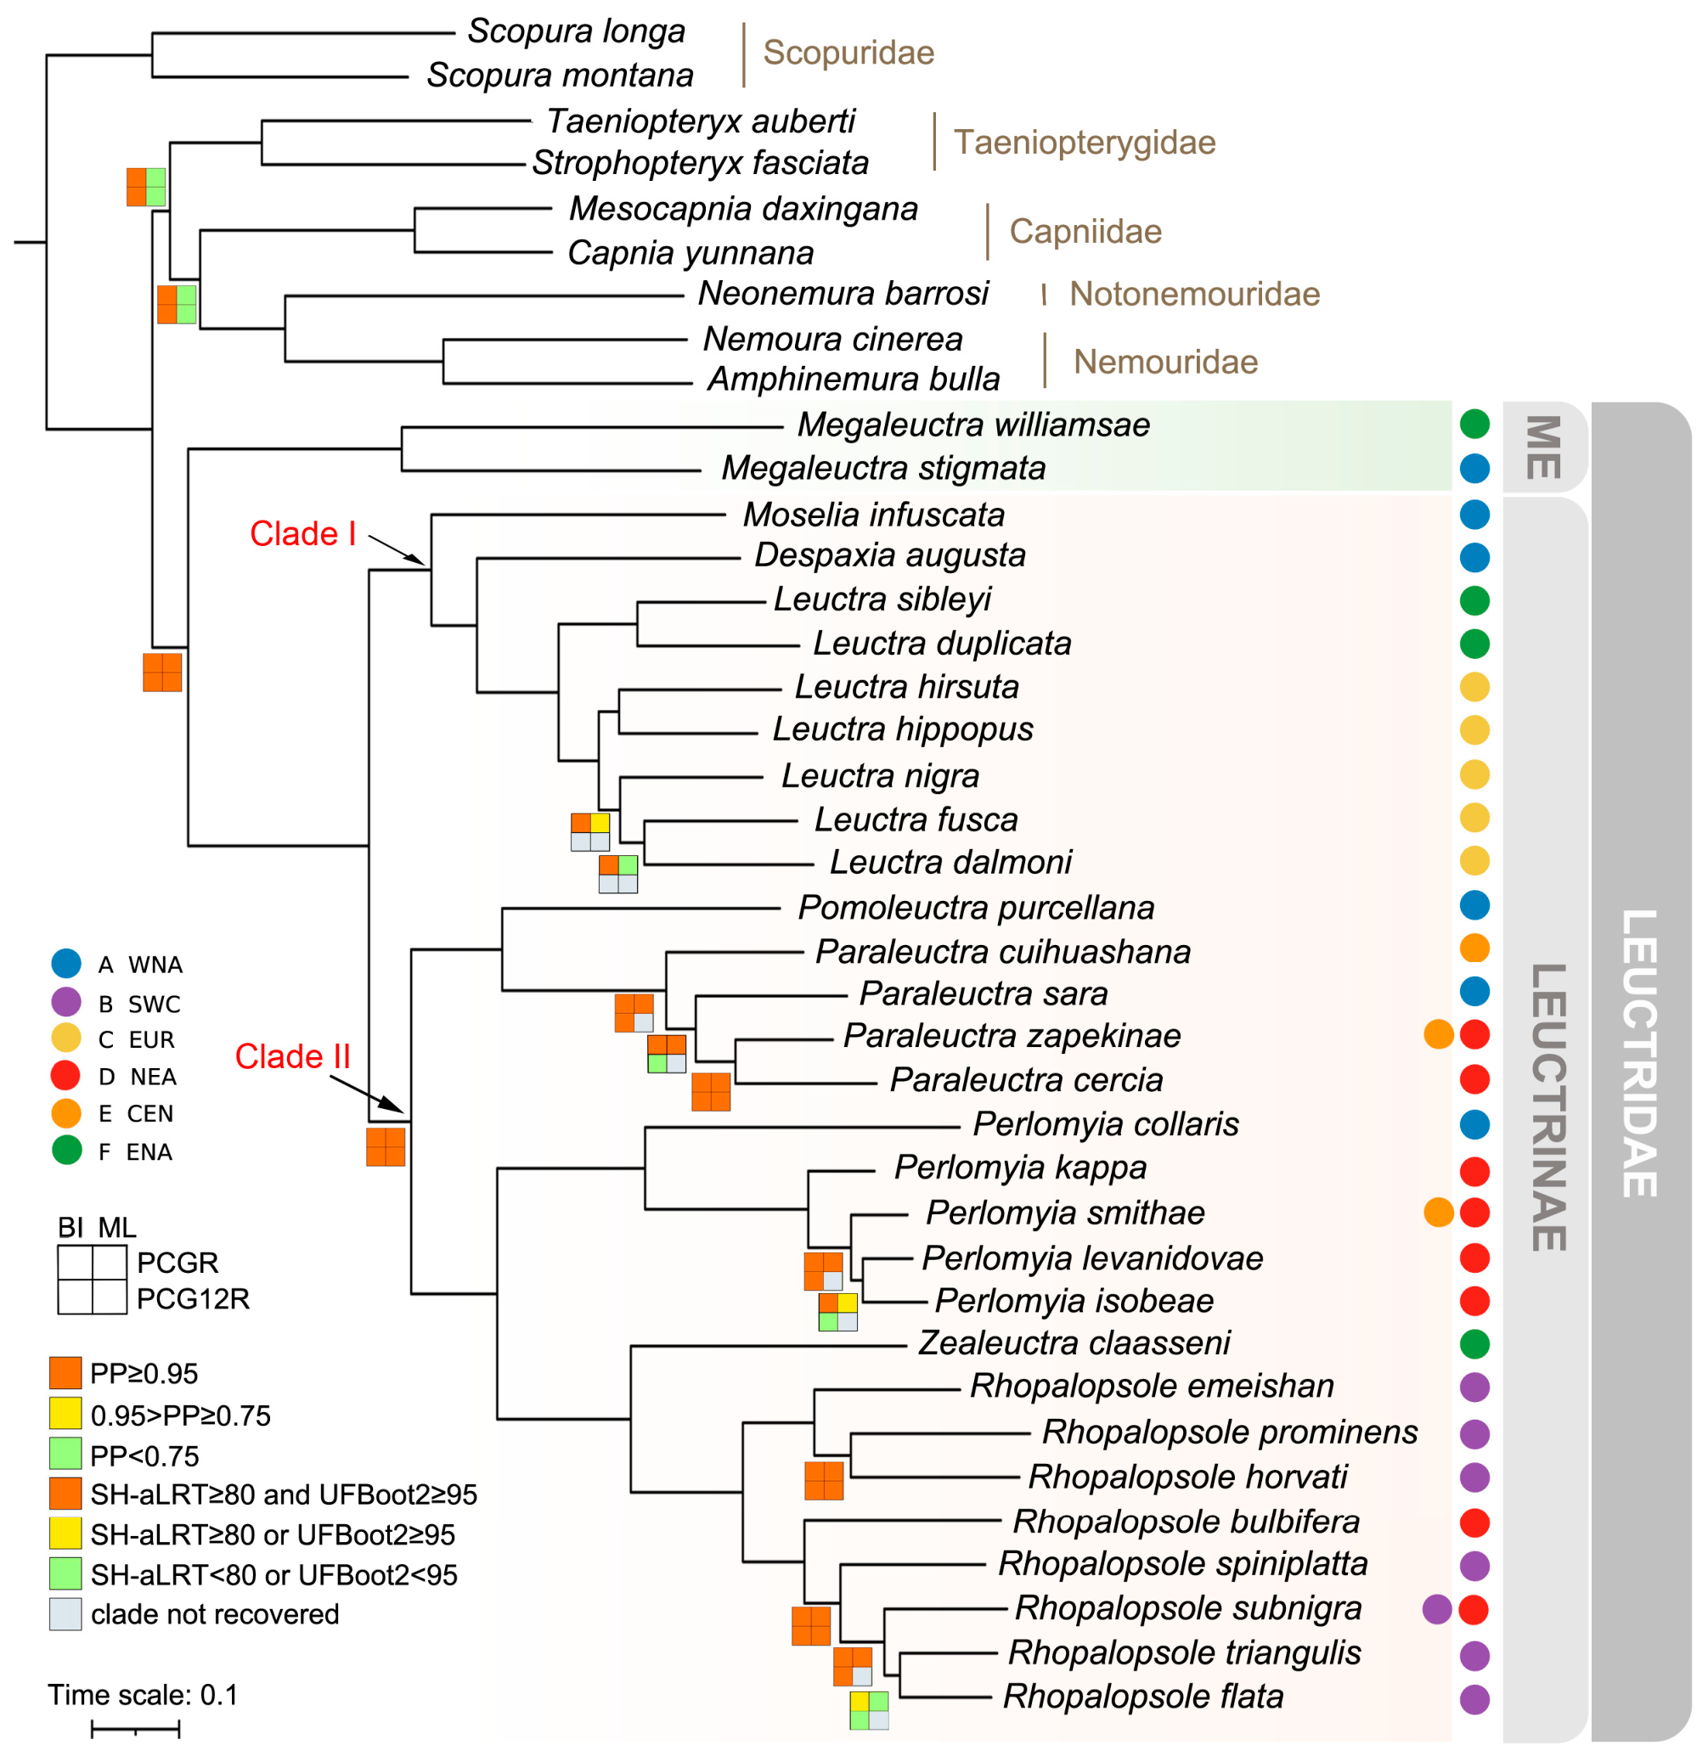
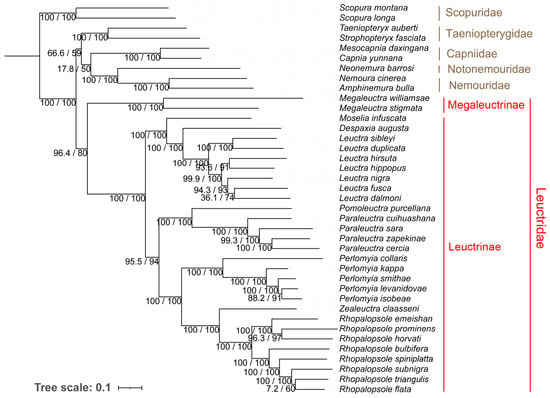
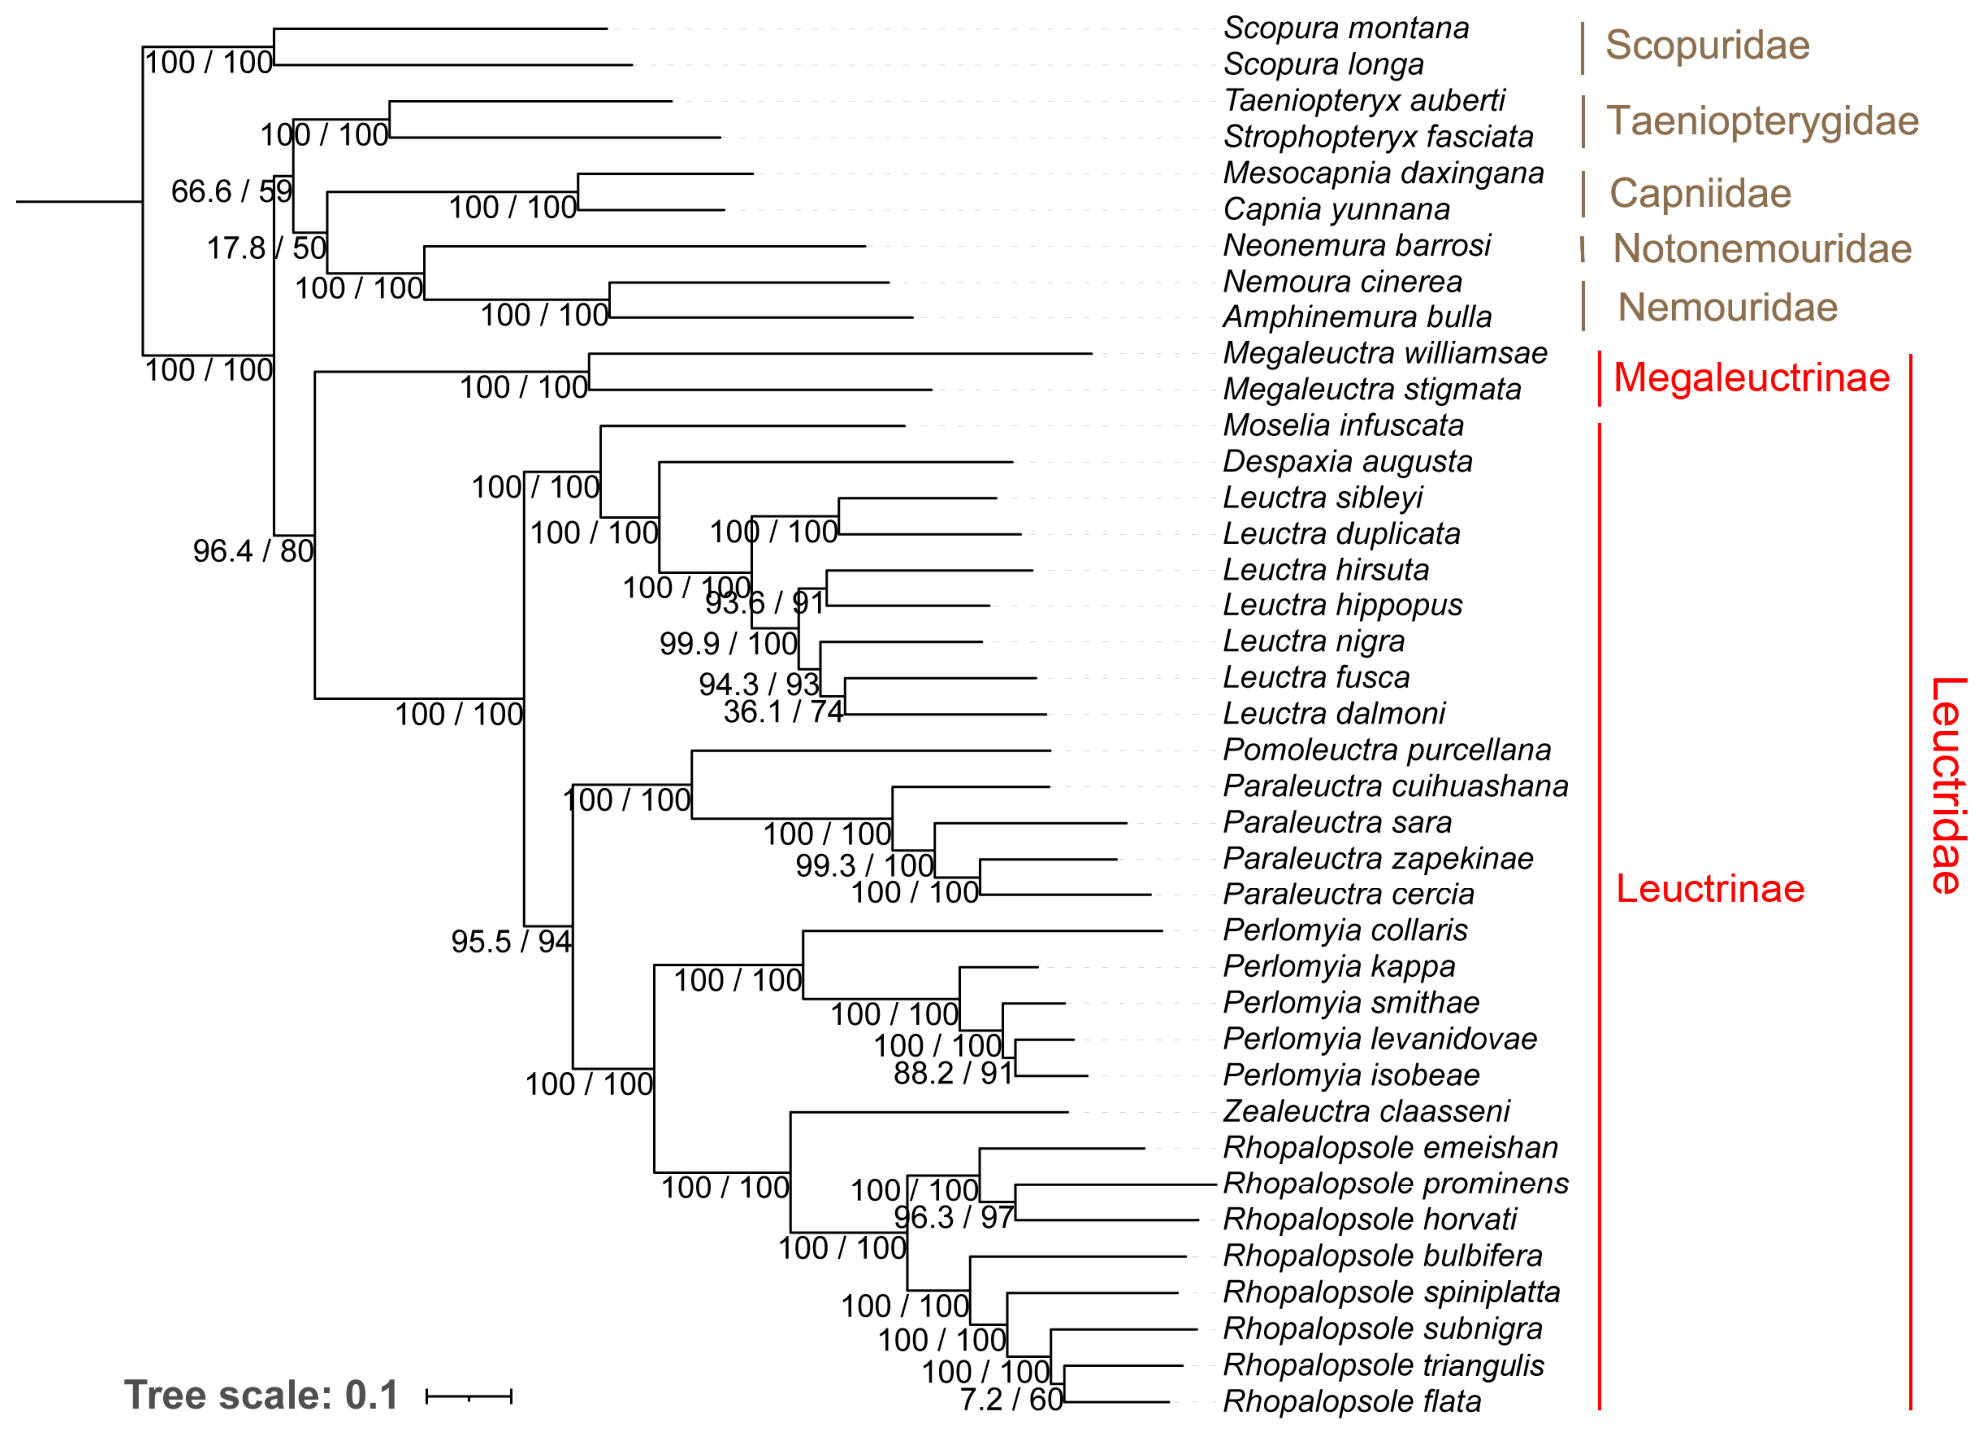
The phylogenetic relationships of Leuctridae were inferred from two nucleotide datasets (PCGR and PCG12R) under both BI and ML methods, and the resulting topologies were identical at all genus-level and deeper nodes (Figure 1 and Figure 2; Figures S1–S3). Leuctridae was recovered as monophyletic with strong support, with all 30 sampled species forming a well-supported clade to the exclusion of the nine outgroup taxa (posterior probability [PP] = 1.00 in both BI analyses; SH-aLRT = 100 and ultrafast bootstrap support [UFBoot2] = 100 in both ML analyses; Figure 1). At the interfamilial level, all four analyses recovered a close outgroup assemblage within Nemouroidea in which Nemouridae grouped with Notonemouridae, followed successively by Capniidae, Taeniopterygidae and Leuctridae (PP = 0.957–1.00; SH-aLRT = 17.8–100/UFBoot2 = 50–100). Scopuridae, a distantly related outgroup, was recovered as sister to the remaining nemouroidean families. Given the low ML support at these backbone nodes and the pronounced mitochondrial compositional heterogeneity documented for Leuctridae [18], the mitogenome data provide limited resolution of interfamilial relationships within Nemouroidea, which is consistent with the conflicting placements of Leuctridae among previous studies [7,15,16,17].
Figure 1.
Molecular phylogeny of Leuctridae. Topology refers to the BI tree generated in MrBayes based on mitochondrial PCGR dataset. The corresponding ML tree inferred from the same PCGR dataset is presented in Figure 2, and the remaining three phylogenetic trees derived from alternative datasets are provided in Figures S1–S3. Nodal supports from various analyses of different datasets are shown as squares at the nodes, with explanation of different colours shown in the bottom left box. Unlabelled nodes indicate strong support (PP = 0.95, SH-aLRT = 100 and UFBoot2 = 100).
Figure 2.
Phylogenetic tree inferred from ML analysis of PCGR dataset. SH-aLRT (left) and ultrafast bootstrap support (UFBoot2, right) values of ML analyses were labeled at each node.
Composition heterogeneity and saturation were assessed for both datasets (Figure S4). Per-taxon IQ-TREE χ2 tests (df = 3) rejected compositional homogeneity for 27 of the 39 PCGR taxa but only three PCG12R taxa, predominantly within Leuctridae. A global 39 × 4 contingency χ2 test (df = 114) was highly significant in PCGR (χ2 = 924.55, p < 0.0001, Cramér’s V = 0.025) but not in PCG12R (χ2 = 112.79, p = 0.51, V = 0.010), and a partition-restricted test of the third codon positions of PCGR was stronger still (χ2 = 2298.57, p < 0.0001, V = 0.074), localising the signal to third positions. PCA of per-taxon frequencies separated the two coding schemes along PC1 (91.9% variance; AT-richness gradient), with PCGR being more dispersed. Xia’s entropy-based saturation index was far below the critical values in both matrices (PCGR: Iss = 0.288–0.294 vs. Iss.c = 0.819–0.859; PCG12R: Iss = 0.157–0.165 vs. Iss.c = 0.816–0.856; both p < 0.001), with transitional plateaux only beyond ~17% divergence in PCGR (Figure S4). Because the bias is lineage-directional and third-position-localised, a site-heterogeneous CAT formulation primarily addresses across-site profile mixture rather than lineage compositional nonstationarity; the third-position-purged PCG12R contrast therefore provides the more direct coding-strategy sensitivity test, and cross-matrix topological congruence shows the biased positions do not distort within-family inference. Within Leuctridae, the BI and ML topologies of PCGR are identical and its BI tree is strongly supported at the vast majority of nodes, whereas the PCG12R BI tree shows low support at several shallow nodes, consistent with the loss of phylogenetically informative sites after removal of the third codon positions; in the ML analyses, both datasets show low support at some shallow intrageneric nodes and at the interfamilial backbone. Given the absence of substitution saturation at these shallow divergences, the strong PCGR support most likely reflects genuine phylogenetic signal rather than a compositional artifact. These diagnostics quantitatively document the compositional heterogeneity invoked above [18] and, together with the coding-strategy comparison afforded by PCG12R, localise rather than overturn the primary PCGR inference.
Within Leuctridae, Megaleuctra, the sole genus of the monogeneric subfamily Megaleuctrinae, was recovered as the sister lineage of all remaining leuctrid genera in all four analyses (PP = 1.00; SH-aLRT = 96.4–98.6/UFBoot2 = 80–93), supporting the monophyly of the family and the position of Megaleuctra as its earliest-diverging lineage. This placement corroborates the transcriptomic [14] and morphological [1,6,7] evidence but rejects the Megaleuctra–Capniidae sister relationship inferred from multi-locus Sanger data [7,13]. The remaining leuctrids, corresponding to Leuctrinae, were divided into two strongly supported major clades (PP = 1.00; SH-aLRT = 95.5–98.9/UFBoot2 = 94–98): clade I, in which Despaxia grouped with Leuctra, and this pair was in turn sister to Moselia; and clade II, comprising Paraleuctra and Pomoleuctra as sister to Perlomyia, Rhopalopsole, and Zealeuctra.
Within clade I, Despaxia was sister to Leuctra (PP = 1.00; SH-aLRT = 99.9–100/UFBoot2 = 100). Leuctra was monophyletic and subdivided into two species groups, one comprising L. duplicata and L. sibleyi and the other L. dalmoni, L. fusca, L. nigra, L. hippopus, and L. hirsuta, although the internal relationships of the latter were poorly resolved in the PCG12R dataset (PP = 0.837–0.846; SH-aLRT = 45.7–54.6/UFBoot2 = 57–60). In clade II, Paraleuctra was monophyletic and sister to Pomoleuctra (PP = 1.00; SH-aLRT = 100/UFBoot2 = 100); Perlomyia was monophyletic, with P. collaris sister to the remaining four species; and Rhopalopsole was monophyletic (PP = 1.00; SH-aLRT = 100/UFBoot2 = 100), comprising two lineages: one including R. bulbifera, R. flata, R. subnigra, R. triangulis, and R. spiniplatta, and the other R. emeishan, R. horvati, and R. prominens. Notably, the Nearctic Zealeuctra was recovered as the sister lineage of the species-rich Oriental Rhopalopsole in all four analyses (PP = 1.00; SH-aLRT = 100/UFBoot2 = 100). Nodal support was generally higher in the PCGR than in the PCG12R analyses, and the four analyses showed minor inconsistencies at shallow nodes; nevertheless, the two datasets recovered identical topologies at all genus-level and deeper nodes, indicating that the inclusion of third codon positions did not visibly alter these relationships despite the compositional heterogeneity of leuctrid mitogenomes [18].
3.2. Divergence Time Estimates
Pairwise comparison of the posterior medians of the three chains showed strong agreement (Pearson r ≥ 0.99999; normalised Root Mean Square Deviation [RMSD] ≤ 8.4 × 10⁻³; maximum absolute difference = 0.015 MCMCtree time units, i.e., 1.5 Ma; Figure S5), with the scatter points clustering tightly around the identity line. These results indicate that the three chains yielded consistent posterior estimates, supporting convergence to the same posterior distribution. Accordingly, the results from run 1 were adopted as the representative estimates.
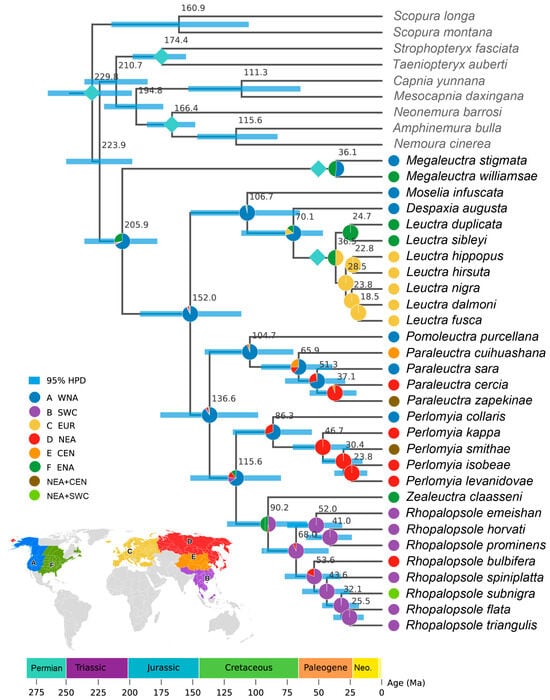
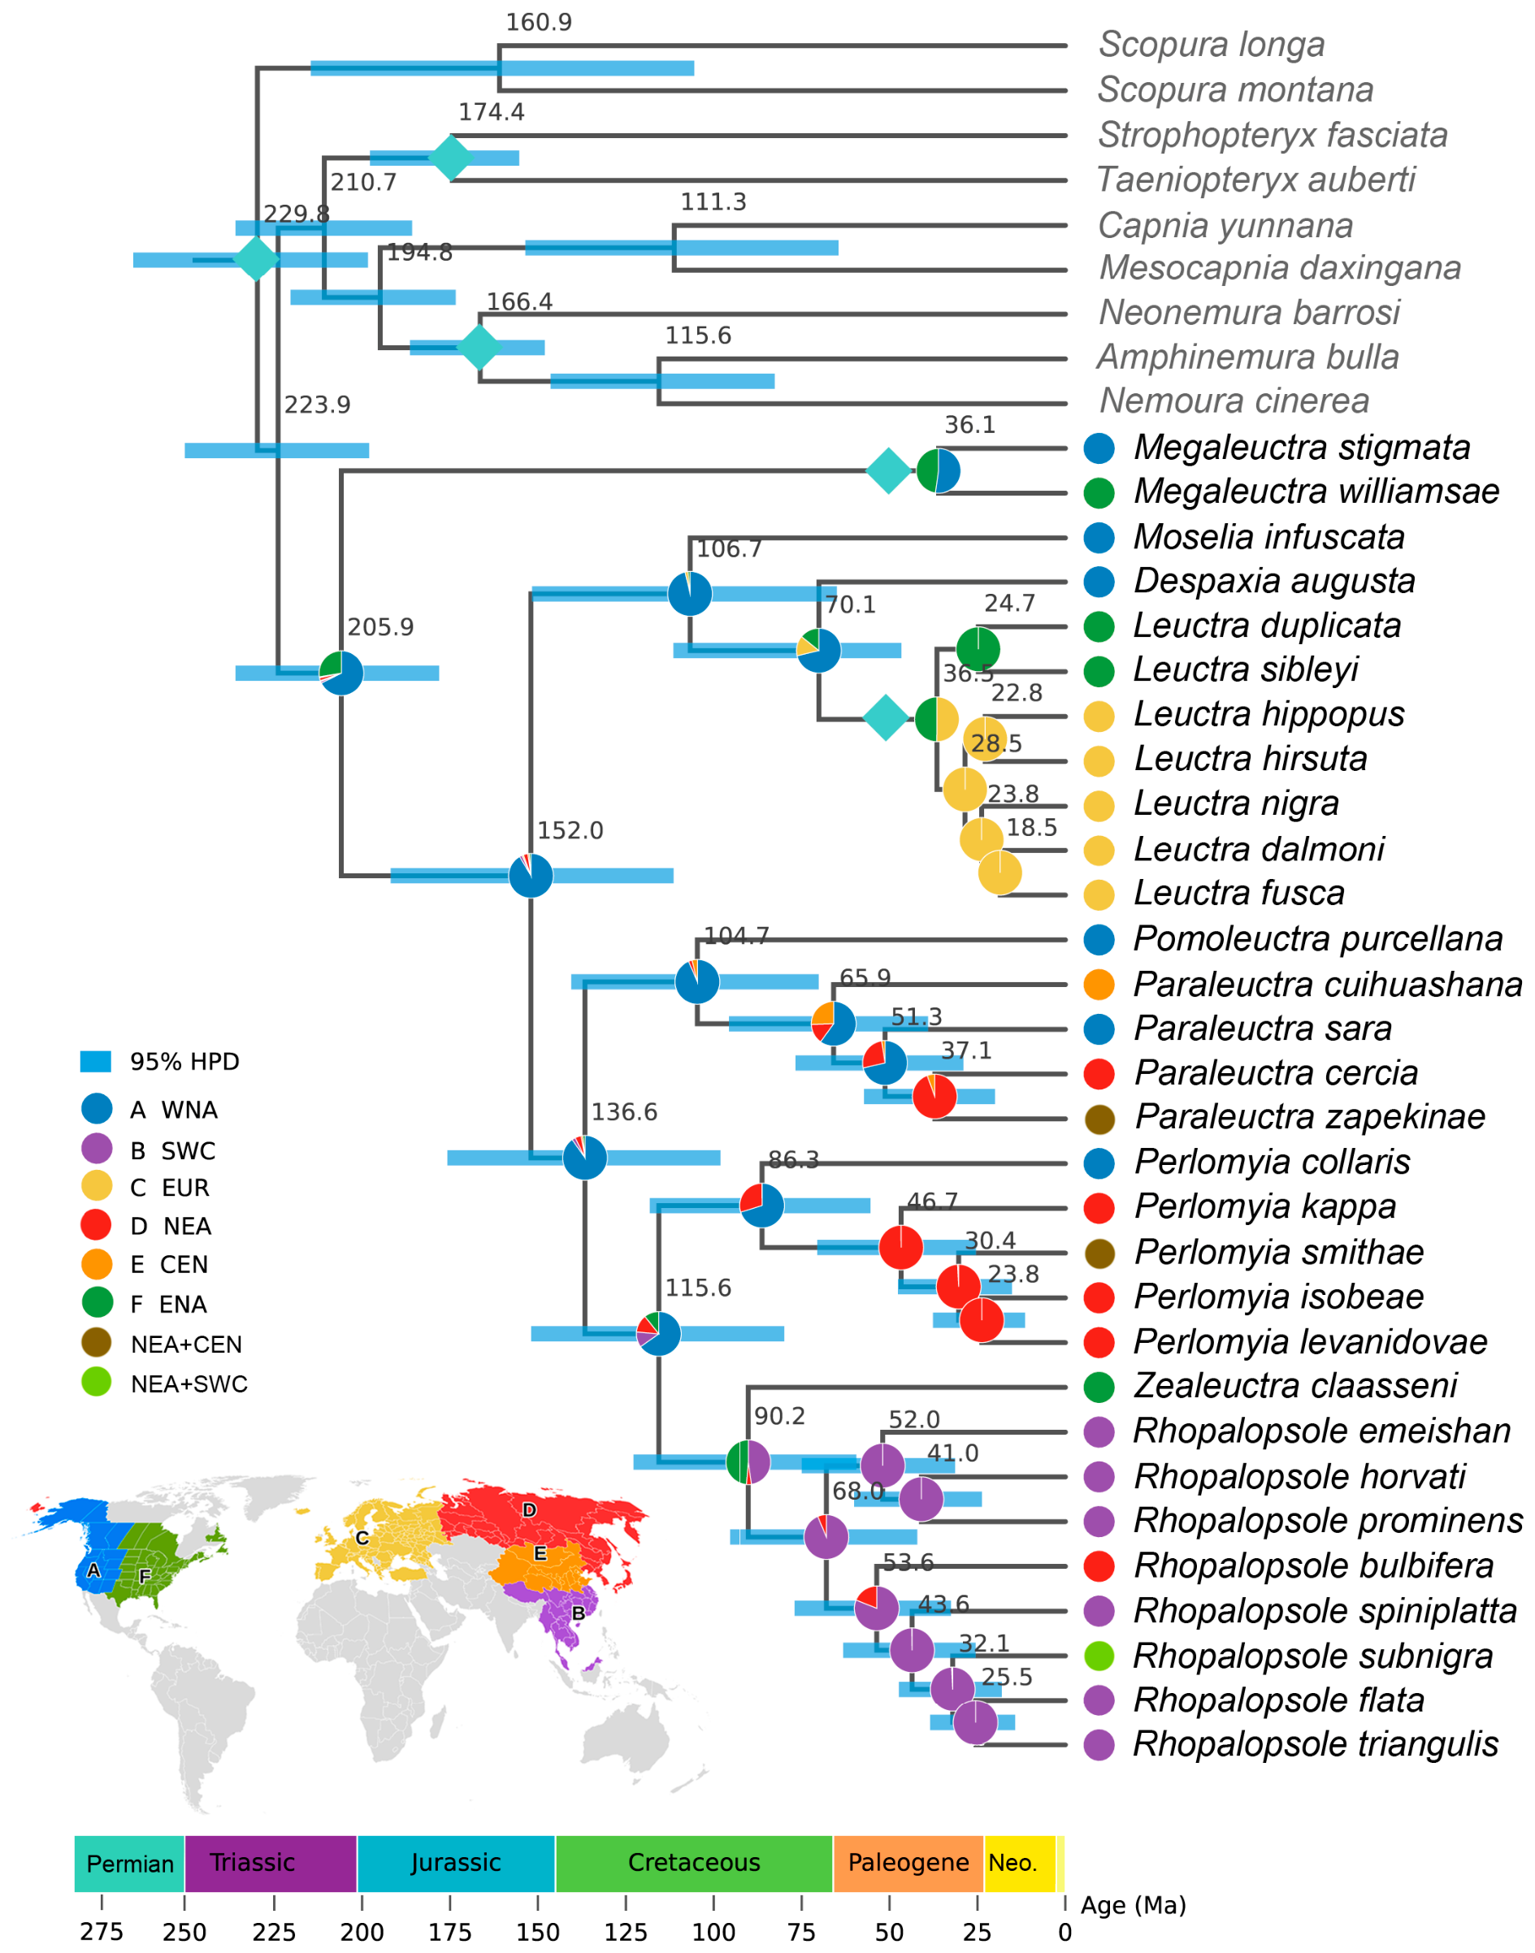
Age estimates (median age values and 95% HPD) from the MCMC molecular dating analysis are shown in Figure 3 and reported in Table S4. The MCMCTree analysis estimated the crown age of Euholognatha at 229.8 Ma (95% HPD: 198.4–266.1 Ma) and the divergence of Leuctridae from its sister groups (node n42, the common ancestor of Leuctridae and its sister groups) at 223.9 Ma (95% HPD: 195.06–256.98 Ma). The crown age of Leuctridae was estimated at 205.9 Ma (95% HPD: 178.1–237.0 Ma), with the median in the Late Triassic and the HPD spanning the Middle/Late Triassic boundary to the Early Jurassic. Taeniopterygidae and Nemouridae + Notonemouridae have Jurassic medians, whereas Nemouridae (115.6 Ma) and Capniidae (111.3 Ma) have Cretaceous medians despite wide, boundary-crossing HPDs. Within Leuctridae, median genus crown ages range from the Late Cretaceous to the Late Eocene: Perlomyia at 86.3 Ma (55.4–118.2 Ma), Rhopalopsole at 68.0 Ma (42.1–95.4 Ma), Paraleuctra at 65.9 Ma (39.1–95.7 Ma), Leuctra at 36.5 Ma (34.4–37.9 Ma), and Megaleuctra at 36.1 Ma (34.0–37.8 Ma), the latter two being tightly constrained by the Baltic amber calibrations. The dependence of these two estimates on the fossil settings was tested explicitly (Table S5). In the prior-only analysis, the marginal priors at these nodes closely matched the main-analysis posterior estimates (Leuctra: 35.99 Ma, 95% HPD 33.96–37.75 Ma; Megaleuctra: 35.81 Ma, 33.92–37.72 Ma), indicating that their narrow HPDs directly mirror the tight bounds of the Baltic amber interval (33.9–37.71 Ma) and that these two ages are essentially prior-determined, whereas the remaining nodes showed prior means close to the posterior estimates of the main analysis, indicating that they are informed primarily by the sequence data. When the two Baltic amber calibrations were removed, the crown ages of Leuctra and Megaleuctra shifted substantially to 112.1 Ma (95% HPD: 88.37–137.49 Ma) and 175.67 Ma (95% HPD: 139.63–213.83 Ma), respectively, and the other intra-familial node ages changed correspondingly, whereas the family-level nodes were only mildly affected (Table S5). These results indicate that the intra-familial divergence times of Leuctridae are driven primarily by the Baltic amber fossil record, while the deeper inter-familial chronological framework is robust to the calibration scheme. These estimates are broadly compatible with recent molecular time estimates for the family and its relatives [7,15,17].
Figure 3.
Chronogram with estimated divergence times among Leuctridae species based on an MCMCTree analysis, with ancestral areas reconstructed from DIVALIKE + J in BioGeoBEARS. Median age estimates (Ma) are shown below nodes; blue bars represent 95% highest posterior density (HPD) intervals of age estimates; green rhombuses indicate placement of fossil; pie charts indicate relative likelihoods of each reconstructed distribution, with geographical distribution colour-coded according to the legend shown in the figure. Letters and colors denote the six biogeographic areas: (A) Western North America (WNA); (B) Oriental region, southern China and mainland Southeast Asia (SWC); (C) Western Palaearctic (EUR); (D) Eastern Palaearctic (NEA); (E) Central Asian–East Asian transition zone (CEN); (F) eastern North America (ENA); see Section 2.6 for delimitation criteria.
3.3. Ancestral Area Estimates
Under the six-area scheme, the DIVALIKE + J model fitted the data best (lnL = −51.22, AICc = 109.36), receiving 72.3% of the AICc weight, followed by DEC + J (11.4%) and the unconstrained DIVALIKE model (8.3%) (Table S6). The founder-event speciation parameter j was estimated to be greater than zero in all +J models (j = 0.029 under DIVALIKE + J), with the AICc comparison providing the primary support for founder-event speciation, whereas the extinction rate e converged on its lower bound in every model, indicating that extinction was effectively unidentifiable at this taxonomic scale. The ranking of models was unaffected by area delimitation: under the five-area scheme with CEN merged into NEA, DIVALIKE + J again ranked first (lnL = −39.40, AICc = 85.73, AICc weight 77.5%, j = 0.042), followed by DEC + J (20.6%) (Table S6). Ancestral ranges were therefore interpreted under the DIVALIKE + J model and are shown in Figure 3, with marginal area probabilities given in Table S7.
Under the six-area scheme, the most likely ancestral range at the crown node of Leuctridae (205.9 Ma, 95% HPD 178.1–237.0 Ma) was western North America (WNA; relative probability 0.59), with substantial additional support for a WNA + ENA (eastern North America) range (marginal probability of ENA 0.40). WNA-dominated ranges were recovered at most deep internal nodes of the family between approximately 152 and 65 Ma (relative probabilities 0.50–0.97), consistent with early diversification in western North America, although the alternative WNA + ENA range received substantial support and the reconstruction is model-dependent; the exceptions to this pattern are the crown nodes of Rhopalopsole + Zealeuctra and Rhopalopsole. The crown node of the clade uniting the Oriental genus Rhopalopsole with the Nearctic Zealeuctra (90.2 Ma, 95% HPD 59.5–122.8 Ma) was poorly resolved: the single most probable range was eastern North America (relative probability 0.37), whereas East Asian ranges accumulated a higher marginal probability (SWC 0.59), so that a North American or East Asian origin for this trans-Pacific lineage cannot be distinguished with the current data. Under the alternative DEC + J model, the most likely range at the family crown node was WNA + ENA rather than WNA alone (Table S8), so that the choice between the two best-scoring founder-event models affects the reconstruction at this node.
At shallower phylogenetic depth, the crown node of Rhopalopsole (68.0 Ma, 95% HPD 42.1–95.4 Ma) was reconstructed as SWC with high confidence (relative probability 0.93), and all subsequent nodes within the genus remained in Southwest China, consistent with a sustained in situ radiation. The Perlomyia clade showed the opposite pattern: its crown node (86.3 Ma) was most likely WNA (0.61), whereas the node grouping P. isobeae, P. kappa, P. levanidovae and P. smithae (46.7 Ma) was firmly Northeast Asia/NEA (0.998), implying a colonization of the Northwest Pacific coast from North America. The crown node of Paraleuctra (65.9 Ma) was most likely WNA (0.50), with NEA and NEA + CEN ranges also supported, and its node at 37.1 Ma was reconstructed as NEA (0.94). Within Leuctra, the crown node (36.5 Ma) was most likely European (EUR; 0.36), and the node of the five western Palaearctic species (28.5 Ma) was reconstructed as EUR with near certainty, while the Nearctic L. duplicata + L. sibleyi pair (24.7 Ma) was unequivocally ENA. The crown node of Megaleuctra (36.1 Ma) was reconstructed as ENA + WNA (0.62), reflecting the present-day disjunction between the eastern and western North American species groups of the genus.
The five-area sensitivity analysis (CEN merged into NEA) did not alter any of these conclusions materially: the model ranking was unchanged, the Leuctridae crown node remained WNA (relative probability 0.52), and all genus-level assignments were retained (Table S9). The only noticeable shift concerned Paraleuctra, whose crown node moved from WNA (0.50) under the six-area scheme to NEA (0.59) under the five-area scheme, an expected consequence of merging the CEN range of P. cuihuashana into NEA. Taken together, the reconstructions were robust to the delimitation of biogeographic areas. The choice between the two founder-event models was likewise of limited consequence: comparing the two models node-by-node within each area scheme, DEC + J and DIVALIKE + J recovered identical most-likely ancestral ranges at 27 of the 29 internal nodes in both the six-area and the five-area scheme, with the same two exceptions: the family crown node, at which both models supported WNA-involving ranges (marginal probability of WNA 0.95–0.98), and the weakly supported crown node of Leuctra (EUR under DIVALIKE + J, ENA under DEC + J; all relative probabilities < 0.5; Table S8).
4. Discussion
Our analyses provide the first family-level time-calibrated biogeographic reconstruction for the family Leuctridae and suggest a history considerably older than previously estimated for the family [7]. The crown age of the family at approximately 206 Ma places its origin in the Late Triassic, broadly compatible within wide credible intervals with recent molecular timescales for Plecoptera as a whole [7,15,17,18] and with the diversification dynamics inferred for the order [44]. The subsequent presence of Leuctridae in Eocene Baltic amber [19,20,38] demonstrates that the principal lineages of the family were already established before the Palaearctic cooling at the Eocene–Oligocene boundary. Today the family reaches its greatest diversity in the temperate Northern Hemisphere, particularly in East Asia and North America [45], a pattern that our reconstructions suggest was assembled through deep-time range persistence, repeated long-distance colonization, and possibly ancient vicariance.
At higher taxonomic levels, our analyses confirm the monophyly of Leuctridae with maximal support (PP = 1.00; SH-aLRT = 100/UFBoot2 = 100), in agreement with previous transcriptomic [14] and morphological [1,6] treatments of the family, while resolving the conflict with the multi-locus Sanger hypothesis of a Megaleuctra–Capniidae relationship [7] in favour of the monophyly of the family as traditionally circumscribed. The position of Leuctridae within the Nemouroidea, however, remains one of the most persistent uncertainties in stonefly phylogenetics. Although all four of our analyses recovered the same backbone, with Nemouridae grouped with Notonemouridae and followed successively by Capniidae, Taeniopterygidae and Leuctridae, ML support at these deep nodes was low (SH-aLRT = 17.8–100/UFBoot2 = 50–100), and the pronounced compositional heterogeneity of leuctrid mitogenomes [18] cautions against over-interpreting this topology. The difficulty is not unique to our data: previous mitogenomic and multi-locus studies have placed Leuctridae in mutually conflicting positions within the superfamily [7,15,16,17], and even the recent mitogenome-based analyses disagree, recovering Leuctridae either as sister to a clade uniting Capniidae, Taeniopterygidae, Nemouridae and Scopuridae [46] or in other, mutually incompatible positions [15,16,17]. Resolving this backbone will probably require denser taxon sampling across the Nemouroidea combined with markers that are less susceptible to mitochondrial compositional bias, such as transcriptomes or anchored hybrid enrichment [7,14].
Within Leuctridae, the recovery of Megaleuctra as the sister lineage of all remaining genera (PP = 1.00; SH-aLRT = 96.4–98.6/UFBoot2 = 80–93) reconciles our mitogenomic results with the classical morphology-based systems of Zwick [1,6], in which the monogeneric Megaleuctrinae was treated as the earliest-diverging branch of the family, and with the transcriptomic phylogeny of North American Plecoptera [14], while rejecting the Megaleuctra–Capniidae sister relationship inferred from multi-locus Sanger data [7]. The remaining genera, corresponding to Leuctrinae, were divided into two strongly supported major clades: clade I, uniting Despaxia and Leuctra with Moselia, and clade II, combining Paraleuctra and Pomoleuctra with Perlomyia, Rhopalopsole and Zealeuctra. This framework refines the morphology-based genus groupings of Zwick [6] by specifying the relationships among them, and it is broadly concordant with the emerging molecular picture of the family. In particular, the close association of Rhopalopsole and Perlomyia within clade II echoes the grouping of these predominantly Oriental genera in the taxonomic reassessment of the Japanese Leuctridae by Shimizu [47] and in the mitogenome-based hypothesis of Yang and Du [5], although the latter analysis, restricted to four Chinese genera, placed Leuctra as sister to (Rhopalopsole + Perlomyia) + Paraleuctra, a position conflicting with the deep split between our clades I and II; denser sampling will be required to reconcile this discrepancy. The sister relationship between the Holarctic Paraleuctra and the Nearctic Pomoleuctra, recovered with maximal support, further suggests that generic-level diversification in clade II preceded the biogeographic differentiation of the Holarctic fauna, although this inference rests on a single sister-group pairing.
At the genus level, two of our results bear directly on the biogeographic interpretations developed below. The recovery of the Nearctic Zealeuctra as the sister lineage of the species-rich Oriental Rhopalopsole (PP = 1.00; SH-aLRT = 100/UFBoot2 = 100) provides independent phylogenetic corroboration of the ancient trans-Pacific connection between eastern Asia and North America that our dating analyses place at approximately 90 Ma. Within Leuctra, the clear separation of a Nearctic species group (L. duplicata and L. sibleyi) from a western Palaearctic group (L. dalmoni, L. fusca, L. nigra, L. hippopus and L. hirsuta) is consistent with the deep Old World–New World differentiation of the genus, whereas the poor resolution within the latter group echoes the pronounced cryptic diversity and recent diversification revealed by integrative studies of the European L. inermis species group [48] and of the eastern Nearctic Leuctra fauna of the southern Appalachians [49]. Such patterns suggest that species-level relationships in Leuctra, and probably in other leuctrid genera, will require denser sampling and faster-evolving markers to resolve. Finally, the identical topologies recovered from the PCGR and PCG12R datasets at all genus-level and deeper nodes, with generally higher nodal support in the PCGR analyses, indicate that the inclusion of third codon positions did not visibly alter these relationships; nevertheless, both datasets remain subject to the same mitochondrial compositional bias [18], and analyses of amino-acid or degenerated-codon alignments would be required to exclude systematic error formally. These results lend confidence to the phylogenetic framework discussed here and used in the biogeographic analyses below.
The recovery of western North America as the most likely ancestral area at the crown and at most deep nodes of Leuctridae, a hypothesis favored rather than firmly established by our analyses, is noteworthy given the family’s Old World diversity. An origin of extant lineages in western North America agrees with the strong Nearctic imprint recovered by phylogenomic analyses of North American Plecoptera [14], although it contrasts with Hynes’s classical view that the North American stonefly fauna was assembled largely through repeated immigration from Eurasia and other source areas [50]. Western North America combines high topographic complexity with mesic temperate habitats that have persisted through much of the Cenozoic, conditions that plausibly acted both as a cradle for diversification and as a refugium during climatic deterioration. The reconstruction of an ENA + WNA range at the crown of Megaleuctra, a genus today disjunctly distributed between North America and the Korean Peninsula [21], further illustrates the role of the continent’s internal biotic exchanges. More broadly, our results fit the emerging picture from time-calibrated ‘Tree of Life’ analyses of aquatic insects, in which Holarctic clades commonly retain signals of a North American or Beringian hub [51]. This contrasts with the austral temperate faunas, where distributions are dominated by Gondwanan vicariance [52].
The sister relationship between the Oriental Rhopalopsole and the Nearctic Zealeuctra, reconstructed at approximately 90 Ma, adds a striking case to the well-documented disjunct distributions uniting East Asia and North America in Plecoptera. Comparable trans-Beringian and trans-Pacific disjunctions are known from other stonefly lineages, and the Russian Far East has repeatedly been identified as a biogeographic crossroads and glacial refugium for the order [53,54]. The intercontinental disjunction of the chloroperlid Alaskaperla [54] and the zoogeographic structure of the Far Eastern stonefly fauna [53] both point to the same corridor, which our estimates suggest could have been available to leuctrid lineages from the Late Cretaceous onwards; because the ancestral range of the Rhopalopsole–Zealeuctra ancestor is poorly resolved, we regard a trans-Beringian route as one plausible historical scenario rather than a direct inference of the present analyses. At the same time, the strongly SWC-confined reconstruction of all Rhopalopsole nodes younger than 68 Ma shows that, once established, lineages may remain regional endemics over tens of millions of years. Stoneflies are weak dispersers, and comparative evidence indicates that wing-reduced taxa in particular track past connections rather than current dispersal routes [55]; the founder-event signal we detect (j > 0 in all best models) is therefore consistent with rare, chance dispersal events across barriers, the mode of range expansion expected for insects with limited vagility [40,56], although we treat this as a model-based inference rather than direct evidence of the historical process.
Methodologically, our results add to the growing evidence that founder-event speciation improves model fit in probabilistic biogeography [40,56], while also illustrating why such results warrant caution. The DEC + J model has been criticized on conceptual and statistical grounds, and likelihood-based comparisons between DEC and DEC + J can be misleading [57]. In our data the extinction parameter was pushed to its lower bound in all models, a common artifact when tip ages are uniform and range dynamics are dominated by cladogenesis, and the relative support for DIVALIKE + J over DEC + J, while clear, rests on a single family with 30 sampled species. Model selection therefore establishes only the relative fit of DIVALIKE + J among the models evaluated; it does not by itself demonstrate founder-event speciation as the actual historical mechanism, and the broader generalization of our results is limited by the taxon sampling. We accordingly interpret the reconstructions qualitatively, treat the positive founder-event parameter as a property of the best-fitting model rather than direct biological evidence, and emphasize robustness across area delimitations rather than the precise parameter estimates.
Several limitations of our analyses warrant consideration. Our sampling covers 30 of the roughly 400 valid Leuctridae species [4,45] and nine of the twelve currently recognized genera. The unsampled genera Calileuctra (2 spp.), Pachyleuctra (3 spp.) and Tyrrhenoleuctra (6 spp.), the Oriental fauna (the likely diversity centre of Rhopalopsole), and the East Asian (Korean) lineage of Megaleuctra represent major taxonomic and geographic gaps; unsampled lineages could alter reconstructions at deep nodes, as could the exclusive reliance on mitochondrial markers. The coding of areas at the scale of entire continents necessarily obscures within-area structure, and the merged five-area analysis, while reassuring, cannot exclude all artifacts of area delimitation. Importantly, robustness to area delimitation does not imply robustness to incomplete taxon sampling: the proposed North American origin is inferred despite the substantial diversity of the family in East Asia, and denser sampling of the Oriental fauna could shift the reconstructions at deeper nodes. Future progress will require denser taxon sampling, especially across East Asia and the Oriental region; the integration of morphological evidence, including the taxonomically informative egg and female genital characters, with molecular data; genome-scale markers to resolve the shallow backbone of the family; and explicit paleogeographic models, including time-stratified analyses with dispersal rates varying through time and across pathways [40], to further test these scenarios. Such data will make it possible to test whether the western North American hub inferred here reflects a genuine evolutionary origin or the lingering signature of an ancient, wider Holarctic range.
5. Conclusions
This study provides the first family-level time-calibrated biogeographic synthesis of the family Leuctridae, based on mitochondrial sequence data from 30 species representing nine of the twelve currently recognized genera. The mitochondrial data confirm the monophyly of the family and resolve Megaleuctra as its earliest-diverging lineage, followed by the division of the remaining leuctrids into two major Leuctrinae clades, although relationships within the Nemouroidea remain weakly resolved and mitochondrial analyses are sensitive to compositional heterogeneity. Our dating analyses place the origin of the family in the Late Triassic, and ancestral-range reconstruction under the DIVALIKE + J model favors western North America as the most likely area of origin, a hypothesis that will require testing with denser taxon sampling, with the present disjunct distributions between East Asia and North America arising through deep-time range persistence and repeated long-distance colonization, possibly combined with ancient vicariance. The reconstructions proved robust to area delimitation but not to incomplete taxon sampling, and model-dependent in the recognition of founder-event speciation; we therefore emphasize their qualitative interpretation. With roughly 400 valid species and the Oriental fauna still largely unsampled, the phylogeny and timescale presented here provide a framework for future studies integrating denser taxon sampling, genome-scale markers, and explicit paleogeographic models to further resolve the evolutionary history of the family.
Supplementary Materials
The following supporting information can be downloaded at https://www.mdpi.com/article/10.3390/insects17111134/s1, Figure S1: Phylogenetic tree inferred from BI analysis of PCGR dataset; Figure S2: Phylogenetic tree inferred from BI analysis of PCG12R dataset; Figure S3: Phylogenetic tree inferred from ML analysis of PCG12R dataset; Figure S4: Composition and saturation diagnostics; Figure S5: Convergence of the three independent MCMCtree chains; Table S1: Molecular data used in the present study; Table S2: Information of Leuctridae species newly sequenced in the present study; Table S3: Biogeographical distribution for each species as applied in BioBEOBEARS; Table S4: Estimated divergence times (in millions of years) for nodes in Figure 3; Table S5. Node age estimates under two dating scenarios; Table S6: Statistical results of BioGeoBEARS analysis of six biogeographical models; Table S7: Node-level ancestral range estimates of six-area scheme for Leuctridae under the DIVALIKE + J model; Table S8: Node-level comparison of ancestral range estimates between the DEC + J and DIVALIKE + J models; Table S9: Node-level ancestral range estimates of five-area scheme for Leuctridae under the DIVALIKE + J model.
Author Contributions
Conceptualization, Y.W. and J.C.; methodology, Y.W., H.L. and Z.S.; validation, Y.W., H.L. and Y.N.; formal analysis, Y.W. and H.L.; data curation, Y.W., H.L., Z.S. and Y.N.; writing—original draft preparation, Y.W.; writing—review and editing, Y.W., J.C. and H.Y.; visualization, H.L. and Z.S.; supervision, J.C.; project administration, J.C.; funding acquisition, J.C. All authors have read and agreed to the published version of the manuscript.
Funding
This research was funded by the National Natural Science Foundation of China (grant number 32270492) and the Natural Science Foundation of Henan (grant number 262300421264).
Data Availability Statement
The newly sequenced and assembled mitogenomes for eleven accessions of leuctrid species have been deposited in GenBank (https://www.ncbi.nlm.nih.gov/, accessed on 30 September 2026) under the accession numbers listed in Table S1. The final sequence alignments, the partitioning schemes and substitution models, the time-calibrated tree and MCMCTree control (priors) files, the sources of the distributional coding sources, and the BioGeoBEARS settings and analysis scripts are publicly available at Zenodo (DOI: 10.5072/zenodo.624575).
Acknowledgments
The authors thank Boris C. Kondratieff (Colorado State University, Fort Collins, USA) and Dávid Murányi (Eszterházy Károly Catholic University, Hungary) for their generosity in collecting and donating the specimens used in this study.
Conflicts of Interest
The authors declare no conflicts of interest.
Abbreviations
The following abbreviations are used in this manuscript:
| PCGs | protein-coding genes |
| rRNA | ribosomal RNA |
| SRA | Sequence Read Archive |
| ML | Maximum likelihood |
| BI | Bayesian inference |
| RMSD | Root Mean Square Deviation |
References
- Zwick, P. Phylogenetic System and Zoogeography of the Plecoptera. Annu. Rev. Entomol. 2000, 45, 709–746. [Google Scholar] [CrossRef] [Scilit]
- DeWalt, R.E.; Ower, G.D. Ecosystem Services, Global Diversity, and Rate of Stonefly Species Descriptions (Insecta: Plecoptera). Insects 2019, 10, 99. [Google Scholar] [CrossRef] [Scilit]
- Eichert, A.; de Almeida, L.H.; Du, Y.-Z.; Duarte, T.; Fochetti, R.; Hotaling, S.; Huo, Q.-B.; Jouault, C.; Kirkaldy, A.P.; Letsch, H.; et al. Stonefly systematics: Past, present, and future. Insect Syst. Divers. 2025, 9, 7. [Google Scholar] [CrossRef]
- DeWalt, R.E.; Hopkins, H.; Neu-Becker, U.; Stueber, G. Plecoptera Species File Online. Version 5.0/5.0. Available online: http://Plecoptera.SpeciesFile.org (accessed on 20 September 2026).
- Yang, X.; Du, Y.-Z. A new species of Rhopalopsole (Insecta, Plecoptera, Leuctridae) from the Anhui Province of China and phylogeny of Leuctridae based on mitochondrial genomes. ZooKeys 2025, 1244, 147–158. [Google Scholar] [CrossRef] [Scilit]
- Zwick, P. Insecta: Plecoptera. Phylogenetisches System und Katalog; Das Tierreich 94; Walter de Gruyter: Berlin, Germany, 1973. [Google Scholar]
- Letsch, H.; Simon, S.; Frandsen, P.B.; Liu, S.; Machida, R.; Mayer, C.; Misof, B.; Niehuis, O.; Zhou, X.; Wipfler, B. Combining molecular datasets with strongly heterogeneous taxon coverage enlightens the peculiar biogeographic history of stoneflies (Insecta: Plecoptera). Syst. Entomol. 2021, 46, 952–967. [Google Scholar] [CrossRef] [Scilit]
- Chen, Z.-T. The first formal report of brachypterous stonefly of Leuctridae (Plecoptera) from China. Zootaxa 2019, 4624, 230–240. [Google Scholar] [CrossRef] [Scilit]
- Lee, J.J.; Baumann, R.W. Dracoleuctra, a new wingless stonefly genus from southern Oregon, U.S.A. (Plecoptera: Leuctridae). Zootaxa 2022, 5115, 258–266. [Google Scholar] [CrossRef] [Scilit]
- Teslenko, V.A.; Palatov, D.M.; Semenchenko, A.A. Description of new apterous winter species of Leuctra (Plecoptera: Leuctridae) based on morphology and DNA barcoding, and further records to the stonefly fauna of the Caucasus, Georgia. Zootaxa 2019, 4585, 546–560. [Google Scholar] [CrossRef] [Scilit]
- Fochetti, R.; Sezzi, E.; de Figueroa, J.M.T.; Modica, M.V.; Oliverio, M. Molecular systematics and biogeography of the western Mediterranean stonefly genus Tyrrhenoleuctra (Insecta, Plecoptera). J. Zool. Syst. Evol. Res. 2009, 47, 328–336. [Google Scholar] [CrossRef] [Scilit][Green Version]
- Vinçon, G.; Boumans, L.; Gattolliat, J.-L. Reinstatement of Leuctra biellensis Festa, 1942 (Plecoptera, Leuctridae). Alp. Entomol. 2018, 2, 35–43. [Google Scholar] [CrossRef] [Scilit]
- Illies, J. Die Gattung Megaleuctra (Plecopt., Ins.). Z. Morphol. Ökol. Tiere 1967, 60, 124–134. [Google Scholar] [CrossRef] [Scilit]
- South, E.J.; Skinner, R.K.; DeWalt, R.E.; Kondratieff, B.C.; Johnson, K.P.; Davis, M.A.; Lee, J.J.; Durfee, R.S. Phylogenomics of the North American Plecoptera. Syst. Entomol. 2021, 46, 287–305. [Google Scholar] [CrossRef] [Scilit]
- Ding, S.; Li, W.; Wang, Y.; Cameron, S.L.; Murányi, D.; Yang, D. The phylogeny and evolutionary timescale of stoneflies (Insecta: Plecoptera) inferred from mitochondrial genomes. Mol. Phylogenet. Evol. 2019, 135, 123–135. [Google Scholar] [CrossRef] [Scilit]
- Cao, J.; Wang, Y.; Guo, X.; Wang, G.; Li, W.; Murányi, D. Two complete mitochondrial genomes from Leuctridae (Plecoptera: Nemouroidea): Implications for the phylogenetic relationships among stoneflies. J. Insect Sci. 2021, 21, 16. [Google Scholar] [CrossRef] [Scilit]
- Wang, Y.; Yang, X.; Engel, M.S.; Huo, Q.-B.; Du, Y.-Z.; Cai, C. Reconstructing the evolutionary history of stoneflies: Phylogenetic insights and temporal dynamics. iScience 2025, 28, 113614. [Google Scholar] [CrossRef] [Scilit]
- Cao, J.J.; Wang, Y.; Murányi, D.; Cui, J.X.; Li, W.H. Mitochondrial genomes provide insights into the Euholognatha (Insecta: Plecoptera). BMC Ecol. Evol. 2024, 24, 16. [Google Scholar] [CrossRef] [Scilit]
- Caruso, C.E.; Wichard, W. Paleogeographic distribution of Leuctridae and Nemouridae genera preserved in Baltic amber, with the description of Palaeopsole weiterschani n. gen., n. sp. (Plecoptera). Entomol. Heute 2011, 23, 69–77. [Google Scholar]
- Chen, Z.T.; Liu, H.L. A new needle stonefly with parasitic mites from the Eocene Baltic amber. Acta Palaeontol. Pol. 2022, 67, 649–654. [Google Scholar] [CrossRef] [Scilit]
- Baumann, R.W.; Stark, B.P. The genus Megaleuctra Neave (Plecoptera: Leuctridae) in North America. Illiesia 2013, 9, 65–93. [Google Scholar]
- Bolger, A.M.; Lohse, M.; Usadel, B. Trimmomatic: A flexible trimmer for Illumina sequence data. Bioinformatics 2014, 30, 2114–2120. [Google Scholar] [CrossRef] [Scilit]
- Peng, Y.; Leung, H.C.M.; Yiu, S.M.; Chin, F.Y.L. IDBA-UD: A de novo assembler for single-cell and metagenomic sequencing data with highly uneven depth. Bioinformatics 2012, 28, 1420–1428. [Google Scholar] [CrossRef] [Scilit]
- Bernt, M.; Donath, A.; Jühling, F.; Externbrink, F.; Florentz, C.; Fritzsch, G.; Pütz, J.; Middendorf, M.; Stadler, P.F. MITOS: Improved de novo metazoan mitochondrial genome annotation. Mol. Phylogenet. Evol. 2013, 69, 313–319. [Google Scholar] [CrossRef] [Scilit]
- Yu, X.Y.; Tang, Z.Z.; Zhang, Z.; Song, Y.X.; He, H.; Shi, Y.; Hou, J.Q.; Yu, Y. GeneMiner2: Accurate and automated recovery of genes from genome-skimming data. Mol. Ecol. Resour. 2026, 26, e70111. [Google Scholar] [CrossRef] [Scilit]
- Abascal, F.; Zardoya, R.; Telford, M.J. TranslatorX: Multiple alignment of nucleotide sequences guided by amino acid translations. Nucleic Acids Res. 2010, 38, W240–W245. [Google Scholar] [CrossRef] [Scilit]
- Katoh, K.; Standley, D.M. MAFFT multiple sequence alignment software version 7: Improvements in performance and usability. Mol. Biol. Evol. 2013, 30, 772–780. [Google Scholar] [CrossRef] [Scilit]
- Castresana, J. Selection of conserved blocks from multiple alignments for their use in phylogenetic analysis. Mol. Biol. Evol. 2000, 17, 540–552. [Google Scholar] [CrossRef] [Scilit]
- Kumar, S.; Stecher, G.; Tamura, K. MEGA7: Molecular Evolutionary Genetics Analysis version 7.0 for bigger datasets. Mol. Biol. Evol. 2016, 33, 1874–1877. [Google Scholar] [CrossRef] [Scilit]
- Kalyaanamoorthy, S.; Minh, B.Q.; Wong, T.K.F.; von Haeseler, A.; Jermiin, L.S. ModelFinder: Fast model selection for accurate phylogenetic estimates. Nat. Methods 2017, 14, 587–591. [Google Scholar] [CrossRef] [Scilit]
- Nguyen, L.-T.; Schmidt, H.A.; von Haeseler, A.; Minh, B.Q. IQ-TREE: A fast and effective stochastic algorithm for estimating maximum-likelihood phylogenies. Mol. Biol. Evol. 2015, 32, 268–274. [Google Scholar] [CrossRef] [Scilit]
- Ronquist, F.; Teslenko, M.; van der Mark, P.; Ayres, D.L.; Darling, A.; Höhna, S.; Larget, B.; Liu, L.; Suchard, M.A.; Huelsenbeck, J.P. MrBayes 3.2: Efficient Bayesian phylogenetic inference and model choice across a large model space. Syst. Biol. 2012, 61, 539–542. [Google Scholar] [CrossRef] [Scilit]
- Xia, X.; Xie, Z.; Salemi, M.; Chen, L.; Wang, Y. An index of substitution saturation and its application. Mol. Phylogenet. Evol. 2003, 26, 1–7. [Google Scholar] [CrossRef] [Scilit]
- Yang, Z. PAML 4: Phylogenetic Analysis by Maximum Likelihood. Mol. Biol. Evol. 2007, 24, 1586–1591. [Google Scholar] [CrossRef] [Scilit]
- Béthoux, O.; Cui, Y.; Kondratieff, B.C.; Stark, B.P.; Ren, D. At last, a Pennsylvanian stem-stonefly (Plecoptera) discovered. BMC Evol. Biol. 2011, 11, 248. [Google Scholar] [CrossRef] [Scilit]
- Cui, Y.; Ren, D.; Béthoux, O. The Pangean journey of ‘south forestflies’ (Insecta: Plecoptera) revealed by their first fossils. J. Syst. Palaeontol. 2019, 17, 255–268. [Google Scholar] [CrossRef] [Scilit]
- Liu, Y.; Ren, D.; Sinitshenkova, N.D.; Shih, C. The oldest known record of Taeniopterygidae in the Middle Jurassic of Daohugou, Inner Mongolia, China (Insecta: Plecoptera). Zootaxa 2007, 1521, 1–8. [Google Scholar] [CrossRef] [Scilit]
- Pictet, F.J.; Hagen, H. Die im Bernstein befindlichen Neuropteren der Vorwelt. In Die im Bernstein Befindlichen Organismen der Vorwelt; Berendt, G.C., Ed.; Nicolai: Berlin, Germany, 1856; Volume 2, pp. 41–126. [Google Scholar]
- Ricker, W.E. New Canadian perlids (Part II). Can. Entomol. 1936, 67, 256–264. [Google Scholar] [CrossRef] [Scilit]
- Matzke, N.J. Probabilistic Historical Biogeography: New Models for Founder-Event Speciation, Improvement on Ancestral Range Inference, and Answers to the ‘Etc.’. Ph.D. Dissertation, The University of Texas at Austin, Austin, TX, USA, 2013. [Google Scholar]
- Ree, R.H.; Moore, B.R.; Webb, C.O.; Donoghue, M.J. A likelihood framework for inferring the evolution of geographic range on phylogenetic trees. Evolution 2005, 59, 2299–2311. [Google Scholar] [CrossRef] [Scilit]
- Ronquist, F. Dispersal-vicariance analysis: A new approach to the quantification of historical biogeography. Syst. Biol. 1997, 46, 195–203. [Google Scholar] [CrossRef]
- Landis, M.J.; Matzke, N.J.; Moore, B.R.; Huelsenbeck, J.P. Bayesian analysis of biogeography when the number of areas is large. Syst. Biol. 2013, 62, 789–804. [Google Scholar] [CrossRef] [Scilit]
- Jouault, C.; Nel, A.; Legendre, F.; Condamine, F.L. Estimating the drivers of diversification of stoneflies through time and the limits of their fossil record. Insect Syst. Divers. 2022, 6, ixac017. [Google Scholar] [CrossRef] [Scilit]
- Fochetti, R.; Tierno de Figueroa, J.M. Global diversity of stoneflies (Plecoptera; Insecta) in freshwater. Hydrobiologia 2008, 595, 365–377. [Google Scholar] [CrossRef] [Scilit]
- Shen, Y.; Du, Y.-Z. The Mitochondrial Genome of Leuctra sp. (Plecoptera: Leuctridae) and Its Performance in Phylogenetic Analyses. Zootaxa 2019, 4671, 571–580. [Google Scholar] [CrossRef] [Scilit]
- Shimizu, T. Paraleuctra (Insecta: Plecoptera: Leuctridae) from Japan, with Taxonomic Notes on the Japanese Leuctridae. Species Divers. 2000, 5, 285–303. [Google Scholar] [CrossRef] [Scilit][Green Version]
- Vitecek, S.; Vinçon, G.; Graf, W.; Pauls, S. High Cryptic Diversity in Aquatic Insects: An Integrative Approach to Study the Enigmatic Leuctra inermis Species Group (Plecoptera). Arthropod Syst. Phylog. 2017, 75, 497–521. [Google Scholar] [CrossRef] [Scilit]
- Metzger, M.L.; Grubbs, S.A.; Johnson, J.R. An Integrative Phylogenetic Analysis of Eastern Nearctic Leuctra (Plecoptera: Leuctridae), with an Emphasis on the Fauna of a Southern Appalachian Highlands Landscape. Can. Entomol. 2022, 154, e15. [Google Scholar] [CrossRef] [Scilit]
- Hynes, H.B.N. Biogeography and origins of the North American stoneflies (Plecoptera). Mem. Entomol. Soc. Can. 1988, 120, 31–37. [Google Scholar] [CrossRef] [Scilit]
- García-Girón, J.; Múrria, C.; Arnedo, M.A.; Bonada, N.; Cañedo-Argüelles, M.; Derka, T.; Fernández-Calero, J.M.; Li, Z.; Tierno de Figueroa, J.M.; Xie, Z.; et al. A time-calibrated ‘Tree of Life’ of aquatic insects for knitting historical patterns of evolution and measuring extant phylogenetic biodiversity across the world. Earth-Sci. Rev. 2024, 252, 104767. [Google Scholar] [CrossRef] [Scilit]
- McCulloch, G.A.; Wallis, G.P.; Waters, J.M. A time-calibrated phylogeny of southern hemisphere stoneflies: Testing for Gondwanan origins. Mol. Phylogenet. Evol. 2016, 96, 150–160. [Google Scholar] [CrossRef] [Scilit]
- Teslenko, V.A. Stoneflies (Plecoptera) of the Russian Far East: Diversity and zoogeography. Aquat. Insects 2009, 31, 693–706. [Google Scholar] [CrossRef] [Scilit]
- Zwick, P. Intercontinental disjunction in Alaskaperla (Plecoptera: Chloroperlidae). Aquat. Insects 2007, 29, 67–69. [Google Scholar] [CrossRef] [Scilit]
- McCulloch, G.A.; Wallis, G.P.; Waters, J.M. Does wing size shape insect biogeography? Evidence from a diverse regional stonefly assemblage. Glob. Ecol. Biogeogr. 2017, 26, 93–101. [Google Scholar] [CrossRef] [Scilit]
- Matzke, N.J. Model selection in historical biogeography reveals that founder-event speciation is a crucial process in island clades. Syst. Biol. 2014, 63, 951–970. [Google Scholar] [CrossRef] [Scilit]
- Ree, R.H.; Sanmartín, I. Conceptual and statistical problems with the DEC+J model of founder-event speciation and its comparison with DEC via model selection. J. Biogeogr. 2018, 45, 741–749. [Google Scholar] [CrossRef] [Scilit]

Disclaimer/Publisher’s Note: The statements, opinions and data contained in all publications are solely those of the individual author(s) and contributor(s) and not of MDPI and/or the editor(s). MDPI and/or the editor(s) disclaim responsibility for any injury to people or property resulting from any ideas, methods, instructions or products referred to in the content. |
© 2026 by the authors. Licensee MDPI, Basel, Switzerland. This article is an open access article distributed under the terms and conditions of the Creative Commons Attribution (CC BY) license.