


Simple Summary
Digger wasps (Crabronidae) are a diverse group of predatory wasps that contribute to ecosystem functioning and insect biodiversity. Southwestern China contains diverse habitats that support a rich wasp fauna, but information on its species and distribution remains scattered among historical and recent records. We reviewed records from southwest China (Yunnan, Sichuan, Guizhou, and Xizang Autonomous Region) to establish a regional biodiversity baseline. The available records showed strong differences among regions and periods, and many species were known from only a few localities, indicating that their distributions remain poorly understood. Our study brings historical and recent information together and provides a useful baseline for future surveys, taxonomic research, biodiversity assessment, and conservation planning in southwestern China.
Abstract
Digger wasps (Crabronidae) are a diverse lineage of aculeate Hymenoptera, but their faunistic documentation in southwestern China remains scattered across historical and recent sources. We collected, compiled, cleaned, and taxonomically reviewed 373 occurrence records from 1909 to 2025, representing 264 coordinate localities across Yunnan, Sichuan, Guizhou, and Xizang Autonomous Region. The resulting working checklist contains 160 species in 30 genera, 11 tribes, and four subfamilies. Crabroninae contained 75 species (46.9%) and Pemphredoninae 70 species (43.8%), while Trypoxylon was the most species-rich recorded genus, with 22 species. Occurrence were highly uneven among regions: Yunnan contributed 310 records (83.1%) and 135 species, whereas Sichuan, Guizhou, and Xizang Autonomous Region contained 15, 13, and 11 species, respectively. Raw Jaccard similarity was highest between Sichuan and Guizhou (0.167), and the equal-record rarefied mean for that pair was 0.161 (95% CI 0.091–0.211). Record-order accumulation continued without a clear asymptote by the end of the compilation. Species-level occurrence was shallow: 81 species (50.6%) were represented by one locality, 147 (91.9%) by fewer than five localities, and 50 species (31.2%) had no record in the compilation during the previous 30 years. These patterns show that the available evidence is strongly shaped by collection and documentation history. Province-only records therefore should not be interpreted as evidence of endemicity or confirmed absence elsewhere. The compilation provides a reproducible baseline for future field surveys and taxonomic revision, especially in the less documented regions of Sichuan, Guizhou, and Xizang Autonomous Region.
1. Introduction
The members of Crabronidae are generally small- to medium-sized solitary wasps that are known as predators and pollinators [1]. This family comprises more than 250 genera containing more than 9000 species worldwide, with particularly high diversity in tropical regions [2]. Ecologically, these wasps are predators that provision their nests with insect prey such as Diptera, Hemiptera, and Coleoptera, and many species also visit flowers [3]. Their nesting requirements can be closely associated with local habitat and microclimatic conditions [4]. Large genera such as Cerceris and Trypoxylon make substantial contributions to regional faunas, and Trypoxylon is also the most species-rich represented genus in the present compilation [2].
Despite their diversity, knowledge of Crabronidae remains uneven among regions. Detailed catalogues are available for some areas, including Russia, the Arabian Peninsula, and the Neotropics [5,6,7]. In China, taxonomic work has expanded in recent decades, including descriptions and revisions of Passaloecus [8,9,10,11], Nitela [12], Stigmus [13,14], Carinostigmus [15,16], Spilomena [17], Trypoxylon [18,19], Lyroda [20], Psen [21], Pemphredon [22], and Psenulus [23]. However, records remain dispersed among species descriptions, revisions, museum-based sources, and regional surveys. This makes it difficult to obtain a clear regional picture from the literature alone. More broadly, work on Apoidea shows that taxonomic knowledge is closely associated with the number and quality of available occurrence records, which makes careful compilation and curation an essential first step in biodiversity assessment [24].
Yunnan, Sichuan, Guizhou, and Xizang Autonomous Region encompass some of the most environmentally complex landscapes in China [25,26]. Southwestern China is widely recognized for high biodiversity and endemism, while also experiencing rapid environmental change [27]. The Hengduan Mountains across parts of Yunnan and Sichuan contain steep elevational gradients and strong climatic variation, yet many insect groups remain incompletely documented [28,29]. Yunnan has received particular attention because of its complex topography and high biological diversity, whereas the Qinghai Tibetan Plateau contributes another major center of ecological and biogeographic importance through Xizang Autonomous Region [30]. Across these landscapes, invertebrate knowledge remains less complete than that of many plant and vertebrate groups, and Asian insect datasets are still uneven compared with those from Europe and North America [4,31].
For Crabronidae, the available records from southwestern China are fragmented across time, geography, and source material. For many species, the number of unique reported localities has not previously been summarized in a single regional dataset. A cleaned and geographically explicit compilation is therefore needed before broader ecological interpretations can be made. Such an assessment can reveal the extent of existing records, where the evidence is concentrated, and which taxa or regions remain poorly represented, while avoiding the assumption that locations without records are true absences.
We therefore addressed four descriptive objectives. First, we compiled, cleaned, and taxonomically reviewed occurrence records to produce an annotated working checklist of Crabronidae from Yunnan, Sichuan, Guizhou, and Xizang Autonomous Region. Second, we summarized taxonomic composition across subfamilies, tribes, genera, and species. Third, we described provincial records, spatial coverage, and sharing among the four regional lists. Finally, we examined temporal accumulation and species-level documentation depth to identify where the available evidence is old, sparse, or geographically limited.
2. Materials and Methods
2.1. Study Region, Collection, and Analytical Units
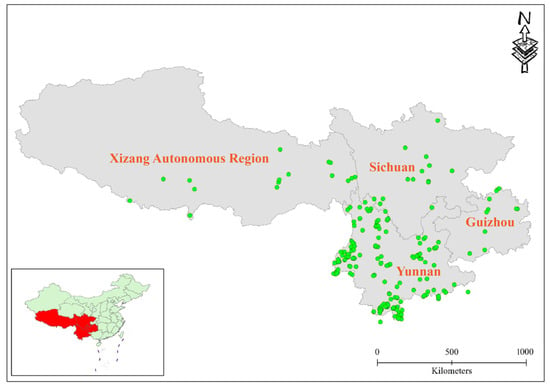
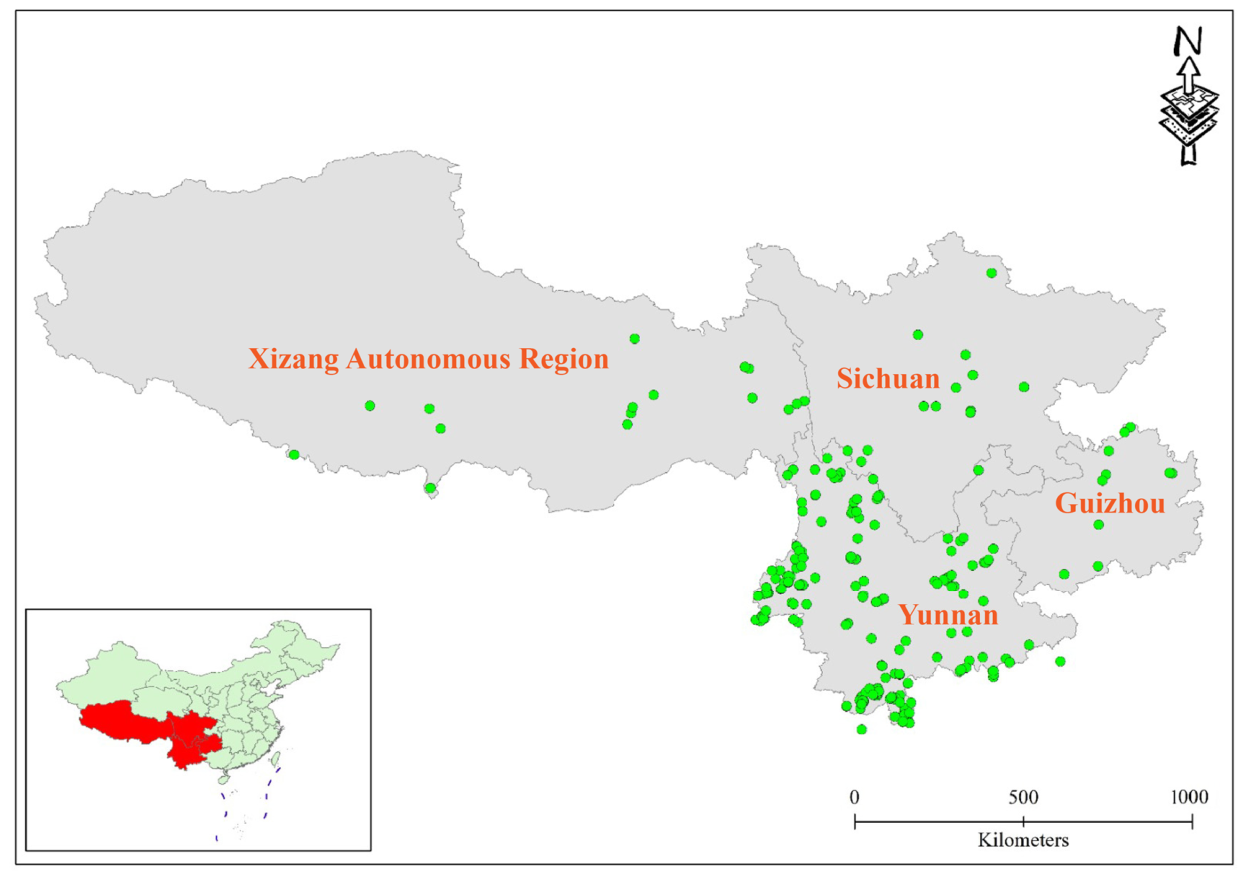
The study covered Yunnan, Sichuan, Guizhou, and Xizang Autonomous Region in southwestern China (Figure 1). The coordinates represented in the compiled dataset extended from 85.329° E to 108.708° E and from 21.068° N to 33.227° N. Crabronidae were collected from several sites in Qujing (25°31′22″ N, 103°44′41″ E; 25°31′34″ N, 103°45′06″ E, and 25°31′38″ N, 103°44′51″ E) and surrounding areas during 2024–2025. Additional distributional data from Yunnan, Sichuan, Guizhou, and Xizang Autonomous Region were obtained from the Catalog of Sphecidae [32] and recent literature [14,20]. The earliest represented record was from 1909 and the dataset cutoff was 2025. These limits describe the spatial and temporal extent of the present compilation and should not be interpreted as the complete historical or biological range of Crabronidae in the region.
Figure 1.
Map showing the study area and occurrence localities of Crabronidae in China (southwest). Green dots indicate the compiled occurrence localities.
The dataset contained taxonomic, geographic, and temporal information assembled from heterogeneous sources. For this study, an occurrence record was one row in the cleaned source table with its own record identifier. A row could represent a single specimen, several specimens from one collecting event, or a published locality report; the source table did not consistently separate those documentary units. Records from different species or different years at the same coordinate were retained. Record-based summaries therefore used rows as the analytical unit, spatial summaries used unique coordinate localities, and species-level spatial summaries used unique species–locality combinations.
The final dataset contained 373 records. All retained rows contained a year, valid decimal coordinates, and a reported positive specimen count; the specimen field summed to 1024 individuals. Specimen totals were retained as descriptive metadata only because sampling effort, collection method, trapping duration, and search area were not standardized. Missing specimen counts were not coded as zero in the working dataset.
2.2. Data Cleaning, Coordinate Validation, and Identifiers
A systematic data-cleaning and quality-control procedure was carried out to identify and quantify common sources of error in occurrence records prior to spatial sampling bias assessment. Data processing began by importing the initial spreadsheet, utilizing the initial row for field headers while preserving original row indices for auditing purposes. A single non-biological entry featuring degree, minute, and second coordinate labels was detected and excluded, keeping all 373 data rows intact. Numeric conversions were applied to year, specimen count, longitude, and latitude fields, with years formatted as integers. Decimal values for longitude and latitude served as the primary coordinates for analysis.
Decimal longitude and latitude were used as the analytical coordinates. Values were checked against valid global ranges and the broad southwestern China extent. Degree–minute–second fields were independently converted and compared with the supplied decimal coordinates as a quality check; nonstandard minute values and small rounding differences were documented rather than silently used to replace the supplied analytical values. Potentially erroneous coordinates were excluded after range and source checks. Coordinates were not removed merely because they were repeated: different species and different years at the same coordinate were retained. The six-decimal coordinate key defines a computational locality and should not be interpreted as evidence that all records at nearby points came from independent sampling sites [33].
A sequential Record ID was assigned to every retained record. Longitude and latitude were rounded to six decimal places when coordinate keys were created. Each distinct coordinate key received a Locality ID, and each distinct species and coordinate combination received a species–locality identifier. This rounding step was used only to prevent harmless binary floating-point differences from splitting the same supplied coordinate into separate analytical localities.
2.3. Taxonomic Review, Working Classification, and Duplicate Audit
Potential duplicates were checked using subfamily, tribe, species, province, coordinates, year, and specimen count, and a second check examined repeated records of the same species, locality, and year. The sequential audit began with 374 worksheet rows, removed one non-biological DMS header-like row, and retained 373 biological records. No retained row failed the required-field, global-coordinate-range, broad-study-extent, exact-duplicate, or same-species/locality/year checks. An exact biological duplicate required agreement on the relevant taxonomic, geographic, temporal, and specimen fields. A same-species, same-locality, same-year record was treated as a duplicate only when the source audit indicated that it represented the same documentary event; distinct sources or collection events were retained. The final working table contains no records meeting either duplicate definition. The audit also records 25 rows requiring DMS review, 264 unique six-decimal coordinate localities, and 346 unique species-coordinate combinations; these are descriptive summaries rather than additional removals.
The four-subfamily framework for Crabronidae used in the source dataset was retained for internal consistency. Eight similar-looking names reviewed during the audit were retained as distinct working species. The resulting working taxonomy therefore comprised 160 species, 30 genera, 11 tribes, and four subfamilies.
2.4. Taxonomic and Provincial Composition
Species percentages used the full working pool of 160 species, and record percentages used the 373 retained records. Because Yunnan contributed 310 records (83.1%) and 125 of the 160 species were documented only there, these percentages were treated as descriptive coverage measures rather than estimates of standardized provincial richness. Provincial comparisons were therefore accompanied by record-level bootstrap and equal-record rarefaction analyses, and no province-only category was interpreted as endemism or confirmed absence.
Provincial summaries were calculated separately for Yunnan, Sichuan, Guizhou, and Xizang Autonomous Region. For each region, we summarized records, documented species, genera, tribes, subfamilies, coordinate localities, earliest and latest documentation years, and specimen totals. Percentages of records and localities used 373 records and 264 localities as denominators. The percentage of the regional species pool documented in each province used the 160 working species as the denominator. Because species could occur in more than one regional list, these provincial percentages were not expected to sum to 100%.
2.5. Provincial Occurrence, Exact Combinations, and List Similarity
A binary species by province matrix recorded whether each working species was represented in Yunnan, Sichuan, Guizhou, and Xizang Autonomous Region. This matrix was used to assign every species to one exact regional combination and to count the number of species represented in one, two, three, or four regions. Species documented in only one regional list were treated as province-only records within this compilation and were not interpreted as endemic, geographically restricted, or absent elsewhere.
For each pair of regions, we calculated the shared documented species, the union of the two species lists, and the complete list of shared taxa. Jaccard similarity was calculated as J = a/(a + b + c), where a represented species documented in both regions and b and c represented species unique to each compiled list [34]. To assess sensitivity to unequal record effort, we added 5000 record-level bootstrap replicates using a fixed random seed of 20260924 (24 September 2026), resampling records within each province with replacement before recalculating the species lists and Jaccard values. We also performed 1000 record-order rarefaction replicates without replacement. Provincial rarefaction was standardized to 16 records, the smallest provincial record sample, and pairwise rarefaction used the smaller record sample of the two provinces. The resulting a, b, and c values; confidence intervals; and equal-effort estimates are reported in the new diagnostic tables.
2.6. Temporal Documentation and Species-Level Documentation Depth
Temporal documentation was summarized by calendar year and decade from 1909 to 2025. The 1909 starting period and the 2020 to 2025 ending period were identified as partial intervals. For each decade, we calculated the number of records, documented species, unique coordinate localities, represented years, specimen totals, species first represented in the compilation, and cumulative documented species. For each species, we also recorded the first and latest represented year and the number of unique documentation years. The age of the latest record was measured relative to the 2025 cutoff and grouped into 0–5, 6–10, 11–20, 21–30, and more than 30 years.
Species-level documentation depth was defined as the number of distinct six decimal coordinate localities associated with each species. Species were grouped into classes of 1, 2–4, 5–9, 10–19, and at least 20 localities. We calculated the mean, median, first and third quartiles, maximum, and numbers of species represented by fewer than five localities or by at least five. The five-locality boundary was used only as a transparent descriptive category. Locality counts were not interpreted as abundance, occupancy probability, conservation status, or true range size.
2.7. Mapping, Reproducibility, and Final Quality Assurance
The occurrence map displayed one point for each of the 264 unique coordinate localities rather than one point for each of the 373 records. Localities were represented in WGS 84 (EPSG:4326) and overlaid on a locally stored administrative boundary file. Boundary geometries for Yunnan, Sichuan, Guizhou, and Xizang Autonomous Region were identified and transformed to the same coordinate reference system. No online basemap was used. A locality consistency check tested whether any Locality ID was assigned to more than one province or retained different coordinates after rounding to six decimals. LOC_025 contained only harmless floating-point variants and was retained as a single locality.
No specific hardware or high-performance computing infrastructure was used, and the complete analytical workflow can be reproduced in commonly available research computing environments. All data processing and spatial analyses were performed using open-source software. Data cleaning, data quality assessment, provincial-list diagnostics, and rarefaction analyses were performed using Python (v. 3.13) within the Spyder environment on a 64-bit Windows operating system.
3. Results
3.1. Dataset Coverage and Taxonomic Composition
The Crabronidae dataset contained 373 occurrence records representing 160 species, 30 genera, 11 tribes, and four subfamilies. These records corresponded to 264 coordinate localities and 346 distinct species–locality combinations. The dataset contained 1024 specimens in total, and represented years ranging from 1909 to 2025 (Table 1). These values describe the size and structure of the compiled evidence rather than standardized abundance or sampling completeness.
Table 1.
Provincial occurrence reported for Crabronidae in southwestern China.
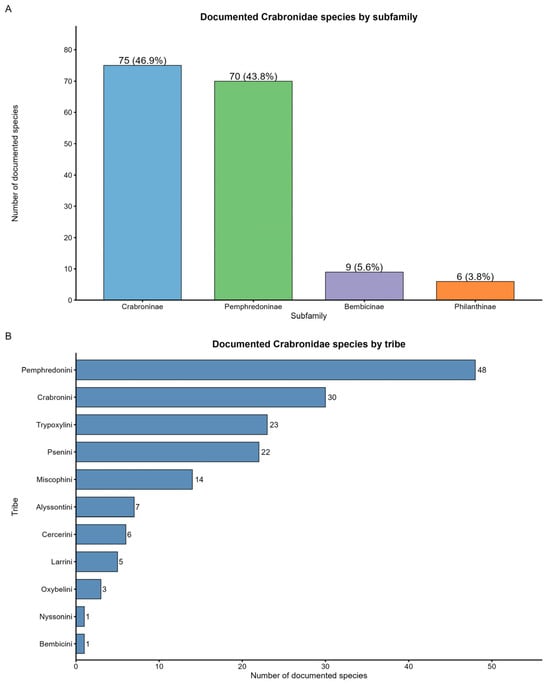
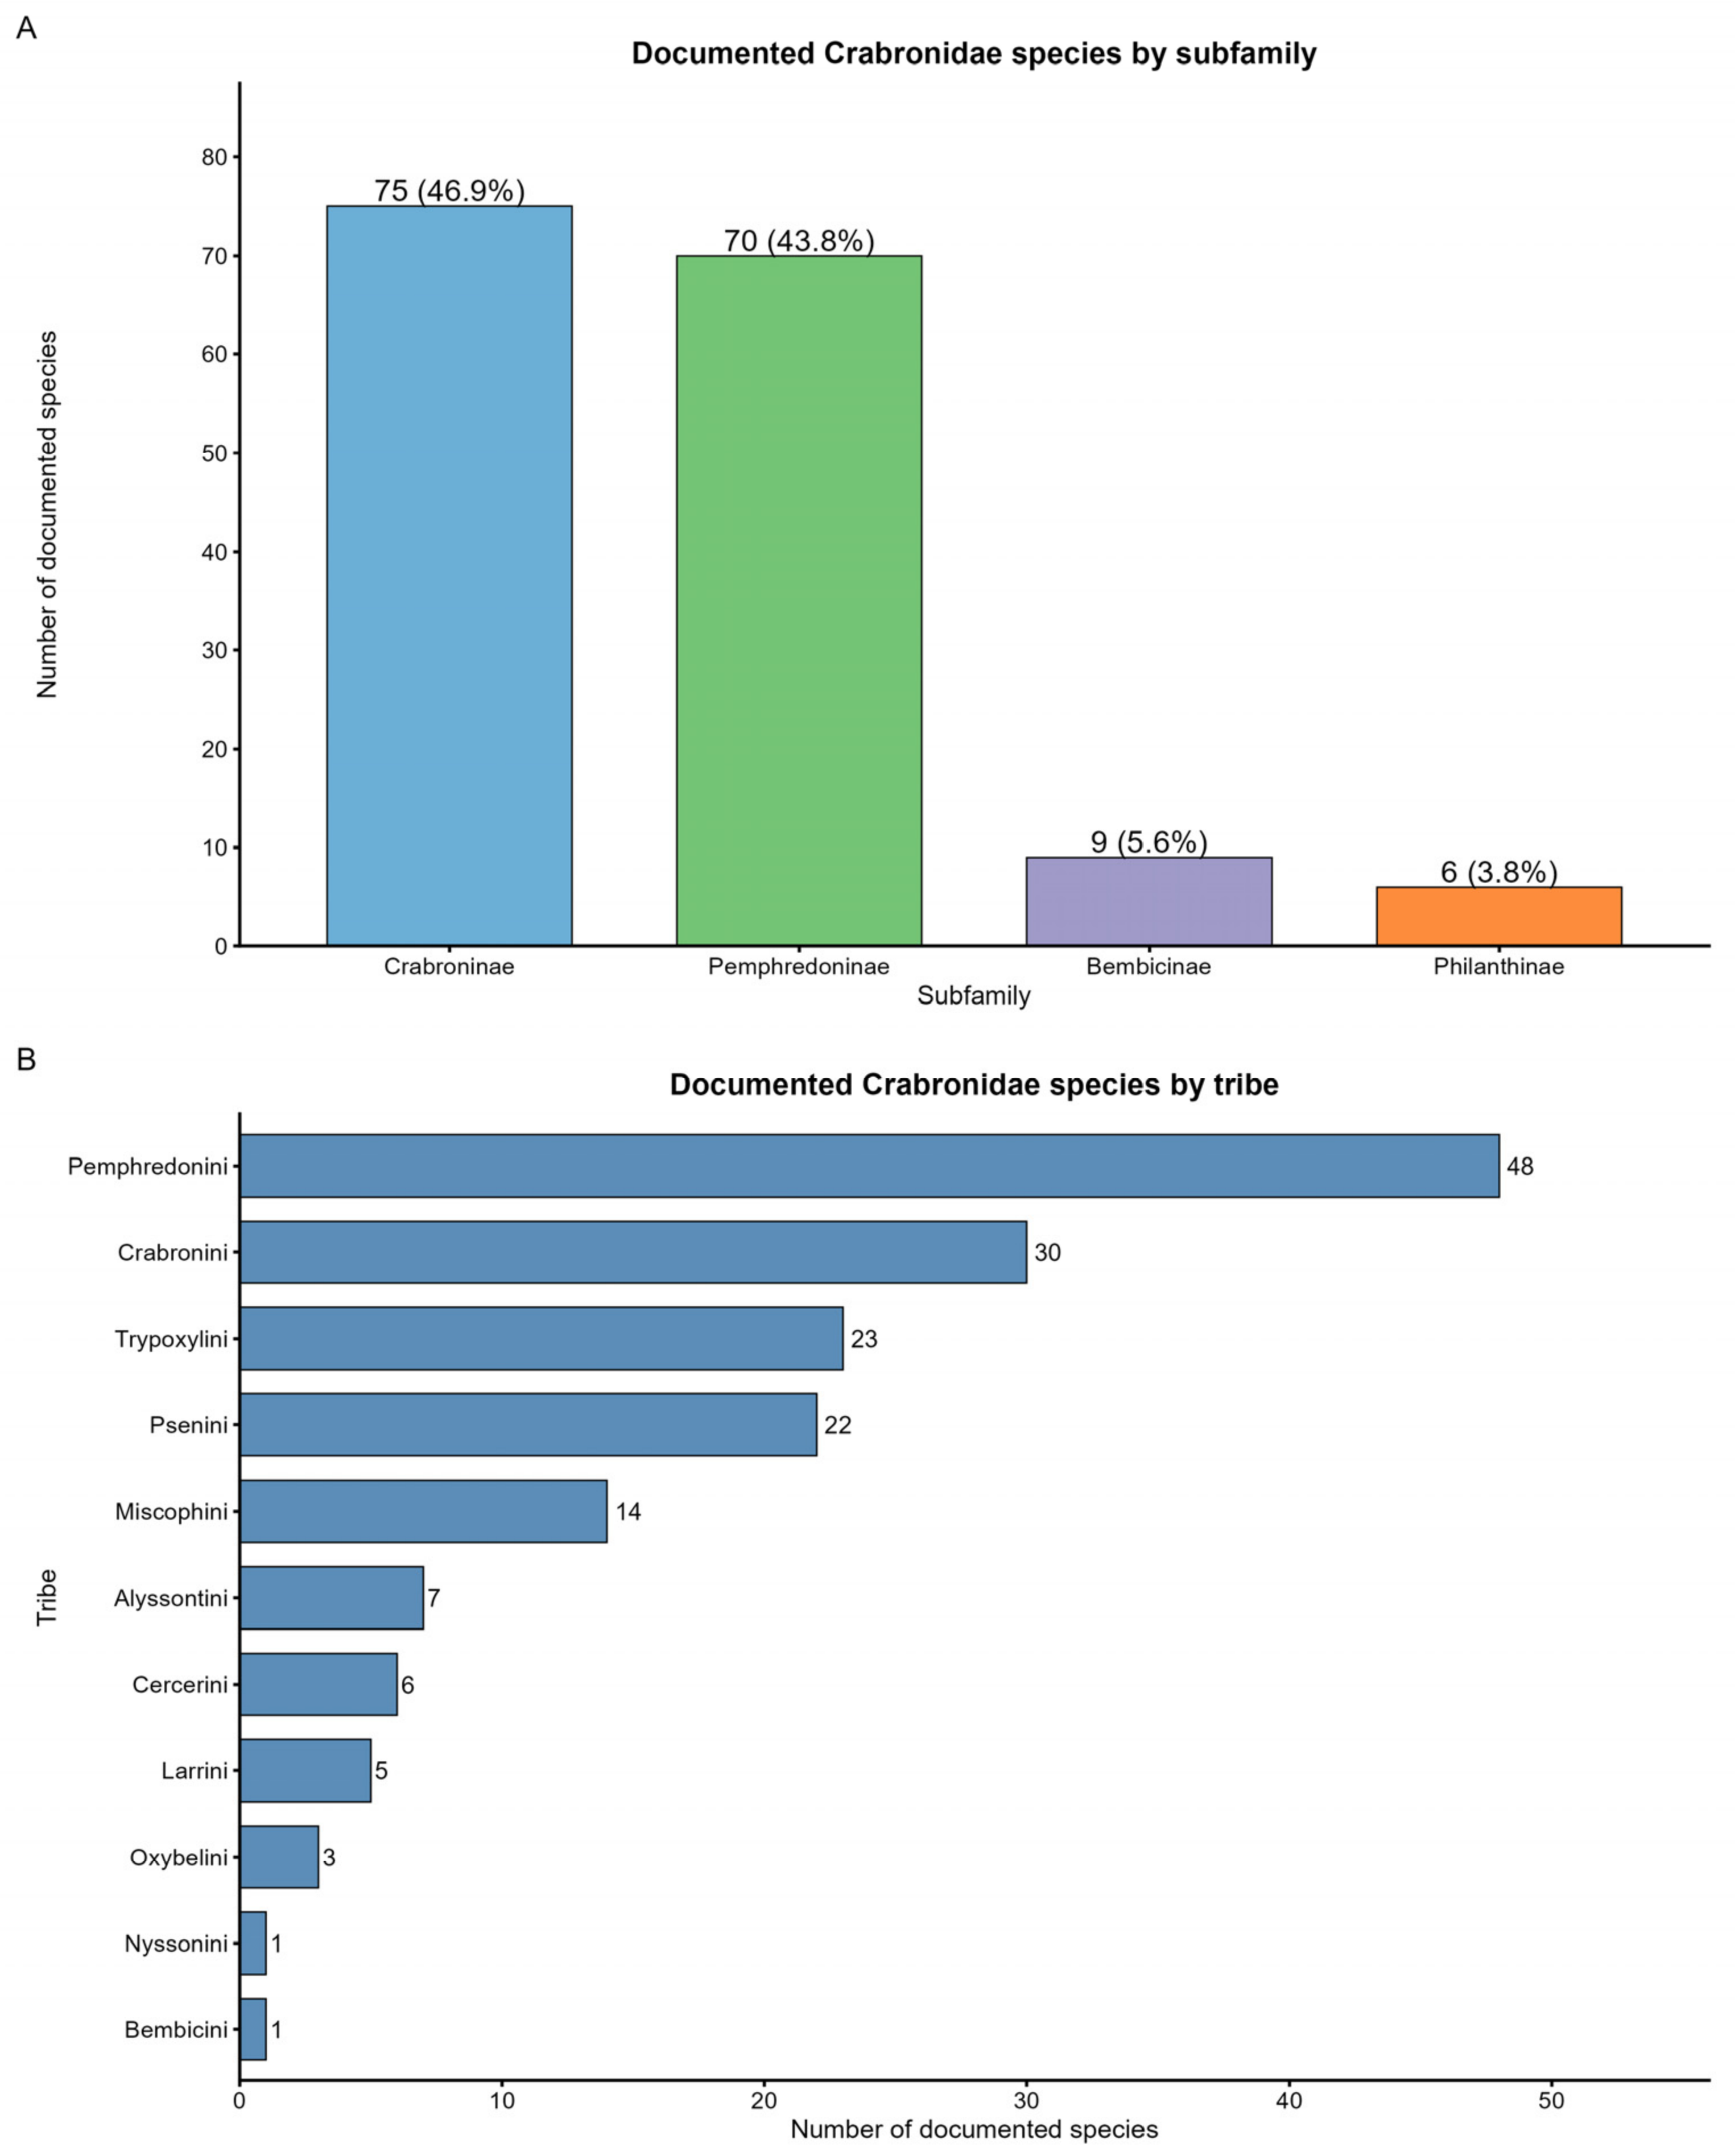
Subfamily Crabroninae contained 75 species (46.9% of the total), 174 records (46.6%), 14 genera, five tribes, and 115 localities. Subfamily Pemphredoninae contained 70 species (43.8%) and contributed the largest record total (176; 47.2%), specimen total (517), and locality total (145). Together, Crabroninae and Pemphredoninae accounted for 145 species (90.6%) and 350 records (93.8%). Subfamily Bembicinae contributed nine species and 13 records, whereas subfamily Philanthinae contributed six species and 10 records (Table 2; Figure 2A).
Table 2.
Taxonomic composition and description of Crabronidae by subfamily.
Figure 2.
Number of documented Crabronidae species: (A) species in each subfamily. (B) species in each tribe. Bar labels show the number of species represented in the checklist.
At tribe level, Pemphredonini was the most species-rich tribe, with 48 species, 125 records, seven genera, and 102 localities (Table S1). Crabronini followed with 30 species and 81 records, Trypoxylini with 23 species and 50 records, and Psenini with 22 species and 51 records. Together, these four tribes represented 123 species (76.9% of the total). The remaining tribes contributed between one and 14 species each (Figure 2B).
Trypoxylon was the most species-rich documented genus, with 22 species and 47 records. Crossocerus contained 13 species, Carinostigmus and Stigmus each contained 11, Passaloecus and Psen each contained 10, and Nitela contained nine. Among these leading genera, the represented distribution periods extended from 1955 to 2025, depending on genus, while the remaining 23 genera each contributed seven or fewer species (Table S2).
3.2. Provincial Distribution, Spatial Coverage, and Record Overlap
Species records were strongly concentrated in Yunnan. The province contributed 310 records (83.1%), 221 localities (83.7%), 135 species, 28 genera, 10 tribes, and all four subfamilies. Its records extended from 1909 to 2025. Sichuan contributed 30 records, 14 localities, and 15 species from 1955 to 1989; Guizhou contributed 17 records, 13 localities, and 13 species from 1980 to 2019; and Xizang Autonomous Region contributed 16 records, 16 localities, and 11 species from 1961 to 2018 (Table 1).
The mapped localities also showed a broad but uneven geographic footprint. Yunnan records extended from 97.617° E to 105.729° E and 21.068° N to 28.517° N, while Sichuan, Guizhou, and Xizang Autonomous Region occupied smaller reported subsets within the full mapped extent of 85.329° E to 108.708° E and 21.068° N to 33.227° N. The concentration of points, especially in Yunnan, represents the distribution of available records and should not be interpreted as population density or standardized richness.
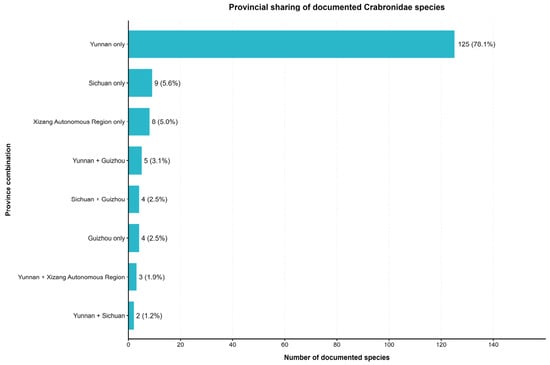
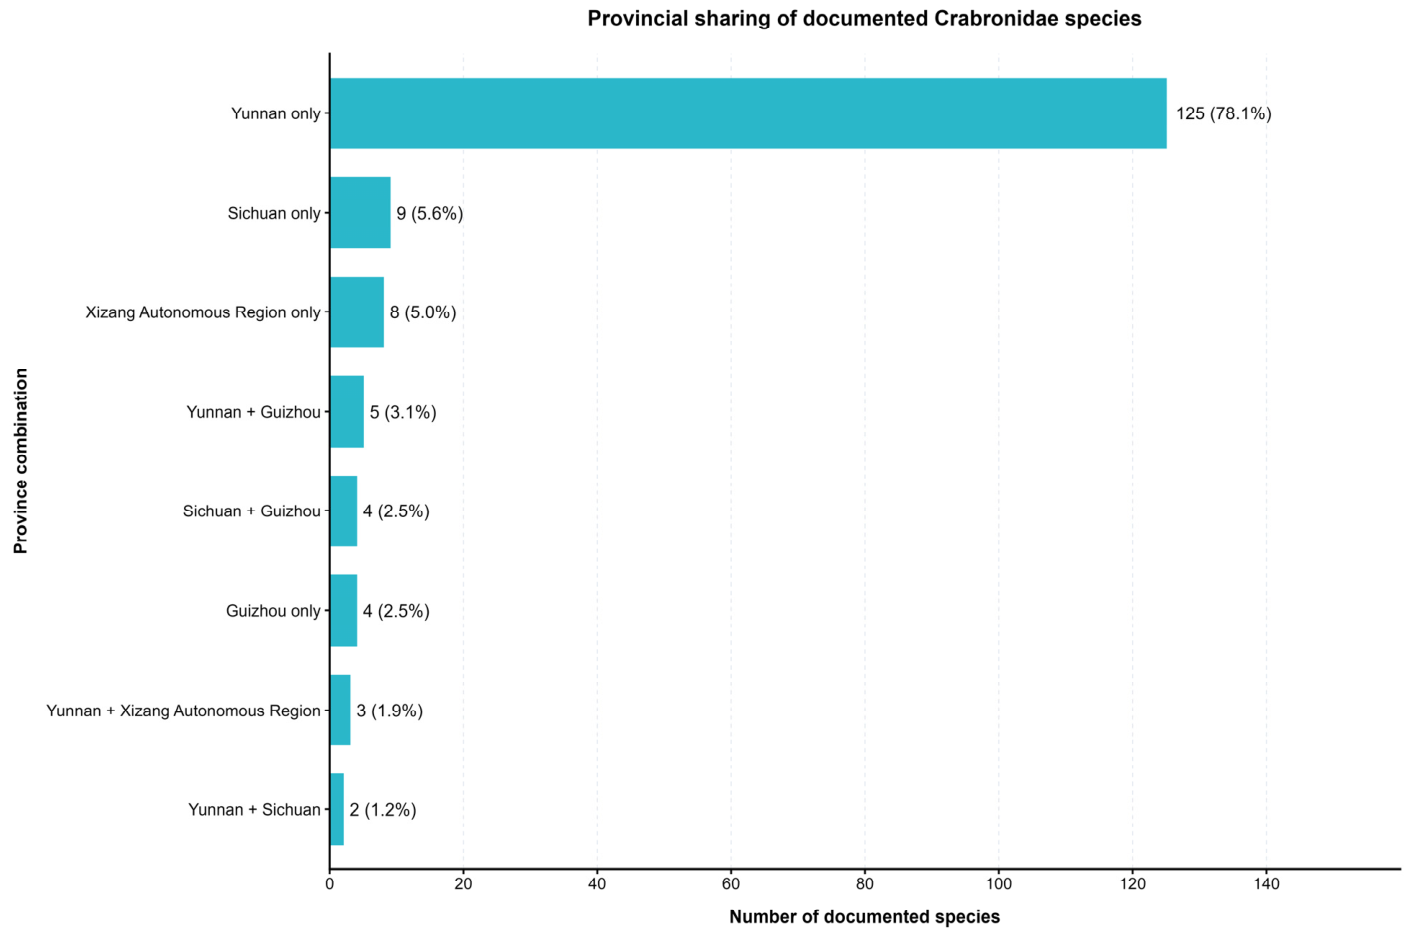
Of the 160 species, 146 (91.3%) were represented in exactly one region and 14 (8.8%) in exactly two; none were represented in three or all four regional lists. Province-only categories comprised 125 species in Yunnan, nine in Sichuan, eight in Xizang Autonomous Region, and four in Guizhou. The two region categories comprised five species in Yunnan plus Guizhou, four in Sichuan plus Guizhou, three in Yunnan plus Xizang Autonomous Region, and two in Yunnan plus Sichuan (Figure 3). Thus, 78.1% of the working list was represented only in Yunnan (Table S3), but this pattern cannot be separated from the much greater assessment effort in that province.
Figure 3.
Regional combinations of the 160 documented species. Bars show the number and percentage of working species represented in each single region or two-region combination. Province-only categories describe the scope of the present compilation and should not be interpreted as endemism or confirmed geographic restriction.
Pairwise list overlap was greatest between Sichuan and Guizhou, which shared four species and had a raw Jaccard similarity of 0.167. Its record-level bootstrap mean was 0.148 (95% CI 0.050–0.235), and its equal-record rarefied mean was 0.161 (95% CI 0.091–0.211). Yunnan and Guizhou shared five species (raw J = 0.035; equal-record rarefied mean = 0.045), Yunnan and Xizang Autonomous Region shared three (raw J = 0.021; equal-record rarefied mean = 0.011), and Yunnan and Sichuan shared two (raw J = 0.014; equal-record rarefied mean = 0.007). No species was shared between Sichuan and Xizang Autonomous Region or between Guizhou and Xizang Autonomous Region in the present compilation (Figure S1). These values describe overlap among the available regional lists and do not demonstrate confirmed biological turnover or absence.
3.3. Temporal Accumulation and Recency of Records
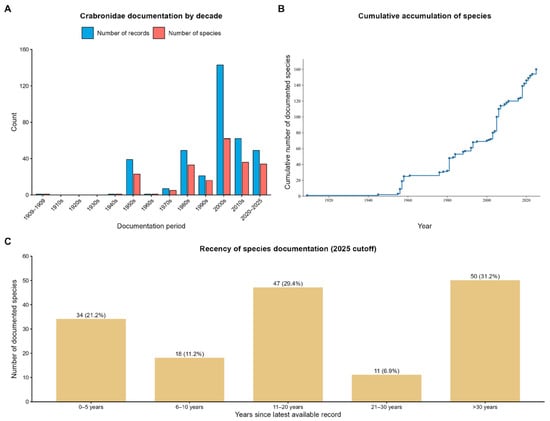
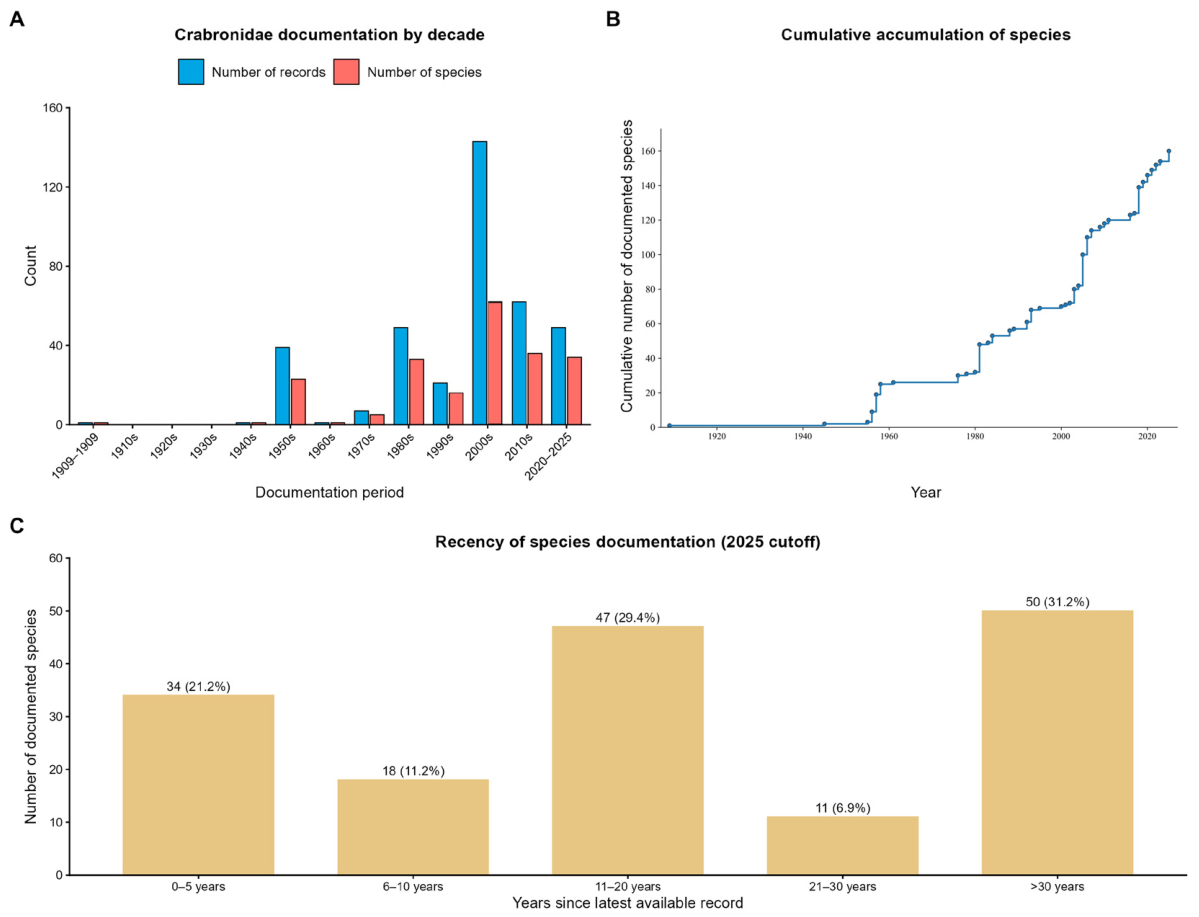
Occurrences were discontinuous across the study period. One record was represented in 1909, no records occurred in the compilation during the 1910s, 1920s, or 1930s, and one record occurred in the 1940s. The first substantial concentration appeared in the 1950s, with 39 records, 23 species, 24 localities, and 89 specimens across four represented years (Figure 4A). The 1960s contained one record, and the 1970s contained seven records representing five species and seven localities (Table S4).
Figure 4.
Crabronidae occurrence history in southwest China: (A) Numbers of occurrence records and documented species represented in each temporal period. (B) Cumulative number of species first represented in the compiled dataset through 2025. (C) Recency of the latest available record for each working species at the 2025 dataset cutoff.
Occurrence increased in the 1980s to 49 records, 33 species, and 40 localities across nine represented years, then fell to 21 records and 16 species in the 1990s. The 2000s were the most strongly represented decade, contributing 143 records (38.3% of all records), 62 species, 121 localities, and 431 specimens (Figure 4B). Forty-seven species were first represented in the compilation during that decade, raising the cumulative total from 69 to 116. Thus, the 2000s peak reflects both collection or data-mobilization effort and taxonomic representation; the available metadata do not allow those components to be separated further.
The 2010s contributed 62 records, 36 species, and 38 localities across six represented years. The partial period from 2020 to 2025 contributed 49 records, 34 species, and 36 localities across five represented years, and added the final 18 species needed to reach the working cumulative total of 160 (Table S4). The record-order accumulation curve continued to rise at the end of the compilation and did not show a clear asymptote. These patterns describe the timing and intensity of available documentation rather than a biological increase in regional richness.
At the 2025 cutoff, 34 species (21.2%) had a latest record from the previous 0 to 5 years and 18 (11.2%) from the previous 6 to 10 years. Forty-seven species (29.4%) had a latest record 11 to 20 years old, 11 (6.9%) were in the 21-to-30-year class, and 50 (31.2%) had not been represented for more than 30 years (Figure 4C). Overall, 61 species (38.1%) had no record in the previous 20 years, while 52 (32.5%) had a record within the previous 10 years. These categories indicate gaps in recent collection and do not demonstrate decline, extirpation, or persistence.
3.4. Species-Level Occurrence Depth
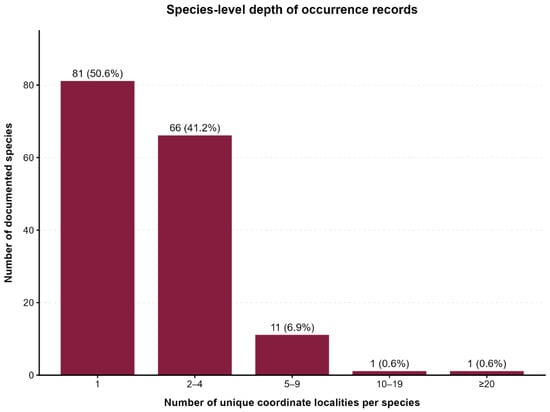
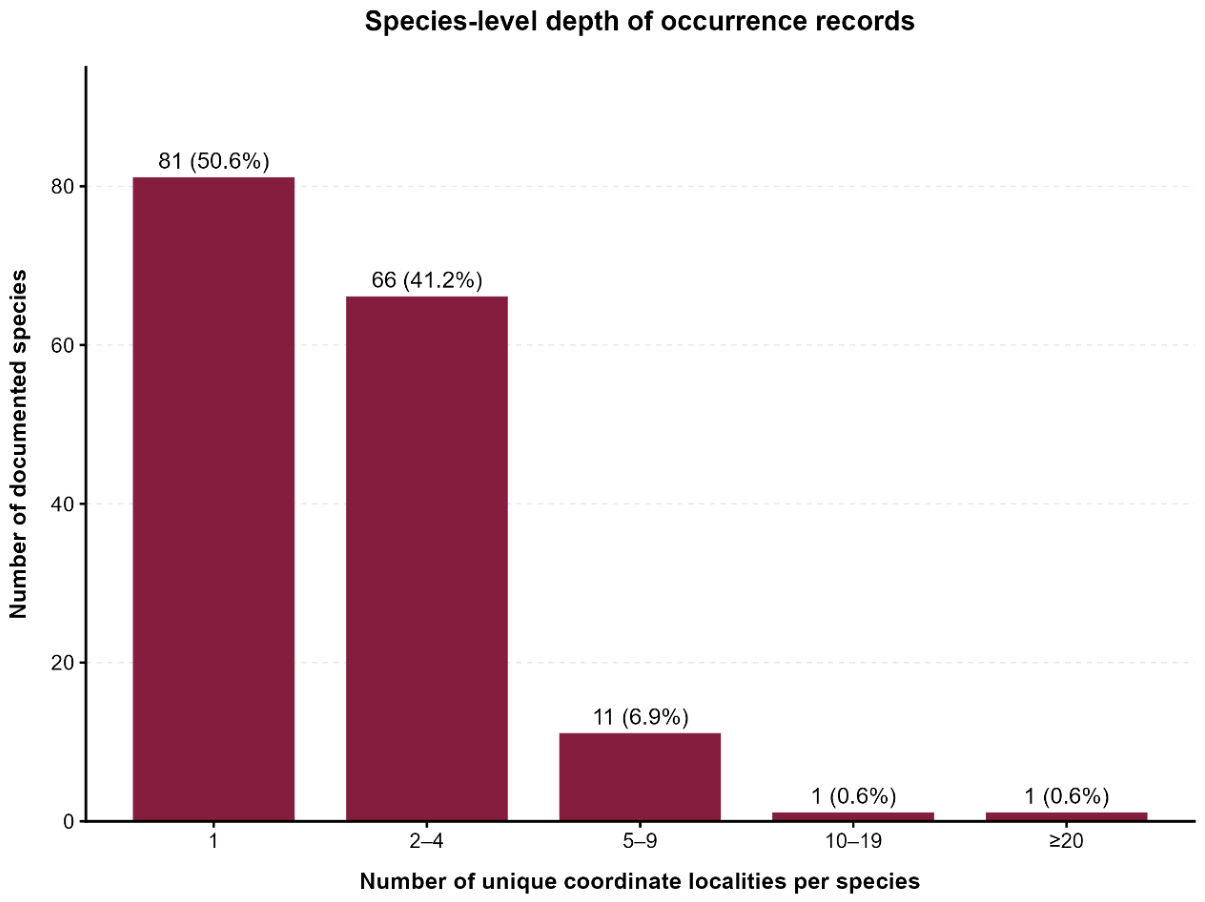
Species-level occurrence was strongly concentrated at the lowest locality classes. Eighty-one species (50.6%) were represented by one unique coordinate locality and another 66 (41.2%) by two to four localities (Figure 5). Eleven species (6.9%) were represented by five to nine localities, one (0.6%) by 10 to 19, and one (0.6%) by at least 20 (Table S5). Consequently, 147 species (91.9%) had fewer than five detected localities, only 13 had at least five, and only two had at least 10.
Figure 5.
Species-level depth of occurrence documentation based on unique coordinate localities. Bars show the number and percentage of working species represented by 1, 2 to 4, 5 to 9, 10 to 19, or at least 20 localities. These classes describe documentation depth and should not be interpreted as abundance, rarity, occupancy, or true range size.
Across all species, the mean occurrence depth was 2.16 localities, the median was one, the interquartile range was one to two, and the maximum was 20. Shallow occurrence was evident in every subfamily. Crabroninae averaged 2.07 localities per species and included 39 species documented from one locality, while Pemphredoninae averaged 2.41 and included 32 such species. Bembicinae averaged 1.33 localities per species and Philanthinae 1.67, with every species in both groups represented by fewer than five localities (Table S6).
The two most deeply recorded species were Dasyproctus cevirus Leclercq, 1963, with 20 localities and Carinostigmus costatus Krombein, 1984, with 19. Polemistus fukuitor Tsuneki, 1992, was represented at nine localities; Mimumesa melanosomatica Ma & Li, 2009, at seven; and Crossocerus rugosilateralis Li & Yang, 2003, and Psenulus bicinctus Turner, 1912, at six each. Seven additional species were represented at five localities (Figure S2). Even these species should not be assumed to be common or widely distributed because locality totals were not standardized for spatial or temporal sampling effort.
4. Discussion
This study brings together the first integrated occurrence compilation of family Crabronidae for Yunnan, Sichuan, Guizhou, and Xizang Autonomous Region. The 373 records represent 160 species in 30 genera, 11 tribes, and four subfamilies from 1909 to 2025. That total is modest when compared with much larger national and regional catalogues from Mexico, the Arabian Peninsula, Russia, and the Altai [2,6,7,35]. However, the contrast should not be read as evidence that southwestern China has low true richness. Instead, it highlights how strongly regional inventories depend on the availability and completeness of occurrence information, a limitation that remains marked across much of Asia [36].
The dataset was dominated by Crabroninae and Pemphredoninae, which together contributed 145 species (90.6%) and 350 records (93.8%). Bembicinae and Philanthinae were much less represented. At tribe level, Pemphredonini, Crabronini, Trypoxylini, and Psenini together contained 123 species (76.9%). These proportions describe the composition of the available compilation rather than the outcome of standardized sampling. Regional comparisons therefore require attention. For example, the Arabian Peninsula contains a much larger Crabroninae component and a much smaller Pemphredoninae component [6], but differences in environment, biogeography, taxonomic treatment, and sampling history can all contribute to such contrasts.
At the genus level, Trypoxylon was the most species-rich taxon in the working list, followed by Crossocerus, Carinostigmus, Stigmus, Passaloecus, Psen, and Nitela. The prominence of these genera is consistent with their importance in other regional faunas, but it may also reflect the intensity of taxonomic work on these groups in China [9,17,18,37]. The comparatively small number of Cercerini (Philanthinae) in the present compilation provides a useful reminder that a regional dataset reflects the history of collecting, identification, publication, and data mobilization.
The strongest geographic pattern was the concentration of species records in Yunnan: 310 of 373 records (83.1%) and 125 of the 160 species were recorded only there. This imbalance is itself a central limitation of the compilation. Global insect datasets often show similarly uneven geographic coverage, with well-studied areas receiving a disproportionate share of records [24,38]. Yunnan is also an important biodiversity region [39] and has received substantial recent taxonomic attention, but the present data cannot separate those influences. Accordingly, the province-level percentages and Jaccard values are interpreted as patterns of documentation coverage, not standardized richness, endemicity, biological turnover, or confirmed absence. Record-level bootstrap and equal-record rarefaction reduced but did not eliminate the sensitivity of comparisons to unequal effort. Sichuan, Guizhou, and Xizang Autonomous Region together contributed only 63 records, identifying clear priorities for equal-effort surveys [29,30].
Provincial species lists overlapped only weakly. The highest raw Jaccard similarity was 0.167 between Sichuan and Guizhou, and the equal-record rarefied estimate remained similar (mean 0.161, 95% CI 0.091–0.211). These low values should not be interpreted as direct measures of species turnover because the regional lists differ greatly in size. Apparent regional restriction can emerge quickly when sampling is spatially concentrated, as shown in other insect checklists from the Hengduan Mountains and in broader studies of biodiversity knowledge gaps [31,40]. For this reason, we treat province-only records as observation categories rather than evidence of endemicity.
The temporal history was equally uneven. After isolated early records, documentation increased in the 1950s and 1980s and reached its largest concentration in the 2000s. Record counts describe collection and data-mobilization effort, whereas the number of species first represented describes taxonomic representation in the compilation. The dataset does not contain enough standardized collector-year effort information to attribute the 2000s peak to a single project, revision, or digitization initiative. Changes in collection activity, taxonomic revision, digitization, publication, and data availability may all contribute [24,38]. The temporal curve should therefore be read as a history of documentation rather than a trend in Crabronidae populations or regional richness.
The shallow species-level evidence is one of the clearest findings of the study. More than half of the crabronid species were represented by one coordinate locality and 91.9% by fewer than five. Only Dasyproctus cevirus Leclercq, 1963, and Carinostigmus costatus Krombein, 1984, were represented by at least 10 localities. Comparable gaps are common in insect occurrence databases, where spatial coverage and inventory completeness remain highly uneven [41,42]. For southwestern China, these locality counts should be treated as minimum observation rather than estimates of true distribution. The available records are too sparse for confident species-level inference about occupancy, range size, rarity, or conservation status.
Recency adds a second limitation. At the 2025 cutoff, 50 species (31.2%) had not been represented for more than 30 years and 61 (38.1%) had no record within the previous 20 years. These values do not show decline, but they reveal how limited recent evidence is available for a substantial part of the studied fauna. Future surveys would therefore be most informative if they expand geographic coverage in Sichuan, Guizhou, and Xizang Autonomous Region while also revisiting historically reported localities. Continued taxonomic work is equally important, particularly for small-bodied groups that can be overlooked. Combining careful morphology with molecular tools can strengthen future revisions and help distinguish genuine distribution patterns from gaps created by insufficient records [28,31].
5. Conclusions
This study provides a working checklist of 160 Crabronidae species from Yunnan, Sichuan, Guizhou, and Xizang Autonomous Region. Its principal contribution is a transparent baseline that identifies strong geographic, temporal, and taxonomic documentation gaps. The available records are too uneven to support claims about true richness, abundance, endemicity, population trends, or confirmed absence. Future work should prioritize equal-effort surveys and source-verified taxonomic sampling in Sichuan, Guizhou, and Xizang Autonomous Region, especially under sampled Hengduan Mountain sectors, eastern Xizang, and Guizhou karst landscapes.
Supplementary Materials
The following supporting information can be downloaded at: https://www.mdpi.com/article/10.3390/insects17111101/s1, Table S1: Tribe level observations of family Crabronidae based on records, species, and number of unique localities in southwestern China; Table S2: Occurrence records of family Crabronidae by genus in southwestern China; Table S3: Exact regional combinations represented by the 160 species. The table reports the number of regions represented, documented species totals, species lists, and the percentage of the working species pool in each combination; Table S4: Decadal history of Crabronidae occurrence from 1909 to 2025; Table S5: Species-level documentation depth based on the number of unique coordinate localities represented for each species; Table S6: Crabronidae species based on localities; Figure S1: Pairwise Jaccard similarity among provincial species of Crabronidae in southwestern China; Figure S2: Distribution of Crabronidae across unique localities in southwestern China. The horizontal axis represents the number of localities in which each species was recorded, and the vertical axis lists the corresponding species names.
Author Contributions
Conceptualization, N.H.B. and M.N.; methodology, N.H.B.; software, M.N.; validation, N.H.B., H.C. and M.G.; formal analysis, M.N.; investigation, M.G.; resources, H.C. and M.G.; data curation, N.H.B.; writing—original draft preparation, N.H.B. and M.N.; writing—review and editing, H.C. and M.G.; visualization, N.H.B. and H.C.; supervision, H.C. and M.G.; project administration, H.C. and M.G.; funding acquisition, N.H.B. and H.C. All authors have read and agreed to the published version of the manuscript.
Funding
This research was funded by the High-Level Talent Recruitment Plan of Yunnan Province “High-End Foreign Experts”, the National Foreign Experts Individual Category Program (No. Y20240138), and the Canping Pan Academician Workstation in Yunnan Province (No. 202505AF35008).
Data Availability Statement
The raw data supporting the conclusions of this article will be made available by the authors on request.
Acknowledgments
We are grateful for the support provided by the Program for Innovative Research Teams at Qujing Normal University. We also sincerely thank Wojciech J. Pulawski (California Academy of Sciences, California) for generously providing numerous valuable references that greatly assisted our study. During the preparation of this manuscript, the authors used Gemini version 3.1 for grammar, spelling, and punctuation. The authors have reviewed and edited the output and take full responsibility for the content of this publication.
Conflicts of Interest
The authors declare no conflicts of interest.
References
- İlyas, C. Wing venation abnormalities in the solitary wasp family Crabronidae (Insecta: Hymenoptera). J. Entomol. Res. Soc. 2022, 24, 219–232. [Google Scholar] [CrossRef] [Scilit]
- Vanoye-Eligio, M.; Horta-Vega, J.V.; Vanoye-Eligio, V.; Estrada-Ramírez, L.J.; Martín-Canché, B.D.R. Crabronidae (Hymenoptera: Apoidea) in Mexico: Occurrence and potential uses in biological control. Rev. Colomb. Entomol. 2022, 48, e11654–e11662. [Google Scholar] [CrossRef] [Scilit]
- Bashir, N.H.; Ma, L.; Naeem, M.; Yao, L.; Li, J.; Chen, H.; Li, Q. Indicator species of multifunctional predatory solitary wasps (Hymenoptera: Pemphredonini) and their biogeographic regionalization in China. Ecol. Inform. 2026, 98, 103999. [Google Scholar] [CrossRef] [Scilit]
- Bashir, N.H.; Naeem, M.; Li, Q.; Chen, H. Bioclimatic and Land Use/Land Cover Factors as Determinants of Crabronidae (Hymenoptera) Community Structure in Yunnan, China. Insects 2026, 17, 100. [Google Scholar] [CrossRef] [Scilit] [PubMed]
- Amarante, S.T.P. A synonymic catalog of the Neotropical Crabronidae and Sphecidae (Hymenoptera: Apoidea). Arq. Zool. 2002, 37, 1–139. [Google Scholar] [CrossRef] [Scilit][Green Version]
- Gadallah, N.S.; Brothers, D.J. Biodiversity of the aculeate wasps (Hymenoptera: Aculeata) of the Arabian Peninsula: Preface. Zootaxa 2020, 4754, 5–7. [Google Scholar] [CrossRef] [Scilit] [PubMed]
- Mokrousov, M.; Proshchalykin, M.Y. New records of digger wasps (Hymenoptera: Crabronidae) from Altai, with taxonomical notes on Crossocerus mongolensis Tsuneki, 1972, stat. n. Russ. Entomol. J. 2023, 32, 410–415. [Google Scholar] [CrossRef] [Scilit]
- Bashir, N.H.; Li, W.; Liu, Z.; Xia, T.; Chen, H. A new species of Passaloecus Shuckard (Hymenoptera, Crabronidae) from China, with a key to Oriental species. ZooKeys 2023, 1181, 299–309. [Google Scholar] [CrossRef] [Scilit] [PubMed]
- Bashir, N.H.; Du, S.-J.; Yue, D.; Li, Q.; Ma, L. The genus Passaloecus Shuckard (Hymenoptera: Crabronidae) from China with four new species and two new records. Zootaxa 2019, 4629, zootaxa.4629.3.10. [Google Scholar] [CrossRef] [Scilit] [PubMed]
- Ma, L.; Li, Q. Key to the Oriental species of Passaloecus Shuckard (Hymenoptera: Crabronidae), with descriptions of four new species from China. Zootaxa 2012, 3329, 41–50. [Google Scholar] [CrossRef] [Scilit]
- Li, J.; Ma, L.; Li, Q. Five new species of Passaloecus Shuckard (Hymenoptera, Crabronidae) from China, with a key to Chinese species. J. Hymenopt. Res. 2024, 97, 1141–1161. [Google Scholar] [CrossRef] [Scilit]
- Li, C.; Li, Q.; Ma, L. Six new species of the genus Nitela Latreille (Hymenoptera, Crabronidae) from China, with a key to the Oriental species. J. Hymenopt. Res. 2025, 98, 871–896. [Google Scholar] [CrossRef] [Scilit]
- Bashir, N.H.; Li, Q.; Ma, L. Review of the genus Stigmus Panzer (Hymenoptera, Crabronidae) in China, with description of five new species from the Oriental and Palearctic Regions. ZooKeys 2019, 843, 51–69. [Google Scholar] [CrossRef] [Scilit] [PubMed]
- Li, J.; Li, Q.; Ma, L. Six new species of Stigmus (Hymenoptera, Crabronidae) from China, with an updated key to all Chinese species. Dtsch. Entomol. Z. 2026, 73, 435–451. [Google Scholar] [CrossRef] [Scilit]
- Bashir, N.H.; Ma, L.; Li, Q. Chinese species of Carinostigmus Tsuneki (Hymenoptera, Crabronidae), including three new species and a new record to China. ZooKeys 2020, 987, 115–134. [Google Scholar] [CrossRef] [Scilit] [PubMed]
- Bashir, N.H.; Li, Q.; Ma, L. Four new species of the genus Carinostigmus Tsuneki (Hymenoptera, Apoidea, Crabronidae) from Oriental China, with an updated key to the Chinese species. J. Hymenopt. Res. 2021, 81, 87–107. [Google Scholar] [CrossRef] [Scilit]
- Bashir, N.H.; Ma, L.; Li, Q. Taxonomic study of Spilomena (Hymenoptera: Crabronidae) with a new species and five new records from China. Zoologia 2021, 38, e55803. [Google Scholar] [CrossRef] [Scilit]
- Fu, Y.; Bashir, N.H.; Li, Q.; Ma, L. A review of Trypoxylon Latreille, 1796 (Hymenoptera, Crabronidae) of Southwest China with descriptions of two new species. J. Hymenopt. Res. 2024, 97, 307–347. [Google Scholar] [CrossRef] [Scilit]
- Li, T.; Li, Q. Four new species and nine new species records of the subgenus Trypoxylon (Trypoxylon) Latreille (Hymenoptera: Crabronidae) from China. Pan-Pac. Entomol. 2007, 83, 1–12. [Google Scholar] [CrossRef] [Scilit]
- Li, C.; Li, Q.; Ma, L. Four new species of the genus Lyroda Say (Hymenoptera, Crabronidae) from China, with a key to Chinese species. ZooKeys 2026, 1279, 311–326. [Google Scholar] [CrossRef] [Scilit] [PubMed]
- Deng, Y.; Ma, L.; Li, Q. Taxonomic update of Psen Latreille, 1796 (Hymenoptera, Crabronidae), with descriptions of three new species from China. J. Hymenopt. Res. 2025, 98, 971–1003. [Google Scholar] [CrossRef] [Scilit]
- Bashir, N.H.; Ma, L.; Li, Q. The genus Pemphredon Latreille (Hymenoptera: Crabronidae) from China, with description of a new species. Orient. Insects 2021, 55, 267–279. [Google Scholar] [CrossRef] [Scilit]
- Jiang, H.; Li, Q.; Ma, L. The Genus Psenulus Kohl, 1897 (Hymenoptera: Crabronidae) in China, with Two New Species and Two New Country Records. Insects 2025, 16, 432. [Google Scholar] [CrossRef] [Scilit] [PubMed]
- Dorey, J.B.; Gilpin, A.-M.; Johnston, N.P.; Esquerré, D.; Hughes, A.C.; Ascher, J.S.; Orr, M.C. Estimating global bee species richness and taxonomic gaps. Nat. Commun. 2026, 17, 1762. [Google Scholar] [CrossRef] [Scilit] [PubMed]
- Gao, B.; Wu, Y.; Li, C.; Zheng, K.; Wu, Y.; Wang, M.; Fan, X.; Ou, S. Multi-scenario prediction of landscape ecological risk in the Sichuan-Yunnan ecological barrier based on terrain gradients. Land 2022, 11, 2079. [Google Scholar] [CrossRef] [Scilit]
- Miao, P.; Chai, Y.; Yang, S.; Chen, Y.; Zhou, J.; Pu, J.; Li, S.; Wang, X. Designing resilient ecological networks through topological redundancy in the Sichuan–Yunnan Ecological Barrier Zone. Ecol. Indic. 2026, 190, 115292. [Google Scholar] [CrossRef] [Scilit]
- Ashton, L.; Nakamura, A.; Burwell, C.; Tang, Y.; Cao, M.; Whitaker, T.; Sun, Z.; Huang, H.; Kitching, R. Elevational sensitivity in an Asian ‘hotspot’: Moth diversity across elevational gradients in tropical, sub-tropical and sub-alpine China. Sci. Rep. 2016, 6, 26513. [Google Scholar] [CrossRef] [Scilit] [PubMed]
- Lai, Y.; Liu, Y.; Liu, X. Elevational diversity patterns of green lacewings (Neuroptera: Chrysopidae) uncovered with DNA barcoding in a biodiversity hotspot of Southwest China. Front. Ecol. Evol. 2021, 9, 778686. [Google Scholar] [CrossRef] [Scilit]
- Liu, C.; Fischer, G.; Garcia, F.H.; Yamane, S.; Liu, Q.; Peng, Y.Q.; Economo, E.P.; Guénard, B.; Pierce, N.E. Ants of the Hengduan Mountains: A new altitudinal survey and updated checklist for Yunnan Province highlight an understudied insect biodiversity hotspot. ZooKeys 2020, 978, 1–171. [Google Scholar] [CrossRef] [Scilit] [PubMed]
- Zhao, Z.; Feng, X.; Zhou, J.; Huang, X. Endemism and Conservation of Hemiptera on the Qinghai-Tibetan Plateau. Ecol. Evol. 2026, 16, e73244. [Google Scholar] [CrossRef] [Scilit] [PubMed]
- Wu, Y.; Chen, Z.; Li, Y.; Wang, Y.; Du, C. Exploring ant (Hymenoptera, Formicidae) species diversity in the Gongga Mountain, China. Trans. Am. Entomol. Soc. 2025, 151, 61–152. [Google Scholar] [CrossRef] [Scilit]
- Pulawski, W.J. Catalog of Sphecidae: Number of Extant Species of Sphecidae. 2026. Available online: https://www.calacademy.org/catalog-of-sphecidae-genera-and-species (accessed on 14 August 2026).
- Lipiński, S. Spatial bias in open biodiversity data: How GBIF record quality shapes conservation analyses. Conservation 2026, 6, 40. [Google Scholar] [CrossRef] [Scilit]
- Jaccard, P. Étude comparative de la distribution florale dans une portion des Alpes et des Jura. Bull. Société Vaudoise Sci. Nat. 1901, 37, 547–579. [Google Scholar]
- Mokrousov, M.V.; Proshchalykin, M.Y. Corrections and additions to the catalogue of the digger wasps (Hymenoptera: Ampulicidae, Sphecidae, Crabronidae) of Russia. Zootaxa 2025, 5728, 401–450. [Google Scholar] [CrossRef] [Scilit] [PubMed]
- Meyer, C.; Kreft, H.; Guralnick, R.; Jetz, W. Global priorities for an effective information basis of biodiversity distributions. Nat. Commun. 2015, 6, 8221. [Google Scholar] [CrossRef] [Scilit] [PubMed]
- Bashir, N.H.; Yue, D.; Jiang, H.; Ma, L.; Li, Q. Taxonomic study of the subtribe Pemphredonina Dahlbom, 1835 (Hymenoptera: Crabronidae) with a new species and six new records from China. J. Asia-Pac. Entomol. 2021, 24, 1055–1065. [Google Scholar] [CrossRef] [Scilit]
- Rocha-Ortega, M.; Rodriguez, P.; Córdoba-Aguilar, A. Geographical, temporal and taxonomic biases in insect GBIF data on biodiversity and extinction. Ecol. Entomol. 2021, 46, 718–728. [Google Scholar] [CrossRef] [Scilit]
- Yang, Y.; Tian, K.; Hao, J.; Pei, S.; Yang, Y. Biodiversity and biodiversity conservation in Yunnan, China. Biodivers. Conserv. 2004, 13, 813–826. [Google Scholar] [CrossRef] [Scilit]
- Castro-Souza, R.A.; Tessarolo, G.; Stropp, J.; Diniz-Filho, J.A.; Ladle, R.J.; Szinwelski, N.; Hortal, J.; Sobral-Souza, T. Mapping ignorance to uncover shortfalls in the knowledge on global Orthoptera distribution. npj Biodivers. 2024, 3, 22. [Google Scholar] [CrossRef] [Scilit]
- Garcia-Rosello, E.; Gonzalez-Dacosta, J.; Guisande, C.; Lobo, J.M. GBIF falls short of providing a representative picture of the global distribution of insects. Syst. Entomol. 2023, 48, 489–497. [Google Scholar] [CrossRef] [Scilit]
- Girardello, M.; Martellos, S.; Pardo, A.; Bertolino, S. Gaps in biodiversity occurrence information may hamper the achievement of international biodiversity targets: Insights from a cross-taxon analysis. Environ. Conserv. 2018, 45, 370–377. [Google Scholar] [CrossRef] [Scilit]

Disclaimer/Publisher’s Note: The statements, opinions and data contained in all publications are solely those of the individual author(s) and contributor(s) and not of MDPI and/or the editor(s). MDPI and/or the editor(s) disclaim responsibility for any injury to people or property resulting from any ideas, methods, instructions or products referred to in the content. |
© 2026 by the authors. Licensee MDPI, Basel, Switzerland. This article is an open access article distributed under the terms and conditions of the Creative Commons Attribution (CC BY) license.