


Abstract
Trace moisture can alter the local environment of synthetic ester lubricants, motivating a molecular description of water accommodation before clustering and interfacial effects arise. Molecular dynamics (MD) and density functional theory (DFT) calculations were used to study bis(2-ethylhexyl) adipate (DEHA) and bis(2-ethylhexyl) sebacate (DEHS) at 343 K, using three independent 12 ns single-water trajectories per oil. Carbonyl oxygen contributed approximately 98% of water–ester hydrogen bonds. Frames in which the two water hydrogens bonded to two different ester molecules occupied 13.66% and 12.02% of the trajectories, respectively. Identity-resolved analysis gave similar complete-event mean durations of approximately 0.19 ps for both oils at 0.1 ps sampling resolution. DEHA had higher mean hydrogen-bond and carbonyl-neighbor counts, whereas DEHS had a higher density-normalized coordination integral. All 12 targeted frozen dimers remained attractive upon changing the DFT basis from 6-31+G(d,p) to def2-TZVPD; interaction energies shifted by 0.306–1.607 kJ mol−1. The combined results distinguish contact occurrence, molecular connectivity and observed persistence as complementary descriptors of dilute water accommodation. They provide a molecular baseline for subsequent moisture-dependent lubricant studies without establishing ensemble binding-strength or macroscopic performance rankings.
1. Introduction
Synthetic ester base oils are used in lubrication and are being developed for electric-drive fluids [1,2]. Experiments on ester-containing lubricant blends [2] and high-speed gears [3], together with recent assessments of electrified transmissions [4], highlight the need to consider base-oil chemistry alongside additives, contact conditions and electrical effects. The application motivating this study is the base-oil component of electric-drive and transmission lubricants exposed to trace moisture. Immersion-cooling fluids and transformer insulating liquids [5] impose additional thermal, electrical and compatibility requirements that are not evaluated here. DEHA and DEHS are chemically defined model diesters rather than tested electric-vehicle formulations. Their bulk local water environment provides a molecular starting point for investigating moisture-dependent performance.
Water contamination has been investigated through bearing and tribological tests on synthetic ester lubricants. Wodtke et al. reported no pronounced changes in hydrodynamic or wear performance under the conditions tested for a water-contaminated, synthetic-ester-based environmentally acceptable lubricant [6]. Wang et al. combined tribological experiments and reactive molecular dynamics to investigate friction and film formation in water-containing synthetic ester lubricants, reporting increased wear at higher water contents and effects of additives [7]. The responses depend on the formulation and operating conditions. At the base-oil level, a complementary question is how a water molecule coordinates with the surrounding ester molecules before interfaces, additives, and water clustering are introduced.
Ester oxygen atoms can accept hydrogen bonds from water, but the two oxygen types have distinct local environments. Fang et al. examined water–ester hydrogen bonding through molecular dynamics and simulated carbonyl stretching spectra [8]. Czarnecki and Orzechowski investigated carbonyl preference and different water coordination states in aliphatic esters using spectroscopy, water-content measurements, and complex calculations [9]. In a diester, the two water hydrogens can coordinate with sites on either the same ester molecule or two different molecules. These arrangements can have the same hydrogen-bond count while differing in molecular connectivity. Distinguishing the acceptor type and molecular identity is consequently necessary to describe the local water environment.
Bis(2-ethylhexyl) adipate (DEHA) and bis(2-ethylhexyl) sebacate (DEHS) provide a chemically defined comparison. They share the same 2-ethylhexyl side chains and number of ester groups but contain four and eight methylene groups, respectively, between the carbonyl carbons. Their mixtures have been investigated through viscosity measurements and simulations [10]. Other recent work has linked ether functionalization in diesters to viscosity and film lubrication [11] and compared measured and simulated density and viscosity of a polyol ester [12]. Experiments across base-fluid structures also show that molecular architecture affects elastohydrodynamic friction [13]. These studies motivate structure-resolved comparisons, but their transport and contact observables do not directly establish how trace water coordinates in the present oils. Changing the central segment alters molecular mass, conformation, packing and acceptor-site density together; comparison of coordination counts and their density-normalized counterparts does not isolate one causal factor.
This study examines acceptor-site distributions, molecular connectivity and the observed persistence of water–ester contacts using three independent simulations per oil at 343 K. Coordination counts are compared with density-normalized integrals, while molecular-identity tracking distinguishes contact occurrence from continuous persistence. Targeted frozen dimers are evaluated by molecular mechanics and DFT, including a larger-basis sensitivity check. A single frozen water–two-ester configuration provides an illustrative decomposition of pairwise and nonadditive energies. The single-water setup approximates dilute local solvation rather than a thermodynamic infinite-dilution extrapolation. The objective is to establish local descriptors for moisture-dependent base-oil studies, without interpreting structural populations as binding free energies or measured lubricant performance.
2. Materials and Methods
2.1. Molecular Models and Simulation Conditions
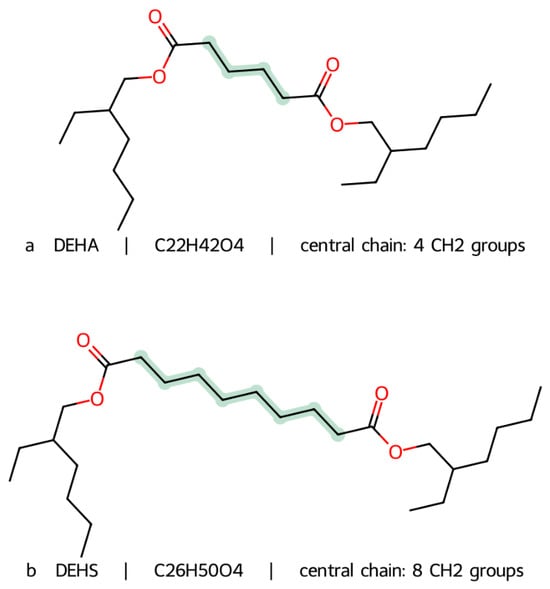
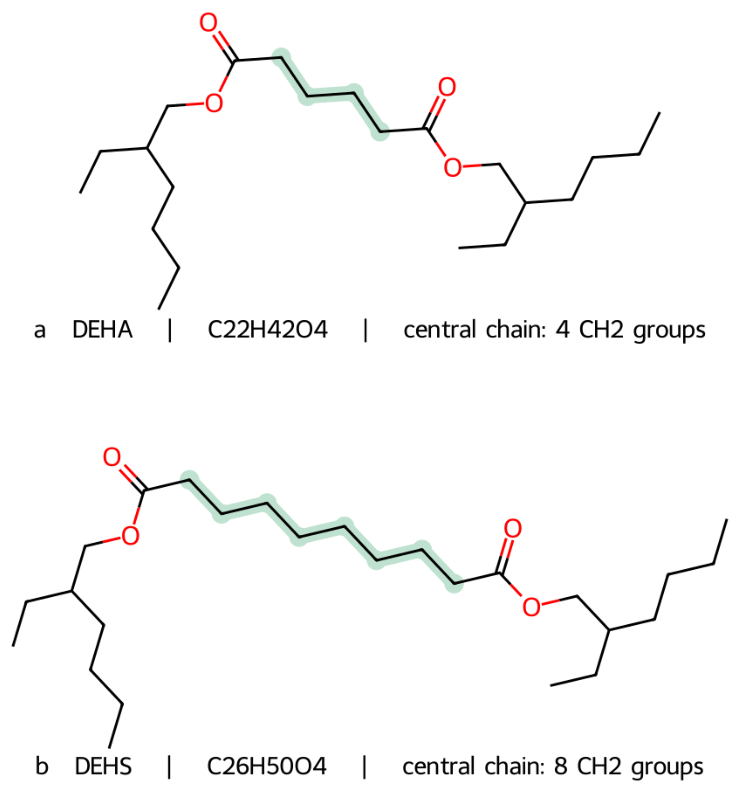
The molecular structures of DEHA and DEHS are shown in Figure 1. The green segments identify the four and eight methylene groups between the carbonyl carbons, respectively. Oxygen atoms are red; carbon atoms and implicit hydrogens follow skeletal notation. The drawings were generated from the simulation inputs and show connectivity without specifying side-chain stereochemistry.
Figure 1.
Molecular structures of (a) DEHA and (b) DEHS.
The molecular formulas of DEHA and DEHS are C22H42O4 and C26H50O4, respectively. Initial conformers were generated using the third version of the experimental-torsion knowledge distance geometry method (ETKDGv3) in RDKit [14] and optimized with the Merck molecular force field (MMFF). PACKMOL 21.2.3 was used to prepare three independent packings [15]. Ordered RS, RR, SS, and SR side-chain labels were assigned in counts of 19, 19, 18, and 18 for DEHA and 16 for each label for DEHS. RS and SR may represent the same physical stereoisomer through molecular symmetry; these labels specify the initialization composition. Random seeds are listed in Table S1.
Each periodic box contained 74 DEHA or 64 DEHS molecules and one water molecule (Table 1). The topology-based water mass fractions were 656.5 and 659.3 ppm. The system design compares the local environment of one water molecule at nearly matched mass fractions, without competition from a second independently moving water molecule. The ppm values follow from this composition and are not experimental solubilities, service limits or demonstrated safe water contents. The setup is a dilute single-solute approximation in a finite periodic box, not a concentration series or a thermodynamic infinite-dilution extrapolation. Water aggregation cannot be assessed, and no box-size extrapolation was performed.
Table 1.
System composition and production simulation conditions.
Simulations used GROMACS 2018.8 [16], its distributed optimized potentials for liquid simulations all-atom (OPLS-AA) force field without refitting [17], and the four-site transferable intermolecular potential (TIP4P) water model [18]. Lennard–Jones parameters followed geometric combination rules; both electrostatic and Lennard–Jones 1–4 interactions were scaled by 0.5. Three-dimensional periodic boundaries and a 1 fs time step were used. Long-range electrostatics were treated with particle mesh Ewald (PME) [19]. Real-space electrostatic and Lennard–Jones cutoffs were 1.2 nm. The Lennard–Jones potential was shifted at the cutoff, with dispersion corrections to energy and pressure. Bonds involving hydrogen and water geometry were constrained with the linear constraint solver (LINCS) [20] and the SETTLE rigid-water algorithm [21], respectively.
Each system underwent energy minimization, 100 ps of NVT equilibration, 200 ps of NPT pre-equilibration, and 2 ns of NPT equilibration. The NPT target pressure was 1 bar with isotropic coupling. Berendsen coupling was used for the 200 ps stage and Parrinello–Rahman coupling for the following 2 ns. Both stages used a pressure-coupling time of 5 ps and an isothermal compressibility of 4.5 × 10⁻⁵ bar−1. A stochastic velocity-rescaling thermostat maintained 343 K with a coupling time of 1 ps. For each oil, the production volume was the equal-weight average of the mean volumes over the last 1 ns of the three NPT runs. Molecular centers of mass were repositioned to this volume without changing intramolecular geometry, followed by energy minimization and 500 ps of NVT equilibration.
Here NVT denotes fixed particle number, volume and temperature; NPT denotes fixed particle number, pressure and temperature.
Production simulations used the NVT ensemble, a single temperature-coupling group containing the whole system, and stochastic velocity rescaling [22] at 343 K with a coupling time of 2 ps and an interval of 10 steps. Packing, initial velocity, and thermostat seeds were recorded separately. Runs of the same oil shared the production volume. Simulation inputs, processed MDP files, ester topologies, and OPLS-AA/TIP4P dependencies are supplied in the simulation input archive.
The dry-oil density comparison in Section S5 is a static consistency check. Quantitative validation against water–ester spectroscopy or water-solubility data for these systems has not been performed, and no validated diffusion coefficient or viscosity is reported. The dimer calculations in Section 2.5 are selected-geometry checks, not a calibration of the liquid force field.
Each independent production trajectory lasted 12 ns without regenerating velocities. Coordinates and energies were saved every 0.1 ps. All production frames were analyzed after duplicate segment-boundary frames were removed, giving 120,001 frames per run, 720,006 frames overall, and 72 ns of aggregate production sampling.
2.2. Acceptor Sites and Hydrogen-Bond Connectivity
Trajectories were read with MDAnalysis [23]. Bond connectivity and molecular identifiers were used to distinguish carbonyl oxygen, ester alkoxy oxygen, and the ester molecule containing each acceptor. Distances and angles were calculated with the minimum-image convention. The TIP4P virtual charge site was excluded from hydrogen-bond donor and acceptor counts.
For acceptor type A, the instantaneous coordination number CNA(t) counted acceptor oxygen atoms within rc = 0.35 nm of the water oxygen. The bulk number density was ρA = NA/V, where NA is the number of sites of type A in the box. The water-oxygen–acceptor-oxygen radial distribution function (RDF), gOW–A(r), is the mean acceptor density in a spherical shell at distance r divided by ρA. It was evaluated using shell-volume normalization and 0.01 nm radial bins up to 1.5 nm. The number-density-normalized coordination integral was defined as
Explicitly, IA(rc) = ⟨CNA(rc)⟩/ρA = 4π∫0ʳᶜ gOW–A(r)r2dr, with rc = 0.35 nm. The dimensionless RDF is integrated over volume, so IA has units of nm3. Carbonyl and alkoxy integrals use their respective site densities. Reported CN values were computed from direct per-frame counts; IA was obtained by division by ρA rather than by numerical integration of binned RDFs. The integral expression states the continuous relation.
The principal hydrogen-bond (HB) criterion required a water-oxygen–acceptor-oxygen distance ≤0.35 nm and a D–H–A angle ≥150°, with D denoting the water oxygen and the vertex at the donor hydrogen. Each qualifying donor-hydrogen–acceptor-oxygen combination was counted as one pair. The instantaneous pair count was H(t); Pk denoted the fraction of frames with H(t) = k and Pany the fraction with H(t) ≥ 1. A donor hydrogen could satisfy the criterion for more than one acceptor, so frames with H ≥ 3 were retained.
Frames with H = 2 were classified by the number of participating donor hydrogens and acceptor molecules as two hydrogens–two esters, two hydrogens–one ester, one hydrogen–two esters, or one hydrogen–one ester. The principal intermolecular measure, P2H,2E, was the fraction of all frames with exactly two HBs in which the two different water hydrogens bonded to two different ester molecules. The conditional fraction was f2E = P2H,2E/P2. Categories were further resolved by acceptor oxygen type. These populations describe instantaneous connectivity; persistence was evaluated separately by tracking molecular identity.
For continuous bridge events, the identity was the water molecule and the unordered pair of participating ester molecules. Acceptor switching within the same ester was allowed; replacing either ester or leaving the principal exactly-two-HB category ended the event. A consecutive episode of m saved frames was assigned m × 0.1 ps. Events touching either trajectory boundary were flagged and excluded from complete-event means. This convention cannot resolve interruptions between saved frames. Run-level event statistics and the distinction between continuous and intermittent observables are given in Section S9.
To separate neighbor counts from angular selection, the angular acceptance fraction was defined as
The denominator counts candidate combinations between nearby acceptors and the two water hydrogens. Within each run, ⟨HBA⟩ = 2⟨CNA⟩qA. This identity decomposes the counts without assuming independence between coordination and orientation.
2.3. Extraction and Visualization of Trajectory Configurations
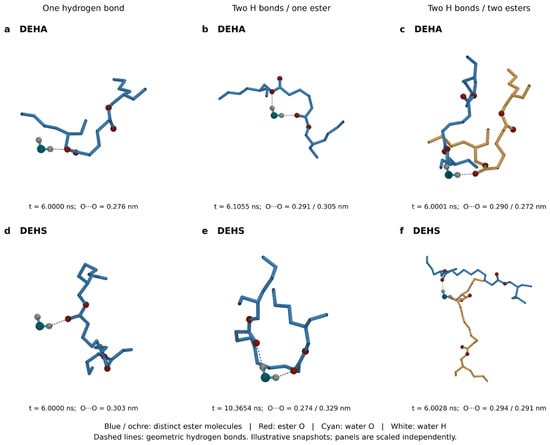
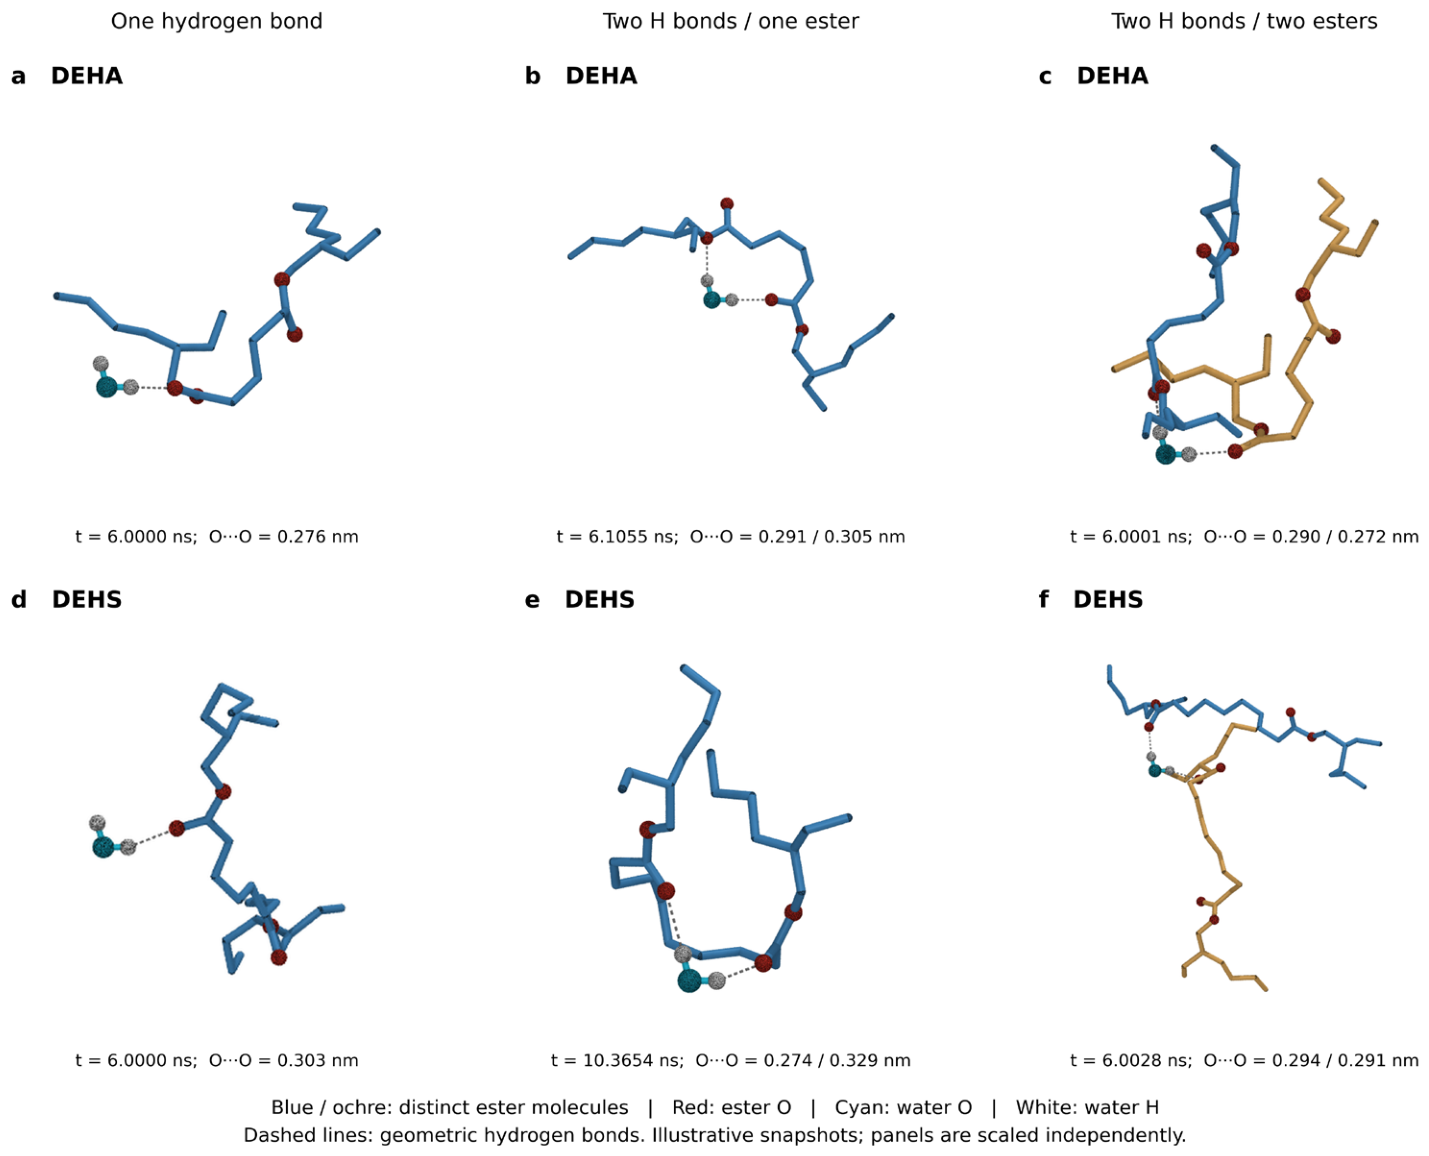
Two separate sets of configurations were used. The 18 configurations in this section are illustrations only and were not used for the quantum chemical energy comparison. For each of the three runs of each oil, frames were examined chronologically in the second half of the 12 ns trajectory. The first frame satisfying each of three conditions was retained: exactly one HB; exactly two HBs with the two water hydrogens bonding to one ester; or exactly two HBs with the two water hydrogens bonding to two different esters. The 0.35 nm/150° criterion was unchanged, and geometries were not optimized. Figure 2 shows the three examples from run 1 for each oil. This deterministic rule is reproducible but is not random or representative ensemble sampling; no statistical inference is made from these illustrations. The separate 12-configuration energy set is defined in Section 2.5.
Figure 2.
Local water–ester configurations: (a) one HB in DEHA; (b) two water hydrogens bonded to one DEHA molecule; (c) two water hydrogens bonded to two DEHA molecules; (d) one HB in DEHS; (e) two water hydrogens bonded to one DEHS molecule; (f) two water hydrogens bonded to two DEHS molecules.
Whole ester molecules were reconstructed across periodic boundaries using covalent connectivity and placed in their nearest images relative to water. Subsequent transformations were limited to rigid rotation and translation. Images were rendered using VMD 1.9.4a53 and TachyonInternal [24] and assembled in Python 3.12. Nonparticipating molecules, ester hydrogens, and the TIP4P virtual site were hidden. Blue and ochre distinguish ester carbon skeletons; ester oxygen, water oxygen, and water hydrogen are red, cyan, and white, respectively. Dashed lines identify geometrically defined HBs. Production times and oxygen–oxygen distances are displayed below the panels. Panels have independent scales. These first-occurrence examples illustrate connectivity; frequencies were calculated from the complete trajectories.
2.4. Statistics and Sensitivity Analysis
Each metric was calculated within a complete run and then averaged with equal weights over the three independent runs of the same oil. For run values xi, the sample standard deviation (SD) is s = [Σ_i(xi − )2/(n − 1)]1ᐟ2, with n = 3 and n − 1 = 2 degrees of freedom. The software notation ddof = 1 denotes subtraction of one from n; it does not mean one degree of freedom. The main tables report means ± s, not standard errors of the means. SDs of percentages are in percentage points. Table S5 additionally reports all three run values, standard errors s/√3 and approximate pointwise 95% Student-t intervals ± 4.30265s/√3. These intervals assume independent, approximately normally distributed run estimates; with n = 3, that distribution cannot be assessed reliably. Neither SDs nor these intervals establish convergence or include force-field, shared-volume or finite-size uncertainty. Frames and blocks are not counted as independent replicates. This separation of run-to-run variation, sampling uncertainty and model error follows established discussions of uncertainty in molecular simulation [25,26].
Geometric sensitivity was assessed using all nine combinations of distance cutoffs of 0.32, 0.35 and 0.38 nm and angle thresholds of 140°, 150° and 160°. Leaving out one run from each oil produced nine combinations of two-run means. Complete trajectories were divided into fixed 1 ns blocks; results for 0.5, 0.75 and 1.5 ns blocks were retained. Table S6 reports the full range of 1 ns block values in each run. Frame-weighted block means were checked against complete-run values. Blocks describe temporal variation and are not independent replicates or a stationarity test. Contact persistence was analyzed separately (Section S9). No hypothesis tests or multiplicity-adjusted significance claims are made. Reporting complete simulation settings and analysis definitions also supports reproducibility [27].
2.5. Matched Frozen-Geometry Energy Calculations
The energy comparison used 12 targeted water–single-ester configurations, distinct from the 18 visualization examples in Section 2.3. They comprised two oils, two acceptor types and three independent runs. Starting at a production time of 1.5 ns, the first frame with exactly one HB in the entire box and the required acceptor type was selected. The water molecule and complete ester containing that acceptor were extracted after periodic reconstruction. Selection was conditional on site type and first occurrence, rather than random; in particular, it gives rare alkoxy contacts equal representation to carbonyl contacts. Configurations were not replaced according to energy. The set tests selected contact geometries only and cannot estimate ensemble-average interaction energies, population ratios or a representative site-strength ranking.
Quantum chemical calculations used Gaussian 16 A.03 at the ωB97X-D/6-31+G(d,p) level [28], an UltraFine integration grid, and Tight/XQC self-consistent-field settings. Both fragments were neutral singlets. Basis-set superposition error was corrected using the counterpoise (CP) method [29], with the frozen interaction energy defined as
The superscript AB denotes a fragment evaluated in the full complex basis. Atomic positions were retained from MD without optimization or frequency calculations, and the TIP4P virtual site was excluded from the quantum calculation. All 12 dimers were additionally evaluated with def2-TZVPD using explicit H/C/O basis definitions, the same functional, frozen coordinates and CP convention (Section S10). This tests basis sensitivity for the selected geometries; CP correction and agreement between two bases do not establish complete-basis convergence or representative liquid binding strengths. The explicit basis definitions were taken from the Basis Set Exchange-derived library [30] distributed with AmberTools 24.8 and checked against the corresponding PySCF definitions. Distinguishing basis-set effects from model and thermochemical contributions is consistent with current DFT practice guidance [31].
The molecular mechanics (MM) calculation used the same real-atom coordinates and original topology parameters. The TIP4P virtual charge site was reconstructed, and all interfragment Coulomb and 12–6 Lennard–Jones terms were summed. This isolated pair calculation excluded intrafragment energy, periodic images, PME self-energy, potential shifts, and tail corrections. Each result was cross-checked against interfragment energy terms from a nonperiodic vacuum GROMACS rerun. MM and CP thus described the same frozen two-fragment geometry in isolation, rather than the total potential energy of the production liquid.
For an illustrative three-fragment calculation, one DEHA run-1 bridge configuration was selected from the first 4 ns production stratum using the predeclared PCG64 random seed 20261105. Complete water and ester molecules were reconstructed across periodic boundaries. Seven frozen subsystem energies were evaluated at ωB97X-D/6-31+G(d,p), each in the same full trimer basis with absent atoms represented by ghost centers. Water–ester-pair interaction and nonadditive three-body energy were calculated as defined in Section S11. Only this one trimer was evaluated; it is not a representative bridge-energy sample.
3. Results
3.1. Carbonyl Oxygen Dominates Local Hydrogen Bonding
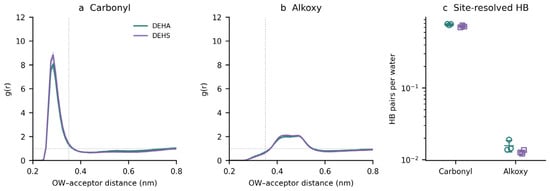
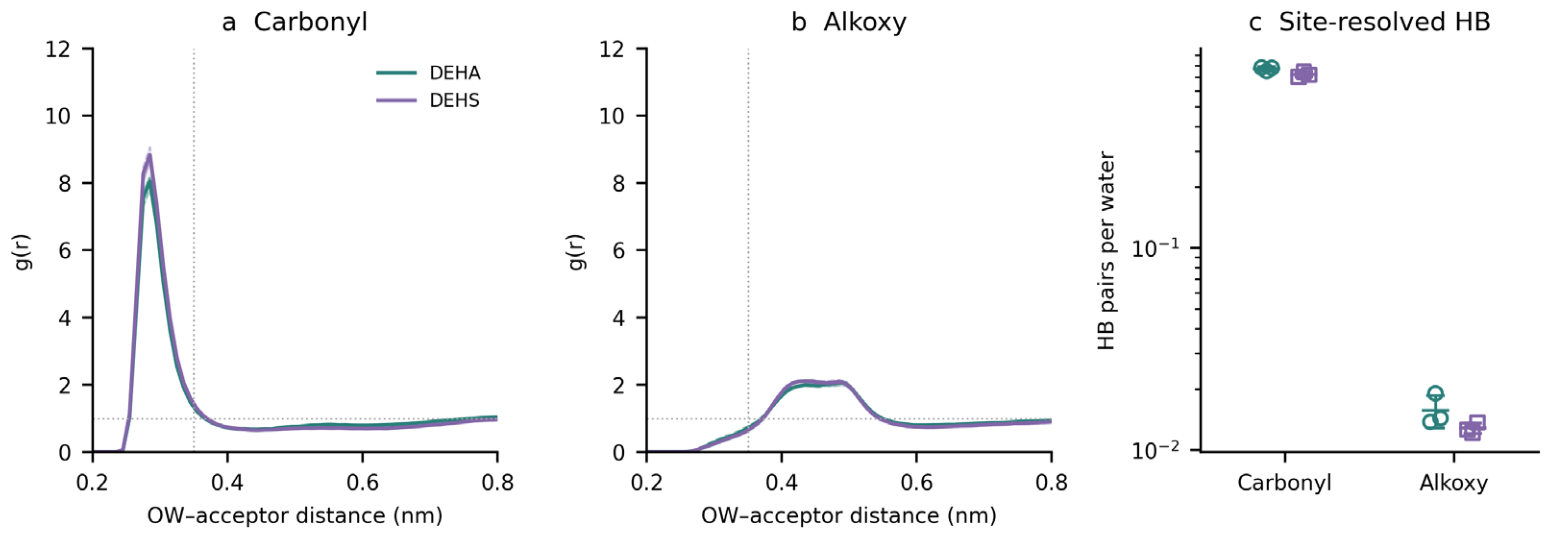
Both oils showed a pronounced short-range water-oxygen–carbonyl-oxygen distribution, whereas the alkoxy oxygen peak occurred at a greater distance (Figure 3a,b). Within 0.35 nm, carbonyl coordination numbers were 1.3342 ± 0.0238 for DEHA and 1.2498 ± 0.0249 for DEHS, compared with alkoxy coordination numbers of 0.1095 ± 0.0138 and 0.0843 ± 0.0046, respectively (Table 2). These counts describe spatial neighbors before the HB angle criterion is applied.
Figure 3.
Acceptor-site distributions and hydrogen bonding: (a) water-oxygen–carbonyl-oxygen RDF; (b) water-oxygen–alkoxy-oxygen RDF; (c) site-resolved HB counts.
Table 2.
Principal local structural metrics.
After angular selection, carbonyl oxygen accounted for most HB pairs (Figure 3c). Total HB counts were 0.7853 ± 0.0143 and 0.7353 ± 0.0205 per water molecule for DEHA and DEHS, with carbonyl shares of 97.99% ± 0.41% and 98.26% ± 0.13%. Carbonyl angular acceptance fractions were 28.84% and 28.90%, compared with 7.15% and 7.60% for alkoxy oxygen. Carbonyl predominance therefore appeared in both the neighbor counts and the angular acceptance of candidate pairs.
In Figure 3a,b, thick lines and shading show equal-weight means and sample SDs across the three runs; thin lines show individual runs. Vertical and horizontal dashed lines mark 0.35 nm and g(r) = 1. Figure 3c uses a logarithmic axis; open symbols are independent runs, and horizontal lines with error bars show means ± SD. Green and purple denote DEHA and DEHS. RDFs are unsmoothed and displayed to 0.8 nm, with full bins retained to 1.5 nm.
Values are means ± sample SD across three independent runs. SDs of percentages are in percentage points. The two denominators for intermolecular double coordination are reported separately.
3.2. Double Hydrogen Bonding Predominantly Connects Two Ester Molecules
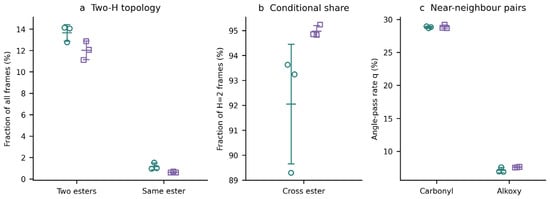
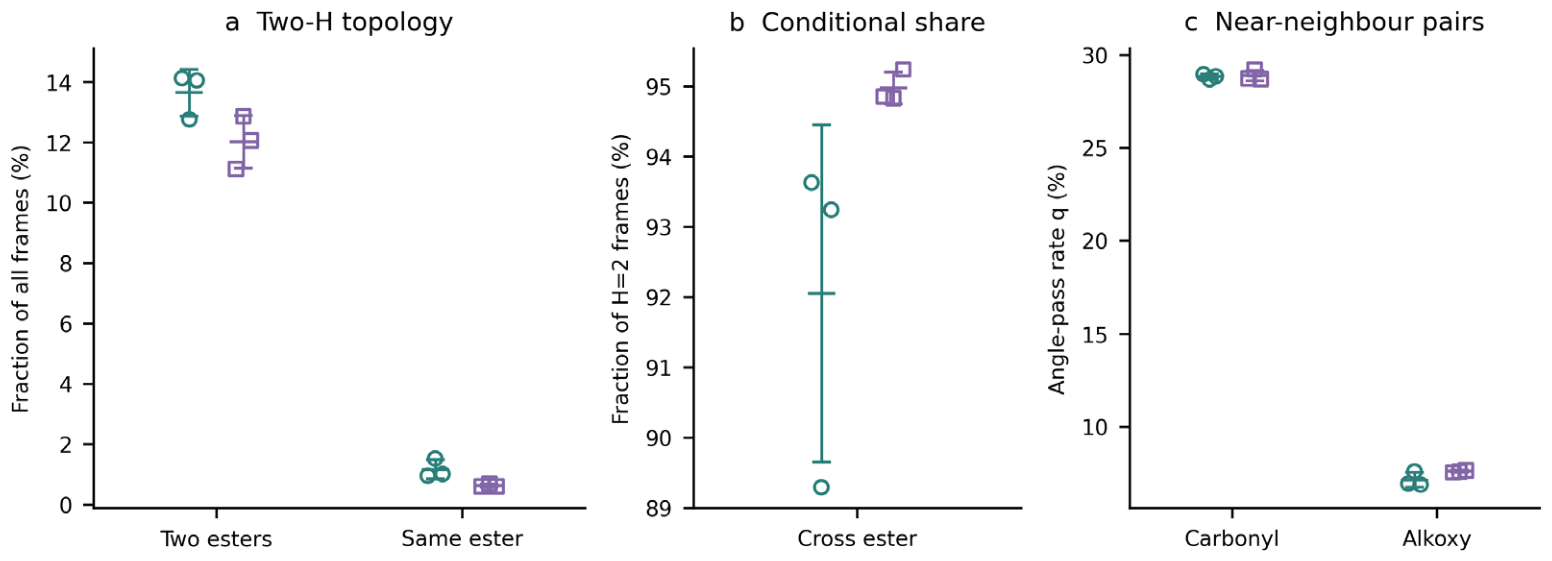
Figure 2 distinguishes water donating two HBs to one ester from water donating one HB to each of two esters. Across the complete trajectories, H = 2 frames were dominated by the latter arrangement (Figure 4a,b). P2 was 14.83% ± 0.46% for DEHA and 12.66% ± 0.92% for DEHS. Two hydrogens–two esters accounted for 13.66% ± 0.77% and 12.02% ± 0.87% of all frames, corresponding to conditional shares of 92.06% ± 2.40% and 94.98% ± 0.23% among H = 2 frames. Two hydrogens–one ester accounted for only 1.17% ± 0.31% and 0.64% ± 0.06% of all frames. Complete classifications are given in Table S2.
Figure 4.
Molecular connectivity and angular acceptance: (a) fractions of frames with two hydrogens bonded to two esters or one ester; (b) fraction of H = 2 frames involving two hydrogens and two esters; (c) angular acceptance fractions for carbonyl and alkoxy oxygen.
Tracking the same unordered pair of ester identities gave complete-event mean durations of approximately 0.19 ps for both oils, with a median of one saved frame (0.1 ps) in every run. Single-frame events accounted for 59.06% ± 0.06% of complete events in DEHA and 59.35% ± 0.83% in DEHS (Table S7). Across the nine geometric criteria, mean durations ranged from 0.12 to 0.30 ps in each oil, and the single-frame proportions ranged from 45.85% to 82.71% for DEHA and from 45.94% to 83.53% for DEHS (Table S11). The two oils remained close in mean duration at matched criteria. These discrete-frame statistics depend on the geometric definition and the 0.1 ps saving interval; they do not resolve shorter interruptions or establish precisely measured continuous-time lifetimes. The results distinguish occupancy from observed persistence without demonstrating sustained coupling of ester motion or a persistent network.
Figure 4a uses all frames as the denominator, Figure 4b uses H = 2 frames, and Figure 4c uses candidate combinations of nearby acceptors and the two donor hydrogens. Green circles and purple squares denote DEHA and DEHS. Open symbols show the three independent runs; horizontal lines and error bars indicate means ± SD under the principal criterion. Fractions with different denominators cannot be added.
3.3. Coordination Counts and Normalized Integrals Rank the Oils Differently
DEHA had a higher carbonyl coordination count but a lower number-density-normalized integral than DEHS. Carbonyl number densities were 2.88750 and 2.47674 nm−3, respectively; ICO was 0.4621 ± 0.0083 nm3 for DEHA and 0.5046 ± 0.0100 nm3 for DEHS (Table 2). Water therefore had more carbonyl neighbors in DEHA, whereas DEHS had a higher coordination integral relative to its lower bulk site density.
Carbonyl angular acceptance was approximately 29% in both oils (Figure 4c). In the counting identity, the difference in HB counts was associated primarily with the difference in neighbor counts rather than a large difference in mean angular acceptance. This is an algebraic description, not a causal attribution to number density. Central-chain length changes molecular mass, conformation and packing together; their effects and possible transport differences were not separated. The reported oil rankings refer to estimated means, without a formal significance claim or an intrinsic hydrophilicity ranking.
3.4. DFT and MM Both Describe the Selected Contacts as Attractive
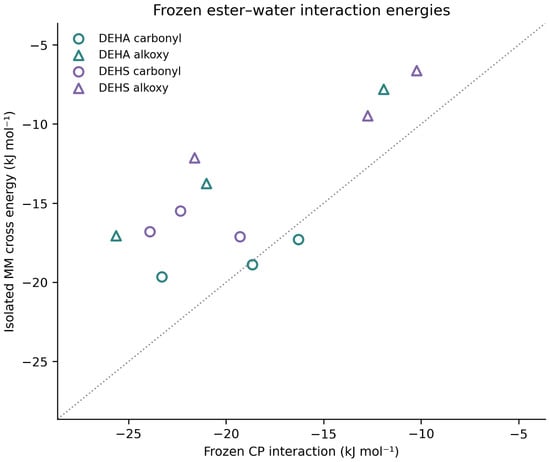
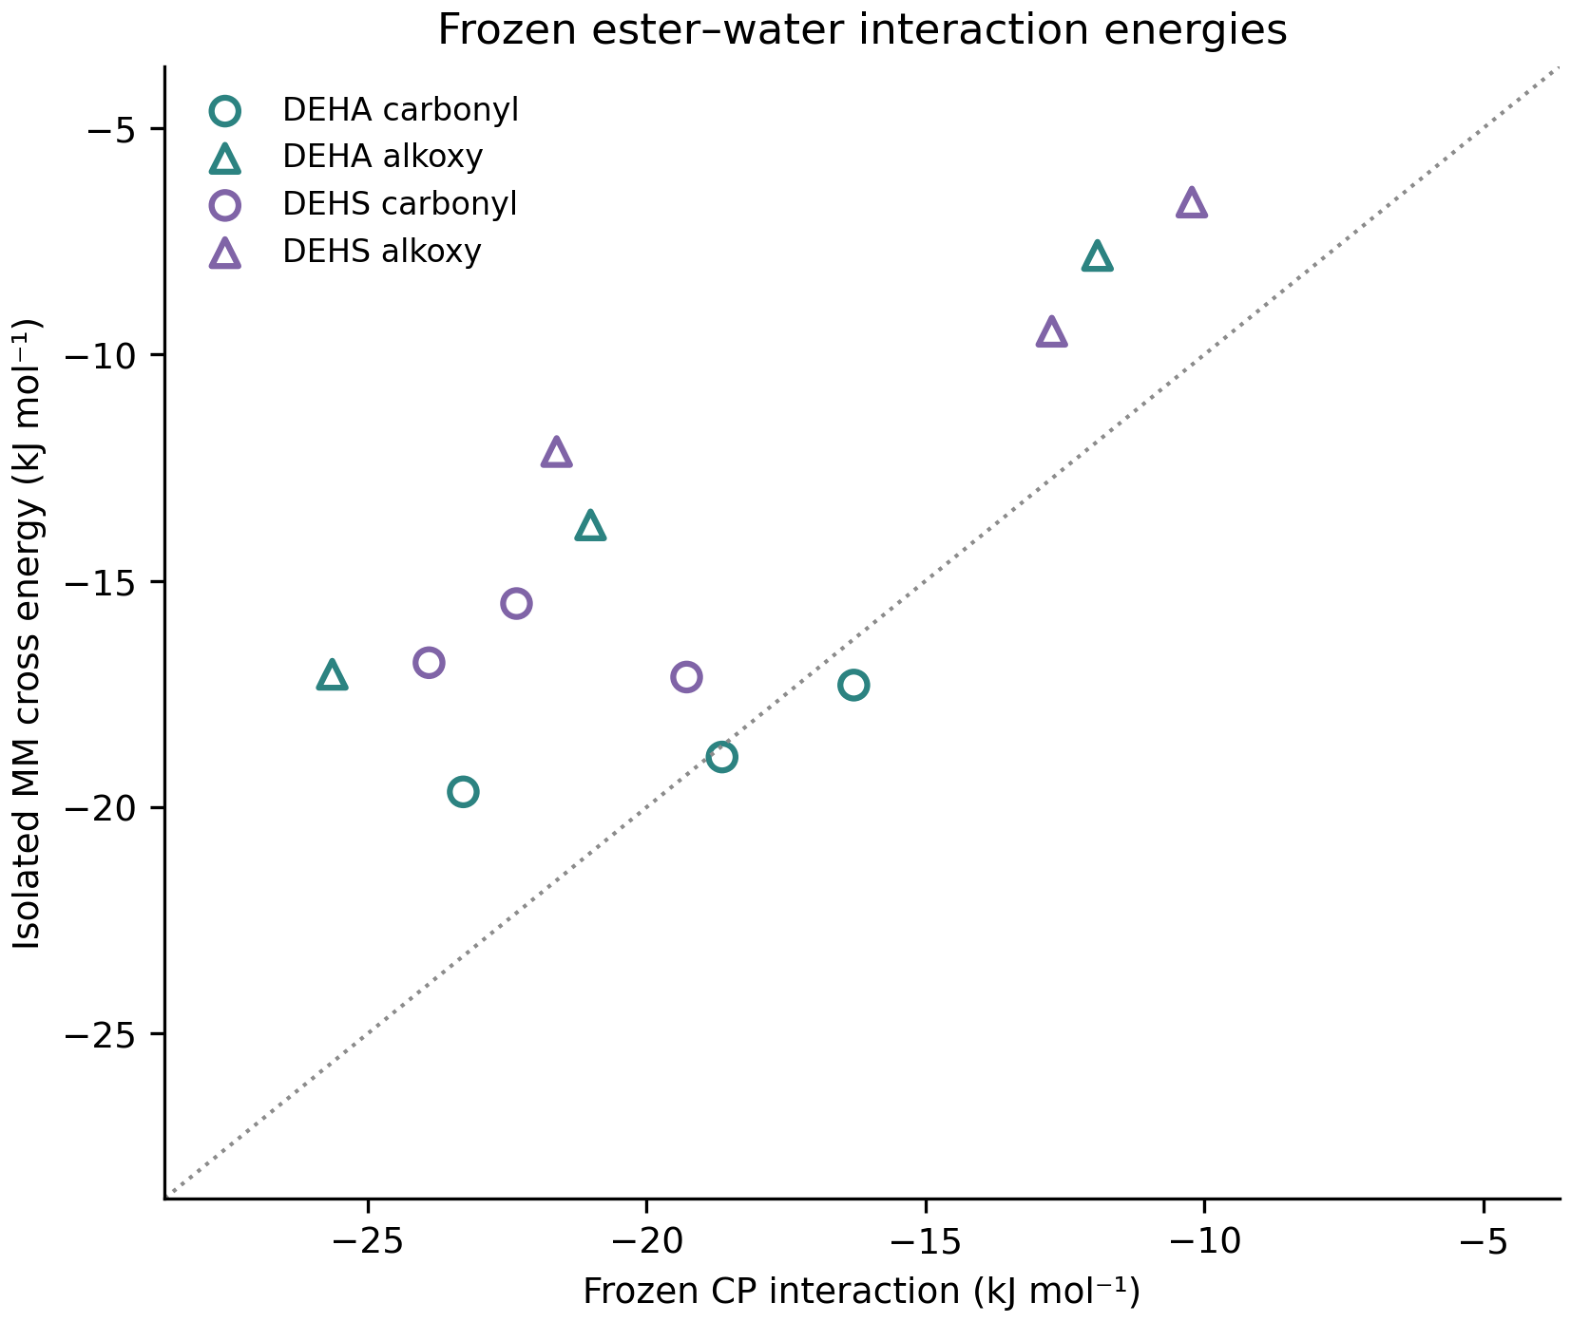
All 12 frozen water–ester configurations had negative DFT/CP interaction energies, ranging from −25.633 to −10.223 kJ mol−1. The corresponding MM energies were also negative, ranging from −19.658 to −6.631 kJ mol−1 (Figure 5; Table S4). Relative to separated fragments retaining the same internal geometry, both calculations gave a lower energy for the complex. The selected trajectory contacts were therefore net attractive under both descriptions.
Figure 5.
MM and DFT/CP interaction energies of the same frozen water–ester configurations.
Energy magnitudes differed between the methods. MM−CP differences for carbonyl-selected configurations ranged from −1.016 to +3.626 kJ mol−1 in DEHA and from +2.157 to +7.093 kJ mol−1 in DEHS. The corresponding alkoxy-selected ranges were +4.106 to +8.573 and +3.250 to +9.469 kJ mol−1. All individual values are reported in Table S4. The maximum component-wise discrepancy between analytical MM sums and GROMACS interfragment terms was below 6 × 10⁻⁵ kJ mol−1. DFT interaction energies were checked using two equivalent expressions from the calculation logs.
Changing all 12 dimers to def2-TZVPD retained negative CP energies, ranging from −24.465 to −9.673 kJ mol−1 (Table S8). The larger-basis energies were less negative by 0.306–1.607 kJ mol−1, with an arithmetic mean shift of 1.001 kJ mol−1 across the fixed set. This supports the qualitative attraction of these selected contacts without resolving selection bias or establishing an ensemble binding-strength ranking. A separate frozen DEHA water–two-ester example gave a water–ester-pair interaction of −28.190 kJ mol−1 and a positive nonadditive three-body term of +1.362 kJ mol−1 (Section S11). Thus, attraction in that configuration does not require favorable nonadditive cooperativity. The example is not an oil-to-oil comparison.
In Figure 5, the horizontal axis shows frozen ωB97X-D/6-31+G(d,p) CP energies, and the vertical axis shows the isolated MM interfragment energies. Green and purple denote DEHA and DEHS; circles and triangles identify carbonyl- and alkoxy-selected configurations. Each oil/site group contains one configuration from each run, giving 12 points. The dashed line indicates equal energies. These targeted configurations are not optimized minima or a sample for estimating liquid ensemble-average interaction energies.
4. Discussion
4.1. Molecular Identity Adds Information Beyond Hydrogen-Bond Counts
The local coordination of trace water involves both acceptor-site selection and the identity of the molecules supplying those sites. Resolving frames with exactly two HBs shows that two neighboring ester molecules participate in most double-coordination events in both models. Total HB counts alone would not reveal this distinction. Tracking molecular identity alongside site populations therefore provides a useful basis for comparing base-oil structures and, in future work, different water loadings. Work on bulk water has connected hydrogen-bond exchange with reorientation and diffusion [32], motivating separate analysis of structure and dynamics. Its bulk-water relationships are not assumed to apply quantitatively to a single water molecule in an ester oil.
Earlier work provides qualitative context for the acceptor distinction. Fang et al. connected hydrogen bonding at the two ester oxygen types to different carbonyl spectral responses in methyl acetate solutions [8]. Czarnecki and Orzechowski used vibrational spectroscopy and water-content measurements to investigate water coordination in aliphatic esters [9]. These findings support examining site-resolved coordination, but their spectral observables and chemical environments are not identical to geometric HB populations in the present diesters. The comparison is qualitative, not a numerical calibration of the approximately 98% carbonyl share. Carbonyl preference itself is not proposed as a new general property of esters.
4.2. Number Density Changes the Interpretation of Coordination
Equal numbers of ester groups per molecule do not imply equal acceptor availability per unit volume. The opposite rankings of CN and ICO distinguish absolute neighbor counts from coordination relative to the bulk site density. Similar carbonyl q values further clarify the count decomposition, but do not isolate number density as the sole cause. Molecular conformations, packing, and surrounding ester molecules vary together in this two-compound comparison.
Reporting CN, I and q together avoids assigning a material ranking from one metric. A useful molecular-design comparison would vary carbonyl accessibility, spacing between ester groups, side-chain steric shielding and conformational flexibility while recording acceptor-site density. Increasing accessible polar sites could favor isolated-water accommodation, but stronger or longer-lived association could also alter mobility. The present two-compound comparison does not identify an optimum or establish that either a larger HB count or a larger I improves water tolerance. These descriptors should be tested against concentration-dependent water uptake and transport, with molecular size and density controlled where possible. The relevance of architecture to friction [13] and of ether functionalization to diester viscosity and film lubrication [11] further supports evaluating several descriptors rather than extrapolating from HB counts alone.
4.3. Correspondence Between Structural and Energetic Evidence
Structural statistics use complete 12 ns trajectories with three independent runs per oil. Figure S1 and Table S6 retain all fixed 1 ns blocks, including variation in the less frequent same-ester category. Table S5 separates run-to-run SD from uncertainty in the estimated mean. The pointwise intervals are broad for several small DEHA/DEHS differences; the common carbonyl preference and conditional prevalence of two-ester arrangements are therefore more central than a fine ranking between oils. The intervals are conditional on the statistical assumptions stated in Section 2.4 and cannot certify stationary sampling.
Across all nine distance/angle criteria, carbonyl sites contributed 96.71–98.96% of water–ester HBs, while two-ester arrangements accounted for 91.78–95.37% of frames with exactly two HBs (Table S3). These are different conditional denominators: all water–ester HBs for the first metric and H = 2 frames for the second. By contrast, bridge occupancy uses all saved frames and ranged from 3.55% to 26.52% for DEHA and from 3.08% to 23.34% for DEHS. DEHA had the higher mean occupancy at each matched criterion, but the absolute percentages were criterion-sensitive. Thus, carbonyl dominance and the predominance of inter-ester connectivity among double-HB frames are robust across the tested criteria; the principal-criterion occupancies of 13.66% and 12.02% should not be read as criterion-independent constants.
The structural, dynamical and energetic analyses address complementary aspects of local water accommodation. Complete trajectories establish contact populations; identity tracking shows that the recorded continuous bridge episodes are short and have similar mean durations in the two models. The 12 targeted dimer calculations retain attraction at both tested DFT basis sets. The single three-fragment example further separates water–ester-pair attraction from a small unfavorable nonadditive contribution. These results connect observed contact geometries with local attractive interactions, but neither the selected configurations nor their gas-phase electronic energies quantify liquid free energies. In particular, the differing structural populations should not be interpreted as proof of stronger or more cooperative binding in either oil.
4.4. Relevance to Water-Containing Base Oils
For electric-drive and transmission lubrication, local water coordination provides a starting point for studying moisture-dependent molecular rearrangement. Here, higher bridge occupancy in DEHA does not coincide with a clearly distinguishable observed continuous duration: both models yield approximately 0.19 ps under the principal geometric definition. These short recorded episodes do not establish sustained coupling of the participating ester molecules or a viscosity change. Comparing their displacements with those of uncoordinated esters, and measuring transport at matched temperature and water content, would test that connection. Likewise, competition with additives and lubricated surfaces requires explicit interfacial models. Bearing and tribological responses remain formulation- and condition-dependent [6,7]; geometric fractions and frozen interaction energies cannot be converted directly into friction or wear performance. Reliable diffusion and viscosity estimates require their own observable-specific sampling and uncertainty analyses [33].
Water tolerance should be assessed operationally as retention of specified lubricant properties at a defined water loading and temperature, rather than inferred from the number of HBs. With increasing loading, water–water association and competition for ester sites can enter, so the single-water proportions need not persist, and their direction of change is not established here. An informative formulation study would combine water uptake or solubility, site-resolved spectroscopy, water-cluster statistics, contact persistence, viscosity and relevant tribological tests. Pure-diester models at 343 K exclude additives, hydrolysis, interfacial shear and electric-field effects. They cannot rank thermal-management, electrical-insulation or material-compatibility performance. The dry-density comparison is retained as a static consistency check only; no experimental validation of water–ester interactions or transport properties is claimed.
5. Conclusions
In single-water models of DEHA and DEHS at 343 K, carbonyl oxygen contributed approximately 98% of geometric hydrogen bonds. Conditional on exactly two HBs, two different ester molecules supplied the acceptors in 92.06% and 94.98% of frames; these arrangements occupied 13.66% and 12.02% of all frames. Molecular-identity tracking gave similar complete-event mean durations of approximately 0.19 ps at 0.1 ps sampling resolution. Contact occurrence and observed persistence therefore provide distinct information about local water accommodation.
DEHA had higher estimated mean HB and carbonyl-neighbor counts, whereas DEHS had a higher density-normalized carbonyl coordination integral. Site density, molecular size, conformation and packing vary together, preventing attribution to a single factor. All 12 targeted dimers remained attractive at both tested DFT basis sets, with shifts of 0.306–1.607 kJ mol−1 upon using def2-TZVPD. A single DEHA trimer illustrated net water–ester-pair attraction with an unfavorable nonadditive contribution. These energy checks support the selected local contacts without establishing ensemble binding-strength or cooperativity rankings between the oils.
The molecular-design implication is to evaluate accessible carbonyl sites, site density, ester-group spacing, coordinating-molecule identity and contact persistence together. These descriptors provide a basis for controlled comparisons of water uptake, spectroscopy, viscosity and tribological response over water concentration. The present study establishes a dilute local-structure and contact-persistence baseline, rather than selecting a superior lubricant formulation.
Supplementary Materials
The following supporting information can be downloaded at: https://www.mdpi.com/article/10.3390/lubricants14110445/s1. Table S1: Random seeds and stereochemical initialization labels. Table S2: Local structural metrics under the principal geometric criterion. Table S3: Conditional fractions and all-frame bridge occupancy for nine geometric criteria. Table S4: Isolated pair energies and basis-set superposition errors at matched frozen geometries. Table S5: Run-level estimates, sample SDs, standard errors and approximate 95% intervals. Table S6: Minimum and maximum 1 ns block estimates within each complete 12 ns run. Table S7: Principal-criterion bridge occupancy, complete-event duration and duration distribution. Table S8: Frozen CP interaction energies at the two basis sets (kJ mol−1). Table S9: Frozen subsystem total electronic energies for the DEHA trimer example. Table S10: Interaction-energy decomposition for the DEHA trimer example. Table S11: Complete-event duration and single-frame proportion across all nine geometric criteria. Figure S1: Fixed-block statistics: (a,b) total HB counts for DEHA and DEHS; (c,d) two-hydrogen–two-ester frame fractions for DEHA and DEHS; (e,f) two-hydrogen–one-ester frame fractions for DEHA and DEHS. The previously supplied simulation inputs and topologies remain part of the Supplementary Materials.
Author Contributions
Conceptualization, methodology, formal analysis, and writing—original draft preparation, Z.M.; validation and writing—review and editing, X.T.; data curation and visualization, S.Z. and J.C.; analysis of the engineering application context and writing—review and editing, R.L. All authors have read and agreed to the published version of the manuscript.
Funding
This research received no external funding.
Data Availability Statement
The data presented in this study are available on request from the corresponding author due to (specify the reason for the restriction).
Acknowledgments
The authors acknowledge the use of Gaussian 16 and GROMACS 2025.3 software packages for quantum chemical calculations and molecular dynamics simulations.
Conflicts of Interest
Zhenzi Ma is employed by Southern (Shaoguan) Intelligent Connected New Energy Vehicle Testing and Inspection Center Co., Ltd. Xingwen Tan and Shengke Zou are employed by China Automotive Engineering Research Institute Co., Ltd. Jie Chen is employed by Nanjing Iveco Automobile Co., Ltd.
References
- Cargill. Priolube™ EF: Dielectric Base Oils. Official Product and Application Information. Available online: https://www.cargill.com/bioindustrial/lubricants/priolube-ef-ev (accessed on 9 October 2026).
- Cañellas, G.; Emeric, A.; Combarros, M.; Navarro, A.; Beltran, L.; Vilaseca, M.; Vives, J. Tribological Performance of Esters, Friction Modifier and Antiwear Additives for Electric Vehicle Applications. Lubricants 2023, 11, 109. [Google Scholar] [CrossRef] [Scilit]
- Zhmud, B.; Najjari, M.; Brodmann, B. The Effects of the Lubricant Properties and Surface Finish Characteristics on the Tribology of High-Speed Gears for EV Transmissions. Lubricants 2024, 12, 112. [Google Scholar] [CrossRef] [Scilit]
- Ali, M.K.A.; Li, B.; Zhang, C.; Yu, Q.; Sun, Y.; Zhou, F.; Liu, W. Lubrication of electrified vehicle transmissions: Challenges, mechanisms, and perspectives. Tribol. Int. 2026, 217, 111672. [Google Scholar] [CrossRef] [Scilit]
- Shell. Shell MIDEL Ester Transformer Liquids. Official Product and Application Information. Available online: https://www.shell.us/business/fuels-and-lubricants/lubricants-for-business/products/midel.html (accessed on 9 October 2026).
- Wodtke, M.; Frost, J.; Litwin, W. Effect of water contamination of an environmentally acceptable lubricant based on synthetic esters on the wear and hydrodynamic properties of stern tube bearing. Tribol. Int. 2025, 205, 110562. [Google Scholar] [CrossRef] [Scilit]
- Wang, X.; Jin, L.; Liu, Y.; Zhu, P.; Xu, R.; Stelmakh, O.; Zhao, Y.; Zhang, H. Experimental and Molecular Dynamics Study on the Friction and Film Formation of Water-Containing Synthetic Ester Lubricants. Langmuir 2026, 42, 9374–9385. [Google Scholar] [CrossRef] [Scilit]
- Fang, B.; Wang, T.; Chen, X.; Jin, T.; Zhang, R.; Zhuang, W. Modeling Vibrational Spectra of Ester Carbonyl Stretch in Water and DMSO Based on Molecular Dynamics Simulation. J. Phys. Chem. B 2015, 119, 12390–12396. [Google Scholar] [CrossRef] [Scilit]
- Czarnecki, M.A.; Orzechowski, K. MIR/NIR spectroscopic insight into the state of water in aliphatic esters. Spectrochim. Acta Part A Mol. Biomol. Spectrosc. 2026, 348, 127126. [Google Scholar] [CrossRef] [Scilit]
- Sarpa, D.; Mathas, D.; Bakolas, V.; Procelewska, J.; Franke, J.; Busch, M.; Roedel, P.; Bohnert, C.; Wolf, M.; Skylaris, C.K. Computing Viscosities of Mixtures of Ester-Based Lubricants at Different Temperatures. J. Phys. Chem. B 2023, 127, 2587–2594. [Google Scholar] [CrossRef] [Scilit]
- Wang, H.; Zhang, C.; Chen, H.; Yu, X.; Li, Y.; Yang, K. Influence of ether group on viscosity and film lubrication of diester lubricants: Integrated quantitative structure–property relationship and molecular dynamics simulation methods. J. Mol. Liq. 2024, 398, 124254. [Google Scholar] [CrossRef] [Scilit]
- Lin, L.; Kedzierski, M.A. Density and viscosity of a polyol ester lubricant: Measurement and molecular dynamics simulation. Int. J. Refrig. 2020, 118, 188–201. [Google Scholar] [CrossRef] [Scilit]
- Zhang, J.; Tan, A.; Spikes, H. Effect of Base Oil Structure on Elastohydrodynamic Friction. Tribol. Lett. 2017, 65, 13. [Google Scholar] [CrossRef] [Scilit]
- Riniker, S.; Landrum, G.A. Better Informed Distance Geometry: Using What We Know To Improve Conformation Generation. J. Chem. Inf. Model. 2015, 55, 2562–2574. [Google Scholar] [CrossRef] [Scilit]
- Martínez, L.; Andrade, R.; Birgin, E.G.; Martínez, J.M. PACKMOL: A package for building initial configurations for molecular dynamics simulations. J. Comput. Chem. 2009, 30, 2157–2164. [Google Scholar] [CrossRef] [Scilit]
- Abraham, M.J.; Murtola, T.; Schulz, R.; Páll, S.; Smith, J.C.; Hess, B.; Lindahl, E. GROMACS: High performance molecular simulations through multi-level parallelism from laptops to supercomputers. SoftwareX 2015, 1–2, 19–25. [Google Scholar] [CrossRef] [Scilit]
- Jorgensen, W.L.; Maxwell, D.S.; Tirado-Rives, J. Development and Testing of the OPLS All-Atom Force Field on Conformational Energetics and Properties of Organic Liquids. J. Am. Chem. Soc. 1996, 118, 11225–11236. [Google Scholar] [CrossRef] [Scilit]
- Jorgensen, W.L.; Chandrasekhar, J.; Madura, J.D.; Impey, R.W.; Klein, M.L. Comparison of simple potential functions for simulating liquid water. J. Chem. Phys. 1983, 79, 926–935. [Google Scholar] [CrossRef] [Scilit]
- Darden, T.; York, D.; Pedersen, L. Particle mesh Ewald: An N⋅log(N) method for Ewald sums in large systems. J. Chem. Phys. 1993, 98, 10089–10092. [Google Scholar] [CrossRef] [Scilit]
- Hess, B.; Bekker, H.; Berendsen, H.J.C.; Fraaije, J.G.E.M. LINCS: A linear constraint solver for molecular simulations. J. Comput. Chem. 1997, 18, 1463–1472. [Google Scholar] [CrossRef]
- Miyamoto, S.; Kollman, P.A. Settle: An analytical version of the SHAKE and RATTLE algorithm for rigid water models. J. Comput. Chem. 1992, 13, 952–962. [Google Scholar] [CrossRef] [Scilit]
- Bussi, G.; Donadio, D.; Parrinello, M. Canonical sampling through velocity rescaling. J. Chem. Phys. 2007, 126, 014101. [Google Scholar] [CrossRef] [Scilit]
- Michaud-Agrawal, N.; Denning, E.J.; Woolf, T.B.; Beckstein, O. MDAnalysis: A toolkit for the analysis of molecular dynamics simulations. J. Comput. Chem. 2011, 32, 2319–2327. [Google Scholar] [CrossRef] [Scilit]
- Humphrey, W.; Dalke, A.; Schulten, K. VMD: Visual molecular dynamics. J. Mol. Graph. 1996, 14, 33–38. [Google Scholar] [CrossRef] [Scilit]
- Grossfield, A.; Patrone, P.N.; Roe, D.R.; Schultz, A.J.; Siderius, D.; Zuckerman, D.M. Best Practices for Quantification of Uncertainty and Sampling Quality in Molecular Simulations [Article v1.0]. Living J. Comput. Mol. Sci. 2018, 1, 5067. [Google Scholar] [CrossRef] [Scilit]
- Wan, S.; Sinclair, R.C.; Coveney, P.V. Uncertainty quantification in classical molecular dynamics. Philos. Trans. R. Soc. A Math. Phys. Eng. Sci. 2021, 379, 20200082. [Google Scholar] [CrossRef] [Scilit]
- Reliability and reproducibility checklist for molecular dynamics simulations. Commun. Biol. 2023, 6, 268. [Google Scholar] [CrossRef] [Scilit]
- Chai, J.D.; Head-Gordon, M. Long-range corrected hybrid density functionals with damped atom–atom dispersion corrections. Phys. Chem. Chem. Phys. 2008, 10, 6615–6620. [Google Scholar] [CrossRef] [Scilit]
- Boys, S.F.; Bernardi, F. The calculation of small molecular interactions by the differences of separate total energies. Some procedures with reduced errors. Mol. Phys. 1970, 19, 553–566. [Google Scholar] [CrossRef] [Scilit]
- Pritchard, B.P.; Altarawy, D.; Didier, B.; Gibson, T.D.; Windus, T.L. New Basis Set Exchange: An Open, Up-to-Date Resource for the Molecular Sciences Community. J. Chem. Inf. Model. 2019, 59, 4814–4820. [Google Scholar] [CrossRef] [Scilit]
- Bursch, M.; Mewes, J.M.; Hansen, A.; Grimme, S. Best-Practice DFT Protocols for Basic Molecular Computational Chemistry. Angew. Chem. Int. Ed. 2022, 61, e202205735. [Google Scholar] [CrossRef] [Scilit]
- Piskulich, Z.A.; Laage, D.; Thompson, W.H. A structure–dynamics relationship enables prediction of the water hydrogen bond exchange activation energy from experimental data. Chem. Sci. 2024, 15, 2197–2204. [Google Scholar] [CrossRef] [Scilit]
- Maginn, E.J.; Messerly, R.A.; Carlson, D.J.; Roe, D.R.; Elliot, J.R. Best Practices for Computing Transport Properties 1. Self-Diffusivity and Viscosity from Equilibrium Molecular Dynamics [Article v1.0]. Living J. Comput. Mol. Sci. 2018, 1, 6324. [Google Scholar] [CrossRef] [Scilit]

Disclaimer/Publisher’s Note: The statements, opinions and data contained in all publications are solely those of the individual author(s) and contributor(s) and not of MDPI and/or the editor(s). MDPI and/or the editor(s) disclaim responsibility for any injury to people or property resulting from any ideas, methods, instructions or products referred to in the content. |
© 2026 by the authors. Licensee MDPI, Basel, Switzerland. This article is an open access article distributed under the terms and conditions of the Creative Commons Attribution (CC BY) license.