


Abstract
The reciprocating dynamic sealing system is crucial for the operational reliability of aircraft high-pressure hydraulic actuators, particularly for civil aircraft with 21 MPa (e.g., B737, A320) and 35 MPa (e.g., B787, A380) pressure systems, where real-time monitoring and prediction of friction and oil-film thickness are essential for health assessment. This study proposes a novel data-driven predictive framework for dynamic seal performance utilizing a long short-term memory (LSTM) network. A specialized reciprocating seal test rig was developed to acquire high-fidelity multimodal data. By integrating ultrasonic detection, fiber Bragg grating (FBG) sensors, and load cells, the simultaneous measurement of oil-film thickness, contact stress, and friction force under high-pressure conditions up to 35 MPa was achieved. The measured oil-film thickness, determined by the sealing gap, provides the physical basis for leakage characterization. An LSTM-based model was then trained on this time-series dataset to predict oil-film thickness and friction force. The results show that the LSTM model achieves a coefficient of determination (R2) above 0.94 and a symmetric mean absolute percentage error (sMAPE) below 2% for both predictions on the test set. Ultimately, this research provides theoretical support for the condition assessment and leakage risk early warning of dynamic seals, advancing the application of artificial intelligence and data-driven methodologies within aviation sealing technologies.
1. Introduction
Hydraulic actuators have rapidly become the primary execution components in aircraft actuation systems (e.g., elevators, rudders, flaperons, and tail units) and landing gear systems (e.g., wheel steering, extension/retraction, and brake actuators) due to their high power density, superior reliability, and excellent damping and heat dissipation properties [1,2]. The reciprocating sealing system of the actuator is a core component ensuring the functional integrity of the hydraulic system, whereas friction, wear, and vibration can induce energy dissipation and potentially lead to system failure [3]. The oil-film thickness and friction force within the reciprocating sealing system serve as direct indicators of the equipment’s performance and operational status. Specifically, the oil-film thickness dictates the lubrication regime and leakage level at the sealing interface, while the friction force reflects the motion resistance, energy loss, and wear severity [4]. Together, these two parameters characterize the dynamic performance, sealing reliability, and degradation trends of the actuator. Therefore, conducting real-time monitoring and investigating their variation laws are essential for accurately evaluating equipment health. To satisfy the demands for high power density, enhanced maneuverability, and high spatial utilization in modern aircraft, aircraft hydraulic systems are progressively evolving towards higher operating pressures and power outputs. Currently, civil airliners generally adopt 21 MPa pressure systems (e.g., B737 and A320 series), while the new generation of large civil aircraft, such as the A380 and B787, have already applied 35 MPa high-pressure hydraulic systems [5]. Compared with the conventional 21 MPa environment, the 35 MPa high-pressure environment imposes a substantially higher pressure differential and extrusion load on the sealing interface, together with more severe frictional heating and a thinner, more easily disrupted oil film, so that the oil-film thickness and friction force exhibit stronger nonlinearity and more pronounced transient fluctuations. These differences also place additional requirements on the test: the pressure-bearing components of the test rig must be reinforced and reliably sealed, the specimen is more prone to extrusion damage, and the elevated contact stress and shear heating demand sensors with a high pressure rating, sufficient sensitivity, and adequate dynamic response, while the oil temperature and pressure should be kept stable, and protection against high-pressure oil jets should be ensured throughout the test. Consequently, predicting the oil-film thickness and friction force of reciprocating seals contributes to identifying sealing performance and degradation trends, thereby optimizing the operational performance of the actuators.
The rapid advancement of artificial intelligence technologies, represented by machine learning (ML), has provided a more efficient and precise technical pathway for predicting sealing performance [6]. Relying on its robust capabilities in nonlinear mapping and data feature extraction, ML enables adaptive modeling under complex operating conditions, significantly improving the prediction accuracy of performance degradation trends and remaining useful life [7]. For instance, Tse et al. [8,9] employed a recurrent neural network (RNN) to predict the developmental trend of sealing-performance degradation, offering a novel method for equipment sealing evaluation. Similarly, Chen et al. [10] utilized a dynamic wavelet neural network to transform sensor monitoring data into a time-evolution model of sealing fault features, thereby achieving RUL prediction for mechanical bearings. Furthermore, Wang et al. [11] applied both RNNs and fuzzy neural networks to compare predictive outcomes for rotary mechanical seal fault prediction, concluding that the fuzzy neural network exhibits superior suitability for such applications.
The performance of a reciprocating seal is comprehensively influenced by its frictional, sealing, and lubrication characteristics [12,13]. Currently, the prevalent methods for predicting reciprocating-seal performance are based on elastohydrodynamic lubrication (EHL) theory and inverse hydrodynamic lubrication (IHL) theory, where input parameters are typically derived from the contact pressure or oil-film-thickness distributions obtained through simulation analysis [14,15]. Because the simulation models are built upon excessive simplifying assumptions, they cannot accurately characterize the actual friction-velocity hysteresis behavior under fluid-lubricated conditions for hydraulic-cylinder reciprocating sealing systems [16].
In contrast, ML-based methods are inherently data-driven, necessitating the experimental acquisition of critical parameters such as oil-film thickness, contact stress, and friction force at the sealing interface. Optical interferometry is a common technique for measuring oil-film thickness. Recently, Song Yang et al. integrated load sensors with the laser-induced fluorescence method to realize the simultaneous measurement of friction force and oil-film thickness between O-rubber rings and glass components [17]. However, its reliance on transparent materials limits its applicability in actual engineering scenarios [18]. To overcome this limitation, Dwyer-Joyce et al. proposed an ultrasonic reflection method to directly measure the actual hydrodynamic oil films in mechanical components, successfully circumventing the material transparency constraint [19,20]. Building on this approach, Zhu et al. employed an ultrasonic sensor array to measure the actual oil-film thickness of O-rings under a medium pressure of 20 N [21]. In addition, Zhaoxiuxu utilized FBG sensors to measure the dynamic contact stress of Y-rings at a pressure of 5 MPa [22]. Nevertheless, current testing methodologies have yet to achieve the simultaneous measurement of oil-film thickness and contact stress under the highly dynamic sealing conditions of high-pressure aircraft actuators.
Fundamentally, performance prediction of reciprocating seals constitutes a multivariable, highly nonlinear time-series forecasting problem under limited sample conditions. While traditional regression models possess certain applicability with small samples, they struggle to characterize the long-term dependencies and periodic hysteresis of variables, such as oil-film thickness, during reciprocating motion, and they fail to effectively model the nonlinear coupling among multiple variables. Likewise, feedforward neural networks, although possessing nonlinear mapping capabilities, lack an internal memory mechanism for historical states, making them prone to memory decay and insufficient stability in complex time-series predictions [23]. Beyond feedforward architectures, other sequence models also exhibit inherent limitations for this task: the gated recurrent unit (GRU) merges the input and forget gates into a single update gate, which weakens its capacity to separately regulate the retention and update of historical information under the periodic hysteresis of reciprocating motion, while convolutional sequence models, such as temporal convolutional networks (TCN), are constrained by a finite receptive field determined by the kernel size and network depth, so that covering the full temporal span of a reciprocating stroke requires a deeper network and a larger parameter budget. The Transformer, in turn, must train its attention parameters on large-scale data, which conflicts with the limited sample conditions available in seal tests, and it does not exploit the sequential inductive bias that recurrent architectures provide. Conversely, the LSTM network, through its unique gating structures (input, forget, and output gates), effectively resolves the vanishing gradient problem inherent in RNNs for long-sequence modeling [24,25]. It can capture the historical evolution trajectories of sealing states and is well-suited for multivariable inputs and multi-step prediction scenarios [26,27]. Furthermore, LSTM can synchronously learn the nonlinear coupling relationships between variables, such as oil-film thickness and contact stress, under limited sample conditions. This capability provides continuous and stable data support for accurate leakage calculation and state evaluation.
Based on the aforementioned analysis, this study selects LSTM as the core algorithmic model for predicting the dynamic seal leakage of piston rods in aircraft high-pressure actuators. First, a reciprocating seal test rig is designed and constructed. By integrating ultrasonic detection, FBG sensing, and mechanical force sensors, the simultaneous and precise measurement of critical parameters, including oil-film thickness, contact stress, and friction force, under high-pressure conditions is achieved. Second, an LSTM-based oil-film-thickness prediction model is developed; once engineering accuracy requirements are satisfied, the leakage rate is mathematically derived to obtain reliable leakage prediction results. Furthermore, by comprehensively considering the impact of friction on sealing performance, a dynamic friction prediction model is established to realize the precise forecasting of time-varying frictional characteristics at the sealing contact interface. The proposed models provide crucial theoretical and data support for evaluating seal wear status and issuing early warnings for leakage risks.
The remainder of this paper is organized as follows. Section 2 describes the test-rig configuration, sensor calibration procedures, experimental schemes, and the detailed architecture and implementation of the LSTM-based prediction models under Materials and Methods. Section 3 presents the multi-sensor monitoring results of friction force, contact stress, interfacial temperature and oil-film thickness, as well as the prediction performance of the established models. Section 4 discusses the strengths, physical insights and inherent limitations of the proposed data-driven approach by comparing it with conventional physical sealing models. Finally, Section 5 summarizes the key findings and outlines future research directions for data-driven sealing-performance prediction in aviation hydraulic actuators.
2. Materials and Methods
2.1. Experimental Design
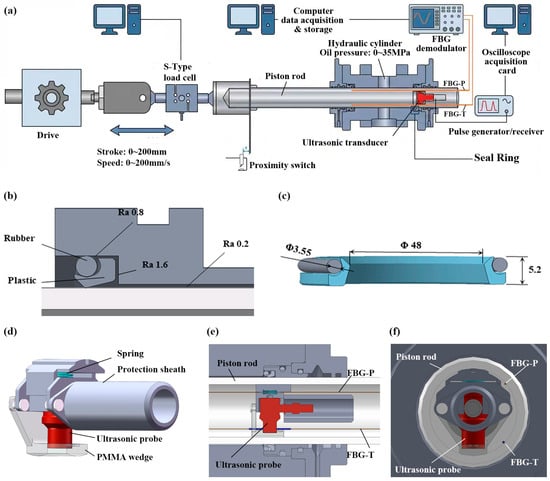
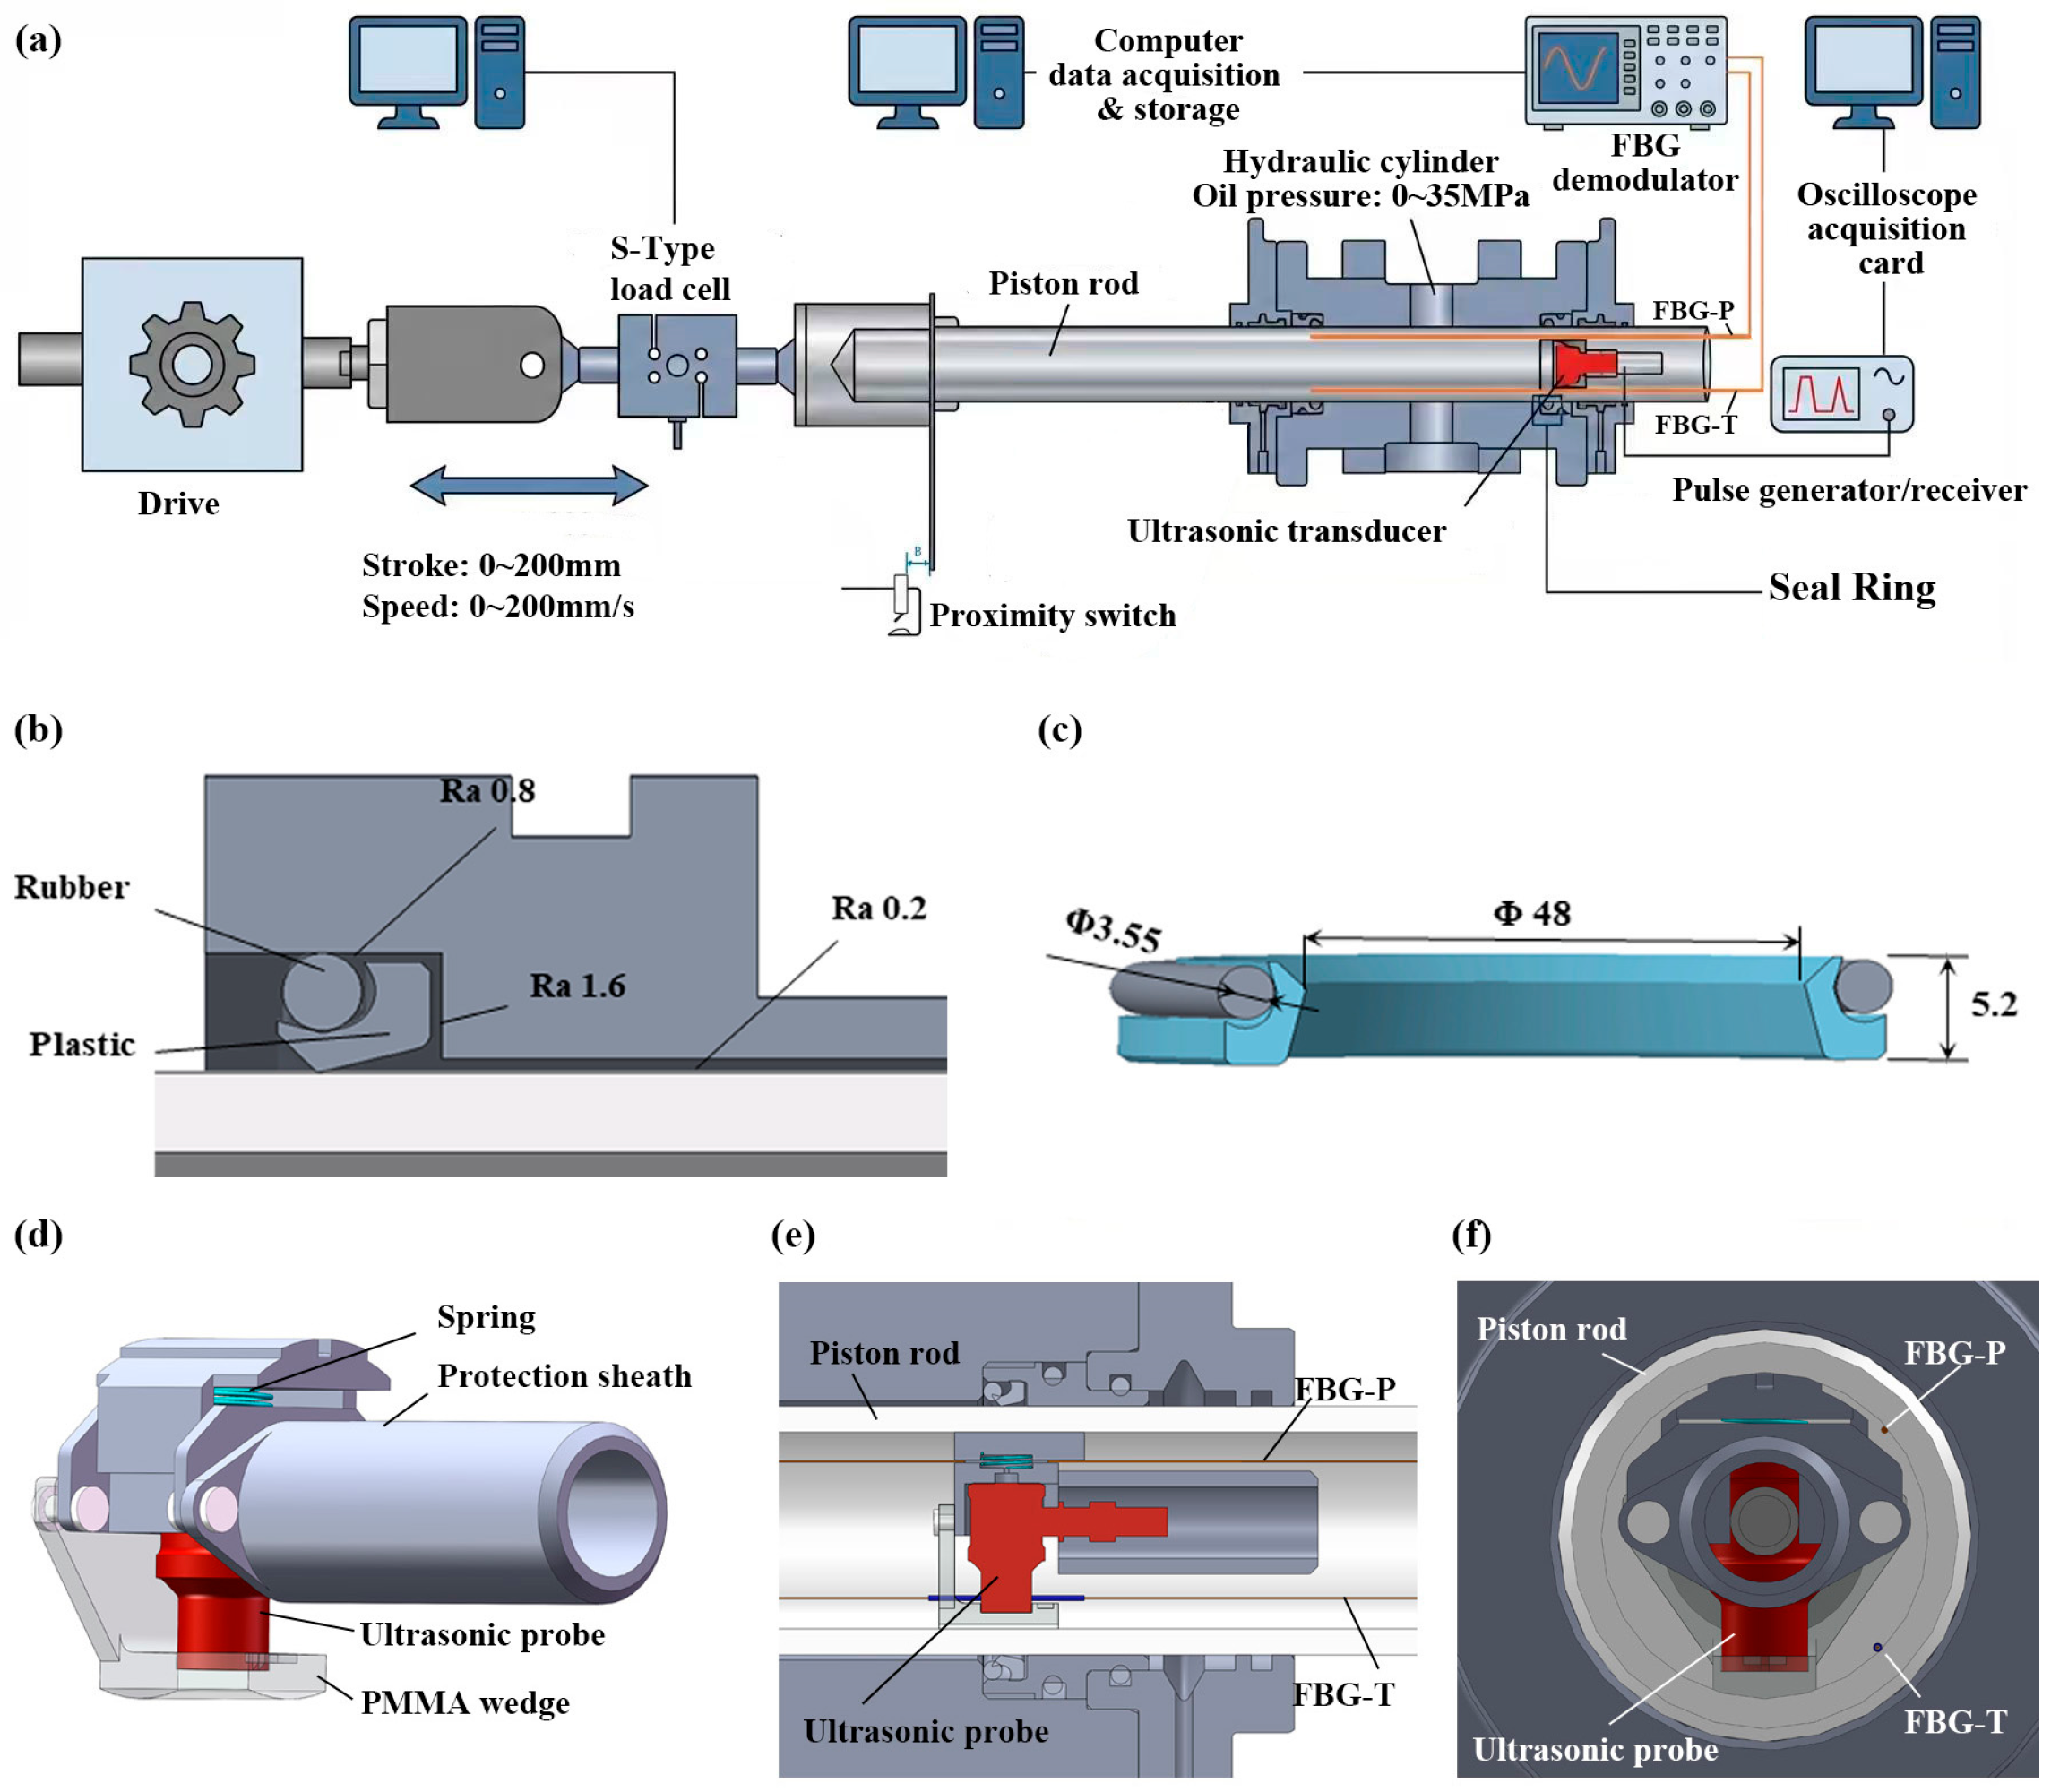
The test apparatus utilized in this study is illustrated in Figure 1a. The piston rod of the test cylinder has an outer diameter of 48 mm. Both the piston rod and the outer cylinder are fabricated from 30CrMnSiNiA steel with a chrome-plated surface treatment. The reciprocating motion is mechanically driven, featuring an adjustable stroke length of 0–200 mm, an operating hydraulic pressure ranging from 0 to 35 MPa, and a reciprocating velocity of 0–200 mm/s. VL-type rubber–plastic composite seal rings are employed as the test specimens, in which the rubber part is made of nitrile rubber (NBR) and the plastic part is made of modified polytetrafluoroethylene (PTFE). The sealing groove and the surface roughness parameters of the mating tribo-pair are presented in Figure 1b, where the groove bottom and the groove side wall have surface roughness values of Ra 0.8 μm and Ra 1.6 μm, respectively, and the mating chrome-plated piston-rod surface has a surface roughness of Ra 0.2 μm. The structural schematic and the main structural parameters of the tested VL seal are given in Figure 1c, i.e., an inner diameter of Φ48 mm, a cross-sectional height of 5.2 mm and a rubber energizer diameter of Φ3.55 mm. An S-type tension-compression load cell (AiLogics, Gardner, MA, USA) with a sensitivity of 0.6 N is mounted between the mechanical drive structure and the piston rod for friction force measurement. FBG sensors (National Engineering Research Center of Fiber Optic Sensing Technology and Networks, Wuhan University of Technology, Wuhan, Hubei, China) are utilized to characterize the dynamic contact stress, which are adhered to the inner wall of the piston rod and arranged to cover the full working stroke of the tested seal rings. Furthermore, an ultrasonic transducer (Guangdong Goworld Co., Ltd., Shantou, Guangdong, China) is embedded inside the piston rod to monitor oil-film thickness at the sealing interface. The detailed structure of the ultrasonic transducer is presented in Figure 1c. Additionally, Figure 1d illustrates the positional relationships among the FBG sensors, ultrasonic transducer, seal ring, and piston rod, while Figure 1d serves as the corresponding side view of Figure 1e. A proximity switch is deployed as an external trigger to capture ultrasonic signals precisely when the transducer passes through the sealing contact region. Overall, the designed test rig facilitates the flexible regulation of the reciprocating velocity, stroke, and pressure while concurrently enabling the real-time acquisition and storage of experimental data [28].
Figure 1.
(a) Reciprocating seal test rig; (b) structural schematic of the sealing groove; (c) main structural parameters of the tested VL seal; (d) detailed structure of the ultrasonic transducer; (e) the positional relationships among the FBG sensors, ultrasonic transducer, seal ring, and piston rod; (f) side view of the positional relationships.
2.2. Contact Stress Monitoring
2.2.1. Calibration
FBG sensors are employed to acquire the contact strain and temperature signals at the sealing interface. The measurement principle relies on the periodic variation in the refractive index within the optical fiber, which induces shifts in specific reflected wavelengths, thereby enabling the derivation of the sealing contact strain [29]. Two FBG sensors are axially embedded along the inner wall of the piston rod. Specifically, FBG pressure sensor (FBG-P) is directly bonded to the inner wall of the piston rod, rendering it sensitive to both temperature variations and mechanical strain. Conversely, FBG temperature sensor (FBG-T) is encapsulated within a capillary steel tube prior to attachment, isolating it from mechanical deformation and subjecting it solely to temperature fluctuations. During the reciprocating motion of the piston rod, frictional heating elevates the local temperature, and the strain varies dynamically as the rod traverses the seal contact zone. Consequently, FBG-T serves a dual purpose. It monitors the internal temperature variations of the piston rod in real time and provides critical temperature compensation for the strain-sensitive FBG-P sensor. This configuration ensures that FBG-P accurately reflects the isolated strain variations within the sealing contact region. Prior to dynamic testing, FBG-P requires both temperature and stress calibration, whereas FBG-T necessitates only temperature calibration. The temperature calibration procedure involves elevating the temperature from 30 °C to 150 °C. The center wavelength shift of the FBG sensors is recorded at 10 °C intervals. Subsequently, the experimental data are processed using a linear fitting method, where the temperature variation is plotted on the horizontal axis and the corresponding center wavelength shift is plotted on the vertical axis. For the stress calibration, the temperature-calibrated piston rod is assembled into the test cylinder. Hydraulic pressure is then incrementally applied to the cylinder. Within the pressure range of 0 MPa to 40 MPa, the center wavelength shift of FBG-P is recorded at intervals of 5 MPa. A linear fitting method is similarly applied to these data, utilizing the applied pressure variation as the horizontal axis and the resulting center wavelength shift as the vertical axis. The comprehensive linear fitting results are summarized in Table 1.
Table 1.
Calibration of FBG-P and FBG-T.
2.2.2. Stress Calculation Algorithm Based on FBG
The variation in the center wavelength of the FBG originates from the concurrent influence of the axial strain exerted on the optical fiber and the fluctuations in ambient temperature. Consequently, this total wavelength shift can be mathematically expressed as a linear superposition of a strain-dependent component and a temperature-dependent component [30]:
where Δλ(t) = λ(t) − λ0 is the wavelength variation relative to the reference state, λ0 is the baseline wavelength at the reference state (0 MPa and reference temperature T0), Δε(t) is the axial strain variation of the optical fiber, ΔT(t) = T(t) − T0 is the temperature variation, Pe is the photoelastic coefficient, αf is the thermal expansion coefficient of the optical fiber, and ξ is the thermo-optic coefficient, which is determined by the basic material of the optical fiber.
For brevity, the strain sensitivity coefficient and temperature sensitivity coefficient are denoted as: kε = (1 − Pe)λ0, kT = (αf + ξ) λ0.
Thus, Equation (1) can be rewritten as:
The wavelength variation of FBG-T is only affected by temperature, and its calibration relationship is given by:
where is the temperature sensitivity coefficient of FBG-T and is the fitting constant obtained from the temperature calibration test of FBG-T in Section 2.2.1.
The temperature variation can be derived from Equation (3):
As FBG-P is simultaneously affected by temperature and contact stress, the wavelength component induced by temperature variation can be expressed as:
where is the temperature sensitivity coefficient of FBG-P and is the fitting constant obtained from the temperature calibration test of FBG-P in Section 2.2.1.
Substituting Equation (4) into Equation (5) yields the temperature-induced wavelength variation of FBG-P.
The measured wavelength of FBG-P contains both temperature and strain components. Subtracting the wavelength component induced by temperature variation yields the wavelength variation caused solely by contact stress :
where is the baseline wavelength at the reference state (0 MPa and reference temperature T0) of FBG-P.
Within the elastic working range, the wavelength variation of the FBG exhibits an approximately linear relationship with the applied stress or contact stress, which can be obtained through calibration tests:
where is the stress sensitivity coefficient of FBG-P.
Combining Equations (6) and (7) yields the calculation formula for contact stress:
Substituting Equation (5) into Equation (8), the contact stress can be finally expressed in a form determined solely by the measured wavelength and calibration parameters:
Substituting the parameters obtained from the calibration test in Section 2.2.1 (Table 1) into Equation (9) yields:
where is the measured wavelength of FBG-P and is the measured wavelength variation of FBG-T.
2.3. Oil-Film-Thickness Monitoring
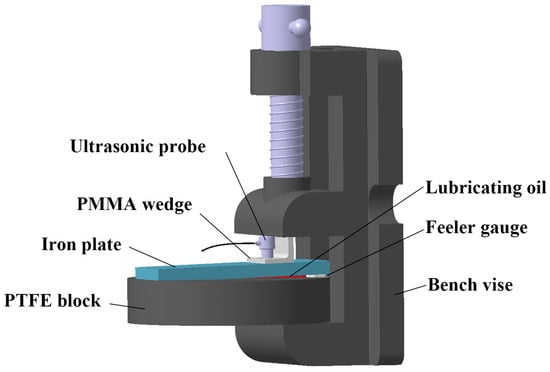
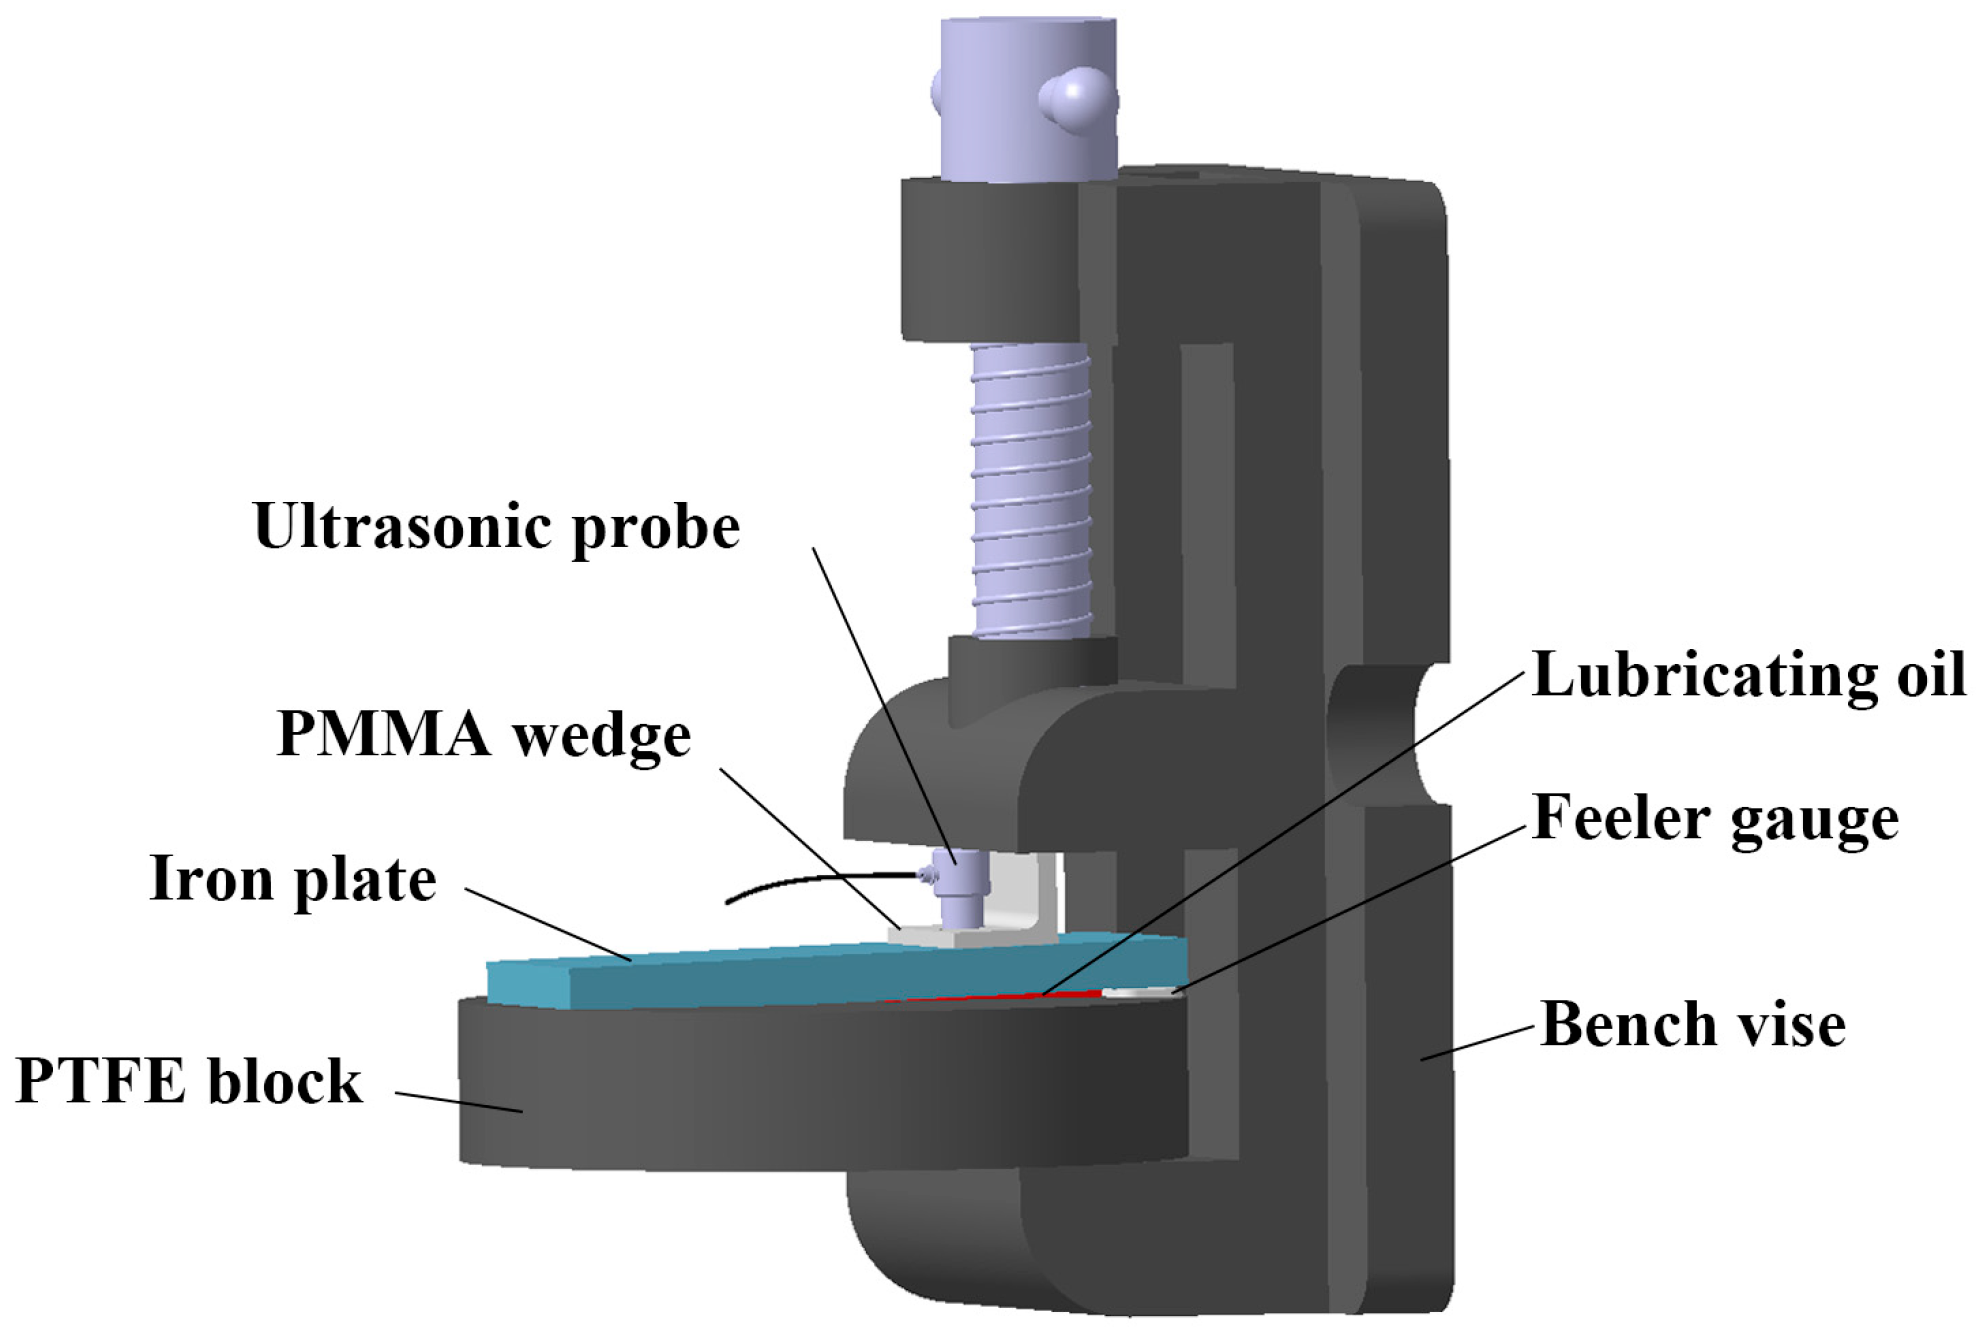
Ultrasonic detection technology is employed to measure the oil-film thickness at the sealing contact interface. The ultrasonic monitoring system comprises an ultrasonic transducer, a pulse generator, an oscilloscope acquisition card, and a dedicated computer. As depicted in Figure 1, the test probe of the ultrasonic transducer is mounted flush against the inner wall of the piston rod. The opposite end is connected to an ultrasonic pulser-receiver to acquire electrical signals for subsequent measurement and data collection at the target location. To achieve precise measurement and calibration of the oil-film thickness, a wedge-structured calibration apparatus was constructed. This setup is utilized to record acoustic signals under both dry and oil-lubricated conditions. As illustrated in Figure 2, the primary components of this apparatus include the ultrasonic pulser-receiver, the ultrasonic probe, a polymethyl methacrylate (PMMA) wedge, an iron plate, lubricating oil, a feeler gauge, a bench vise, and a polytetrafluoroethylene (PTFE) block. The PTFE block serves as the foundation. A feeler gauge and an iron plate are positioned on top of it. Together, these elements form a wedge-shaped clearance with a continuously varying thickness to accommodate the target oil film. The specific oil-film thickness at the probe location can be analytically determined utilizing the known dimensions of the feeler gauge.
Figure 2.
Calibration setup of the oil-film-thickness measurement.
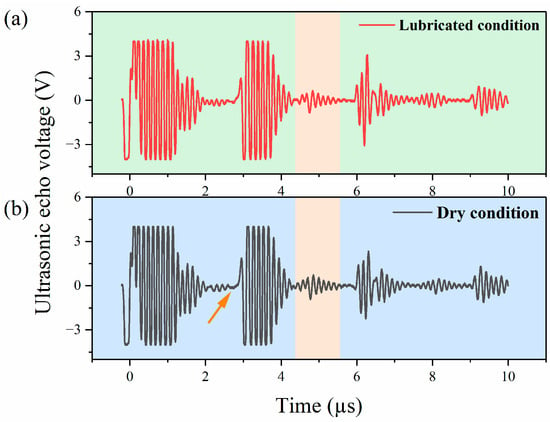
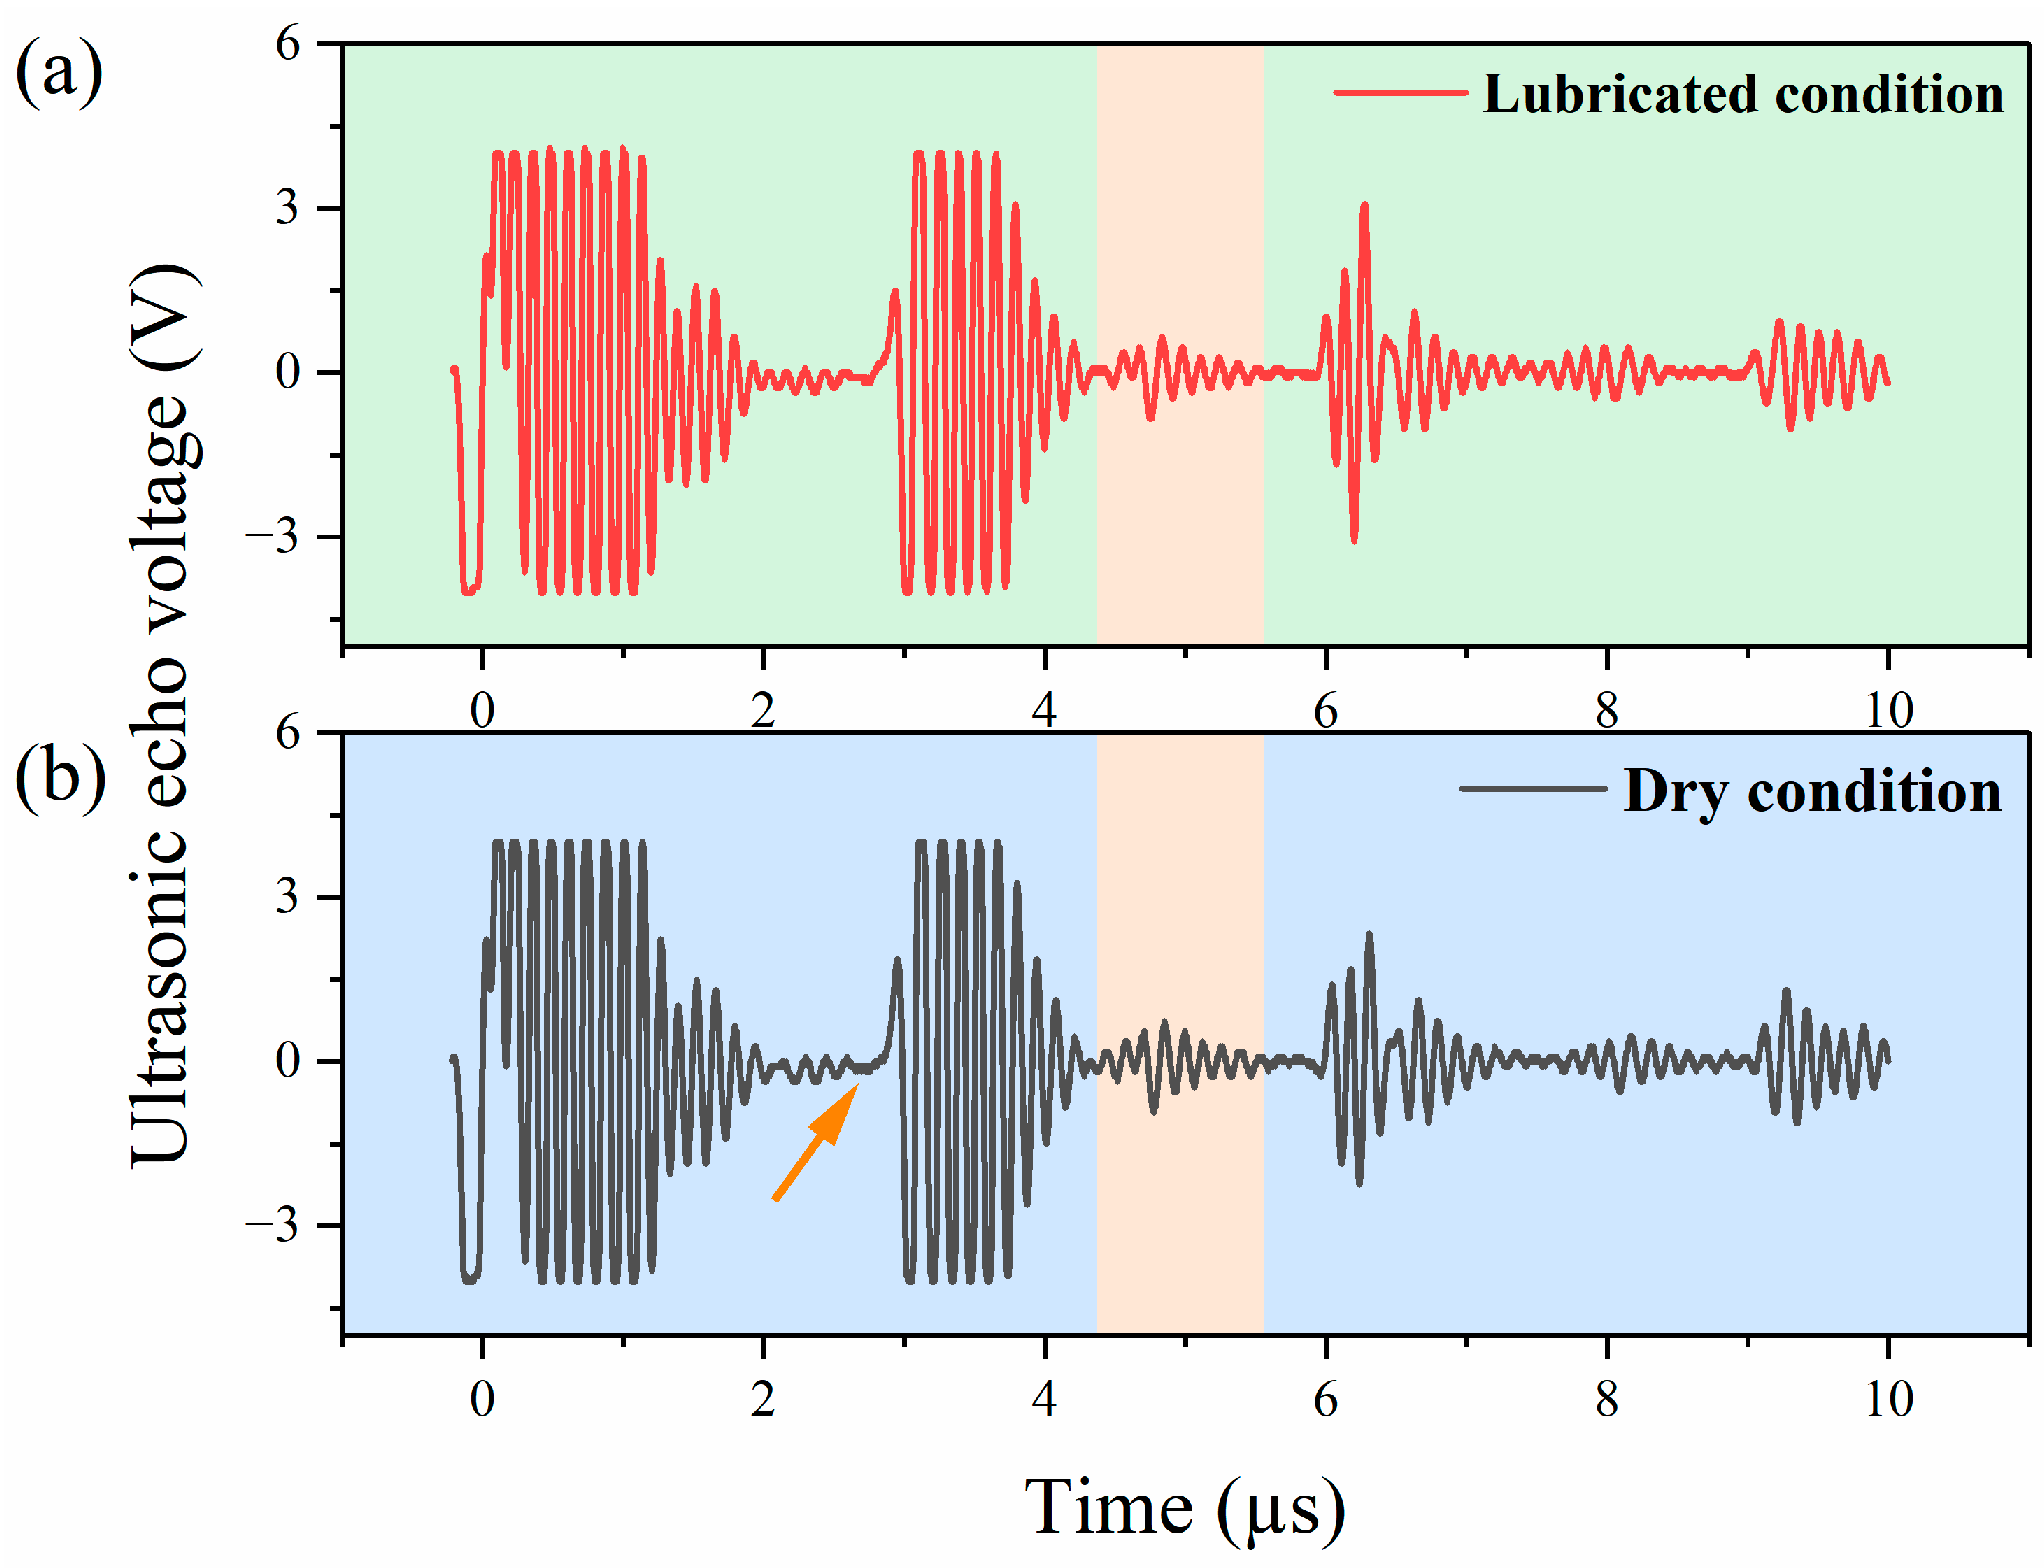
Measurement under dry condition (reference signal): The ultrasonic probe is thoroughly coupled to the PMMA wedge utilizing a liquid couplant. Subsequently, the couplant is applied to the upper surface of the iron plate. The PMMA wedge is then pressed firmly against the iron plate to ensure complete interfacial contact. The reference signal reflected from the iron–air interface is properly acquired and stored. The obtained reference signal is illustrated in Figure 3. The propagation path of the ultrasonic wave proceeds sequentially through the probe, the PMMA wedge, the iron plate, the air gap, and the PTFE block. Based on the measured dimensional parameters and the known acoustic velocities, the theoretical time of flight (TOF) for the ultrasonic waves propagating through the respective materials is calculated and summarized in Table 2. As observed in Figure 3b, the initial prominent echo occurs at approximately 2.900 µs, indicated by an arrow. This observation exhibits excellent agreement with the calculated round-trip travel time in the PMMA wedge, which is 2.93 µs. Furthermore, the signal captured within the 4.3–4.6 µs interval aligns with the theoretical arrival time of the iron plate bottom echo (4.571 µs) detailed in Table 2. Therefore, the signal enclosed by the orange area is definitively identified as the bottom echo reflected from the internal interface of the iron plate. Given the extreme thinness of the oil film, the acoustic echo generated from the opposite boundary of the oil film undergoes interference with this bottom echo rather than forming an independently resolvable waveform. Consequently, this specific signal segment constitutes the combined reflection echo of the oil-film layer.
Figure 3.
(a) The ultrasonic signal under lubricated condition; (b) the ultrasonic signal under dry condition.
Table 2.
TOF of ultrasonic waves propagating through corresponding materials.
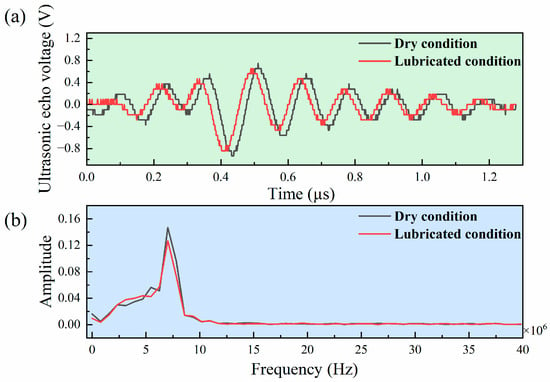
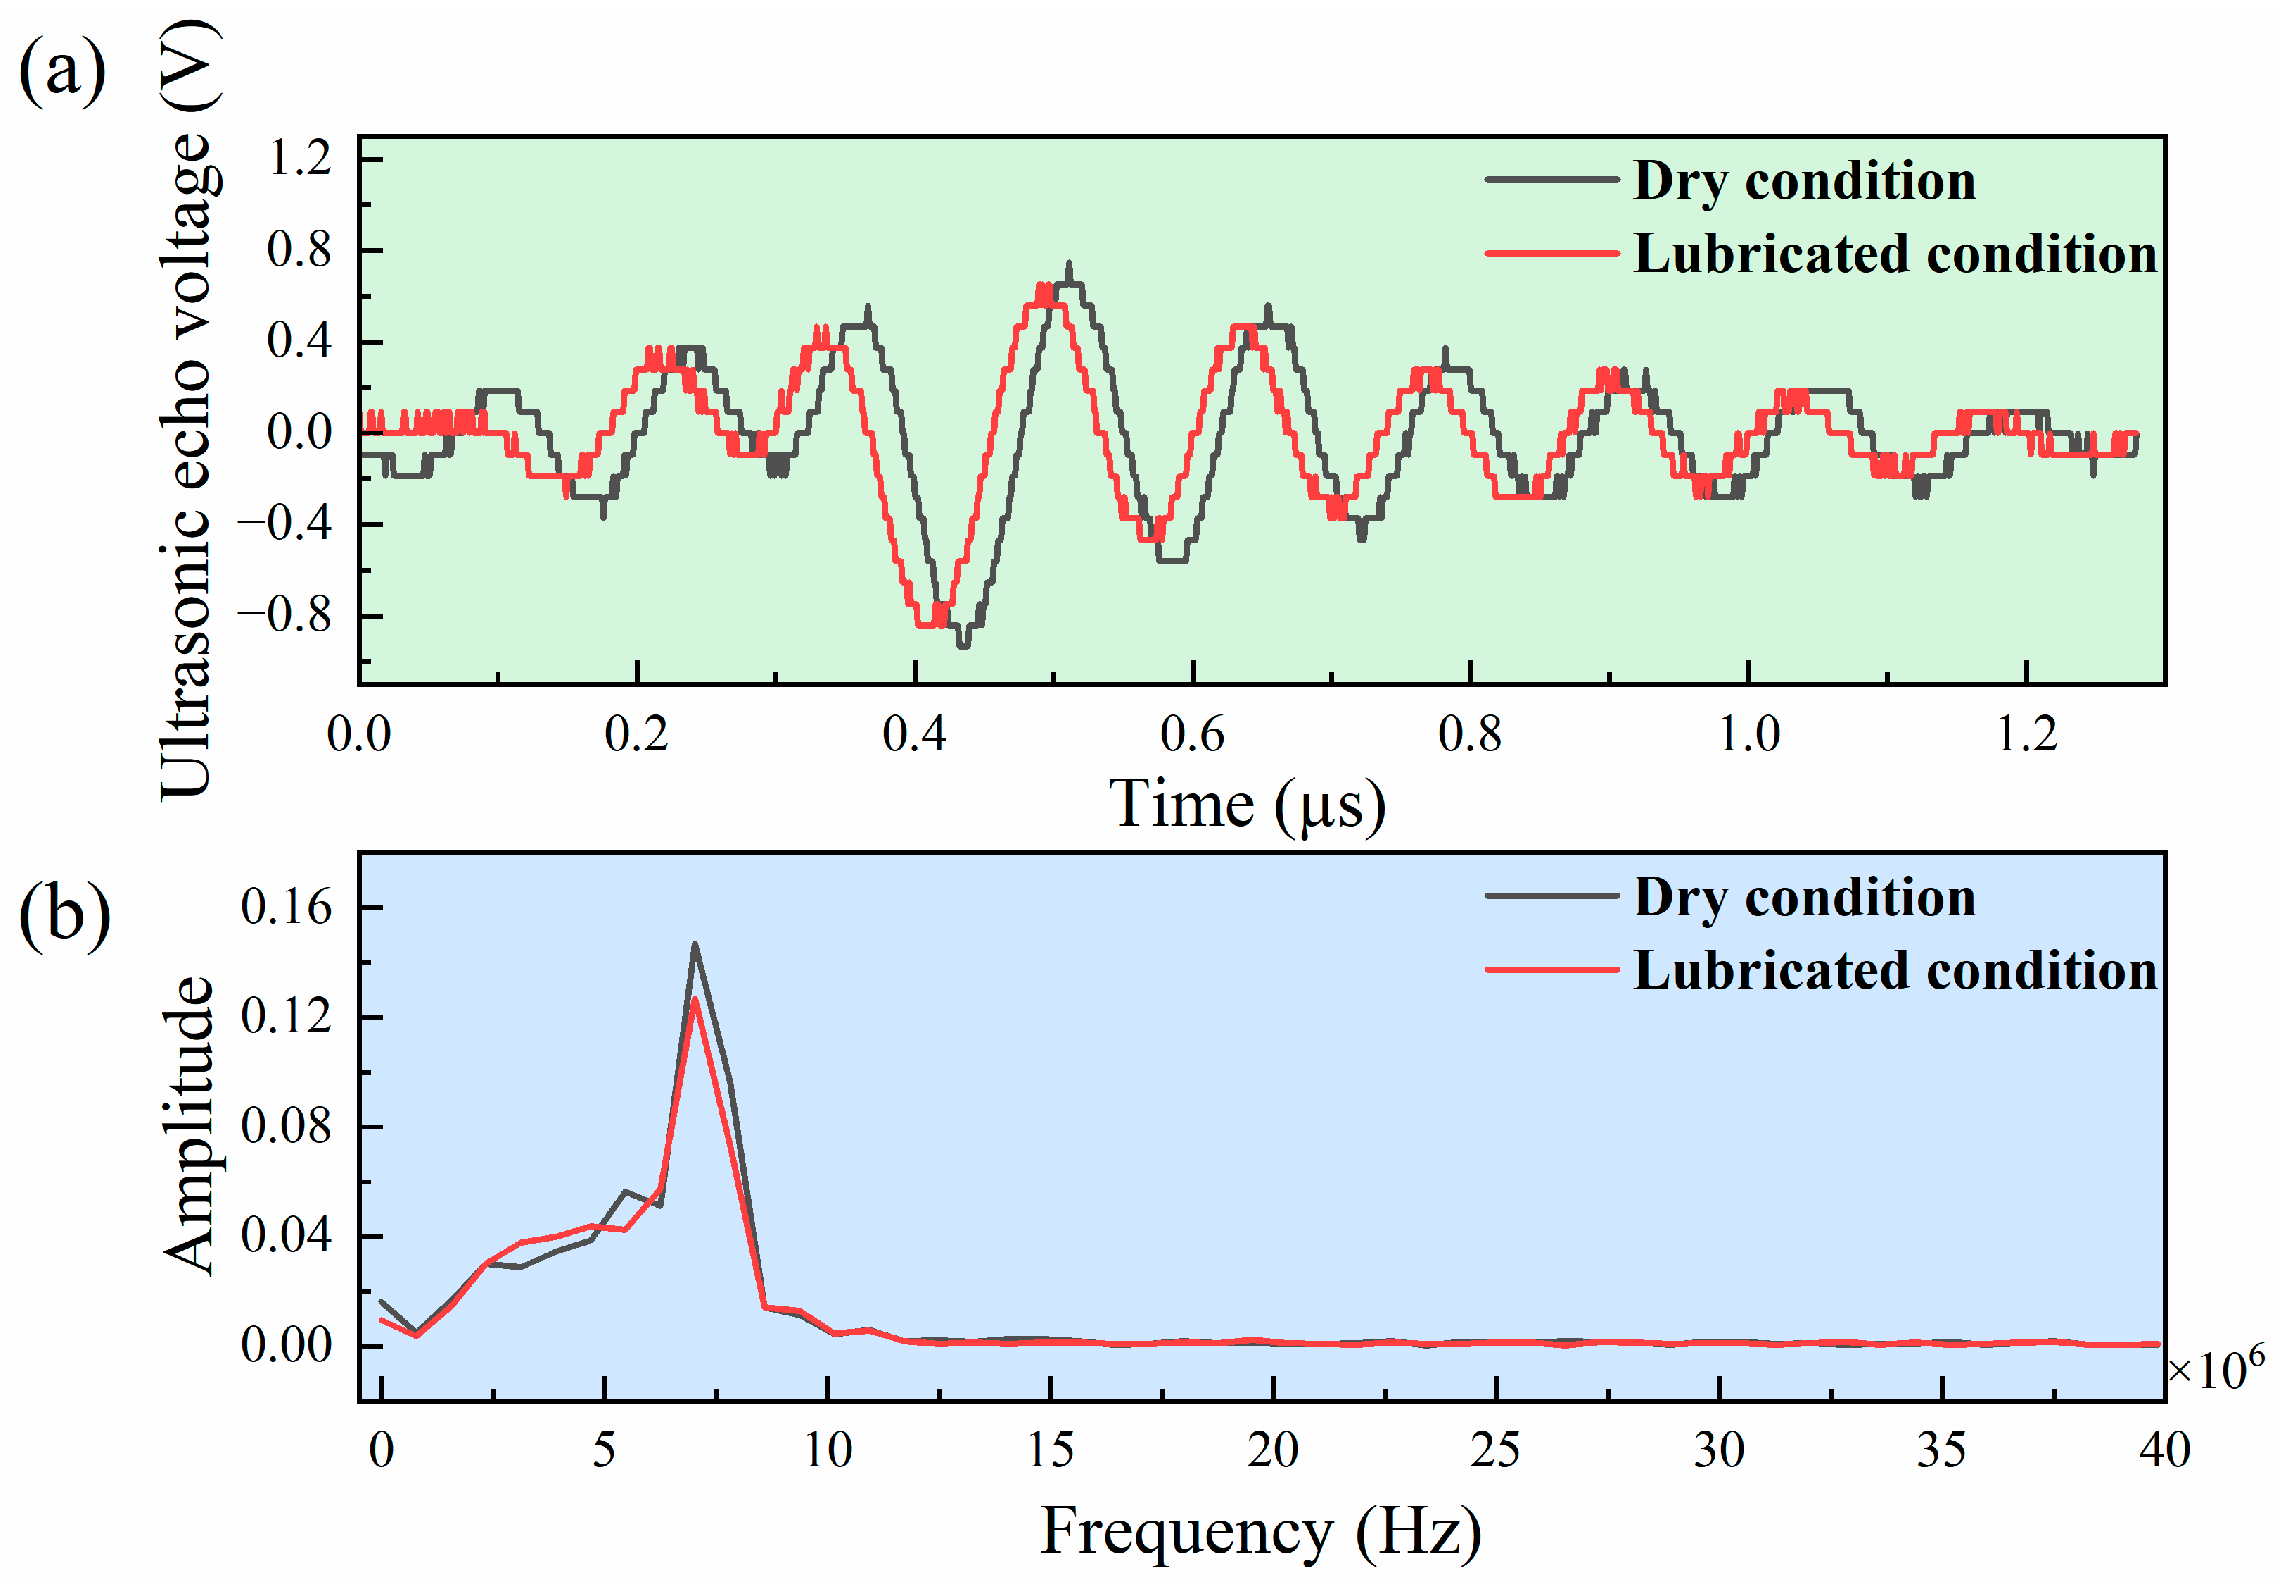
Measurement under lubricated condition: The target lubricating oil is introduced into the clearance between the PTFE block and the iron plate within the previously described dry calibration apparatus. The ultrasonic signal reflected from the bottom surface of the iron plate, after traversing the oil film, is subsequently acquired and stored. This acquired waveform is illustrated in Figure 3a. The specific echo segments corresponding to both the dry and lubricated conditions (the signals with background colors) are extracted for further computational analysis. A comparative time-domain plot of these two distinct waveforms is presented in Figure 4a. A fast Fourier transform (FFT) is then applied to both waveform segments to facilitate frequency-domain analysis. The resulting frequency-domain comparison is depicted in Figure 4b. This visual representation clearly demonstrates that the spectral amplitude of the dry signal is significantly higher than that of the lubricated signal. The reflection coefficient is further determined as 0.86515 from the amplitude ratio in the frequency domain between the lubricated and dry conditions. The center frequency of the acquired acoustic signal is identified as 7.030 MHz. Ultimately, the oil-film thickness is analytically calculated based on the specific reflection coefficient corresponding to this center frequency. The final determined thickness value is 7.008 μm. During the calibration procedure, the theoretical oil-film thickness at the designated mark directly beneath the probe was analytically calculated to be 7.500 μm based on the triangular wedge geometry. A comparison between this theoretical reference and the ultrasonically computed value of 7.008 μm yielded a relative error of 6.56%. Furthermore, calibration experiments at different temperatures were carried out at the same position. The oil-film thicknesses were calibrated at 20 °C, 40 °C, and 60 °C respectively, and the calibration results are listed in Table 3. The results show that the relative error of ultrasonic measurement of oil-film thickness is within 8.21%, indicating that the proposed testing method features high measurement accuracy and stability.
Figure 4.
(a) The comparative time-domain plots of dry and lubricated conditions; (b) the comparative frequency-domain plots of dry and lubricated conditions.
Table 3.
Measurement results of oil-film thickness at three temperatures.
2.4. Dynamic Monitoring Experiment
The dynamic monitoring experiment is designed to simultaneously measure the contact stress, oil-film thickness, temperature, and friction force under active reciprocating sealing conditions. The synchronous data acquisition architecture for the FBG sensor signals and the ultrasonic signals is illustrated in Figure 1. For this specific test, the cylinder was filled with 15# aviation hydraulic fluid. The established operational parameters included a stroke length of 200 mm and a uniform reciprocating velocity of 200 mm/s. To ensure spatial consistency, the FBG sensors and the ultrasonic transducer probe are precisely aligned at the identical axial position on the piston rod. As this specific instrumented location enters the sealing contact zone during both the extension and retraction strokes, a proximity switch is activated. This activation triggers the recording of the ultrasonic signals to compute the localized oil-film thickness. Concurrently, FBG-P and FBG-T capture their respective characteristic wavelength shifts. These recorded shifts are then utilized to independently calculate the dynamic contact strain and the localized temperature within the sealing interface.
The monitoring tests were performed on VL-type seals with three distinct compression levels (14.04%, 16.69%, and 19.36%) under two hydraulic pressure conditions: 21 MPa and 35 MPa.
2.5. Performance Prediction Algorithm
2.5.1. Architectural Design of the Friction Prediction Algorithm
The friction prediction in this study focuses specifically on the hydraulic reciprocating dynamic seals. It aims to forecast the maximum friction force (F_max) during the motion of the seal at a precise frame level. By meticulously integrating multi-sensor monitoring data with time-series features, a highly accurate dynamic prediction of the friction force at the sealing contact interface is achieved. This predictive capability provides fundamental mechanical metric support for evaluating the wear status of the seal and issuing early warnings regarding potential leakage risks.
The dataset for the predictive model is derived from three core data sources from the ultrasonic, fiber optic sensors, and tension-compression load cell. Following rigorous standardization procedures, a unified dataset is constructed.
The engineered feature system is categorized into two primary groups: dynamic time-series features and static operating condition features. This constitutes a comprehensive total of 38 input feature dimensions.
Dynamic Time-Series Features (36 dimensions): These comprise friction statistical features (e.g., F_ptp, F_std, F_min), oil-film-thickness features (film_out, film_in), and ultrasonic signal characteristics (e.g., pulse factors for the extension and retraction strokes, wavelet d3 statistical metrics, and Hilbert–Huang Transform instantaneous parameters).
Static Operating Condition Features (2 dimensions): These include the defined seal configuration parameters and the target hydraulic fluid pressure.
Time-Series Correlation Features: To further enhance the memory capacity of the model regarding historical states, time-series correlation features are introduced.
Data preprocessing: Missing values and distinct outliers are entirely filtered out. All numerical features are uniformly converted to floating-point data types to ensure strict data consistency. The dataset is hierarchically sorted by operating condition identifier, cycle index, and frame index. This sequential sorting guarantees the absolute integrity of the time-series logic.
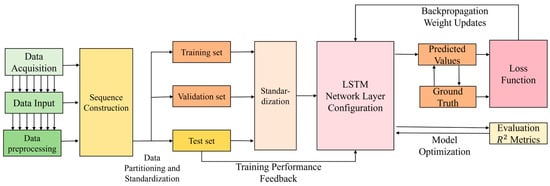
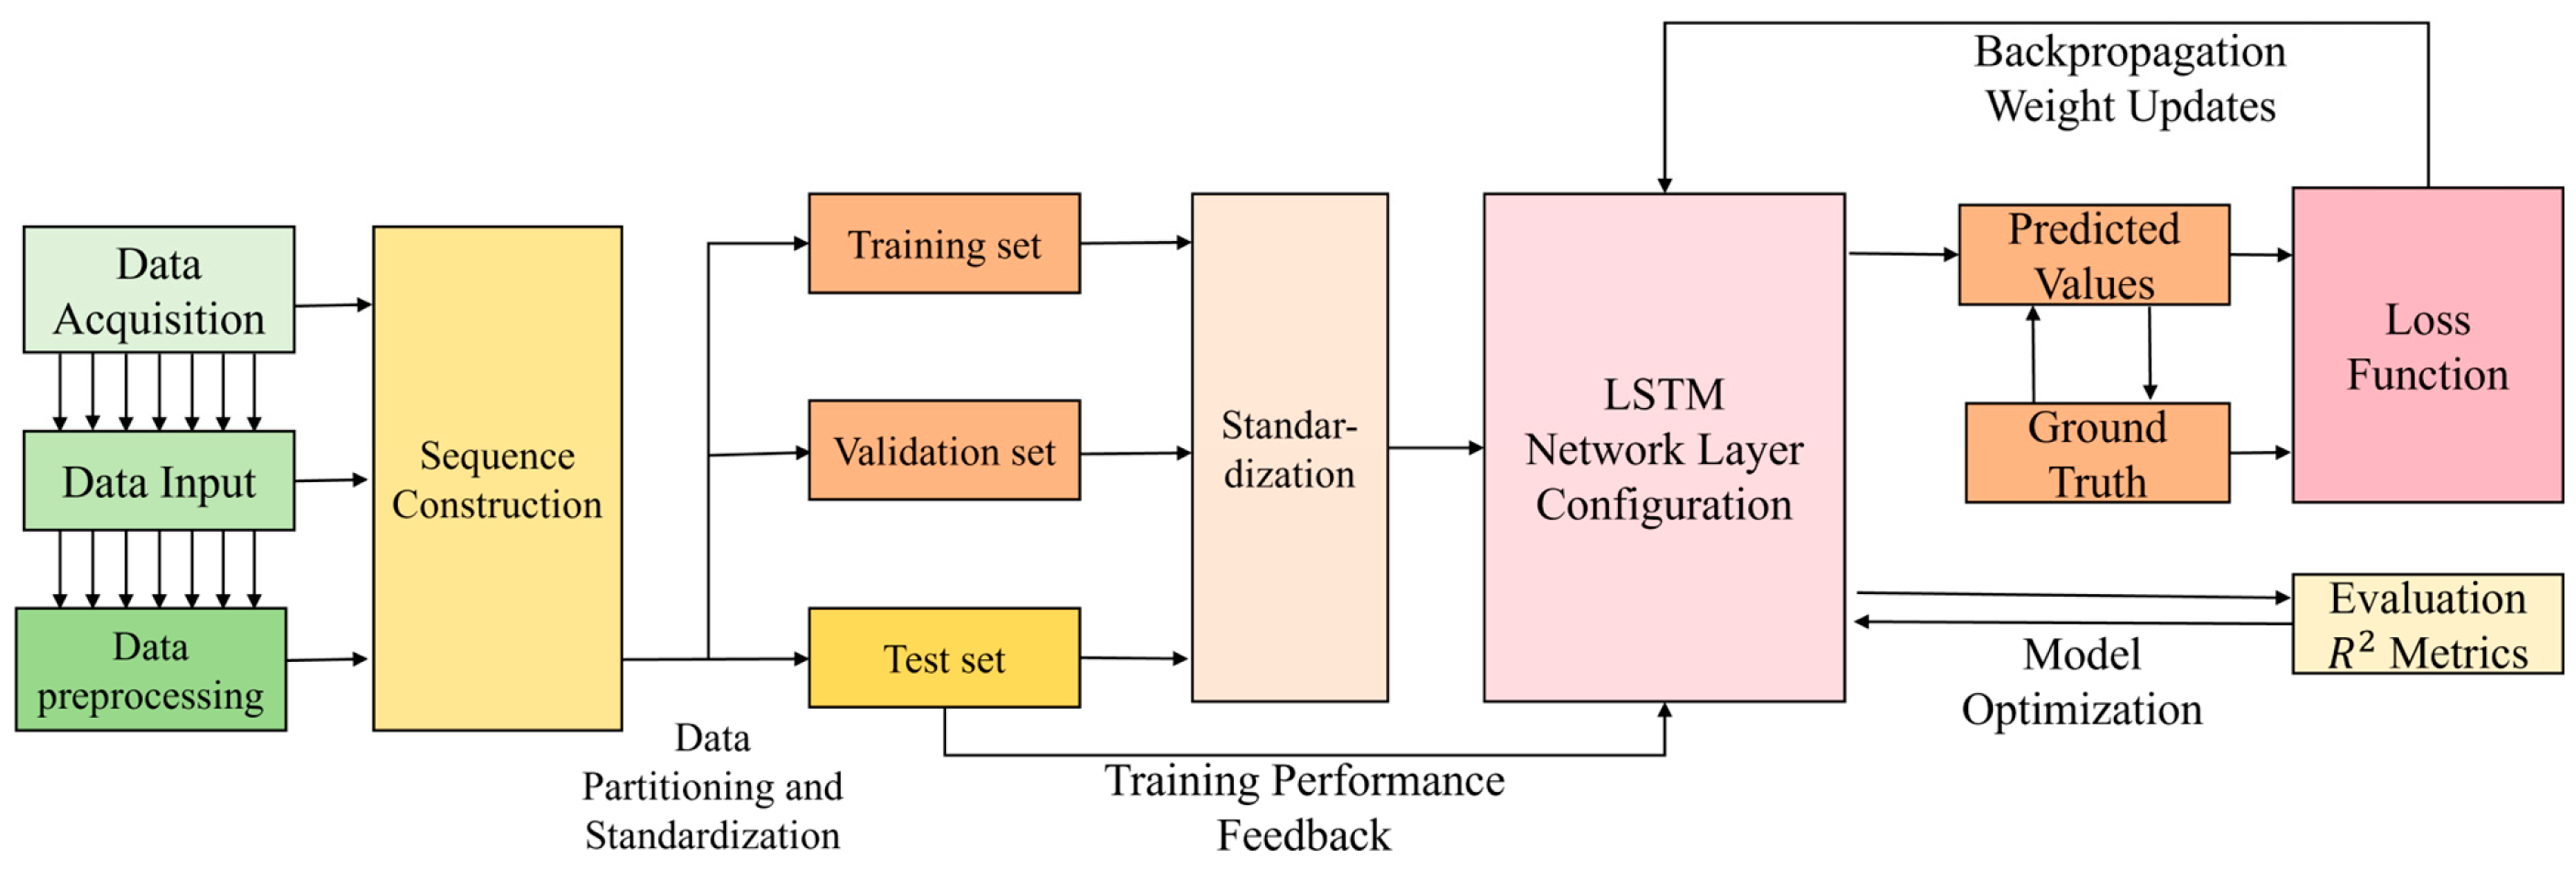
Sequence Construction: A sliding window methodology is employed to construct the time-series samples. The lookback window is explicitly set to 100, and the prediction horizon is set to 1. Consequently, the model predicts the maximum friction force of the immediate next frame based strictly on the engineered features of the preceding 100 frame-level samples.
Data Partitioning and Standardization: The assembled dataset is chronologically partitioned into a training set, a validation set, and a test set utilizing a 7:1:2 ratio. The input features are normalized to the [0, 1] interval utilizing a MinMaxScaler algorithm. Concurrently, the target variable is standardized using a StandardScaler to prevent dimensional discrepancies from adversely affecting the model training process.
The proposed model adopts a deep neural architecture comprising two sequential LSTM layers, followed by fully connected layers. The specific topological configurations are detailed below.
- (1)
- Input Layer: This initial layer receives three-dimensional time-series data defined by the total number of samples, a lookback window of 100, and a feature dimensionality of 38. This directly corresponds to the 38-dimensional features spanning 100 consecutive data frames.
- (2)
- First LSTM Layer: This layer is configured with 128 neurons and is explicitly set to return the full temporal sequence. A dropout rate of 0.2 is strategically integrated to mitigate potential overfitting.
- (3)
- Second LSTM Layer: This subsequent hidden layer consists of 64 neurons and is configured to only return the final output of the sequence. A dropout rate of 0.2 is applied to further enhance the overall generalization capability of the network.
- (4)
- Fully Connected Layer: A dense layer comprising 64 neurons is utilized, employing the rectified linear unit (ReLU) activation function to execute nonlinear mapping.
- (5)
- Output Layer: The final layer contains a single neuron designed to output the predicted frame-level maximum friction force.
- (6)
- Optimizer and Loss Function: The Adam optimizer is selected to iteratively update the network weights. The Huber loss function, configured with a delta parameter of 0.5, is employed to significantly improve the robustness of the model against unexpected data outliers.
- (7)
- Training Epochs: The maximum number of training epochs is set to 300. An EarlyStopping strategy is actively utilized by monitoring the validation loss. If no measurable improvement is observed for 20 consecutive epochs, the training is automatically halted, and the optimal model weights are restored.
- (8)
- Batch Size: A batch size of 32 is selected to optimally balance computational training efficiency and model convergence stability.
- (9)
- Regularization Measures: Partial neurons are randomly deactivated through the specified dropout layers during each forward pass. This action strictly prevents the model from overly fitting the specific noise present within the training dataset.
2.5.2. Implementation of the Friction Prediction Model
The model training process adopts an iterative optimization paradigm. The maximum number of training epochs is set to 300, and the batch size is configured to 32. These specific hyperparameters are selected to optimally balance computational training efficiency and convergence stability. To rigorously prevent overfitting, an EarlyStopping strategy is incorporated into the training workflow. This specific mechanism actively monitors the validation loss metric. If the validation loss exhibits no measurable improvement for 20 consecutive epochs, the training process is automatically terminated.
Throughout the training phase, the calculated loss values progressively decrease and eventually reach a stable plateau. The evolutionary trend of the training loss remains highly consistent with that of the validation loss. The complete absence of both overfitting and underfitting phenomena demonstrates that the proposed model has sufficiently and robustly learned the underlying nonlinear data patterns. The empirical data utilized for this final evaluation is derived directly from the reciprocating seal monitoring experiments. During these physical tests, critical parameters including contact pressure, localized temperature, and oil-film thickness were systematically recorded at intervals of 50 reciprocating cycles. Comprehensive data collection was executed for VL-type seals featuring three distinct compression levels across three hydraulic pressure conditions of 2 MPa, 21 MPa, and 35 MPa.
2.5.3. Architectural Design of the Oil-Film-Thickness Prediction Algorithm
The prediction procedure for the leakage of hydraulic reciprocating dynamic seals encompasses several critical sequential phases. These phases consist of monitoring data acquisition, data preprocessing, feature construction, oil-film-thickness prediction, prediction accuracy evaluation, the ultimate calculation, and output of the leakage volume. Initially, an oil-film-thickness prediction model is developed utilizing the multimodal monitoring data acquired from the ultrasonic and fiber optic sensors. Provided that the prediction accuracy of this specific model satisfies the established engineering thresholds, the dynamic leakage rate is subsequently computed to yield reliable oil-film-thickness prediction results. Furthermore, an accuracy assessment and feedback mechanism is intrinsically incorporated into the workflow to facilitate the continuous iterative optimization of the prediction model. The comprehensive operational flowchart of this algorithmic architecture is illustrated in Figure 5.
Figure 5.
Architectural design of the oil-film-thickness prediction algorithm.
The oil-film-thickness prediction algorithm utilizes the contact stress and temperature data, acquired continuously from the FBG sensors, as the core input features. Furthermore, the historical oil-film thickness is incorporated as a sequential feature. This integration significantly enhances the representational capacity of the model regarding the temporal evolution of the oil-film thickness. The constructed LSTM model adopts a fundamental architecture comprising two sequential LSTM layers, followed by a fully connected layer. The specific topological configurations are detailed below.
- (1)
- Input layer: This initial layer receives time-series data characterized by a sequence length of 10 and a feature dimensionality of 6. This structural configuration precisely corresponds to a six-dimensional feature set spanning ten consecutive operational cycles.
- (2)
- First LSTM layer: This layer is configured with 64 neurons and is explicitly set to return the full sequence. A dropout rate of 0.2 is strategically integrated into this layer to effectively mitigate potential overfitting during the training phase.
- (3)
- Second LSTM layer: This subsequent hidden layer consists of 32 neurons and is configured to only return the final output of the sequence. Similarly, a dropout rate of 0.2 is applied to further enhance the generalization capability of the network.
- (4)
- Output layer: A fully connected dense layer containing exactly two neurons is utilized as the final stage. This specific design facilitates a dual output, corresponding to the simultaneously predicted oil-film-thickness values for both the extension and retraction strokes.
- (5)
- Optimizer and loss function: The adaptive moment estimation (Adam) optimizer is employed to iteratively update the network weights. Concurrently, the mean squared error (MSE) is selected as the designated loss function to accurately quantify the discrepancy between the predicted and actual values.
2.5.4. Implementation of the Oil-Film-Thickness Prediction Model
Based on the empirical results obtained from the reciprocating seal monitoring experiments, the contact stress, temperature, and oil-film-thickness data were recorded at intervals of 50 reciprocating cycles. Comprehensive data collection was executed for VL-type composite seals featuring three distinct compression levels across three discrete hydraulic pressure conditions: 2 MPa, 21 MPa, and 35 MPa. This extensive monitoring dataset was subsequently utilized to train and validate the machine learning model. The primary objective of this model is to accurately forecast the evolutionary trend of the oil-film thickness over the forthcoming several operational cycles. Consequently, this predictive capability provides intelligent decision support for monitoring the real-time operational status of the seal and proactively evaluating potential leakage risks. The specific details of the experimental matrix are systematically summarized in Table 4. To construct a robust predictive model, the measured oil-film thicknesses during both the extension and retraction strokes were selected as fundamental variables. These variables were then integrated with the FBG-monitored contact stress, the FBG-monitored interfacial temperature, the friction force of extension stroke, and the friction force of retraction stroke. Together, these parameters constitute a comprehensive six-dimensional input feature vector. To rigorously prevent data leakage during the model evaluation phase, the acquired time-series dataset was chronologically partitioned into a training set, a validation set, and a test set according to a strict 6:2:2 ratio.
Table 4.
The details of the experimental matrix.
The MinMaxScaler algorithm is employed to normalize both the input features (X) and the target variables (y) into the [0, 1] interval. This standardization procedure effectively eliminates the adverse effects of dimensional discrepancies on the model training process. To ensure strict data consistency and entirely prevent data leakage, the normalization parameters derived exclusively from the training set are subsequently applied to the testing set and the final prediction phases. Regarding sequence generation, a sliding window encompassing 10 consecutive cycles is utilized as the input sequence to forecast the oil-film thickness of the immediately subsequent cycle. This formatting step generates the requisite three-dimensional input data structure for the LSTM network, which is defined by the number of samples, the sequence length, and the feature dimensionality. During the model optimization process, the batch size is configured to 16, and the total number of training epochs is set to 500. Furthermore, a validation set is utilized to continuously monitor the generalization capability of the model in real time.
3. Results
3.1. Friction Force Monitoring Results
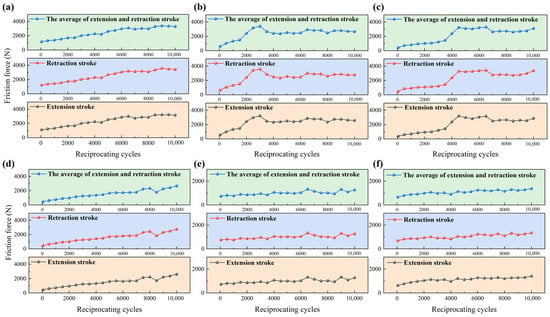
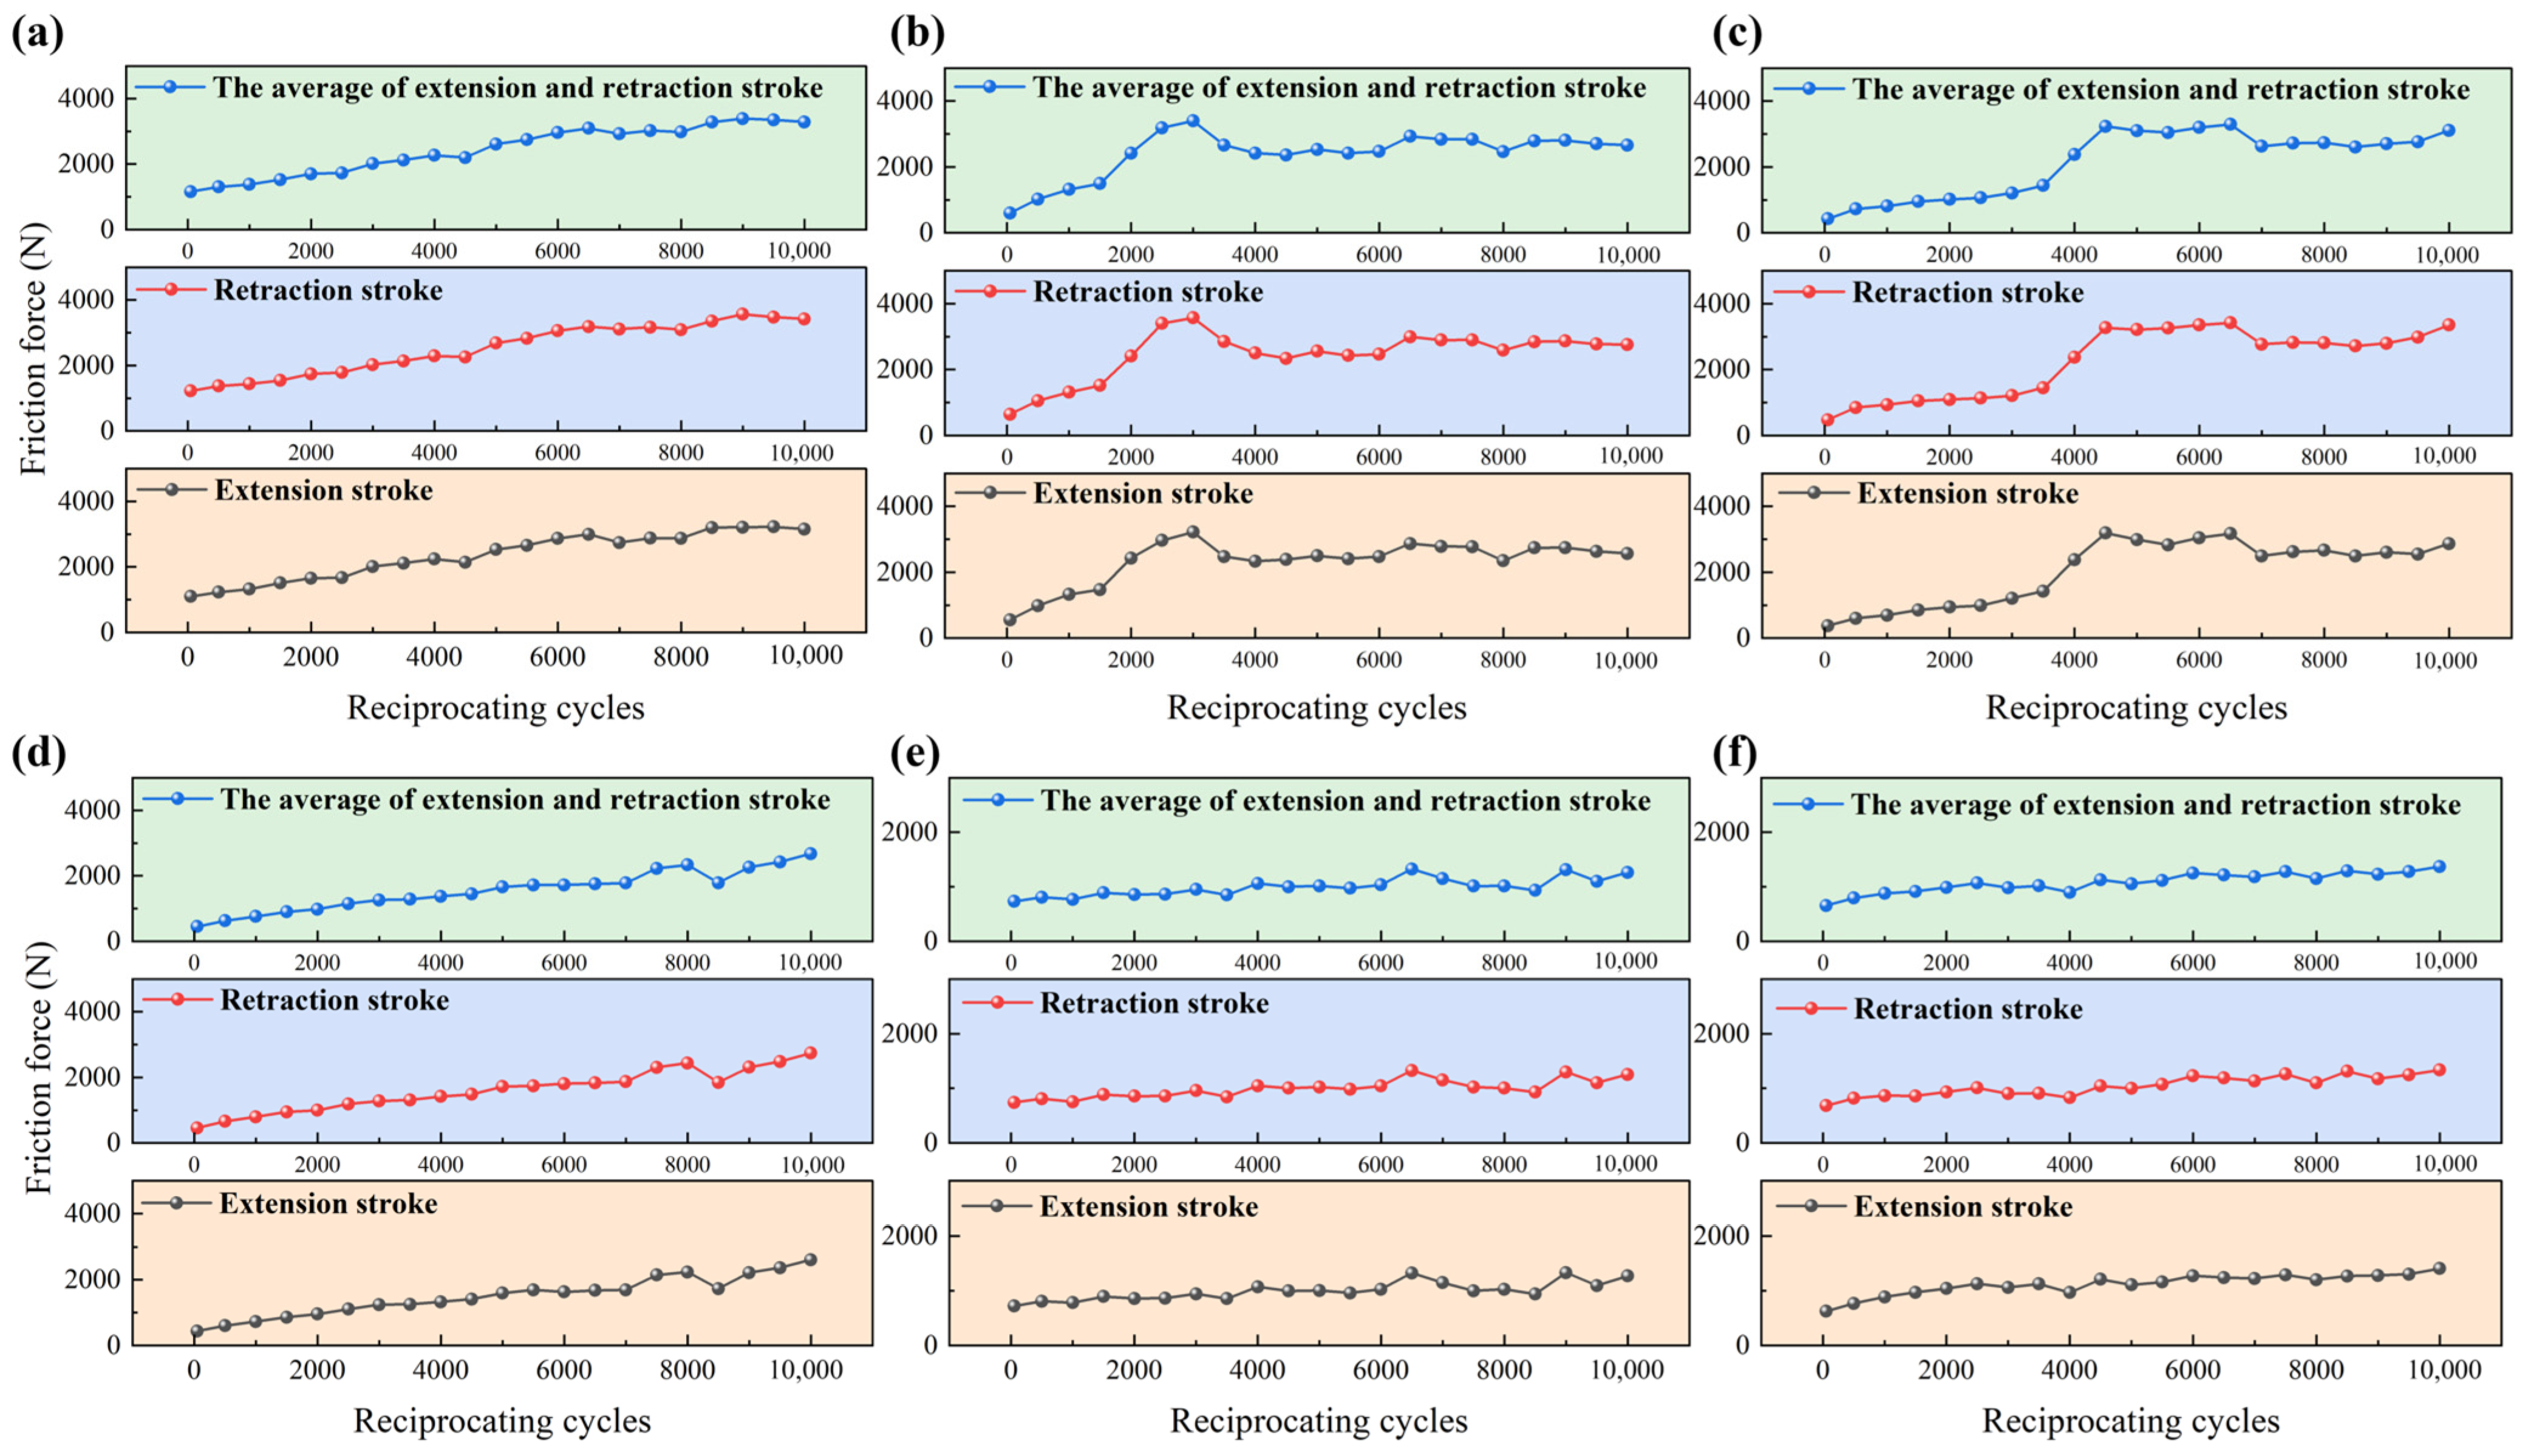
Figure 6 presents the continuous friction force monitoring data acquired over a duration of 10,000 reciprocating cycles. The tests were performed on VL-type seals with three distinct compression levels (14.04%, 16.69%, and 19.36%) under two hydraulic pressure conditions: 21 MPa and 35 MPa. The outward movement of the piston rod from the hydraulic cylinder is defined as the extension stroke, during which a portion of the fluid is entrained. The retraction of the piston rod from the outside back into the cylinder is defined as the retraction stroke, during which the fluid entrained in the extension stroke can flow back into the hydraulic cylinder. Figure 6 indicates that, under three compression levels, the friction force of the seal during both retraction and extension strokes increases significantly with the rise in oil pressure. All test results show that the friction force exhibits a gradual increasing trend with the increase in reciprocating cycles, which is attributed to the seal wear and interface deterioration caused by continuous high-pressure reciprocating motion. Notably, under 35 MPa, the friction force at the initial stage decreases gradually as the seal compression level increases. The initial friction forces of the seals with compression levels of 14.04%, 16.69%, and 19.36% are 1159.09 N, 597.82 N, and 425.12 N, respectively. However, at the final stage of 10,000 reciprocating cycles, the increment of friction force increases significantly with the rise in compression level. The increments of final friction force for the seals with compression levels of 14.04%, 16.69%, and 19.36% are 183.55%, 345.55%, and 631.62%, respectively (Figure 6a–c). These results reveal that higher compression levels lead to more severe friction growth under prolonged high-pressure reciprocating operation, providing important guidance for the compression design and service life prediction of VL-type seals. It should be noted that each curve in Figure 6 originates from an individual endurance test run under corresponding operating condition. The observed evolutionary trends represent the degradation characteristics captured within each single experiment, and statistical significance across multiple independent replicate specimens has not been verified. Stochastic interfacial wear and material-transfer phenomena may introduce sample-to-sample deviation. Generalization of these quantitative increment values to other seal specimens needs to be treated with caution.
Figure 6.
Friction force of high-pressure reciprocating-seal tests: (a) 35 MPa, 14.04% seal compression; (b) 35 MPa, 16.69% seal compression; (c) 35 MPa, 19.36% seal compression; (d) 21 MPa, 14.04% seal compression; (e) 21 MPa, 16.69% seal compression; (f) 21 MPa, 19.36% seal compression.
3.2. Contact Stress and Interfacial Temperature Results
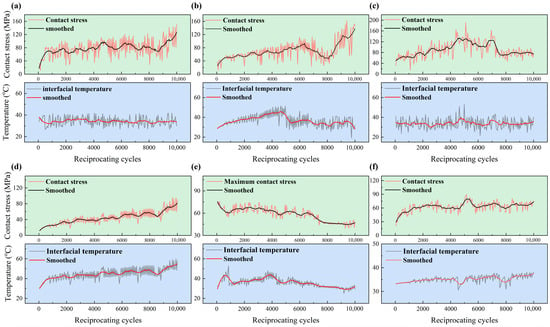
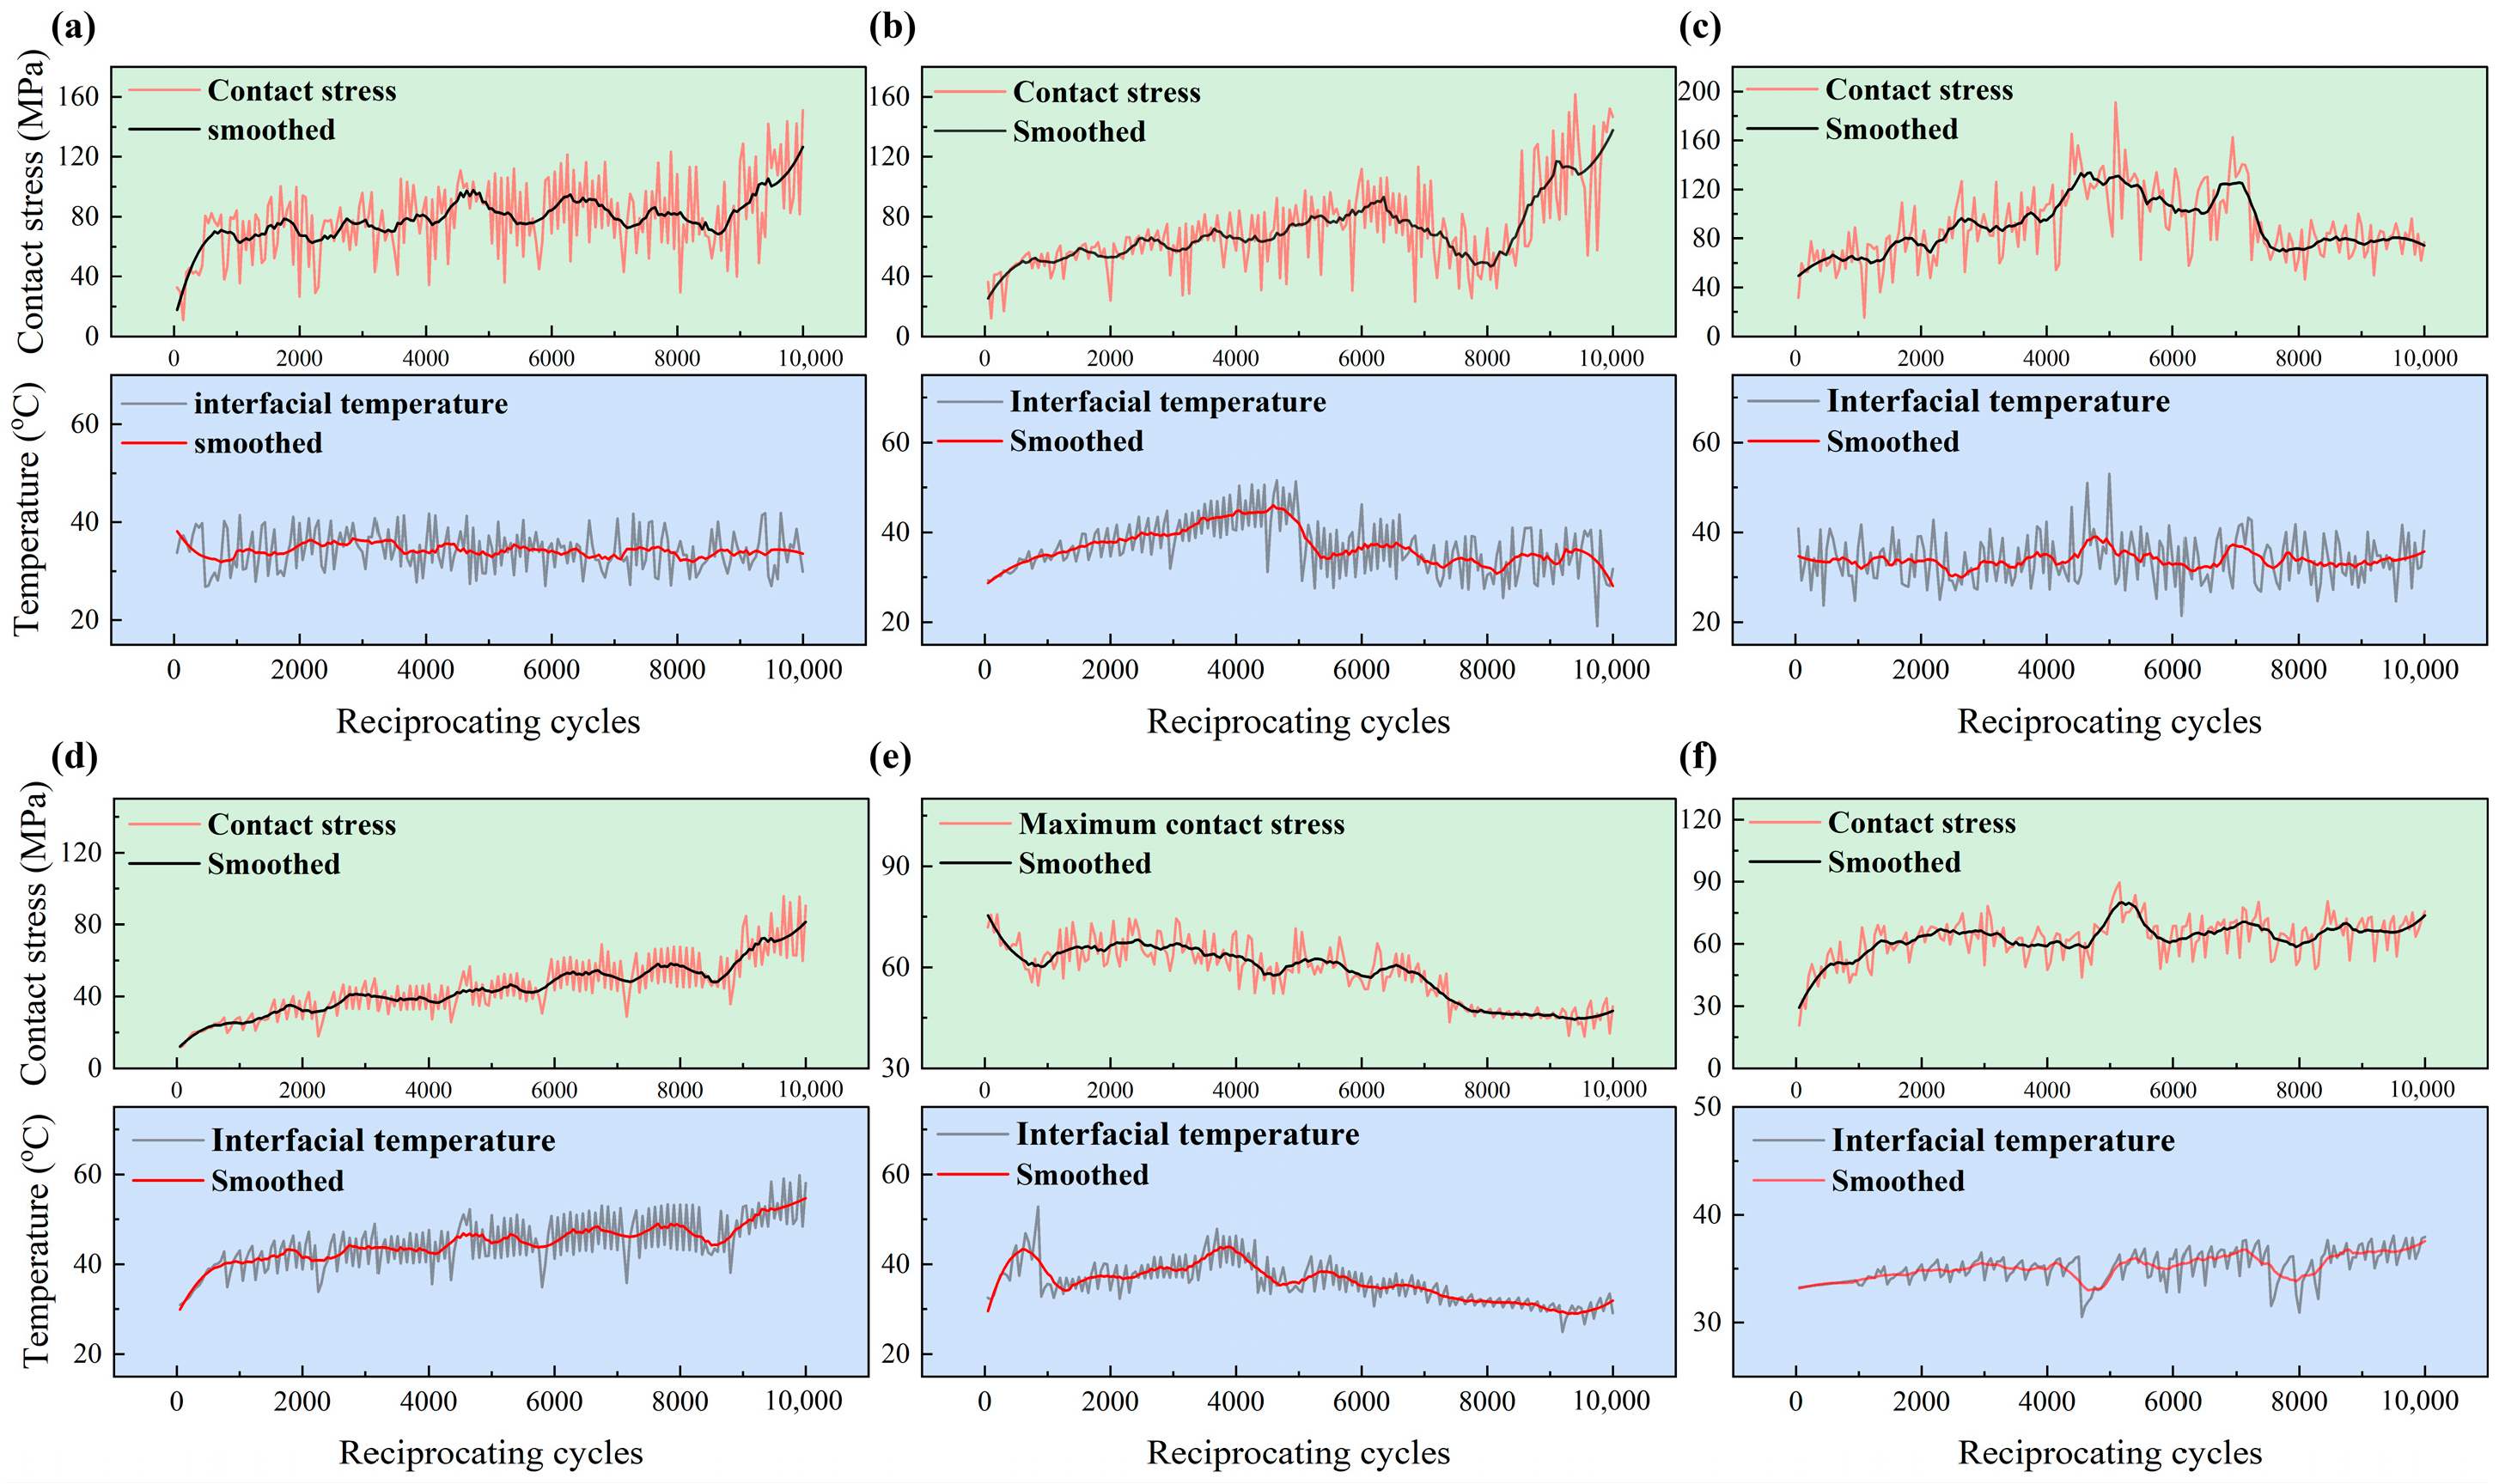
Figure 7 shows that the transient variations in the contact stress and the interfacial temperature exhibit a strong correlation with the evolutionary trend of the friction force. Throughout the extended testing period, all of these critical performance parameters demonstrate a gradual upward trajectory. Under 35 MPa, the maximum contact stress of the seals with compression levels of 14.04%, 16.69%, and 19.36% are 151.04 MPa, 161.64 MPa, and 190.99 MPa, respectively. Under 35 MPa, for the seal with a compression level of 14.04%, the contact stress shows a continuous increasing trend as reciprocating cycles increase. However, for seals with compression levels of 16.69% and 19.36%, the contact stress increases initially, followed by a decrease with an increasing number of reciprocating cycles, and resumes its upward trend after 6350 cycles. Under continuous high-pressure reciprocating motion, seals with excessive compression experience lip wear, which reduces the actual compression level. Nevertheless, interface deterioration caused by wear leads to a sustained increase in contact stress after a certain degree of reduction. This phenomenon elucidates the coupled mechanism of lip wear, interface degradation, and contact stress evolution in highly compressed seals under long-term high-pressure reciprocating conditions, which is critical for understanding the friction-induced failure behavior of hydraulic rod seals.
Figure 7.
Maximum contact stress and the interfacial temperature of high-pressure reciprocating-seal tests: (a) 35 MPa, 14.04% seal compression; (b) 35 MPa, 16.69% seal compression; (c) 35 MPa, 19.36% seal compression; (d) 21 MPa, 14.04% seal compression; (e) 21 MPa, 16.69% seal compression; (f) 21 MPa, 19.36% seal compression.
The considerable cycle-driven scatter of contact stress and interfacial temperature shown in Figure 7 arises from combined factors including sensor measurement noise, stochastic lip wear, interfacial material transfer and micro-localized frictional events. These results are obtained from single-run endurance tests for each condition; repeatability and statistical significance across multiple replicate samples remain to be further confirmed in future repeated experiments.
3.3. Oil-Film-Thickness Monitoring Results
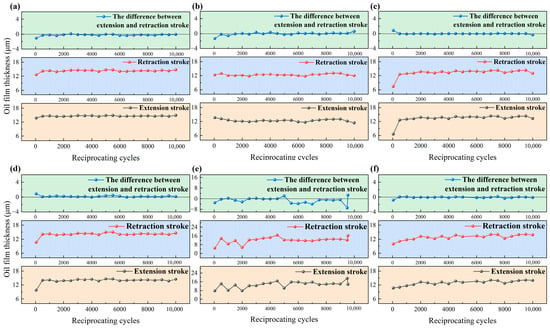
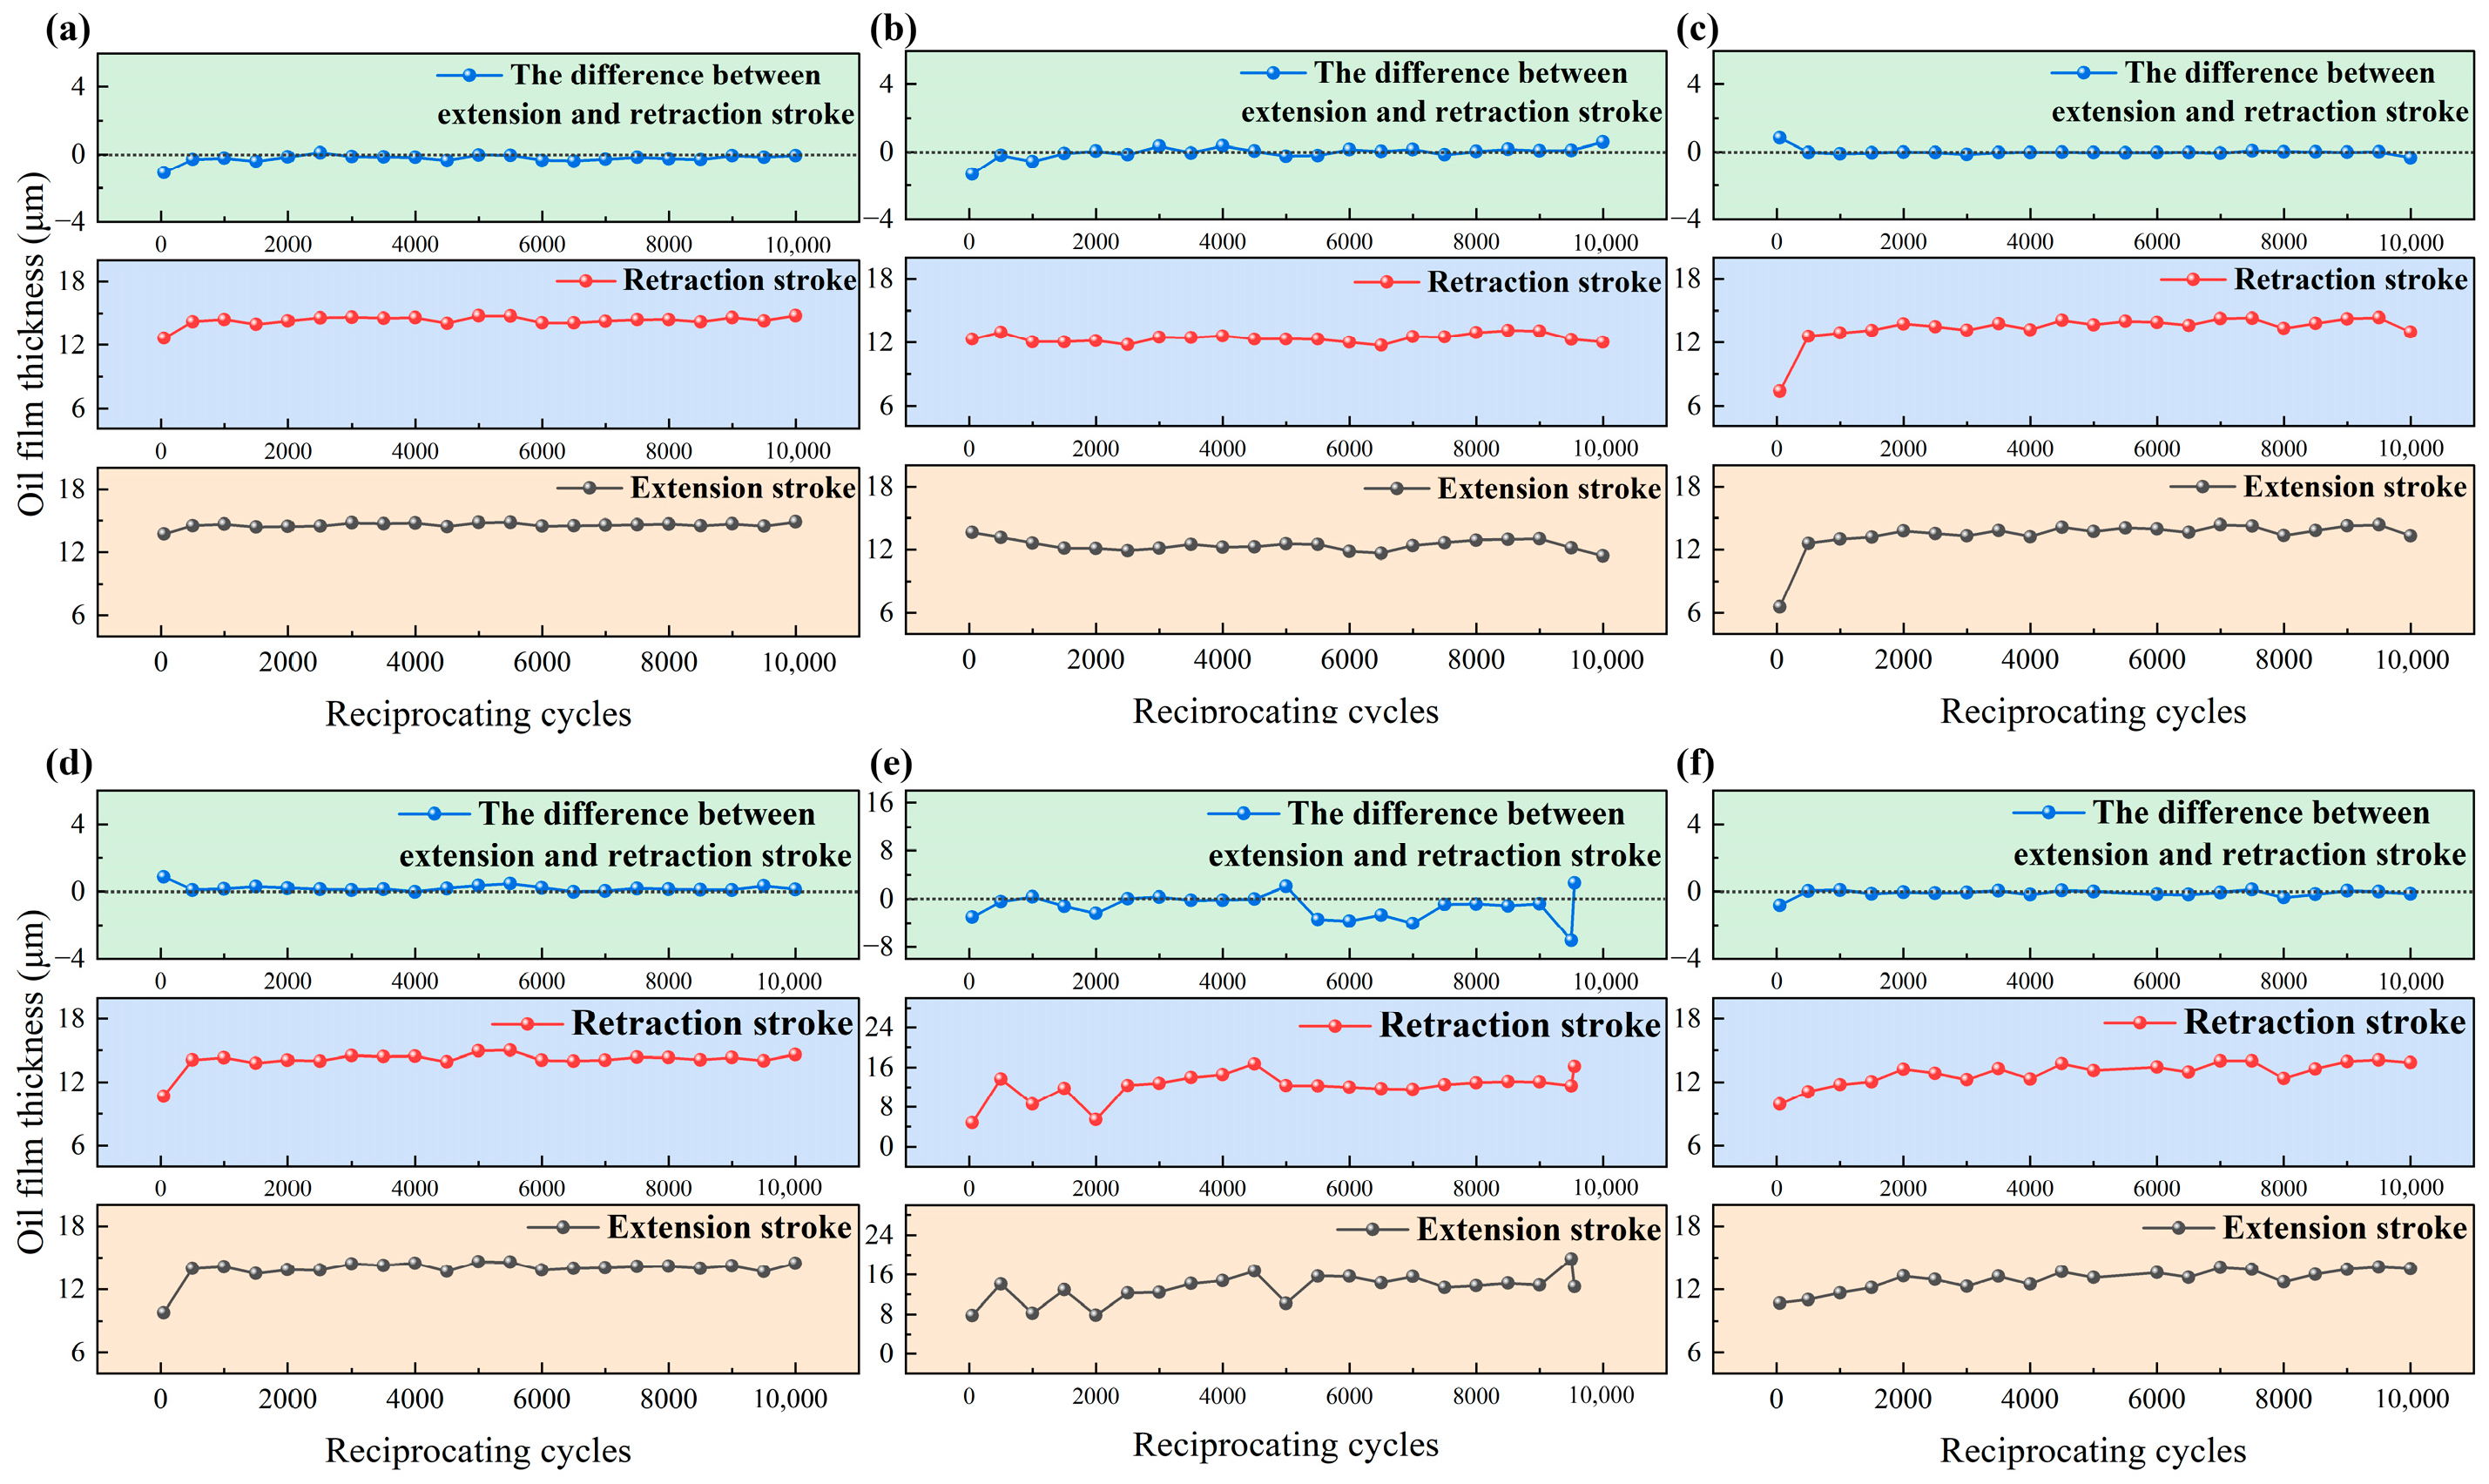
Figure 8 presents the continuous oil-film-thickness monitoring data acquired over 10,000 reciprocating cycles. The tests were performed on VL-type seals with three distinct compression levels (14.04%, 16.69%, and 19.36%) under two hydraulic pressure conditions: 21 MPa and 35 MPa. An analysis of the plotted data reveals distinct tribological differences between the two stroke directions under this high-pressure condition. Dowson and Swales investigated the oil-film thickness at the reciprocating-seal interface and demonstrated that the volume of fluid entrained differs between the extension stroke and the retraction stroke in reciprocating sealing systems [31]. Figure 8 shows that the measured oil-film thickness during the retraction stroke is greater than the corresponding values recorded during the extension stroke under 35 MPa. With the increase in seal compression level, the initial oil-film thickness gradually decreases. The initial oil-film thicknesses during the retraction stroke at 35 MPa for seals with compression levels of 14.04%, 16.69%, and 19.36% are 12.62 μm, 12.30 μm, and 7.40 μm, respectively. This is caused by the gradual increase in the preload of the seal. For seals with 14.04% and 16.69% compression, the difference in oil-film thickness gradually increases with the rise in reciprocating cycles, whereas the seal with 19.36% compression shows an opposite trend. The above observed evolution laws of friction force, contact stress, and oil-film thickness under varying compression levels and reciprocating cycles can be utilized as basic data to establish an LSTM model for the prediction of oil-film thickness and friction force of sealing components.
Figure 8.
Oil-film thickness of high-pressure reciprocating-seal tests: (a) 35 MPa, 14.04% seal compression; (b) 35 MPa, 16.69% seal compression; (c) 35 MPa, 19.36% seal compression; (d) 21 MPa, 14.04% seal compression; (e) 21 MPa, 16.69% seal compression; (f) 21 MPa, 19.36% seal compression.
The oil-film-thickness evolution in Figure 8 is derived from individual long-duration reciprocating tests for each compression-pressure combination. While these curves reveal qualitative tribological tendencies under the present test configuration, inter-sample variability may exist, and the trends should not be directly generalized to seal specimens of different batches or altered surface conditions without further validation.
3.4. Prediction Performance of LSTM Model
The friction prediction results of the predictive model, assessed on the independent test dataset, are systematically summarized in Table 5.
Table 5.
Results of the friction prediction model.
Due to the significant differences in hydraulic pressure across various operating conditions (2 MPa, 21 MPa, and 35 MPa), the order of magnitude of the absolute friction force exhibits substantial disparities. Under low-pressure conditions (2 MPa), the friction values are generally low. For instance, the MAE for run_id 1, 4, and 7 is consistently below 3.000. Conversely, under high-pressure conditions (35 MPa), the friction values increase significantly. This pronounced disparity in magnitude renders absolute error-based metrics, such as MAE and RMSE, unsuitable for a horizontal comparison of prediction accuracy across disparate operational states. Alternatively, the sMAPE relies on relative deviation as its core computational logic. It remains fundamentally unaffected by the absolute magnitude of the variables. Similarly, the rRMSE adopts normalized error as its core calculation logic. By eliminating the influences of variable dimensions and numerical scales, it can more objectively reflect the overall prediction deviation of the model under data with different orders of magnitude. In addition, the R2 takes the proportion of explained variance as its core calculation logic, which is independent of the absolute values of variables and can more intuitively reflect the goodness of fit and interpretability of the model for the variability of target variables. Therefore, R2, rRMSE, and sMAPE are employed as the core evaluation indicators in this study. Under all operating conditions, the sMAPE values of the model are controlled within 2%, with the relative deviation falling within the acceptable threshold for engineering applications. Meanwhile, the R2 values are all higher than 0.94, and the rRMSE values are lower than 1.6%, indicating that the model possesses reliable overall prediction accuracy and can provide stable and precise prediction support for practical engineering scenarios.
To conduct a visual analysis of the predictive performance, a representative high-pressure condition (run_id 9) is selected. The ground truth values and the corresponding predicted values from the test set are arranged chronologically according to their frame indices. The oil-film-thickness data acquired from the physical experiment conducted under a hydraulic pressure of 21 MPa is selected as a representative case study. A regression prediction is executed for the oil-film thickness during both the extension and retraction strokes. Quantitative evaluation metrics for oil-film-thickness prediction under two stroke directions are summarized in Table 6. Low MSE, RMSE and MAE values together with high R2 demonstrate that the LSTM-based model can effectively capture and fit the temporal evolution process of dynamic oil-film thickness under reciprocating sealing conditions. The model reproduces local fluctuation characteristics without obvious systematic deviations across the full time-series.
Table 6.
Results of the oil-film-thickness prediction model.
Based on the quantitative results presented in the table, the RMSE values for the extension and retraction strokes are 0.032 μm and 0.038 μm, respectively. Both evaluation metrics remain at a remarkably low level. Notably, the MSE is significantly less than 0.02. This indicates the complete absence of severe outliers with massive deviations in the model predictions. Furthermore, it demonstrates a uniform overall error distribution and fitting stability. The MAEs for the extension and retraction strokes are 0.027 μm and 0.033 μm, respectively, yielding an overall average of 0.04 μm. This specific metric reflects a low average absolute deviation of the predicted values relative to the ground truth. It signifies a high degree of overall approximation. Additionally, the sMAPE for the extension and retraction strokes is calculated as 0.206% and 0.255%, respectively. As a relative percentage error, this indicator directly quantifies the relative deviation between the predicted and actual values. These sMAPE results mutually corroborate the MAE and RMSE findings. Together, they confirm that the model possesses exceptionally high precision and robust generalization capability for predicting oil-film thickness.
According to the comprehensive analysis, the proposed model achieves high fitting accuracy for the oil-film thickness during both the extension and retraction strokes. It can effectively characterize the temporal evolution features of the dynamic oil-film thickness. Consequently, it fully satisfies the rigorous accuracy requirements for online prediction and condition monitoring in practical engineering applications.
Building upon this reliable predictive foundation, the forecasted oil-film thicknesses for the extension and retraction strokes can be utilized to further analytically derive the dynamic seal leakage volume. The calculation formula is expressed as follows:
where V denotes the seal leakage volume, ho represents the corresponding oil-film thickness during the extension stroke, and hi indicates the corresponding oil-film thickness during the retraction stroke. The variable d refers to the diameter of the piston rod, and L defines the effective sealing contact length.
V = πdL(ho − hi)
4. Discussion
In the present study, a multi-sensor experimental platform was developed to realize the synchronous acquisition of oil-film thickness, contact stress and friction force for reciprocating seals under hydraulic pressures up to 35 MPa. Using the obtained multimodal time-series degradation datasets, two long short-term memory (LSTM) prediction models were established to characterize the evolutionary trends of oil-film thickness and friction force for VL-type rubber–plastic composite seals. Evaluated on held-out test samples, both models yield satisfactory prediction accuracy, with coefficients of determination \( R^2\) above 0.94 and symmetric mean absolute percentage error (sMAPE) below 2%. The predicted oil-film-thickness sequences are further utilized to compute the dynamic leakage volume of reciprocating seals, which provides fundamental data support for health-status assessment and leakage-risk early warning of aircraft hydraulic actuators.
When compared with conventional elastohydrodynamic-lubrication (EHL) and inverse-hydrodynamic-lubrication (IHL) physical models for rod seals, the data-driven LSTM framework shows distinct advantages in reproducing real-world seal degradation behaviors. Conventional physical seal models are built upon substantial idealized assumptions regarding surface topography, boundary-lubrication properties and seal-lip deformation [14,15]. Consequently, they struggle to capture complex friction-velocity hysteresis, long-term wear-driven interface deterioration, and time-dependent contact states under practical high-pressure aviation operating environments [16]. In contrast, the LSTM architecture directly learns the intrinsic nonlinear couplings among contact stress, interfacial temperature, oil-film thickness and friction force from full-cycle experimental measurements. It is capable of excavating long-range temporal dependencies of seal degradation without requiring explicit prior assumptions about underlying wear mechanisms. Such characteristics render the proposed approach well-suited for representing practical seal performance evolution under complex service conditions.
Nevertheless, it should be noted that the developed LSTM model acts as a data-driven empirical surrogate rather than a first-principle physical model. Its forecasting capability is heavily constrained by the parameter coverage of training datasets. In this work, model training and validation are performed within three hydraulic-pressure levels (2 MPa, 21 MPa, 35 MPa) and three seal compression ratios (14.04%, 16.69%, 19.36%). Acceptable prediction reliability can be guaranteed for operating conditions falling within the interpolation domain spanned by existing experimental samples. By contrast, blind extrapolation toward unseen working boundaries, e.g., higher system pressure, alternative seal materials or modified rod-seal clearances, may introduce considerable prediction bias. Without supplementary experimental data covering these new operating boundaries, the model cannot ensure generalization performance outside the original training parameter space.
Differences in feature-engineering and time-window configurations also provide physical insights into seal degradation mechanisms. For oil-film-thickness prediction, a six-dimensional feature set together with a short lookback window of 10 cycles is adopted. For friction-force prediction, expanded sensor-derived statistical features and a longer lookback window of 100 frames are constructed. The discrepancy in window sizes implies that friction evolution is dominated by long-term cumulative wear history, whereas oil-film-thickness variation responds more sensitively to short-term cycle-by-cycle operating conditions. This observation aligns with the physical nature of reciprocating sealing: oil-film formation is predominantly governed by instantaneous fluid-entrainment effects within individual strokes, while friction build-up accumulates damage originating from thousands of reciprocating cycles, including seal-lip material removal and transfer-film evolution.
From the perspective of aviation-actuator engineering applications, the measurement capacity of the constructed test rig merits emphasis. Most existing laboratory investigations cannot achieve simultaneous measurement of oil-film thickness, contact stress and friction force under pressures exceeding 20 MPa [17,21,22]. The integrated ultrasonic-FBG measuring scheme reported in this study generates high-fidelity multimodal time-series datasets for seal-degradation research. These experimental measurements are valuable not only for training machine learning-based prediction models but also for calibrating and refining physical lubrication simulation models targeting high-pressure aviation rod seals. In addition, it is necessary to clarify the interpretation boundary for the long-term endurance experimental data reported in this work. Owing to the extremely high time-consumption of 10,000-cycle high-pressure reciprocating-seal tests, each set of friction, contact stress, temperature and oil-film-thickness results presented in Figure 6, Figure 7 and Figure 8 are acquired from one independent endurance-test run per operating condition. The degradation tendencies described in this paper are qualitative observations obtained under fixed experimental parameters (VL-type NBR–PTFE composite seal, piston-rod surface roughness, 15# aviation hydraulic fluid, reciprocating velocity of 200 mm/s). They provide insight into seal degradation mechanisms but do not possess proven statistical significance across multiple replicate samples. Random interfacial events such as local material transfer and micro-scuffing can lead to inter-specimen dispersion. Hence, quantitative numerical results should not be directly extrapolated to different seal batches, varied surface topography or other lubricant conditions. Systematic multi-replicate endurance tests will be carried out in future work to validate the repeatability of these degradation patterns.
Several inherent limitations remain to be addressed in future research. First, all datasets in this study are acquired at a fixed reciprocating velocity of 200 mm/s using a single type of aviation hydraulic fluid. Follow-up experiments will introduce variable-speed operating modes and diverse lubricants to broaden the model’s applicable parameter envelope. Second, the current model outputs time-series predictions of oil-film thickness and friction force. Future work will incorporate classification and threshold-judgement modules to realize quantitative remaining-useful-life (RUL) estimation and graded leakage-risk alarms. Third, hybrid-modeling strategies that couple physical sealing equations with LSTM networks will be explored. By embedding physical constraints into data-driven forecasting, such hybrid schemes are expected to mitigate extrapolation risks associated with pure-data-driven models. Overall, this study validates the feasibility of deploying LSTM-based time-series networks for high-pressure reciprocating-seal performance prediction using multi-sensor monitoring data. It offers an alternative technical pathway for health-state evaluation of hydraulic reciprocating sealing components in aviation actuation systems.
5. Conclusions
A dedicated test-bench system integrating ultrasonic transducers, FBG optical-fiber sensors and force sensors was developed in this work, which enables synchronous measurement of oil-film thickness, contact stress and friction force for aviation reciprocating rod seals under pressures up to 35 MPa. Multimodal time-series degradation datasets under multiple seal compression ratios and hydraulic pressures were acquired through long-duration reciprocating experiments.
Two LSTM-based time-series prediction models were constructed for oil-film thickness and friction-force forecasting respectively. On independent test datasets, both models achieve a coefficient of determination (R2) higher than 0.94 and symmetric mean absolute percentage error (sMAPE) below 2%. Predicted oil-film-thickness results were further used to calculate the dynamic leakage volume of reciprocating seals. The results verify that the data-driven approach can effectively capture the time-variant nonlinear evolution characteristics of sealing interfaces and can provide basic support for leakage risk early warning of aircraft hydraulic actuators.
Compared with traditional EHL/IHL physical sealing models, the LSTM model avoids excessive idealized physical assumptions and can learn complex coupling degradation behaviors directly from measured experimental data. However, as a purely data-driven empirical model, its generalization is limited by the parameter coverage of training samples. Reliable prediction is valid mainly within the interpolation range of experimental working conditions; blind extrapolation to completely new operating parameters is not recommended.
Future research will expand experimental conditions, including variable speed and different lubricating media, to enrich the dataset. Hybrid modeling combining physical sealing mechanisms with deep learning networks will be further studied to reduce extrapolation deviation and realize direct remaining-useful-life assessment for high-pressure reciprocating seals in aviation hydraulic systems. Because the sealing signals are acquired continuously in the time domain, the proposed test bench and sensing scheme are not restricted to steady operating points, and the rod speed and system pressure can be directly introduced as additional input variables of the LSTM model; together with transfer learning or condition-parameterized training, this provides an extension path from the steady operating points covered in this work to the continuously varying speed and pressure profiles of actual aviation applications.
Author Contributions
W.Y.: Conceptualization, Methodology, Experiment, Writing—original draft; Y.W.: Conceptualization, Methodology, Experiment, Review and editing, Funding acquisition; W.X.: Data curation, Visualization; Q.G.: Simulation, Data curation; J.A.: Simulation, Visualization; S.Z.: Data curation, Visualization; J.S.: Supervision, Review and editing, Funding acquisition; X.Z.: Review and editing; X.S.: Data curation, Visualization. All authors have read and agreed to the published version of the manuscript.
Funding
This research received no external funding.
Institutional Review Board Statement
Not applicable.
Data Availability Statement
Data is available upon request from the authors.
Conflicts of Interest
Authors Wenjun Yu, Yanan Wang, Weiwei Xu, Qingyun Guo, Jianping Ai, Shuang Zhang and Junying Suo were employed by the company AVIC Chengdu Aircraft Industrial (Group) Co., Ltd. The remaining authors declare that the research was conducted in the absence of any commercial or financial relationships that could be construed as a potential conflict of interest.
Abbreviations
The following abbreviations are used in this manuscript:
| LSTM | long short-term memory |
| sMAPE | symmetric mean absolute percentage error |
| rRMSE | relative root mean square error |
| FBG | fiber Bragg grating |
| PMMA | polymethyl methacrylate |
| PTFE | polytetrafluoroethylene |
| EHL | elastohydrodynamic-lubrication |
| IHL | inverse-hydrodynamic-lubrication |
References
- Jiao, Z.; Li, Y.; Yu, T.; Jiang, C.; Huang, L.; Shang, Y. Dynamic thermal coupling modeling and analysis of wet electro-hydrostatic actuator. Chin. J. Aeronaut. 2022, 35, 298–311. [Google Scholar] [CrossRef] [Scilit]
- Xu, Z.; Zhang, Y.; Wang, J.; Wang, X.; Li, K.; He, Q.; Zhang, Y. Operating conditions analysis and performance adaptability evaluation of fluoroelastomer seals in aircraft applications. Polym. Eng. Sci. 2025, 66, 1494–1519. [Google Scholar] [CrossRef] [Scilit]
- Cheng, G.; Guo, F.; Zang, X.; Zhang, Z.; Jia, X.; Yan, X. Failure analysis and improvement measures of airplane actuator seals. Eng. Fail. Anal. 2022, 133, 105949. [Google Scholar] [CrossRef] [Scilit]
- Heipl, O.; Murrenhoff, H. Friction of hydraulic rod seals at high velocities. Tribol. Int. 2015, 85, 66–73. [Google Scholar] [CrossRef] [Scilit]
- Liao, B.; Sun, B.; Li, Y.; Yan, M.; Ren, Y.; Feng, Q.; Yang, D.; Zhou, K. Sealing reliability modeling of aviation seal based on interval uncertainty method and multidimensional response surface. Chin. J. Aeronaut. 2019, 32, 2188–2198. [Google Scholar] [CrossRef] [Scilit]
- Nikas, G.K. Performance mapping of rectangular-rounded hydraulic reciprocating seals to minimize leakage, frictional work and abrasive wear with the aid of a duty parameter. Tribol. Int. 2023, 179, 108191. [Google Scholar] [CrossRef] [Scilit]
- Li, J.W.; Chen, G.Q.; Yang, L.; Wang, Y. Failure analysis and structural optimization of high-pressure reciprocating Y-shaped sealing ring. J. Fail. Anal. Prev. 2024, 24, 1957–1975. [Google Scholar] [CrossRef] [Scilit]
- Yam, R.C.M.; Tse, P.W.; Li, L.; Tu, P. Intelligent predictive decision support system for condition-based maintenance. Int. J. Adv. Manuf. Technol. 2001, 17, 383–391. [Google Scholar] [CrossRef] [Scilit]
- Tse, P.W.; Atherton, D.P. Prediction of machine deterioration using vibration based fault trends and recurrent neural networks. ASME. J. Vib. Acoust. 1999, 121, 355–362. [Google Scholar] [CrossRef] [Scilit]
- Chen, Y.; Yang, B.; Dong, J. Time-series prediction using a local linear wavelet neural network. Neurocomputing 2006, 69, 449–465. [Google Scholar] [CrossRef] [Scilit]
- Wang, W.Q.; Golnaraghi, M.F.; Ismail, F. Prognosis of machine health condition using neuro-fuzzy systems. Mech. Syst. Signal Process. 2004, 18, 813–831. [Google Scholar] [CrossRef] [Scilit]
- Salant, R.F.; Maser, N.; Yang, B. Numerical model of a reciprocating hydraulic rod seal. J. Tribol.-Trans. ASME 2007, 129, 91–97. [Google Scholar] [CrossRef] [Scilit]
- Wei, J.; Sun, X.; Tian, J.; Liu, C. Thermo-elastohydrodynamic lubrication performance study of step seal under transient condition. Ind. Lubr. Tribol. 2023, 75, 969–980. [Google Scholar] [CrossRef] [Scilit]
- Wang, B.; Li, X.; Peng, X.; Li, Y.; Chen, Y.; Jin, J. Thermoelastohydrodynamic mixed lubrication of combined rod seals operating at high pressures and speeds: Mathematical modeling and numerical analysis. J. Tribol. 2024, 146, 044104. [Google Scholar] [CrossRef] [Scilit]
- Liao, C.; Huang, W.; Wang, Y.; Suo, S.; Liu, Y. Fluid-solid interaction model for hydraulic reciprocating O-ring seals. Chin. J. Mech. Eng. 2013, 26, 85–94. [Google Scholar] [CrossRef] [Scilit]
- Tran, X.B.; Hafizah, N.; Yanada, H. Modeling of dynamic friction behaviors of hydraulic cylinders. Mechatronics 2012, 22, 65–75. [Google Scholar] [CrossRef] [Scilit]
- Kaneta, M.; Todoroki, H.; Nishikawa, H.; Kanzaki, Y.; Kawahara, Y. Tribology of flexible seals for reciprocating motion. J. Tribol. 2000, 122, 787–795. [Google Scholar] [CrossRef] [Scilit]
- Sun, J.; Wang, L.; Li, J.; Li, F.; Li, J.; Lu, H. Online oil debris monitoring of rotating machinery: A detailed review of more than three decades. Mech. Syst. Signal Process. 2021, 149, 107341. [Google Scholar] [CrossRef] [Scilit]
- Dwyer-Joyce, R.S.; Reddyhoff, T.; Zhu, J. Ultrasonic measurement for film thickness and solid contact in elastohydrodynamic lubrication. J. Tribol. 2011, 133, 031501. [Google Scholar] [CrossRef] [Scilit]
- Albahrani, S.M.B.; Philippon, D.; Vergne, P.; Bluet, J. A review of in situ methodologies for studying elastohydrodynamic lubrication. Proc. Inst. Mech. Eng. Part J J. Eng. Tribol. 2016, 230, 86–110. [Google Scholar] [CrossRef] [Scilit]
- Zhu, J.; Li, X.; Beamish, S.; Dwyer-Joyce, R.S. An ultrasonic method for measurement of oil films in reciprocating rubber O-ring seals. Tribol. Int. 2022, 167, 107407. [Google Scholar] [CrossRef] [Scilit]
- Zhao, X.; Appiah, E.; Xia, Y.; Wang, J. Degradation process analysis and reliability prediction modeling of hydraulic reciprocating seal based on monitoring data. Eng. Fail. Anal. 2022, 140, 106565. [Google Scholar] [CrossRef] [Scilit]
- Schmidhuber, J. Deep learning in neural networks: An overview. Neural Netw. 2015, 61, 85–117. [Google Scholar] [CrossRef] [Scilit] [PubMed]
- Chen, H.; Yan, J.; Fu, W. Two-layer fault diagnosis model of aircraft based on LSTM. Aerosp. Sci. Technol. 2025, 158, 109756. [Google Scholar] [CrossRef] [Scilit]
- Guo, K.; Wang, N.; Liu, D.; Peng, X. Uncertainty-aware LSTM based dynamic flight fault detection for UAV actuator. IEEE Trans. Instrum. Meas. 2023, 72, 3502113. [Google Scholar] [CrossRef] [Scilit]
- Zhou, D.; Zhuang, X.; Zuo, H. A hybrid deep neural network based on multi-time window convolutional bidirectional LSTM for civil aircraft APU hazard identification. Chin. J. Aeronaut. 2022, 35, 344–361. [Google Scholar] [CrossRef] [Scilit]
- Yang, J.; Guo, Y.; Zhao, W. Long short-term memory neural network based fault detection and isolation for electro-mechanical actuators. Neurocomputing 2019, 360, 85–96. [Google Scholar] [CrossRef] [Scilit]
- Bhaumik, S.; Kumaraswamy, A.; Guruprasad, S. Design & development of test rig for investigation of contact mechanics phenomena in reciprocating hydraulic seals. Procedia Eng. 2013, 64, 835–843. [Google Scholar] [CrossRef] [Scilit]
- Mao, Y.; Tong, X.; Zhang, C.; Wei, J. High temperature in-situ sensing system based on fiber Bragg grating for reciprocating compressor. Opt. Fiber Technol. 2021, 64, 102545. [Google Scholar] [CrossRef] [Scilit]
- Hill, K.O.; Meltz, G. Fiber Bragg grating technology fundamentals and overview. J. Light. Technol. 1997, 15, 1263–1276. [Google Scholar] [CrossRef] [Scilit]
- Dowson, D.; Swales, P.D. The development of elastohydrodynamic conditions in a reciprocating seal. In Proceedings of the Fourth International Conference on Fluid Sealing, Philadelphia, PA, USA, 5–9 May 1969; pp. 1–9. [Google Scholar]

Disclaimer/Publisher’s Note: The statements, opinions and data contained in all publications are solely those of the individual author(s) and contributor(s) and not of MDPI and/or the editor(s). MDPI and/or the editor(s) disclaim responsibility for any injury to people or property resulting from any ideas, methods, instructions or products referred to in the content. |
© 2026 by the authors. Licensee MDPI, Basel, Switzerland. This article is an open access article distributed under the terms and conditions of the Creative Commons Attribution (CC BY) license.