


Abstract
Background/Objectives: We reviewed the performance, validation and clinical readiness of wearable- and vision-based models predicting future falls. Methods: Nine databases and supplementary sources were searched for reports published in 2000–20 July 2026 (retrospective PROSPERO registration: CRD420261502037). Eligible populations had a minimum, mean or median age ≥60 years or separable older-adult results. Screening, extraction and appraisal used single-reviewer assessment with second-reviewer verification, rather than independent duplication. Ten of 47 reports (21.28%) lacked complete-article access. Cohort families were synthesized without meta-analysis; PROBAST+AI appraisal was restricted to complete articles. Results: The 47 reports represented 37 cohort families (15–1705 participants; horizons 7 days–5 years). Representative AUCs ranged from 0.51 to 0.99 across 26 families; 24 estimates were apparent, internally validated or validation-unverified. The only independent-cohort evaluation of published models yielded AUCs of 0.49–0.59. Retained domain-level appraisals classified all 37 complete-article evaluations as high risk of bias. Calibration intercept and slope appeared in one report (2.13%); none reported decision curve analysis, net benefit or clinical impact. Conclusions: Interpretability is limited by high risk of bias, sparse events, limited independent validation and missing calibration. The evidence does not support routine deployment; this concerns evidentiary readiness rather than technical potential. Funding: King Salman Center for Disability Research.
1. Introduction
Falls are a leading cause of injury, loss of independence, and injury-related death in older adults, and their frequency rises steeply with age, frailty, and multimorbidity [1,2]. The World Guidelines for Falls Prevention and Management recommend opportunistic case finding followed by multifactorial assessment of those at high risk, with gait and balance evaluation at its core [2]. In practice, risk stratification relies largely on fall history, clinical questions, and brief performance tests, which are episodic, depend on the setting and examiner, and have limited predictive accuracy when used alone [2]. An objective, repeatable, and scalable estimate of an individual’s probability of falling over a defined period would therefore be clinically valuable, provided that it is accurate, calibrated, and transportable to the settings in which it will be used.
Gait is a biologically plausible source of such information because walking integrates musculoskeletal, neurological, sensory, cardiovascular, and cognitive function. Slower speed, reduced rhythm, and greater stride-to-stride variability have been prospectively associated with incident falls [3]. Inertial measurement units (IMUs), pressure-sensing insoles, smartphones, and wrist devices can quantify these features during structured tests or during days of free-living activity, and depth or video cameras can estimate gait without a body-worn device [4,5,6]. Such sensor-derived gait and mobility measures, often termed digital gait biomarkers, include spatiotemporal and variability features of walking; the walking, turning, and transition phases of instrumented mobility tests; and the quantity and structure of daily walking; they are increasingly promoted as prognostic tools for fall-risk screening.
Whether these technologies are ready for clinical decisions is less clear. Three analytically distinct tasks are often labeled “fall prediction”: detection of a fall as it occurs, classification of people according to their past falls, and prediction of falls that occur after the measurement. Only the third is prognostic. Even among prospective studies, optimism can arise when repeated windows from the same participant enter both training and test sets, when feature selection precedes cross-validation, or when many candidate features are evaluated relative to the number of fallers [7,8]. Adjacent syntheses have addressed related but different questions. Narrative, scoping, and systematic reviews have described sensor-based fall-risk assessment without restricting eligibility to falls occurring after the measurement [4,5,7,9,10]; a scoping review mapped wearable-sensor fall-risk prediction models in community-dwelling older adults [11]; a scoping review of computer vision applied to conventional gait videos found evidence mainly of technical feasibility and screening or classification performance [12]; and a diagnostic accuracy meta-analysis pooled reconstructed accuracy data from predominantly prospective wearable studies [13]. We did not identify a previous systematic review that jointly restricted eligibility to individualized prediction of falls occurring strictly after gait measurement, grouped overlapping reports by cohort family, included both wearable and vision modalities, separated estimates by validation stage, and applied a PROBAST+AI-informed appraisal [14].
Clinical use of a prediction model requires more than discrimination. It requires a defined target population and index time, a stated prediction horizon, calibrated probabilities, performance that holds in new participants and settings, and evidence that decisions based on the model improve outcomes [14,15]. These requirements depend on the intended use, which, for gait-based fall prediction, can be grouped into five categories: community screening of older adults; short-term triage after hospital or emergency department discharge; surveillance in long-term care; disease-specific prognosis, for example in Parkinson disease or dementia; and dynamic, rolling-horizon prediction from repeatedly updated measurements. For sensor-based models, transportability depends on the entire measurement pipeline—hardware, placement, acquisition protocol, signal processing, feature construction, and classifier—not on the final algorithm alone [6,14].
We therefore conducted a systematic review without meta-analysis of prognostic models that use wearable- or vision-derived gait measurements to predict future falls in older adults. The objectives were to (1) characterize populations, sensing technologies, gait domains, outcomes, and prediction horizons; (2) distinguish apparent, internally validated, prospectively evaluated, and independently evaluated performance; (3) describe discrimination, calibration, incremental value over clinical predictors, and clinical utility; (4) conduct a PROBAST+AI-informed appraisal of risk of bias and applicability; and (5) summarize the available evidence against review-specific, descriptive criteria for clinical readiness within these intended-use categories.
2. Materials and Methods
2.1. Registration and Reporting
The review was registered retrospectively in PROSPERO (CRD420261502037; https://www.crd.york.ac.uk/PROSPERO/view/CRD420261502037 (accessed on 10 September 2026)). The record was submitted on 9 September 2026 and registered on 10 September 2026, after the searches had ended on 20 July 2026. No protocol was written or published before the searches. Registration therefore documents the review but did not constrain its methods, and the review does not meet AMSTAR 2 item 2, which requires review methods to be established before the review is conducted [16]. All analytical decisions made after the searches began are listed in Section 2.10. Reporting follows the Preferred Reporting Items for Systematic Reviews and Meta-Analyses (PRISMA) 2020 statement [17]; the completed PRISMA 2020 checklist is provided in the Supplementary Materials. The narrative synthesis is reported according to the Synthesis Without Meta-analysis (SWiM) guideline [18], and the search is reported according to PRISMA-S [19] to the extent that the retained records allowed. Prediction model items are reported according to TRIPOD-SRMA [20], and data items are based on the CHARMS checklist [21]. The review question was as follows: in older adults, how valid, transportable, and clinically ready are models that use wearable- or vision-derived gait measurements obtained before follow-up to predict subsequent falls?
2.2. Eligibility Criteria
Eligibility was defined using the population, index model, comparator, outcome, timing, and setting (PICOTS) framework (Table 1). Eligible reports studied an older-adult population (minimum, mean, or median age ≥ 60 years, or separately reported older-adult results) in any community, clinical, or residential setting, including disease-specific populations such as people with Parkinson disease or dementia; quantified gait with a body-worn or portable sensor or a camera-based vision system; completed predictor measurement before the fall-outcome window; ascertained actual subsequent falls; and reported individualized model performance (discrimination, calibration, or classification accuracy). Models could use gait alone or combine gait with clinical predictors, and development, internal validation, temporal testing, updating, and external validation studies were all eligible. Fixed commercial scores were eligible when their inputs included sensor-derived gait and they were evaluated against prospectively ascertained falls. Explicit decision rules defined the eligible index measures: (1) measures from walking, including gait initiation, turning while walking, and the walking phases of instrumented mobility tests such as the Timed Up and Go, were eligible; (2) sit-to-stand and other postural transitions were eligible only when recorded within an instrumented mobility test that included walking; (3) the quantity or structure of walking (for example, daily step counts or walking-bout durations) was eligible when derived from detected walking bouts; and (4) models whose sensor-derived predictors were limited to static balance, posturography, sit-to-stand alone, or non-specific physical activity were not eligible, although such measures could accompany an eligible gait measure. Individualized performance required discrimination, calibration, or classification of individual participants against observed outcomes (sensitivity, specificity, predictive values, accuracy, or an equivalent 2 × 2 table); hazard ratios, odds ratios, model fit statistics, and event rates in risk groups without such classification were treated as prognostic factor or risk stratification results. These rules were formalized after the initial eligibility assessment and re-applied to all borderline reports (Section 2.10; Supplementary Table S4).
Table 1.
Eligibility criteria according to the PICOTS framework.
We excluded studies of retrospective or concurrent faller classification, real-time fall detection, prognostic factor associations without individualized performance, surrogate fall-risk scores as the outcome, measurement validation studies without future falls, intervention effect studies, and non-gait sensor models. English-language peer-reviewed journal reports published from 1 January 2000 to 20 July 2026 were considered; the lower limit reflects the introduction of the digital wearable and computer vision pipelines that are the focus of this review. Reports were never excluded because performance was poor or incompletely reported.
2.3. Information Sources and Search Strategy
MEDLINE (PubMed), Embase (Ovid), Scopus, Web of Science Core Collection, IEEE Xplore, CINAHL (EBSCOhost), APA PsycInfo (EBSCOhost), the ACM Digital Library, and the Cochrane Central Register of Controlled Trials (CENTRAL) were searched from 1 January 2000 to 20 July 2026. Google Scholar was searched as a supplementary source, with screening of the first 200 relevance-ranked records. Trial and study registries, ProQuest Dissertations & Theses Global, and medRxiv and arXiv preprint servers were searched with the same core concepts. We also completed backward and forward citation searching, performed targeted table-of-contents screening of relevant journals, and contacted authors to identify further published reports. Database strategies combined concept blocks for older adults, gait or walking, wearable, portable, or vision-based sensing, and falls, supplemented by prediction and performance terms; block combinations were adapted to each interface. Supplementary Table S1 reproduces the retained database histories and aggregate yields.
Because several original strategies required gait or walking terminology, a known-item and eligibility sensitivity check used broader mobility test terms (Timed Up and Go, sit-to-stand, turning, stepping, postural and balance) and citation-linked candidates. It reinstated one report previously excluded at title/abstract screening [22]; this was an existing screened record, not an additional identification record. During revision, the core database searches were rerun with expanded mobility terminology, and the search strings underwent peer review. The retained documentation does not include database-specific rerun dates, yields, screening dispositions or a completed PRESS checklist [23]. Supplementary Table S1 therefore distinguishes the original search histories from the reported revision activity. The numerical study flow and synthesis refer to the documented original search dataset; a reconciled flow incorporating the revision reruns is not available.
2.4. Study Selection and Source Access
Records were deduplicated using digital object identifiers and normalized titles. Titles and abstracts, and then reports, were assessed against the eligibility criteria. Each record and report was assessed by one reviewer, and every decision was verified by a second reviewer against the source record; the verifier had access to the first reviewer’s decision. Report-stage eligibility decisions were also cross-checked by the review team, with disagreements discussed to consensus. This dependent verification is not equivalent to independent duplicate assessment under AMSTAR 2 item 5: it can propagate initial errors and overstate agreement. Paired, independently blinded pre-consensus decisions and reviewer-level adjudication logs are unavailable in the retained archive. Consensus decisions and dependent verification cannot retrospectively establish independent inter-rater reliability; no independent disagreement rate or Cohen’s κ is reported. No automation tool excluded records. When several exclusion reasons applied, a hierarchy specified during the review (publication type, population, index measurement, temporality/outcome, and analysis type) determined the principal reason. Excluded reports that might appear eligible are listed with reasons in Supplementary Table S4.
Complete journal articles were sought through publisher websites, institutional subscriptions, and open-access or institutional repositories. Eleven reports could not be retrieved in any form sufficient to judge eligibility and were not assessed (Figure 1). Ten further reports were included without complete-article access because indexed or publisher abstracts established temporal separation and individualized performance; directly attributable indexed publisher excerpts additionally verified the Greene 2012 [24] AUC and Mehdizadeh 2021 [25] participant counts. Companion papers, theses, posters and conference abstracts were not substituted for unavailable articles. Extraction was limited to the identified source material, with unavailable details recorded as NR. These 10 reports form a secondary source-access tier: they are flagged throughout, excluded from formal appraisal, and excluded in a performance sensitivity analysis. Table S3 distinguishes verified abstract or publisher excerpt information from details unavailable without the complete article.
Figure 1.
PRISMA 2020 flow diagram of study selection for the documented original search dataset. Records identified through other methods were deduplicated and screened together with database and register records. Revision rerun counts are not available for reconciliation (Section 2.3). The 11 reports not retrieved were not assessed; they are distinct from the 10 included reports assessed without complete-article access.
2.5. Data Extraction and Management of Overlapping Cohorts
A structured form based on CHARMS [21] captured bibliographic details, setting, age, sample size and number of fallers, outcome definition and ascertainment, prediction horizon, gait task, device and placement, candidate predictors, modeling method, validation method, discrimination, classification and calibration measures, measures of uncertainty, and principal limitations. Extraction was performed by one reviewer and verified in full by a second reviewer who had access to the first extraction, with team cross-checks. This dependent verification does not meet independent duplicate extraction under AMSTAR 2 item 6 and can propagate initial errors; paired independent extraction and adjudication logs are unavailable. Supplementary Table S2 identifies the source material used for each report and separately labels derived values; it does not provide a source locator for every cell. Granular page, section and table/figure coordinates were not systematically recorded for every extracted field. Source inconsistencies were handled at the metric level: the reported Kelly cohort total was retained, but incompatible subgroup sums were not combined; Lockhart classification summaries were labeled as repeated-run averages and were not converted into a single confusion matrix; incompatible Marques swing time and stride length results were excluded from summaries. The Marques stance time variability AUC was retained as a flagged source estimate, and its influence was examined by excluding that family. Missing information was recorded as not reported (NR), and uncertainty was labeled by its reported type.
Participant overlap was assessed from recruitment sites, dates, sample sizes, devices, trial identifiers, author groups, and baseline characteristics. Reports sharing participants were assigned to one cohort family and were not treated as independent replications (Supplementary Table S5). Each performance estimate was classified by validation stage: apparent (performance in the development data); internal validation (participant-level resampling or data splitting); prospective fixed-model evaluation (a previously specified model, rule, or commercial score applied to newly followed participants without refitting); target-sample updating (a model refitted or recalibrated in the evaluation sample); and independent-cohort evaluation (previously published models applied with their original coefficients or cut-offs to non-overlapping participants). We distinguished independent-cohort evaluation of a model from faithful replication of its complete sensor-to-model pipeline, which additionally required that predictors were measured and processed exactly as in development. Results based on observation-level rather than participant-level data splits were retained only to illustrate data leakage.
2.6. Outcomes and Performance Measures
The primary outcome was any fall occurring after the index measurement. Secondary outcomes were recurrent falls, injurious falls, fall counts, and time to first fall. Prediction horizons were extracted as defined by each report. Discrimination was summarized by the area under the receiver operating characteristic curve (AUC) or concordance statistic (C-index); classification performance by accuracy, sensitivity, specificity, and positive and negative predictive values; calibration by calibration-in-the-large (intercept), calibration slope, observed-to-expected ratios, and calibration plots; overall performance by the Brier score, which combines discrimination and calibration and is not itself a calibration measure; and clinical utility by decision curves and net benefit. Sensitivity, specificity, and predictive values were recalculated only when exact cell counts were published. Apparent, internal, prospective, and independent-cohort estimates were kept separate throughout. In the main text and tables, discrimination and classification measures are presented as proportions to two decimal places (for example, sensitivity 0.73) and proportions calculated by the review team as percentages to two decimal places; calculations use the values tabulated in Table S6 without intermediate rounding, and measurement cut-points retain the source precision needed to define each threshold.
2.7. Risk of Bias and Applicability Assessment
PROBAST+AI [14] informed appraisal of development quality (Part A), risk of bias in model evaluation (Part B), and applicability. Each part covers participants and data sources, predictors, outcome and analysis; development and evaluation were considered separately for the principal gait-containing model in each report. Applying the tool to the single-predictor receiver operating characteristic cut-point analysis of Marques et al. (2018) [26] is an adaptation outside its core multivariable prediction model scope, as declared in Supplementary Table S7. Complete official item-level response forms for all 37 complete-article reports are not included in the Supplementary Materials. The published numerical appraisal is restricted to the retained domain-level judgments (A1–A4 and B1–B4) and study-specific rationales in Table S7; the domain table does not substitute for the official signaling question forms. Item-by-item reproducibility is therefore not established, and all domain-level judgments are interpreted provisionally. Appraisal used one reviewer with dependent second-reviewer verification and team discussion; the verifier saw the initial ratings. Independently blinded paired item/domain ratings and reviewer-level adjudication logs are unavailable, so no independent agreement statistic is reported. Absence of external validation was treated as a transportability limitation rather than a bias criterion.
The 10 reports without complete-article access did not provide sufficient methodological detail for a reproducible PROBAST+AI appraisal. Their domain and overall ratings are therefore designated not evaluable (NE), rather than assigning high or low risk based on unreported methods. They are excluded from the primary appraisal synthesis and remain a secondary descriptive performance tier. Table S7 reports development quality, evaluation bias and applicability judgments for complete-article reports and source availability limitations for reports without complete articles. Applicability was judged against each model’s intended-use population and setting; generalizability to all older adults was considered separately. RoB 2, ROBINS-I and QUIPS address other study questions and were not used.
2.8. Synthesis Methods
Meta-analysis was not appropriate because populations, fall definitions, ascertainment methods, prediction horizons, sensor pipelines, validation stages, and reported metrics were not exchangeable, and several cohorts contributed multiple reports. We therefore performed a structured narrative synthesis without meta-analysis, reported according to SWiM [18] and organized into five domains: evidence architecture and validation stage; sensing technologies and gait phenotypes; outcomes and horizons; discrimination, incremental value, calibration, and clinical utility; and risk of bias, applicability, and clinical readiness. Reports were grouped by cohort family, validation stage, and intended-use category (Section 1), and the 10 reports assessed without complete-article access formed a secondary evidence tier (Section 2.4).
To avoid double counting, one representative AUC was selected per cohort family using a hierarchy defined during analysis (Section 2.10): (1) independent-cohort evaluation of an existing model with original coefficients; otherwise, prospective evaluation of a fixed model or score without refitting; (2) participant-level internal validation; or (3) apparent development performance or estimates for which validation could not be verified. Within a level, ties were resolved by preferring a complete-article source, then the earliest horizon with an exact AUC, then the primary (earliest) cohort report, then the authors’ principal or best final model. These choices prioritize validation strength and verifiable reporting while limiting repeated optimization within a cohort. An exact faller count was not required for the overall or validation-stage summaries; it was required only for event-count analyses and Figure 2. Table S6 records all selections and alternatives. Lowest and highest alternatives were restricted to eligible wearable- or vision-derived, gait-containing models, excluding clinical-only, walkway-only and static-sway-only comparators, observation-level splits, and directionally inconsistent source results. Medians, IQRs and ranges are unweighted exploratory descriptions, not pooled estimates of a common performance. Quartiles use linear interpolation (type 7) on the values tabulated in Table S6, followed by decimal half-up rounding for two-decimal display. The three AUC estimates with unverified validation methods are grouped conservatively with apparent estimates, not counted as verified internal validation. Single-family strata show individual AUCs. Event bands (≤15, 16–39 and ≥40 fallers) are descriptive; they do not estimate causal effects of sample size or validation rigor. All summaries can be recalculated from the values tabulated in Tables S2 and S6.
Figure 2.
Representative AUC by number of participants with the outcome and validation stage. The 23 plotted families have both an exact AUC and a verified faller count. Greene 2012 [24], Giardini 2025 [27] and Al Abiad 2023 [28] contribute to the 26-family AUC summary but are omitted here because faller counts were not verifiable or reported. The apparent legend category includes two plotted estimates with unverified validation methods (Ma 2022 [29] and Suffoletto 2026 [22]); neither is counted as verified internal validation. Open markers identify estimates without complete-article access; bars show reported 95% confidence intervals or ranges across resamples, not interchangeable uncertainty measures. The full Roshdibenam 2021 [30] resampling range (0.33–0.74) is shown. * Marques 2018 [26] is flagged for source numerical inconsistencies and examined in a family-exclusion sensitivity analysis. No pooled estimate or trend is fitted. Marker labels identify cohort families by first author and year; the corresponding reports are cited in Table 2.
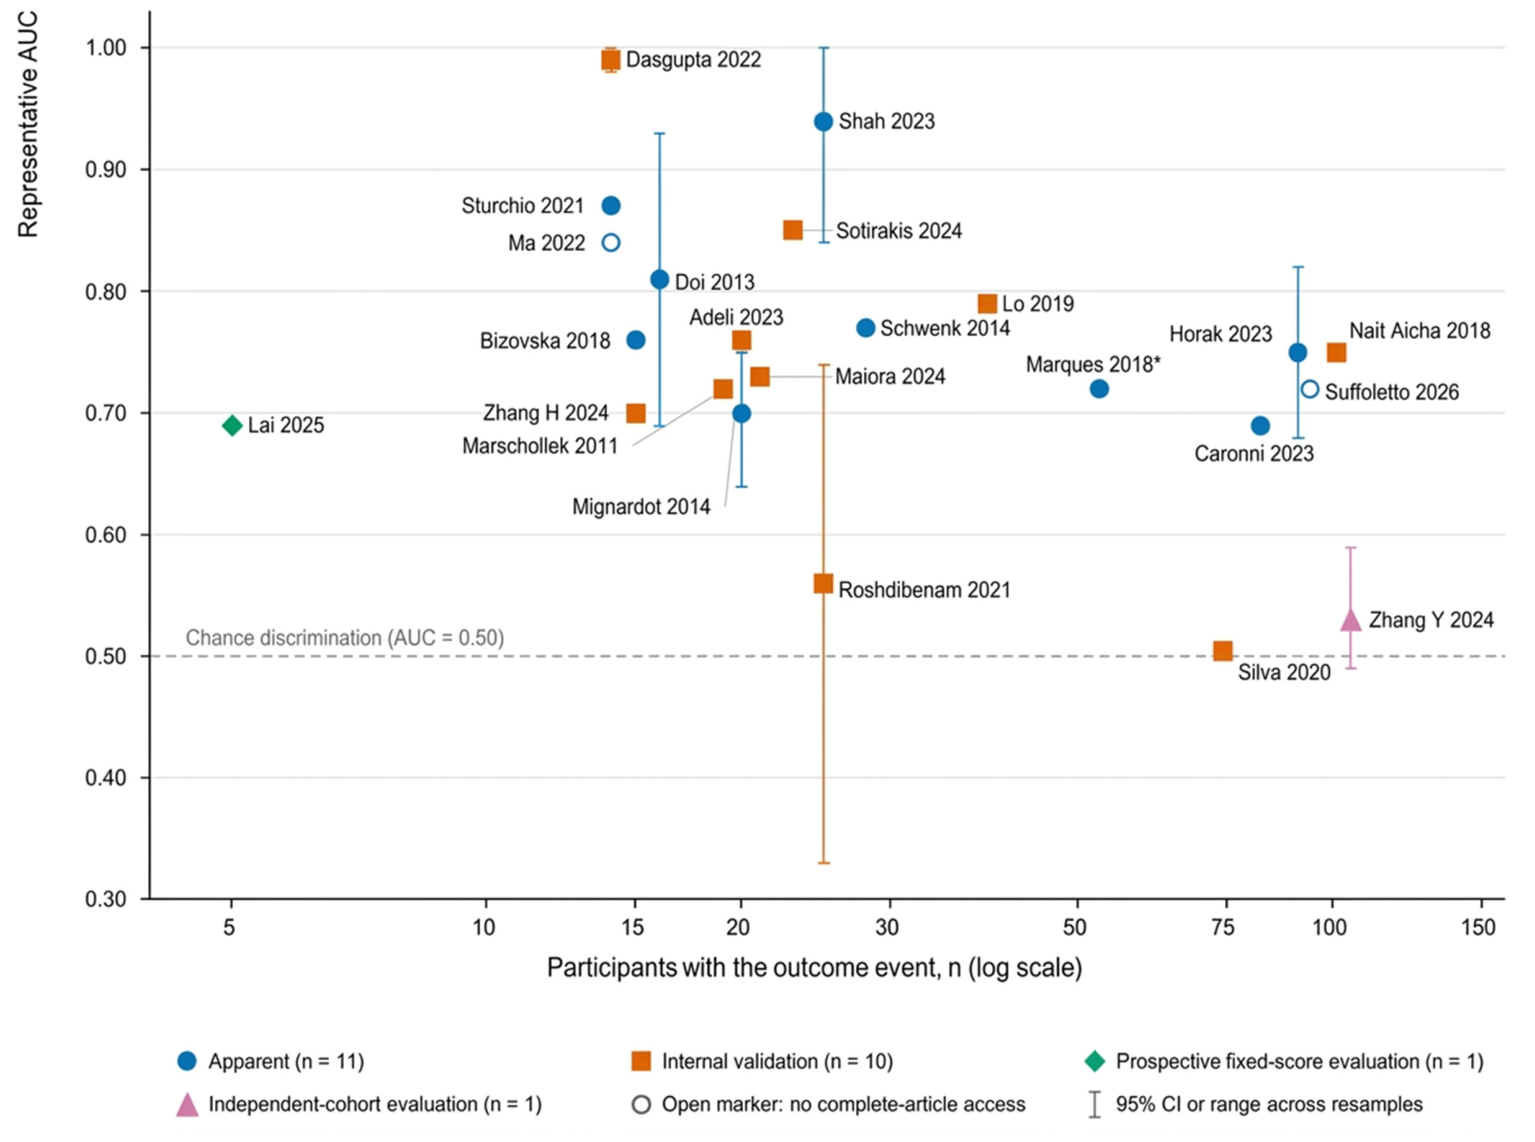
Table 2.
Characteristics and principal results of the 37 cohort families (47 reports).
Table 3.
Descriptive summary of representative AUCs and sensitivity analyses.
Table 4.
Evidence available against review-specific descriptive criteria for the clinical readiness of wearable- and vision-based gait models predicting future falls.
Robustness was examined by selecting the lowest or highest eligible AUC per family, preferring the most recent report, excluding abstract-derived representative estimates, excluding the source-inconsistent Marques 2018 [26] family, and setting all non-analysis appraisal domains to low. A probably overlapping report was also treated as an independent cohort. No formal small-study-effect test was performed because no common model performance estimand was pooled. Reporting bias was considered qualitatively based on model multiplicity, selective presentation, incomplete uncertainty and scarcity of independent evaluations.
2.9. Certainty of Evidence and Clinical Readiness
A formal certainty assessment was not performed. Guidance on grading prognostic model discrimination addresses a body of validation studies for a specified model [71]; this review instead mapped heterogeneous models, and no model had multiple independent-cohort evaluations. We therefore report the limitations relevant to certainty—risk of bias, imprecision and event sparsity, inconsistency, indirectness and reporting bias—without assigning a categorical certainty rating. Clinical readiness is a separate, review-specific descriptive construct, informed by prediction model guidance [14,15,70,72,73], not a validated instrument. Section 3.10 records whether evidence exists for temporal separation, evaluation beyond development, fixed-model prospective evaluation, independent-cohort evaluation, faithful pipeline replication, replication in multiple cohorts, calibration, decision analysis, low evaluation bias, and clinical impact. Each criterion has an explicit rationale. The categories describe evidence availability and do not establish that a model is safe or effective for deployment.
2.10. Analytical Decisions Made During the Review
Because no protocol preceded the searches, none of the analytical decisions below can be regarded as prospectively prespecified. The documented original search cut-off was 20 July 2026; the PROSPERO record was submitted on 9 September and registered on 10 September 2026 (Section 2.1). Exact completion dates and time-stamped project logs for title/abstract screening, report assessment, extraction and initial appraisal are unavailable in the retained archive. Dated execution records for revision activities, including expanded database reruns, search string peer review and item-level appraisal work, are also unavailable; intermediate stage completion dates are therefore not reconstructed. All analytical rules are classified as post hoc: (1) the representative result hierarchy and tie-breaking order (Section 2.8), which replaced an earlier rule that preferred the model with higher sensitivity when the alternative had a sensitivity below 0.40; that rule had been applied to one family, for which tie-breaking step (d) selects the same estimate; (2) the descriptive event-count bands (≤15, 16–39 and ≥40 fallers); (3) the complete-article sensitivity analysis and secondary source-access tier; (4) the risk-of-bias sensitivity analysis setting non-analysis domains to low; (5) the known-item mobility check (Section 2.3); (6) the formalized index measure and individualized performance eligibility rules (Section 2.2); and (7) the descriptive clinical readiness criteria (Section 2.9) and source inconsistency sensitivity analysis. Section 3.6 quantifies the influence of the synthesis decisions on the performance summaries.
3. Results
3.1. Study Selection
The documented original searches identified 14,912 records: 14,667 through databases and registers and 245 through other methods (Supplementary Table S1). After removal of 5433 duplicates, 9479 records were screened, and 9127 were excluded. Of 352 reports sought, 11 could not be retrieved, and 341 were assessed for eligibility, including 10 assessed without complete-article access (Figure 1; Supplementary Table S3). Of the 341 reports, 294 were excluded, most commonly because they lacked a prospective fall outcome or valid temporal separation (n = 99), addressed fall detection (n = 53), or reported no individualized performance (n = 44) (Supplementary Table S4). Forty-seven reports representing 37 cohort families were included: 37 were assessed with complete articles and 10 without complete-article access [22,24,25,26,27,28,29,30,31,32,33,34,35,36,37,38,39,40,41,42,43,44,45,46,47,48,49,50,51,52,53,54,55,56,57,58,59,60,61,62,63,64,65,66,67,68,69]. Applying the explicit index measure and individualized performance rules (Section 2.2) to the included reports and to the excluded reports listed in Supplementary Table S4 did not change any eligibility decision. For example, the largest prospective study of injurious falls identified (32,619 UK Biobank participants with wrist-sensor gait measures) was excluded because it reported hazard ratios, model fit statistics, and risk-group event rates but no individualized discrimination, calibration, or classification [74] (Supplementary Table S4).
3.2. Study and Model Characteristics
Cohort families ranged from 15 to 1705 participants, and 24 of 37 enrolled fewer than 150 participants (Table 2; report-level extraction in Supplementary Table S2). By intended-use population, 22 reports studied community-dwelling older adults, 12 people with Parkinson disease, dementia, or other neurological conditions, seven residents of nursing homes or long-term care, four hospital or rehabilitation patients, and two emergency department patients. In a mutually exclusive population and setting grouping, the 37 cohort families comprised 17 community-screening families, 10 disease-specific families, five long-term care families, three families addressing short-term risk after hospital or emergency department discharge [22,27,59], and two other hospital or clinic families [30,31,32]; these groups differ from the overlapping clinical use cases in Section 1, and dynamic, rolling-horizon prediction was addressed by one dementia family [25,56]. Prediction horizons ranged from 7 days to 5 years, most commonly 6–12 months. Any fall was the dominant outcome; recurrent falls, first falls, and fall counts were modeled less often, and no included model predicted injurious falls (Section 3.1). Three reports contained source-level numerical inconsistencies; only affected metrics were excluded or qualified (Section 2.5): partition counts that did not sum to the reported total [58], classification percentages that could not arise from a single 2 × 2 table because they summarized repeated runs [57], and single-predictor results that were incompatible with the stated denominators and with their own AUCs [26] (Table 2 footnotes).
Forty-five reports used wearable or portable sensors—IMUs on the trunk, waist, shank, or foot; smartphones; instrumented insoles or footwear; and footswitches—and two linked reports from one dementia cohort used ambient computer vision [25,56]. Structured gait tasks predominated, particularly instrumented Timed Up and Go (iTUG) tests and straight walking; free-living monitoring lasted from 24 h to 14 days. Modeling approaches ranged from logistic and survival regression to classification trees, support vector machines, random forests, and deep neural networks. For three reports, only a separable prospective analysis was eligible: the baseline iTUG model against falls during one month after discharge [27], the participant-level model of new-onset falls at 18 months [48], and the logistic model of falls over 6 months [29].
3.3. Evidence Architecture and Validation Stage
Requiring completion of gait measurement before fall follow-up excluded many studies commonly cited as fall prediction evidence. The included evidence also contained substantial dependence: seven multi-report cohort families accounted for 17 reports, including four reports from the Fall-Risk Assessment in Older Adults (FARAO) cohort [38,39,40,41] and three from one Canadian research program [42,43,44] (Supplementary Table S5). Because participant independence could not be established for one of these reports [44], it was grouped with the program; treating it as independent (38 families) did not change any conclusion.
Twelve reports presented confirmed apparent performance only, 23 presented internal validation, three presented prospective fixed-model evaluation, two presented target-sample updating, and one presented independent-cohort evaluation. Validation methods could not be verified for six reports assessed without complete-article access [22,27,29,42,49,50]. Fifteen cohort families had no verified estimate beyond development. One updating report first evaluated prior fixed parameters. Thus, 28 reports from 22 families had verifiable performance beyond development (Section 3.10). Internal validation did not guarantee unbiased estimates: full-dataset feature selection or tuning occurred in several reports (Tables S2 and S7). Splitting repeated walking samples rather than participants produced an AUC of 0.94, compared with 0.65–0.75 for participant-level evaluation [41]. Two complete-article reports nested model selection within training partitions [53,67], and one used a prespecified held-out test set after development set tuning [58].
3.4. Sensing Technologies and Gait Phenotypes
Structured tests captured iTUG phases, turning, postural transitions, straight walking, and dynamic stability, whereas free-living monitoring captured walking quantity, bout structure, pace, rhythm, variability, smoothness, symmetry, harmonicity, and complexity. Gait variability, trunk stability and harmonicity, turning, and the distribution of daily walking bouts were among the retained predictors in several reports [35,38,47,60,63]; because predictors were not tallied across all cohort families and feature definitions differed, no comparison of the predictive value of individual features was made. Nominally similar features were computed with different devices, axes, filters, bout definitions, and aggregation windows, so they were not directly equivalent across studies.
Ambient computer vision was evaluated in a single long-term care dementia cohort. Frequently updated vision-derived gait features were associated with an increase in the internally validated AUC for a fall within the next 4 weeks from 0.56 without gait to 0.76 with gait (sensitivity 0.73, specificity 0.73) [56], and an earlier report from the same cohort reported AUCs of 0.80 at 7 days and 0.67 at 30 days [25]. These results derive from one site and require independent validation across camera environments and populations.
3.5. Outcomes and Prediction Horizons
Horizons ranged from 7–30 days in dementia care [25,56] to 3–12 months in most community and clinical cohorts and 24–60 months in one Parkinson disease cohort [64]. These tasks differ in baseline risk, intervention opportunity, and the acceptable balance of false-positive and false-negative predictions. Fall ascertainment ranged from daily calendars with regular telephone contact to telephone follow-up after 1–2 years [24,31] and facility records. Where a first-fall outcome was modeled over successive intervals, discrimination was lower in later intervals and absent beyond 12 months [36]. In the only fall count model, fitted to 15 people with Parkinson disease, explained variance changed from 0.50 to 0.73 after exclusion of participants with more than 10 falls, including one participant who reported 127 falls [46].
3.6. Discrimination Across Validation Stages
A representative exact AUC was available for 26 of 37 cohort families (Supplementary Table S6). Representative AUCs ranged from 0.51 to 0.99, with an unweighted median of 0.75 (IQR 0.70–0.81) (Table 3); this descriptive summary combines prediction tasks that differ in horizon, setting, outcome definition, and validation stage and is not an estimate of a common performance. Descriptively, the median was 0.77 for the apparent-or-unverified group (12 families: nine confirmed apparent and three with unverified validation) and 0.74 for internal validation (12 families); the single prospectively evaluated fixed score had an AUC of 0.69 [69], and the single independent-cohort evaluation had an AUC of 0.53 [68]. Exact faller counts were available for 23 of these 26 families. In that subset, medians were 0.80 for ≤15 fallers, 0.77 for 16–39 fallers, and 0.72 for ≥40 fallers (Figure 2). These are exploratory, unadjusted comparisons across studies: the strata differ in population, outcome, horizon, and model; the external stratum contains one cohort; and the gradient was not monotonic in the complete-article subset (below), so the pattern cannot be attributed to validation rigor or sample size.
The summaries were moderately sensitive to the selection rule but not materially to source access (Table 3). Unweighted medians were 0.72 and 0.78 under the lowest-estimate and highest-estimate selection rules, respectively (IQRs 0.67–0.79 and 0.71–0.85), and 0.76 (IQR 0.71–0.83) when the most recent rather than the primary report was preferred within a family. Excluding the four families whose representative estimate came from a report assessed without the complete article left 22 families with a median of 0.74 (IQR 0.69–0.79); the apparent and internal validation strata comprised nine and 11 families, with medians of 0.76 and 0.73, respectively. The complete-article sensitivity analysis included five, 10, and six families across the three event-count bands, with medians of 0.76, 0.77, and 0.71. Excluding the source-inconsistent Marques 2018 [26] family left 25 families, with a median AUC of 0.75 (IQR 0.70–0.81; range 0.51–0.99).
Several of the highest values came from small, flexibly modeled samples: an emergency department neural network reported a leave-one-out AUC of 0.99 (95% CI 0.98–1.00) with 14 fallers [59], and a Parkinson disease model reported an apparent AUC of 0.94 (95% CI 0.84–1.00) after best-subset selection from 80 candidate measures in 34 participants [63]. A post-fracture model reported an AUC of 0.91, but the validation procedure and exact faller count could not be verified from the accessible abstract [27]. Within one instrumented footwear cohort of 95 participants with 15 fallers, the internally validated AUC was 0.70 in the primary report and 0.89 in a later re-analysis of the same participants after revision of the gait estimation algorithm and model search [65,66]. Several larger or more stringently evaluated studies reported modest or near-chance discrimination: AUCs of 0.50–0.51 across repeated splits for multisensor fusion in 281 community-dwelling adults [53], 0.56 (range across resamples 0.33–0.74) in a secondary prospective analysis in a geriatric clinic [30], a mean of 0.67 (SD 0.05 across repeated hold-out splits) for step-based parameters [28], and a sensitivity of 0.61 with a specificity of 0.66 in a held-out test set from a 1705-participant cohort [58].
3.7. Incremental Value over Clinical Information
Several reports compared gait-containing models with clinical information in the same participants. Daily-life accelerometry was associated with an increase in the apparent AUC from 0.68 for questionnaires and clinical tests to 0.82 in community-dwelling adults [38]; instrumented stand-and-walk measures with an increase from 0.69 for age and fall history to 0.75 (95% CI 0.68–0.82) in older men [61]; and selected daily-life gait and turning features with an increase from 0.77 for fall history to 0.94 in Parkinson disease [63]. In neurological rehabilitation, adding Timed Up and Go turning duration to fall history increased the AUC only from 0.66 to 0.69, the same gain as a clinical balance scale [60]. In the largest emergency department cohort (360 participants; 94 fallers), adding four IMU-derived features to nine clinical predictors increased the AUC from 0.67 to 0.72 (p = 0.19) and, at a prespecified 30.00% risk threshold, sensitivity from 0.45 to 0.57 and specificity from 0.76 to 0.80 [22]. These increments were apparent estimates or lacked verifiable optimism correction in the accessible source material and should be interpreted cautiously.
3.8. Calibration, Clinical Utility, and Independent-Cohort Evaluation
Calibration intercept and slope were reported in only one of 47 reports (2.13%) [68]: when the original combined gait–questionnaire model was applied to a new cohort, the calibration intercept was −0.83 and the slope was 1.40 for all falls. Four further reports provided related information that does not establish calibration: Brier scores, which measure overall accuracy, in two [31,32]; Hosmer–Lemeshow goodness-of-fit tests in one [38]; and a qualitative comparison of predicted and observed survival in one [25]. No report (0 of 47) presented a calibration plot, and none reported decision curve analysis, net benefit, or the effect of model use on clinical decisions or fall rates. Operating points were frequently unbalanced. In one nursing home cohort, the bidirectional long short-term memory (BLSTM) network trained with the Adam optimizer had the highest reported AUC (0.78) but a sensitivity of 0.33, whereas the BLSTM trained with stochastic gradient descent with momentum (SGDM), which the authors designated as their best model, had an AUC of 0.73, a sensitivity of 0.50, and a specificity of 0.92 [67]. A commercial score achieved a sensitivity of 1.00 but a specificity of 0.38 and a positive predictive value of 0.20 [69], and a sensor-supplemented Timed Up and Go rule had a specificity of 0.96 but a sensitivity of 0.29 [52].
The single independent-cohort evaluation applied three previously published questionnaire and trunk accelerometry models, with their original coefficients and cut-offs, to 263 new participants, of whom 105 fell [68]. Before any updating, the gait-containing models achieved AUCs of 0.49–0.59, sensitivities of 0.32–0.55, and specificities of 0.45–0.89, and a questionnaire-only comparator performed at least as well (AUC up to 0.68). The original models were miscalibrated in the new cohort. After recalibration and updating in the same cohort, AUCs of the gait-containing models were 0.51–0.62; these updated estimates are target-sample results rather than external validation. Because predictor processing differed from the original development pipeline, this study is an independent-cohort evaluation of the published model coefficients but not a faithful replication of their complete sensor-to-model pipelines. A separate prospective blind test of a random forest classifier trained on fall history reported an accuracy of 0.82, a sensitivity of 0.87, and a specificity of 0.80 in 44 participants with nine fallers [57]; these values summarize 10 random forest runs with different random seeds (reported as means with standard errors) and cannot correspond to a single fixed 2 × 2 table because, with nine fallers, a single-run sensitivity can only take values such as 0.78 or 0.89. Evidence on hardware and software transferability was minimal. No included report evaluated a fixed model across device models, sensor placements, firmware or software versions, or camera installations; within one cohort, revising only the gait estimation algorithm changed the AUC from 0.84 to 0.89 [66]; and the only independent-cohort evaluation reconstructed predictors with processing that differed from development [68]. No model was evaluated in more than one independent cohort.
3.9. Risk of Bias and Applicability
The primary appraisal synthesis was restricted to complete-article reports. All 35 applicable development assessments had high overall quality concerns (Part A), and all 37 model evaluations had high overall risk of bias (Part B) (Figure 3; Table S7). The analysis-domain judgment was high in all 35 development assessments and in 36 of 37 evaluations. Development concerns included sparse events, data-driven selection and inadequate protection against overfitting; evaluation concerns included apparent performance, selection outside validation loops and absent calibration reporting. The evaluation with a low analysis-domain judgment remained high overall because predictor reconstruction differed from the development specification [68]. In Part B, participants and data sources were low in 18, unclear in two and high in 17 reports; predictors were low in 34, unclear in one and high in two; and outcome was low in 30, unclear in two and high in five. These are the retained domain-level judgments, which are interpreted provisionally because complete official item-level forms are not included in the Supplementary Materials.
Figure 3.
Retained domain-level PROBAST+AI development quality concerns (Part A), evaluation risk of bias (Part B), and applicability judgments for complete-article reports. Panels (A–C) use 35 applicable development and 37 evaluation assessments; numbers in bars are report counts. The 10 reports without complete-article access are not evaluable and are excluded (Table S7). The published judgments remain provisional because complete official item-level forms are not included here. The single-predictor cut-point analysis of Marques 2018 [26] uses a declared adaptation of the tool.
The 10 reports without complete-article access were not included in formal quality, risk-of-bias or applicability counts because methodological detail was insufficient for reproducible appraisal. Their NE labels in Table S7 indicate inability to appraise, not evidence of low risk. Among complete-article evaluations, setting every non-analysis domain to low would change one overall judgment to low: the independent-cohort evaluation [68]. This sensitivity analysis does not substitute for the tool’s standard domain-based judgment.
Among complete-article reports, overall applicability concern was high in four and low in 31 of 35 development assessments; it was high in four, unclear in one and low in 32 of 37 evaluation assessments (Table S7). Concerns arose from case-mix restrictions, retrospective or clinician-rated development targets, and predictor reconstruction differing from development. Applicability to an intended disease-specific population should not be confused with generalizability to all older adults: 25 of 47 reports studied disease-specific, institutional, hospital or emergency department populations.
3.10. Clinical Readiness
Table 4 summarizes the evidence against the review-specific readiness criteria and the justification for each criterion. Gait measurement before the outcome window and performance estimated beyond the development data (28 reports from 22 cohort families) were each satisfied in two or more cohort families, and prospective evaluation of a fixed model without refitting was satisfied in five. Independent-cohort evaluation and calibration intercept and slope were each satisfied in one cohort family only. Faithful replication of a complete pipeline and a low overall domain-level risk-of-bias judgment were assessed but not satisfied; evaluation in two or more independent cohorts, calibration plots, decision curve or net benefit analysis, and evaluation of clinical impact were not assessed in any report. Reporting bias could not be assessed formally, but most small studies compared multiple features, classifiers, or thresholds while reporting incomplete uncertainty, and null independent evaluations were rare, so selective reporting is plausible.
4. Discussion
4.1. Principal Findings
This systematic review of 47 reports from 37 cohort families found that wearable- and vision-derived gait measures discriminated future fallers from non-fallers to a highly variable degree (representative AUCs 0.51–0.99), almost entirely in development and internal validation analyses. Several models added discrimination to fall history or brief clinical tests in the same data, but these increments were not optimism-corrected. Interpretation is limited by pervasive high risk of bias (all 37 complete-article evaluations high; 10 reports without complete-article access not evaluable), extreme event sparsity (six representative estimates based on 15 or fewer fallers), limited independent external validation (one independent-cohort evaluation, with AUCs of 0.49–0.59), and missing calibration reporting (one of 47 reports). The evidence therefore does not establish that any wearable- or vision-based model is ready for routine clinical deployment.
4.2. Comparison with Previous Reviews
Earlier reviews documented the promise of inertial sensors for characterizing fallers and warned that small samples and flexible modeling may inflate reported accuracy [4,5,7]. Subsequent reviews broadened this picture: a systematic review of 54 studies of automatic wearable monitoring included fall-risk targets defined by retrospective fall history, prospective falls, or clinical scales [9]; a systematic review of 25 studies of wearable fall-risk assessment compared sensor, feature, and model choices descriptively [10]; a scoping review mapped wearable-sensor fall-risk prediction models in community-dwelling older adults [11]; and a scoping review of computer vision applied to conventional gait videos concluded that the evidence supported technical feasibility and preliminary screening or classification rather than established clinical validity [12]. A 2026 diagnostic accuracy meta-analysis of 20 wearable studies, 19 of which were prospective, applied a bivariate model to 2 × 2 data reconstructed from reported or digitized accuracy values and reported a summary AUC of 0.85, pooled sensitivity of 0.55, and specificity of 0.89 [13]. The present review addresses a different estimand. Rather than pooling accuracy at reported thresholds, it restricted eligibility to individualized prediction of falls occurring after gait measurement, grouped overlapping reports by cohort family, included vision-based as well as wearable sensing, and kept apparent, internally validated, prospective, and independent-cohort estimates separate. Because a summary receiver operating characteristic AUC from a bivariate meta-analysis and an unweighted median of heterogeneous representative AUCs are not exchangeable quantities, their magnitudes should not be compared directly. The distinctive contribution of the present review is instead to show that almost all available performance evidence comes from the development cohorts themselves, which pooled accuracy estimates cannot reveal; the approaches are therefore complementary.
4.3. Why Reported Performance May Overstate Clinical Readiness
Several mechanisms can make reported discrimination optimistic, although this review cannot quantify their individual contributions. First, events were sparse: 24 of 37 cohort families enrolled fewer than 150 participants, and six representative estimates with an exact event count were based on 15 or fewer fallers, far below the sample sizes recommended for stable model development and precise evaluation [70,75]. Second, information can leak between training and test data when repeated windows from one participant are split across partitions or when features are selected on the full dataset before resampling [8]; one included study quantified an increase from 0.65–0.75 to 0.94 [41]. Third, calibration was rarely assessed, although a well-discriminating model can still systematically over- or underestimate risk, which determines whether a threshold-based decision is appropriate [72]. Fourth, no study linked predictions to a clinical action, so net benefit at plausible thresholds remains unknown [73]. The lower median AUC in higher event-count bands should be interpreted only as an exploratory, unadjusted, between-study (ecological) pattern: it does not demonstrate a small-study effect or any of the mechanisms above; it is confounded by differences in population, outcome, horizon, and model; and it was not monotonic when the analysis was restricted to complete articles.
4.4. Technologies, Gait Phenotypes, and Outcomes
Wearables supported two complementary strategies. Structured instrumented tests quantify turning, transitions, and dynamic stability during a standardized encounter and may suit rapid triage in clinics or emergency departments [22,24,60]. Free-living monitoring captures habitual exposure, variability, and day-to-day walking organization and may suit ongoing surveillance [38,58,63]. Neither strategy was consistently superior. Free-living walking quantity is also ambiguous because more walking may indicate greater capacity but also more exposure to fall opportunities; models should separate vulnerability from exposure. Ambient vision avoids device burden and enables frequently updated risk estimates, but all prospective evidence came from one dementia facility [25,56]; transfer will require validation of both the measurement layer and the prognostic model because camera geometry, lighting, occlusion, walking aids, and software versions can alter predictors before any classifier is applied. More generally, external validation of model coefficients and replication of the complete sensor-to-model pipeline answer different questions: the first asks whether a published equation translates to new participants and the second whether the same hardware, placement, acquisition protocol, and processing reproduce the predictors before the equation is applied. Neither form of evidence is yet adequate: the one independent-cohort evaluation reconstructed predictors with different processing [68], no report evaluated a fixed model across devices or software versions, and within one cohort, a change in the gait estimation algorithm alone changed discrimination [66]. Finally, predicting a fall within the next week in long-term care, within 6 months after emergency discharge, and within 5 years in Parkinson disease are different clinical tasks that warrant different thresholds and separate validation within their own intended-use populations.
4.5. Implications for Clinical Practice
Based on current evidence, sensor-derived gait measures should complement, not replace, guideline-recommended multifactorial fall-risk assessment [2]. Until a model has been independently validated and calibrated in the intended setting, gait-derived risk estimates should not be used alone to allocate or withhold fall prevention interventions. Their use in research or further clinical assessment requires evaluation within the intended setting. Clinicians and health systems evaluating commercial fall-risk devices should ask for independent-cohort validation, calibration, performance at the intended decision threshold, and identification of the device and software version that was evaluated, rather than development-sample accuracy or AUC alone.
4.6. Priorities for Future Research
Table 5 translates the gaps identified in this review into minimum standards for future studies. The immediate priority is adequately powered, independent, multisite validation of existing models with their measurement and signal-processing pipelines fully specified [70], reported according to TRIPOD+AI [15]. Alongside validation and impact studies, priorities include version control of devices, firmware, signal-processing code, and models so the evaluated pipeline can be identified and reproduced; harmonization of sensor placement, sampling, and feature definitions, or explicit evaluation across devices and placements; decision thresholds prespecified and linked to defined clinical actions; predefined monitoring of calibration, with triggers for recalibration or model updating when performance drifts; and model explainability appropriate to the intended clinical user so clinicians can see which gait features drive an individual prediction [15,72]. Injurious fall prediction is a distinct unmet need: no included model predicted injurious falls, and the largest relevant cohort reported hazard ratios and risk-group event rates rather than individualized performance [74], so validated individualized prediction of injurious falls remains unavailable despite their direct relevance to hospitalization and loss of independence. Studies should use consensus fall definitions and prospective daily calendars with regular follow-up [76], account for death and other competing events, and compare gait-containing models with a parsimonious clinical model. Only after transportability has been demonstrated should impact studies test whether model-guided care improves decisions and reduces falls.
Table 5.
Evidence gaps identified and minimum standards for future gait-based fall prediction studies.
4.7. Strengths and Limitations
This review used a strict definition of prospective prediction, searched clinical and engineering databases, clustered overlapping publications, separated development from evaluation, reported domain-level PROBAST+AI judgments and their rationales, judged applicability against each model’s intended-use population, reported every representative estimate selection under a uniform rule, and tested the robustness of its summaries in sensitivity analyses. It preserved poor and null results rather than pooling non-exchangeable estimates, and the synthesis is reported according to SWiM.
Several limitations affect interpretation. First, expanded database reruns and peer review of the strings were undertaken during revision, but their dated execution histories, yields, screening dispositions and completed PRESS record are not archived with this report. The flow and synthesis remain tied to the documented original search dataset; the completeness of the revised search cannot be independently checked. Original registry, hand search, citation search and author contact logs are also unavailable. English-language and journal publication restrictions may introduce bias. Second, registration was retrospective and no protocol preceded the search, so the prospective method safeguard represented by AMSTAR 2 item 2 was not met; all analytical decisions in Section 2.10 were post hoc. Exact stage completion dates and time-stamped operational logs for screening, report assessment, extraction, initial appraisal and revision activities are unavailable. Third, screening, extraction and appraisal used dependent second-reviewer verification, not independent duplication. No auditable independent sample reassessment, paired pre-consensus decisions or reviewer-level adjudication logs are available; neither an independent disagreement rate nor Cohen’s κ can be estimated, and verification may propagate errors. Fourth, complete articles were unavailable for 10 reports (21.28%); these form a secondary tier based on abstracts and, for specified fields, publisher-indexed excerpts, which are not formally appraised and are excluded in a performance sensitivity analysis. Fifth, PROBAST+AI was adapted for the single-predictor analysis of Marques et al. (2018) [26]. Complete official item-level forms for all 37 complete-article reports are not included, so the retained domain-level judgments remain provisional, and item-by-item reproducibility is not established. Sixth, source material and derived values are identified, but systematic cell-level source coordinates are unavailable; source numerical anomalies and their influence remain explicitly flagged. Only 26 of 37 families supplied an exact representative AUC. Selection is post hoc, comparisons are unadjusted and ecological, and heterogeneous tasks preclude a common pooled performance estimate. Finally, no formal certainty rating or quantitative reporting bias assessment was undertaken.
5. Conclusions
Reported discrimination of wearable- and vision-based gait models for predicting future falls in older adults varied substantially and was derived predominantly from small development or internally validated cohorts at high risk of bias. Evidence from independent external cohorts, calibration assessments, decision curve analyses, and clinical impact evaluations remains insufficient. Current evidence does not support routine clinical deployment. This conclusion reflects evidentiary readiness rather than the biological or technical potential of gait-derived biomarkers. Progress depends on adequately powered, independent, multisite validation of fully specified and version-controlled sensor-to-model pipelines, with calibration, prespecified decision thresholds, net benefit analysis, and subsequent impact evaluation.
Supplementary Materials
The following supporting information can be downloaded at https://www.mdpi.com/article/10.3390/diagnostics16223752/s1: Table S1: Original search strategies as recorded, limits, dates, and yields; Table S2: Report-level data extraction for the 47 included reports, with source material identified; Table S3: Reports assessed without complete-article access (secondary evidence tier); Table S4: Excluded reports that might appear eligible, with reasons; Table S5: Cohort overlap map; Table S6: Representative estimate selection for each cohort family; Table S7: Domain-level PROBAST+AI development quality, evaluation risk-of-bias, and applicability judgments (Panels A and B), with rationales and not-evaluable designations for reports without complete-article access; PRISMA 2020 checklist.
Author Contributions
Conceptualization, M.S.A. and Y.H.J.; methodology, M.S.A., Y.H.J. and A.H.I.; validation, F.M.A.S. and M.G.A.; formal analysis, M.S.A. and A.H.I.; investigation, M.S.A., Y.H.J., F.M.A.S. and M.G.A.; data curation, A.H.I. and F.M.A.S.; writing—original draft preparation, M.S.A. and Y.H.J.; writing—review and editing, A.H.I., F.M.A.S. and M.G.A.; visualization, A.H.I.; supervision, Y.H.J.; project administration, Y.H.J.; funding acquisition, Y.H.J. All authors have read and agreed to the published version of the manuscript.
Funding
This research was funded by the King Salman Center for Disability Research, grant number KSRG-2026-455.
Institutional Review Board Statement
Not applicable; this systematic review analyzed data from published studies.
Informed Consent Statement
Not applicable.
Data Availability Statement
Supplementary Tables S1–S7 contain the retained original search strategies and yields, report-level extractions with source material labels, exclusion rationales, cohort links, representative AUC selections and domain-level appraisal records. Table S6 records the representative AUC values and Table S2 the report-to-family validation classifications from which the descriptive AUC summaries and validation counts are calculated; no separate data files or analysis code are supplied. Expanded search execution histories, rerun yields and screening dispositions, a completed PRESS record, exact intermediate stage dates and time-stamped project logs, a prospective standalone protocol, source-level histories for the original supplementary searches, and systematic cell-level extraction locators are unavailable. No auditable independent sample reassessment, paired blinded pre-consensus decisions/ratings or reviewer-level adjudication logs are supplied; neither independent disagreement rates nor Cohen’s κ can be estimated. Complete official item-level PROBAST+AI forms for all 37 complete-article reports are not included; Table S7 is a provisional domain-level record and does not establish item-by-item reproducibility.
Acknowledgments
The authors extend their appreciation to the King Salman Center for Disability Research for funding this work through Research Group Number KSRG-2026-455.
Conflicts of Interest
The authors declare no conflicts of interest. The funders had no role in the design of the study; in the collection, analysis, or interpretation of data; in the writing of this manuscript; or in the decision to publish the results.
Abbreviations
- The following abbreviations are used in this manuscript:
AMSTAR 2, A MeaSurement Tool to Assess systematic Reviews, version 2; AUC, area under the receiver operating characteristic curve; BLSTM, bidirectional long short-term memory; CHARMS, Critical Appraisal and Data Extraction for Systematic Reviews of Prediction Modelling Studies; CI, confidence interval; C-index, concordance index; FARAO, Fall-Risk Assessment in Older Adults; GRADE, Grading of Recommendations Assessment, Development and Evaluation; IMU, inertial measurement unit; IQR, interquartile range; iTUG, instrumented Timed Up and Go; NR, not reported; PICOTS, population, index model, comparator, outcome, timing, and setting; PRESS, Peer Review of Electronic Search Strategies; PRISMA, Preferred Reporting Items for Systematic Reviews and Meta-Analyses; PRISMA-S, PRISMA extension for reporting literature searches; PROBAST+AI, Prediction model Risk Of Bias ASsessment Tool, updated for regression and artificial intelligence methods; QTUG, Quantitative Timed Up and Go; QUIPS, Quality In Prognosis Studies; RoB 2, Cochrane risk-of-bias tool for randomized trials; ROBINS-I, Risk Of Bias In Non-randomized Studies of Interventions; SD, standard deviation; SE, standard error; SGDM, stochastic gradient descent with momentum; SWiM, Synthesis Without Meta-analysis; TRIPOD+AI, Transparent Reporting of a multivariable prediction model for Individual Prognosis Or Diagnosis, updated for regression and machine learning methods; TRIPOD-SRMA, TRIPOD checklist for systematic reviews and meta-analyses; TUG, Timed Up and Go.
References
- World Health Organization. Falls. Available online: https://www.who.int/news-room/fact-sheets/detail/falls (accessed on 30 July 2026).
- Montero-Odasso, M.; van der Velde, N.; Martin, F.C.; Petrovic, M.; Tan, M.P.; Ryg, J.; Aguilar-Navarro, S.; Alexander, N.B.; Becker, C.; Blain, H.; et al. World guidelines for falls prevention and management for older adults: A global initiative. Age Ageing 2022, 51, afac205. [Google Scholar] [CrossRef] [Scilit] [PubMed]
- Verghese, J.; Holtzer, R.; Lipton, R.B.; Wang, C. Quantitative gait markers and incident fall risk in older adults. J. Gerontol. A Biol. Sci. Med. Sci. 2009, 64A, 896–901. [Google Scholar] [CrossRef] [Scilit] [PubMed]
- Howcroft, J.; Kofman, J.; Lemaire, E.D. Review of fall risk assessment in geriatric populations using inertial sensors. J. Neuroeng. Rehabil. 2013, 10, 91. [Google Scholar] [CrossRef] [Scilit] [PubMed]
- Patel, M.; Pavic, A.; Goodwin, V.A. Wearable inertial sensors to measure gait and posture characteristic differences in older adult fallers and non-fallers: A scoping review. Gait Posture 2020, 76, 110–121. [Google Scholar] [CrossRef] [Scilit] [PubMed]
- Han, X.; Guffanti, D.; Brunete, A. A comprehensive review of vision-based sensor systems for human gait analysis. Sensors 2025, 25, 498. [Google Scholar] [CrossRef] [Scilit] [PubMed]
- Shany, T.; Wang, K.; Liu, Y.; Lovell, N.H.; Redmond, S.J. Review: Are we stumbling in our quest to find the best predictor? Over-optimism in sensor-based models for predicting falls in older adults. Healthc. Technol. Lett. 2015, 2, 79–88. [Google Scholar] [CrossRef] [Scilit] [PubMed]
- Kapoor, S.; Narayanan, A. Leakage and the reproducibility crisis in machine-learning-based science. Patterns 2023, 4, 100804. [Google Scholar] [CrossRef] [Scilit] [PubMed]
- Olson, M.C.; Lockhart, T.E. Predicting fall risk through automatic wearable monitoring: A systematic review. Int. J. Progn. Health Manag. 2021, 12. [Google Scholar] [CrossRef] [Scilit]
- Chen, M.; Wang, H.; Yu, L.; Yeung, E.H.K.; Luo, J.; Tsui, K.-L.; Zhao, Y. A systematic review of wearable sensor-based technologies for fall risk assessment in older adults. Sensors 2022, 22, 6752. [Google Scholar] [CrossRef] [Scilit] [PubMed]
- Wang, B.; Liu, Y.; Lu, A.; Wang, C. Application of wearable sensors in constructing a fall risk prediction model for community-dwelling older adults: A scoping review. Arch. Gerontol. Geriatr. 2025, 129, 105689. [Google Scholar] [CrossRef] [Scilit] [PubMed]
- Banarjee, C.; Bilic, A.; Kwon, Y.J.; Rojas Aristizabal, S.; Lopez, J.; Xie, R.; Chen, C.; Thiamwong, L. Use of computer vision with conventional video recordings of gait in older adults: A scoping review. Healthcare 2026, 14, 2487. [Google Scholar] [CrossRef] [Scilit] [PubMed]
- Mou, C.; Yan, X.; Miao, X.; Zhu, L. Accuracy of wearable devices in predicting falls in older adults: A systematic review and meta-analysis. Front. Public Health 2026, 14, 1778750. [Google Scholar] [CrossRef] [Scilit] [PubMed]
- Moons, K.G.M.; Damen, J.A.A.G.; Kaul, T.; Hooft, L.; Andaur Navarro, C.; Dhiman, P.; Beam, A.L.; Van Calster, B.; Celi, L.A.; Denaxas, S.; et al. PROBAST+AI: An updated quality, risk of bias, and applicability assessment tool for prediction models using regression or artificial intelligence methods. BMJ 2025, 388, e082505. [Google Scholar] [CrossRef] [Scilit] [PubMed]
- Collins, G.S.; Moons, K.G.M.; Dhiman, P.; Riley, R.D.; Beam, A.L.; Van Calster, B.; Ghassemi, M.; Liu, X.; Reitsma, J.B.; van Smeden, M.; et al. TRIPOD+AI statement: Updated guidance for reporting clinical prediction models that use regression or machine learning methods. BMJ 2024, 385, e078378. [Google Scholar] [CrossRef] [Scilit] [PubMed]
- Shea, B.J.; Reeves, B.C.; Wells, G.; Thuku, M.; Hamel, C.; Moran, J.; Moher, D.; Tugwell, P.; Welch, V.; Kristjansson, E.; et al. AMSTAR 2: A critical appraisal tool for systematic reviews that include randomised or non-randomised studies of healthcare interventions, or both. BMJ 2017, 358, j4008. [Google Scholar] [CrossRef] [Scilit] [PubMed]
- Page, M.J.; McKenzie, J.E.; Bossuyt, P.M.; Boutron, I.; Hoffmann, T.C.; Mulrow, C.D.; Shamseer, L.; Tetzlaff, J.M.; Akl, E.A.; Brennan, S.E.; et al. The PRISMA 2020 statement: An updated guideline for reporting systematic reviews. BMJ 2021, 372, n71. [Google Scholar] [CrossRef] [Scilit] [PubMed]
- Campbell, M.; McKenzie, J.E.; Sowden, A.; Katikireddi, S.V.; Brennan, S.E.; Ellis, S.; Hartmann-Boyce, J.; Ryan, R.; Shepperd, S.; Thomas, J.; et al. Synthesis without meta-analysis (SWiM) in systematic reviews: Reporting guideline. BMJ 2020, 368, l6890. [Google Scholar] [CrossRef] [Scilit] [PubMed]
- Rethlefsen, M.L.; Kirtley, S.; Waffenschmidt, S.; Ayala, A.P.; Moher, D.; Page, M.J.; Koffel, J.B.; PRISMA-S Group. PRISMA-S: An extension to the PRISMA Statement for Reporting Literature Searches in Systematic Reviews. Syst. Rev. 2021, 10, 39. [Google Scholar] [CrossRef] [Scilit] [PubMed]
- Snell, K.I.E.; Levis, B.; Damen, J.A.A.G.; Dhiman, P.; Debray, T.P.A.; Hooft, L.; Reitsma, J.B.; Moons, K.G.M.; Collins, G.S.; Riley, R.D. Transparent reporting of multivariable prediction models for individual prognosis or diagnosis: Checklist for systematic reviews and meta-analyses (TRIPOD-SRMA). BMJ 2023, 381, e073538. [Google Scholar] [CrossRef] [Scilit] [PubMed]
- Moons, K.G.M.; de Groot, J.A.H.; Bouwmeester, W.; Vergouwe, Y.; Mallett, S.; Altman, D.G.; Reitsma, J.B.; Collins, G.S. Critical appraisal and data extraction for systematic reviews of prediction modelling studies: The CHARMS checklist. PLoS Med. 2014, 11, e1001744. [Google Scholar] [CrossRef] [Scilit] [PubMed]
- Suffoletto, B.; Ashenburg, N.; Losak, M.; Kim, D. Brief instrumented mobility testing improves fall risk stratification in older emergency department patients. Acad. Emerg. Med. 2026, 33, e70259. [Google Scholar] [CrossRef] [Scilit] [PubMed]
- McGowan, J.; Sampson, M.; Salzwedel, D.M.; Cogo, E.; Foerster, V.; Lefebvre, C. PRESS Peer Review of Electronic Search Strategies: 2015 guideline statement. J. Clin. Epidemiol. 2016, 75, 40–46. [Google Scholar] [CrossRef] [Scilit] [PubMed]
- Greene, B.R.; Doheny, E.P.; Walsh, C.; Cunningham, C.; Crosby, L.; Kenny, R.A. Evaluation of falls risk in community-dwelling older adults using body-worn sensors. Gerontology 2012, 58, 472–480. [Google Scholar] [CrossRef] [Scilit] [PubMed]
- Mehdizadeh, S.; Sabo, A.; Ng, K.-D.; Mansfield, A.; Flint, A.J.; Taati, B.; Iaboni, A. Predicting short-term risk of falls in a high-risk group with dementia. J. Am. Med. Dir. Assoc. 2021, 22, 689–695.e1. [Google Scholar] [CrossRef] [Scilit] [PubMed]
- Marques, N.R.; Spinoso, D.H.; Cardoso, B.C.; Moreno, V.C.; Kuroda, M.H.; Navega, M.T. Is it possible to predict falls in older adults using gait kinematics? Clin. Biomech. 2018, 59, 15–18. [Google Scholar] [CrossRef] [Scilit] [PubMed]
- Giardini, M.; Arcolin, I.; Baracco, S.; Corna, S.; Godi, M. Instrumented Timed up and Go test: A reliable and valid tool for elderly with femur fracture. Gait Posture 2025, 122, 375–381. [Google Scholar] [CrossRef] [Scilit] [PubMed]
- Al Abiad, N.; van Schooten, K.S.; Renaudin, V.; Delbaere, K.; Robert, T. Association of prospective falls in older people with ubiquitous step-based fall risk parameters calculated from ambulatory inertial signals: Secondary data analysis. JMIR Aging 2023, 6, e49587. [Google Scholar] [CrossRef] [Scilit] [PubMed]
- Ma, L.; Mi, T.M.; Jia, Q.; Han, C.; Chhetri, J.K.; Chan, P. Gait variability is sensitive to detect Parkinson’s disease patients at high fall risk. Int. J. Neurosci. 2022, 132, 888–893. [Google Scholar] [CrossRef] [Scilit] [PubMed]
- Roshdibenam, V.; Jogerst, G.J.; Butler, N.R.; Baek, S. Machine learning prediction of fall risk in older adults using Timed up and Go test kinematics. Sensors 2021, 21, 3481. [Google Scholar] [CrossRef] [Scilit] [PubMed]
- Marschollek, M.; Rehwald, A.; Wolf, K.H.; Gietzelt, M.; Nemitz, G.; Meyer zu Schwabedissen, H.; Haux, R. Sensor-based fall risk assessment—An expert “to go”. Methods Inf. Med. 2011, 50, 420–426. [Google Scholar] [CrossRef] [Scilit] [PubMed]
- Marschollek, M.; Rehwald, A.; Wolf, K.H.; Gietzelt, M.; Nemitz, G.; Meyer zu Schwabedissen, H.; Schulze, M. Sensors vs. experts—A performance comparison of sensor-based fall risk assessment vs. conventional assessment in a sample of geriatric patients. BMC Med. Inform. Decis. Mak. 2011, 11, 48. [Google Scholar] [CrossRef] [Scilit] [PubMed]
- Weiss, A.; Brozgol, M.; Dorfman, M.; Herman, T.; Shema, S.; Giladi, N.; Hausdorff, J.M. Does the evaluation of gait quality during daily life provide insight into fall risk? A novel approach using 3-day accelerometer recordings. Neurorehabil. Neural Repair 2013, 27, 742–752. [Google Scholar] [CrossRef] [Scilit] [PubMed]
- Schwesig, R.; Fischer, D.; Lauenroth, A.; Becker, S.; Leuchte, S. Can falls be predicted with gait analytical and posturographic measurement systems? A prospective follow-up study in a nursing home population. Clin. Rehabil. 2013, 27, 183–190. [Google Scholar] [CrossRef] [Scilit] [PubMed]
- Doi, T.; Hirata, S.; Ono, R.; Tsutsumimoto, K.; Misu, S.; Ando, H. The harmonic ratio of trunk acceleration predicts falling among older people: Results of a 1-year prospective study. J. Neuroeng. Rehabil. 2013, 10, 7. [Google Scholar] [CrossRef] [Scilit] [PubMed]
- Mignardot, J.-B.; Deschamps, T.; Barrey, E.; Auvinet, B.; Berrut, G.; Cornu, C.; Constans, T.; de Decker, L. Gait disturbances as specific predictive markers of the first fall onset in elderly people: A two-year prospective observational study. Front. Aging Neurosci. 2014, 6, 22. [Google Scholar] [CrossRef] [Scilit] [PubMed]
- Schwenk, M.; Hauer, K.; Zieschang, T.; Englert, S.; Mohler, J.; Najafi, B. Sensor-derived physical activity parameters can predict future falls in people with dementia. Gerontology 2014, 60, 483–492. [Google Scholar] [CrossRef] [Scilit] [PubMed]
- van Schooten, K.S.; Pijnappels, M.; Rispens, S.M.; Elders, P.J.M.; Lips, P.; van Dieën, J.H. Ambulatory fall-risk assessment: Amount and quality of daily-life gait predict falls in older adults. J. Gerontol. A Biol. Sci. Med. Sci. 2015, 70, 608–615. [Google Scholar] [CrossRef] [Scilit] [PubMed]
- van Schooten, K.S.; Pijnappels, M.; Rispens, S.M.; Elders, P.J.M.; Lips, P.; Daffertshofer, A.; Beek, P.J.; van Dieën, J.H. Daily-life gait quality as predictor of falls in older people: A 1-year prospective cohort study. PLoS ONE 2016, 11, e0158623. [Google Scholar] [CrossRef] [Scilit] [PubMed]
- Ihlen, E.A.F.; van Schooten, K.S.; Bruijn, S.M.; van Dieën, J.H.; Vereijken, B.; Helbostad, J.L.; Pijnappels, M. Improved prediction of falls in community-dwelling older adults through phase-dependent entropy of daily-life walking. Front. Aging Neurosci. 2018, 10, 44. [Google Scholar] [CrossRef] [Scilit] [PubMed]
- Nait Aicha, A.; Englebienne, G.; van Schooten, K.S.; Pijnappels, M.; Kröse, B. Deep learning to predict falls in older adults based on daily-life trunk accelerometry. Sensors 2018, 18, 1654. [Google Scholar] [CrossRef] [Scilit] [PubMed]
- Howcroft, J.; Kofman, J.; Lemaire, E.D. Prospective fall-risk prediction models for older adults based on wearable sensors. IEEE Trans. Neural Syst. Rehabil. Eng. 2017, 25, 1812–1820. [Google Scholar] [CrossRef] [Scilit] [PubMed]
- Howcroft, J.; Lemaire, E.D.; Kofman, J. Prospective elderly fall prediction by older-adult fall-risk modeling with feature selection. Biomed. Signal Process. Control 2018, 43, 320–328. [Google Scholar] [CrossRef] [Scilit]
- Drover, D.; Howcroft, J.; Kofman, J.; Lemaire, E.D. Faller classification in older adults using wearable sensors based on turn and straight-walking accelerometer-based features. Sensors 2017, 17, 1321. [Google Scholar] [CrossRef] [Scilit] [PubMed]
- Greene, B.R.; Caulfield, B.; Lamichhane, D.; Bond, W.; Svendsen, J.; Zurski, C.; Pratt, D. Longitudinal assessment of falls in patients with Parkinson’s disease using inertial sensors and the Timed up and Go test. J. Rehabil. Assist. Technol. Eng. 2018, 5, 2055668317750811. [Google Scholar] [CrossRef] [Scilit] [PubMed]
- Greene, B.R.; Premoli, I.; McManus, K.; McGrath, D.; Caulfield, B. Predicting fall counts using wearable sensors: A novel digital biomarker for Parkinson’s disease. Sensors 2022, 22, 54. [Google Scholar] [CrossRef] [Scilit] [PubMed]
- Bizovska, L.; Svoboda, Z.; Janura, M.; Bisi, M.C.; Vuillerme, N. Local dynamic stability during gait for predicting falls in elderly people: A one-year prospective study. PLoS ONE 2018, 13, e0197091. [Google Scholar] [CrossRef] [Scilit] [PubMed]
- Lo, C.; Arora, S.; Baig, F.; Lawton, M.A.; El Mouden, C.; Barber, T.R.; Ruffmann, C.; Klein, J.C.; Brown, P.; Ben-Shlomo, Y.; et al. Predicting motor, cognitive & functional impairment in Parkinson’s. Ann. Clin. Transl. Neurol. 2019, 6, 1498–1509. [Google Scholar] [CrossRef] [Scilit] [PubMed]
- Marques, N.R.; Camilo, G.F.; de Martini Lopes dos Santos, A.P.; Cardoso, B.C.; Navega, M.T.; de Abreu, D.C.C. The ability of gait kinematic parameters to predict falls in older adults with cognitive impairments living in long term institutions. Clin. Biomech. 2019, 65, 123–127. [Google Scholar] [CrossRef] [Scilit] [PubMed]
- Gillain, S.; Boutaayamou, M.; Schwartz, C.; Brüls, O.; Bruyère, O.; Croisier, J.-L.; Salmon, E.; Reginster, J.-Y.; Garraux, G.; Petermans, J. Using supervised learning machine algorithm to identify future fallers based on gait patterns: A two-year longitudinal study. Exp. Gerontol. 2019, 127, 110730. [Google Scholar] [CrossRef] [Scilit] [PubMed]
- Buisseret, F.; Catinus, L.; Grenard, R.; Jojczyk, L.; Fievez, D.; Barvaux, V.; Dierick, F. Timed up and Go and Six-Minute Walking Tests with wearable inertial sensor: One step further for the prediction of the risk of fall in elderly nursing home people. Sensors 2020, 20, 3207. [Google Scholar] [CrossRef] [Scilit] [PubMed]
- Dierick, F.; Stoffel, P.L.; Schütz, G.; Buisseret, F. High specificity of single inertial sensor-supplemented Timed up and Go test for assessing fall risk in elderly nursing home residents. Sensors 2022, 22, 2339. [Google Scholar] [CrossRef] [Scilit] [PubMed]
- Silva, J.; Sousa, I.; Cardoso, J.S. Fusion of clinical, self-reported, and multisensor data for predicting falls. IEEE J. Biomed. Health Inform. 2020, 24, 50–56. [Google Scholar] [CrossRef] [Scilit] [PubMed]
- Sturchio, A.; Dwivedi, A.K.; Marsili, L.; Hadley, A.; Sobrero, G.; Heldman, D.; Maule, S.; Lopiano, L.; Comi, C.; Versino, M.; et al. Kinematic but not clinical measures predict falls in Parkinson-related orthostatic hypotension. J. Neurol. 2021, 268, 1006–1015. [Google Scholar] [CrossRef] [Scilit] [PubMed]
- Bet, P.; Castro, P.C.; Ponti, M.A. Foreseeing future falls with accelerometer features in active community-dwelling older persons with no recent history of falls. Exp. Gerontol. 2021, 143, 111139. [Google Scholar] [CrossRef] [Scilit] [PubMed]
- Adeli, V.; Korhani, N.; Sabo, A.; Mehdizadeh, S.; Mansfield, A.; Flint, A.; Iaboni, A.; Taati, B. Ambient monitoring of gait and machine learning models for dynamic and short-term falls risk assessment in people with dementia. IEEE J. Biomed. Health Inform. 2023, 27, 3599–3609. [Google Scholar] [CrossRef] [Scilit] [PubMed]
- Lockhart, T.E.; Soangra, R.; Yoon, H.; Wu, T.; Frames, C.W.; Weaver, R.; Roberto, K.A. Prediction of fall risk among community-dwelling older adults using a wearable system. Sci. Rep. 2021, 11, 20976. [Google Scholar] [CrossRef] [Scilit] [PubMed]
- Kelly, D.; Condell, J.; Gillespie, J.; Muñoz Esquivel, K.; Barton, J.; Tedesco, S.; Nordström, A.; Åkerlund Larsson, M.; Alamäki, A. Improved screening of fall risk using free-living based accelerometer data. J. Biomed. Inform. 2022, 131, 104116. [Google Scholar] [CrossRef] [Scilit] [PubMed]
- Dasgupta, P.; Frisch, A.; Huber, J.; Sejdić, E.; Suffoletto, B. Predicting falls within 3 months of emergency department discharge among community-dwelling older adults using self-report tools versus a brief functional assessment. Am. J. Emerg. Med. 2022, 53, 245–249. [Google Scholar] [CrossRef] [Scilit] [PubMed]
- Caronni, A.; Picardi, M.; Scarano, S.; Malloggi, C.; Tropea, P.; Gilardone, G.; Aristidou, E.; Pintavalle, G.; Redaelli, V.; Antoniotti, P.; et al. Pay attention: You can fall! The Mini-BESTest scale and the turning duration of the TUG test provide valid balance measures in neurological patients: A prospective study with falls as the balance criterion. Front. Neurol. 2023, 14, 1228302. [Google Scholar] [CrossRef] [Scilit] [PubMed]
- Horak, F.B.; Laird, A.; Carlson-Kuhta, P.; Abrahamson, M.; Mancini, M.; Orwoll, E.S.; Lapidus, J.A.; Shah, V.V. The Instrumented Stand and Walk (ISAW) test to predict falls in older men. GeroScience 2023, 45, 823–836. [Google Scholar] [CrossRef] [Scilit] [PubMed]
- Ullrich, M.; Roth, N.; Küderle, A.; Richer, R.; Gladow, T.; Gaßner, H.; Marxreiter, F.; Klucken, J.; Eskofier, B.M.; Kluge, F. Fall risk prediction in Parkinson’s disease using real-world inertial sensor gait data. IEEE J. Biomed. Health Inform. 2023, 27, 319–328. [Google Scholar] [CrossRef] [Scilit] [PubMed]
- Shah, V.V.; Jagodinsky, A.; McNames, J.; Carlson-Kuhta, P.; Nutt, J.G.; El-Gohary, M.; Sowalsky, K.; Harker, G.; Mancini, M.; Horak, F.B. Gait and turning characteristics from daily life increase ability to predict future falls in people with Parkinson’s disease. Front. Neurol. 2023, 14, 1096401. [Google Scholar] [CrossRef] [Scilit] [PubMed]
- Sotirakis, C.; Brzezicki, M.A.; Patel, S.; Conway, N.; FitzGerald, J.J.; Antoniades, C.A. Predicting future fallers in Parkinson’s disease using kinematic data over a period of 5 years. npj Digit. Med. 2024, 7, 345. [Google Scholar] [CrossRef] [Scilit] [PubMed]
- Zhang, H.; Wu, C.; Huang, Y.; Song, R.; Zanotto, D.; Agrawal, S.K. Fall risk prediction using instrumented footwear in institutionalized older adults. IEEE Trans. Neural Syst. Rehabil. Eng. 2024, 32, 4260–4269. [Google Scholar] [CrossRef] [Scilit] [PubMed]
- Guan, Z.; Cai, J.; Wang, J.; Li, Y.; Song, R.; Zanotto, D.; Agrawal, S.K.; Zhang, H. Accuracy and precision of wearable-derived gait parameters: How these affect the performance of models for fall prediction in the elderly. IEEE Trans. Neural Syst. Rehabil. Eng. 2025, 33, 4255–4266. [Google Scholar] [CrossRef] [Scilit] [PubMed]
- Maiora, J.; Rezola-Pardo, C.; García, G.; Sanz, B.; Graña, M. Older adult fall risk prediction with deep learning and Timed up and Go (TUG) test data. Bioengineering 2024, 11, 1000. [Google Scholar] [CrossRef] [Scilit] [PubMed]
- Zhang, Y.; Weijer, R.H.A.; van Schooten, K.S.; Bruijn, S.M.; Pijnappels, M. External validation and further exploration of fall prediction models based on questionnaires and daily-life trunk accelerometry. J. Am. Med. Dir. Assoc. 2024, 25, 105107. [Google Scholar] [CrossRef] [Scilit] [PubMed]
- Lai, K.M.; Fong, K.N.K. Efficacy of a waist-mounted sensor in predicting prospective falls among older people residing in community dwellings: A prospective cohort study. Sensors 2025, 25, 2516. [Google Scholar] [CrossRef] [Scilit] [PubMed]
- Riley, R.D.; Snell, K.I.E.; Archer, L.; Ensor, J.; Debray, T.P.A.; van Calster, B.; van Smeden, M.; Collins, G.S. Evaluation of clinical prediction models (part 3): Calculating the sample size required for an external validation study. BMJ 2024, 384, e074821. [Google Scholar] [CrossRef] [Scilit] [PubMed]
- Foroutan, F.; Mayer, M.; Guyatt, G.; Riley, R.D.; Mustafa, R.; Kreuzberger, N.; Skoetz, N.; Darzi, A.; Alba, A.C.; Mowbray, F.; et al. GRADE concept paper 8: Judging the certainty of discrimination performance estimates of prognostic models in a body of validation studies. J. Clin. Epidemiol. 2024, 170, 111344. [Google Scholar] [CrossRef] [Scilit] [PubMed]
- Van Calster, B.; McLernon, D.J.; van Smeden, M.; Wynants, L.; Steyerberg, E.W. Calibration: The Achilles heel of predictive analytics. BMC Med. 2019, 17, 230. [Google Scholar] [CrossRef] [Scilit] [PubMed]
- Vickers, A.J.; Elkin, E.B. Decision curve analysis: A novel method for evaluating prediction models. Med. Decis. Mak. 2006, 26, 565–574. [Google Scholar] [CrossRef] [Scilit] [PubMed]
- Chan, L.L.Y.; Arbona, C.H.; Brodie, M.A.; Lord, S.R. Prediction of injurious falls in older adults using digital gait biomarkers extracted from large-scale wrist sensor data. Age Ageing 2023, 52, afad179. [Google Scholar] [CrossRef] [Scilit] [PubMed]
- Riley, R.D.; Ensor, J.; Snell, K.I.E.; Harrell, F.E., Jr.; Martin, G.P.; Reitsma, J.B.; Moons, K.G.M.; Collins, G.; van Smeden, M. Calculating the sample size required for developing a clinical prediction model. BMJ 2020, 368, m441. [Google Scholar] [CrossRef] [Scilit] [PubMed]
- Lamb, S.E.; Jørstad-Stein, E.C.; Hauer, K.; Becker, C.; Prevention of Falls Network Europe and Outcomes Consensus Group. Development of a common outcome data set for fall injury prevention trials: The Prevention of Falls Network Europe consensus. J. Am. Geriatr. Soc. 2005, 53, 1618–1622. [Google Scholar] [CrossRef] [Scilit] [PubMed]
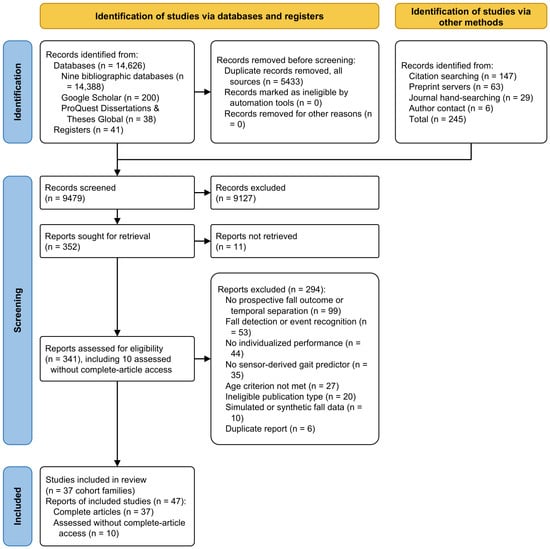
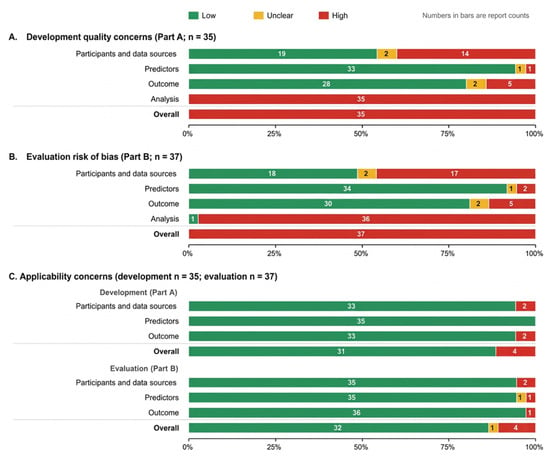
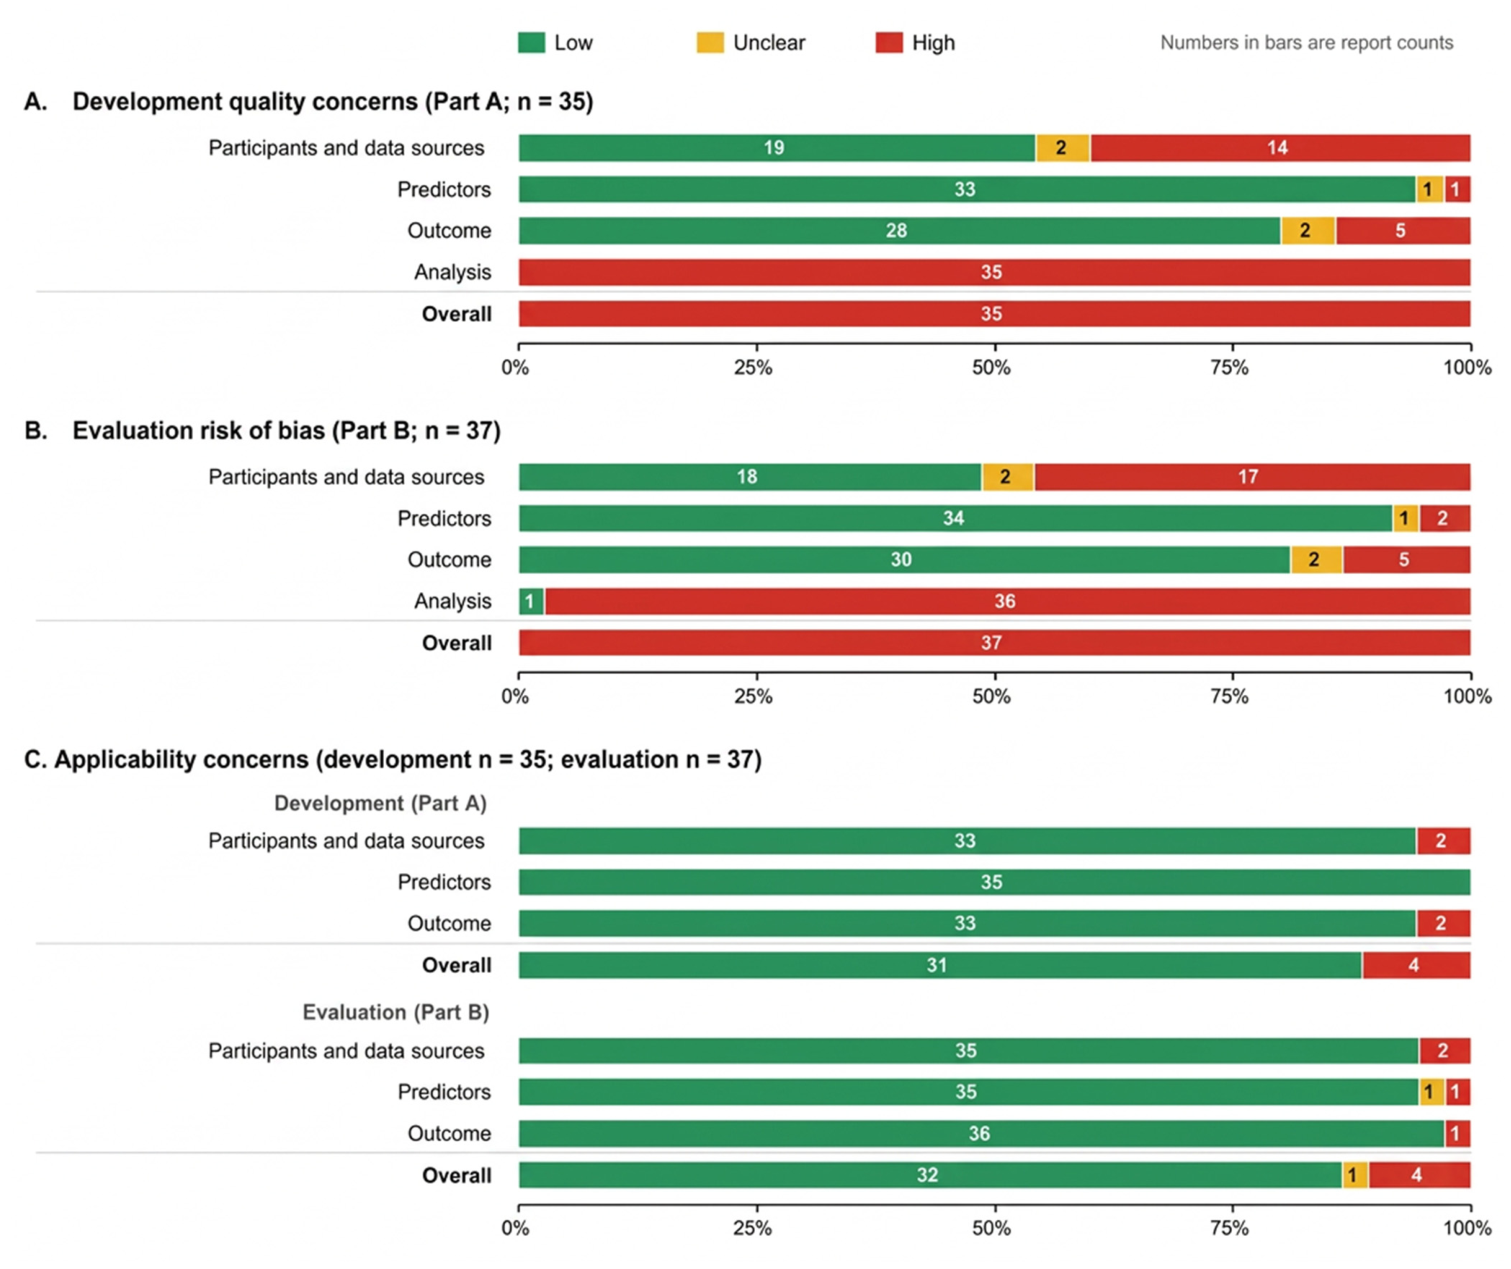

Disclaimer/Publisher’s Note: The statements, opinions and data contained in all publications are solely those of the individual author(s) and contributor(s) and not of MDPI and/or the editor(s). MDPI and/or the editor(s) disclaim responsibility for any injury to people or property resulting from any ideas, methods, instructions or products referred to in the content. |
© 2026 by the authors. Licensee MDPI, Basel, Switzerland. This article is an open access article distributed under the terms and conditions of the Creative Commons Attribution (CC BY) license.