


Abstract
Background: Long COVID is clinically and immunologically heterogeneous. We describe unexpected biomarker separation between recorded groups and limitations that prevent a disease-specific interpretation. Methods: This exploratory cross-sectional secondary analysis included 191 post-COVID records: 158 labeled long COVID and 33 originally designated “No adverse events.” The comparator designation did not establish a clinically verified absence of post-COVID sequelae. Eight biomarkers were evaluated after correction of confirmed reporting errors at common assay lower limits. Analyses included rank-based comparisons, Firth penalized logistic regression, internal resampling, censoring sensitivity analyses and exploratory clustering. Results: Seven biomarkers were higher in the recorded long COVID group (all false-discovery-rate q < 0.001). Apparent areas under the receiver operating characteristic curve (AUCs) were 0.9942 for CXCL9 and 0.9914 for IL-6. The seven-marker model had an apparent AUC of 1.0000 and a mean cross-validated AUC of 0.9989. CXCL9 was at or below the reporting limit in 30/33 comparator records versus 1/158 long COVID records. All individual coefficients in the full model had 95% profile intervals including the null. Clustering did not establish distinct biological subtypes. Conclusions: The unexpectedly strong separation is a hypothesis-generating observation requiring independent investigation. Incomplete verification of group definitions and sampling times limits disease-specific interpretation. These findings do not establish a long COVID-specific immune signature or a clinically applicable diagnostic test.
1. Introduction
Long COVID encompasses heterogeneous symptoms and functional limitations following SARS-CoV-2 infection. The WHO clinical case definition describes post-COVID-19 condition in people with a history of probable or confirmed infection, usually three months from COVID-19 onset, with symptoms lasting at least two months and not explained by an alternative diagnosis [1]. This framework does not, by itself, establish the criteria used in a particular cohort.
Longitudinal and cellular studies have identified immune abnormalities after infection, including immune-cell perturbations and T-cell dysregulation [2,3]. Longer follow-up has also shown improvement in some individuals [4], while proteomic work identified an inflammatory subgroup rather than a uniform signature [5]. These findings motivate biomarker studies but emphasize the importance of clinical characterization, sampling time and assay comparability.
We compared eight immune biomarkers between the recorded long COVID group and a post-COVID comparator group originally designated “No adverse events” in the source data. This comparator label does not establish a clinically verified absence of post-COVID sequelae. The aim was to describe an unexpected pattern of group separation and assess how the limitations of clinical classification and laboratory documentation constrain its interpretation. Biomarker associations, within-dataset discrimination and exploratory structure were examined as hypothesis-generating analyses. This study was not designed to establish a disease-specific immune signature, diagnostic test, causal mechanism or treatment-selection rule.
2. Materials and Methods
2.1. Study Design, Setting and Source Data
This was a cross-sectional secondary analysis of a de-identified biomarker dataset from a study involving Kochi Medical University Hospital, Sapporo Medical University Hospital, St. Marianna University Hospital and Aichi Medical University Hospital. The analytical workbook contained 158 records under “Long COVID patients” and 33 under “No adverse events patients who have suffered from COVID-19.” We refer to these as the recorded long COVID group and the comparator group, respectively. The original comparator designation does not establish a clinically verified absence of post-COVID sequelae. “Case” and “control”, where used in analytical descriptions or inherited displays, refer only to these recorded groups and do not imply independently adjudicated diagnoses or confirmed clinical comparability. The parent study planned longitudinal assessment of antibody titers as its primary outcome and factors associated with COVID-19 severity as secondary outcomes, according to disease severity, time since symptom onset and post-COVID sequelae. The present report is an exploratory cross-sectional secondary analysis of biomarker data collected within that study.
2.2. Group Definitions and Clinical Information
The study protocol specified assessment of the presence, severity and course of post-COVID sequelae. Participants were selected, and their group status was assessed by the treating physicians at the respective participating institutions during follow-up. The same physicians were responsible for selection and group assessment. The same protocol-defined follow-up sampling criteria were applied to both groups, with follow-up visits selected at the physician’s discretion. Serum collected at follow-up was used for biomarker measurements. A uniform symptom-duration threshold and compliance with the WHO case definition could not be verified from the available documentation. The actual time from symptom onset to blood sampling was not available for each analyzed record; common sampling criteria do not establish comparable sampling-time distributions. Age, sex, comorbidities, acute COVID-19 severity, vaccination and treatment histories, reinfections and record-level site identifiers were unavailable for adjustment. The recorded classifications were not independently adjudicated. In particular, symptom resolution and the absence of post-COVID sequelae in the comparator group could not be verified from the available documentation; clinical comparability could not be established in this analysis.
2.3. Biomarkers and Laboratory Reporting
The biomarkers were interferon-λ3 (IFN-λ3), interleukin-6 (IL-6), tumor necrosis factor-α (TNF-α), C-X-C motif chemokine ligand 9 (CXCL9/MIG), interferon gamma-induced protein 10 (IP-10/CXCL10), signaling lymphocytic activation molecule family member 1 (SLAMF1/CD150), interleukin-15 receptor subunit alpha (IL15RA), and interleukin-18 (IL-18). The first five biomarkers were reported in pg/mL, whereas SLAMF1, IL15RA and IL-18 were reported as normalized protein expression (NPX) values on a log2 scale. NPX values were not treated as absolute concentrations or log-transformed again. The investigators previously confirmed that the same assay kits and instruments were used in both groups for TNF-α and CXCL9, with common lower reporting limits of 0.15 and 31.3 pg/mL, respectively. The sub-limit numeric entries in the source table were confirmed to be recording errors; the appropriate reports are TNF-α < 0.15 pg/mL and CXCL9 ≤ 31.3 pg/mL.
All eight biomarkers were measured by the same central laboratory. The investigators confirmed that, for each biomarker, all specimens from both groups were measured on the same day, using multiple assay plates of the same type, and using reagents from the same lot. These were the actual measurement conditions. The investigators also confirmed common analyte-specific specimen storage and transport procedures across participating institutions.
TNF-α was measured using the Human TNF-alpha Quantikine HS ELISA Kit (R&D Systems, Inc., Minneapolis, MN, USA), and CXCL9 was measured using the Human CXCL9/MIG Quantikine ELISA Kit (R&D Systems, Inc., Minneapolis, MN, USA). Both kits were obtained from Funakoshi Co., Ltd., Tokyo, Japan.
The assay schedule specified refrigerated storage for IFN-λ3 specimens and frozen storage for the other four concentration-based markers. The lower reporting limits used in this analysis were 0.15 pg/mL for TNF-α and 31.3 pg/mL for CXCL9; results were reported as TNF-α < 0.15 pg/mL and CXCL9 ≤ 31.3 pg/mL, respectively. These are described as lower reporting limits because their formal designation as limits of detection (LOD) or lower limits of quantification (LLOQ) was not established by the available information.
2.4. Data Lock, Audit and Censoring
The analyses used a version-locked corrected dataset linked to the unchanged original workbook. Excel rows 3–160 and 165–197 formed the two recorded groups. Three decimal-comma strings were standardized (I159: 0.3; B190: 0.2; J197: 7.2). Following investigator confirmation, 14 comparator TNF-α entries recorded as 0.1 were recoded as <0.15, and 30 comparator CXCL9 entries at or below 31.3 were recoded as ≤31.3. These 44 cell-level reporting corrections concerned two markers in the 33 comparator records; they do not denote 44 participants or new measurements. No case measurements, participant counts or group labels were changed. Original entries, corrected reports and numerical analysis substitutes were stored separately with cell coordinates and the confirmation date. A numeric case TNF-α value equal to 0.15 (C46) was retained because the confirmed TNF-α rule is strictly <0.15.
For the primary analysis, censored concentrations were replaced by one-half of the relevant limit: IFN-λ3 < 3.0 by 1.5, TNF-α < 0.15 by 0.075 and CXCL9 ≤ 31.3 by 15.65 pg/mL. The TNF-α/CXCL9 rule was applied identically in both groups following the author confirmation; negative NPX values and all other numeric reports were retained. Sensitivity analyses used limit/√2 and the limit for the same corrected censoring flags. Numeric completeness does not mean quantitative detection. Quantiles falling within a censored region are reported as inequalities in Table 1; numerical substituted summaries are available in the audit workbook. The audit is described in Supplementary Table S1.
Table 1.
Biomarker comparisons with censoring-aware descriptive reporting.
2.5. Statistical Analysis
2.5.1. Group Comparisons and Model Estimation
Two-sided Mann–Whitney U tests used the asymptotic, tie-corrected normal approximation with continuity correction. Benjamini–Hochberg adjustment covered all eight biomarkers. With n1 = 158 long COVID records and n0 = 33 comparator records, U1 counts case–control pairs in which the case value is higher, with half-weight for ties; rank-biserial r = 2U1/(n1n0) − 1. For the fixed higher-value orientation, AUC = U1/(n1n0) = (r + 1)/2. Pairwise counts and ROC software, performed with scikit-learn version 1.8.0 (Python), calculations were checked for identity. Single-marker AUC 95% intervals used 5000 stratified percentile bootstrap samples; they describe uncertainty, not optimism correction.
The primary biomarker model used Firth penalized logistic regression with all seven non-degenerate markers; IFN-λ3 was excluded because of its floor effect [6]. IL-6, TNF-α, CXCL9 and IP-10 were log10-transformed without an added constant. All predictors were standardized using population SD (ddof = 0). Odds ratios are per one SD conditional on the other included biomarkers, not on unmeasured clinical covariates. Confidence intervals and p values were obtained from profile penalized likelihood and one-degree-of-freedom penalized likelihood-ratio tests, retaining the full model’s penalty during coefficient constraints. There was no stepwise selection. A four-marker Firth model (TNF-α, SLAMF1, IL15RA, IL-18) was secondary; an ordinary maximum-likelihood fit of that same explicit specification was retained as a reproducibility comparison, not as the primary inferential model.
Complete separation was examined by linear-program feasibility; variance-inflation factors and the design condition number assessed collinearity. The full model had 158 events and 33 non-events for seven slopes (22.57 and 4.71 observations per slope, respectively); corresponding four-slope ratios were 39.50 and 8.25. These ratios are descriptive, not evidence of adequate precision.
2.5.2. Internal Resampling
For both Firth models, 1000 stratified bootstrap samples repeated standardization and fitting. AUC optimism was the mean difference between performance in each bootstrap sample and in the original sample under the bootstrap-fitted model; this was subtracted from apparent AUC [7]. Separately, 50 repetitions of stratified fivefold cross-validation generated held-out predictions. Scaling and model fitting were confined to each training fold. Each repetition yielded one pooled out-of-fold model AUC; repetition means and 2.5th–97.5th percentiles describe split variability, not independent confidence intervals.
For individual markers, the direction of association was fixed. A separate optimism-corrected AUC was not estimated for fixed single-marker rankings. Brier scores and calibration intercepts/slopes were evaluated within this selected sample; ordinary calibration slopes were reported as non-estimable when predictions perfectly separated outcomes. No independent site- or external-cohort validation was possible. Alternative censoring substitutions also underwent full-model fitting and 20 matched repetitions of fivefold cross-validation. All internal procedures reuse the same underlying recruitment, classification and laboratory structure and cannot establish comparability of the recorded groups or biological specificity.
2.5.3. Exploratory Structure and Computation
Within the 158 long COVID records, the four concentration markers were log10-transformed, and all seven informative markers were standardized using case-only means and SDs. Ward hierarchical clustering used Euclidean distance. Solutions k = 2–5 were examined using silhouette widths; a gap analysis additionally included k = 1, with 500 uniform reference datasets in the PCA-rotated bounding box, squared-distance dispersion and the original one-standard-error selection rule [8]. Bootstrap stability used 500 row-resamples, re-estimating scaling and Ward clustering; best-matching Jaccard overlap was calculated on unique in-bag records, and adjusted Rand indices summarized partition agreement. PCA was performed separately in cases and in all records. The k = 2 partition was retained only for descriptive comparison with the previous presentation; no p or q values were calculated between clusters defined by those same markers.
Analyses used Python 3.12.9 (Python Software Foundation, Wilmington, DE, USA) with NumPy 2.3.5, SciPy 1.17.0, scikit-learn 1.8.0 and statsmodels 0.14.6. Firth estimation used an implementation of the Jeffreys-penalized likelihood. An independent adjusted-score iteration reproduced full-model coefficients within 3.5 × 10⁻⁸. Seeds, model scaling, unrounded outputs, convergence checks and scripts were retained in the analysis package.
3. Results
3.1. Records and Reporting-Bound Audit
All 191 records were included. The original data contained no blank biomarker cell or exact duplicate eight-marker profile; this does not establish unique participant identities. Following correction of the 44 numeric comparator entries, TNF-α was censored in 12/158 cases (7.6%) and 14/33 comparator records (42.4%); CXCL9 was censored in 1/158 (0.6%) and 30/33 (90.9%). IFN-λ3 remained censored in 157/158 cases (99.4%) and all 33 comparator records. No censoring flags were reported for the other markers; their assay-limit documentation remains incomplete. No case measurement was changed by the previously confirmed reporting correction (Supplementary Table S1).
3.2. Group-Associated Biomarker Differences
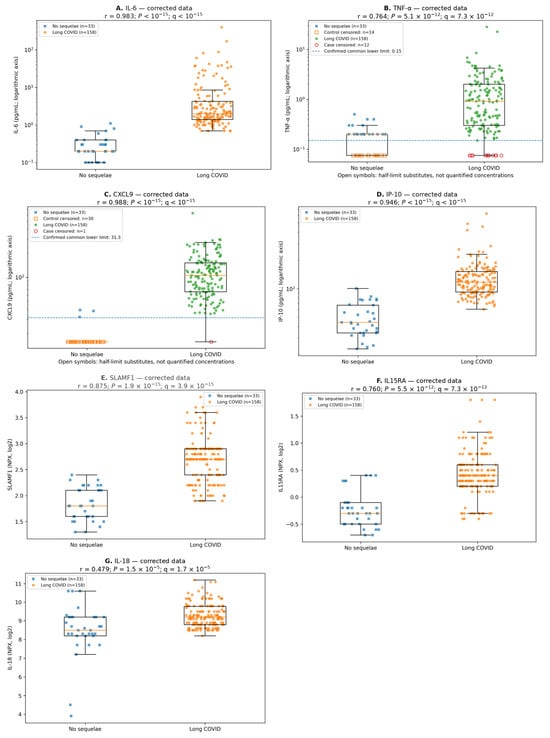
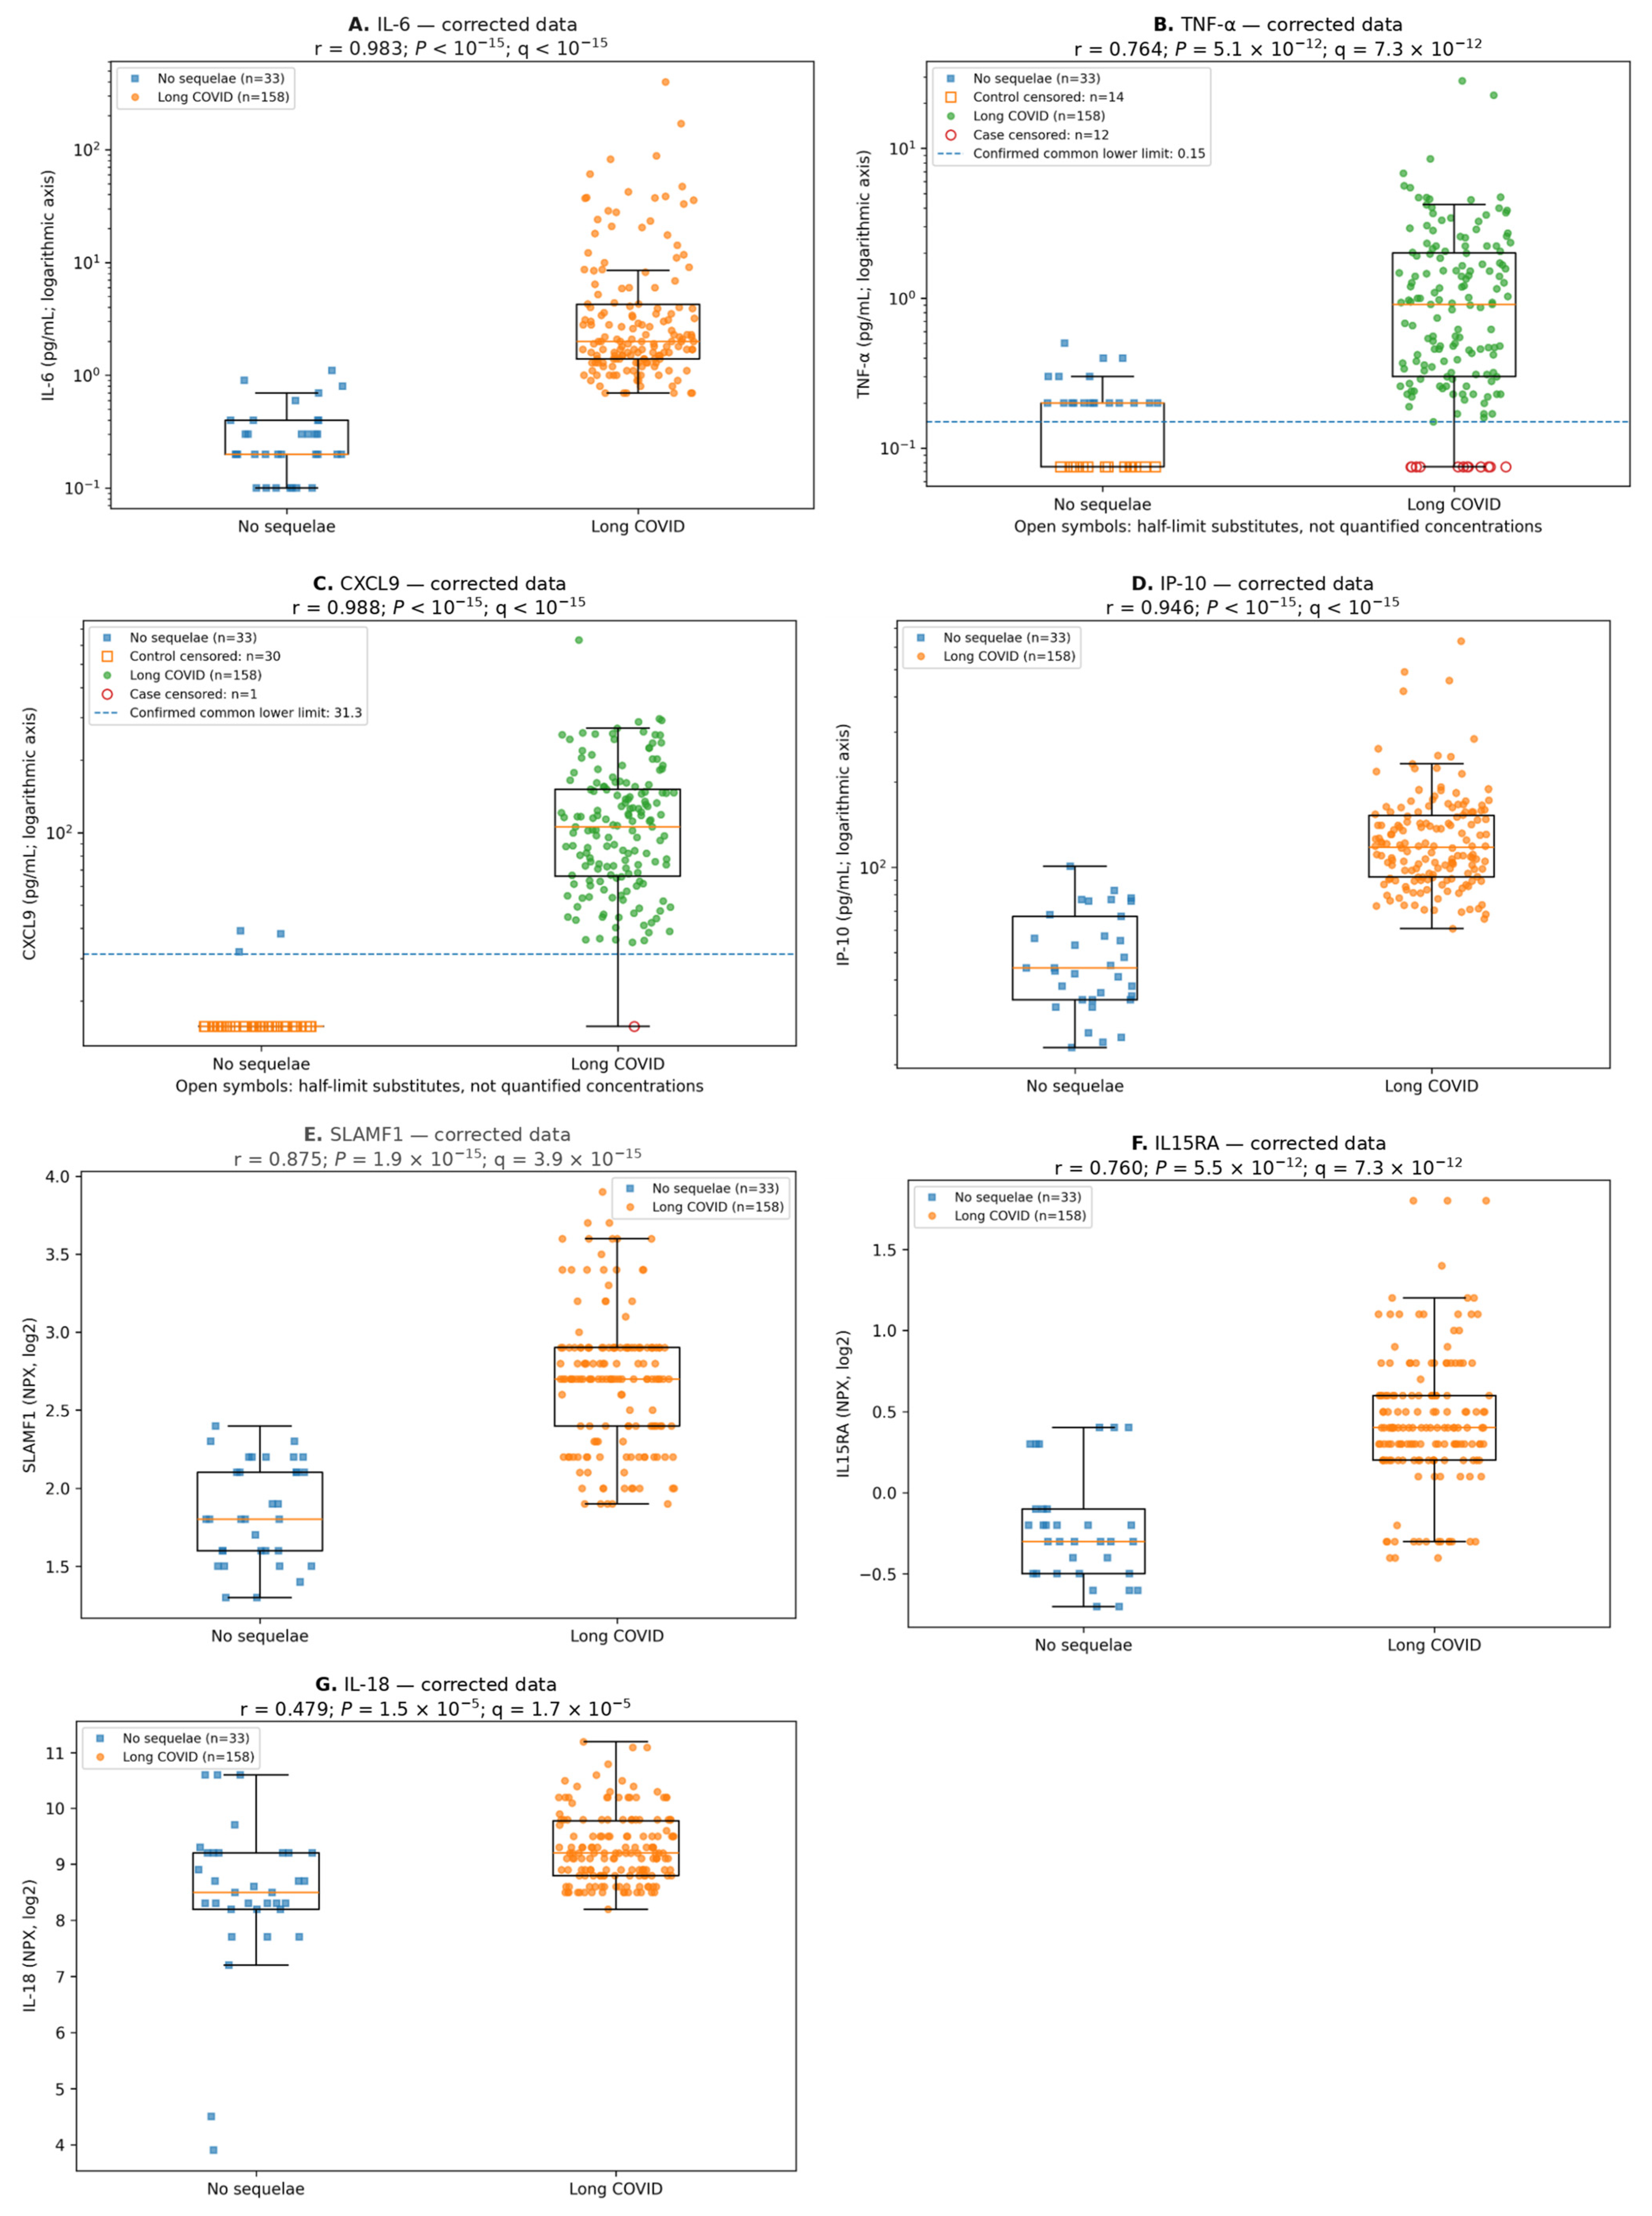
IL-6, TNF-α, CXCL9, IP-10, SLAMF1, IL15RA and IL-18 were higher in the recorded long COVID group after multiplicity adjustment (all q < 0.001; Table 1; Figure 1A–G). Case CXCL9 was 106.00 [65.90–151.00] pg/mL; all three control quartiles lie at or below 31.3 pg/mL and cannot be reported as precise concentrations. IL-6 was 2.00 [1.40–4.25] versus 0.20 [0.20–0.40] pg/mL, and IP-10 was 118.00 [92.22–152.75] versus 44.00 [34.00–67.00] pg/mL. IFN-λ3 had little resolvable variation (p = 0.658). With common-limit censoring, CXCL9 U1 = 5184 of 5214 pairs, r = 0.9884925 and AUC = 0.9942463; these values satisfy the rank/AUC identity. Tables and figures report the same corrected analysis.
Figure 1.
(A–G) Biomarker distributions in the recorded long COVID and comparator groups. The legacy in-panel label “No sequelae” denotes the 33 records originally designated “No adverse events patients who have suffered from COVID-19”; it does not indicate a clinically verified absence of post-COVID sequelae. Individual primary-analysis values are shown for (A) IL-6, (B) TNF-α, (C) CXCL9, (D) IP-10, (E) SLAMF1, (F) IL15RA and (G) IL-18, with medians and IQRs; whiskers extend to 1.5 × IQR. Concentration axes are logarithmic, and NPX retains its native scale. Open symbols identify all corrected censored measurements in either group, plotted at half the limit for analysis/visualization, not as observed concentrations. Dashed lines mark confirmed common lower reporting limits for TNF-α and CXCL9. In particular, the comparator CXCL9 box at 15.65 consists predominantly of substituted values. Statistical annotations share the Table 1 calculation and eight-marker BH family. Site identifiers were unavailable. IFN-λ3 is omitted because 190/191 measurements were censored. Group labels reflect the recorded classifications, which were not independently adjudicated against a uniform operational definition. Abbreviations: BH, Benjamini–Hochberg; CXCL9, C-X-C motif chemokine ligand 9; IFN, interferon; IL, interleukin; IL15RA, interleukin-15 receptor subunit alpha; IP-10, interferon gamma-induced protein 10; IQR, interquartile range; NPX, normalized protein expression; SLAMF1, signaling lymphocytic activation molecule family member 1; TNF, tumor necrosis factor.
3.3. Full and Reduced Biomarker Models
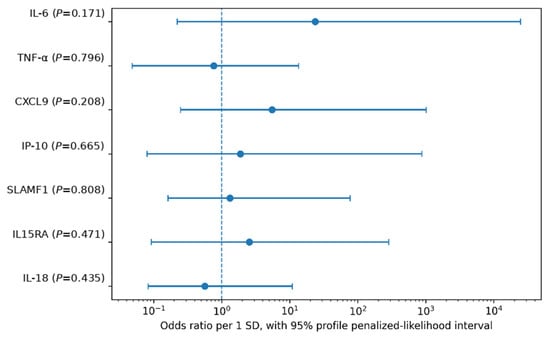
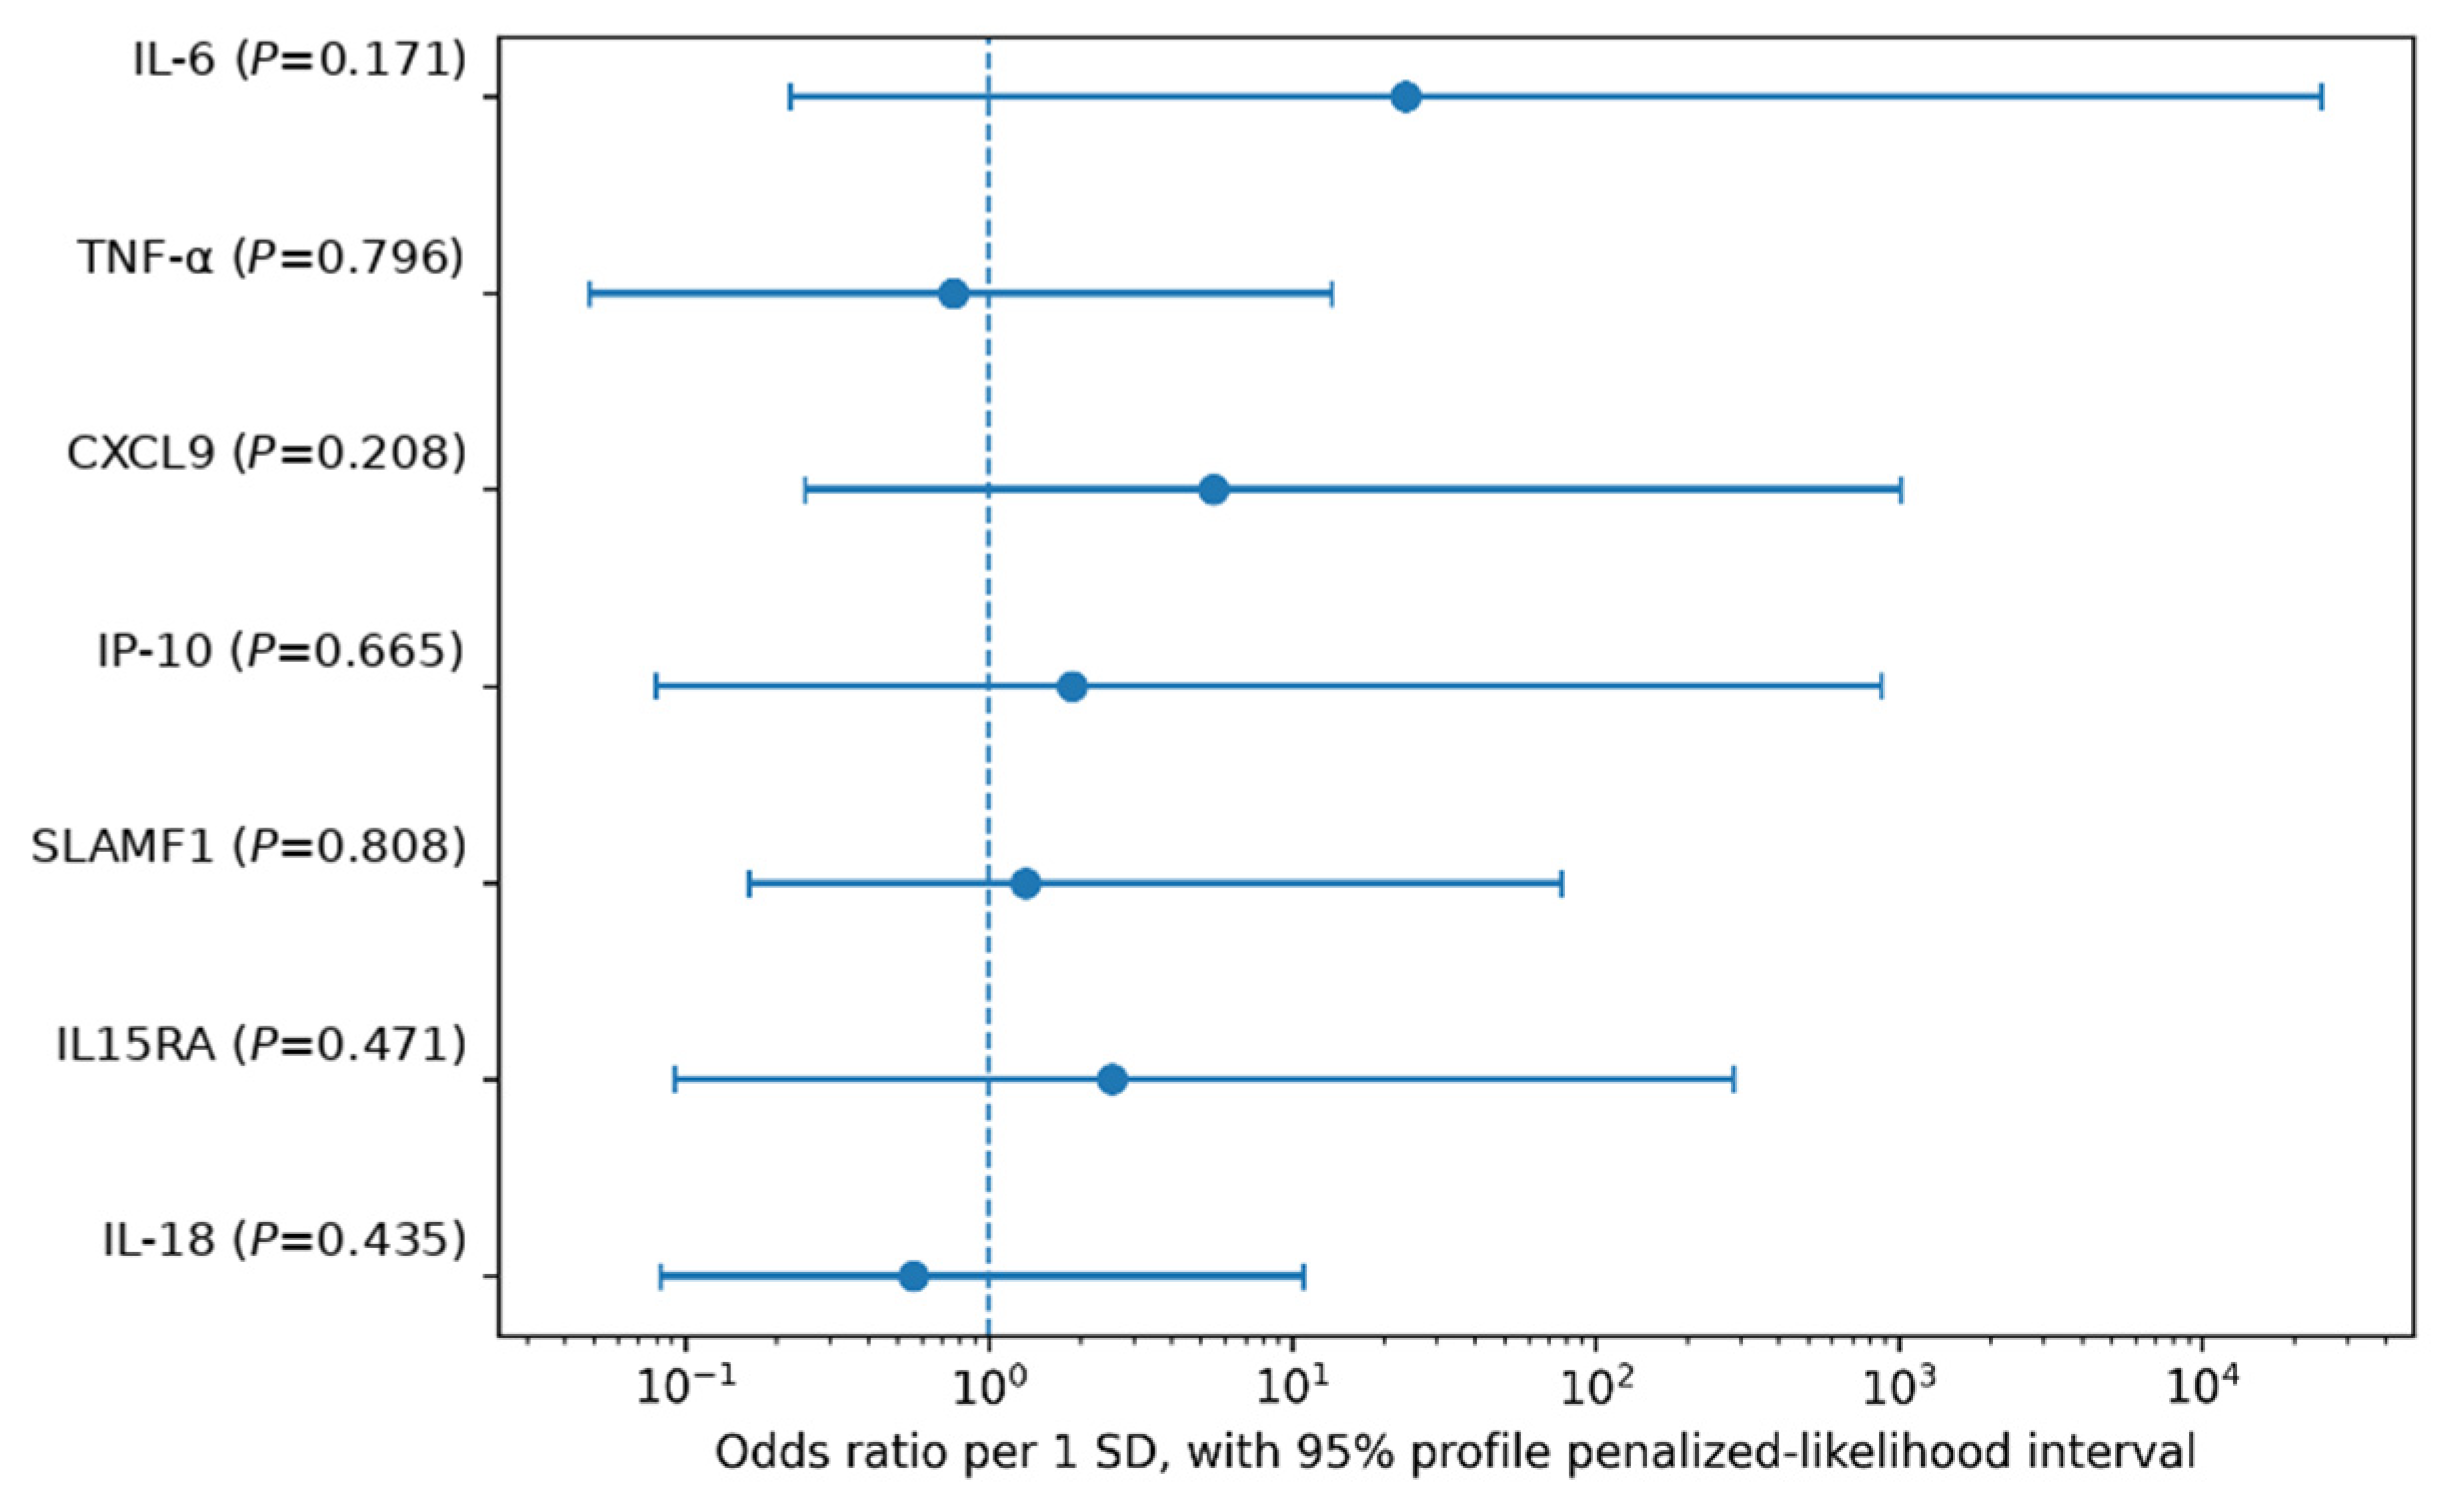
A separating hyperplane was feasible for the full seven-marker design. Firth coefficients were finite, but all seven profile 95% intervals included OR = 1, and all coefficient tests had p ≥ 0.171 (Table 2; Figure 2). The IL-6 OR was 23.57 (0.22–2.48 × 10⁴), and the CXCL9 OR was 5.48 (0.25–1.01 × 10³). VIFs ranged from 1.15 to 2.97, and the design condition number was 3.88. In the secondary four-marker Firth model, TNF-α, SLAMF1 and IL15RA had intervals excluding one, but these conditional associations were not individually supported in the full model and do not establish independence from IL-6, CXCL9, IP-10 or clinical factors (Supplementary Table S2).
Table 2.
Primary seven-marker Firth penalized logistic model.
Figure 2.
Primary seven-marker Firth model. Odds ratios per one standardized predictor increment and full 95% profile penalized-likelihood intervals are displayed on a logarithmic axis. All seven variables are retained; none of the intervals is truncated. p values are profile penalized likelihood-ratio tests. The reference line is OR = 1. These are conditional biomarker coefficients, not effects adjusted for clinical covariates. Abbreviations: CXCL9, C-X-C motif chemokine ligand 9; IL, interleukin; IL15RA, interleukin-15 receptor subunit alpha; IP-10, interferon gamma-induced protein 10; OR, odds ratio; SD, standard deviation; SLAMF1, signaling lymphocytic activation molecule family member 1; TNF, tumor necrosis factor.
3.4. Within-Dataset Separation and Internal Resampling
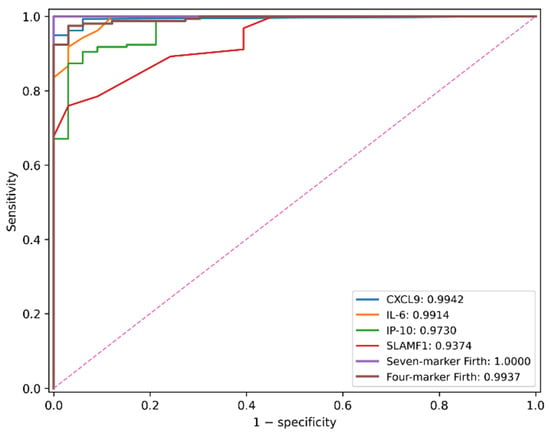
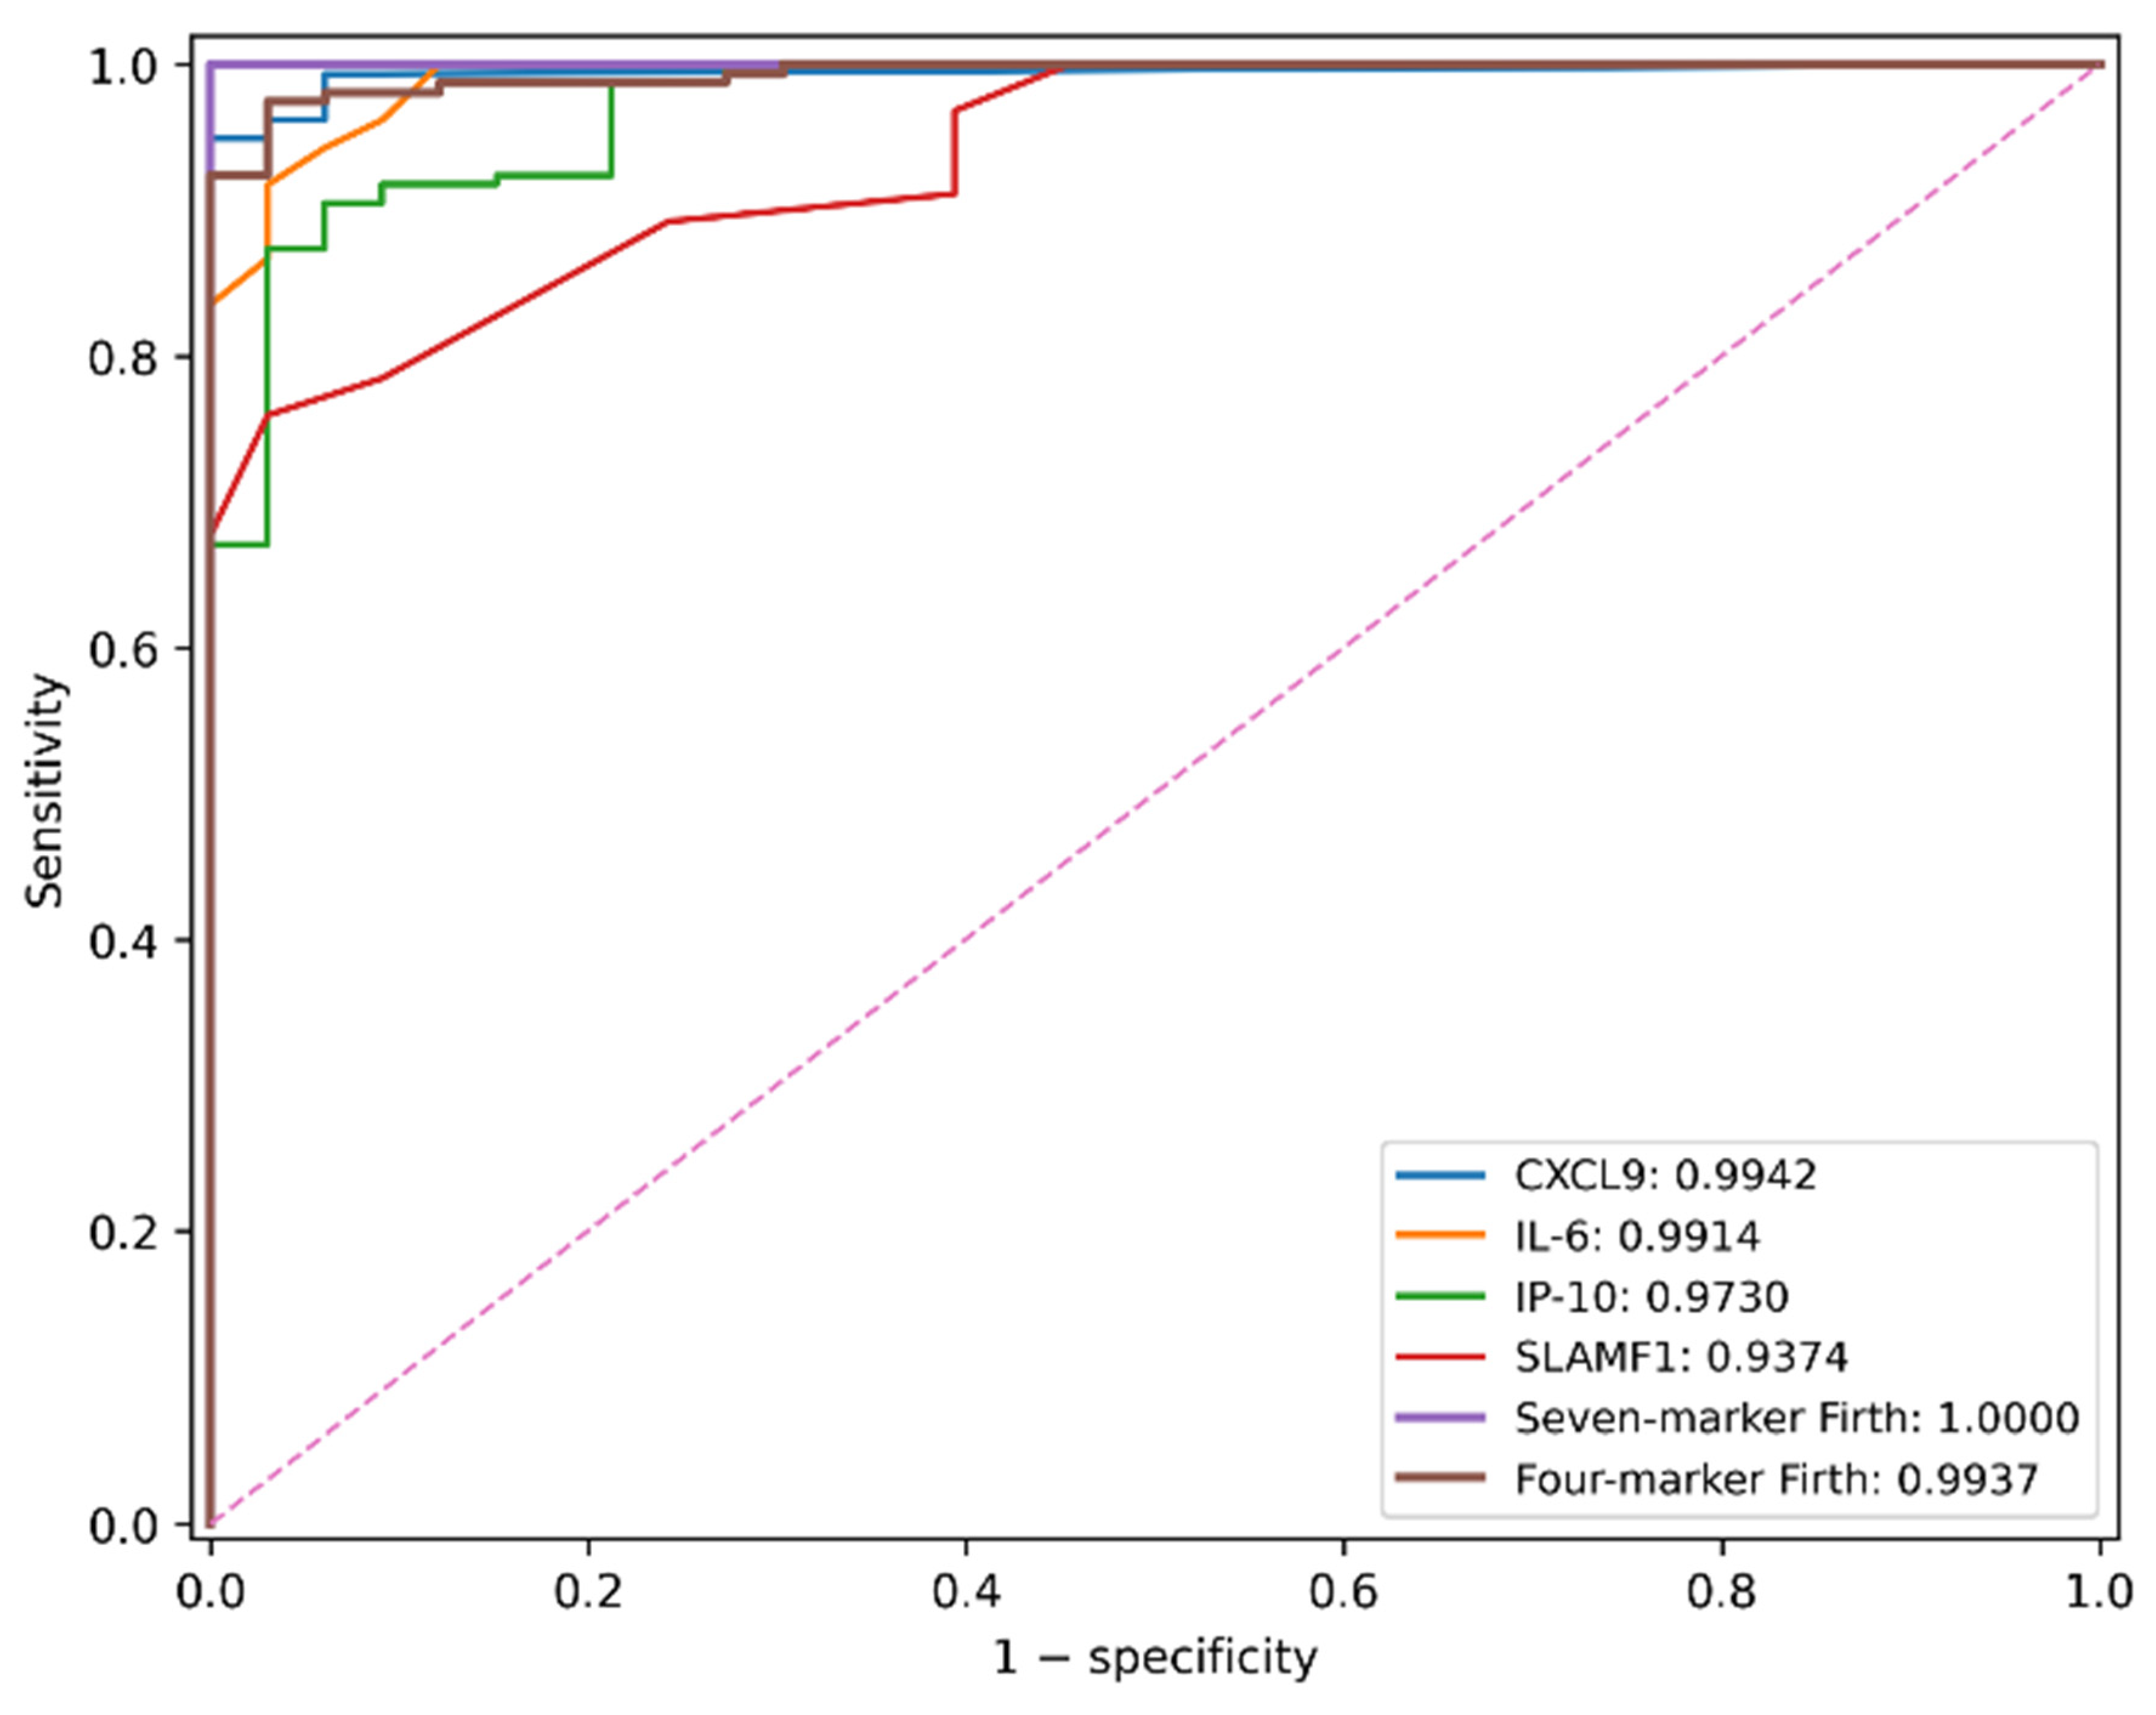
Fixed single-marker AUCs were 0.9942 (95% CI 0.9850–1.0000) for CXCL9, 0.9914 (0.9783–0.9994) for IL-6 and 0.9730 (0.9446–0.9921) for IP-10. TNF-α AUC was 0.8819 (0.8300–0.9275). Full-model apparent, optimism-corrected and mean cross-validated AUCs were 1.0000, 0.9996 and 0.9989; corresponding reduced-model values were 0.9937, 0.9901 and 0.9855 (Table 3; Figure 3). All bootstrap fits met the specified convergence criterion.
Table 3.
Exploratory discrimination and internal validation.
Figure 3.
Apparent ROC curves from the development dataset. Single-marker curves for CXCL9, IL-6, IP-10 and SLAMF1 and the seven- and four-marker Firth models are shown. Legend AUCs are apparent, not out-of-fold curves. Internally validated summary estimates are in Table 3. Only 33 comparator records were available; repeated resampling does not increase the number of independent comparator observations. The curves describe separation of recorded labels and do not establish external diagnostic accuracy. The dashed diagonal line indicates the chance level (no discrimination; sensitivity = specificity). Abbreviations: AUC, area under the receiver operating characteristic curve; CXCL9, C-X-C motif chemokine ligand 9; IL, interleukin; IP-10, interferon gamma-induced protein 10; ROC, receiver operating characteristic; SLAMF1, signaling lymphocytic activation molecule family member 1.
The full-model AUC split-percentile range was 0.9968–0.9998, not a confidence interval. Mean CV Brier scores were 0.0106 and 0.0324. Apparent ordinary full-model calibration was non-estimable under complete separation, whereas all 50 CV repetitions had finite joint calibration estimates (Supplementary Tables S2 and S3).
Only 33 comparator records were available; repeated resampling added no independent comparator observations. These within-dataset summaries do not establish diagnostic performance in a clinical population.
3.5. Censoring Sensitivity and Exploratory Clustering
After applying the same censoring rule in both groups, CXCL9 AUC was 0.9942 under half-limit, limit/√2 and full-limit substitution. TNF-α AUCs were 0.8819, 0.8819 and 0.8805, respectively. The small full-limit difference arises because a quantified TNF-α value of 0.15 becomes tied with the substituted values. All seven informative-marker comparisons remained q < 0.001. Full-model mean AUCs in 20 matched fivefold-validation repetitions were 0.9986, 0.9989 and 0.9988. These analyses assess the specified substitutions; they do not recover unobserved sub-limit concentrations or eliminate clinical or batch confounding (Supplementary Table S4).
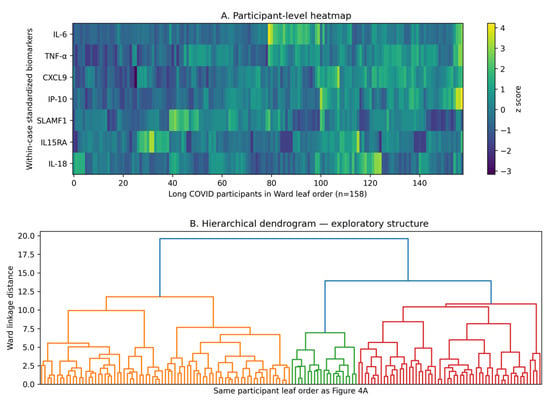
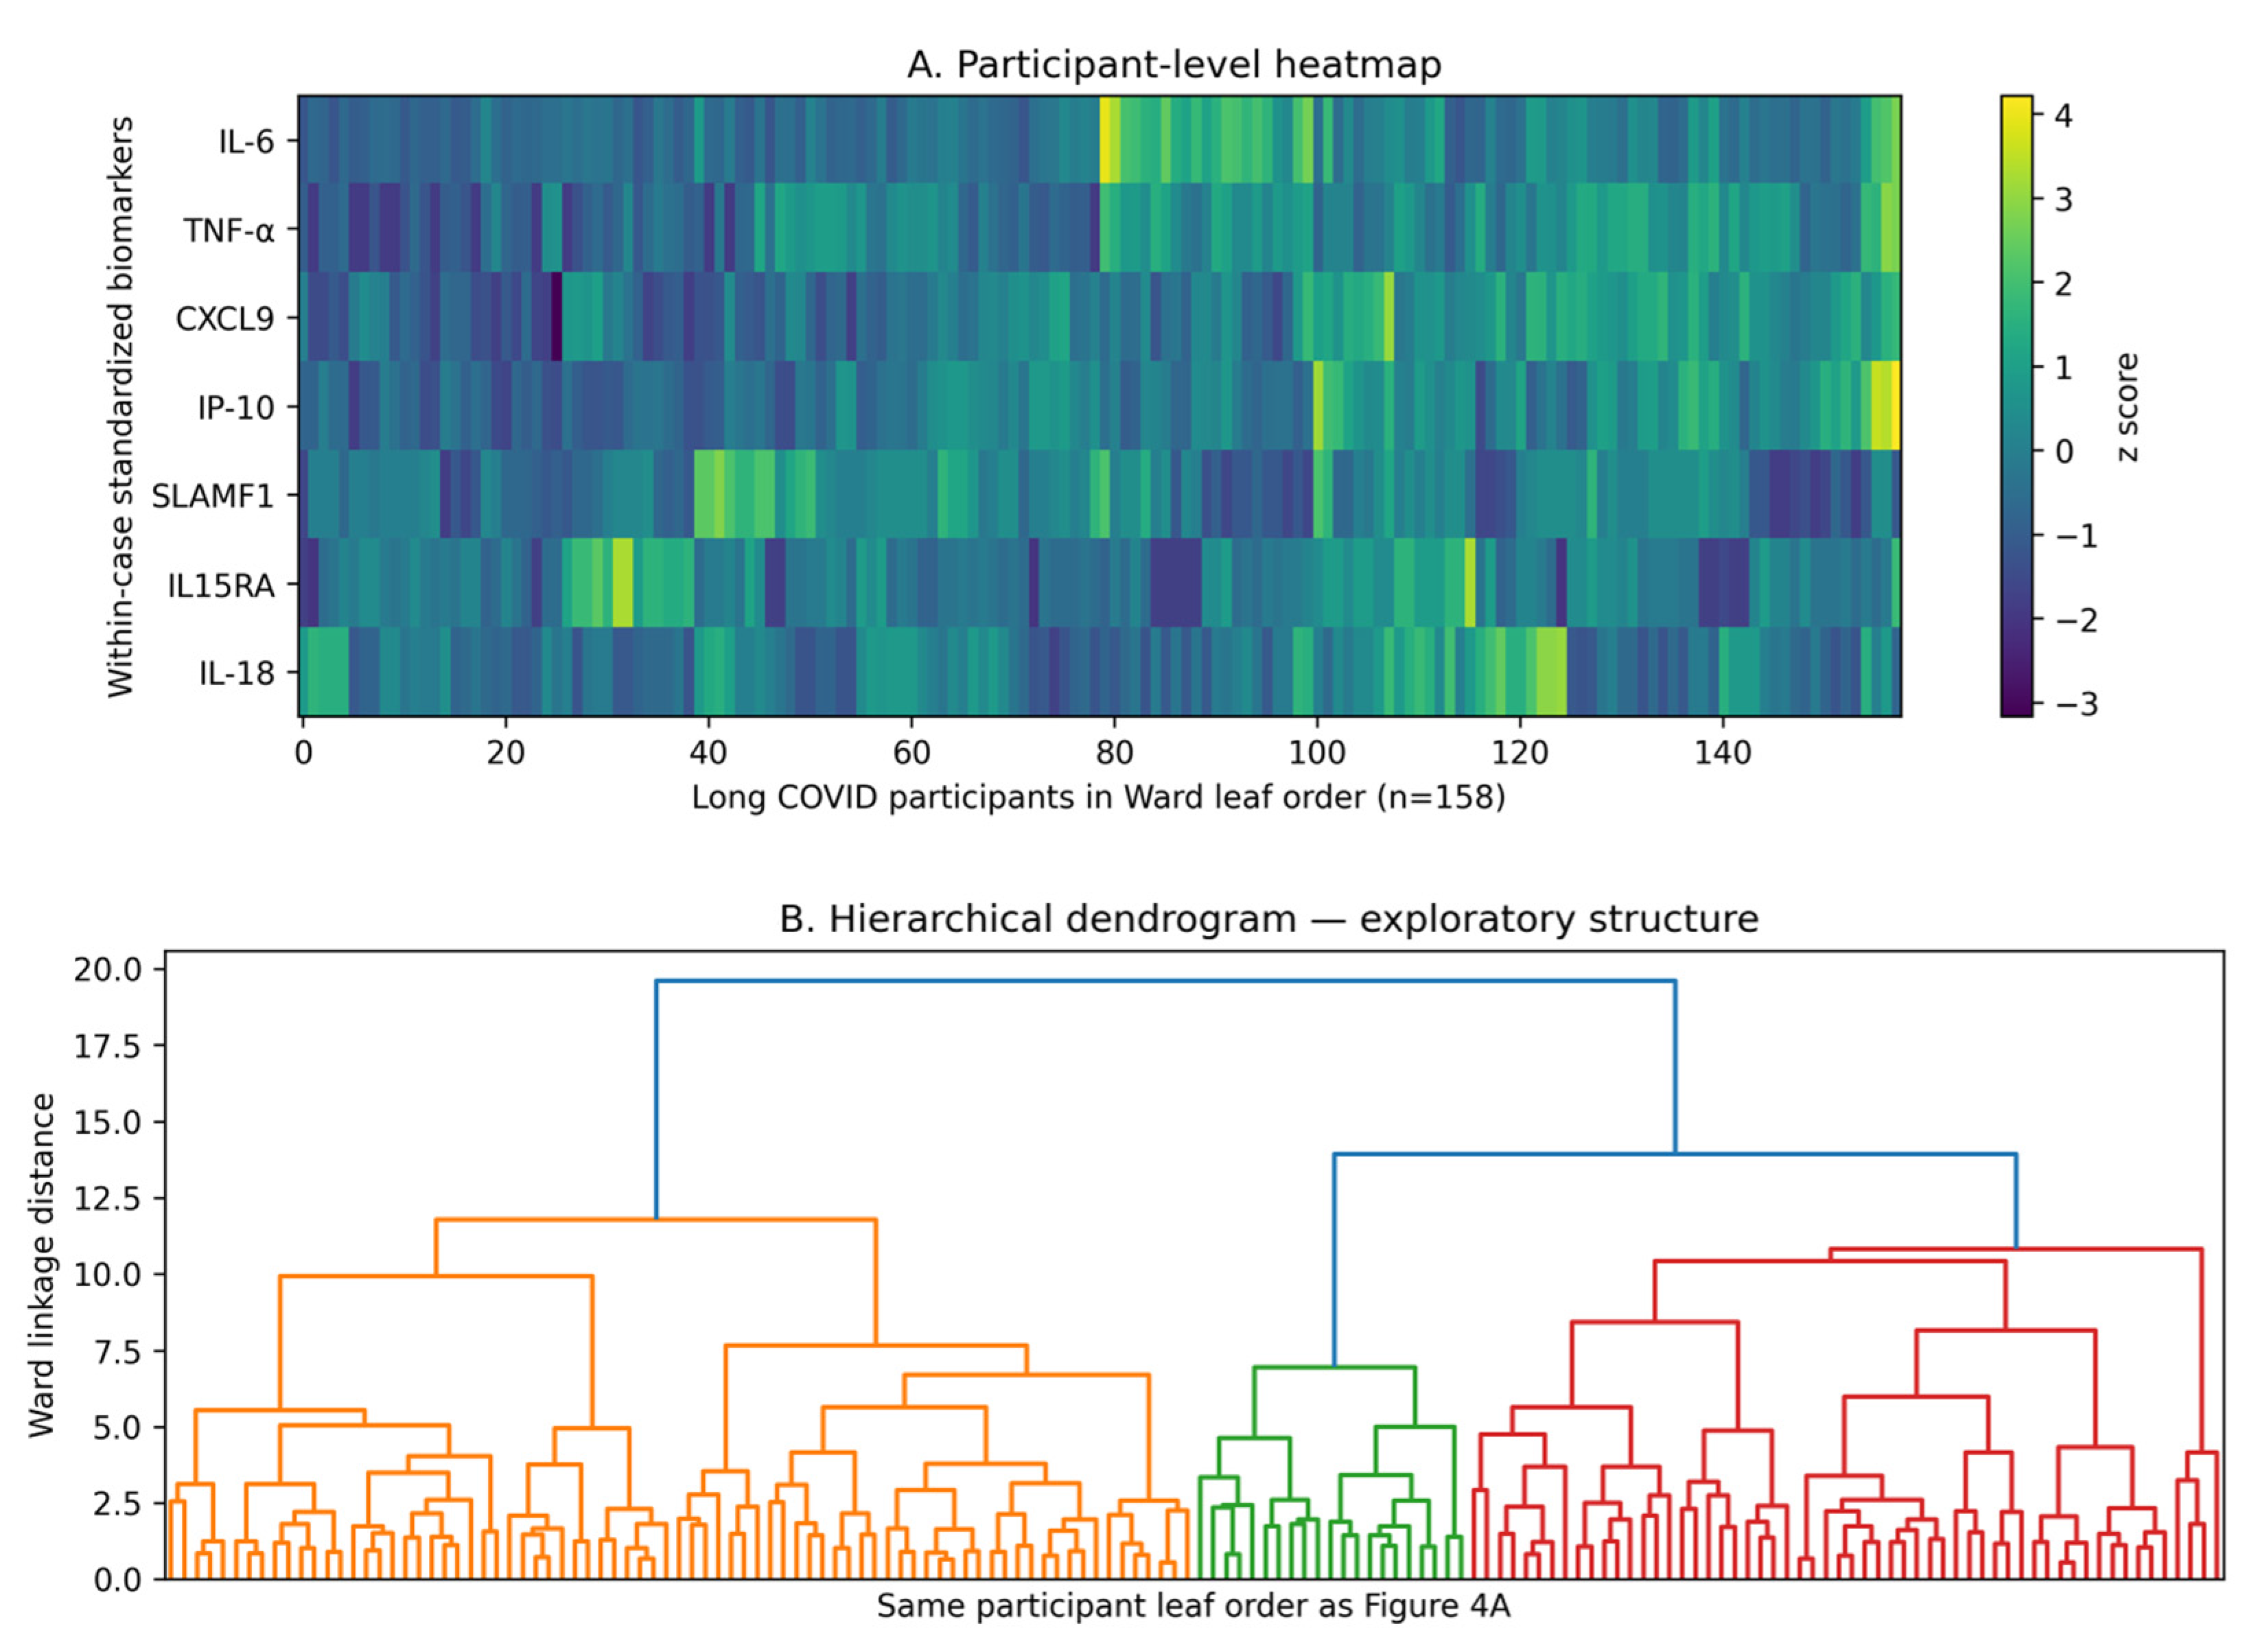
Ward clustering reproduced the original k = 2 group sizes of 79/79, but silhouette width was 0.155. The k = 3, 4 and 5 widths were 0.166, 0.122 and 0.136; the gap rule selected k = 1. For k = 2, mean best-matching bootstrap Jaccard values were 0.690 and 0.688, and mean adjusted Rand index was 0.421 (Table 4). Case-only PC1 explained 29.8% of variance, compared with 49.8% for PC1 in the all-record analysis. These are different populations and are not interchangeable. The results did not establish distinct biological subtypes or prove a single-dimensional inflammatory continuum. The two-way partition is descriptive only (Figure 4; Supplementary Table S5; Figures S1–S3).
Table 4.
Exploratory cluster validity and bootstrap stability.
Figure 4.
(A,B) Participant-level heatmap and Ward dendrogram within the recorded long COVID group. Each heatmap column represents one of 158 records in dendrogram leaf order; the companion dendrogram uses the same ordering. Four concentration markers were log10-transformed, and then, all seven markers were standardized within cases. The display does not establish discrete subtypes. Dendrogram branch colors (orange, green, red and blue) distinguish branches for visualization only and do not identify validated subtypes or determine the selected number of clusters. k = 2 reproduced 79/79 groups, but the gap criterion selected k = 1. Abbreviations: CXCL9, C-X-C motif chemokine ligand 9; IL, interleukin; IL15RA, interleukin-15 receptor subunit alpha; IP-10, interferon gamma-induced protein 10; SLAMF1, signaling lymphocytic activation molecule family member 1; TNF, tumor necrosis factor.
4. Discussion
The principal finding is an unexpected, almost complete separation of several biomarker values between the recorded groups. The biological specificity of these findings cannot be established. Clinical selection, classification or laboratory differences could account for some or all of the observed separation. The result is therefore a hypothesis-generating observation that requires explanation before disease-specific inferences can be drawn.
4.1. Comparison with Other Long COVID Cohorts
The magnitude of separation requires caution in the context of more extensively characterized cohorts. Klein et al. enrolled 275 participants and reported an AUC of 0.94 (95% CI 0.84–1.00) for a k-nearest-neighbor classifier using immunological features in matched participants [9]. Liew et al. profiled 368 plasma proteins in 657 previously hospitalized participants and identified inflammatory associations that differed across symptom groups [10]. Talla et al. identified an inflammatory protein pattern in a subset of participants with post-acute sequelae rather than uniformly across the affected group [5]. In longitudinal follow-up, several early immune differences were no longer detectable at 24 months [4]. These findings emphasize heterogeneity across participants and time.
Negative and inconclusive findings are also important to this comparison. Santopaolo et al. found that long COVID symptoms were not associated with the measured cellular immune activation markers or pro-inflammatory cytokines after adjustment for age, sex and acute disease severity [11]. In an age- and sex-matched study of 48 long COVID patients and 48 recovered controls at a median of 69 weeks after infection, Omdal et al. found that nominal differences in ultrasensitive measurements of IL-6, TNF-α and other inflammatory markers did not remain significant after correction for multiple comparisons [12].
Humer et al. likewise found no significant differences after multiple-testing correction in circulating cytokines, monocyte inflammatory gene expression or systemic interferon pathway activation between patients with prolonged severe long COVID and convalescent controls under resting conditions [13]. Other evidence is mixed: Gao et al. found no consistent differences in immune-cell composition or antiviral T-cell immunity, alongside soluble-protein associations with breathlessness [14]. These null or mixed findings do not demonstrate equivalence or exclude tissue-restricted, intermittent or subgroup-specific immune abnormalities. They do show that persistent symptoms are not consistently accompanied by a strong, shared peripheral immune profile.
Against this background of absent, modest and symptom-dependent findings, the almost complete separation across several markers in our dataset is markedly atypical and remains unexplained. The populations, comparator definitions, sampling intervals, biomarker panels, assays and validation procedures differ across studies, so the reported AUC estimates are not directly comparable; no formal between-study comparison was performed. Our near-perfect separation should not be interpreted as superior diagnostic performance or as a general feature of long COVID. The discrepancy is central to interpreting the present observation and increases the need to verify participant selection, clinical classification and laboratory comparability. Internal resampling cannot resolve it because the same selection, classification and measurement structure is retained.
4.2. Clinical Classification and Comparability
The study protocol specified assessment of post-COVID sequelae, and treating physicians at the participating institutions assessed group status during follow-up. Both groups were subject to the same protocol-defined follow-up sampling criteria. Nevertheless, the original comparator designation “No adverse events” is a recorded label, not confirmation that post-COVID sequelae were clinically excluded. A uniform symptom-duration threshold and compliance with the WHO case definition were not independently established. The actual sampling timepoint for each analyzed record was unavailable. Differences in recruitment, referral patterns, ascertainment or sampling time could therefore cause the markers to distinguish features of the selected populations rather than long COVID-specific biology.
Our single-timepoint measurements cannot establish persistent inflammation or distinguish delayed recovery from sustained activation. Differences in time from symptom onset to blood sampling are a plausible explanation for the observed separation, particularly given the temporal changes reported in longitudinal studies [4]. Age, vaccination, reinfection, acute severity, treatment and inflammatory comorbidities were unmeasured. CXCL9 has also been associated with physical performance and mortality in older men [15], providing another reason to consider demographic and clinical context when interpreting the present differences. The contributions of these factors cannot be estimated or ranked with the present dataset. Review of the study protocol clarified the planned follow-up schedule but did not supply the missing record-level sampling intervals or clinical covariates.
4.3. Laboratory Comparability and Censoring
Correction of the table entries using the previously confirmed common lower reporting limits resolves the specific reporting inconsistency. All eight markers were measured centrally, using the same measurement day and reagent lot within each assay and multiple assay plates of the same type. The 44 corrections concerned 14 TNF-α cells and 30 CXCL9 cells in the 33 comparator records; they were reporting corrections, not new measurements. In particular, CXCL9 was at or below 31.3 pg/mL in 30/33 comparator records (90.9%) compared with 1/158 records labeled long COVID (0.6%). This marked asymmetry remains an unresolved feature of the data. The comparator median and interquartile range within the censored region cannot be recovered, and 15.65 pg/mL is an analysis substitute rather than an observed concentration.
The unchanged CXCL9 AUC across the three substitution schemes shows that its ranking is insensitive to those specific replacements; it does not recover the ordering of unobserved sub-limit concentrations or independently validate the measurements. The confirmed common measurement day and reagent lot within each assay reduce concern about those sources of variation. However, multiple plates were used, and a common plate type does not exclude between-plate effects. Analyte-specific storage and transport procedures were common across institutions. However, the formal LOD/LLOQ designation of the reporting limits and detailed assay quality-control results were not verified from the available documentation. These residual uncertainties, together with unresolved clinical classification and sampling-time differences, prevent attribution of the observed separation to long COVID-specific biology.
4.4. Interpretation of Internal Analyses
Internal resampling quantifies aspects of statistical stability within the observed dataset. Bootstrap samples and cross-validation folds retain their underlying recruitment, classification and measurement structure and can reproduce systematic differences already present. Consequently, even near-perfect held-out discrimination cannot exclude selection bias, misclassification or residual systematic measurement error. A common measurement day and reagent lot were used within each assay, together with multiple plates of the same type. These conditions do not establish absence of between-plate effects, and internal validation cannot supply missing clinical covariates or validate the recorded outcome definitions.
The full seven-marker Firth model addressed separation without deleting the most separating markers. Nevertheless, all individual profile intervals included the null. Conditional associations in the reduced model cannot be interpreted as independent contributions across the complete biomarker panel. Penalization yields finite estimates but cannot supply clinical covariates or validate the outcome definition. Sample-specific calibration does not establish performance in a target clinical population.
The case-only measurements reproduced the 79/79 partition, but low silhouette widths, limited bootstrap agreement and gap selection of k = 1 do not support two validated subtypes. Case-only PC1 explained 29.8%, so a single inflammatory axis is also not established. The descriptive partition and participant-level displays do not support treatment selection, anti-cytokine trial eligibility or a clinically applicable diagnostic cutoff.
4.5. Limitations and Independent Investigation
The limitations include the cross-sectional design, unverified uniform operational case/comparator definitions, absent demographic and clinical covariates and record-level sampling intervals, incomplete study-era assay and quality-control documentation, missing record-level site identifiers, substantial comparator CXCL9 censoring, the small comparator group and lack of external validation. All markers were measured centrally, using the same measurement day and reagent lot within each assay and multiple plates of the same type. These measurement conditions do not exclude between-plate effects. Row-level resampling cannot resolve unrecognized participant duplication or within-site dependence. The findings remain hypothesis-generating and cannot be attributed to long COVID-specific biology solely on the basis of numerical consistency in the internal analyses.
Independent investigation requires documented case and comparator definitions, clinically characterized participants from comparable recruitment settings, and defined sampling windows. Laboratory assessment should document specimen handling, assay products, reporting characteristics, quality controls and allocation across lots and runs, with blinded assessment where feasible.
Verification against source records and replication in an independently recruited cohort are needed to determine whether the unusual separation persists under comparable conditions. Until then, this study contributes an observation requiring explanation; it does not establish biological specificity, diagnostic accuracy in clinical practice or treatment-selection utility.
5. Conclusions
This exploratory analysis identifies an unusually strong biomarker separation between the recorded long COVID and comparator groups. The biological specificity of the observed differences cannot be established. Unverified uniform clinical classification criteria, missing clinical covariates and sampling intervals, and residual gaps in assay documentation prevent distinction between disease-related biology and clinical or analytical confounding. The contribution is an unexpected observation requiring independent investigation under documented, comparable clinical and laboratory conditions. The results do not establish a diagnostic test, persistent inflammation, distinct biological subtypes or treatment-selection utility.
Supplementary Materials
The following supporting information can be downloaded at: https://www.mdpi.com/article/10.3390/diagnostics16223722/s1, Table S1: Data and reporting-bound audit; Table S2: Secondary models and numerical diagnostics; Table S3: Internal resampling variability; Table S4: Sensitivity to corrected censored values; Table S5: Descriptive partition and PCA; Figure S1: PCA in all 191 records; Figure S2: PCA within the 158 records labeled long COVID; Figure S3: Gap assessment.
Author Contributions
Conceptualization: Y.Y. and H.M.; Methodology: Y.Y., S.T., H.K. and H.M.; Investigation: Y.Y., S.T., H.K. and H.M.; Data curation: Y.Y. and H.M.; Writing—original draft preparation: YY.; Writing—review and editing: Y.Y. and H.M.; Project administration: Y.Y. and H.M.; Supervision: S.T., H.K. and H.M. All authors have read and agreed to the published version of the manuscript.
Funding
This research was supported by the 40th Anniversary Commemorative Disease-Specific Research Grant for Fiscal Years 2021 and 2022 from the Public Interest Incorporated Foundation Kenzo Suzuki Memorial Foundation for Medical Science Research.
Institutional Review Board Statement
This study was conducted in accordance with the Declaration of Helsinki and approved by the Ethics Committee of Aichi Medical University (protocol code 2021-095, approved on 6 October 2021).
Informed Consent Statement
Patient consent was obtained from all subjects involved in this study. Participants were provided with detailed information about the study objectives, procedures, and their right to withdraw at any time without affecting their clinical care.
Data Availability Statement
The data presented in this study are available on request from the corresponding author due to privacy and ethical restrictions concerning patient information.
Acknowledgments
The authors thank the staff of Aichi Medical University Hospital, Kochi Medical School Hospital, Sapporo Medical University Hospital and St. Marianna University Hospital for their assistance in specimen collection and laboratory coordination.
Conflicts of Interest
The authors declare no conflicts of interest.
References
- Soriano, J.B.; Murthy, S.; Marshall, J.C.; Relan, P.; Diaz, J.V.; WHO Clinical Case Definition Working Group on Post-COVID-19 Condition. A clinical case definition of post-COVID-19 condition by a Delphi consensus. Lancet Infect. Dis. 2022, 22, e102–e107. [Google Scholar] [CrossRef] [Scilit] [PubMed]
- Phetsouphanh, C.; Darley, D.R.; Wilson, D.B.; Howe, A.; Munier, C.M.L.; Patel, S.K.; Juno, J.A.; Burrell, L.M.; Kent, S.J.; Dore, G.J.; et al. Immunological dysfunction persists for 8 months following initial mild-to-moderate SARS-CoV-2 infection. Nat. Immunol. 2022, 23, 210–216. [Google Scholar] [CrossRef] [Scilit] [PubMed]
- Yin, K.; Peluso, M.J.; Luo, X.; Thomas, R.; Shin, M.-G.; Neidleman, J.; Andrew, A.; Young, K.C.; Ma, T.; Hoh, R.; et al. Long COVID manifests with T cell dysregulation, inflammation and an uncoordinated adaptive immune response to SARS-CoV-2. Nat. Immunol. 2024, 25, 218–225. [Google Scholar] [CrossRef] [Scilit] [PubMed]
- Phetsouphanh, C.; Jacka, B.; Ballouz, S.; Jackson, K.J.L.; Wilson, D.B.; Manandhar, B.; Klemm, V.; Tan, H.-X.; Wheatley, A.; Aggarwal, A.; et al. Improvement of immune dysregulation in individuals with long COVID at 24-months following SARS-CoV-2 infection. Nat. Commun. 2024, 15, 3315. [Google Scholar] [CrossRef] [Scilit] [PubMed]
- Talla, A.; Vasaikar, S.V.; Szeto, G.L.; Lemos, M.P.; Czartoski, J.L.; MacMillan, H.; Moodie, Z.; Cohen, K.W.; Fleming, L.B.; Thomson, Z.; et al. Persistent serum protein signatures define an inflammatory subcategory of long COVID. Nat. Commun. 2023, 14, 3417. [Google Scholar] [CrossRef] [Scilit] [PubMed]
- Heinze, G.; Schemper, M. A solution to the problem of separation in logistic regression. Stat. Med. 2002, 21, 2409–2419. [Google Scholar] [CrossRef] [Scilit] [PubMed]
- Steyerberg, E.W.; Harrell, F.E., Jr.; Borsboom, G.J.; Eijkemans, M.; Vergouwe, Y.; Habbema, J.F. Internal validation of predictive models: Efficiency of some procedures for logistic regression analysis. J. Clin. Epidemiol. 2001, 54, 774–781. [Google Scholar] [CrossRef] [Scilit] [PubMed]
- Tibshirani, R.; Walther, G.; Hastie, T. Estimating the number of clusters in a data set via the gap statistic. J. R. Stat. Soc. Ser. B Stat. Methodol. 2001, 63, 411–423. [Google Scholar] [CrossRef] [Scilit]
- Klein, J.; Wood, J.; Jaycox, J.R.; Dhodapkar, R.M.; Lu, P.; Gehlhausen, J.R.; Tabachnikova, A.; Greene, K.; Tabacof, L.; Malik, A.A.; et al. Distinguishing features of long COVID identified through immune profiling. Nature 2023, 623, 139–148. [Google Scholar] [CrossRef] [Scilit] [PubMed]
- Liew, F.; Efstathiou, C.; Fontanella, S.; Richardson, M.; Saunders, R.; Swieboda, D.; Sidhu, J.K.; Ascough, S.; Moore, S.C.; Mohamed, N.; et al. Large-scale phenotyping of patients with long COVID post-hospitalization reveals mechanistic subtypes of disease. Nat. Immunol. 2024, 25, 607–621. [Google Scholar] [CrossRef] [Scilit] [PubMed]
- Santopaolo, M.; Gregorova, M.; Hamilton, F.; Arnold, D.; Long, A.; Lacey, A.; Oliver, E.; Halliday, A.; Baum, H.; Hamilton, K.; et al. Prolonged T-cell activation and long COVID symptoms independently associate with severe COVID-19 at 3 months. eLife 2023, 12, e85009. [Google Scholar] [CrossRef] [Scilit] [PubMed]
- Omdal, R.; Lenning, O.B.; Jonsson, G.; Kvaløy, J.T.; Di Molfetta, G.; Tan, K.; Benedet, A.L.; Ashton, N.J.; Braut, G.S.; Zetterberg, H.; et al. Long-COVID: Assessment of circulating markers suggests no cerebral neuronal damage, neuroinflammation or systemic inflammation–a controlled study. Sci. Rep. 2026, 16, 11856. [Google Scholar] [CrossRef] [Scilit] [PubMed]
- Humer, B.; Berentschot, J.C.; van Helden-Meeuwsen, C.G.; Lam, W.; Defesche, T.M.; Boly, C.A.; Versnel, M.A.; Hellemons, M.E.; Dik, W.A. No detectable differences in peripheral blood immune profiles between patients with prolonged severe long COVID and convalescent controls. Sci. Rep. 2026. [Google Scholar] [CrossRef] [Scilit]
- Gao, Y.; Cai, C.; Adamo, S.; Biteus, E.; Kamal, H.; Dager, L.; Miners, K.L.; Llewellyn-Lacey, S.; Ladell, K.; Amratia, P.S.; et al. Identification of soluble biomarkers that associate with distinct manifestations of long COVID. Nat. Immunol. 2025, 26, 692–705. [Google Scholar] [CrossRef] [Scilit] [PubMed]
- Seo, D.H.; Corr, M.; Patel, S.; Lui, L.-Y.; Cauley, J.A.; Evans, D.; Mau, T.; Lane, N.E. Chemokine CXCL9, a marker of inflammaging, is associated with changes of muscle strength and mortality in older men. Osteoporos. Int. 2024, 35, 1789–1796. [Google Scholar] [CrossRef] [Scilit] [PubMed]

Disclaimer/Publisher’s Note: The statements, opinions and data contained in all publications are solely those of the individual author(s) and contributor(s) and not of MDPI and/or the editor(s). MDPI and/or the editor(s) disclaim responsibility for any injury to people or property resulting from any ideas, methods, instructions or products referred to in the content. |
© 2026 by the authors. Licensee MDPI, Basel, Switzerland. This article is an open access article distributed under the terms and conditions of the Creative Commons Attribution (CC BY) license.