


Abstract
Background/Objectives: Fetal growth restriction (FGR) is associated with maternal cardiovascular maladaptation, but its relationship with cardiac function, biomarkers and fetoplacental dysfunction remains incompletely characterized. We aimed to characterize the maternal cardiovascular phenotype associated with FGR and its variation according to onset. Methods: This prospective study included 140 singleton pregnancies: 59 with FGR (10 early-onset; 49 late-onset) and 81 controls. Assessments included maternal hemodynamics, echocardiography, circulating biomarkers, fetoplacental Doppler indices and neonatal outcomes. Analyses comprised group comparisons, multivariable regression, correlations and exploratory biomarker ROC analyses. Results: After adjustment for gestational age at the corresponding assessment, maternal age, body mass index, preeclampsia and chronic hypertension, FGR was associated with lower cardiac output (−1.84 L/min; 95% CI, −2.13 to −1.55), higher systemic vascular resistance (+530 dyn·s·cm−5; 95% CI, 429–632) and altered relaxation indices. NT-proBNP and GDF-15 concentrations were 191% (95% CI, 141–250%) and 125% (95% CI, 92–164%) higher, respectively. Early-onset FGR showed greater abnormalities in selected hemodynamic and relaxation parameters and higher GDF-15 than late-onset FGR; e′, E/e′, and NT-proBNP did not differ significantly. Apparent within-cohort AUCs for FGR discrimination were 0.991 for NT-proBNP and 0.961 for GDF-15. Selected cardiovascular parameters correlated with fetoplacental Doppler indices and perinatal outcomes. Early-onset FGR had the highest NICU admission rate and longest neonatal hospitalization among survivors, alongside substantially earlier delivery. Conclusions: FGR was associated with a low-output, high-resistance maternal cardiovascular phenotype and elevated biomarkers. Onset-related comparisons remain exploratory and were not validated by the gestational-age-restricted sensitivity analysis, which included only late-onset FGR. Incremental predictive value beyond fetal biometry and Doppler assessment and benefits for clinical management remain to be established.
1. Introduction
Fetal growth restriction (FGR) reflects failure to achieve fetal growth potential and is commonly associated with placental dysfunction. Diagnosis integrates fetal biometry and Doppler assessment, with early- and late-onset FGR defined by diagnosis before 32 weeks and at or after 32 weeks, respectively [1,2]. These phenotypes differ in severity, Doppler findings and perinatal outcomes. FGR is associated with prematurity, increased perinatal morbidity and mortality and adverse neurodevelopmental, cardiovascular and metabolic outcomes later in life [2,3].
Although traditionally regarded predominantly as a consequence of placental insufficiency, FGR is increasingly recognized as being associated with maternal cardiovascular maladaptation. Normal pregnancy requires expansion of circulating volume, increased stroke volume and cardiac output, and reduced systemic vascular resistance [4,5]. A recent meta-analysis of 33 studies involving 7816 women demonstrated increased maternal peripheral vascular resistance from the second trimester and reduced cardiac output, particularly during the third trimester [4]. These findings support a broader maternal cardiovascular-placental framework of FGR.
Maternal cardiovascular maladaptation in FGR appears to extend beyond altered central hemodynamics. Echocardiographic studies have demonstrated changes in ventricular geometry and evidence of subclinical myocardial dysfunction, particularly impaired diastolic relaxation, even in normotensive women with severe FGR [6]. In a prospective cohort of 1152 normotensive nulliparous women, hemodynamic and cardiac abnormalities were identified at 22–24 weeks in those who subsequently developed FGR, with greater impairment preceding early-onset disease [7]. Maternal cardiovascular maladaptation may therefore represent an early component of the FGR phenotype rather than solely a consequence of established placental disease.
Maternal low-output, high-resistance profiles have been associated with increased umbilical artery impedance and reduced umbilical venous flow, supporting an integrated maternal-placental-fetal cardiovascular framework [8]. More recently, the 2025 ISUOG Consensus Statement on maternal hemodynamic assessment recognized the potential relevance of maternal hemodynamic assessment while emphasizing the need for standardized methods and further prospective evidence [5].
Circulating biomarkers may provide an additional biological dimension to this cardiovascular phenotype. N-terminal pro-B-type natriuretic peptide (NT-proBNP), a marker of myocardial wall stress, has been associated with altered maternal hemodynamics and subclinical cardiac dysfunction in pregnancies complicated by preeclampsia and FGR, although findings in isolated FGR have been inconsistent [9,10]. Growth differentiation factor-15 (GDF-15), a stress-responsive cytokine highly expressed by the placenta, has been implicated in placental dysfunction and hypertensive pregnancy disorders [11]. Increased placental GDF-15 expression has also been reported in FGR with and without preeclampsia [12].
Maternal hemodynamics, echocardiographic indices, circulating biomarkers and fetoplacental Doppler parameters have rarely been evaluated simultaneously within the same cohort. It also remains uncertain whether cardiovascular maladaptation differs between early- and late-onset FGR and to what extent it is independent of concomitant preeclampsia.
The main objective of this exploratory study was to characterize the maternal cardiovascular phenotype associated with FGR by comparing maternal hemodynamic and echocardiographic measures between FGR and control pregnancies. Secondary exploratory analyses examined circulating NT-proBNP and GDF-15, differences according to FGR onset and concomitant preeclampsia, and associations with fetoplacental Doppler indices and perinatal outcomes. Biomarker discrimination between established FGR and selected control pregnancies was also explored.
2. Materials and Methods
2.1. Study Design and Population
This prospective observational study was conducted at the “Cuza Vodă” Clinical Hospital of Obstetrics and Gynecology, Iași, Romania, between 25 July 2025 and August 2026. Women aged ≥18 years with singleton pregnancies at ≥24 + 0 weeks of gestation were consecutively recruited. Exclusion criteria were major fetal structural anomalies, known chromosomal abnormalities and pre-existing maternal cardiac disease. Four eligible women declined participation. A total of 140 women provided written informed consent and were enrolled, comprising 59 FGR pregnancies and 81 controls with appropriate fetal growth and no FGR according to the study criteria. Controls were not individually matched to FGR pregnancies and underwent the same study assessments.
Maternal blood sampling, fetal ultrasound and Doppler assessment were performed during the same visit. Echocardiography was performed on the same day or on a separate day. The interval between cardiovascular assessment and biomarker sampling was calculated as the absolute difference between the gestational ages recorded at the two assessments expressed in completed weeks and days.
Maternal characteristics, obstetric history, pregnancy complications, cardiovascular measurements, ultrasound and Doppler findings, biomarker concentrations, delivery and neonatal outcomes were prospectively recorded. Medication data comprised binary indicators of recorded aspirin, heparin, methyldopa and nifedipine use. Drug doses, treatment duration and timing of administration relative to cardiovascular assessment were not available in the analysis dataset. Gestational age was established by first-trimester ultrasound and recorded in completed weeks and days.
The sample size was determined by consecutive recruitment of eligible, consenting women during the predefined study period, rather than by a formal a priori sample-size calculation.
2.2. Definition and Classification of Fetal Growth Restriction
FGR was diagnosed using the international Delphi consensus criteria incorporated into the ISUOG Practice Guideline [1,2]. Classification was based on gestational age when these criteria were first met, irrespective of gestational age at cardiovascular assessment or delivery.
In the absence of congenital anomalies, early-onset FGR (<32 + 0 weeks) was defined by: (1) abdominal circumference (AC) or estimated fetal weight (EFW) <3rd centile; (2) absent umbilical artery (UA) end-diastolic flow; or (3) AC or EFW <10th centile combined with uterine artery pulsatility index (UtA-PI) >95th centile and/or UA-PI >95th centile.
Late-onset FGR (≥32 + 0 weeks) was defined by AC or EFW <3rd centile, or at least two of three criteria: (1) AC or EFW <10th centile; (2) downward crossing of AC or EFW centiles by more than two quartiles on non-customized growth charts; and (3) cerebroplacental ratio (CPR) <5th centile or UA-PI >95th centile. Fetuses with AC or EFW between the 3rd and 10th centiles who did not meet FGR criteria were classified as small for gestational age (SGA) and excluded from both groups.
Preeclampsia was defined according to ISSHP criteria as new-onset hypertension at ≥20 weeks accompanied by proteinuria, maternal organ dysfunction, or uteroplacental dysfunction. Chronic hypertension and superimposed preeclampsia were classified using the same guideline [13]. For descriptive reporting, preeclampsia was additionally classified by the presence of severe features according to ACOG criteria [14].
2.3. Maternal Cardiovascular Assessment
Transthoracic echocardiography was performed by the same experienced cardiologist, with participants in the left lateral position, using a Vivid T8 ultrasound system equipped with a 3Sc-RS phased-array cardiac transducer (GE HealthCare, Chicago, IL, USA). Standardized echocardiographic measurements were obtained according to current American Society of Echocardiography/European Association of Cardiovascular Imaging recommendations [15,16], and values were averaged over three consecutive cardiac cycles.
Blood pressure was measured after at least 10 min of rest using an automated oscillometric upper-arm device (Microlife WatchBP Office Vascular, TWIN200 VSR; Microlife AG, Widnau, Switzerland) with an appropriately sized cuff. Systolic and diastolic blood pressure values were averaged from two consecutive measurements obtained 1 min apart. Heart rate was recorded during echocardiography. Mean arterial pressure (MAP) was calculated as (SBP + 2 × DBP)/3.
Diastolic assessment included transmitral early diastolic inflow velocity (E wave), isovolumic relaxation time (IVRT), and early diastolic mitral annular velocity (e′) measured by tissue Doppler imaging at both the septal and lateral mitral annulus. E′ velocity was calculated as the average of septal and lateral e′ velocities. The E/e′ ratio reported throughout the study represents the average E/e′ ratio and was calculated as transmitral E-wave velocity divided by average e′ velocity. These measurements were analyzed as continuous indices of left ventricular relaxation and filling. No categorical diagnosis or grading of diastolic dysfunction was derived from these measurements for the study analyses.
Stroke volume was derived echocardiographically from the left ventricular outflow tract cross-sectional area and LVOT velocity–time integral. Cardiac output was calculated from stroke volume and heart rate, and cardiac index was obtained by indexing cardiac output to maternal body surface area. Systemic vascular resistance was estimated from mean arterial pressure and cardiac output, assuming negligible right atrial pressure.
Gestational age at cardiovascular assessment was recorded and included in adjusted analyses. Cardiovascular and fetal ultrasound assessors were not blinded to FGR status.
2.4. Fetal Ultrasound and Doppler Assessment
Fetal ultrasound and Doppler examinations were performed by the same experienced obstetrician using Voluson E10 Expert machines (General Electric Healthcare, Zipf, Austria) equipped with a 2–5 MHz transabdominal convex RM7C and C1-6 transducer following ISUOG recommendations [2,17].
Fetal biometry included biparietal diameter (BPD), head circumference (HC), abdominal circumference (AC), and femur length (FL). EFW was calculated using the three-parameter Hadlock model incorporating HC, AC, and FL (Hadlock 3) [18]. Gestational age-specific EFW and AC centiles were determined using the Hadlock reference charts implemented in the ultrasound system. Pregnancy dating remained based on first-trimester ultrasound.
Doppler assessment of the uterine, umbilical, and middle cerebral arteries was performed in accordance with the ISUOG Practice Guidelines on Doppler velocimetry in obstetrics [17]. Umbilical and middle cerebral artery pulsatility indices were interpreted using the JSUM (2001) reference curves, while uterine artery pulsatility indices were interpreted using the Merz reference curves. Doppler recordings comprised at least three consecutive technically adequate waveforms obtained during fetal quiescence, without fetal breathing movements. Right and left UtA-PI were recorded separately, and mean UtA-PI was calculated.
UA-PI and abnormalities of end-diastolic flow were documented. MCA-PI was measured. The cerebroplacental ratio (CPR) was subsequently calculated as: CPR = MCA-PI/UA-PI.
2.5. Biomarker Assessment
Maternal peripheral venous blood samples were collected in tubes containing a clot activator. Following clot formation, samples were centrifuged at 4500 rpm for 10 min, and the separated serum was stored at −20 °C for a maximum of eight months before analysis. Samples were not refrozen.
Serum concentrations of NT-proBNP and GDF-15 were measured using commercially available enzyme-linked immunosorbent assay (ELISA) kits: the Human NT-proBNP ELISA Kit (catalog no. E0485h; EIAab Science Inc., Wuhan, China) and the Human GDF-15 ELISA Kit (catalog no. E2034h; EIAab Science Inc., Wuhan, China). Determinations were performed in duplicate according to the manufacturer’s instructions. Samples from FGR pregnancies and controls were included on the same assay plates.
Optical density was measured using a Biosan microplate reader (Biosan Medical-Biological Research & Technologies, Riga, Latvia; software version 0.8.4.4) at 450 nm, with 620 nm as the reference wavelength. Reference-corrected absorbance values were used to calculate biomarker concentrations from the corresponding run-specific standard curves.
For NT-proBNP, a standard calibration curve covering the assay range was generated for each analytical run. The manufacturer’s datasheet specifies a detection range of 312–20,000 pg/mL. The laboratory separately confirmed a lower limit of quantification (LLOQ) of 6 pg/mL. NT-proBNP concentrations were expressed in pg/mL for reporting and statistical analysis; observed concentrations in the study population ranged from 15 to 670 pg/mL. Manufacturer-reported intra-assay and inter-assay coefficients of variation for the NT-proBNP assay were ≤5.9% and ≤7.8%, respectively.
For GDF-15, calibration standards were prepared by serial dilution of a 1000 pg/mL stock standard to 15.6 pg/mL, with sample diluent serving as the zero standard. Concentrations were calculated using five-parameter logistic curve fitting and reported in pg/mL. The manufacturer-reported detection range was 15.6–1000 pg/mL, with an analytical sensitivity of <7.8 pg/mL. Manufacturer-reported intra-assay and inter-assay coefficients of variation were ≤5.3% and ≤8.2%, respectively.
Gestational age at biomarker sampling was recorded for each participant and included as a covariate in adjusted analyses of biomarker concentrations to account for potential gestational age-related variation.
2.6. Maternal, Delivery and Neonatal Outcomes
Prospectively recorded maternal and delivery variables included gestational hypertension, preeclampsia, delivery mode, and gestational age at delivery. Neonatal data included birth weight, sex, Apgar scores at 1 and 5 min, neonatal intensive care unit (NICU) admission, respiratory support, hospital stay, and death. Recorded morbidities included intraventricular hemorrhage (IVH), necrotizing enterocolitis (NEC), hypoglycemia, hypocalcemia, and jaundice.
Birthweight z-scores and centiles were additionally derived using the sex-specific lambda-mu-sigma (LMS) parameters for completed gestational weeks published by Olsen et al. [19]. Gestational age at delivery was recorded in complete weeks; no within-week days were imputed. These post hoc measures supplemented birthweight in grams and did not alter the original antenatal classification of FGR and control pregnancies.
Respiratory support was classified by the highest level required: none; supplemental oxygen or nasal cannula; continuous positive airway pressure (CPAP); non-invasive positive-pressure ventilation (NIPPV/SNIPPV); invasive mechanical ventilation; or high-frequency oscillatory ventilation (HFOV). Respiratory support and NICU admission were recorded separately. The composite adverse neonatal outcome comprised NICU admission, CPAP or higher respiratory support, Apgar score ≤ 7 at 1 min, IVH, NEC, or neonatal death. The composite summarized neonatal complications and care requirements; each infant was counted once. Component frequencies were also reported. Hospital stay was calculated from birth to discharge among surviving infants; infants who died before discharge were excluded from this outcome analysis.
2.7. Ethical Approval and Informed Consent
The study was conducted in accordance with the principles of the Declaration of Helsinki. The study protocol was approved by the Research Ethics Committee of “Grigore T. Popa” University of Medicine and Pharmacy, Iași (Approval No. 631/24 July 2025) and received a favorable opinion from the Medical Ethics Committee of the “Cuza Vodă” Clinical Hospital of Obstetrics and Gynecology, Iași (Approval No. 6/26 March 2025). All participants provided written informed consent before enrollment and prior to the performance of study-specific procedures.
2.8. Statistical Analysis
Data were organized in Microsoft Excel (Version 2608; Microsoft Corporation, Redmond, WA, USA) and analyzed using Python 3.12.14 with pandas 2.2.3, NumPy 2.3.5, SciPy 1.17.0 and scikit-learn 1.8.0. Figures were generated using Matplotlib 3.10.8 and seaborn 0.13.2, with assistance from ChatGPT (GPT 6; OpenAI) in developing plotting code. Cardiovascular, biomarker, Doppler variables and full-cohort model covariates were complete for all 140 participants (59 FGR and 81 controls). Correlation analyses included 59 FGR pregnancies. Hospital stay was available for all 137 survivors (81 controls, 48 late-onset and eight early-onset FGR); deaths remained included in other applicable analyses. No imputation was performed. Sample sizes for restricted analyses are specified separately. Distributional characteristics of continuous variables were assessed using graphical inspection and the Shapiro–Wilk test. Approximately normally distributed variables are presented as mean ± standard deviation (SD) and were compared using Welch’s t-test for two groups or Welch’s ANOVA for three groups. Non-normally distributed variables are presented as median [interquartile range (IQR)] and were compared using the Mann–Whitney U or Kruskal–Wallis test, respectively. Effect sizes for two-group continuous comparisons were expressed as Hedges’ g or rank-biserial correlations, respectively. Significant three-group comparisons were followed by pairwise Welch’s t-tests or Mann–Whitney U tests, with Holm correction across the three comparisons within each variable. Categorical variables are presented as n (%) and were compared using Pearson’s χ2 or Fisher’s exact test, as appropriate. Three-group comparisons of uterine artery notching and NICU admission used Pearson’s χ2 statistics with fixed-margin Monte Carlo p values (200,000 replicates; random seed 20261024, reinitialized for each outcome). Pairwise comparisons used two-sided Fisher’s exact tests with Holm adjustment across the three comparisons within each variable.
Model diagnostics assessed collinearity, residual patterns and influential observations. Robustness was evaluated by leave-one-out refitting and, in the full cohort, by adding quadratic terms for gestational age, maternal age and BMI. These exploratory, post hoc assessments are detailed in Supplementary Tables S1 and S2. Diagnostic p values were not adjusted for multiple testing, and no observations were excluded from the reported main models on diagnostic grounds.
Separate ordinary least-squares regression models with HC3 robust standard errors and normal-reference inference were fitted for each cardiovascular and biomarker outcome. Models in the full cohort (n = 140) included FGR status, maternal age, BMI, current preeclampsia, chronic hypertension, and gestational age at the corresponding assessment: echocardiography for cardiovascular outcomes and blood sampling for biomarkers. Age, BMI and gestational age were entered as continuous linear terms; FGR status, preeclampsia and chronic hypertension were entered as binary indicators.
A sensitivity analysis for cardiac output, systemic vascular resistance, E/e′ ratio, NT-proBNP, and GDF-15 excluded pregnancies with preeclampsia (n = 119; 38 FGR and 81 controls). These models retained FGR status, gestational age at the corresponding assessment, maternal age, BMI and chronic hypertension (Supplementary Table S3).
Under this additive model, the FGR coefficient represents the estimated difference between FGR and control pregnancies at the same modeled values of the included covariates. These estimates describe conditional associations and should not be interpreted as causal effects.
In the FGR-control models and the corresponding sensitivity analyses, cardiovascular outcomes were modeled in their original units to retain clinically interpretable absolute differences. NT-proBNP and GDF-15 were log2-transformed to accommodate their positive, right-skewed distributions and estimate proportional differences. Biomarker effects were expressed as percentage differences in adjusted geometric means, calculated as 100 × (2β − 1), where β denotes the FGR coefficient on the log2 scale. The same transformation was applied to the lower and upper limits of its 95% confidence interval.
Exploratory sensitivity analyses undertaken during manuscript revision, and not prespecified, evaluated CO, SVR, E/e′, NT-proBNP and GDF-15 under separate restrictions: (i) overlapping gestational-age ranges, defined as the intersection of the observed FGR and control ranges for echocardiography (35 + 0–40 + 2 weeks) and biomarker sampling (35 + 3–40 + 2 weeks); (ii) exclusion of recorded chronic hypertension, current preeclampsia or pregnancy-induced hypertension from both groups; and (iii) an absolute difference of ≤1 calendar day between the gestational ages recorded at echocardiography and blood sampling. Within the cohort excluding recorded hypertensive disorders, a stricter analysis additionally excluded participants with systolic blood pressure ≥ 140 mmHg or diastolic blood pressure ≥ 90 mmHg at cardiovascular assessment, or recorded methyldopa or nifedipine use.
All sensitivity models retained the covariates, outcome transformations and HC3 robust inference of the corresponding full-cohort models, except that preeclampsia and chronic hypertension were omitted from models excluding recorded hypertensive disorders because these conditions were absent by restriction. For cardiovascular profiles by FGR onset, models included subgroup indicators, with controls as the reference group, and adjusted for gestational age at echocardiography, maternal age, and BMI. Outcomes were standardized using the control-group mean and standard deviation; SVR was natural-log transformed before standardization. Figure 1 presents the subgroup coefficients and nominal 95% confidence intervals calculated using HC3 robust standard errors and normal-reference inference.
Figure 1.
Adjusted maternal cardiovascular profiles according to FGR onset. Points and horizontal bars represent adjusted differences and nominal 95% confidence intervals for late-onset FGR (n = 49) and early-onset FGR (n = 10) relative to controls (n = 81). Models were adjusted for gestational age at echocardiography, maternal age and BMI, with HC3 robust standard errors and normal-reference inference. Differences are expressed in control-group standard deviation units; SVR was natural-log transformed before standardization. The dashed vertical line indicates zero difference from controls. Confidence intervals were not adjusted for multiple testing and do not test differences between the two FGR subgroups. These analyses are exploratory; estimates for early-onset FGR rely on model extrapolation because gestational ages at echocardiography did not overlap with those of controls. Controls, n = 81; late-onset FGR, n = 49; early-onset FGR, n = 10. Abbreviations: BMI, body mass index; CO, cardiac output; E/e′, ratio of early transmitral flow velocity to early diastolic mean mitral annular velocity; FGR, fetal growth restriction; IVRT, isovolumic relaxation time; SV, stroke volume; SVR, systemic vascular resistance.
Post hoc, unadjusted early–late comparisons undertaken during revision were reported with 95% confidence intervals (Supplementary Table S4): Welch–Satterthwaite intervals for mean differences, back-transformed log2 estimates for percentage differences in biomarker geometric means, and Newcombe–Wilson intervals for risk differences. Mortality was described using counts and exact Clopper–Pearson intervals, without hypothesis testing. These analyses were not prespecified; their nominal confidence intervals complement the Holm-adjusted pairwise tests. Receiver operating characteristic (ROC) analysis assessed unadjusted biomarker discrimination between FGR and control pregnancies. Areas under the curve (AUCs) were reported with percentile 95% confidence intervals from 5000 stratified bootstrap resamples preserving the original group sizes (random seed: 20261023). Exploratory cut-offs maximized the Youden index, with concentrations at or above the cut-off classified as positive and the highest cut-off selected in the event of ties. Apparent sensitivity and specificity were reported with exact binomial 95% confidence intervals conditional on the selected cut-off. Post hoc internal validation undertaken during revision repeated cut-off selection in each bootstrap resample and evaluated sensitivity and specificity at that cut-off in both the resample and the original cohort. Mean optimism, calculated as bootstrap-sample minus original-cohort performance, was subtracted from the corresponding apparent estimate. Optimism-corrected sensitivity and specificity were reported as point estimates without confidence intervals; AUCs were not optimism-corrected. This procedure provides internal correction for optimism associated with threshold selection and does not constitute external validation of the resulting cut-offs.
During manuscript revision, we assessed the feasibility of exploratory logistic regression with FGR status as the binary outcome in all 140 participants. Candidate models combined cardiac output with either log2-transformed NT-proBNP or log2-transformed GDF-15. Complete separation was assessed using linear programming.
Within the FGR cohort, exploratory associations were assessed using Spearman’s rank correlation coefficient. Percentile 95% confidence intervals were estimated using 5000 paired participant-bootstrap resamples (seed: 20261024). Additional post hoc analyses examined correlations of SV, CO, cardiac index, SVR and mean UtA-PI with birthweight z-scores, using the same bootstrap and partial rank-correlation procedures. These additional estimates were reported with nominal 95% confidence intervals, without p or q values.
An additional exploratory sensitivity analysis estimated partial rank correlations adjusted jointly for FGR onset and gestational age at the corresponding assessment: echocardiography for SV, CO, cardiac index and SVR, and the concurrent fetal-ultrasound/blood-sampling visit for mean UtA-PI. Partial correlations were calculated by correlating residuals after regressing both ranked variables on the onset indicator and ranked gestational age. Ranks and regression fits were recalculated in each bootstrap resample. The added confidence-interval and partial-correlation analyses were undertaken during revision and were not prespecified. Confidence intervals were not adjusted for multiplicity; p and q values were reported only for the unadjusted correlations.
All tests were two-sided. Holm correction was applied to the three pairwise comparisons within each variable to control the family-wise error rate at 0.05, treating comparisons addressing the same outcome as one family. The Benjamini–Hochberg procedure was applied to the 30 original unadjusted Spearman correlation tests (q < 0.05), aiming to limit false discoveries while retaining sensitivity to potential associations in this broader exploratory analysis. Given the study’s exploratory phenotyping objective, the remaining analyses emphasized effect estimation and were not subjected to study-wide multiplicity adjustment. Their p values, including those from covariate-adjusted regression models, were interpreted as exploratory, with p < 0.05 indicating nominal significance only. All confidence intervals were unadjusted for multiplicity. This strategy does not provide study-wide error control.
3. Results
3.1. Study Population and Maternal Characteristics
Eligible women were consecutively recruited during the study period. Four eligible women declined participation. A total of 140 women provided informed consent and were included in the analysis, comprising 59 pregnancies complicated by FGR and 81 pregnancies with appropriate fetal growth. All enrolled participants were included in the primary analyses. Women in the FGR group had fewer previous pregnancies than controls (median 0 [IQR 0–1] vs. 1 [0–2], p = 0.049). Gestational age at echocardiography and at biomarker sampling was lower in FGR pregnancies than in controls (36.29 [33.21–37.43] vs. 38.43 [37.86–39.00] weeks and 36.57 [33.71–38.00] vs. 38.43 [38.00–39.29] weeks, respectively; both p < 0.001; Table 1).
Table 1.
Maternal demographic and clinical characteristics.
The median interval between echocardiography and blood sampling was 2 days [IQR, 0–5] in FGR pregnancies and 0 days [IQR, 0–1] in controls, with ranges of 0–15 and 0–14 days, respectively. Within the FGR group, the median interval was 2 days [IQR, 1–3.75] in early-onset disease and 2 days [IQR, 0–5] in late-onset disease. Assessments were performed on the same day or one calendar day apart in 25/59 FGR pregnancies (42.4%) and 62/81 controls (76.5%).
The history of preeclampsia was more frequent in the FGR group (9/59, 15.3%) than in controls (2/81, 2.5%; p = 0.009). Chronic hypertension was present in 21/59 (35.6%) women with FGR and in none of the controls (p < 0.001).
Preeclampsia in the current pregnancy occurred in 21/59 (35.6%) FGR pregnancies and in none of the controls (p < 0.001); among affected women, 11 had preeclampsia without severe features and 10 had preeclampsia with severe features.
Chronic hypertension and current preeclampsia coexisted in 13 women, representing 22.0% of the FGR cohort and 61.9% of women with preeclampsia. Eight women (13.6% of the FGR cohort) had chronic hypertension without current preeclampsia, and eight (13.6%) had current preeclampsia without chronic hypertension.
Methyldopa use was recorded in 23/59 women with FGR (39.0%) and 4/81 controls (4.9%), while nifedipine use was recorded in 7/59 (11.9%) and 1/81 (1.2%), respectively (Table 1). All participants with recorded nifedipine use also had methyldopa use recorded.
3.2. Maternal Cardiovascular and Biomarker Profile in FGR
Pregnancies complicated by FGR had lower stroke volume (62.93 ± 6.81 vs. 86.23 ± 9.20 mL), cardiac output (median [IQR], 4.28 [3.92–4.83] vs. 6.32 [6.06–6.54] L/min) and cardiac index (median [IQR], 2.26 [2.05–2.61] vs. 3.49 [3.17–3.72] L/min/m2) than controls, together with higher systemic vascular resistance (1727.36 ± 311.17 vs. 996.13 ± 125.77 dyn·s·cm−5; all p < 0.001; Table 2).
Table 2.
Maternal cardiovascular, echocardiographic and biomarker profile in FGR and control.
Selected indices of left ventricular relaxation and filling also differed significantly between groups. Women with FGR had a longer IVRT (median [IQR], 83.00 [78.00–89.50] vs. 66.00 [62.00–72.00] ms) lower e′ velocity (median 8.90 [7.95–9.40] vs. 13.70 [12.70–15.10] cm/s) and a higher E/e′ ratio (10.29 [9.43–11.43] vs. 6.52 [6.14–7.26]; all p < 0.001).
After adjustment for gestational age at echocardiography, maternal age, BMI, current preeclampsia, and chronic hypertension, FGR remained associated with lower stroke volume (adjusted difference, −19.14 mL; 95% CI, −22.59 to −15.69), cardiac output (−1.84 L/min; 95% CI, −2.13 to −1.55), and cardiac index (−0.97 L/min/m2; 95% CI, −1.15 to −0.79), and higher systemic vascular resistance (+530.46 dyn·s·cm−5; 95% CI, 429.06–631.86). Longer IVRT (+13.62 ms; 95% CI, 9.50–17.73), lower mean e′ velocity (−4.70 cm/s; 95% CI, −5.46 to −3.94), and a higher E/e′ ratio (+3.72; 95% CI, 2.95–4.49) also remained associated with FGR (all p < 0.001; Table 2). The adjusted differences in systolic blood pressure (+3.70 mmHg; 95% CI, −0.65 to 8.04) and transmitral E-wave velocity (+0.27 cm/s; 95% CI, −6.50 to 7.04) had confidence intervals that included zero (Table 2). These findings do not establish equivalence between FGR and control pregnancies.
Circulating biomarker concentrations were also higher in FGR pregnancies. Median NT-proBNP concentration was 151.0 [133.0–183.5] pg/mL in the FGR group and 61.0 [34.0–99.0] pg/mL in controls. Median GDF-15 concentration was 288.31 [239.68–329.88] versus 131.59 [107.91–158.59] pg/mL, respectively (both p < 0.001). In the full-cohort models adjusted for gestational age at biomarker sampling, maternal age, BMI, current preeclampsia and chronic hypertension, adjusted geometric mean concentrations were 191% higher (95% CI, 141–250%) and GDF-15 concentrations were 125% higher (95% CI, 92–164%) in FGR pregnancies than in controls (both p < 0.001; Table 2).
Exploratory sensitivity analyses included 119 pregnancies after excluding current preeclampsia (38 FGR and 81 controls; Supplementary Table S3). Restriction to overlapping gestational-age ranges retained 113 pregnancies for cardiovascular analyses at 35 + 0–40 + 2 weeks (37 FGR and 76 controls) and 112 for biomarker analyses at 35 + 3–40 + 2 weeks (37 FGR and 75 controls). All retained FGR pregnancies were late-onset. These analyses therefore assess robustness within the retained late-onset subset and do not validate the early-onset findings (Supplementary Table S5). Exclusion of recorded hypertensive disorders retained 101 pregnancies (24 FGR and 77 controls), or 98 (22 FGR and 76 controls) under additional blood-pressure and medication restrictions (Supplementary Table S6). Restriction to echocardiography and blood sampling performed on the same day or one calendar day apart retained 87 pregnancies: 25 FGR (4 early-onset and 21 late-onset) and 62 controls (Supplementary Table S7).
Across these sensitivity analyses, changes in adjusted FGR–control effects, calculated as the sensitivity-analysis estimate minus the full-cohort estimate, ranged from approximately −0.25 to +0.25 L/min for CO, −14 to +105 dyn·s·cm−5 for SVR, and −0.33 to −0.20 for E/e′. Changes in the estimated biomarker percentage differences ranged from −14 to +8 percentage points for NT-proBNP and −15 to +28 percentage points for GDF-15. In the subset with assessments performed on the same day or one calendar day apart, the CO difference attenuated from −1.84 to −1.59 L/min, a reduction in magnitude of approximately 0.25 L/min, and the GDF-15 difference decreased from +125% to +110%, a reduction of 15 percentage points. All associations retained their direction, and their nominal 95% confidence intervals excluded the null (Supplementary Tables S3, S5–S7).
Collinearity was limited, with maximum variance inflation factors of 2.01 in the full cohort and 2.53 in sensitivity analyses. Some models showed heteroscedasticity, non-normal residuals or evidence of nonlinear covariate relationships. Nevertheless, associations for CO, SVR, E/e′, NT-proBNP and GDF-15 retained their direction and HC3 95% confidence intervals excluded the null in leave-one-out analyses and models incorporating quadratic terms (Supplementary Tables S1 and S2).
3.3. Cardiovascular Phenotype According to FGR Onset
Among the 59 pregnancies complicated by FGR, 10 were classified as early-onset and 49 as late-onset FGR. Median gestational age at both echocardiography and biomarker sampling was lowest in early-onset FGR, intermediate in late-onset FGR and highest in controls (Table 3). An ordered cardiovascular pattern was observed across control, late-onset FGR, and early-onset FGR pregnancies (Table 3). Systemic vascular resistance increased from 996.13 ± 125.77 dyn·s·cm−5 in controls to 1647.22 ± 236.75 dyn·s·cm−5 in late-onset FGR and 2120.02 ± 344.61 dyn·s·cm−5 in early-onset FGR. Conversely, stroke volume decreased from 86.23 ± 9.20 mL to 64.14 ± 6.40 mL and 57.00 ± 5.77 mL, respectively (both overall p < 0.001). Pairwise differences between early- and late-onset FGR remained significant after Holm adjustment for stroke volume, cardiac output, cardiac index and systemic vascular resistance (all Holm adjusted p ≤ 0.045).
Table 3.
Maternal cardiovascular, fetoplacental, and perinatal phenotype according to FGR onset.
IVRT increased progressively across groups, with median values of 66.00 [62.00–72.00] ms in controls, 82.00 [78.00–87.00] ms in late-onset FGR and 96.50 [90.50–102.50] ms in early-onset FGR (overall p < 0.001). Both FGR subgroups had lower e′ velocity and higher E/e′ ratios than controls, whereas neither index differed significantly between early- and late-onset FGR.
In direct unadjusted early-late comparisons, early-onset FGR had lower mean stroke volume (difference, −7.14 mL; 95% CI, −11.53 to −2.76), higher systemic vascular resistance (+472.80 dyn·s·cm−5; 95% CI, 221.08–724.51), and longer IVRT (+14.67 ms; 95% CI, 6.60–22.74). Geometric mean GDF-15 concentration was 37.7% higher (95% CI, 13.7–66.7%).
The mean cardiac-output difference was −0.525 L/min (95% CI, −1.056 to 0.005). Although the rank-based pairwise comparison yielded Holm-adjusted p = 0.045, the confidence interval for the mean difference included zero; these analyses assess different aspects of the group comparison. Confidence intervals for e′, E/e′ and NT-proBNP also included the null and did not establish equivalence. Direct effect estimates and confidence intervals are provided in Supplementary Table S4.
GDF-15 concentrations also showed an ordered increase, with median values of 131.59 [107.91–158.59] pg/mL in controls, 266.85 [235.91–313.40] pg/mL in late-onset FGR, and 384.32 [303.18–441.70] pg/mL in early-onset FGR (overall p < 0.001). The difference between early- and late-onset FGR remained significant after Holm adjustment (p = 0.002). NT-proBNP concentrations were higher in both FGR subgroups than in controls but did not differ significantly between early- and late-onset FGR (p = 0.196).
CPR decreased progressively across the three groups, with median values of 1.17 [1.04–1.45] in controls, 0.99 [0.85–1.06] in late-onset FGR, and 0.86 [0.77–0.90] in early-onset FGR (overall p < 0.001). All pairwise CPR comparisons remained significant after Holm adjustment. Mean uterine artery PI and the frequency of uterine artery notching were higher in both FGR subgroups than in controls, without significant differences between early- and late-onset FGR.
In analyses adjusted for gestational age at cardiovascular assessment, maternal age, and BMI, both FGR subgroups showed lower cardiac output and stroke volume and higher systemic vascular resistance, E/e′ ratio, and IVRT relative to controls (Figure 1). The adjusted point estimates suggested a greater reduction in cardiac output and larger increases in systemic vascular resistance and IVRT in early-onset FGR, whereas estimates for stroke volume and E/e′ were numerically close between the FGR subgroups. The figure illustrates the direction and magnitude of adjusted differences from controls; it does not establish the statistical significance of differences between early- and late-onset FGR. Adjusted early-onset–control comparisons rely on model extrapolation because gestational ages at echocardiography did not overlap between these groups.
3.4. Maternal Cardiovascular Phenotype According to Preeclampsia Status
Among women with FGR, 21/59 (35.6%) had concomitant preeclampsia, including 11 cases without severe features and 10 with severe features; 38/59 (64.4%) had no current preeclampsia. Compared with women with FGR without preeclampsia, those with concomitant preeclampsia had higher systolic, diastolic, mean arterial pressures (all p ≤ 0.006) and a higher heart rate (p = 0.027). They also had a lower stroke volume (60.00 ± 6.44 vs. 64.55 ± 6.54 mL, p = 0.013) and higher systemic vascular resistance (1847.99 ± 363.00 vs. 1660.69 ± 260.25 dyn·s·cm−5, p = 0.045). Cardiac output and cardiac index did not differ significantly according to preeclampsia status.
Preeclampsia was also associated with a higher mean uterine artery PI (1.78 [1.67–2.05] vs. 1.50 [1.21–1.76], p = 0.006) and a lower cerebroplacental ratio (0.89 [0.81–0.94] vs. 1.00 [0.87–1.07], p = 0.012). No significant differences were observed in IVRT, e′ velocity, E/e′ ratio, UA-PI, MCA-PI, NT-proBNP, or GDF-15 concentrations (Supplementary Table S8).
Early-onset FGR was more frequent among pregnancies complicated by preeclampsia than among those without preeclampsia (7/21 [33.3%] vs. 3/38 [7.9%]); therefore, these subgroup comparisons should be interpreted as descriptive. In the sensitivity analysis excluding pregnancies with preeclampsia, the principal cardiovascular and biomarker differences between FGR and control pregnancies remained significant after multivariable adjustment (Supplementary Table S3).
3.5. Discriminative Performance of NT-proBNP and GDF-15
ROC analysis demonstrated high within-cohort discrimination between FGR and control pregnancies for both circulating biomarkers (Figure 2). NT-proBNP yielded an AUC of 0.991 (95% CI, 0.980–0.999), whereas GDF-15 yielded an AUC of 0.961 (95% CI, 0.926–0.987).
Figure 2.
Apparent within-cohort discrimination ofNT-proBNP and GDF-15 between fetal growth restriction and control pregnancies. ROC curves compare FGR (n = 59) with controls (n = 81). AUC 95% confidence intervals were estimated using 5000 stratified bootstrap resamples. Filled circles indicate exploratory Youden thresholds of ≥124 pg/mL for NT-proBNP and ≥197.99 pg/mL for GDF-15. The dashed line indicates chance discrimination. Analyses were unadjusted; thresholds were derived and evaluated in the same cohort without external validation. Bootstrap optimism-corrected sensitivity and specificity are reported in Supplementary Table S9. Abbreviations: AUC, area under the curve; CI, confidence interval; FGR, fetal growth restriction; ROC, receiver operating characteristic.
The exploratory Youden-derived threshold for NT-proBNP was 124 pg/mL, corresponding to 96.6% (57/59) sensitivity and 93.8% (76/81) specificity. For GDF-15, the corresponding threshold was 197.99 pg/mL, with 91.5% (54/59) sensitivity and 93.8% (76/81) specificity. After bootstrap correction for optimism associated with threshold selection, estimated sensitivity and specificity were 95.1% and 93.0%, respectively, for NT-proBNP, and 90.1% and 93.3% for GDF-15 (Supplementary Table S9). These exploratory, assay-specific thresholds have not been externally validated.
Complete separation was detected in both candidate cardiac-output–biomarker models, precluding finite unpenalized maximum-likelihood coefficient estimates. Conventional logistic-regression odds ratios were therefore not reported. This within-cohort separation does not establish diagnostic performance in an independent population.
3.6. Fetoplacental Relationships and Neonatal Outcomes
In exploratory analyses within the FGR cohort, several unadjusted Spearman correlations remained significant after Benjamini–Hochberg correction. Stroke volume was positively correlated with CPR (ρ = 0.41, q = 0.011), whereas SVR was inversely correlated with gestational age at delivery (ρ = −0.42, q = 0.011). Higher mean UtA-PI was associated with lower CPR and birth weight (both ρ = −0.40, q = 0.011). No correlations with Apgar scores remained significant after correction. Unadjusted correlations and partial rank correlations adjusted for FGR onset and assessment gestational age are presented in Supplementary Table S10.
Mean birthweight z-scores were 0.04 ± 0.68 in controls, −1.80 ± 0.80 in late-onset FGR and −1.90 ± 0.62 in early-onset FGR. Centiles and proportions below the 10th and 3rd centiles are reported in Supplementary Table S11. Within the FGR cohort, all five unadjusted correlations with birthweight z-score had confidence intervals including zero. After adjustment for FGR onset and assessment gestational age, mean UtA-PI was inversely associated with birthweight z-score (partial ρ = −0.260; 95% CI, −0.474 to −0.010), whereas confidence intervals for the other four partial correlations included zero. These additional analyses were exploratory, and confidence intervals were not adjusted for multiplicity.
Neonatal outcomes varied across groups, with the earliest delivery and lowest birth weight observed in early-onset FGR (both overall p < 0.001; Table 3). NICU admission occurred in 100.0% of early-onset FGR, 69.4% of late-onset FGR, and 8.6% of controls. Median neonatal hospital stay among survivors was 77.5, 20.0, and 4.0 days, respectively (both overall p < 0.001; Figure 3).
Figure 3.
Neonatal outcomes according to FGR onset. (A) Neonatal hospital stay among survivors to discharge. Boxes show interquartile ranges, central lines medians, and points individual neonates; whiskers extend to the most extreme observations within 1.5 times the interquartile range of the corresponding quartiles. (B) NICU admission proportions with 95% Wilson confidence intervals; labels indicate n/N (%). Comparisons are descriptive and unadjusted.
Three neonatal deaths occurred in the FGR cohort (3/59, 5.08%; exact 95% CI, 1.06–14.15%). Deaths occurred in 2/10 early-onset FGR cases (20.00%; 95% CI, 2.52–55.61%) and 1/49 late-onset cases (2.04%; 95% CI, 0.05–10.85%). No deaths occurred among controls (0/81, 0.00%; 95% CI, 0.00–4.45%). All mortality confidence intervals were calculated using the exact Clopper–Pearson method. The composite adverse neonatal outcome occurred in 48/59 FGR neonates (81.4%) and 16/81 controls (19.8%). Within the FGR cohort, its components included NICU admission in 44/59 (74.6%), CPAP or higher respiratory support in 43/59 (72.9%), Apgar score ≤ 7 at 1 min in 32/59 (54.2%), IVH in 9/59 (15.3%), NEC in 9/59 (15.3%), and three neonatal deaths. Components could coexist within the same infant.
4. Discussion
In this prospective cohort, FGR was associated with lower maternal cardiac output and higher systemic vascular resistance, altered indices of left ventricular relaxation and higher circulating NT-proBNP and GDF-15 concentrations. The principal associations persisted after adjustment for gestational age and maternal covariates, including preeclampsia and chronic hypertension, and after excluding pregnancies with preeclampsia. The hemodynamic findings agree with the meta-analysis by Kempener et al., which included 33 studies and 7816 women and identified increased peripheral vascular resistance in the second and third trimesters and reduced cardiac output in the third trimester in pregnancies with impaired fetal growth [4]. These observations are also reflected in the recent ISUOG Consensus Statement on maternal hemodynamic assessment, which recognizes maternal cardiovascular evaluation as an emerging approach to the characterization of FGR and hypertensive disorders of pregnancy [5]. Melchiorre et al. also reported lower cardiac index, higher vascular resistance, and impaired relaxation in severe normotensive FGR [6]. Longer IVRT, lower e′ and higher E/e′ indicate altered relaxation and filling indices but do not establish elevated filling pressures or a diagnosis or grade of diastolic dysfunction.
The maternal cardiovascular profile varied according to FGR onset, with early-onset disease showing lower SV, CO, and CI, higher SVR and longer IVRT than late-onset FGR. Late-onset FGR generally displayed an intermediate profile between early-onset disease and uncomplicated pregnancy. This pattern is consistent with the progressive reduction in CO and increase in vascular resistance reported by Vasapollo et al. [7] and with published descriptions of more pronounced hemodynamic alterations in early-onset FGR [20]. However, e′, E/e′ and NT-proBNP did not differ significantly between the FGR subgroups, whereas GDF-15 was higher in early-onset FGR. The onset-related pattern therefore involved selected features. The small early-onset subgroup and differences in gestational age and preeclampsia distribution limit attribution of these differences specifically to FGR onset. In exploratory, unadjusted comparisons within the FGR cohort, concomitant preeclampsia was associated with lower SV, higher SVR and mean UtA-PI and lower CPR. Tay et al. likewise found that preeclampsia with FGR had a different hemodynamic profile from preeclampsia with appropriate fetal growth [21]. In our cohort, early-onset FGR was more frequent among women with preeclampsia (33.3% vs. 7.9%), and differences in FGR onset and gestational age may have contributed to the observed subgroup differences. These comparisons therefore do not establish an independent effect of preeclampsia. Non-significant differences in biomarkers and echocardiographic indices should not be interpreted as equivalence or as excluding clinically relevant differences, particularly given the limited subgroup sizes.
Medication exposure may have contributed to the observed hemodynamic differences. Nifedipine can reduce afterload and increase cardiac output [22], while changes in cardiac output and systemic vascular resistance following methyldopa treatment have also been reported in gestational hypertension [23]. In this observational cohort, medication use may additionally reflect underlying disease severity and treatment indications. Binary medication records without dose, duration or timing relative to assessment do not permit separation of medication effects from disease-related cardiovascular alterations.
Associations persisted after excluding recorded hypertensive disorders, including under additional blood-pressure and medication restrictions. These analyses support FGR-associated differences without these recorded exposures but do not isolate medication effects or eliminate residual confounding.
The observed correlations indicate that maternal hemodynamic and fetoplacental Doppler alterations coexist within the FGR phenotype. Higher maternal SVR was associated with lower CPR and lower gestational age at delivery, whereas higher stroke volume was associated with higher CPR, lower UA-PI and higher gestational age at delivery. These findings are consistent with the concept that maternal cardiovascular maladaptation and fetoplacental vascular dysfunction represent interconnected components of the FGR phenotype rather than isolated abnormalities [24]. Valensise et al. further demonstrated a positive relationship between maternal cardiac output and umbilical venous flow and an inverse relationship between maternal systemic vascular resistance and umbilical venous flow in FGR [8]. Such observations have contributed to the concept of a cardiac-fetal-placental unit, in which maternal cardiovascular adaptation, uteroplacental perfusion, and fetal circulation are viewed as interconnected physiological compartments [8].
Within-FGR correlations were exploratory. Several associations with fetoplacental Doppler indices persisted after adjustment for onset and assessment gestational age, whereas associations with gestational age at delivery were sensitive to adjustment. Because CPR and other Doppler abnormalities contributed to FGR classification, selection effects may influence these associations. Assessments during a single period of pregnancy cannot establish temporal sequence, and associations with delivery timing and neonatal outcomes may also reflect clinical indications for delivery and prematurity. Adjustment and multiplicity correction do not eliminate residual confounding or establish causal or independent prognostic relationships. The small early-onset subgroup limits comparisons of correlations by onset. The biomarker findings provide a complementary biological dimension to the maternal cardiovascular phenotype. NT-proBNP concentrations were higher in FGR and remained elevated after adjustment for maternal characteristics, gestational age at biomarker assessment, preeclampsia and chronic hypertension. Natriuretic peptides are released in response to myocardial wall stress and altered cardiac loading conditions. Giannubilo et al. reported an association between natriuretic peptide concentrations and maternal hemodynamic alterations in pregnancies complicated by preeclampsia and FGR [9], while Lafuente-Ganuza et al. found that NT-proBNP concentrations in isolated FGR were comparable to those in hypertensive and unaffected pregnancies, whereas higher concentrations were observed predominantly in early-onset preeclampsia [10]. Other studies of ProBNP-related measurements have also produced heterogeneous results. Higher first-trimester concentrations were reported in women who subsequently developed FGR [25], while a study performed at delivery found no statistically significant difference in maternal concentrations, although umbilical cord concentrations were higher in growth-restricted fetuses [26]. Differences in gestational age, case mix, cardiovascular burden, and assay methodology may contribute to these discrepancies. Our results identify a group-level biomarker difference, but do not establish NT-proBNP as specific for FGR or demonstrate that its elevation directly reflects the measured diastolic alterations. The coexistence of impaired relaxation indices, reduced cardiac output, increased vascular resistance and higher NT-proBNP concentrations supports a maternal cardiovascular phenotype in FGR. In this context, the NT-proBNP cut-off for FGR discrimination identified in our cohort (124 pg/mL) is noteworthy for its proximity to the 125 pg/mL threshold used to rule out heart failure in non-acute settings [27]. However, numerical proximity does not establish equivalent diagnostic meaning or clinical applicability, and our cut-off should not be interpreted as a threshold for maternal cardiac disease. The combined cardiovascular and biomarker findings warrant longitudinal investigation, with comprehensive cardiac assessment, to clarify the relationship between maternal cardiovascular maladaptation and clinically manifest cardiac dysfunction and determine whether this phenotype has implications for subsequent maternal heart failure.
GDF-15 was also elevated after covariate adjustment in FGR and demonstrated a gradient from controls to late-onset and early-onset disease. GDF-15 is a stress-responsive member of the transforming growth factor-β superfamily that is highly expressed in placental tissue. Increased circulating or placental GDF-15 has been reported in pregnancies complicated by preeclampsia [11,28,29]. Temel Yuksel et al. found higher concentrations in preeclampsia than in controls, but no significant difference between early- and late-onset preeclampsia (p = 0.34) [28]. More directly relevant to FGR, Kiyokoba et al. demonstrated increased placental GDF15 expression in FGR and in preeclampsia complicated by FGR [12]. In our cohort, GDF-15 remained elevated after adjustment for preeclampsia and chronic hypertension and did not differ significantly between FGR pregnancies with and without preeclampsia. These observations are compatible with a broader maternal-placental stress response, although they do not establish a mechanism specific to FGR.
The available evidence does not yet establish GDF-15 as a disease-specific biomarker. Wertaschnigg et al. found that circulating GDF-15 increased with gestational age and was only modestly elevated at 30–34 weeks in women who subsequently developed preterm preeclampsia, with limited predictive value when used alone [30]. In contrast, Cruickshank et al. reported elevated GDF-15 concentrations preceding the clinical diagnosis of preeclampsia in two independent prospective cohorts [31], while Jacobsen et al. demonstrated associations between GDF-15, other cardiovascular biomarkers, and markers of placental dysfunction in hypertensive pregnancies [29]. Chen et al. reported lower third-trimester concentrations in preeclampsia than in gestational-age-matched controls [32]. These studies provide biological context without establishing FGR specificity. The tissue source of circulating GDF-15 cannot be determined from these data.
The high apparent biomarker discrimination requires cautious interpretation. The ROC analyses distinguished pregnancies with established FGR from selected controls, while SGA pregnancies not meeting FGR criteria were excluded. This case mix may yield greater separation than would be observed in routine screening or among pregnancies with borderline findings. Bootstrap correction addressed optimism associated with threshold selection but could not address participant selection, between-group differences in gestational age and hypertensive disorders, or assay-related differences. The analyses therefore do not establish independent diagnostic value or incremental benefit beyond fetal biometry and Doppler assessment. Prospective external validation in an independent cohort representative of the intended clinical setting is required before these thresholds can be considered for clinical use.
The neonatal composite combined events of differing clinical importance, with NICU admission and respiratory support being its most frequent components. These care-related outcomes may be influenced by prematurity and local clinical practices. The composite therefore requires cautious interpretation and should not be regarded as a measure of severe neonatal morbidity alone. Early-onset FGR was associated with greater neonatal care requirements, with the highest proportion of NICU admissions and the longest hospitalization among survivors. These findings accompanied substantially earlier delivery and lower birth weight and should be interpreted in the context of prematurity. Only three neonatal deaths occurred. The small number of events and wide confidence intervals limit the precision of mortality estimates and comparisons between groups.
Whether maternal cardiovascular assessment or biomarkers improve clinical decisions and outcomes beyond fetal biometry and Doppler surveillance remains unproven. ISUOG Consensus Statement recognizes its potential while identifying unresolved questions about clinical utility [5]. Multicenter longitudinal studies should use standardized assessment timing and assays, gestational-age-comparable controls and independent validation. Any incremental prediction of prespecified adverse outcomes should be followed by evaluation of assessment-guided management.
Strengths and Limitations
The prospective design and assessment of maternal cardiovascular function, circulating biomarkers, fetoplacental Doppler, and neonatal outcomes within the same cohort enabled an integrated characterization of FGR. Complete primary data, covariate adjustment, and the sensitivity analysis excluding preeclampsia supported evaluation of the internal consistency of the findings.
The single-center setting and recruitment-based sample size, without a formal a priori sample-size calculation, limit generalizability and the strength of confirmatory inference. The small early-onset subgroup (n = 10 versus 49 late-onset cases) limits the precision of exploratory subgroup comparisons. Non-significant differences in e’ velocity, E/e’ ratio or NT-proBNP should not be interpreted as evidence that these parameters are equivalent between the two FGR subgroups. Multiplicity correction was limited to within-variable pairwise comparisons and the 30 original unadjusted Spearman correlation tests; other p values and all confidence intervals were unadjusted for multiplicity. Additional analyses undertaken during revision were post hoc and not prespecified. These limitations increase the risk of chance findings and reinforce the need for independent confirmation.
Gestational-age ranges at both assessments did not overlap between early- and late-onset FGR, limiting separation of onset-related differences from assessment timing and other group characteristics. Sensitivity analyses within the shared FGR-control ranges included only late-onset cases, did not provide gestational-age-comparable controls for early-onset FGR and did not ensure comparable gestational-age distributions. Preeclampsia and chronic hypertension occurred exclusively in FGR pregnancies, further restricting covariate overlap. Estimates for strata lacking one group rely on model extrapolation; adjustment therefore cannot eliminate residual confounding.
Although associations persisted when echocardiography and blood sampling were performed on the same day or one calendar day apart, this restriction retained proportionately fewer FGR pregnancies than controls and only four early-onset cases. These findings support robustness within this selected subset, but selection effects remain possible.
Assessments during a single period of pregnancy limit causal and longitudinal interpretation. Cardiovascular and fetal ultrasound assessors were unblinded, potentially introducing measurement bias. Standardized acquisition, one experienced operator per modality and averaging echocardiographic measurements over three cardiac cycles supported consistency but did not eliminate this risk. Interobserver reproducibility was not assessed.
The available echocardiographic variables did not permit comprehensive classification or grading of diastolic dysfunction; the findings therefore characterize selected relaxation and filling indices.
Birthweight standardization used an external US reference that was not validated in this cohort. Gestational age at delivery was recorded in completed weeks, limiting the precision of birthweight standardization within each week. Similar descriptive birthweight z-scores in early- and late-onset FGR do not establish equivalence between these subgroups.
5. Conclusions
In this prospective single-center cohort, FGR was associated with a maternal cardiovascular phenotype characterized by lower cardiac output, higher systemic vascular resistance, altered echocardiographic relaxation and filling indices, and higher NT-proBNP and GDF-15 concentrations. These exploratory findings remain subject to potential selection effects and residual confounding and do not establish causality or independent diagnostic or prognostic utility. Multicenter longitudinal studies with standardized assessment timing and external validation are needed to determine whether these measures add value beyond fetal biometry and Doppler assessment and whether their use improves clinical management or perinatal outcomes.
Supplementary Materials
The following supporting information can be downloaded at: https://www.mdpi.com/article/10.3390/diagnostics16223716/s1. Table S1: Regression diagnostics and sensitivity to individual observations; Table S2: Adjusted differences after adding quadratic covariate terms; Table S3. Adjusted FGR–control differences in the full cohort and after exclusion of pregnancies with preeclampsia; Table S4: Direct comparisons by FGR onset; Table S5: Adjusted FGR–control differences within overlapping gestational-age ranges; Table S6. Adjusted FGR–control differences after exclusion of recorded hypertensive disorders and under additional blood-pressure and medication restrictions; Table S7. Adjusted FGR–control differences after restriction to echocardiography and blood sampling performed on the same day or one calendar day apart; Table S8. Maternal cardiovascular, biomarker and Doppler characteristics in FGR according to preeclampsia status; Table S9. Apparent biomarker discrimination and bootstrap internal validation; Table S10. Maternal cardiovascular-fetoplacental correlations within the FGR cohort; Table S11: Standardized birthweight and exploratory correlations.
Author Contributions
Conceptualization, D.-A.M., M.S.C.H. and D.-G.S.; methodology, D.-A.M., M.S.C.H., R.-M.H., C.-D.M., M.H. and D.-G.S.; software, D.-A.M., M.S.C.H. and C.-D.M.; validation, D.-C.D., A.C., I.-S.S. and C.C.; formal analysis, D.-A.M., C.-D.M. and R.-M.H.; investigation, D.-A.M., M.S.C.H., R.-M.H., C.C. and C.-D.M.; resources, D.-A.M., M.S.C.H. and D.-C.D.; data curation, C.-D.M.; writing—original draft preparation, D.-A.M.; writing—review and editing, D.-A.M., M.S.C.H., R.-M.H., C.-D.M., A.C., I.-S.S., D.-C.D. and D.-G.S.; visualization, D.-A.M., D.-C.D., R.-M.H., C.-D.M. and M.S.C.H.; supervision, M.S.C.H., M.H., D.-C.D. and D.-G.S.; project administration, D.-G.S. and M.H. All authors have read and agreed to the published version of the manuscript.
Funding
This research was funded by The Health Programme (PS) 2021–2027, Policy Objective 4, Priority 3, project title “Support for Enhancing Performance and Innovation in Excellent Medical Doctoral Research”, acronym INNODOC-MED, SMIS code 351058.
Institutional Review Board Statement
The study was conducted in accordance with the Declaration of Helsinki and received ethical approval. The study protocol was approved by the Research Ethics Committee of “Grigore T. Popa” University of Medicine and Pharmacy, Iași, Romania (Approval No. 631, 24 July 2025), and received a favorable opinion from the Medical Ethics Committee of the “Cuza Vodă” Clinical Hospital of Obstetrics and Gynecology, Iași, Romania (Reference No. 6, 26 March 2025).
Informed Consent Statement
Written informed consent was obtained from all subjects involved in the study before enrollment and before any study-specific procedures.
Data Availability Statement
The datasets analyzed during the current study are not publicly available due to patient privacy and institutional restrictions but are available from the corresponding author on reasonable request and with the permission of the institution. Python scripts supporting the revised analyses and Figure 1 and Figure 2 are also available from the corresponding author on reasonable request.
Acknowledgments
During the preparation of this manuscript, the authors used ChatGPT (GPT-6; OpenAI) to assist with language editing and development of plotting code. The scientific concept, figure content, interpretation, and final revisions were conceived, verified, and approved by the authors, who take full responsibility for the accuracy and integrity of the manuscript.
Conflicts of Interest
The authors declare no conflicts of interest.
Abbreviations
The following abbreviations are used in this manuscript:
| AC | Abdominal circumference |
| ANOVA | Analysis of variance |
| AUC | Area under the receiver operating characteristic curve |
| BMI | Body mass index |
| BSA | Body surface area |
| CI | Cardiac index; confidence interval (depending on context) |
| CO | Cardiac output |
| CPAP | Continuous positive airway pressure |
| CPR | Cerebroplacental ratio |
| DBP | Diastolic blood pressure |
| E | Early diastolic transmitral inflow velocity |
| e′ | Early diastolic mitral annular velocity |
| E/e′ | Ratio of early diastolic transmitral inflow velocity to early diastolic mitral annular velocity |
| EFW | Estimated fetal weight |
| ELISA | Enzyme-linked immunosorbent assay |
| FDR | False discovery rate |
| FGR | Fetal growth restriction |
| FL | Femur length |
| GA | Gestational age |
| GDF-15 | Growth differentiation factor-15 |
| HC | Head circumference |
| HC3 | Heteroscedasticity-consistent covariance estimator, type 3 |
| HFOV | High-frequency oscillatory ventilation |
| HR | Heart rate |
| IQR | Interquartile range |
| ISUOG | International Society of Ultrasound in Obstetrics and Gynecology |
| IVH | Intraventricular hemorrhage |
| IVRT | Isovolumic relaxation time |
| LVOT | Left ventricular outflow tract |
| LVOT-VTI | Left ventricular outflow tract velocity–time integral |
| MAP | Mean arterial pressure |
| MCA | Middle cerebral artery |
| MCA-PI | Middle cerebral artery pulsatility index |
| NEC | Necrotizing enterocolitis |
| NICU | Neonatal intensive care unit |
| NIPPV | Non-invasive positive-pressure ventilation |
| NT-proBNP | N-terminal pro-B-type natriuretic peptide |
| OR | Odds ratio |
| PE | Preeclampsia |
| PI | Pulsatility index |
| proBNP | Pro-B-type natriuretic peptide |
| ROC | Receiver operating characteristic |
| SBP | Systolic blood pressure |
| SD | Standard deviation |
| SGA | Small for gestational age |
| SNIPPV | Synchronized nasal intermittent positive-pressure ventilation |
| SV | Stroke volume |
| SVR | Systemic vascular resistance |
| UA | Umbilical artery |
| UA-PI | Umbilical artery pulsatility index |
| UtA | Uterine artery |
| UtA-PI | Uterine artery pulsatility index |
References
- Gordijn, S.J.; Beune, I.M.; Thilaganathan, B.; Papageorghiou, A.; Baschat, A.A.; Baker, P.N.; Silver, R.M.; Wynia, K.; Ganzevoort, W. Consensus definition of fetal growth restriction: A Delphi procedure. Ultrasound Obstet. Gynecol. 2016, 48, 333–339. [Google Scholar] [CrossRef] [Scilit] [PubMed]
- Lees, C.C.; Stampalija, T.; Baschat, A.A.; Da Silva Costa, F.; Ferrazzi, E.; Figueras, F.; Hecher, K.; Kingdom, J.; Poon, L.C.; Salomon, L.J.; et al. ISUOG Practice Guidelines: Diagnosis and management of small-for-gestational-age fetus and fetal growth restriction. Ultrasound Obstet. Gynecol. 2020, 56, 298–312. [Google Scholar] [CrossRef] [Scilit] [PubMed]
- Crispi, F.; Miranda, J.; Gratacós, E. Long-term cardiovascular consequences of fetal growth restriction: Biology, clinical implications, and opportunities for prevention of adult disease. Am. J. Obstet. Gynecol. 2018, 218, S869–S879. [Google Scholar] [CrossRef] [Scilit] [PubMed]
- Kempener, B.M.J.G.; Jorissen, L.M.; Mulder, E.G.; Ghossein-Doha, C.; Van Drongelen, J.; Scholten, R.R.; Lees, C.C.; De Haas, S.; Janssen, E.B.N.J.; Spaanderman, M.E.A. Hemodynamic changes in pregnancies with impaired fetal growth: A systematic review and meta-analysis. Acta Obstet. Gynecol. Scand. 2026, 105, 215–224. [Google Scholar] [CrossRef] [Scilit] [PubMed]
- Stampalija, T.; Lees, C.; Ghi, T.; Cornette, J.; Gyselaers, W.; Ferrazzi, E.; Mousa, T.; Spaanderman, M.; Thilaganathan, B.; Valensise, H.; et al. ISUOG Consensus Statement on maternal hemodynamic assessment in hypertensive disorders of pregnancy and fetal growth restriction. Ultrasound Obstet. Gynecol. 2025, 66, 681–696. [Google Scholar] [CrossRef] [Scilit] [PubMed]
- Melchiorre, K.; Sutherland, G.R.; Liberati, M.; Thilaganathan, B. Maternal Cardiovascular Impairment in Pregnancies Complicated by Severe Fetal Growth Restriction. Hypertension 2012, 60, 437–443. [Google Scholar] [CrossRef] [Scilit] [PubMed]
- Vasapollo, B.; Novelli, G.P.; Maellaro, F.; Gagliardi, G.; Pais, M.; Silvestrini, M.; Pometti, F.; Farsetti, D.; Valensise, H. Maternal cardiovascular profile is altered in the preclinical phase of normotensive early and late intrauterine growth restriction. Am. J. Obstet. Gynecol. 2025, 232, 312.e1–312.e21. [Google Scholar] [CrossRef] [Scilit] [PubMed]
- Valensise, H.; Farsetti, D.; Pometti, F.; Vasapollo, B.; Novelli, G.P.; Lees, C. The cardiac-fetal-placental unit: Fetal umbilical vein flow rate is linked to the maternal cardiac profile in fetal growth restriction. Am. J. Obstet. Gynecol. 2023, 228, 222.e1–222.e12. [Google Scholar] [CrossRef] [Scilit] [PubMed]
- Giannubilo, S.R.; Pasculli, A.; Tidu, E.; Biagini, A.; Boscarato, V.; Ciavattini, A. Relationship between maternal hemodynamics and plasma natriuretic peptide concentrations during pregnancy complicated by preeclampsia and fetal growth restriction. J. Perinatol. 2017, 37, 484–487. [Google Scholar] [CrossRef] [Scilit] [PubMed]
- Lafuente-Ganuza, P.; Carretero, F.; Lequerica-Fernández, P.; Fernandez-Bernardo, A.; Escudero, A.I.; de la Hera-Galarza, J.M.; Garcia-Iglesias, D.; Alvarez-Velasco, R.; Alvarez, F.V. NT-proBNP levels in preeclampsia, intrauterine growth restriction as well as in the prediction on an imminent delivery. Clin. Chem. Lab. Med. 2021, 59, 1077–1085. [Google Scholar] [CrossRef] [Scilit] [PubMed]
- Sugulle, M.; Dechend, R.; Herse, F.; Weedon-Fekjaer, M.S.; Johnsen, G.M.; Brosnihan, K.B.; Anton, L.; Luft, F.C.; Wollert, K.C.; Kempf, T.; et al. Circulating and placental growth-differentiation factor 15 in preeclampsia and in pregnancy complicated by diabetes mellitus. Hypertension 2009, 54, 106–112. [Google Scholar] [CrossRef] [Scilit] [PubMed]
- Kiyokoba, R.; Uchiumi, T.; Yagi, M.; Toshima, T.; Tsukahara, S.; Fujita, Y.; Kato, K.; Kang, D. Mitochondrial dysfunction-induced high hCG associated with development of fetal growth restriction and pre-eclampsia with fetal growth restriction. Sci. Rep. 2022, 12, 4056. [Google Scholar] [CrossRef] [Scilit] [PubMed]
- Magee, L.A.; Brown, M.A.; Hall, D.R.; Gupte, S.; Hennessy, A.; Karumanchi, S.A.; Kenny, L.C.; McCarthy, F.; Myers, J.; Poon, L.C.; et al. The 2021 International Society for the Study of Hypertension in Pregnancy classification, diagnosis & management recommendations for international practice. Pregnancy Hypertens. 2022, 27, 148–169. [Google Scholar] [CrossRef] [Scilit] [PubMed]
- Gestational Hypertension and Preeclampsia: ACOG Practice Bulletin, Number 222. Obstet. Gynecol. 2020, 135, e237–e260. [Google Scholar] [CrossRef] [Scilit] [PubMed]
- Taub, C.C.; Stainback, R.F.; Abraham, T.; Forsha, D.; Garcia-Sayan, E.; Hill, J.C.; Hung, J.; Mitchell, C.; Rigolin, V.H.; Sachdev, V.; et al. Guidelines for the Standardization of Adult Echocardiography Reporting: Recommendations From the American Society of Echocardiography. J. Am. Soc. Echocardiogr. 2025, 38, 735–774. [Google Scholar] [CrossRef] [Scilit] [PubMed]
- Nagueh, S.F.; Sanborn, D.Y.; Oh, J.K.; Anderson, B.; Billick, K.; Derumeaux, G.; Klein, A.; Koulogiannis, K.; Mitchell, C.; Shah, A.; et al. Recommendations for the Evaluation of Left Ventricular Diastolic Function by Echocardiography and for Heart Failure with Preserved Ejection Fraction Diagnosis: An Update from the American Society of Echocardiography. J. Am. Soc. Echocardiogr. 2025, 38, 537–569. [Google Scholar] [CrossRef] [Scilit] [PubMed]
- Bhide, A.; Acharya, G.; Baschat, A.; Bilardo, C.M.; Brezinka, C.; Cafici, D.; Ebbing, C.; Hernandez-Andrade, E.; Kalache, K.; Kingdom, J.; et al. ISUOG Practice Guidelines (updated): Use of Doppler velocimetry in obstetrics. Ultrasound Obstet. Gynecol. 2021, 58, 331–339. [Google Scholar] [CrossRef] [Scilit] [PubMed]
- Hadlock, F.P.; Harrist, R.B.; Sharman, R.S.; Deter, R.L.; Park, S.K. Estimation of fetal weight with the use of head, body, and femur measurements—A prospective study. Am. J. Obstet. Gynecol. 1985, 151, 333–337. [Google Scholar] [CrossRef] [Scilit] [PubMed]
- Olsen, I.E.; Groveman, S.A.; Lawson, M.L.; Clark, R.H.; Zemel, B.S. New intrauterine growth curves based on United States data. Pediatrics 2010, 125, e214–e224. [Google Scholar] [CrossRef] [Scilit] [PubMed]
- Vasapollo, B.; Novelli, G.P.; Farsetti, D.; Pometti, F.; Gagliardi, G.; Picone, S.; Mondì, V.; Valensise, H. Maternal hemodynamics in early and late fetal growth restriction. Best Pract. Res. Clin. Obstet. Gynaecol. 2025, 101, 102618. [Google Scholar] [CrossRef] [Scilit] [PubMed]
- Tay, J.; Foo, L.; Masini, G.; Bennett, P.R.; McEniery, C.M.; Wilkinson, I.B.; Lees, C.C. Early and late preeclampsia are characterized by high cardiac output, but in the presence of fetal growth restriction, cardiac output is low: Insights from a prospective study. Am. J. Obstet. Gynecol. 2018, 218, 517.e1–517.e12. [Google Scholar] [CrossRef] [Scilit] [PubMed]
- Cornette, J.; Duvekot, J.J.; Roos-Hesselink, J.W.; Hop, W.C.J.; Steegers, E.a.P. Maternal and fetal haemodynamic effects of nifedipine in normotensive pregnant women. BJOG 2011, 118, 510–540. [Google Scholar] [CrossRef] [Scilit] [PubMed]
- Binder, J.; Palmrich, P.; Sugulle, M.; Kalafat, E.; Schirwani-Hartl, N.; Khalil, A.; Pixner, L.; Kantoush, K.; Kedziora, S.M.; Kraeker, K.; et al. Effects of Antihypertensive Therapy on Pre- and Postnatal Maternal Hemodynamics. Hypertension 2026, 83, e26126. [Google Scholar] [CrossRef] [Scilit] [PubMed]
- Roberts, L.A.; Ling, H.Z.; Poon, L.C.; Nicolaides, K.H.; Kametas, N.A. Maternal hemodynamics, fetal biometry and Doppler indices in pregnancies followed up for suspected fetal growth restriction. Ultrasound Obstet. Gynecol. 2018, 52, 507–514. [Google Scholar] [CrossRef] [Scilit] [PubMed]
- Eroğlu, H.; Tonyalı, N.V.; Orgul, G.; Biriken, D.; Yucel, A.; Yazihan, N.; Uygur, D. Is ProBNP a New Marker for Predicting Intrauterine Growth Restriction? Z. Geburtshilfe Neonatol. 2021, 225, 125–128. [Google Scholar] [CrossRef] [Scilit] [PubMed]
- Eroğlu, H.; Erdöl, M.A.; Tonyalı, N.V.; Örgül, G.; Biriken, D.; Yücel, A.; Yazihan, N.; Şahin, D. Maternal Serum and Umbilical Cord Brain Natriuretic Peptide Levels in Fetuses with Intrauterine Growth Restriction. Fetal Pediatr. Pathol. 2022, 41, 722–730. [Google Scholar] [CrossRef] [Scilit] [PubMed]
- McDonagh, T.A.; Metra, M.; Adamo, M.; Gardner, R.S.; Baumbach, A.; Böhm, M.; Burri, H.; Butler, J.; Čelutkienė, J.; Chioncel, O.; et al. 2021 ESC Guidelines for the diagnosis and treatment of acute and chronic heart failure. Eur. Heart J. 2021, 42, 3599–3726. [Google Scholar] [CrossRef] [Scilit] [PubMed]
- Temel Yuksel, I.; Mathyk, B.A.; Aslan Cetin, B.; Turhan, U.; Okumus, Z.G.; Yetkin Yildirim, G.; Acar, D.K. Maternal levels of growth differentiation factor-15 in patients with preeclampsia. Hypertens. Pregnancy 2018, 37, 192–196. [Google Scholar] [CrossRef] [Scilit] [PubMed]
- Jacobsen, D.P.; Røysland, R.; Strand, H.; Moe, K.; Sugulle, M.; Omland, T.; Staff, A.C. Circulating cardiovascular biomarkers during and after preeclampsia: Crosstalk with placental function? Pregnancy Hypertens. 2022, 30, 103–109. [Google Scholar] [CrossRef] [Scilit] [PubMed]
- Wertaschnigg, D.; Rolnik, D.L.; Nie, G.; Teoh, S.S.Y.; Syngelaki, A.; da Silva Costa, F.; Nicolaides, K.H. Second- and third-trimester serum levels of growth-differentiation factor-15 in prediction of pre-eclampsia. Ultrasound Obstet. Gynecol. 2020, 56, 879–884. [Google Scholar] [CrossRef] [Scilit] [PubMed]
- Cruickshank, T.; MacDonald, T.M.; Walker, S.P.; Keenan, E.; Dane, K.; Middleton, A.; Kyritsis, V.; Myers, J.; Cluver, C.; Hastie, R.; et al. Circulating Growth Differentiation Factor 15 Is Increased Preceding Preeclampsia Diagnosis: Implications as a Disease Biomarker. J. Am. Heart Assoc. 2021, 10, e020302. [Google Scholar] [CrossRef] [Scilit] [PubMed]
- Chen, Q.; Wang, Y.; Zhao, M.; Hyett, J.; da Silva Costa, F.; Nie, G. Serum levels of GDF15 are reduced in preeclampsia and the reduction is more profound in late-onset than early-onset cases. Cytokine 2016, 83, 226–230. [Google Scholar] [CrossRef] [Scilit] [PubMed]
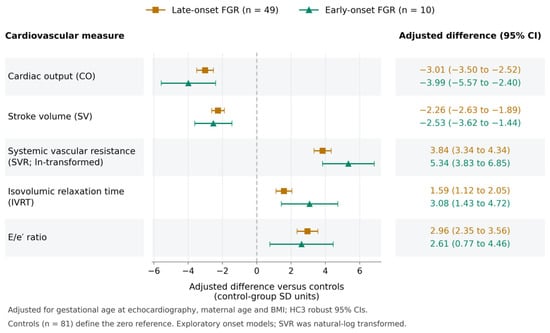
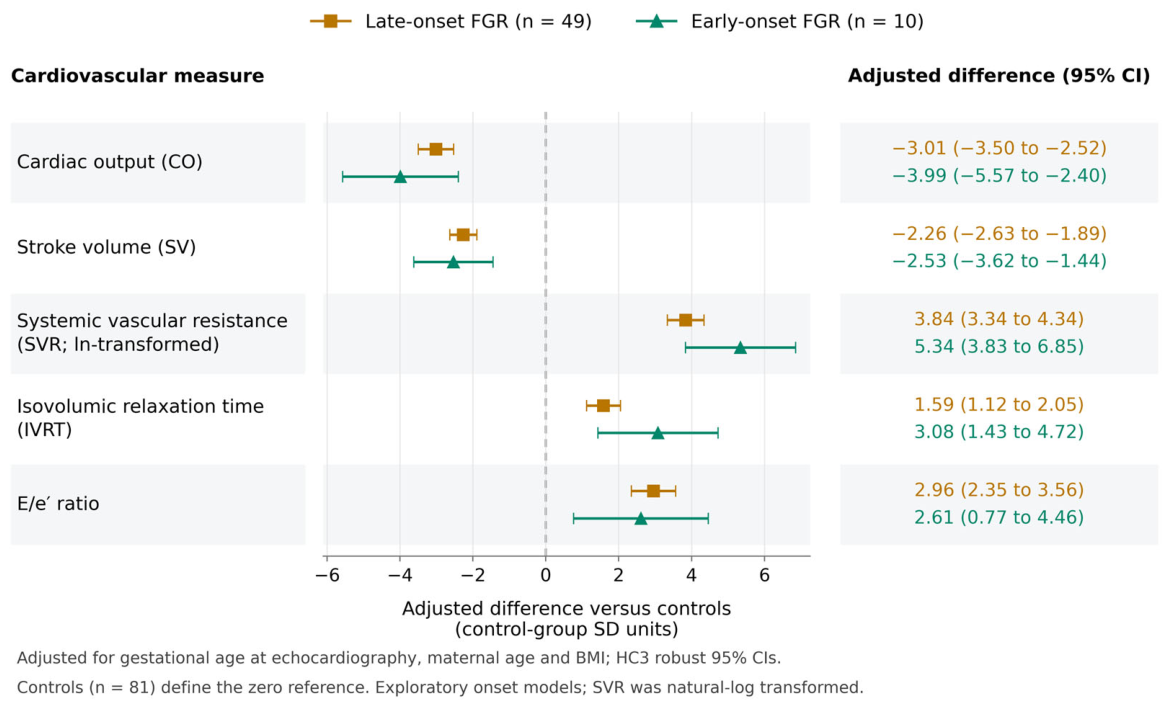
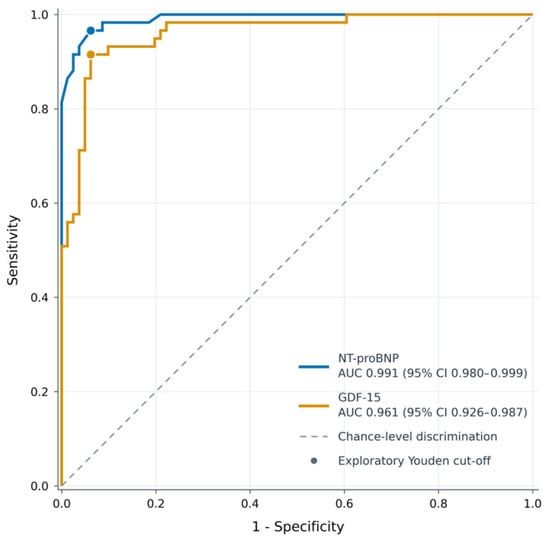
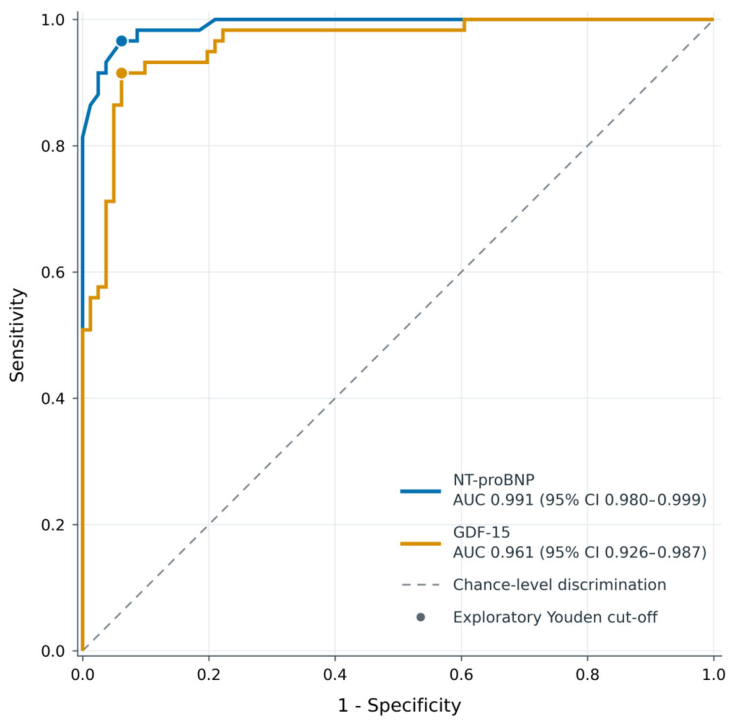
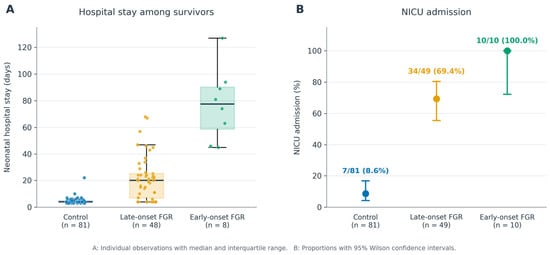
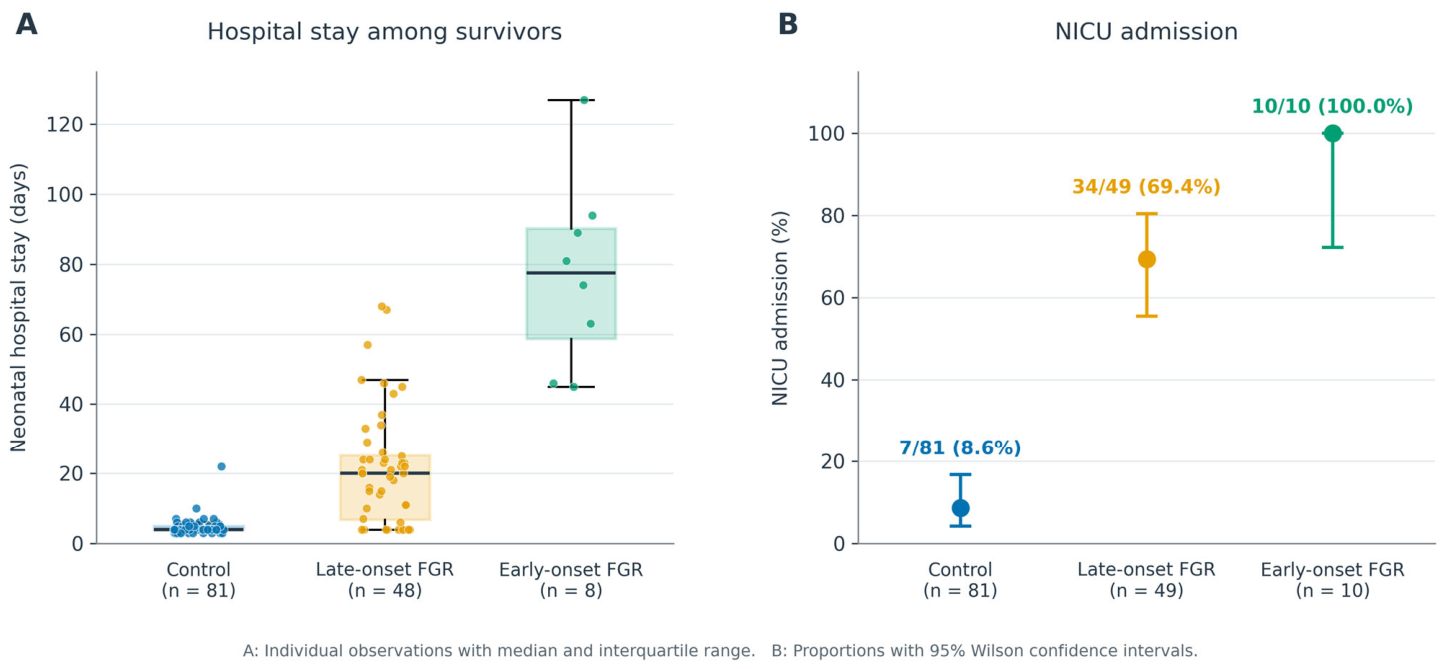

Disclaimer/Publisher’s Note: The statements, opinions and data contained in all publications are solely those of the individual author(s) and contributor(s) and not of MDPI and/or the editor(s). MDPI and/or the editor(s) disclaim responsibility for any injury to people or property resulting from any ideas, methods, instructions or products referred to in the content. |
© 2026 by the authors. Licensee MDPI, Basel, Switzerland. This article is an open access article distributed under the terms and conditions of the Creative Commons Attribution (CC BY) license.