


Abstract
NAC transcription factors connect plant development and environmental responses with specialized metabolism. We established a chromosome-anchored NAC catalog for Panax quinquefolius and compared three candidates against two ginsenoside-pathway promoter reporters. Genome screening identified 194 candidates, of which 190 chromosome-localized genes were retained. Their proteins ranged from 96 to 828 amino acids and showed characteristic N-terminal NAC regions with variable motif arrangements and gene structures. Collinearity analysis identified 151 unique collinear pairs; 127 of 130 evaluable pairs had Ka/Ks ratios below one. Tissue expression profiles varied among roots, leaves and flowers. PqNAC74, PqNAC101 and PqNAC178, selected for their prominent induction in the initial MeJA screen, showed fluorescence consistent with nuclear localization and growth with a synthetic 3 × CATGTG yeast reporter. In transient dual-luciferase assays, PqNAC74 and PqNAC101 increased both PqDDS- and PqSE-promoter-driven activity, whereas PqNAC178 had no significant effect. Analysis of the original LUC/REN ratios using a linear model with effector and plant factors followed by Dunnett comparisons supported these candidate-specific responses. The study provides a family resource and identifies two candidates that activate both promoter reporters.
1. Introduction
NAC proteins constitute a large family of plant transcription factors named after NO APICAL MERISTEM, ARABIDOPSIS TRANSCRIPTION ACTIVATION FACTOR and CUP-SHAPED COTYLEDON proteins [1,2]. Their conserved N-terminal NAC domain contributes to DNA binding and dimerization, whereas the more variable C-terminal region supports diverse transcriptional outputs [3,4,5]. The NAC domain is conventionally divided into subdomains A–E. This conserved architecture and the variability of the regulatory region accommodate roles in organ development, senescence and responses to drought, salinity, temperature and pathogens [6,7]. These features make NAC proteins plausible links between environmental responses and specialized metabolism, while cautioning against assigning identical functions to related family members.
Genome-wide NAC surveys in medicinal plants provide resources for selecting candidates for functional analysis. Studies in Panax ginseng and P. notoginseng have characterized family membership, genomic distribution and expression patterns under developmental or stress conditions [8,9]; related surveys have also been reported in Salvia miltiorrhiza, Andrographis paniculata, Dendrobium officinale and Eucommia ulmoides [10,11,12,13]. Functional evidence connects some NAC proteins to triterpenoid metabolism. In P. ginseng, PgNAC72 activates the PgDDS promoter and increases saponin accumulation following overexpression [14], and PgNAC41-2 overexpression increases ginsenoside content [15]. In Eleutherococcus senticosus, NAC interactions with saponin-pathway promoters, including EsSE, are sensitive to DNA methylation [16]. These findings motivate tests of related regulatory activities in P. quinquefolius.
Panax quinquefolius is a medicinal plant in the Araliaceae whose ginsenosides are specialized metabolites. Ginsenoside accumulation varies among tissues and responds to environmental and hormonal signals, making transcriptional regulation relevant to metabolic variation [17]. Squalene epoxidase (SE; EC 1.14.14.17) converts squalene into 2,3-oxidosqualene, which dammarenediol II synthase (DDS; EC 4.2.1.125) cyclizes to form the dammarane skeleton [18,19]. Because SE also supplies precursors for sterol biosynthesis, examining SE alongside DDS addresses shared precursor formation and commitment to the dammarane branch. Elicitation of P. quinquefolius hairy-root cultures also alters biosynthetic gene expression and saponin accumulation [20]. Identifying regulators of these promoters could help connect external signals to pathway expression.
NAC-family transcripts have been implicated previously in P. quinquefolius metabolism, including NAC90 in comparative analyses of cambial meristematic and dedifferentiated cell cultures [21]. A chromosome-anchored catalog integrating sequence features, duplication relationships and expression information provides a complementary resource for selecting candidates for functional investigation. Here, the contribution is this integrated family resource together with a comparison of three candidate proteins against both PqDDS and PqSE promoter reporters.
Methyl jasmonate (MeJA) offers a route to identifying regulators of elicited metabolism. Jasmonate signaling controls transcription through the relief of repression by JASMONATE ZIM-DOMAIN proteins [22]. MeJA treatments increase ginsenoside production in P. quinquefolius suspension cultures and P. notoginseng cell cultures [23,24], while transcriptomic analyses in P. ginseng identify candidate biosynthetic and transport genes [25]. The MeJA-responsive factor PgMYB2 binds the PgDDS promoter and positively regulates its expression [26]. In Aralia elata, MeJA-responsive AeMYB9 and AeMYB73 promote oleanolic acid and hederagenin accumulation [27]; in A. paniculata, ApNAC02 responds to MeJA, and heterologous NAC expression affects a terpenoid-pathway transcript [28]. These observations support evaluating NAC candidates selected from MeJA-responsive expression profiles.
In this study, we characterized the chromosome-localized NAC genes of P. quinquefolius, including sequence features, gene structures, predicted upstream elements, duplication relationships and tissue expression profiles. PqNAC74, PqNAC101 and PqNAC178 were prioritized because they showed prominent increases in the initial MeJA expression screening. Localization, synthetic-reporter yeast one-hybrid assays and transient PqDDS/PqSE promoter comparisons were then used to examine their regulatory activities.
2. Materials and Methods
2.1. Gene Identification and Characterization
The P. quinquefolius reference genome, protein sequences and annotations (GWHBEIR00000000.1; BioProject PRJCA006678) were obtained from the Genome Warehouse [29]. The NAC-domain profile PF02365 was searched against the predicted proteome using HMMER 3.3.2 with an E-value threshold of ≤1 × 10⁻¹⁰. Homology-based screening and redundancy removal were followed by parallel NAC-domain confirmation using SMART and the NCBI Conserved Domain Database. A total of 194 nonredundant candidates passed domain confirmation. Of these, 190 assigned to chromosomes were retained and named PqNAC1–PqNAC190 by genomic position. The four unplaced candidates were excluded from this chromosome-anchored set. Coordinates, strand and CDS lengths were taken from the GFF annotation and positions were plotted with matplotlib. Protein sequences and annotations are supplied in Tables S1–S3. Protein lengths, molecular weights and theoretical pI values were calculated from these sequences using the documented sequence-based procedure; the mass definitions, pK parameters and calculation details are provided in Supplementary Methods SM1. Subcellular localization was predicted with Euk-mPLoc 2.0 and is distinguished from the experimental localization assays.
2.2. Sequence Alignment and Phylogenetic Analysis
Full-length sequences of 190 PqNAC proteins and 105 Arabidopsis thaliana NAC proteins from TAIR were aligned using ClustalW in MEGA X. Alignments were inspected in Jalview v2.11.5.1 and sequence logos were generated using WebLogo 3 [30]. Neighbor-joining analysis with 1000 bootstrap resamplings was used to provide a reference-based overview for the descriptive family comparison. The tree was visualized in iTOL v7 and interpreted together with domain coverage and motif organization. Displayed group names followed the positions of the Arabidopsis reference groups; no numerical bootstrap cutoff was used to define new clades. The tree is not used to infer functional equivalence or fully resolved deep evolutionary relationships. For the updated Supplementary Figure S2, domain support was re-examined with HMMER 3.4 using Pfam PF02365.22 and its curated sequence and domain gathering thresholds of 27 bits, with the E-value search space set to 64,247 proteins. Accepted domain envelopes were aligned with hmmalign. The figure displays the 126 predefined model match states.
2.3. Motifs, Gene Structures and Cis-Elements
MEME Suite v5.5.9 identified ten conserved motifs with widths of 6–50 amino acids and a reported E-value threshold of 1 × 10⁻¹⁰. All the motifs and the exon–intron structures visualized using TBtools-II(version 2.121) are shown in Supplementary Figure S3. PlantCARE analyzed 2000 bp upstream of each annotated translation start. Table S4 contains 5265 predicted occurrences across 189 genes, with PqNAC99 treated as missing data. Functional annotations were classified nonexclusively into light, hormone, stress and growth/development categories, with unmatched records grouped as other. Percentages use all 5265 occurrences as the denominator. Assignments and classification rules are provided in Table S4 and Supplementary Methods SM2.
2.4. Tissue Expression Display
Public RNA-sequencing data for roots, leaves and flowers of P. quinquefolius were obtained from the CNGBdb project CNP0001680, with three samples per tissue (R1–R3, L1–L3 and F1–F3). Transcript abundance was represented as FPKM and a heatmap was generated with TBtools. The heatmap is used to describe variation across the sampled tissues. No threshold-based or statistical assignment to broadly expressed or tissue-specific classes was made.
2.5. Collinearity Analysis
Collinearity analysis used the P. quinquefolius (GWHBEIR00000000.1), P. ginseng (GWHBEIL00000000.1) and A. thaliana TAIR10.1 (GCF_000001735.4) assemblies and matched annotations. The longest protein isoform per nuclear protein-coding gene was retained, yielding 61,221, 65,060 and 27,444 proteins, respectively. BLASTP v2.17.0+ searches used E ≤ 1 × 10⁻⁵, five targets per query and one HSP per target. Searches comprised P. quinquefolius self-comparisons and bidirectional interspecific comparisons. MCScanX v1.0.0 identified blocks using a match score of 50, a gap penalty of −1, at least five anchors, up to 25 gaps, an overlap window of five genes and block E ≤ 1 × 10⁻⁵. Unique PqNAC–PqNAC pairs and interspecific anchors involving PqNAC genes were retained. Tandem candidates were BLASTP-matched PqNAC genes occupying consecutive positions in the genome-wide protein-coding gene order.Ka/Ks was recomputed for all 151 intraspecific pairs. CDS translations were verified against source proteins, aligned using MAFFT v7.526 with --auto --amino and back-translated to codons. Codon columns containing gaps, ambiguous nucleotides or stop codons were removed. KaKs_Calculator 2.0 estimated substitution rates using the YN method and standard genetic code. Pairs with undefined estimates or Ks > 2 were excluded from the summary. Estimates, retained alignment lengths and inclusion status are provided in Table S5.
2.6. MeJA Transcriptome Screening
The MeJA-treated leaf transcriptomes analyzed here were generated in the previously published study of Song et al. [31], which treated P. quinquefolius seedlings with 100 μmol L−1 MeJA and collected leaves at 0, 2, 6, 12 and 24 h with three biological replicates. For the present reanalysis we compared the 24 h MeJA-treated samples with the 0 h untreated controls. DESeq2 in R v4.5.1 used raw gene counts, median-of-ratios normalization, a negative binomial generalized linear model and Wald testing; p-values were adjusted by the Benjamini–Hochberg procedure. The thresholds were |log2 fold change| > 1 and adjusted p < 0.05. PqNAC74, PqNAC101 and PqNAC178 were prioritized because of their prominent induction in the initial screen. No new RNA-seq experiment or independent NAC qRT-PCR time course was performed for this NAC study. The newly reported candidate assays comprise localization, synthetic-reporter yeast one-hybrid tests and transient promoter-reporter assays.
2.7. Plant Material for Transient Assays
P. quinquefolius plants were obtained from the Medicinal Plant Garden of Jilin Agricultural University, China. Nicotiana benthamiana plants used for transient expression were grown at 22–25 °C under a 14 h light and 10 h dark photoperiod.
2.8. Subcellular Localization
Total RNA was extracted from P. quinquefolius roots, leaves and flowers and reverse-transcribed into cDNA. The coding sequences of PqNAC74, PqNAC101 and PqNAC178 were amplified from this cDNA using the primers in Supplementary Table S6 and cloned into the PHB-YFP vector using HindIII and SacI sites, under the cauliflower mosaic virus 35S promoter. The resulting constructs and the empty YFP control were introduced into Agrobacterium tumefaciens GV3101. Bacterial suspensions were prepared in 2 mmol L−1 MgCl2, 2 mmol L−1 MES and 150 μmol L−1 acetosyringone, with OD600 adjusted to 0.4–0.6. Suspensions were infiltrated into leaves of approximately 30-day-old N. benthamiana plants using a needleless syringe, following an Agrobacterium-mediated transient expression approach [32]. Fluorescence was examined by confocal microscopy (Leica Microsystems GmbH, Wetzlar, Germany). An independent nuclear marker was not included, so nuclear co-localization was not established.
2.9. Yeast One-Hybrid Assay
PqNAC74, PqNAC101 and PqNAC178 coding sequences were cloned into pGADT7 using EcoRI and BamHI. A synthetic sequence containing three tandem CATGTG repeats was inserted into pHIS2 using SacI and EcoRI. Yeast strain Y187 was used for the assays. The reporter-background titration in Supplementary Figure S5 is labeled with 0, 5, 10, 15, 20 and 30 mmol L−1 3-amino-1,2,4-triazole (3-AT); 30 mmol L−1 was selected for subsequent comparisons. Prey and reporter constructs were cotransformed, and yeast cultures were serially diluted for growth comparisons. The pHIS2-3 × CATGTG plus empty pGADT7 combination was used as a negative control, and pHIS2-p53 plus pGADT7-p53 as a positive control. Growth was compared on SD medium lacking tryptophan, leucine and histidine, with 0 or 30 mmol L−1 3-AT, after incubation at 29 °C for 3–5 days. The assay was performed in three independent experiments.
2.10. Dual-Luciferase Reporter Assay
Candidate coding sequences were cloned into pGreenII 62-SK, and the reported PqDDS (−948 to +1) and PqSE (−377 to +1) promoter fragments were cloned into pGreenII 0800-LUC (Supplementary Figure S6). Positions are relative to the annotated translation start, while Figure S7 summarizes the 2000 bp upstream regions. Constructs were verified by Sanger sequencing, and primers are listed in Table S6. Agrobacterium GV3101 carrying pSoup was grown at 28 °C and resuspended in 10 mmol L−1 MgCl2, 10 mmol L−1 MES (pH 5.6) and 100 μmol L−1 acetosyringone. Suspensions were adjusted to OD600 = 1.0, incubated for 3 h and mixed at a reporter-to-effector ratio of 1:4. Leaves of approximately 30-day-old N. benthamiana plants were infiltrated and harvested after 72 h.
Empty pGreenII 62-SK served as the EV control, with candidate and EV sites on opposite leaf sides. Five plant blocks per promoter each included EV and the three effectors, yielding 20 observations per promoter and 40 overall. Raw LUC/REN ratios were analyzed using effector and plant factors, with each EV observation included once. Images were cropped for layout with their original pseudocolor preserved.
2.11. Statistical Analysis
Differential-expression criteria followed Section 2.6. Family counts, motifs, tissue expression and Ka/Ks were summarized descriptively, while localization and yeast growth were assessed qualitatively. For each promoter, raw LUC/REN ratios were analyzed using an additive linear model with effector and plant as fixed factors across five matched plant blocks (effector df = 3, residual df = 12). Each observation entered the model once. Two-sided, single-step Dunnett comparisons against the shared EV controlled the family-wise error rate within each promoter, with adjusted p < 0.05 considered significant. EV-normalized ratios were used for display. Residual normality was assessed descriptively using the Shapiro–Wilk test, and log-transformed ratios provided a sensitivity analysis. Calculations used Python (3.15.2), NumPy 2.5.4 and SciPy 1.18.1. Table S7 reports means, sample SDs, mean differences, simultaneous 95% confidence intervals and model results.
3. Results
3.1. Chromosomal Distribution and Characteristics of PqNAC Genes
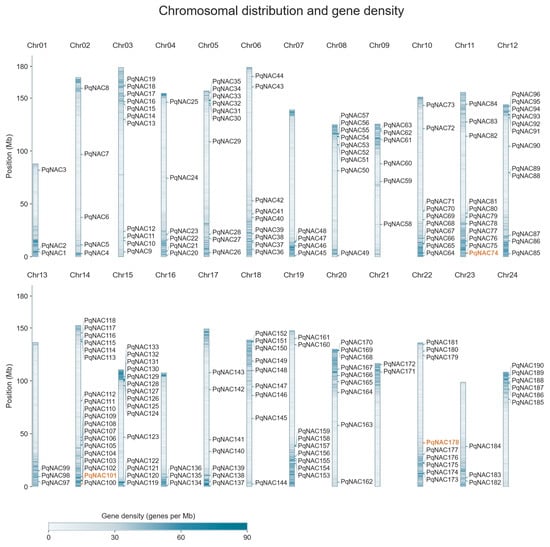
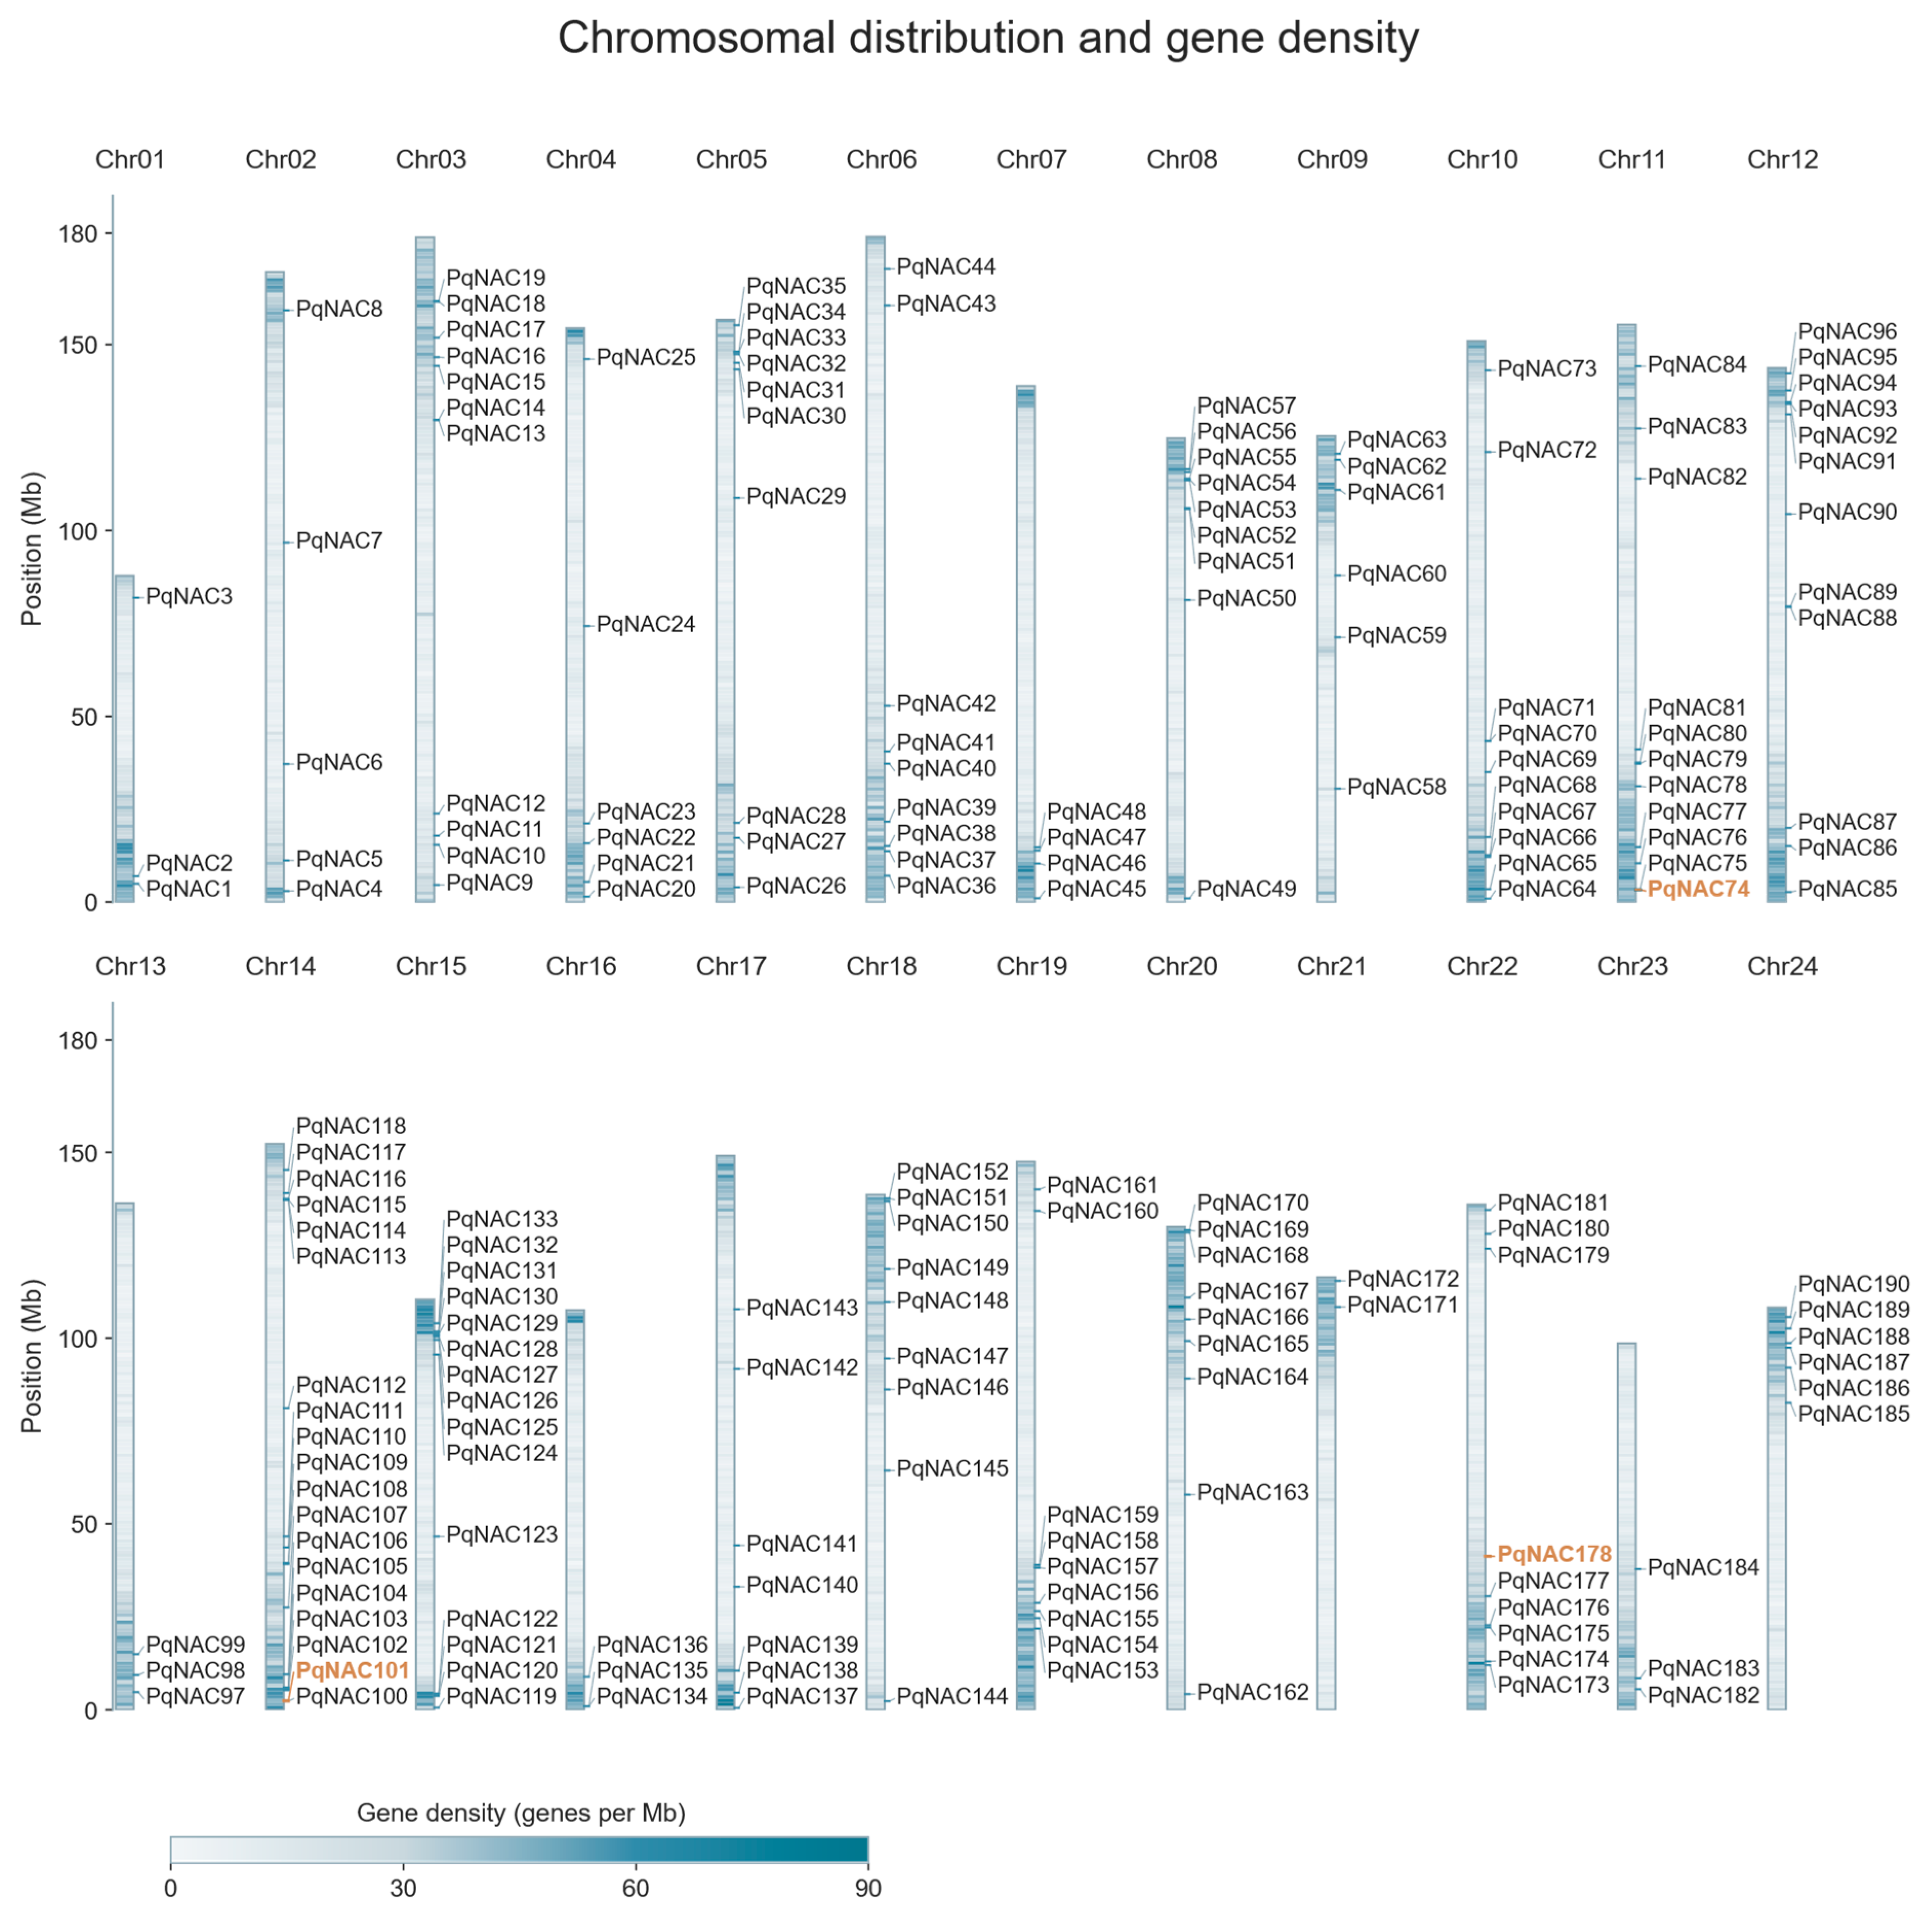
To identify NAC family members in P. quinquefolius, homology screening and redundancy removal were followed by parallel SMART/CDD domain confirmation, yielding 194 confirmed candidates. Of these, 190 anchored to the 24 chromosomes were retained for analysis. The anchored genes were named PqNAC1–PqNAC190 according to their genomic positions and were unevenly distributed across the chromosomes (Figure 1; Supplementary Tables S1–S3). Chromosome 14 contained the most genes (19), followed by chromosome 15 (15), whereas chromosome 21 carried only two. Protein lengths ranged from 96 to 828 amino acids, with molecular weights of 11.265–93.777 kDa and theoretical isoelectric points of 4.298–9.917; 55 proteins (28.95%) had a theoretical pI above seven and 135 (71.05%) below seven, indicating that most PqNAC proteins are weakly acidic. Identifiers, genomic coordinates and CDS lengths are summarized in Supplementary Tables S1–S3. Predicted subcellular localization was predominantly nuclear, with additional compartments assigned to some members (Supplementary Table S3).
Figure 1.
Chromosomal distribution of PqNAC genes and annotated gene density in Panax quinquefolius. The 190 PqNAC loci are mapped onto 24 nuclear chromosomes in two rows sharing a common Mb scale. Chromosome shading shows the density of annotated genes in 1 Mb windows, assigning genes by their genomic midpoints and normalizing terminal windows by their actual widths. Leader lines connect labels to PqNAC midpoints. PqNAC74, PqNAC101 and PqNAC178 are highlighted in orange.
3.2. Sequence Alignment and Reference-Based Phylogenetic Analysis
Profile-guided analysis detected NAM-domain support in 189 of the 190 cataloged proteins (Supplementary Figure S2). The seven entries previously highlighted in the displayed alignment, PqNAC117, PqNAC130, PqNAC125, PqNAC124, PqNAC182, PqNAC31 and PqNAC83, spanned 99.2–100% of the NAM model and occupied 96.0–100% of its match states in the new alignment. Model coverage was used to describe alignment support.
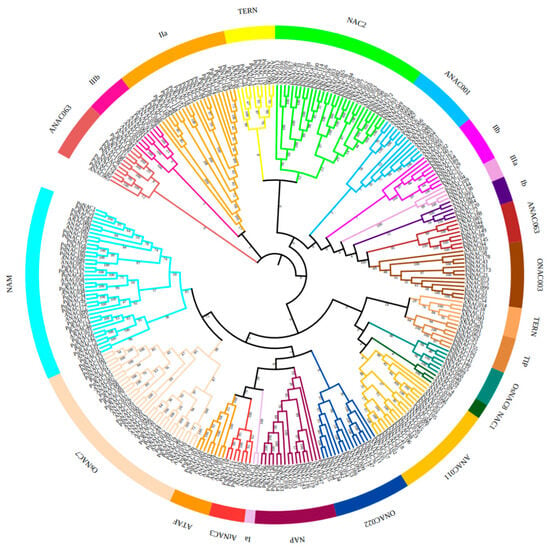
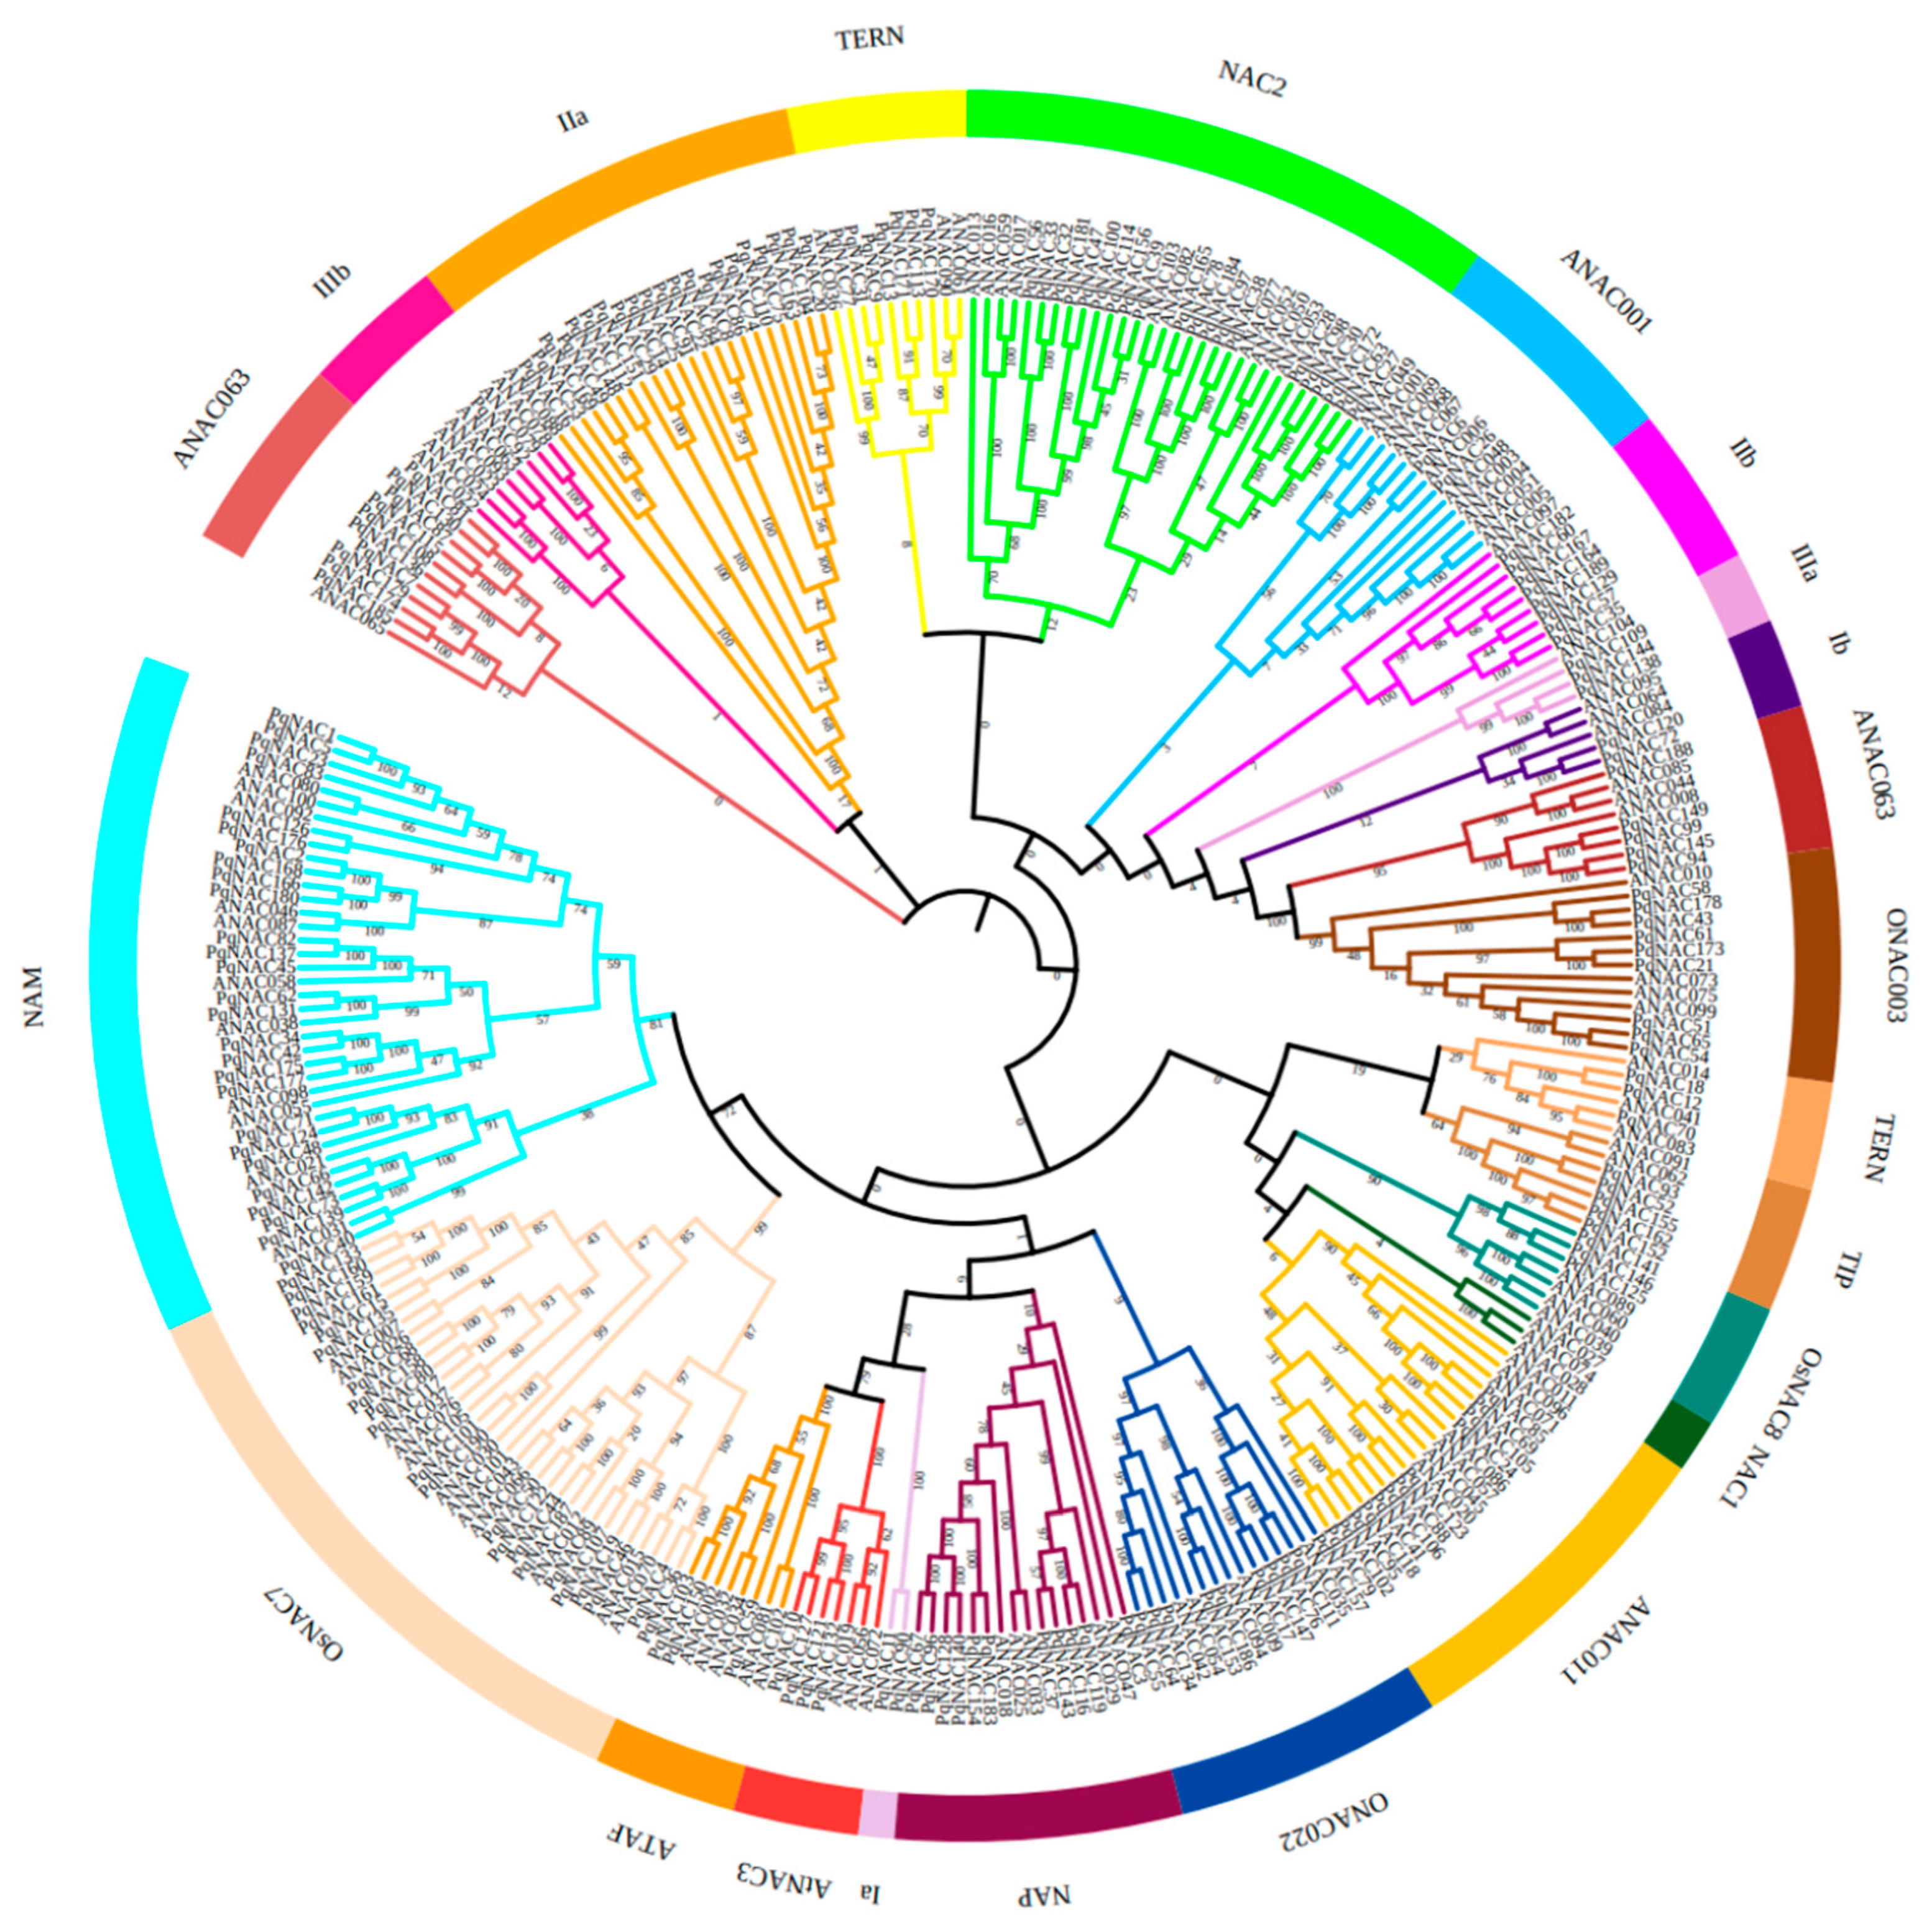
A neighbor-joining tree was constructed from the full-length sequences of 190 PqNAC and 105 Arabidopsis thaliana NAC proteins (Figure 2). The displayed group labels follow the positions of Arabidopsis reference groups and provide a descriptive comparison of sequence relationships. They were not defined by a numerical bootstrap cutoff and are not used as evidence that all the members share the same function. Similar motif arrangements among neighboring sequences provide complementary context for candidate comparisons.
Figure 2.
Reference-based phylogenetic display of 190 PqNAC and 105 Arabidopsis thaliana NAC proteins. ClustalW alignment and neighbor-joining analysis were performed in MEGA X, with 1000 bootstrap resamplings. Colors and group names indicate correspondence with the Arabidopsis reference groups in the displayed tree; they do not define newly validated clades using a bootstrap threshold. Bootstrap values describe support for individual branches.
3.3. Gene Structure and Conserved Motifs
Ten conserved motifs, 11–50 amino acids long, were identified and all ten are displayed in Supplementary Figure S3. Motifs 1–7 were broadly distributed toward the N-terminal region, whereas motifs 8–10 occurred in more restricted protein sets. Members near one another in the displayed tree often shared similar motif arrangements. Exon numbers ranged from one to ten and intron numbers from zero to nine; PqNAC123 contained ten exons and nine introns.
3.4. Predicted Cis-Element Annotations
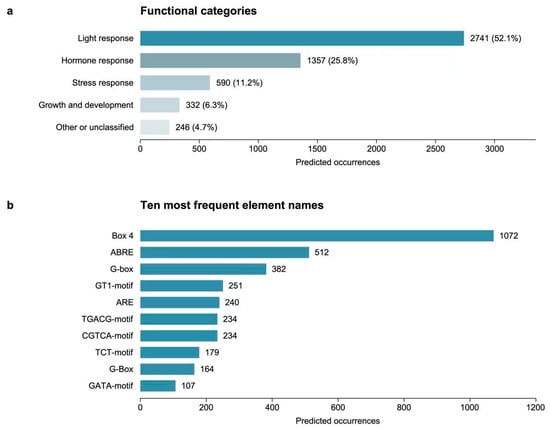
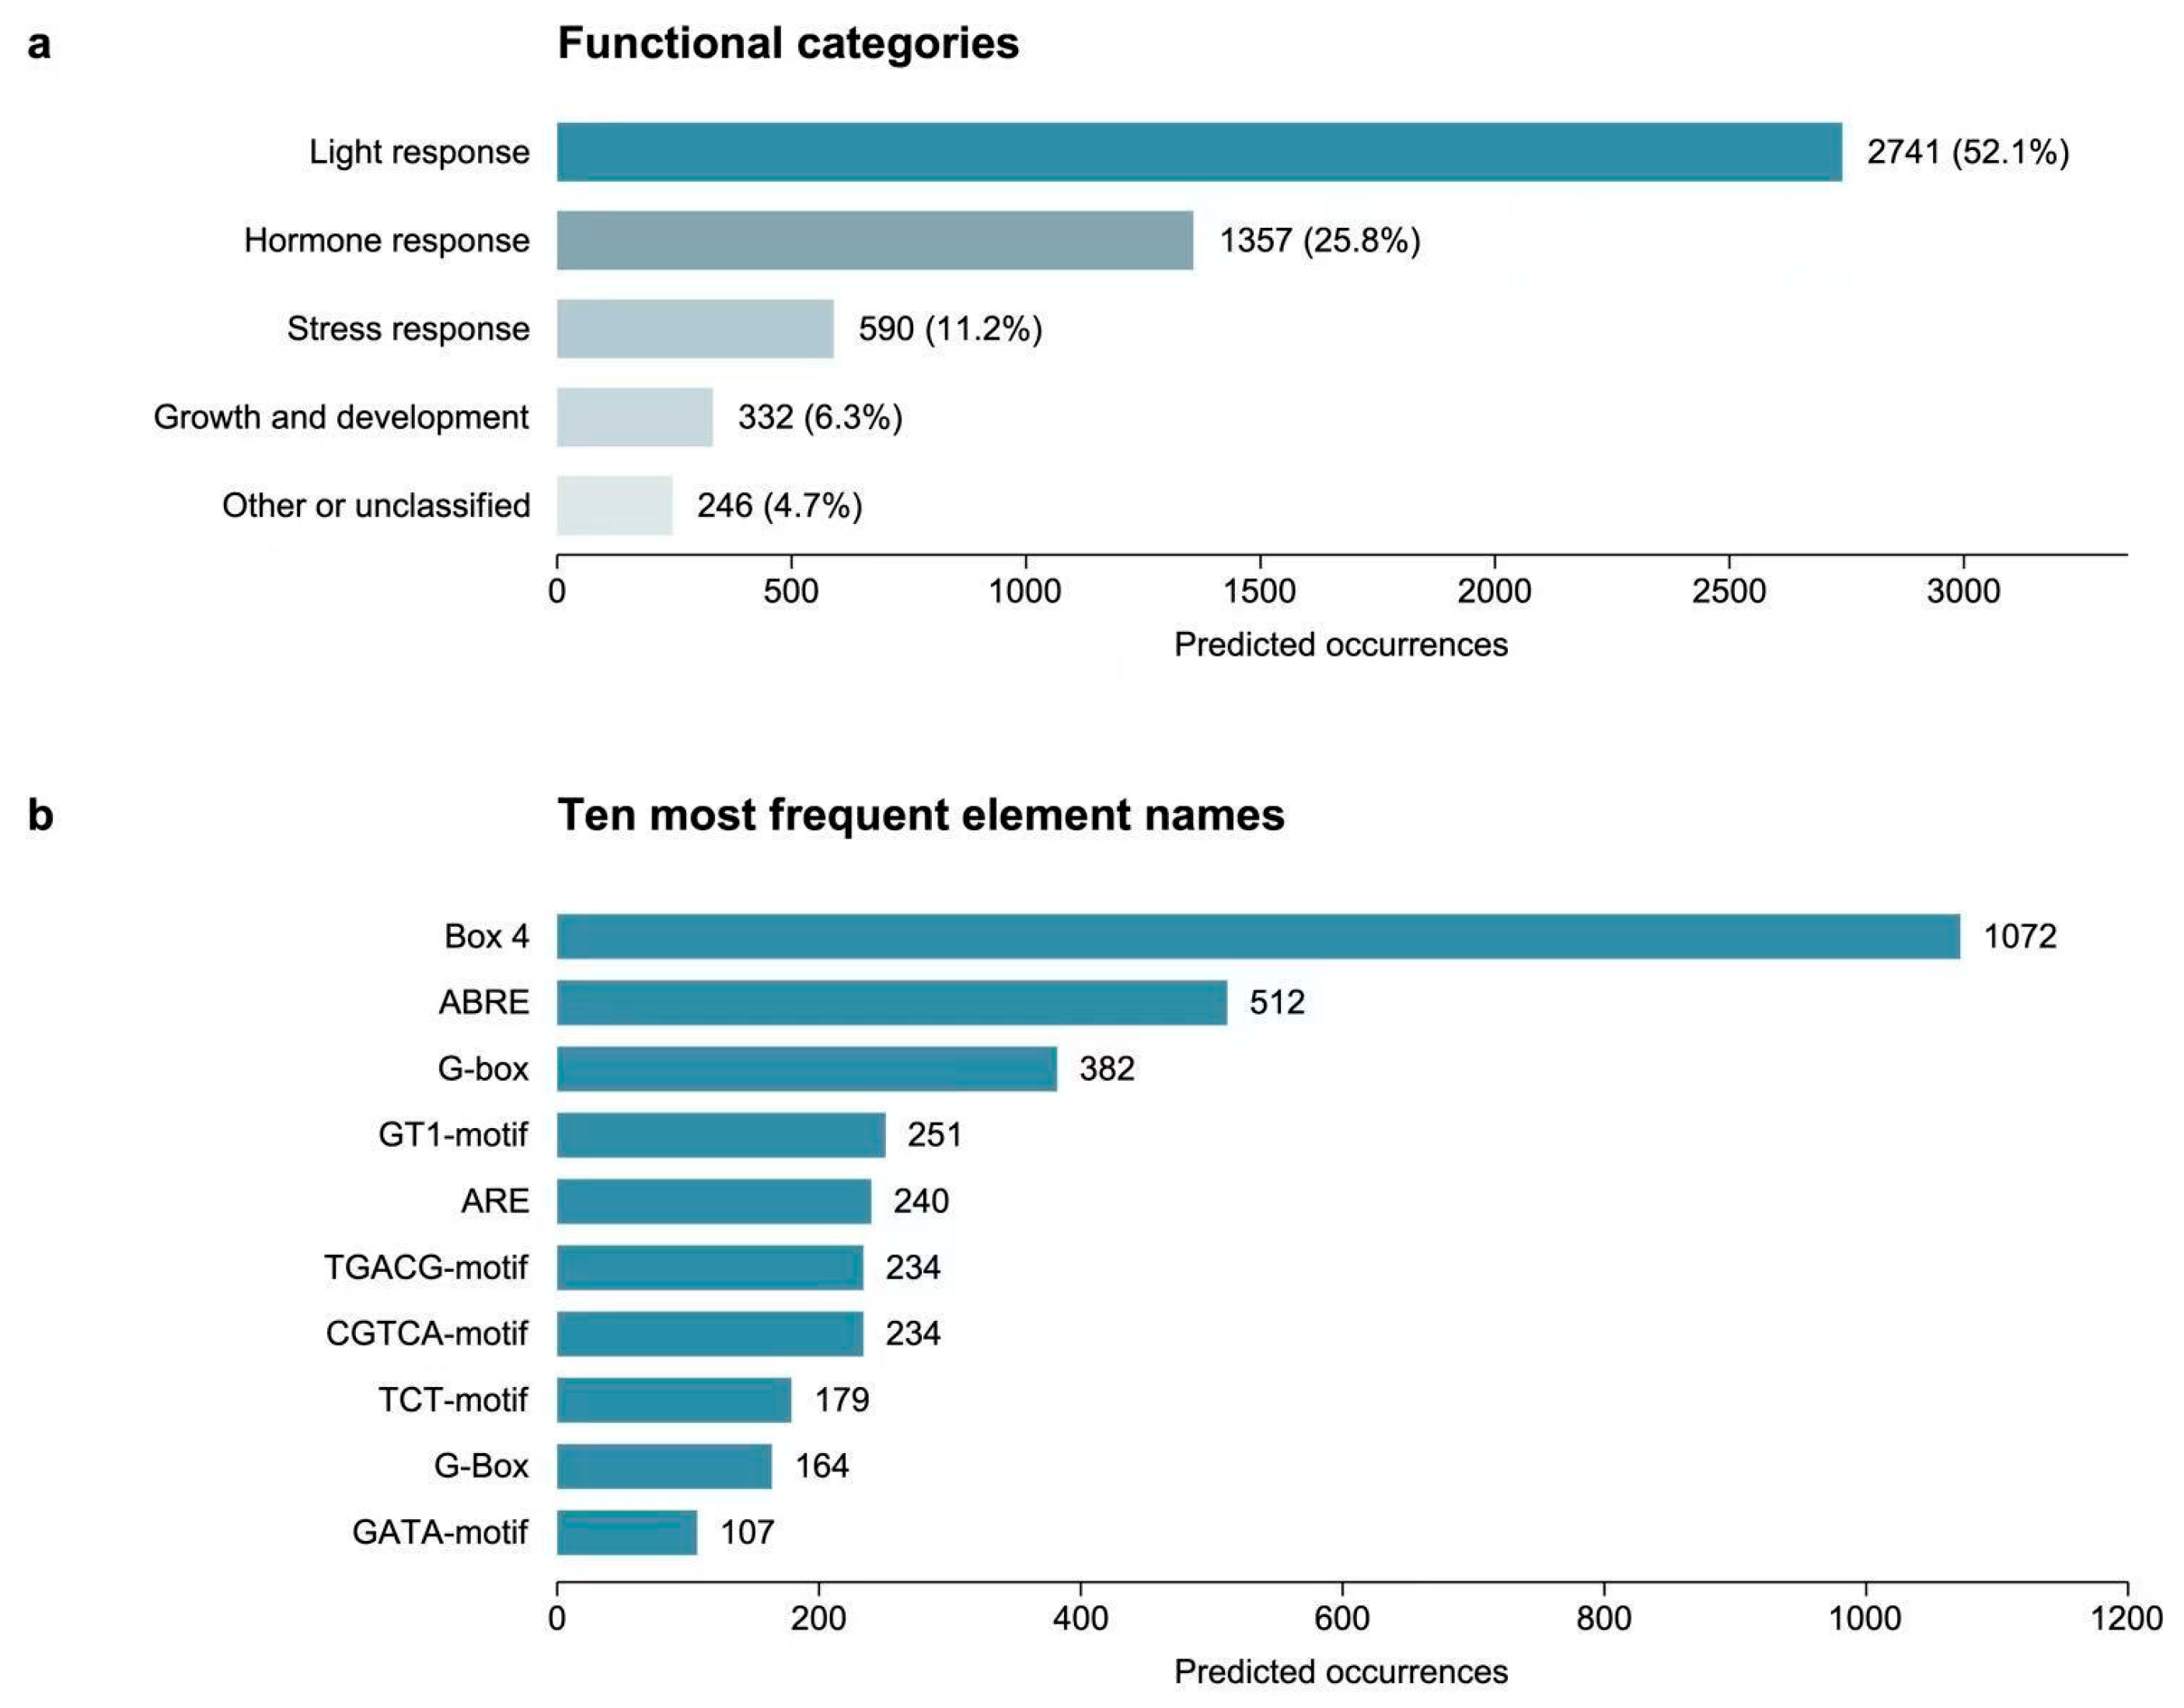
The supplied predictions contained 5265 occurrence records across 189 PqNAC genes; PqNAC99 was absent. Nonexclusive classification of the recorded functions assigned 2741 occurrences (52.1%) to light response, 1357 (25.8%) to hormone response, 590 (11.2%) to stress response and 332 (6.3%) to growth and development; 246 (4.7%) remained other or unclassified (Figure 3a). One P-box occurrence in PqNAC84 explicitly carried both light- and gibberellin-response annotations and was counted in both categories. The most frequent element names were Box 4 (1072), ABRE (512), G-box (382), GT1-motif (251) and ARE (240) (Figure 3b). PqNAC151 had the most recorded occurrences (57), followed by PqNAC74 (56) and PqNAC28 (54). These are annotation frequencies, not a test of functional enrichment.
Figure 3.
Predicted cis-element annotations in Supplementary Table S4: (a) Nonexclusive functional-category counts among 5265 occurrence records across 189 genes. Every category explicitly supported by the recorded function is retained. (b) The ten most frequent element names, retaining the separately recorded G-box and G-Box labels.
3.5. Descriptive Tissue Expression Profiles
Expression profiles of PqNAC genes varied across the root, leaf and flower samples (Supplementary Figure S4). Groups of genes showed relatively higher expression signals in flower, root or leaf samples. The display included patterns shared across several samples from the same tissue, together with pronounced signals confined to individual samples. Variation among samples within tissues was also evident. These profiles provide descriptive expression context for the PqNAC family catalog.
3.6. Gene Duplication and Collinearity
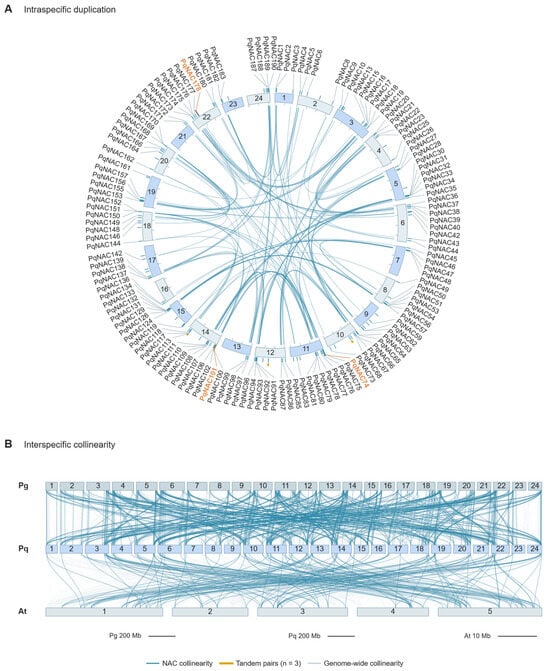
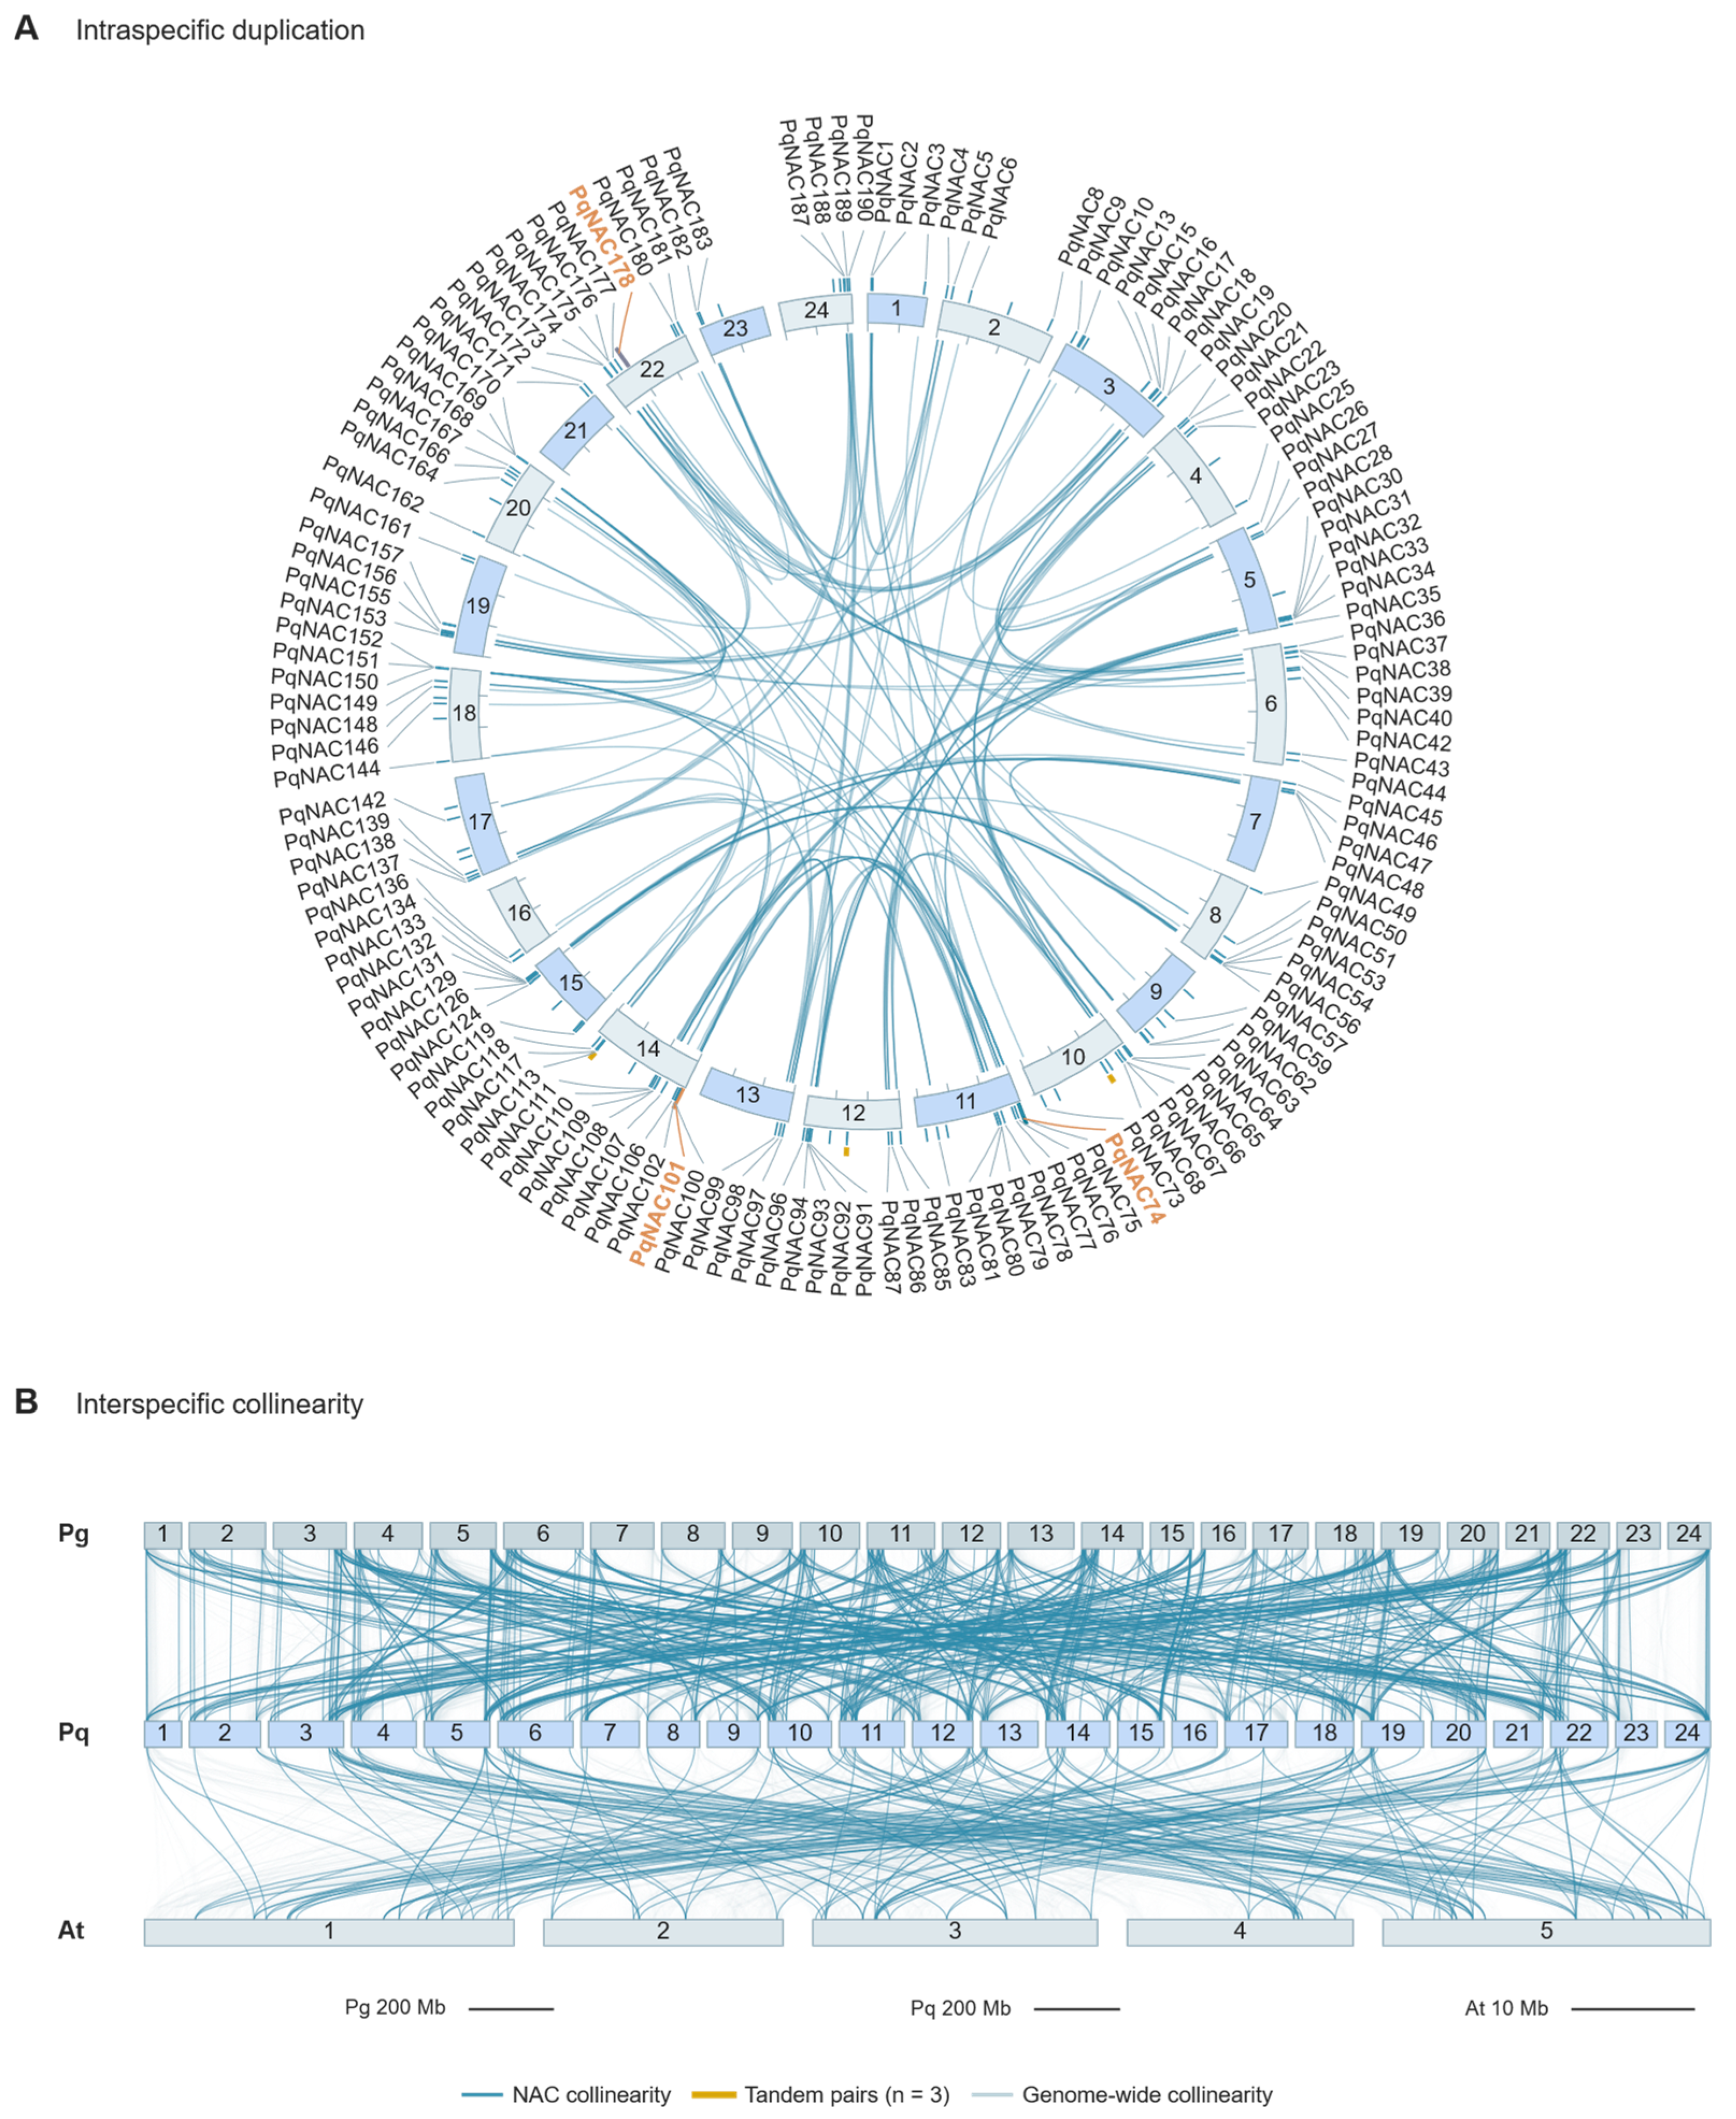
Reference-matched collinearity analysis identified 151 unique PqNAC–PqNAC collinear pairs involving 137 genes (Figure 4A). Using direct adjacency among annotated protein-coding genes, three adjacent homologous pairs involving six PqNAC genes were detected. Interspecific comparisons identified 514 PqNAC-associated anchor pairs with P. ginseng involving 164 PqNAC genes, and 167 anchor pairs with A. thaliana involving 97 PqNAC genes (Figure 4B). Multiple correspondences can occur per locus. Of the 151 recomputed pairs, 21 had Ks > 2 and were excluded from the Ka/Ks summary. All the estimates were defined. Among the 130 evaluable pairs, 127 (97.69%) had Ka/Ks < 1. The three pairs with Ka/Ks > 1 were PqNAC136–PqNAC47 (Ka/Ks = 1.073, Ks = 0.152616), PqNAC148–PqNAC166 (1.183, 0.0343361) and PqNAC27–PqNAC86 (1.527, 0.00837772) (Supplementary Table S5).
Figure 4.
Intraspecific and interspecific collinearity involving chromosome-anchored PqNAC genes: (A) Distribution of 190 PqNAC loci and 151 unique collinear pairs involving 137 genes in P. quinquefolius. Blue ticks and curves indicate loci and collinear pairs. Chromosome arcs are proportional to sequence lengths, with ticks every 50 Mb. Gold marks indicate three BLASTP-matched PqNAC pairs adjacent in the genome-wide protein-coding gene order. All 137 collinear genes are labeled, with PqNAC74, PqNAC101 and PqNAC178 highlighted in orange. (B) Collinearity among Pg (P. ginseng), Pq (P. quinquefolius) and At (A. thaliana), arranged from top to bottom. Pg–Pq and Pq–At comparisons contain 514 and 167 unique PqNAC-associated anchor pairs involving 164 and 97 PqNAC genes, respectively. Gray links show genome-wide anchors and blue links highlight PqNAC-associated anchors. Chromosomes are numbered and scaled independently within species, with separate scale bars. Each locus may have multiple partners.
3.7. MeJA Screening and Candidate Selection
Reanalysis of the previously generated MeJA-treated leaf transcriptomes at 24 h identified 30 differentially expressed PqNAC genes, comprising 17 up-regulated and 13 down-regulated genes under |log2 fold change| > 1 and adjusted p < 0.05. PqNAC74, PqNAC101 and PqNAC178 were selected for targeted comparison because their increases were considered prominent during the initial screening. Their reference identifiers are GWHPBEIR029036.1, GWHPBEIR037737.1 and GWHPBEIR059093.1, respectively. Subsequent experiments evaluated localization, activity in the synthetic CATGTG reporter assay and activity toward PqDDS/PqSE promoter reporters.
3.8. Subcellular Localization of the Candidate NAC Proteins
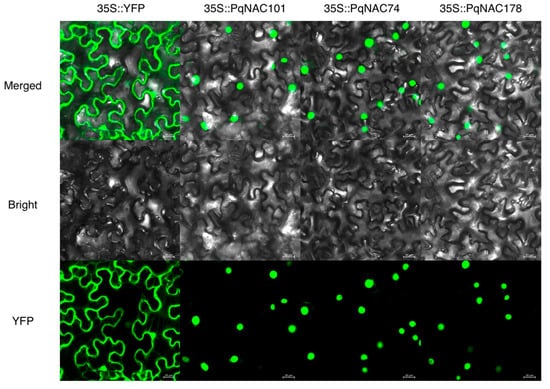
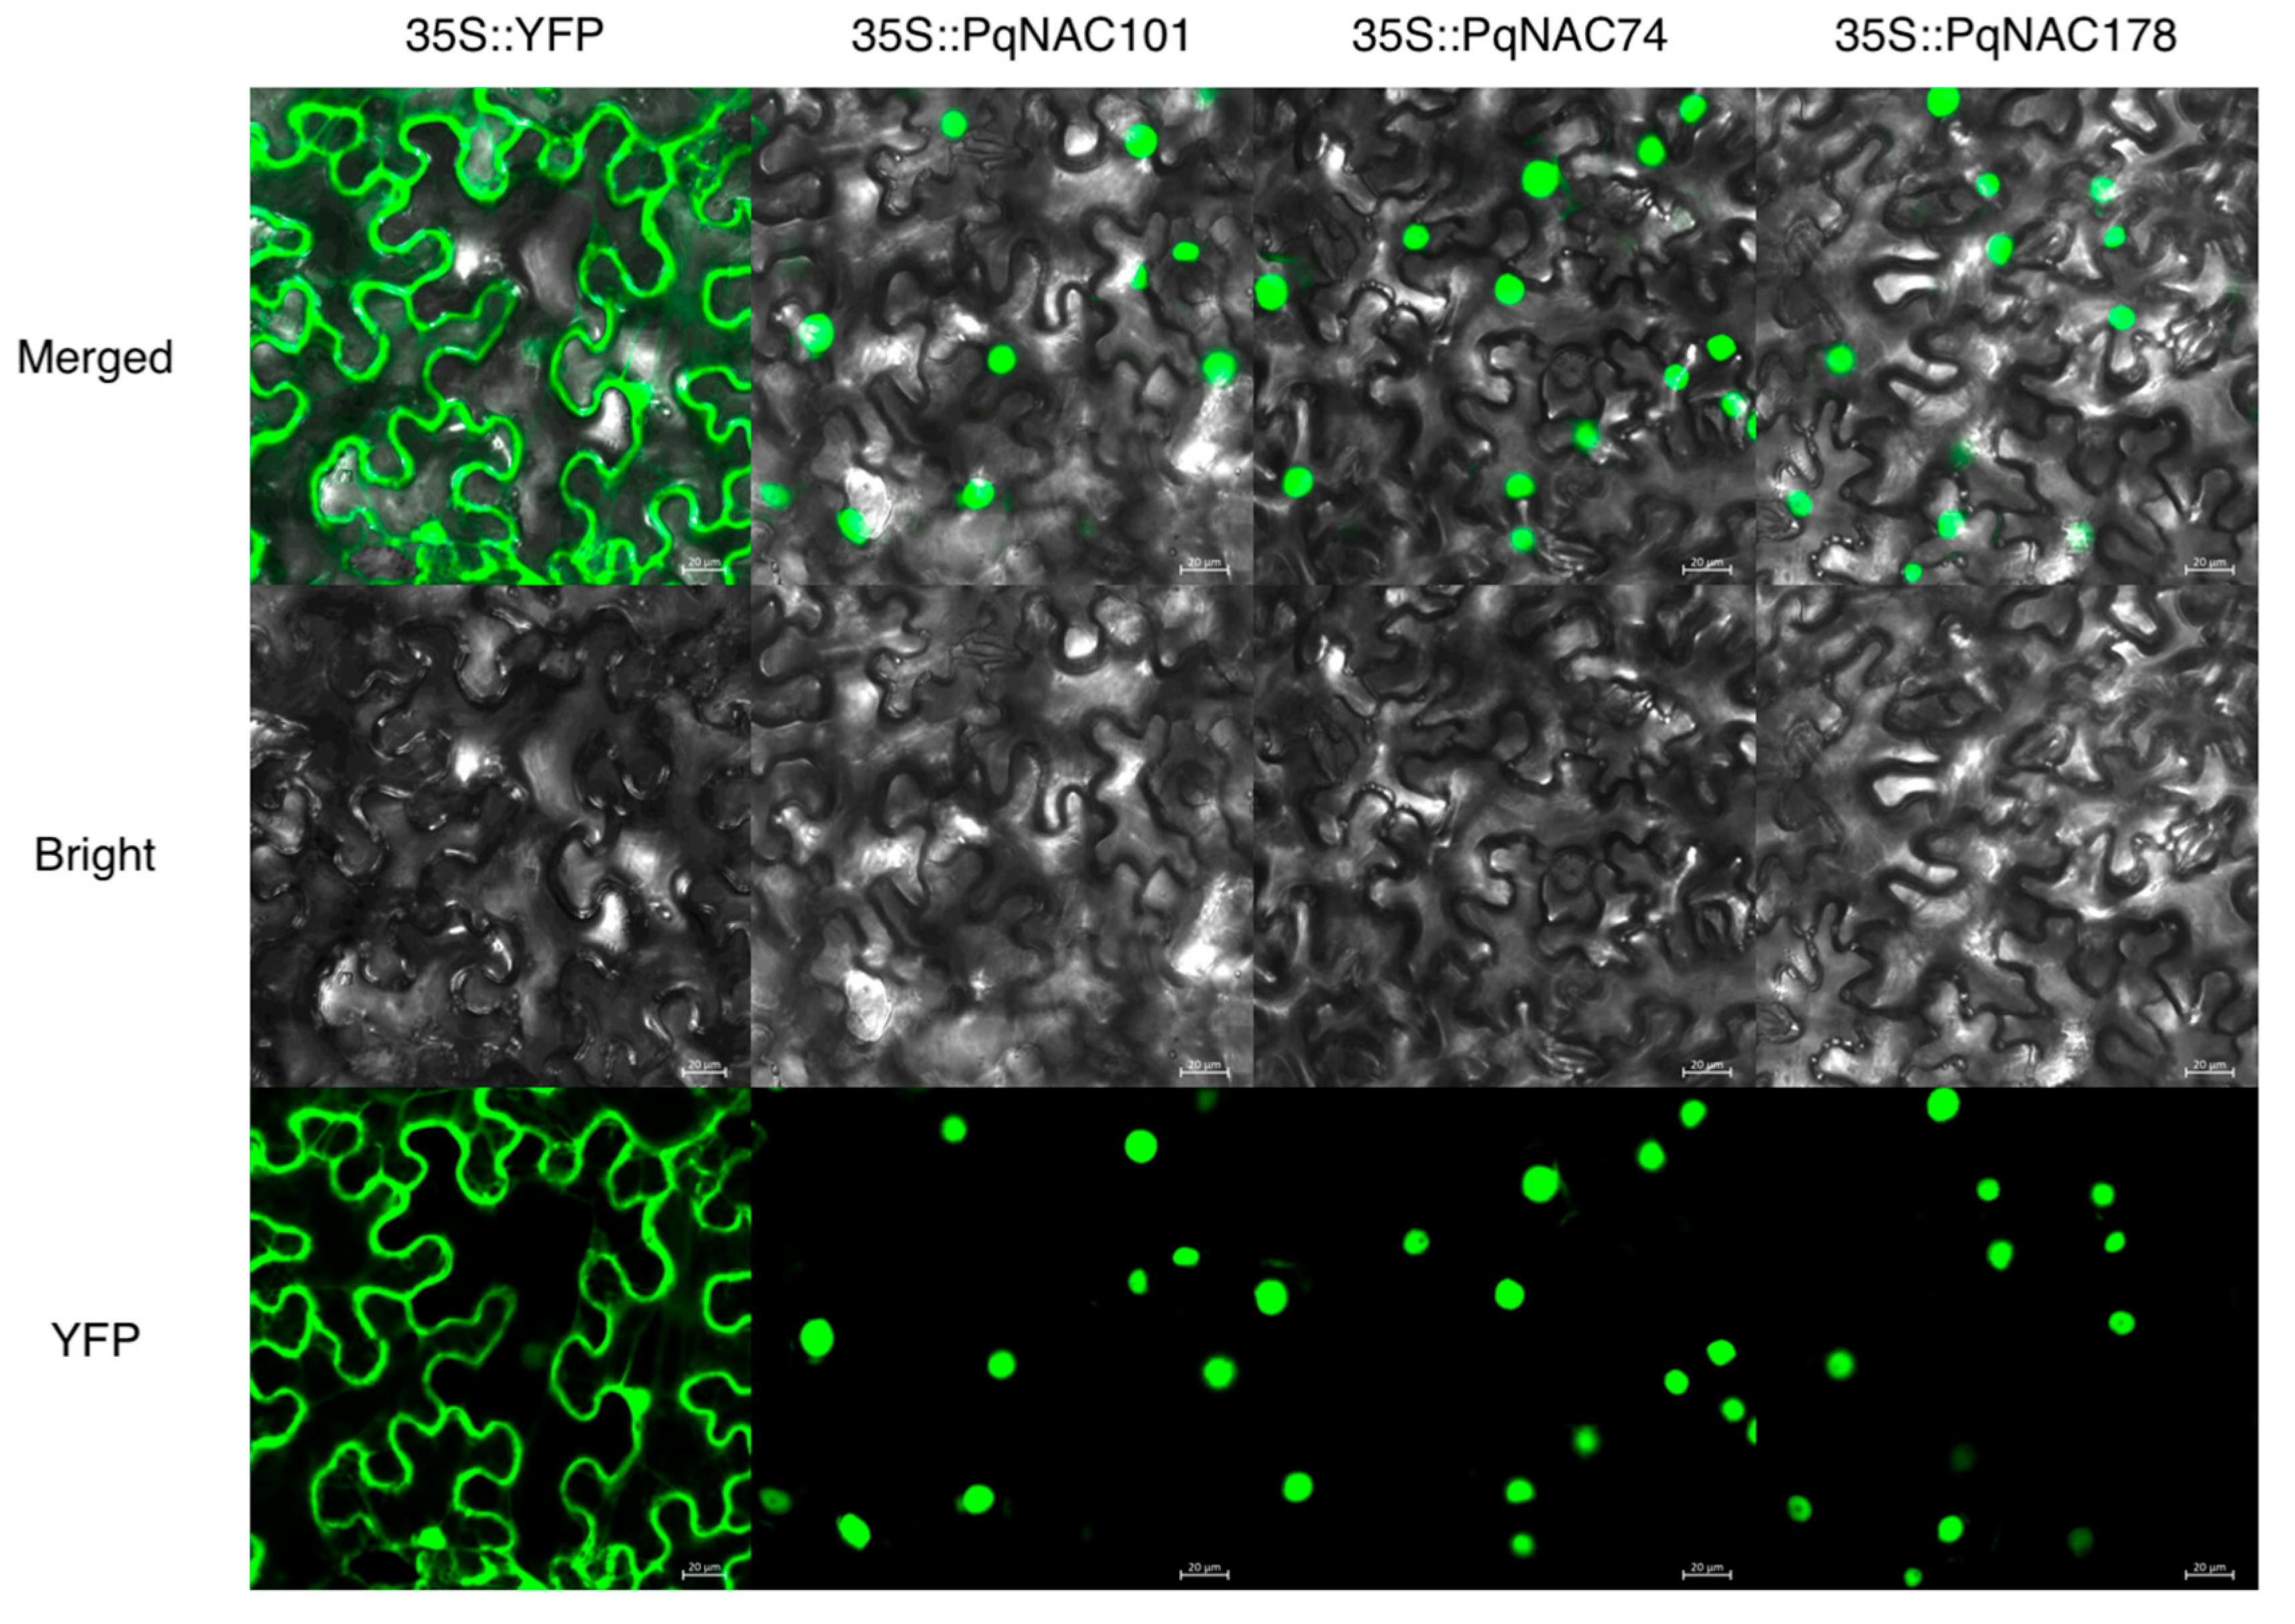
To examine the subcellular distribution of the candidate proteins, PqNAC74–YFP, PqNAC101–YFP and PqNAC178–YFP fusion constructs were transiently expressed in N. benthamiana leaves (Figure 5). Whereas the empty YFP control was distributed across multiple cellular regions, the candidate fusion proteins showed concentrated fluorescence consistent with nuclear localization. Because no independent nuclear marker was included, these images suggest nuclear localization but do not establish nuclear co-localization.
Figure 5.
Transient localization of PqNAC74, PqNAC101 and PqNAC178 YFP constructs in Nicotiana benthamiana leaves. YFP fluorescence, bright-field images and merged views are shown with the empty YFP control. Concentrated signals are consistent with nuclear localization; an independent nuclear marker was not included, and nuclear co-localization was not established. Scale bars, 20 μm.
3.9. Yeast One-Hybrid Assay of Candidate Transcription Factors Against a Synthetic CATGTG Reporter
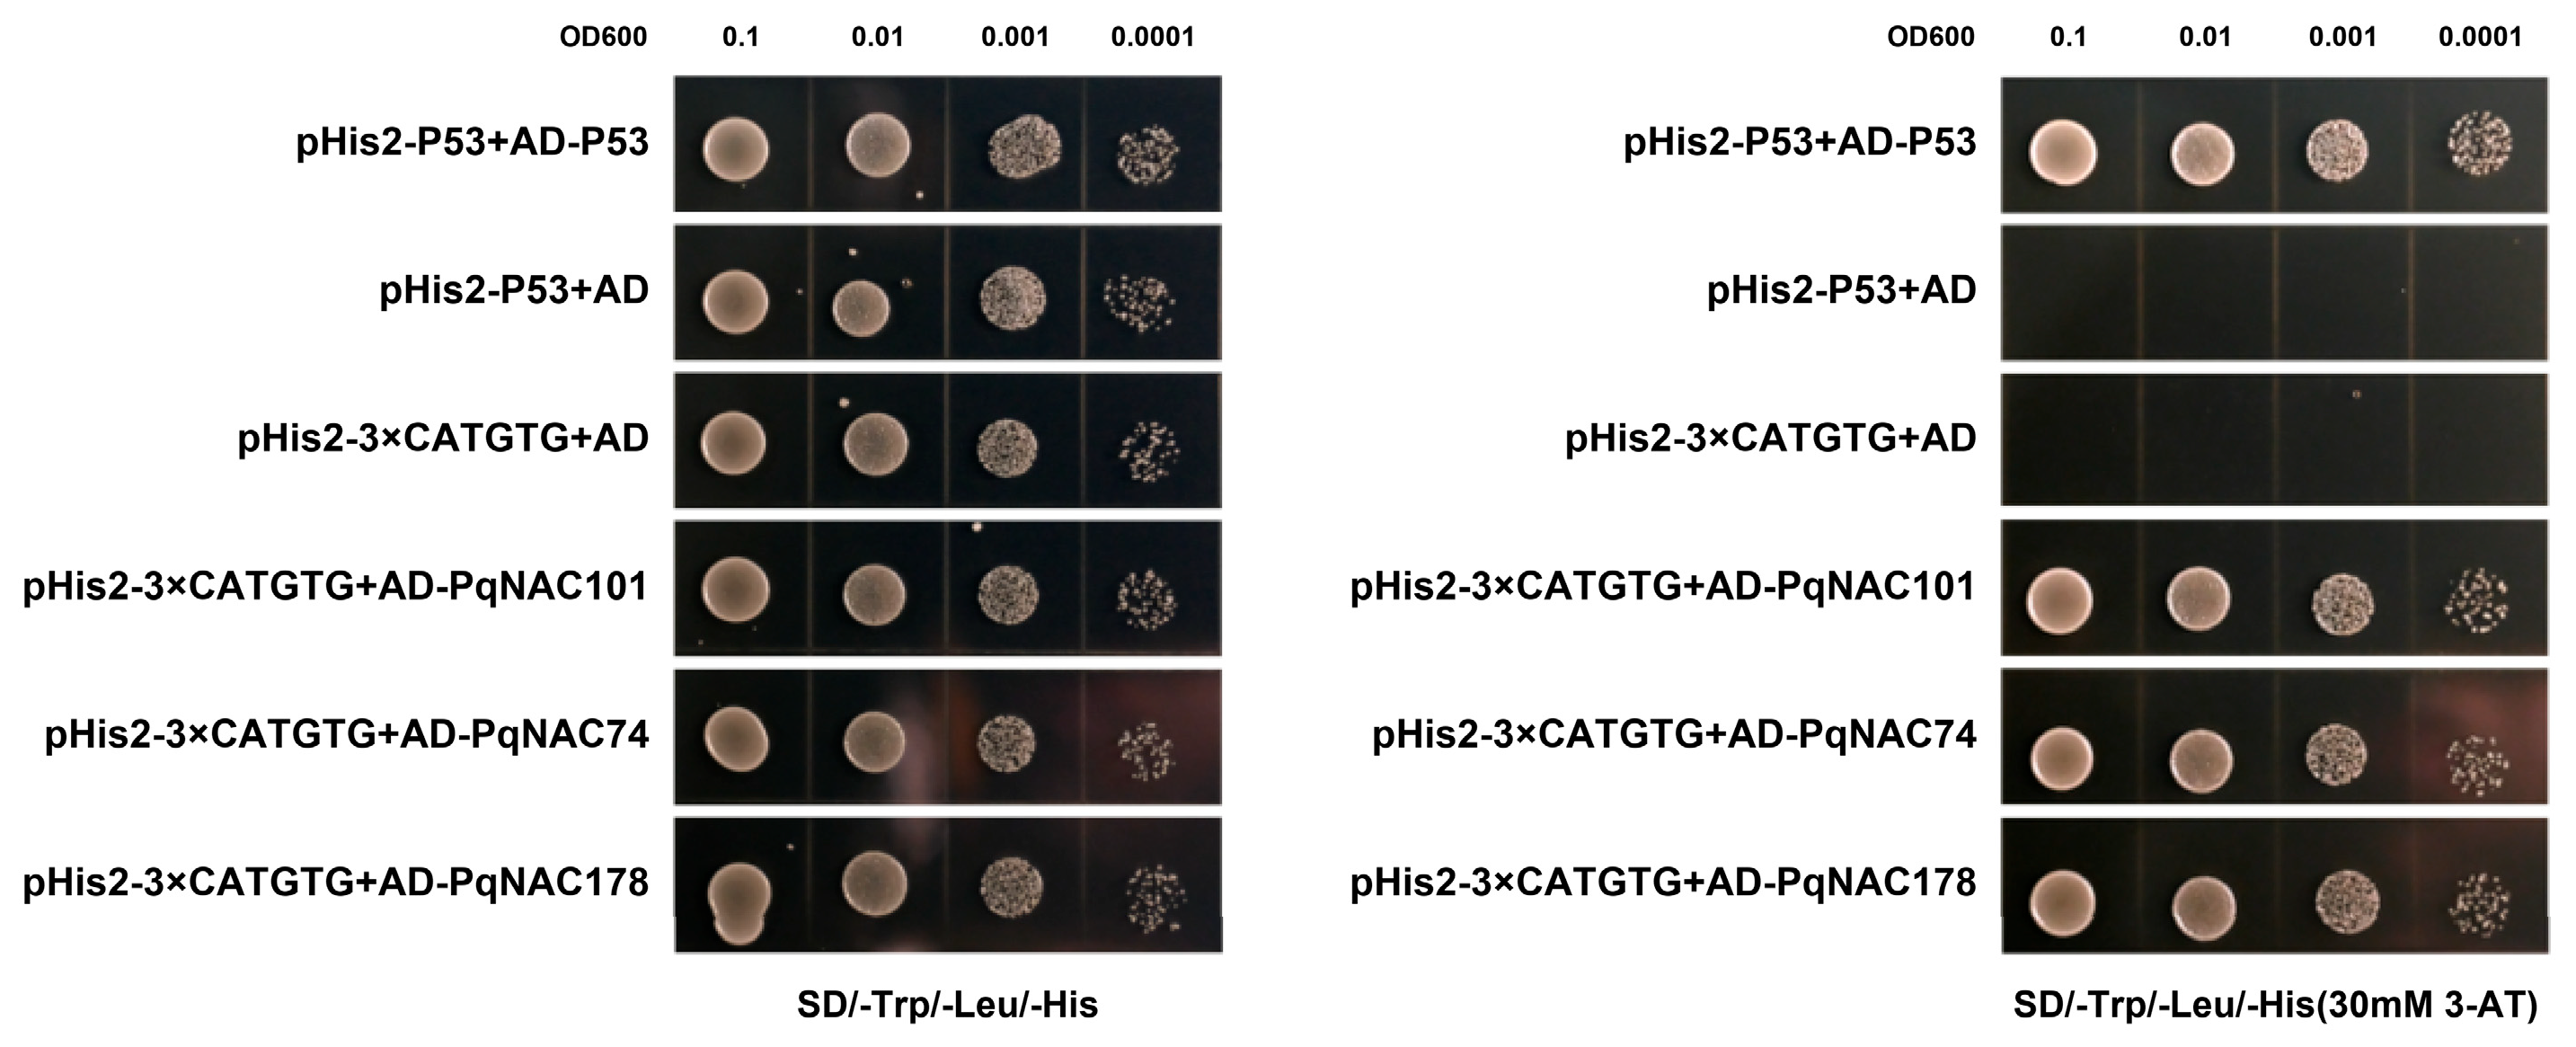
Yeast one-hybrid assays used a synthetic reporter containing three tandem CATGTG repeats. Reporter-background growth decreased across the 3-AT titration (Supplementary Figure S5), and 30 mmol L−1 was used for candidate comparisons.
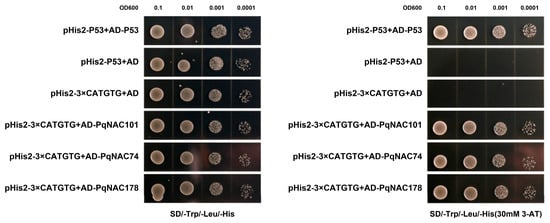
At 30 mmol L−1 3-AT, transformants containing each candidate retained growth, whereas the empty-prey control showed little or no growth and the p53 positive control grew (Figure 6). The assay was repeated in three independent experiments, and one representative experiment is shown. Serial-dilution growth supports activity with the synthetic CATGTG reporter and is interpreted qualitatively. The assay did not test binding to native promoter fragments or the contribution of individual CATGTG sites.
Figure 6.
Yeast one-hybrid assay with the synthetic CATGTG-containing reporter system. Y187 transformants were compared on SD medium lacking tryptophan, leucine and histidine without 3-AT (left image) or with 30 mmol L−1 3-AT (right image). The pHIS2-p53 plus pGADT7-p53 combination is the positive control, and pHIS2-3 × CATGTG plus empty pGADT7 is the negative control. Candidate prey constructs carry PqNAC74, PqNAC101 or PqNAC178. One representative result from three independent experiments is shown. Growth is assessed qualitatively in the synthetic reporter system.
3.10. Dual-Luciferase Reporter Assay of PqNAC74, PqNAC101, and PqNAC178 Against the PqDDS and PqSE Promoters
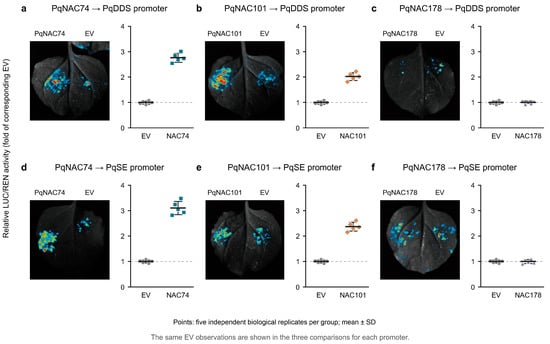
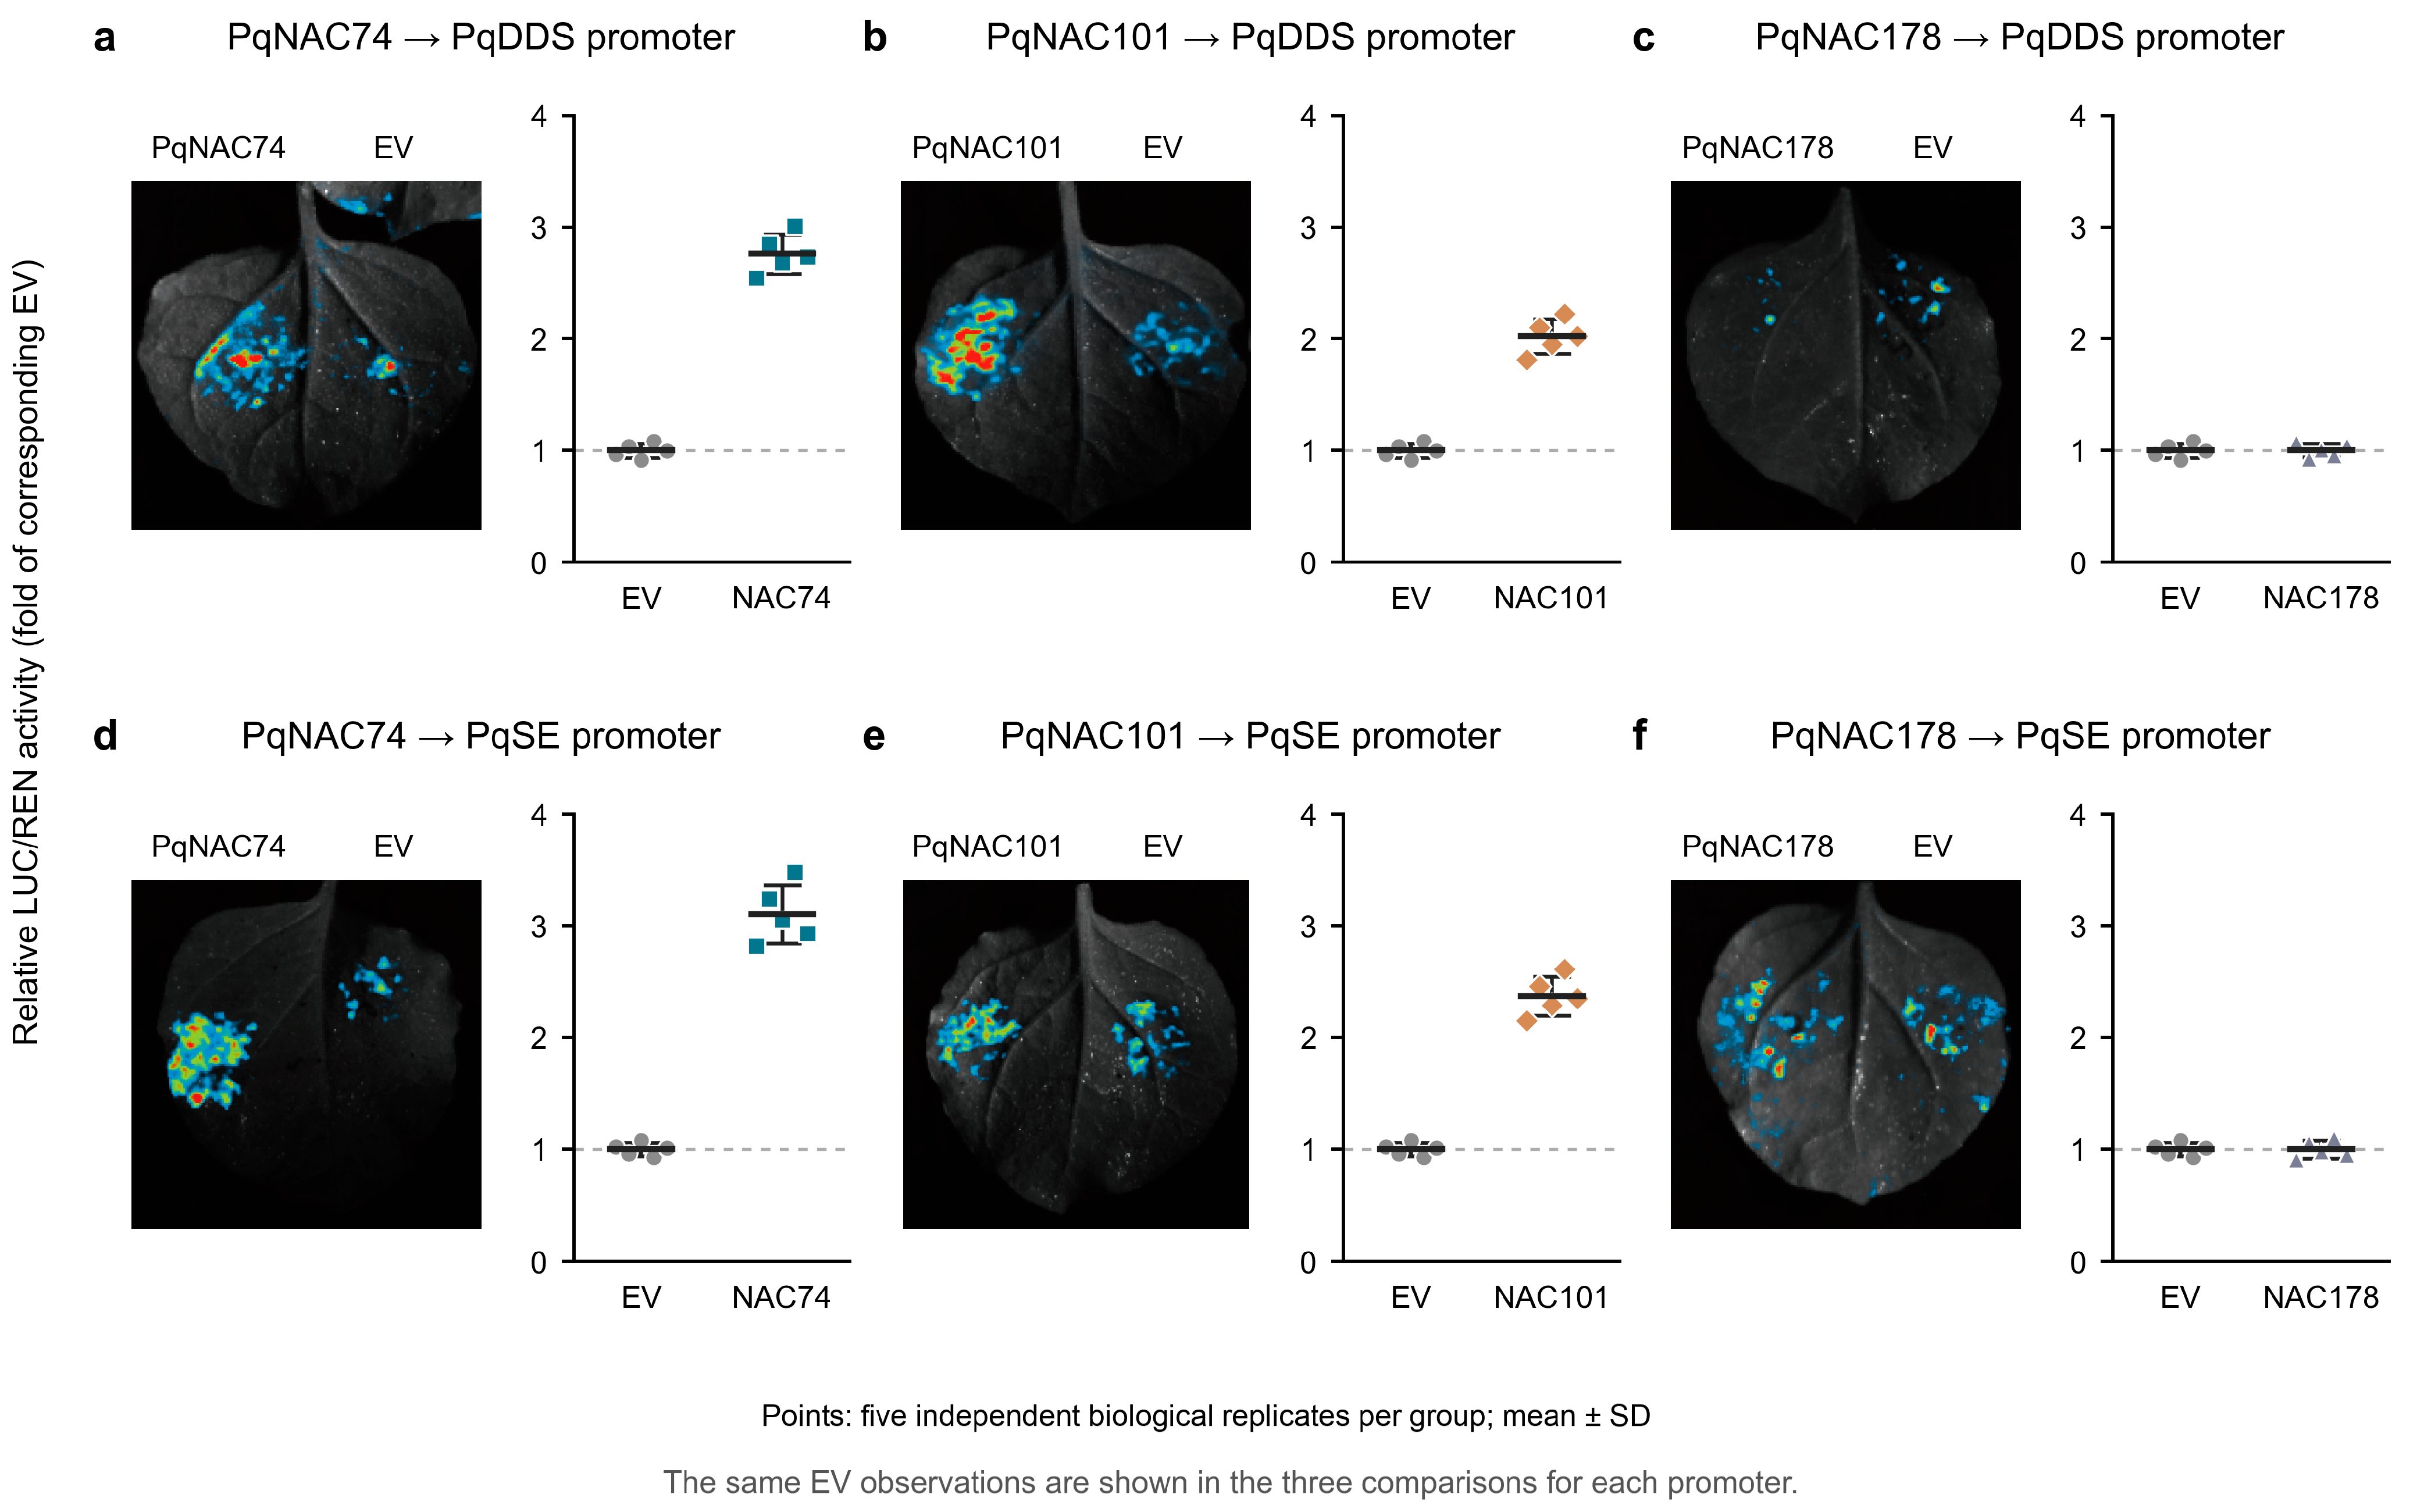
PqNAC74 and PqNAC101 increased reporter activity driven by both the PqDDS and PqSE promoters (Figure 7; Supplementary Table S7). Relative mean activities for PqNAC74 and PqNAC101 were 2.761 ± 0.177 and 2.022 ± 0.154 for PqDDS, and 3.104 ± 0.262 and 2.372 ± 0.174 for PqSE (mean ± sample SD, five plant-matched biological replicates per condition; matching EV mean = 1). PqNAC178 remained close to EV (1.002 ± 0.062 for PqDDS; 1.000 ± 0.078 for PqSE). Inference used the original LUC/REN ratios without division by the EV mean. The model including effector and plant factors gave F(3, 12) = 321.389 for PqDDS and 304.919 for PqSE for the effector effect (both p < 0.001). Dunnett’s simultaneous comparisons with the single shared EV group supported increases for PqNAC74 and PqNAC101 with each promoter (all adjusted p < 0.001); PqNAC178 did not differ from EV (both adjusted p > 0.99). A sensitivity analysis of natural-log LUC/REN ratios gave the same candidate-versus-EV conclusions. The higher mean activity of PqNAC74 than PqNAC101 is descriptive; a direct comparison between these two effectors was not the specified contrast.
Figure 7.
Effects of PqNAC effectors on PqDDS- and PqSE-promoter-driven reporter activity. Panels (a–c) represent the co-infiltration of PqNAC74, PqNAC101 and PqNAC178 with the PqDDS promoter reporter, respectively; panels (d–f) represent co-infiltration of the same three effectors with the PqSE promoter reporter. The luminescence images of Nicotiana benthamiana leaves are displayed on the left of each panel, with the PqNAC effector on the left side of the leaf and empty vector (EV) control on the right side. The scatter plots on the right show relative LUC/REN activity. Each dot corresponds to one plant-matched biological replicate; horizontal lines mark the mean values and vertical error bars indicate sample SD. LUC/REN values are normalized to the corresponding EV mean for display, with the dashed line at y = 1 representing the baseline activity of the EV control. Each promoter was analyzed using raw LUC/REN ratios in an effector-and-plant model (20 observations across five plant blocks), followed by two-sided Dunnett comparisons against EV. Shared EV observations enter each model once. Table S7 reports descriptive statistics, adjusted p-values, and simultaneous 95% confidence intervals.
4. Discussion
The chromosome-anchored catalog of 190 PqNAC genes integrates sequence, duplication and expression information and identifies candidates for functional investigation. Its family size is similar to the 191 PgNAC genes identified by a genome-based search in P. ginseng [14], whereas 98 PnNAC genes were reported for P. notoginseng [9]. The earlier P. ginseng inventory contained 89 genes represented by 251 transcripts from sampled tissues [8], illustrating the importance of distinguishing transcriptome-derived and genome-derived catalogs. The larger catalogs in the two tetraploid species are compatible with Panax polyploid history [29], although family counts alone cannot assign particular gains to a specific duplication event. Here, 151 unique collinear pairs and three directly adjacent homologous pairs document duplicated PqNAC copies. The reported absence of tandem duplication in the P. notoginseng survey [9] offers a contrasting pattern, subject to differences in annotation and detection criteria. Comparable family-wide Ka/Ks distributions were not reported in the cited surveys [8,9], so a numerical cross-species comparison of selective pressure is not made.
Among the 130 evaluable collinear pairs, 127 (97.69%) had Ka/Ks below one, consistent with predominant coding-sequence constraint. The three estimates above one were PqNAC136–PqNAC47 (Ka/Ks = 1.073, Ks = 0.152616), PqNAC148–PqNAC166 (1.183, 0.0343361) and PqNAC27–PqNAC86 (1.527, 0.00837772). The small synonymous divergence for PqNAC27–PqNAC86 warrants caution when interpreting its ratio. These pairs are candidates for closer evolutionary examination. Reliable coding annotations, codon alignments and further evolutionary analyses are needed to evaluate possible positive selection.
Conserved N-terminal regions and variable motif arrangements accord with established NAC organization [5] and with surveys in other plants [33,34,35,36,37,38]. The upstream predictions provide candidate regulatory regions for experimental testing. Light-response labels were frequent, but PlantCARE coverage and annotation bias, short multifunctional sequence matches and the absence of a matched genomic background can affect these frequencies. Nonexclusive classification preserves explicitly recorded multifunctionality; the counts do not demonstrate light-response enrichment or light–MeJA integration. Tissue expression variation provides complementary context, without assigning statistically supported tissue-specific classes from the heatmap.
The localization, yeast and promoter-reporter assays provide complementary evidence for the three selected candidates. Fluorescence was consistent with nuclear localization, although an independent nuclear marker was not included. Growth with a synthetic 3 × CATGTG reporter establishes activity in that assay system; NAC recognition can depend on sequences beyond a shared core motif [39], and the result does not establish recognition of native PqDDS or PqSE sites. In the PgNAC72 study, promoter transactivation was complemented by EMSA using PgDDS-derived ABRE/CACG probes and by DAPI-supported localization [14]. These assays address distinct aspects of the proposed regulatory mechanism. In the present study, native-promoter binding and the necessity or sufficiency of individual CATGTG sites remain untested. Candidate perturbation in P. quinquefolius, combined with measurements of pathway transcripts and ginsenosides, would connect the reporter activities to endogenous metabolism. Hairy-root culture offers one possible platform for such work [40].
Testing SE alongside DDS links the reporter comparison to both shared precursor formation and the committed dammarane branch [18,19,41]. SE supplies 2,3-oxidosqualene to sterol and triterpenoid pathways, whereas DDS directs this precursor into the dammarane branch. Related regulatory mechanisms include PgWRKY4X activation of PgSE [42], PnNAC2/PnNAC03 activity toward multiple saponin-pathway promoters [43,44], and PgNAC72/PgMYB2 regulation of PgDDS [14,26]. The present results extend candidate-level promoter evidence to P. quinquefolius: PqNAC74 and PqNAC101 activated both reporters, while PqNAC178 did not show a significant effect. Dual-luciferase assays quantify promoter-dependent transcriptional activity [45]. Activity of the same candidates toward both reporters therefore provides a basis for investigating coordination between these two pathway steps; it does not demonstrate coordinated endogenous regulation, increased metabolic flux or greater ginsenoside accumulation.
PqNAC74 had a larger mean reporter response than PqNAC101 for both promoters. Differences in protein abundance or stability, transactivation capacity, cofactors or promoter recognition could contribute, but the experiments did not measure these mechanisms or establish a direct difference between the two effectors. Both candidates merit follow-up, with their observed activity patterns providing a basis for prioritizing subsequent mechanistic tests.
5. Conclusions
This study establishes a chromosome-anchored resource for 190 PqNAC genes and identifies PqNAC74 and PqNAC101 as candidates capable of increasing activity from both PqDDS and PqSE promoter reporters. The contrasting response of PqNAC178 emphasizes candidate-specific regulatory activity and provides a useful comparison for future functional studies. The current evidence comprises sequence analyses, fluorescence consistent with nuclear localization, a synthetic CATGTG yeast reporter and transient promoter assays. Direct binding to native promoters, the contribution of individual CATGTG sites, nuclear co-localization with an independent marker, effects on endogenous ginsenoside abundance and independent qRT-PCR validation of NAC MeJA responses were not established. The catalog and comparative reporter results provide a focused basis for addressing these questions.
Supplementary Materials
The following supporting information can be downloaded at https://www.mdpi.com/article/10.3390/life16111972/s1. Figures S1–S7 contain the following Figure S1. Conceptual organization of a NAC transcription factor. The N-terminal NAC domain is conventionally described by subdomains A–E, followed by a more variable C-terminal region. The schematic is not to scale. Figure S2. NAM-profile alignment of the 190 catalogued PqNAC proteins. Figure S3. Motif, domain and gene-structure analysis in phylogenetic order. The left block shows colored motif occurrences along protein-length bars; the middle block shows NAC-domain annotations; the right block shows gene structures. In the gene-structure legend, coding sequences are yellow, untranslated regions are green, and connecting lines indicate introns. Motif numbers and colors follow the figure. The MEME analysis searched for ten motifs; all ten are displayed. Figure S4. Descriptive heatmap of PqNAC expression in three root (R), three leaf (L) and three flower (F) samples. Columns retain the source order R2, R1, R3, L2, L1, L3, F1, F2 and F3. Colors reproduce the expression display. No quantitative threshold or statistical test is used to classify genes as broadly expressed or tissue-specific. Figure S5. Reporter-background titration across 3-amino-1,2,4-triazole (3-AT) concentrations. Plate labels indicate SD medium lacking tryptophan and histidine with 0, 5, 10, 15Figure S1. Conceptual organization of a NAC transcription factor. The N-terminal NAC domain is conventionally described by subdomains A–E, followed by a more variable C-terminal region. The schematic is not to scale. Figure S2. NAM-profile alignment of the 190 catalogued PqNAC proteins. Figure S3. Motif, domain and gene-structure analysis in phylogenetic order. The left block shows colored motif occurrences along protein-length bars; the middle block shows NAC-domain annotations; the right block shows gene structures. In the gene-structure legend, coding sequences are yellow, untranslated regions are green, and connecting lines indicate introns. Motif numbers and colors follow the figure. The MEME analysis searched for ten motifs; all ten are displayed. Figure S4. Descriptive heatmap of PqNAC expression in three root (R), three leaf (L) and three flower (F) samples. Columns retain the source order R2, R1, R3, L2, L1, L3, F1, F2 and F3. Colors reproduce the expression display. No quantitative threshold or statistical test is used to classify genes as broadly expressed or tissue-specific. Figure S5. Reporter-background titration across 3-amino-1,2,4-triazole (3-AT) concentrations. Plate labels indicate SD medium lacking tryptophan and histidine with 0, 5, 10, 15, 20 or 30 mmol L−1 3-AT. Growth was reduced across the displayed series, and 30 mmol L−1 was used for subsequent candidate comparisons. This is a qualitative background-growth comparison; no colony-count or growth-curve quantification is inferred from the plate images. Figure S6. Components used in the dual-luciferase assay. (a) pGreenII 62-SK effectors carrying PqNAC74, PqNAC101 or PqNAC178 and the empty effector vector (EV). (b) pGreenII 0800-LUC reporters in which the PqDDS or PqSE promoter drives LUC expression. REN provides the internal reference. 35S denotes the cauliflower mosaic virus promoter; NOS denotes the nopaline synthase terminator. The schematic summarizes the reported functional components and is not a physical plasmid map. Reporter constructs were verified by Sanger sequencing; primer names are listed in Supplementary Table S6. Figure S7. Reported CATGTG positions in the 2000 bp upstream regions of PqDDS (a) and PqSE (b), relative to the annotated translation start (ATG). The reported positions are −948 and −864 bp for PqDDS and −377 bp for PqSE. The schematic reproduces these sequence-position annotations without assigning strand orientation or verified clone boundaries. These positions differ in scope from the promoter fragments used in the reporter assay. The sequence annotations do not establish binding or a functional contribution of the individual sites; motif-specific mutants were not tested. Tables S1–S6 provide protein sequences, identifiers and properties, genomic positions and localization predictions, nonexclusive cis-element annotations, duplicated pairs and primers. Table S7 provides descriptive values, plant-blocked raw-ratio model and Dunnett comparisons, simultaneous confidence intervals and log-scale sensitivity results. Supplementary Methods SM1 and SM2 accompany Figures S1–S7 and describe the protein physicochemical calculations and nonexclusive cis-element classification.
Author Contributions
Conceptualization, P.D.; methodology, K.Y.; software, K.Y.; validation, K.Y.; formal analysis, K.Y.; investigation, K.Y.; resources, P.D.; data curation, K.Y.; writing—original draft preparation, K.Y.; writing—review and editing, P.D.; visualization, K.Y.; supervision, P.D.; project administration, P.D.; funding acquisition, P.D. All authors have read and agreed to the published version of the manuscript.
Funding
This research was funded by the Science and Technology Development Plan Project of Jilin Province, China (grant number 20260601053RC), and the Sanjiang Laboratory Science and Technology Innovation Project (grant number SJ2025007).
Institutional Review Board Statement
Not applicable.
Informed Consent Statement
Not applicable.
Data Availability Statement
The reference genome is available from GWH under accession GWHBEIR00000000.1 and the public tissue transcriptomic data through the CNGBdb project CNP0001680. Protein sequences, annotations, cis-element records, duplicated pairs and primers are supplied in Tables S1–S6. The dual-luciferase statistical results are supplied in Table S7. The cis-element records underlying Figure 3 are provided in Table S4, with classification rules in Supplementary Methods SM2. The MeJA transcriptomes originate from the study in reference [31].
Acknowledgments
During manuscript preparation, the authors used DeepSeek-V4.1-Flash and GPT-6.1 Sol (OpenAI, accessed via Codex) to assist with English editing, consistency checks, calculation-script preparation and figure layout. The authors have reviewed and edited the output and take full responsibility for the content of this publication.
Conflicts of Interest
The authors declare no conflicts of interest.
References
- Souer, E.; van Houwelingen, A.; Kloos, D.; Mol, J.; Koes, R. The No Apical Meristem Gene of Petunia Is Required for Pattern Formation in Embryos and Flowers and Is Expressed at Meristem and Primordia Boundaries. Cell 1996, 85, 159–170. [Google Scholar] [CrossRef] [Scilit]
- Aida, M.; Ishida, T.; Fukaki, H.; Fujisawa, H.; Tasaka, M. Genes involved in organ separation in Arabidopsis: An analysis of the cup-shaped cotyledon mutant. Plant Cell 1997, 9, 841–857. [Google Scholar] [CrossRef] [Scilit]
- Ernst, H.A.; Olsen, A.N.; Skriver, K.; Larsen, S.; Leggio, L.L. Structure of the conserved domain of ANAC, a member of the NAC family of transcription factors. EMBO Rep. 2004, 5, 297–303. [Google Scholar] [CrossRef] [Scilit]
- Duval, M.; Hsieh, T.F.; Kim, S.Y.; Thomas, T.L. Molecular characterization of AtNAM: A member of the Arabidopsis NAC domain superfamily. Plant Mol. Biol. 2002, 50, 237–248. [Google Scholar] [CrossRef] [Scilit]
- Olsen, A.N.; Ernst, H.A.; Lo Leggio, L.; Skriver, K. NAC transcription factors: Structurally distinct, functionally diverse. Trends Plant Sci. 2005, 10, 79–87. [Google Scholar] [CrossRef] [Scilit]
- Xiong, H.; He, H.; Chang, Y.; Miao, B.; Liu, Z.; Wang, Q.; Dong, F.; Xiong, L. Multiple roles of NAC transcription factors in plant development and stress responses. J. Integr. Plant Biol. 2025, 67, 510–538. [Google Scholar] [CrossRef] [Scilit]
- Nuruzzaman, M.; Sharoni, A.M.; Kikuchi, S. Roles of NAC transcription factors in the regulation of biotic and abiotic stress responses in plants. Front. Microbiol. 2013, 4, 248. [Google Scholar] [CrossRef] [Scilit]
- Liu, Q.; Sun, C.; Han, J.; Li, L.; Wang, K.; Wang, Y.; Chen, J.; Zhao, M.; Wang, Y.; Zhang, M. Identification, characterization and functional differentiation of the NAC gene family and its roles in response to cold stress in ginseng, Panax ginseng C.A. Meyer. PLoS ONE 2020, 15, e0234423. [Google Scholar] [CrossRef] [Scilit]
- Jin, B.; Hu, X.; Li, N.; Li, X.; Chen, Z.; Zhao, X.; Wu, X. Genome-Wide Identification and Expression Pattern of the NAC Gene Family in Panax notoginseng. Genes 2025, 16, 320. [Google Scholar] [CrossRef] [Scilit]
- Li, X.; Pan, J.; Islam, F.; Li, J.; Hou, Z.; Yang, Z.; Xu, L. Genome-wide identification of the NAC gene family and expression analysis under abiotic stresses in Salvia miltiorrhiza. Biocell 2022, 46, 1947–1958. [Google Scholar] [CrossRef] [Scilit]
- Xu, S.; Li, J.; Sun, M.; Sun, W.; Gu, Y.; Mei, Y.; Wang, J.-H. Identification and expression analysis of the NAC gene family in Andrographis paniculata. Chin. Agric. Sci. Bull. 2024, 40, 117–125. [Google Scholar] [CrossRef]
- Yang, Q.; Li, Z.; Wang, X.; Jiang, C.; Liu, F.; Nian, Y.; Fu, X.; Zhou, G.; Liu, L.; Wang, H. Genome-wide identification and Characterization of the NAC gene family and its involvement in cold response in Dendrobium officinale. Plants 2023, 12, 3626. [Google Scholar] [CrossRef] [Scilit]
- Zhan, N.; Zhao, Z.; Ren, L.; Yang, F.; Zhang, C.; Qin, L.; Gong, X. Genome-wide identification and genetic Characterization of Eucommia ulmoides NAC family genes and functional analysis of EuNAC9 in alleviating Mn2+ stress. J. Plant Biol. 2024, 67, 449–466. [Google Scholar] [CrossRef] [Scilit]
- Jiang, T.; Zhang, Y.; Zuo, G.; Luo, T.; Wang, H.; Zhang, R.; Luo, Z. Transcription factor PgNAC72 activates DAMMARENEDIOL SYNTHASE expression to promote ginseng saponin biosynthesis. Plant Physiol. 2024, 195, 2952–2969. [Google Scholar] [CrossRef] [Scilit]
- Liu, C.; Zhao, M.; Ma, H.; Zhang, Y.; Liu, Q.; Liu, S.; Wang, Y.; Wang, K.; Zhang, M.; Wang, Y. The NAC Transcription Factor PgNAC41-2 Gene Involved in the Regulation of Ginsenoside Biosynthesis in Panax ginseng. Int. J. Mol. Sci. 2023, 24, 11946. [Google Scholar] [CrossRef] [Scilit]
- Dong, J.; Zhao, X.; Song, X.; Wang, S.; Zhao, X.; Liang, B.; Long, Y.; Xing, Z. Identification of Eleutherococcus senticosus NAC transcription factors and their mechanisms in mediating DNA methylation of EsFPS, EsSS, and EsSE promoters to regulate saponin synthesis. BMC Genom. 2024, 25, 536. [Google Scholar] [CrossRef] [Scilit]
- Tian, L.; Gao, R.; Cai, Y.; Chen, J.; Dong, H.; Chen, S.; Yang, Z.; Wang, Y.; Huang, L.; Xu, Z. A systematic review of ginsenoside biosynthesis, spatiotemporal distribution, and response to biotic and abiotic factors in American ginseng. Food Funct. 2024, 15, 2343–2365. [Google Scholar] [CrossRef] [Scilit]
- Tansakul, P.; Shibuya, M.; Kushiro, T.; Ebizuka, Y. Dammarenediol-II synthase, the first dedicated enzyme for ginsenoside biosynthesis, in Panax ginseng. FEBS Lett. 2006, 580, 5143–5149. [Google Scholar] [CrossRef] [Scilit]
- Han, J.Y.; In, J.G.; Kwon, Y.S.; Choi, Y.E. Regulation of ginsenoside and phytosterol biosynthesis by RNA interferences of squalene epoxidase gene in Panax ginseng. Phytochemistry 2010, 71, 36–46. [Google Scholar] [CrossRef] [Scilit]
- Kochan, E.; Sienkiewicz, M.; Szmajda-Krygier, D.; Balcerczak, E.; Szymańska, G. Thymol as a control factor of the expression of key genes of the ginsenoside biosynthesis pathway and its effect on the production of ginseng saponins in Panax quinquefolium hairy root cultures. Ind. Crops Prod. 2024, 210, 118151. [Google Scholar] [CrossRef] [Scilit]
- Zhou, P.; Li, H.; Li, J.; Liu, N.; Wang, J.; Li, H.; Zhang, R.; Xue, J.; Kang, X.; Yang, C. Jasmonates mediate increased levels of ginsenosides in Panax quinquefolius cambial meristematic cell cultures. BMC Plant Biol. 2025, 25, 1546. [Google Scholar] [CrossRef] [Scilit]
- Chini, A.; Fonseca, S.; Fernández, G.; Adie, B.; Chico, J.M.; Lorenzo, O.; García-Casado, G.; López-Vidriero, I.; Lozano, F.M.; Ponce, M.R.; et al. The JAZ family of repressors is the missing link in jasmonate signalling. Nature 2007, 448, 666–671. [Google Scholar] [CrossRef] [Scilit]
- Kochan, E.; Caban, S.; Szymańska, G.; Szymczyk, P.; Lipert, A.; Kwiatkowski, P.; Sienkiewicz, M. Influence of methyl jasmonate on ginsenoside biosynthesis in suspension cultures of Panax quinquefolium L. Ann. Univ. Mariae Curie-Sklodowska Sect. C Biol. 2017, 72, 27–35. [Google Scholar] [CrossRef] [Scilit]
- Wang, W.; Zhang, Z.Y.; Zhong, J.J. Enhancement of ginsenoside biosynthesis in high-density cultivation of Panax notoginseng cells by various strategies of methyl jasmonate elicitation. Appl. Microbiol. Biotechnol. 2005, 67, 752–758. [Google Scholar] [CrossRef] [Scilit]
- Cao, H.; Nuruzzaman, M.; Xiu, H.; Huang, J.; Wu, K.; Chen, X.; Li, J.; Wang, L.; Jeong, J.-H.; Park, S.-J.; et al. Transcriptome Analysis of Methyl Jasmonate-Elicited Panax ginseng Adventitious Roots to Discover Putative Ginsenoside Biosynthesis and Transport Genes. Int. J. Mol. Sci. 2015, 16, 3035–3057. [Google Scholar] [CrossRef] [Scilit]
- Liu, T.; Luo, T.; Guo, X.; Zou, X.; Zhou, D.; Afrin, S.; Li, G.; Zhang, Y.; Zhang, R.; Luo, Z. PgMYB2, a MeJA-Responsive Transcription Factor, Positively Regulates the Dammarenediol Synthase Gene Expression in Panax Ginseng. Int. J. Mol. Sci. 2019, 20, 2219. [Google Scholar] [CrossRef] [Scilit]
- Li, Z.; Xing, X.; Ding, L.; Xing, G.; Zhang, S.; Suo, H.; Zeng, D.; Qu, G.; You, X. MeJA-responsive transcription factors AeMYB9/73 promote oleanolic acid and hederagenin accumulation in Aralia elata. Plant Sci. 2026, 364, 112887. [Google Scholar] [CrossRef] [Scilit]
- Kumar, R.; Kumar, C.; Roy Choudhury, D.; Ranjan, A.; Raipuria, R.K.; Dubey, K.K.D.; Mishra, A.; Kumar, C.; Manzoor, M.M.; Kumar, A.; et al. Isolation, Characterization, and Expression Analysis of NAC Transcription Factor from Andrographis paniculata (Burm. f.) Nees and Their Role in Andrographolide Production. Genes 2024, 15, 422. [Google Scholar] [CrossRef] [Scilit]
- Wang, Z.H.; Wang, X.F.; Lu, T.; Li, M.-R.; Jiang, P.; Zhao, J.; Liu, S.-T.; Fu, X.-Q.; Wendel, J.F.; Van de Peer, Y.; et al. Reshuffling of the ancestral core-eudicot genome shaped chromatin topology and epigenetic modification in Panax. Nat. Commun. 2022, 13, 1902. [Google Scholar] [CrossRef] [Scilit]
- Crooks, G.E.; Hon, G.; Chandonia, J.M.; Brenner, S.E. WebLogo: A Sequence Logo Generator. Genome Res. 2004, 14, 1188–1190. [Google Scholar] [CrossRef] [Scilit]
- Song, G.; Yan, Y.; Guo, C.; Chen, J.; Wang, Y.; Wang, Y.; Zhang, J.; Gao, C.; Lian, J.; Piao, X.; et al. Identification and Expression Analysis of R2R3-MYB Transcription Factors Associated with Flavonoid Biosynthesis in Panax quinquefolius. Int. J. Mol. Sci. 2024, 25, 3709. [Google Scholar] [CrossRef] [Scilit]
- Vergish, S.; Wolf, R.; Song, W.Y. Simplified Protocol to Demonstrate Gene Expression in Nicotiana benthamiana Using an Agrobacterium-Mediated Transient Assay. Bio-Protoc. 2024, 14, e4987. [Google Scholar] [CrossRef] [Scilit]
- Meng, X.; Feng, C.; Chen, Z.; Shah, F.A.; Zhao, Y.; Fei, Y.; Zhao, H.; Ren, J. Genome-wide analyses of the NAC transcription factor gene family in Acer palmatum provide valuable insights into the natural process of leaf senescence. PeerJ 2025, 13, e18817. [Google Scholar] [CrossRef] [Scilit]
- Shen, S.; Zhang, Q.; Shi, Y.; Sun, Z.; Zhang, Q.; Hou, S.; Wu, R.; Jiang, L.; Zhao, X.; Guo, Y. Genome-wide analysis of the NAC domain transcription factor gene family in Theobroma cacao. Genes 2019, 11, 35. [Google Scholar] [CrossRef] [Scilit]
- Li, W.; Li, X.; Chao, J.; Zhang, Z.; Wang, W.; Guo, Y. NAC Family Transcription Factors in Tobacco and Their Potential Role in Regulating Leaf Senescence. Front. Plant Sci. 2018, 9, 1900. [Google Scholar] [CrossRef] [Scilit]
- Li, F.; Guo, X.; Liu, J.; Zhou, F.; Liu, W.; Wu, J.; Zhang, H.; Cao, H.; Su, H.; Wen, R. Genome-Wide Identification, Characterization, and Expression Analysis of the NAC Transcription Factor in Chenopodium quinoa. Genes 2019, 10, 500. [Google Scholar] [CrossRef] [Scilit]
- Singh, A.K.; Sharma, V.; Pal, A.K.; Acharya, V.; Ahuja, P.S. Genome-wide organization and expression profiling of the NAC transcription factor family in potato (Solanum tuberosum L.). DNA Res. 2013, 20, 403–423. [Google Scholar] [CrossRef] [Scilit]
- Hu, R.; Qi, G.; Kong, Y.; Kong, D.; Gao, Q.; Zhou, G. Comprehensive analysis of the NAC domain transcription factor gene family in Populus trichocarpa. BMC Plant Biol. 2010, 10, 145. [Google Scholar] [CrossRef] [Scilit]
- He, L.; Xu, J.; Wang, Y.; Yang, K. Transcription Factor ANAC074 Binds to NRS1, NRS2, or MybSt1 Element in Addition to the NACRS to Regulate Gene Expression. Int. J. Mol. Sci. 2018, 19, 3271. [Google Scholar] [CrossRef] [Scilit]
- Xu, J.; Huang, X.; Chen, J.; Shen, Q.; Hu, R.; Wang, P.; Yan, Y.; Di, P. Establishment of hairy roots culture of Perilla frutescens L. and production of phenolic acids. Med. Plant Biol. 2025, 4, e018. [Google Scholar] [CrossRef] [Scilit]
- Wang, L.; Zhao, S.-J.; Cao, H.-J.; Sun, Y. The isolation and characterization of dammarenediol synthase gene from Panax quinquefolius and its heterologous co-expression with cytochrome P450 gene PqD12H in yeast. Funct. Integr. Genom. 2014, 14, 545–557. [Google Scholar] [CrossRef] [Scilit]
- Yao, L.; Wang, J.; Sun, J.; He, J.; Paek, K.-Y.; Park, S.-Y.; Huang, L.; Gao, W. A WRKY transcription factor, PgWRKY4X, positively regulates ginsenoside biosynthesis by activating squalene epoxidase transcription in Panax ginseng. Ind. Crops Prod. 2020, 154, 112671. [Google Scholar] [CrossRef] [Scilit]
- Huang, Y.; Shi, Y.; Hu, X.; Zhang, X.; Wang, X.; Liu, S.; He, G.; An, K.; Guan, F.; Zheng, Y.; et al. PnNAC2 promotes the biosynthesis of Panax notoginseng saponins and induces early flowering. Plant Cell Rep. 2024, 43, 73. [Google Scholar] [CrossRef] [Scilit]
- Zhang, X.; Huang, Y.; Shi, Y.; Wang, X.; Chen, W.; Amu, L.; Wang, B.; Peng, Z.; Wang, X.; Wei, S. PnNAC03 from Panax notoginseng functions in positively regulating saponins and lignin biosynthesis during cell wall formation. Plant Cell Rep. 2025, 44, 63. [Google Scholar] [CrossRef] [Scilit]
- Hellens, R.P.; Allan, A.C.; Friel, E.N.; Bolitho, K.; Grafton, K.; Templeton, M.D.; Karunairetnam, S.; Gleave, A.P.; Laing, W.A. Transient expression vectors for functional genomics, quantification of promoter activity and RNA silencing in plants. Plant Methods 2005, 1, 13. [Google Scholar] [CrossRef] [Scilit]
Disclaimer/Publisher’s Note: The statements, opinions and data contained in all publications are solely those of the individual author(s) and contributor(s) and not of MDPI and/or the editor(s). MDPI and/or the editor(s) disclaim responsibility for any injury to people or property resulting from any ideas, methods, instructions or products referred to in the content. |
© 2026 by the authors. Licensee MDPI, Basel, Switzerland. This article is an open access article distributed under the terms and conditions of the Creative Commons Attribution (CC BY) license.