


Abstract
This review examined machine learning applications to adolescent sports injury prediction. Six databases were searched on 25 May 2026 for publications from January 2021 onward involving participants aged 10–19 years. Two reviewers independently screened studies. Methodological appraisal was conducted using PROBAST+AI, design-specific JBI checklists, or QualSyst, with one reviewer conducting the assessments and the other verifying them. Findings were synthesized narratively. Thirty reports representing 29 studies covered injury prediction, clinical and surrogate outcomes, biomechanical classification, and monitoring or exploratory applications. Thirteen reports provided ROC-AUC values of 0.58–0.94; sensitivity/recall for injury occurrence or recurrence ranged from 25.0% to 94.3%. Features included maturation, anthropometry, clinical history, neuromuscular performance, biomechanics, physiological and metabolic markers, training load, and psychological and sleep-related measures. Among 14 PROBAST+AI reports, performance-related risk of bias was high in 4 and unclear in 10. JBI assessments identified methodological concerns; nine QualSyst scores ranged from 0.50 to 0.80, with one report unscored owing to indeterminate criterion applicability. Evidence is insufficient to establish the generalizability of machine-learning performance because of high or unclear risk of bias and limited external validation. Addressing these limitations may support the future use of machine learning in sports injury risk prediction among adolescents. The review was prospectively registered with OSF (PYE97) and received no external funding.
1. Introduction
1.1. Sports Injury Risk During Adolescence
Peak height velocity (PHV) is an important physiological milestone during growth and development in children and adolescents, occurring at approximately 13–15 years in boys and 11–13 years in girls. During this period, differences in tissue growth rates, with skeletal growth outpacing muscle and tendon development, are accompanied by substantial changes in joint range of motion, center of mass, and movement patterns [1,2]. Muscle strength may not adapt in parallel with rapid skeletal growth, potentially reducing joint stability and motor control [3] and increasing sports injury risk during adolescence.
A 1-year prospective study of 103 schoolgirls aged 12–15 years (mean age = 14.0 ± 0.6 years) reported that approximately 21% experienced an injury during physical education or sports training in any given week, with an overall injury rate of 10.4 injuries per 1000 exposure hours. Overuse injuries were more common than acute injuries, and acute injuries predominantly involved the ankle and knee, identifying the lower extremities as the principal high-risk region [4]. Another prospective study followed 178 male track-and-field athletes aged 12–18 years (mean age = 14.9 ± 1.8 years) across five seasons. At least one time-loss injury occurred in more than half of athlete-seasons, and the overall injury incidence was 4.0 injuries per 1000 training or competition exposures. Approximately 70% of injuries involved the lower extremities, predominantly thigh muscle strains and stress fractures, with distinct injury patterns across sprinting, jumping, endurance, and throwing events [5].
Participation in competitive sport during adolescence offers health and performance benefits but is also accompanied by a substantial risk of sports injury. In a study of 498 athletes aged 14–21 years, including adolescents, 40.4% sustained an injury and the injury recurrence rate was 39%, indicating a substantial burden of recurrent injury in this population. Injury risk differed significantly by sport, with the highest injury rate observed in soccer (7.21 injuries per 1000 h). Injuries involved the ankle (36.1%), knee (19.3%), and shoulder (6.5%), and nearly 60% (59.3%) occurred during training. Risk factors were categorized as intrinsic, including the 14–17-year age range and inadequate physical preparation, or extrinsic, including excessive weekly training duration, insufficient warm-up, poor playing surfaces, inappropriate training load, inadequate preventive measures, and a lack of qualified coaching supervision [6]. Sport-specific demands and individual differences in movement patterns, muscle recruitment, and developmental stage complicate injury-risk prediction for coaches and sport science teams [7]. Understanding injury risk factors and informing prevention are therefore important for sustained participation and athletic development.
Conventional statistical methods are well suited to examining prespecified associations between variables and injury risk. However, model specification and interpretation can become challenging when sports injury data include numerous predictors, nonlinear relationships, and high-dimensional features. These characteristics may limit predictive performance in some settings and motivate evaluation of more flexible modeling approaches for adolescent injury-risk assessment.
1.2. Conventional Assessment Methods and Their Limitations
Conventional statistical methods are widely used in medicine and health research to develop individualized prediction models. Depending on the outcome type, common approaches include linear regression for continuous outcomes, logistic regression for binary outcomes, and Cox proportional hazards models for time-to-event outcomes. Linear regression can be used to model continuous outcomes and estimate associations between predictors and the outcome, but reliable model development depends on data quality and appropriate model specification [8]. Logistic regression is commonly used for binary outcomes, whereas Cox proportional hazards models incorporate time-to-event information in survival analysis [9].
For injury prediction, a central methodological concern is whether the available sample size and number of injury events are sufficient for the intended model complexity. Insufficient data can increase overfitting and produce overly optimistic estimates of predictive performance [10]. For binary outcomes, a fixed events-per-variable threshold does not provide a universal basis for determining sample-size adequacy. Model development should instead consider the total sample size, event proportion, number of candidate predictor parameters, and anticipated model performance [11].
Model specification becomes more challenging when candidate predictors involve complex nonlinear relationships and interactions. Machine-learning methods offer greater modeling flexibility through data-driven algorithms that can capture nonlinear relationships and complex feature patterns. In high-dimensional settings, regularization adds a penalty to the loss function to constrain model complexity and reduce sensitivity to chance characteristics of individual samples, which may improve generalization to unseen data [12]. Ensemble learning combines multiple base models and can reduce the error or variance of individual models [13]. Machine learning may therefore complement conventional statistical approaches when integrating complex and multidimensional features in adolescent sports injury prediction models.
1.3. Applications of Machine Learning to Sports Injury Prediction
One potential advantage of machine learning in sport science is its capacity to model heterogeneous, high-dimensional feature sets. In a study of lower-extremity muscle strains in National Basketball Association (NBA) players, historical injury records and multidimensional game statistics from more than 2100 players were combined. The extreme gradient boosting (XGBoost) model showed better overall discrimination than conventional logistic regression, with an area under the receiver operating characteristic curve (ROC-AUC) of 0.84 [14]. Machine learning has also been applied to high-frequency sports monitoring data. A study using global positioning system (GPS) data from professional soccer players in Italy developed a decision-tree injury forecasting model from 55 candidate features. The model achieved a recall of 0.80 and a precision of 0.50 under the study’s evaluation procedure [15].
Beyond predictive performance, machine-learning models can identify features that contribute to model predictions. In the soccer study, the final model selected three features: an exponentially weighted previous-injury indicator, the exponentially weighted moving average of high-speed-running distance, and the monotony of total distance [15]. These findings illustrate how injury history and longitudinal workload measures can be incorporated into prediction models. However, model-selected features do not establish causal effects, and their relevance to adolescent injury prediction requires evaluation in adolescent populations.
Soccer has been one of the most frequently studied sports in machine-learning research on sports injury prediction. Ensemble methods such as random forest and XGBoost have been widely used to model high-dimensional and nonlinear data, with reported ROC-AUC values of approximately 0.70 in some sports injury prediction studies [16]. Machine learning has also been applied extensively to injury-risk prediction in professional athletes. Model performance nevertheless varies across sports, data sources, and training contexts, while the distinctive growth, developmental, and training characteristics of adolescents introduce additional methodological challenges. Evidence focused specifically on machine-learning applications to adolescent sports injury prediction remains fragmented across data sources, modeling approaches, validation procedures, and performance metrics. This systematic review therefore examined machine-learning applications to adolescent sports injury prediction and characterized the modeling approaches, validation procedures, predictive performance, and important predictors or features reported across studies. Three research questions were addressed: (1) In which sports has machine learning been applied to adolescent sports injury prediction, risk assessment, prevention, or injury-related outcomes? (2) What predictive performance and validation procedures have been reported for machine-learning models used in adolescent sports injury prediction and risk assessment? (3) Which predictors or features have been used or identified as important in machine-learning models for adolescent sports injury prediction, risk assessment, and injury-related outcomes?
The findings are intended to inform coaches and sport science teams about methodological considerations in injury-prediction model development and candidate feature domains. The synthesis may also help practitioners interpret reported model performance in relation to validation design and data characteristics. For researchers, this review identifies methodological characteristics and evidence gaps in machine-learning applications to adolescent sports injury prediction that may inform future model development and study design.
2. Methods
2.1. Review Design, Registration, and Protocol
This systematic review was reported in accordance with the Preferred Reporting Items for Systematic Reviews and Meta-Analyses 2020 (PRISMA 2020) statement [17], and the completed checklist is provided in Supplementary File S1. The review protocol was prospectively registered with the Open Science Framework (OSF; PYE97; DOI: 10.17605/OSF.IO/PYE97) on 6 June 2025. Methodological amendments made after registration, including their timing, rationale, and implications for the review procedures, are documented in Supplementary Table S2.
2.2. Search Strategy
The literature search was conducted on 25 May 2026 across six databases: PubMed, Scopus, Web of Science, Embase, IEEE Xplore, and the ACM Digital Library. The review targeted studies published between 1 January 2021 and 25 May 2026, focusing on recent applications of machine learning to adolescent sports injury prediction. Date restrictions differed across databases. PubMed, Web of Science, IEEE Xplore, and the ACM Digital Library used publication-date filters, with Web of Science applying the Date of Publication field. Scopus used the original record-loading date, whereas Embase combined a publication-year restriction with database entry-date restrictions. Consequently, the date restrictions applied across the six databases were not uniformly based on publication dates. No additional date restrictions were specified for first-online publication, online-ahead-of-print publication, or issue-assignment dates. No language or document-type filters were applied during the database searches; eligibility based on language and document type was assessed during study screening. The search strategy comprised three concept groups: (1) machine-learning and artificial intelligence methods; (2) athletes or sport participants; and (3) sports injury, injury risk, injury prevention, and injury prediction. Synonyms within each concept group were combined using OR, and the three concept groups were combined using AND. Search syntax was adapted to the indexing rules, field codes, and search restrictions of each database. A more concise strategy was used for IEEE Xplore because the platform limits the number of terms and Boolean operators permitted in a single search. Complete search strategies, search dates, field restrictions, filters, and retrieval counts for each database are provided in Supplementary Table S1. All records were imported into Rayyan (web-based platform; accessed on 25 May 2026), which was used for automated duplicate detection and review management; no automated eligibility decisions were made.
2.3. Eligibility Criteria and Study Selection
Two reviewers independently screened titles/abstracts and full texts in Rayyan, with decisions concealed until both assessments were completed. Disagreements were resolved through discussion or consultation with a third reviewer. Unavailable full texts were sought via DOI links or publisher webpages, Google Scholar, ResearchGate, and institutional library resources. Study authors were not contacted. Multiple reports arising from the same underlying cohort or dataset were retained as separate reports when they provided distinct analyses or outcomes, but were linked and treated as a single study for study-level counts.
Studies were eligible if they (1) were written in English; (2) were published as peer-reviewed original research articles or conference proceedings; (3) used data collected from adolescent athletes and sport participants aged 10–19 years; (4) explicitly described and applied machine-learning methods; and (5) examined outcomes related to the prediction, risk identification, or prevention of adolescent sports injuries. Studies were excluded if their model inputs relied primarily on medical imaging or data requiring specialized clinical diagnostic procedures. Studies were eligible only if all participants were aged 10–19 years; mixed-age samples including participants outside this range were excluded.
Studies relying primarily on medical imaging or data obtained through specialized clinical diagnostic procedures were excluded because this review focused on monitoring and assessment information that coaches and sport science teams could obtain or use in sports settings. Clinical symptoms, injury and medical history, questionnaire-based assessments, and routine physiological or biochemical monitoring data were not excluded on this basis. Studies excluded after full-text assessment and their primary reasons for exclusion are provided in Supplementary Table S3.
2.4. Data Extraction and Performance Metrics
One reviewer extracted data from all included reports, and a second reviewer independently verified the extracted information for accuracy regarding study characteristics, model information, validation procedures, and performance metrics. Disagreements were resolved through discussion and, when consensus could not be reached, consultation with a third reviewer. Extracted data included (1) basic study information, including authors and publication year; (2) participant characteristics, including sport, sample size, age, and reported sex information; (3) prediction tasks and outcomes, including injury type, injury risk, and other injury-related outcomes; (4) model information, including statistical or machine-learning methods, within-study model comparisons, the principal performance results reported for each model, and any primary or final model explicitly designated by the original study; (5) validation methods, including training/test splits, cross-validation, nested cross-validation, and other procedures; and (6) performance metrics, including ROC-AUC, sensitivity, specificity, precision, recall, F1-score, accuracy, and other relevant metrics reported in each study. For classification tasks, outcome-class definitions and class counts or proportions were also extracted when reported, with the corresponding analytical units and datasets identified. Unreported study information was recorded as not reported (NR), and study authors were not contacted for clarification. Performance metrics were reproduced as reported in the original studies. When the curve type was not explicitly specified, the original designation AUC was retained. When numerical discrepancies occurred within an article, values reported in tables or figures were prioritized over those in the narrative text, abstract, or conclusion.
For binary classification models, ROC-AUC was used as a principal measure of discrimination when reported. ROC-AUC reflects the ability to distinguish positive from negative cases across classification thresholds, with values closer to 1 indicating better discrimination and values near 0.5 indicating performance approaching random classification [18]. Because ROC-AUC may not fully characterize class-specific performance under the circumstance of class imbalance, sensitivity/recall, specificity, precision, and F1-score were also extracted. In binary classification, sensitivity/recall is the proportion of actual positive cases correctly identified as positive; specificity is the proportion of actual negative cases correctly identified as negative; precision is the proportion of predicted positive cases that are actually positive; and F1-score summarizes the balance between precision and recall [19]. The positive class was defined according to the prediction target in the original study. For studies predicting incident or recurrent injury, it represented participants who sustained an injury or injury events; for other studies, it followed the definition of the specific outcome.
For the purposes of this review, injury-related outcomes included direct injury events and surrogate or monitoring outcomes only when the original study explicitly linked the machine-learning application to injury-risk identification, prevention, or management. Multiple reports from the same cohort or dataset were treated separately. When a study included multiple independent cohorts or datasets, participant characteristics and analytical purposes were extracted separately for each source. Model performance was attributed only to the dataset used for model development or validation. Different cohorts, datasets, or units of analysis were not directly combined.
2.5. Data Synthesis
A narrative synthesis was conducted because the included studies differed in sport, participant characteristics, injury outcome definitions, predictors, algorithms, performance metrics, and validation procedures, and no common-effect measure could be pooled directly across collected studies. No meta-analysis was performed. For descriptive synthesis, the included reports were grouped into three overarching domains and six subcategories based on their research goals: (A) injury and clinical outcomes, comprising (A1) prospective injury occurrence or recurrence and (A2) clinical diagnosis, recovery, or symptom profiling; (B) surrogate and biomechanical outcomes, comprising (B1) risk-status or surrogate-outcome classification and (B2) biomechanical or movement detection, classification, and profiling; and (C) monitoring and exploratory applications, comprising (C1) training-load and fatigue monitoring and (C2) exploratory injury-related analysis or decision support. Reports addressing multiple tasks were categorized according to their primary analytical objectives. These categories were used to organize Table 1 and distinguish differences in research objectives and outcomes. Findings were organized around the research questions, covering sports and participant characteristics, model types and validation strategies, and the main predictor domains. Model performance was summarized at the report level using the extracted metrics. When the same algorithm and performance metric were reported in multiple studies, individual results and observed ranges were presented without calculating cross-study means or pooled estimates. For studies comparing multiple models, the principal performance results reported for each model were retained, and any primary or final model explicitly designated by the original study was recorded. Results were reported separately when performance differed across metrics, data-processing approaches, validation datasets, or validation stages, without assigning an additional single best model. Because prediction targets, validation procedures, and class distributions differed across studies, performance estimates were summarized descriptively and were not interpreted as direct head-to-head comparisons. Models were therefore not ranked across studies. Validation methods were categorized as cross-validation, holdout validation, other procedures, or unclearly reported procedures. Given the methodological heterogeneity and absence of meta-analysis, reporting bias was not quantitatively assessed using funnel plots or related statistical tests, and certainty of the overall evidence was not assessed using GRADE or another formal framework.
2.6. Methodological Quality and Risk-of-Bias Assessment
Appraisal tools were selected according to the design and analytical purpose of the assessed study component. PROBAST+AI was used to assess selected diagnostic or prognostic prediction-model components, with separate judgments for model development quality and risk of bias in performance estimates [20]. Design-specific JBI checklists were used for analytical cross-sectional [21], cohort [22], and quasi-experimental [23] components. The quantitative QualSyst checklist was used to assess general methodological quality in the remaining reports [24]. For reports containing multiple models, tasks, or validation stages, assessments were restricted to the components specified in Table 1 and were not automatically extended to all reported analyses.
For PROBAST+AI, domain-level and overall judgments were recorded separately for model development and performance evaluation, with supporting reasons across the participants and data sources, predictors, outcome, and analysis domains [20]. Unclear judgments indicated that the available full texts and Supplementary Materials provided insufficient methodological information to determine the level of concern about development quality or risk of bias in performance estimates. JBI findings were reported by methodological aspect without calculating an overall score. QualSyst items were scored as yes (2), partial (1), or no (0), with non-applicable items excluded from the denominator. The standardized score was calculated by dividing the total score obtained by twice the number of applicable items [24]. A summary score was not calculated when item applicability could not be established. Findings from different tools were interpreted separately and were not combined into a common quality ranking.
One reviewer conducted the initial assessments, and a second reviewer checked all item-level responses, supporting evidence, scores, and domain-level and overall judgments, as applicable. Disagreements were resolved through discussion, with a third reviewer consulted when necessary. Final assessments and their supporting reasons were agreed upon by consensus.
3. Results
3.1. Search Results
The searches identified 10,789 records: 1714 from PubMed, 379 from Web of Science, 3680 from Scopus, 4430 from Embase, 558 from IEEE Xplore, and 28 from the ACM Digital Library. After 4214 duplicates were removed, 6575 records underwent title and abstract screening, and 6373 were excluded because they did not meet the eligibility criteria. Full texts were sought for 202 reports, of which 2 could not be retrieved. The remaining 200 reports underwent full-text assessment. Exclusions comprised reports not written in English (n = 3), reports that were not peer-reviewed original research articles or conference proceedings (n = 4), studies whose data were not collected exclusively from adolescent athletes and sport participants aged 10–19 years (n = 157), studies that did not use machine-learning methods (n = 1), and studies whose outcomes were unrelated to the prediction, risk identification, or prevention of adolescent sports injuries (n = 5). Thirty reports representing 29 unique studies were included in the review. The study selection process is presented in Figure 1.
Figure 1.
PRISMA 2020 flow diagram of the study selection process.
3.2. Methodological Quality and Risk-of-Bias of Included Reports
The 30 included reports were assessed using PROBAST+AI (14 reports), design-specific JBI checklists (6 reports), or QualSyst (10 reports), according to the assessed study component (Table 1). Among the 14 reports assessed using PROBAST+AI, concerns about model development quality were rated high in 10 (71.4%) and unclear in 4 (28.6%). Risk of bias in the selected model performance estimates was rated high in 4 reports (28.6%) and unclear in 10 (71.4%).
Table 1.
Methodological quality and risk-of-bias assessment of the included reports.
Analysis-domain concerns primarily involved sample-size adequacy, handling of missing data and repeated observations, separation of preprocessing and model tuning from performance evaluation, and correction for optimism. Development quality concerns included limited numbers of independent participants or outcome events relative to the number of candidate predictors and model complexity [25,26]. High risk of bias in performance estimates arose from model fitting or selection and performance evaluation using the same data without adequate correction for optimism [27,28], participant exclusions based on outcomes observed during follow-up [29], or inadequate handling of unequal follow-up durations [30]. Unclear judgments reflected insufficient information about whether preprocessing was restricted to training data, whether tuning was separated from performance evaluation, how repeated observations or missing data were handled, and how outcomes were timed or ascertained. The specific information gaps supporting these judgments are detailed in Table 1.
Among reports assessed using JBI checklists, methodological concerns included inadequate confounding control, uncertainty about measurement validity or follow-up completeness, insufficiently addressed dependence between repeated observations, and limitations in control groups or measurement schedules. Findings were reported by methodological aspect without calculating an overall score. Among the 10 reports assessed using QualSyst, 9 had standardized scores ranging from 0.50 to 0.80. Limitations concerned sample adequacy, analytical procedures, and the reporting of variability in the principal results. One report did not receive a summary score because the applicability of four criteria could not be established from the available information [45].
Report-specific judgments and their supporting reasons are presented in Table 1. Results from the three appraisal tools were interpreted separately because they assess different methodological constructs.
3.3. Characteristics of the Included Studies
The 30 included reports are summarized in Table 2, which presents study and participant characteristics, research task categories, models or algorithms, validation strategies, and reported predictive performance. Based on their primary research tasks, the reports were organized into six subcategories across three overarching domains: (A1) prospective injury occurrence or recurrence (n = 9); (A2) clinical diagnosis, recovery, or symptom profiling (n = 4); (B1) risk-status or surrogate-outcome classification (n = 3); (B2) biomechanical or movement detection, classification, and profiling (n = 6); (C1) training-load and fatigue monitoring (n = 4); and (C2) exploratory injury-related analysis or decision support (n = 4). Two reports by Kolodziej et al. [27,31] were derived from the same 2018–2019 youth soccer cohort but employed different modeling approaches. These reports were retained separately for descriptive synthesis and counted as one underlying study when determining the number of unique studies.
Table 2.
Characteristics, validation strategies, and reported performance of included reports.
3.3.1. In Which Sports Has Machine Learning Been Applied to Adolescent Sports Injury Prediction, Risk Assessment, Prevention, or Injury-Related Outcomes?
The 30 included reports covered different units of analysis, including individual participants, repeated observations, movement trials, video clips, and sweat samples (Table 2). Several studies did not fully specify the number of unique participants. Therefore, counts based on different analytical units were not summed, and no overall mean age or sex distribution was calculated across the included reports (Table 2). Among reports explicitly identifying the sport, soccer was the most common setting (n = 12), followed by basketball (n = 5). Other sports included ice hockey (n = 1), swimming (n = 1), badminton (n = 1), baseball (n = 1), soft tennis (n = 1), table tennis (n = 1), and track and field (n = 1). Reports also included multisport or mixed-sport populations (n = 4), a clinical cohort after anterior cruciate ligament (ACL) reconstruction (n = 1), and school physical education (n = 1). One report did not explicitly identify the sport (n = 1). Sport categories were not mutually exclusive for reports involving more than one sport; therefore, category counts should not be summed to derive the total number of included reports.
Participants represented a broad range of competitive levels, including national teams and national development programs, professional club youth academies, regional or subelite competitors, high school and school teams, nonprofessional sport participants, and physical education students. Representative samples included elite youth soccer players from Europe and Korea, participants in Malaysia’s national football development program, the Italian U14 national women’s basketball team, the Fujian provincial youth women’s basketball team, and high school soft tennis players competing at the national level.
3.3.2. Predictive Performance and Validation Methods in Adolescent Sports Injury Research
Of the 30 included reports, 13 reported ROC-AUC for at least one model (Table 2). Among these, five addressed prospective injury occurrence or recurrence (A1), four examined clinical diagnosis, recovery, or symptom profiling (A2), one focused on risk-status or surrogate-outcome classification (B1), and three investigated biomechanical or movement-related outcomes (B2). Reported ROC-AUC values ranged from approximately 0.58 to 0.94 across these heterogeneous tasks. Within A1, ROC-AUC values ranged from 0.58 to 0.859 [26,28,29,31,34], although the lowest value was reported for a nonathlete subgroup [29]. Values ranged from 0.70 to 0.81 in A2 [35,36,38,42], from 0.89 to 0.94 across different validation stages in B1 [33], and from 0.81 to 0.91 in B2 [48,51,54]. One additional report provided AUC values of 0.94395–0.97395 without explicitly specifying the curve type [32]. These values were retained as AUC and excluded from the ROC-AUC ranges. These ranges represent heterogeneous outcomes, including incident injury, recurrent injury, recovery time, injury-risk classification, biomechanical surrogate outcomes, and other injury-related outcomes, and should not be interpreted as direct comparisons between algorithms.
Several studies also reported threshold-dependent metrics, including sensitivity, recall, specificity, precision, and F1-score. Among reports predicting incident or recurrent injury (A1), sensitivity/recall ranged from approximately 25.0% to 94.3%. Reported recall values were 25.0% [25], 87.0% [26], and 55.0% [34]; a true-positive rate of 53.7% was also reported [28], and sensitivity reached 94.3% in a holdout sample [30]. Precision was reported less consistently, with values of 11.1% [25], 21.0% [34], and 63.6% [26]. These findings indicate substantial variation in the identification of positive injury events and in the precision of positive predictions. However, differences in injury definitions, event proportions, prediction windows, classification thresholds, class-balancing methods, and validation procedures preclude direct cross-study model rankings.
Additional findings were reported using alternative performance metrics or descriptive analyses. In B1, Marin-Puyalto et al. [37] reported a classification accuracy of 0.74 for low bone mineral density risk, whereas Taborri et al. [47] reported an accuracy of 0.95 and an F1-score of 0.96 for LESS-based ACL injury-risk classification. Within B2, studies reported physical-contact event detection (PR-AUC = 0.51) [53], throwing-action identification and intensity classification [49], and clustering of landing-force waveforms [43].
No reports in the training-load and fatigue monitoring (C1) or exploratory injury-related analysis and decision-support (C2) categories provided AUC values. Within C1, reported findings included improvements in training-load prediction accuracy and overload-warning sensitivity [45], descriptive fatigue-response clusters [41], regression performance for post-match perceived exertion (R2 = 0.95, MAE = 0.07, and RMSE = 0.26) [50], and classification accuracy following feature selection (random forest = 0.87; decision tree = 0.85) [52]. Within C2, studies reported associations of previous-injury risk clusters with subsequent training and injury outcomes [44], associations between physical-fitness clusters and injury regions [39], metabolomic pattern classification (PLS-DA accuracy = 0.68) [40], or changes in training-related performance and injury-risk scores relative to comparator models [46].
Validation strategy was an important consideration when interpreting predictive performance. The included reports used holdout validation, stratified k-fold cross-validation, repeated cross-validation, leave-one-out cross-validation (LOOCV), nested cross-validation, and temporal or external validation. Some exploratory and unsupervised analyses did not report conventional predictive-validation procedures. For datasets with low proportions of injury events, some studies used stratified cross-validation to maintain class distributions across folds [26,28,34]. Repeated cross-validation was used to evaluate models across different data partitions to reduce dependence on a single random split and characterize variation in performance across partitions [26,28,34].
Some studies additionally used LOOCV or nested cross-validation. LOOCV was reported by Kolodziej et al. [31]. Nested cross-validation separates model or hyperparameter selection from outer-loop performance evaluation. In the included studies, hyperparameter optimization or feature selection was generally performed in the inner loop, whereas performance was evaluated in the outer loop on data not used for tuning, helping to reduce optimism associated with model selection and parameter tuning [29,42]. These procedures primarily provide internal validation evidence and do not directly establish generalizability across populations, time periods, or application settings.
The importance of validation beyond model development was illustrated by a study with multiple levels of validation. The ROC-AUC of a random forest model for overtraining-risk classification declined from 0.94 in internal validation to 0.91 in temporal validation and 0.89 in an external youth academy sample [33]. Performance obtained through internal validation may therefore not be fully maintained in data from different periods or populations. Model performance should be interpreted alongside the level of validation, and independent temporal or external validation remains important for assessing generalizability and practical applicability.
3.3.3. Important Predictors and Features in Adolescent Sports Injury Prediction
Key predictors and features identified in the 30 included reports were grouped into six domains (Table 3). Demographic, maturation, and anthropometric characteristics included age, sex, body mass index (BMI), height, maturity status, and body-fat-related features in specific populations [29,34,36,37]. Clinical symptoms and injury history included concussion mechanism, headache/migraine history, initial concussion symptom burden, time to presentation, history of concussion, Sport Concussion Assessment Tool, 5th Edition (SCAT5) symptom severity, anxiety- and depression-related measures, sleep quality, symptom-onset timing, and previous low back pain [35,36,38]. Neuromuscular and physical performance features included agility and speed performance and countermovement-jump indicators of neuromuscular fatigue [26,34]. Additional features included center-of-pressure sway, knee-flexor and knee-extensor peak torque, functional knee strength ratio, unstable-platform displacement path, handgrip strength, and selected balance and functional fitness tests [27,31,37,50].
Table 3.
Key predictors and features in machine-learning models for adolescent sports injury prediction, risk assessment, and injury-related outcomes.
Biomechanical and kinematic features included medial knee displacement, hip transverse-plane moment during single-leg drop landing, dynamic knee valgus, vertical ground-reaction-force asymmetry, nondominant hip internal rotation range of motion, and balance, load-absorption, movement, and postural-angle measures [28,31,42,47,54]. Physiological, biochemical, and metabolic features included urinary ketones, urinary blood, urinary protein, changes in creatine kinase, urinary specific gravity, cell-free DNA (cfDNA), the testosterone-to-cortisol ratio, and injury-associated sweat metabolomic and free induction decay (FID) signal patterns [25,26,33,40]. Training-load, psychological, and sleep-related features included sleep quality and duration, the acute:chronic workload ratio (ACWR), session rating of perceived exertion (session-RPE), session-RPE variability, training monotony, training strain, cumulative load, recovery status, weekly training hours, stress–recovery balance, fatigue-related measures, dynamic stress load, and relative high-speed running distance [25,29,33,34,52].
The analytical roles of these features varied across research tasks. Some were used for prospective injury prediction (A1), whereas others were examined in clinical diagnosis and recovery profiling (A2), risk-status/surrogate classification (B1), biomechanical/movement classification (B2), training-load/fatigue monitoring (C1), or exploratory injury-related analysis (C2). Accordingly, feature importance should be interpreted in relation to the corresponding model targets and should not be assumed to indicate predictive value for future injury occurrence across different research tasks.
4. Discussion
This systematic review examined three main aspects of machine-learning applications in adolescent sports injury research: the approaches used, their reported predictive performance and validation procedures, and the predictors or features used or identified as important for injury prediction, risk assessment, and injury-related outcomes.
4.1. Sport-Specific Evidence in Machine Learning Applications
Soccer was the most common setting among the 30 included reports, accounting for 12 reports (40.0%), followed by basketball (n = 5), with fewer reports in other sports (Table 2). Soccer reports addressed non-contact lower-extremity injury, muscle strain, injury occurrence, and training-related risks [27,28,31,32,33,34]. Basketball reports included lower-extremity non-contact injury, ACL injury risk classification, and other injury-related monitoring or biomechanical analyses [26,43,44,47]. Machine learning was also applied in ice hockey, swimming, badminton, baseball, soft tennis, table tennis, and track and field [37,42,46,49,50,53,54]. Although machine-learning research on adolescent sports injury now spans several sports, the included evidence remains concentrated in soccer and selected team sports.
This distribution is broadly consistent with previous reviews of machine learning in sports injury research. Systematic and scoping reviews have identified soccer as one of the most frequently investigated sports in machine-learning-based injury prediction [16,55]. Previous reviews have also indicated that models are often developed within specific athlete cohorts or sport settings, with limited evidence of generalizability across populations and contexts [16,56]. The predominance of soccer in the present review is therefore consistent with the pattern observed in broader sports injury prediction research, although differences in study populations and eligibility criteria limit direct comparisons across reviews.
The concentration of research in soccer and selected team sports may partly reflect the availability of longitudinal training-monitoring data, competition-exposure data, injury records, and multidimensional athlete information [16]. Several included reports integrated training-load, physical-performance, physiological, psychological, and recovery information for modeling [25,33,34]. However, the reasons for differences in research volume across sports were not directly examined in this review. Because injury mechanisms, training exposure, monitoring practices, and available features differ across sports, a model developed in one sport should not be assumed to generalize directly to another [16,56]. Research has also extended to individual sports, school physical education, and clinical sport populations, indicating a broader range of applications.
4.2. What Predictive Performance and Validation Strategies Have Been Reported for Machine-Learning Models in Adolescent Sports Injury Prediction and Risk Assessment?
Predictive performance varied substantially across the 30 included reports. Thirteen reports provided explicitly identified ROC-AUC values ranging from 0.58 to 0.94, while one additional report provided AUC values without specifying the curve type (Table 2). However, these estimates represented different research tasks. Reports in A1 directly predicted prospective injury occurrence or recurrence, whereas those in A2, B1, and B2 examined clinical outcomes, surrogate risk status, or biomechanical and movement-related outcomes. Reports in C1 and C2 focused on monitoring or exploratory applications and did not report AUC values. Among reports predicting incident or recurrent injury (A1), sensitivity/recall ranged from approximately 25.0% to 94.3%, indicating substantial variation in the identification of positive injury events [25,26,28,30,34]. Specifically, the lowest reported ROC-AUC of 0.58 was obtained from a nonathlete subgroup [29]. These research tasks differed in the timing of their outcomes, epidemiological assumptions, and intended applications. Prospective injury prediction (A1) addressed injury occurrence or recurrence during follow-up, whereas clinical and surrogate classifications (A2 and B1) examined clinical status, recovery outcomes, or surrogate risk indicators. Biomechanical and movement-related tasks (B2) characterized movement events or biomechanical states without directly forecasting subsequent injury occurrence. Differences in prediction horizons, outcome definitions, event prevalence, reference standards, and validation procedures therefore limit the comparability of performance estimates. Accordingly, performance in surrogate or biomechanical classification should not be interpreted as evidence of prospective injury-prediction accuracy, and algorithms should not be ranked across heterogeneous research tasks using a single metric [16,56].
Adolescent sports injury datasets often contain relatively few positive events or imbalanced class distributions. Some included reports addressed these conditions using resampling, ensemble methods, or cost-sensitive learning [26,28,34]. A model combining undersampling bagging with sequential minimal optimization reported a true-positive rate of 53.7%, a true-negative rate of 73.9%, and an ROC-AUC of 0.700 [28]. A cost-sensitive neural network applied to imbalanced injury data from adolescent female basketball players achieved an ROC-AUC of 0.859, recall of 0.870, and precision of 0.636 [26]. In contrast, a random forest model using the synthetic minority over-sampling technique (SMOTE) for overtraining-risk classification reported sensitivity of 0.87 and specificity of 0.92 in internal validation [33]. However, these studies differed in research tasks, class distributions, classification thresholds, and validation procedures. Because the approaches were not directly compared under equivalent conditions, differences in predictive performance cannot be attributed to a particular class-balancing strategy based on the available evidence [26,28,33].
Performance evaluation should extend beyond ROC-AUC. Precision–recall curves describe the relationship between positive predictive value and sensitivity across decision thresholds, providing additional information when injury outcomes are imbalanced [19]. For models estimating individual injury probabilities, calibration assesses agreement between predicted risks and observed outcome frequencies [20]. Where these assessments were unavailable, discrimination metrics alone could not establish the reliability of predicted risks or justify particular thresholds for practical decisions.
Validation strategy was another important consideration when interpreting model performance. The included reports used single holdout splits, k-fold cross-validation, repeated cross-validation, LOOCV, and nested cross-validation (Table 2). Some reports used a single development/test or training/test split, such as a 200/23 development/test split or an 80/20 training/test split [36,38]. Others used 9-fold cross-validation or repeated stratified cross-validation to evaluate performance across different data partitions [26,28,47]. Nested cross-validation was used to separate model or hyperparameter selection from outer-loop performance evaluation, helping to reduce optimism associated with model selection and tuning [29,42]. These differences demonstrate substantial methodological heterogeneity in model development, tuning, and evaluation across research tasks [16,55].
When performed within the development dataset, cross-validation, including LOOCV and nested cross-validation, provides internal validation evidence. Such evaluation alone does not establish that model performance will be maintained in other populations or settings [20,55]. For example, in a study classifying overtraining risk (B1), the ROC-AUC of a random forest model decreased from 0.94 in internal validation to 0.91 in temporal validation and 0.89 in an external youth academy sample [33]. Sensitivity also decreased from 0.87 to 0.82 and specificity decreased from 0.92 to 0.88 between internal and external validation [33]. These findings illustrate that predictive performance observed during internal validation may not be fully maintained when a model is evaluated in different periods or populations. Even small reductions in classification performance may become practically relevant when models are applied to larger populations, because they can translate into greater absolute numbers of false-positive or false-negative classifications.
A further example was observed in a biomechanical event-detection study (B2), in which the MCC decreased from approximately 0.95 during internal evaluation to 0.44 when the model was evaluated using unseen full-game footage [53]. Although this evaluation did not constitute independent external-population validation, it illustrates that model performance may vary when the model is evaluated under conditions that differ from those used during model development. Together, these findings highlight the importance of evaluating predictive performance beyond internal validation while considering the specific research task, outcome definition, and evaluation setting. Evaluation using data not used for model development, including data from later periods or other populations and settings, is important for assessing whether predictive performance is maintained beyond the development sample [16,20,55].
The appraisal findings further qualify the interpretation of reported performance. High risk of bias was identified where model fitting or selection and performance evaluation used the same data without adequate correction for optimism [27,28], where participants were excluded according to outcomes observed during follow-up [29], or where unequal follow-up durations were inadequately handled [30]. These issues may distort performance estimates even when cross-validation or a holdout sample is reported. In other reports, insufficient information about preprocessing, tuning, missing data, or outcome ascertainment prevented a clear judgment about performance-related bias. Accordingly, unclear ratings should not be interpreted as evidence of low risk, and reported performance should be considered alongside the specific appraisal findings.
Overall, reported model performance varied across research tasks, outcome definitions, data structures, and validation procedures. Current evidence is insufficient to identify a single algorithm with consistently superior performance across sports or injury-related applications. Future research should prioritize task-specific performance evaluation and independent temporal or external validation, particularly for models intended to predict prospective injury occurrence or recurrence, to better establish their generalizability and practical value.
4.3. Which Predictors or Features Have Been Used or Identified as Important in Machine-Learning Models for Adolescent Sports Injury Prediction, Risk Assessment, and Injury-Related Outcomes?
The six predictor domains summarized in Table 3 illustrate the breadth of information examined in adolescent sports injury research. However, the interpretation of these features depends on their evidence roles and corresponding model targets. Features identified in prospective injury prediction (A1), such as postural control and knee strength [27,31], were evaluated in relation to subsequent injury occurrence, although the overlapping cohorts limit independent confirmation. In contrast, features associated with clinical conditions (A2), surrogate risk status (B1), biomechanical classification (B2), or training-load monitoring (C1) address different outcomes and cannot be assumed to predict future injuries [33,42,50,52,54]. Similarly, exploratory injury-related features (C2) require further validation before their predictive relevance can be established [40]. Therefore, the identification of similar feature domains across different research tasks does not necessarily indicate consistent evidence of prospective injury risk. Their potential value for injury-risk assessment should be established through task-specific evaluation and independent validation.
Maturation and anthropometric features have particular developmental relevance to injury-risk assessment in adolescents. Biological maturity, the period around PHV, and changes in body size may be associated with injury occurrence and injury burden during adolescence [3,57,58,59]. Included studies incorporated maturity status, height, BMI, or other anthropometric measures into injury-prediction models [29,34]. The predictive contributions of these measures were not consistent across studies. Maturation and anthropometric information should therefore be considered candidate features, with their incremental predictive value evaluated in specific populations and validation settings rather than assumed to improve model performance.
There was substantial overlap in the predictors and important features used or identified by conventional regression and machine-learning models. Across these reports, model inputs included injury history, physical performance, training load, fatigue, and physiological monitoring measures, although the specific inputs differed by study and prediction task [33,34,36]. These approaches differ in their modeling assumptions and flexibility, despite overlap in the predictors themselves. Conventional parametric models generally require prespecified functional forms, whereas more flexible machine-learning algorithms can accommodate high-dimensional features, nonlinear relationships, and complex interactions. However, greater model complexity does not necessarily improve predictive performance. Comparisons within individual reports showed mixed results: logistic regression achieved a higher reported AUC than SVM in one report [32], whereas random forest achieved a higher reported AUC than logistic regression in another [36].
Several included reports used or described Shapley additive explanations (SHAP) to examine feature importance across prospective injury prediction (A1), clinical recovery prediction (A2), risk-status classification (B1), and training-load monitoring (C1) [26,28,33,36,50]. These methods can help characterize the contributions of individual features to model predictions. However, feature importance is specific to the model, outcome, and data from which it is estimated and does not establish a causal relationship with injury outcomes. The appraisal findings also raise concerns about the robustness of reported feature importance. Limited independent samples, outcome-dependent participant selection, and insufficiently described preprocessing may affect which features appear important and the stability of their rankings (Table 1). These rankings therefore require confirmation in independent datasets before informing practical risk assessment. Furthermore, features identified through clinical classification, surrogate risk assessment, training-load monitoring, or exploratory analyses should not be assumed to predict subsequent injury occurrence. Important predictors and features should therefore be interpreted alongside the research task, data source, validation procedures, and existing biological evidence; feature rankings alone should not be used to infer injury mechanisms.
4.4. Limitations
This systematic review has several review-level limitations. First, eligibility was restricted to English-language studies published between 2021 and 2026 because the review was designed to synthesize approximately the preceding five years of research. Consequently, earlier studies and non-English publications may not have been captured. Second, although six databases—PubMed, Scopus, Web of Science, Embase, IEEE Xplore, and the ACM Digital Library—were searched, differences in database coverage, indexing practices, and search syntax may have influenced study retrieval. Third, the included studies were highly heterogeneous with respect to sport, participant characteristics, prediction targets, feature sources, model algorithms, validation procedures, and performance metrics. Some studies focused on actual injury events, whereas others evaluated injury-risk classification, biomechanical surrogate outcomes, recovery-related outcomes, or other injury-related endpoints. Accordingly, a narrative synthesis was undertaken rather than a meta-analysis, and pooled effect estimates or a single overall model performance estimate could not be derived. Fourth, performance metrics—including ROC-AUC, sensitivity, specificity, precision, recall, and F1-score—were not consistently reported, limiting direct comparisons across models and requiring performance to be interpreted within each study’s design and validation framework. Greater standardization of outcome definitions, data structures, and validation procedures may facilitate more robust quantitative synthesis in future reviews. Finally, different appraisal tools were used to accommodate the diverse study designs and analytical objectives. These tools assess different methodological constructs, and their results cannot be combined into a common quality ranking. General methodological checklists also provide limited coverage of task-specific issues, such as clustering stability and simulation-model validation. Incomplete reporting further limited some judgments, leaving uncertainty about specific methodological procedures.
5. Conclusions
This systematic review synthesized studies published from 2021 to 2026 on machine-learning applications to adolescent sports injury prediction, risk assessment, and injury-related outcomes. Research was concentrated in soccer and basketball, and the methods used included random forest, SVM, neural networks, decision trees, logistic regression, and other machine-learning methods. Across heterogeneous prediction and classification tasks, reported ROC-AUC values ranged from approximately 0.58 to 0.94; among studies predicting prospective injury occurrence or recurrence, sensitivity/recall ranged from approximately 25.0% to 94.3%. These performance estimates should be interpreted in relation to their specific research tasks, outcome definitions, and validation procedures. Performance in clinical, surrogate-risk, factor or biomechanical classification does not directly establish the ability to predict future injury occurrence. A single performance metric should not be used to identify a best-performing model across heterogeneous studies.
Important predictors and features spanned demographic and maturation characteristics; clinical symptoms and injury history; neuromuscular and physical performance; biomechanics and kinematics; physiological, biochemical, and metabolic markers; and training-load, psychological, and sleep-related variables. In some studies, conventional regression and machine-learning methods identified overlapping features, suggesting that the approaches can provide complementary information from different modeling perspectives. Conventional statistical models can estimate associations between predictors and outcomes and generate interpretable prediction rules, whereas machine-learning methods offer flexibility for high-dimensional features, nonlinear relationships, and complex interactions. Heterogeneous prediction targets, high or unclear risk of bias in the assessed performance estimates, and limited external validation constrain confidence in the generalizability of current findings. Methodological improvements and evaluation in independent adolescent populations are needed to establish whether machine-learning models can support sports injury risk assessment in practice.
6. Practical Applications
Coaches and sport science teams should interpret injury-risk assessment models in relation to the available data, sample size, model complexity, validation evidence, and intended use. Parsimonious statistical models may be appropriate when the number of predictors is limited and interpretability is a priority. When multidimensional or high-dimensional monitoring data are available, machine-learning methods may be evaluated for their ability to model nonlinear relationships and complex feature structures. When maturity information is available and the research question concerns developmental differences during adolescence, PHV, maturity offset, or other biological maturity indicators may be considered as candidate predictors, with their incremental predictive value and generalizability evaluated empirically. Candidate data domains may include maturation and anthropometry, injury history, neuromuscular and physical performance, biomechanics and kinematics, physiological and biochemical monitoring, metabolic markers, training load, psychological measures, and sleep-related variables. Inclusion in a final prediction model should depend on predictive contribution, data availability, and validation results.
Given current methodological concerns and limited evidence of generalizability, machine-learning models should be regarded as research tools. Their routine use to guide training participation, training modification, or competition readiness in adolescent athletes is not yet supported by sufficient evidence. Prospective, multisite validation and impact studies are needed before implementation. If supported by such evidence, model outputs could subsequently be considered alongside athlete-reported symptoms, recovery status, and assessments by sports medicine personnel as part of multidisciplinary decision-making.
Supplementary Materials
The following supporting information can be downloaded at https://www.mdpi.com/article/10.3390/life16111939/s1: Table S1, Complete Search Strategies for All Electronic Databases; Table S2, Amendments and Deviations from the Prospectively Registered OSF Protocol; Supplementary Table S3, Reports Excluded After Full-Text Assessment; Supplementary File S1, PRISMA 2020 Checklist. Reference [60] is cited in Supplementary Materials.
Author Contributions
Conceptualization, Y.-W.L. and B.-H.W.; methodology, Y.-W.L., T.-Y.H. and B.-H.W.; validation, T.-Y.H.; formal analysis, Y.-W.L.; investigation, Y.-W.L. and T.-Y.H.; data curation, Y.-W.L. and T.-Y.H.; writing—original draft preparation, Y.-W.L.; writing—review and editing, Y.-W.L., T.-Y.H. and B.-H.W.; visualization, Y.-W.L.; supervision, B.-H.W.; project administration, Y.-W.L. and B.-H.W. All authors have read and agreed to the published version of the manuscript.
Funding
This research received no external funding.
Institutional Review Board Statement
Not applicable.
Informed Consent Statement
Not applicable.
Data Availability Statement
All data supporting the findings of this systematic review are available within the article and its Supplementary Materials. Full database search strategies, search dates, search fields, restrictions, and retrieval counts are provided in Supplementary Table S1. Study-level characteristics, model performance data, predictor information, and risk-of-bias assessments are reported in Table 1, Table 2 and Table 3.
Conflicts of Interest
The authors declare no conflicts of interest.
References
- Corso, M. Developmental changes in the youth athlete: Implications for movement, skills acquisition, performance and injuries. J. Can. Chiropr. Assoc. 2018, 62, 150–160. [Google Scholar] [PubMed]
- Drnach, M.; Kreger, A.; Corliss, C.; Kocher, D. Limb length discrepancies among 8- to 12-year-old children who are developing typically. Pediatr. Phys. Ther. 2012, 24, 334–337. [Google Scholar] [CrossRef] [Scilit] [PubMed]
- Kemper, G.L.J.; Van Der Sluis, A.; Brink, M.S.; Visscher, C.; Frencken, W.G.P.; Elferink-Gemser, M.T. Anthropometric injury risk factors in elite-standard youth soccer. Int. J. Sports Med. 2015, 36, 1112–1117. [Google Scholar] [CrossRef] [Scilit] [PubMed]
- Sommerfield, L.M.; Harrison, C.B.; Whatman, C.S.; Maulder, P.S. A prospective study of sport injuries in youth females. Phys. Ther. Sport 2020, 44, 24–32. [Google Scholar] [CrossRef] [Scilit] [PubMed]
- Martínez-Silván, D.; Wik, E.H.; Alonso, J.M.; Jeanguyot, E.; Salcinovic, B.; Johnson, A.; Cardinale, M. Injury characteristics in male youth athletics: A five-season prospective study in a full-time sports academy. Br. J. Sports Med. 2021, 55, 954–960. [Google Scholar] [CrossRef] [Scilit] [PubMed]
- Prieto-González, P.; Martínez-Castillo, J.L.; Fernández-Galván, L.M.; Casado, A.; Soporki, S.; Sánchez-Infante, J. Epidemiology of sports-related injuries and associated risk factors in adolescent athletes: An injury surveillance. Int. J. Environ. Res. Public Health 2021, 18, 4857. [Google Scholar] [CrossRef] [Scilit] [PubMed]
- Field, A.E.; Tepolt, F.A.; Yang, D.S.; Kocher, M.S. Injury risk associated with sports specialization and activity volume in youth. Orthop. J. Sports Med. 2019, 7, 2325967119870124. [Google Scholar] [CrossRef] [Scilit] [PubMed]
- Riley, R.D.; Snell, K.I.; Ensor, J.; Burke, D.L.; Harrell, F.E., Jr.; Moons, K.G.; Collins, G.S. Minimum sample size for developing a multivariable prediction model: Part I—Continuous outcomes. Stat. Med. 2019, 38, 1262–1275. [Google Scholar] [CrossRef] [Scilit] [PubMed]
- Riley, R.D.; Snell, K.I.; Ensor, J.; Burke, D.L.; Harrell, F.E., Jr.; Moons, K.G.; Collins, G.S. Minimum sample size for developing a multivariable prediction model: Part II—Binary and time-to-event outcomes. Stat. Med. 2019, 38, 1276–1296. [Google Scholar] [CrossRef] [Scilit] [PubMed]
- Jenkins, D.G.; Quintana-Ascencio, P.F. A solution to minimum sample size for regressions. PLoS ONE 2020, 15, 0229345. [Google Scholar] [CrossRef] [Scilit] [PubMed]
- Van Smeden, M.; Moons, K.G.; de Groot, J.A.; Collins, G.S.; Altman, D.G.; Eijkemans, M.J.; Reitsma, J.B. Sample size for binary logistic prediction models: Beyond events per variable criteria. Stat. Methods Med. Res. 2019, 28, 2455–2474. [Google Scholar] [CrossRef] [Scilit] [PubMed]
- Tian, Y.; Zhang, Y. A comprehensive survey on regularization strategies in machine learning. Inf. Fusion 2022, 80, 146–166. [Google Scholar] [CrossRef] [Scilit]
- Sagi, O.; Rokach, L. Ensemble learning: A survey. WIREs Data Min. Knowl. Discov. 2018, 8, 1249. [Google Scholar] [CrossRef] [Scilit]
- Lu, Y.; Pareek, A.; Lavoie-Gagne, O.Z.; Forlenza, E.M.; Patel, B.H.; Reinholz, A.K.; Forsythe, B.; Camp, C.L. Machine learning for predicting lower extremity muscle strain in National Basketball Association athletes. Orthop. J. Sports Med. 2022, 10, 23259671221111742. [Google Scholar] [CrossRef] [Scilit] [PubMed]
- Rossi, A.; Pappalardo, L.; Cintia, P.; Iaia, F.M.; Fernández, J.; Medina, D. Effective injury forecasting in soccer with GPS training data and machine learning. PLoS ONE 2018, 13, 0201264. [Google Scholar] [CrossRef] [Scilit] [PubMed]
- Leckey, C.; Van Dyk, N.; Doherty, C.; Lawlor, A.; Delahunt, E. Machine learning approaches to injury risk prediction in sport: A scoping review with evidence synthesis. Br. J. Sports Med. 2025, 59, 491–500. [Google Scholar] [CrossRef] [Scilit] [PubMed]
- Page, M.J.; McKenzie, J.E.; Bossuyt, P.M.; Boutron, I.; Hoffmann, T.C.; Mulrow, C.D.; Shamseer, L.; Tetzlaff, J.M.; Akl, E.A.; Brennan, S.E.; et al. The PRISMA 2020 statement: An updated guideline for reporting systematic reviews. Syst. Rev. 2021, 10, 89. [Google Scholar] [CrossRef] [Scilit] [PubMed]
- Yang, T.; Ying, Y. AUC maximization in the era of big data and AI: A survey. ACM Comput. Surv. 2022, 55, 172. [Google Scholar] [CrossRef] [Scilit]
- Cabot, J.H.; Ross, E.G. Evaluating prediction model performance. Surgery 2023, 174, 723–726. [Google Scholar] [CrossRef] [Scilit] [PubMed]
- Moons, K.G.M.; Damen, J.A.A.; Kaul, T.; Hooft, L.; Andaur Navarro, C.; Dhiman, P.; Beam, A.L.; Van Calster, B.; Celi, L.A.; Denaxas, S.; et al. PROBAST+AI: An updated quality, risk of bias, and applicability assessment tool for prediction models using regression or artificial intelligence methods. BMJ 2025, 388, e082505. [Google Scholar] [CrossRef] [Scilit] [PubMed]
- Barker, T.H.; Hasanoff, S.; Aromataris, E.; Stone, J.C.; Leonardi-Bee, J.; Sears, K.; Klugar, M.; Tufanaru, C.; Moola, S.; Liu, X.-L.; et al. The revised JBI critical appraisal tool for the assessment of risk of bias for analytical cross-sectional studies. JBI Evid. Synth. 2026, 24, 401–408. [Google Scholar] [CrossRef] [Scilit] [PubMed]
- Moola, S.; Munn, Z.; Tufanaru, C.; Aromataris, E.; Sears, K.; Sfetcu, R.; Currie, M.; Lisy, K.; Qureshi, R.; Mattis, P.; et al. Chapter 7: Systematic reviews of etiology and risk. In JBI Manual for Evidence Synthesis; Aromataris, E., Munn, Z., Eds.; JBI: North Adelaide, Australia, 2020. [Google Scholar] [CrossRef] [Scilit]
- Tufanaru, C.; Munn, Z.; Aromataris, E.; Campbell, J.; Hopp, L. Chapter 3: Systematic reviews of effectiveness. In JBI Manual for Evidence Synthesis; Aromataris, E., Munn, Z., Eds.; JBI: North Adelaide, Australia, 2020. [Google Scholar] [CrossRef] [Scilit]
- Kmet, L.M.; Lee, R.C.; Cook, L.S. Standard Quality Assessment Criteria for Evaluating Primary Research Papers from a Variety of Fields; HTA Initiative No. 13; Alberta Heritage Foundation for Medical Research: Edmonton, AB, Canada, 2004. [Google Scholar] [CrossRef]
- Haller, N.; Kranzinger, S.; Kranzinger, C.; Blumkaitis, J.C.; Strepp, T.; Simon, P.; Tomaskovic, A.; O’Brien, J.; Düring, M.; Stöggl, T. Predicting injury and illness with machine learning in elite youth soccer: A comprehensive monitoring approach over 3 months. J. Sports Sci. Med. 2023, 22, 476–487. [Google Scholar] [CrossRef] [Scilit] [PubMed]
- Huang, Y.; Li, C.; Bai, Z.; Wang, Y.; Ye, X.; Gui, Y.; Lu, Q. The impact of sport-specific physical fitness change patterns on lower limb non-contact injury risk in youth female basketball players: A pilot study based on field testing and machine learning. Front. Physiol. 2023, 14, 1182755. [Google Scholar] [CrossRef] [Scilit] [PubMed]
- Kolodziej, M.; Nolte, K.; Schmidt, M.; Alt, T.; Jaitner, T. Identification of neuromuscular performance parameters as risk factors of non-contact injuries in male elite youth soccer players: A preliminary study on 62 players with 25 non-contact injuries. Front. Sports Act. Living 2021, 3, 615330. [Google Scholar] [CrossRef] [Scilit] [PubMed]
- Robles-Palazón, F.J.; Puerta-Callejón, J.M.; Gámez, J.A.; Croix, M.D.S.; Cejudo, A.; Santonja, F.; Sainz de Baranda, P.; Ayala, F. Predicting injury risk using machine learning in male youth soccer players. Chaos Solitons Fractals 2023, 167, 113079. [Google Scholar] [CrossRef] [Scilit]
- Karuc, J.; Mišigoj-Duraković, M.; Šarlija, M.; Marković, G.; Hadžić, V.; Trošt-Bobić, T.; Sorić, M. Can injuries be predicted by functional movement screen in adolescents? The application of machine learning. J. Strength Cond. Res. 2021, 35, 910–919. [Google Scholar] [CrossRef] [Scilit] [PubMed]
- Greenberg, E.M.; Watson, A.; Helm, K.; Landrum, K.; Lawrence, J.T.R.; Ganley, T.J. Precision rehabilitation after youth anterior cruciate ligament reconstruction: Individualized reinjury risk stratification and modifiable risk factor identification to guide late-phase rehabilitation. Orthop. J. Sports Med. 2025, 13, 23259671251329355. [Google Scholar] [CrossRef] [Scilit] [PubMed]
- Kolodziej, M.; Groll, A.; Nolte, K.; Willwacher, S.; Alt, T.; Schmidt, M.; Jaitner, T. Predictive modeling of lower extremity injury risk in male elite youth soccer players using least absolute shrinkage and selection operator. Scand. J. Med. Sci. Sports 2023, 33, 1021–1033. [Google Scholar] [CrossRef] [Scilit] [PubMed]
- Xu, S.; Zhang, X.; Jin, N. Soccer sports injury risk analysis and prediction by edge wearable devices and machine learning. In Proceedings of 2023 International Conference on Artificial Intelligence of Things and Systems (AIoTSys); IEEE: New York, NY, USA, 2023; pp. 38–43. [Google Scholar] [CrossRef] [Scilit]
- Qian, H.; Lee, S. A multidimensional prediction model for overtraining risk in youth soccer players: Integrating physiological and psychological markers. J. Sports Sci. 2025, 43, 1819–1834. [Google Scholar] [CrossRef] [Scilit] [PubMed]
- Mandorino, M.; Figueiredo, A.J.; Cima, G.; Tessitore, A. Predictive analytic techniques to identify hidden relationships between training load, fatigue and muscle strains in young soccer players. Sports 2022, 10, 3. [Google Scholar] [CrossRef] [Scilit] [PubMed]
- Allen, J.H.; Tang, R.; Hajdu, K.S.; Hou, B.Q.; Grusky, A.Z.; Chen, H.; Bonfield, C.M.; Zuckerman, S.L.; Terry, D.P.; Yengo-Kahn, A.M. Predicting early versus late recovery from sport-related concussion using decision tree analysis. J. Neurosurg. Pediatr. 2023, 32, 9–18. [Google Scholar] [CrossRef] [PubMed]
- Bunt, S.C.; Wilmoth, K.; Taylor, E.; Bullinger, L.; Driskill, T.; Shurtz, L.; Magill, R.T.; Hynan, L.S.; Silver, C.H.; Didehbani, N.; et al. Patterns of concussion recovery and persisting symptoms in adolescent females. J. Head Trauma Rehabil. 2025, 40, 408–419. [Google Scholar] [CrossRef] [Scilit] [PubMed]
- Marin-Puyalto, J.; Gomez-Cabello, A.; Gomez-Bruton, A.; Matute-Llorente, A.; Castillo-Bernad, S.; Lozano-Berges, G.; Gonzalez-Agüero, A.; Casajus, J.A.; Vicente-Rodriguez, G. Design of a computer model for the identification of adolescent swimmers at risk of low BMD. Int. J. Environ. Res. Public Health 2023, 20, 3454. [Google Scholar] [CrossRef] [Scilit] [PubMed]
- Aoyagi, M.; Naito, K.; Sato, Y.; Kobayashi, A.; Sakamoto, M.; Tumilty, S. Identifying acute lumbar spondylolysis in young athletes with low back pain: Retrospective classification and regression tree analysis. Spine 2021, 46, 1026–1032. [Google Scholar] [CrossRef] [Scilit] [PubMed]
- Rosdi, M.H.; Kosni, N.A.; Sanuddin, N.D.; Azam, Z.; Zanudin, M.Z.F.; Sinnathamby, V.; Faozi, M.A.M.; Azmi, M.A.M.; Khalidi, M.K.A. Association between physical fitness and injury patterns in young footballers of the national football development programme in Malaysia. Sri Lanka J. Child Health 2025, 54, 204–211. [Google Scholar] [CrossRef] [Scilit]
- Longo, G.; Marino, C.; Napolitano, E.; Grimaldi, M.; Liguori, R.; Rubino, A.; D’Ursi, A.M. Soccer-players “sportomics” analysis for future injury-prevention biosensor development. In Proceedings of 2025 International Workshop on Biomedical Applications, Technologies and Sensors (BATS); IEEE: New York, NY, USA, 2025; pp. 300–305. [Google Scholar] [CrossRef] [Scilit]
- Mangini, A.; Macchi, R.; Giraud, D.; Pomportes, L.; Galantine, P.; Bertin, D.; Nicol, C.; Hays, A. Towards a more individualised assessment of post-training fatigue in young footballers. Heliyon 2024, 10, e33626. [Google Scholar] [CrossRef] [Scilit] [PubMed]
- Tanabe, T.; Sugano, T.; Watabu, T.; Mizuno, K. Machine learning analysis of physical factors associated with low back pain in male high school soft tennis players: Emphasis on nondominant hip internal rotation. J. Bodyw. Mov. Ther. 2026, 47, 627–635. [Google Scholar] [CrossRef] [Scilit] [PubMed]
- Zhang, X.; Ogasawara, I.; Konda, S.; Matsuo, T.; Uno, Y.; Miyakawa, M.; Nishizawa, I.; Arita, K.; Liu, J.; Nakata, K. Absorption function loss due to the history of previous ankle sprain explored by unsupervised machine learning. Gait Posture 2024, 109, 56–63. [Google Scholar] [CrossRef] [Scilit] [PubMed]
- Huang, Y.; Wang, S.; Li, C.; Wang, Y.; Bai, Z.; Lv, B.; Gui, Y.; Wei, Z. Investigating the effects of previous injury on subsequent training loads, physical fitness, and injuries in youth female basketball players. Front. Physiol. 2025, 16, 1506611. [Google Scholar] [CrossRef] [Scilit] [PubMed]
- Li, P.; Xu, N.; Yang, Z. Study on the prediction and intervention mechanism of students’ training load in physical education courses. Proc. SPIE 2026, 14018, 140185. [Google Scholar] [CrossRef] [Scilit]
- Wu, J.; Yang, H. AI-driven personalized training recommender for adolescent sports: A multimodal adaptive learning framework. In Proceedings of 2025 International Conference on Advances in Electrical Engineering and Computer Applications (AEECA); IEEE: New York, NY, USA, 2025; pp. 662–666. [Google Scholar] [CrossRef] [Scilit]
- Taborri, J.; Molinaro, L.; Santospagnuolo, A.; Vetrano, M.; Vulpiani, M.C.; Rossi, S. A machine-learning approach to measure the anterior cruciate ligament injury risk in female basketball players. Sensors 2021, 21, 3141. [Google Scholar] [CrossRef] [Scilit] [PubMed]
- Ueno, R.; Navacchia, A.; Schilaty, N.D.; Myer, G.D.; Hewett, T.E.; Bates, N.A. Anterior cruciate ligament loading increases with pivot-shift mechanism during asymmetrical drop vertical jump in female athletes. Orthop. J. Sports Med. 2021, 9, 2325967121989095. [Google Scholar] [CrossRef] [Scilit] [PubMed]
- Rose, M.J.; McCollum, K.A.; Freehill, M.T.; Cain, S.M. Quantifying throw counts and intensities throughout a season in youth baseball players: A pilot study. J. Biomech. Eng. 2021, 143, 034502. [Google Scholar] [CrossRef] [Scilit] [PubMed]
- Musa, R.M.; Abdul Majeed, A.P.P.; Rusdiana, A.; Raj, N.B.; Memmert, D.; Clemente, F.M. Decision tree classification of RPE-based internal load in youth badminton players based on fitness and anthropometric profiles. J. Sports Sci. 2026, 1–11, Advance online publication. [Google Scholar] [CrossRef] [Scilit] [PubMed]
- Benjaminse, A.; Nijmeijer, E.M.; Gokeler, A.; Di Paolo, S. Application of machine learning methods to investigate joint load in agility on the football field: Creating the model, part I. Sensors 2024, 24, 3652. [Google Scholar] [CrossRef] [Scilit] [PubMed]
- Teixeira, J.E.; Afonso, P.; Schneider, A.; Branquinho, L.; Maio, E.; Ferraz, R.; Nascimento, R.; Morgans, R.; Barbosa, T.M.; Monteiro, A.M.; et al. Player tracking data and psychophysiological features associated with mental fatigue in U15, U17, and U19 male football players: A machine learning approach. Appl. Sci. 2025, 15, 3718. [Google Scholar] [CrossRef] [Scilit]
- Azadi, A.; Dehghan, P.; Hussein, R.M.A.H.; Karton, C.; Fraser, M.; Laganière, R.; Graham, R.B.; Hoshizaki, T.B. Automated detection of physical contact events in youth ice hockey: A player-centric deep learning approach. Sci. Rep. 2026, 16, 14908. [Google Scholar] [CrossRef] [Scilit] [PubMed]
- Wang, D.; Guo, Y. A multimodal deep learning-based model for posture asymmetry recognition and sports injury risk prediction in adolescent table tennis athletes. Front. Physiol. 2026, 17, 1800522. [Google Scholar] [CrossRef] [Scilit] [PubMed]
- Van Eetvelde, H.; Mendonça, L.D.; Ley, C.; Seil, R.; Tischer, T. Machine learning methods in sport injury prediction and prevention: A systematic review. J. Exp. Orthop. 2021, 8, 27. [Google Scholar] [CrossRef] [Scilit] [PubMed]
- Yuan, J.; Zeng, Q.; Li, J.; Cong, Z.; Zhang, Y. Machine learning applications in sports injury prediction: A narrative review. Sci. Prog. 2025, 108, 00368504251385956. [Google Scholar] [CrossRef] [Scilit] [PubMed]
- Pakarinen, O.; Ponkilainen, V.T.; Kuitunen, I. Association of peak height velocity and skeletal maturity to injury incidence in male elite adolescent football (soccer) players—A systematic review. Health Sci. Rep. 2025, 8, e71096. [Google Scholar] [CrossRef] [Scilit] [PubMed]
- van der Sluis, A.; Elferink-Gemser, M.T.; Coelho-e-Silva, M.J.; Nijboer, J.A.; Brink, M.S.; Visscher, C. Sport injuries aligned to peak height velocity in talented pubertal soccer players. Int. J. Sports Med. 2014, 35, 351–355. [Google Scholar] [CrossRef] [Scilit] [PubMed]
- Rommers, N.; Rössler, R.; Goossens, L.; Vaeyens, R.; Lenoir, M.; Witvrouw, E.; D’Hondt, E. Risk of acute and overuse injuries in youth elite soccer players: Body size and growth matter. J. Sci. Med. Sport 2020, 23, 246–251. [Google Scholar] [CrossRef] [Scilit] [PubMed]
- Claudino, J.G.; Capanema, D.O.; de Souza, T.V.; Serrão, J.C.; Machado Pereira, A.C.; Nassis, G.P. Current approaches to the use of artificial intelligence for injury risk assessment and performance prediction in team sports: A systematic review. Sports Med. Open 2019, 5, 28. [Google Scholar] [CrossRef] [Scilit] [PubMed]
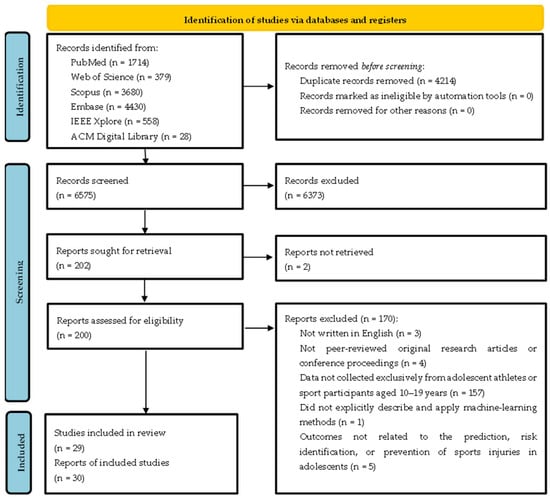
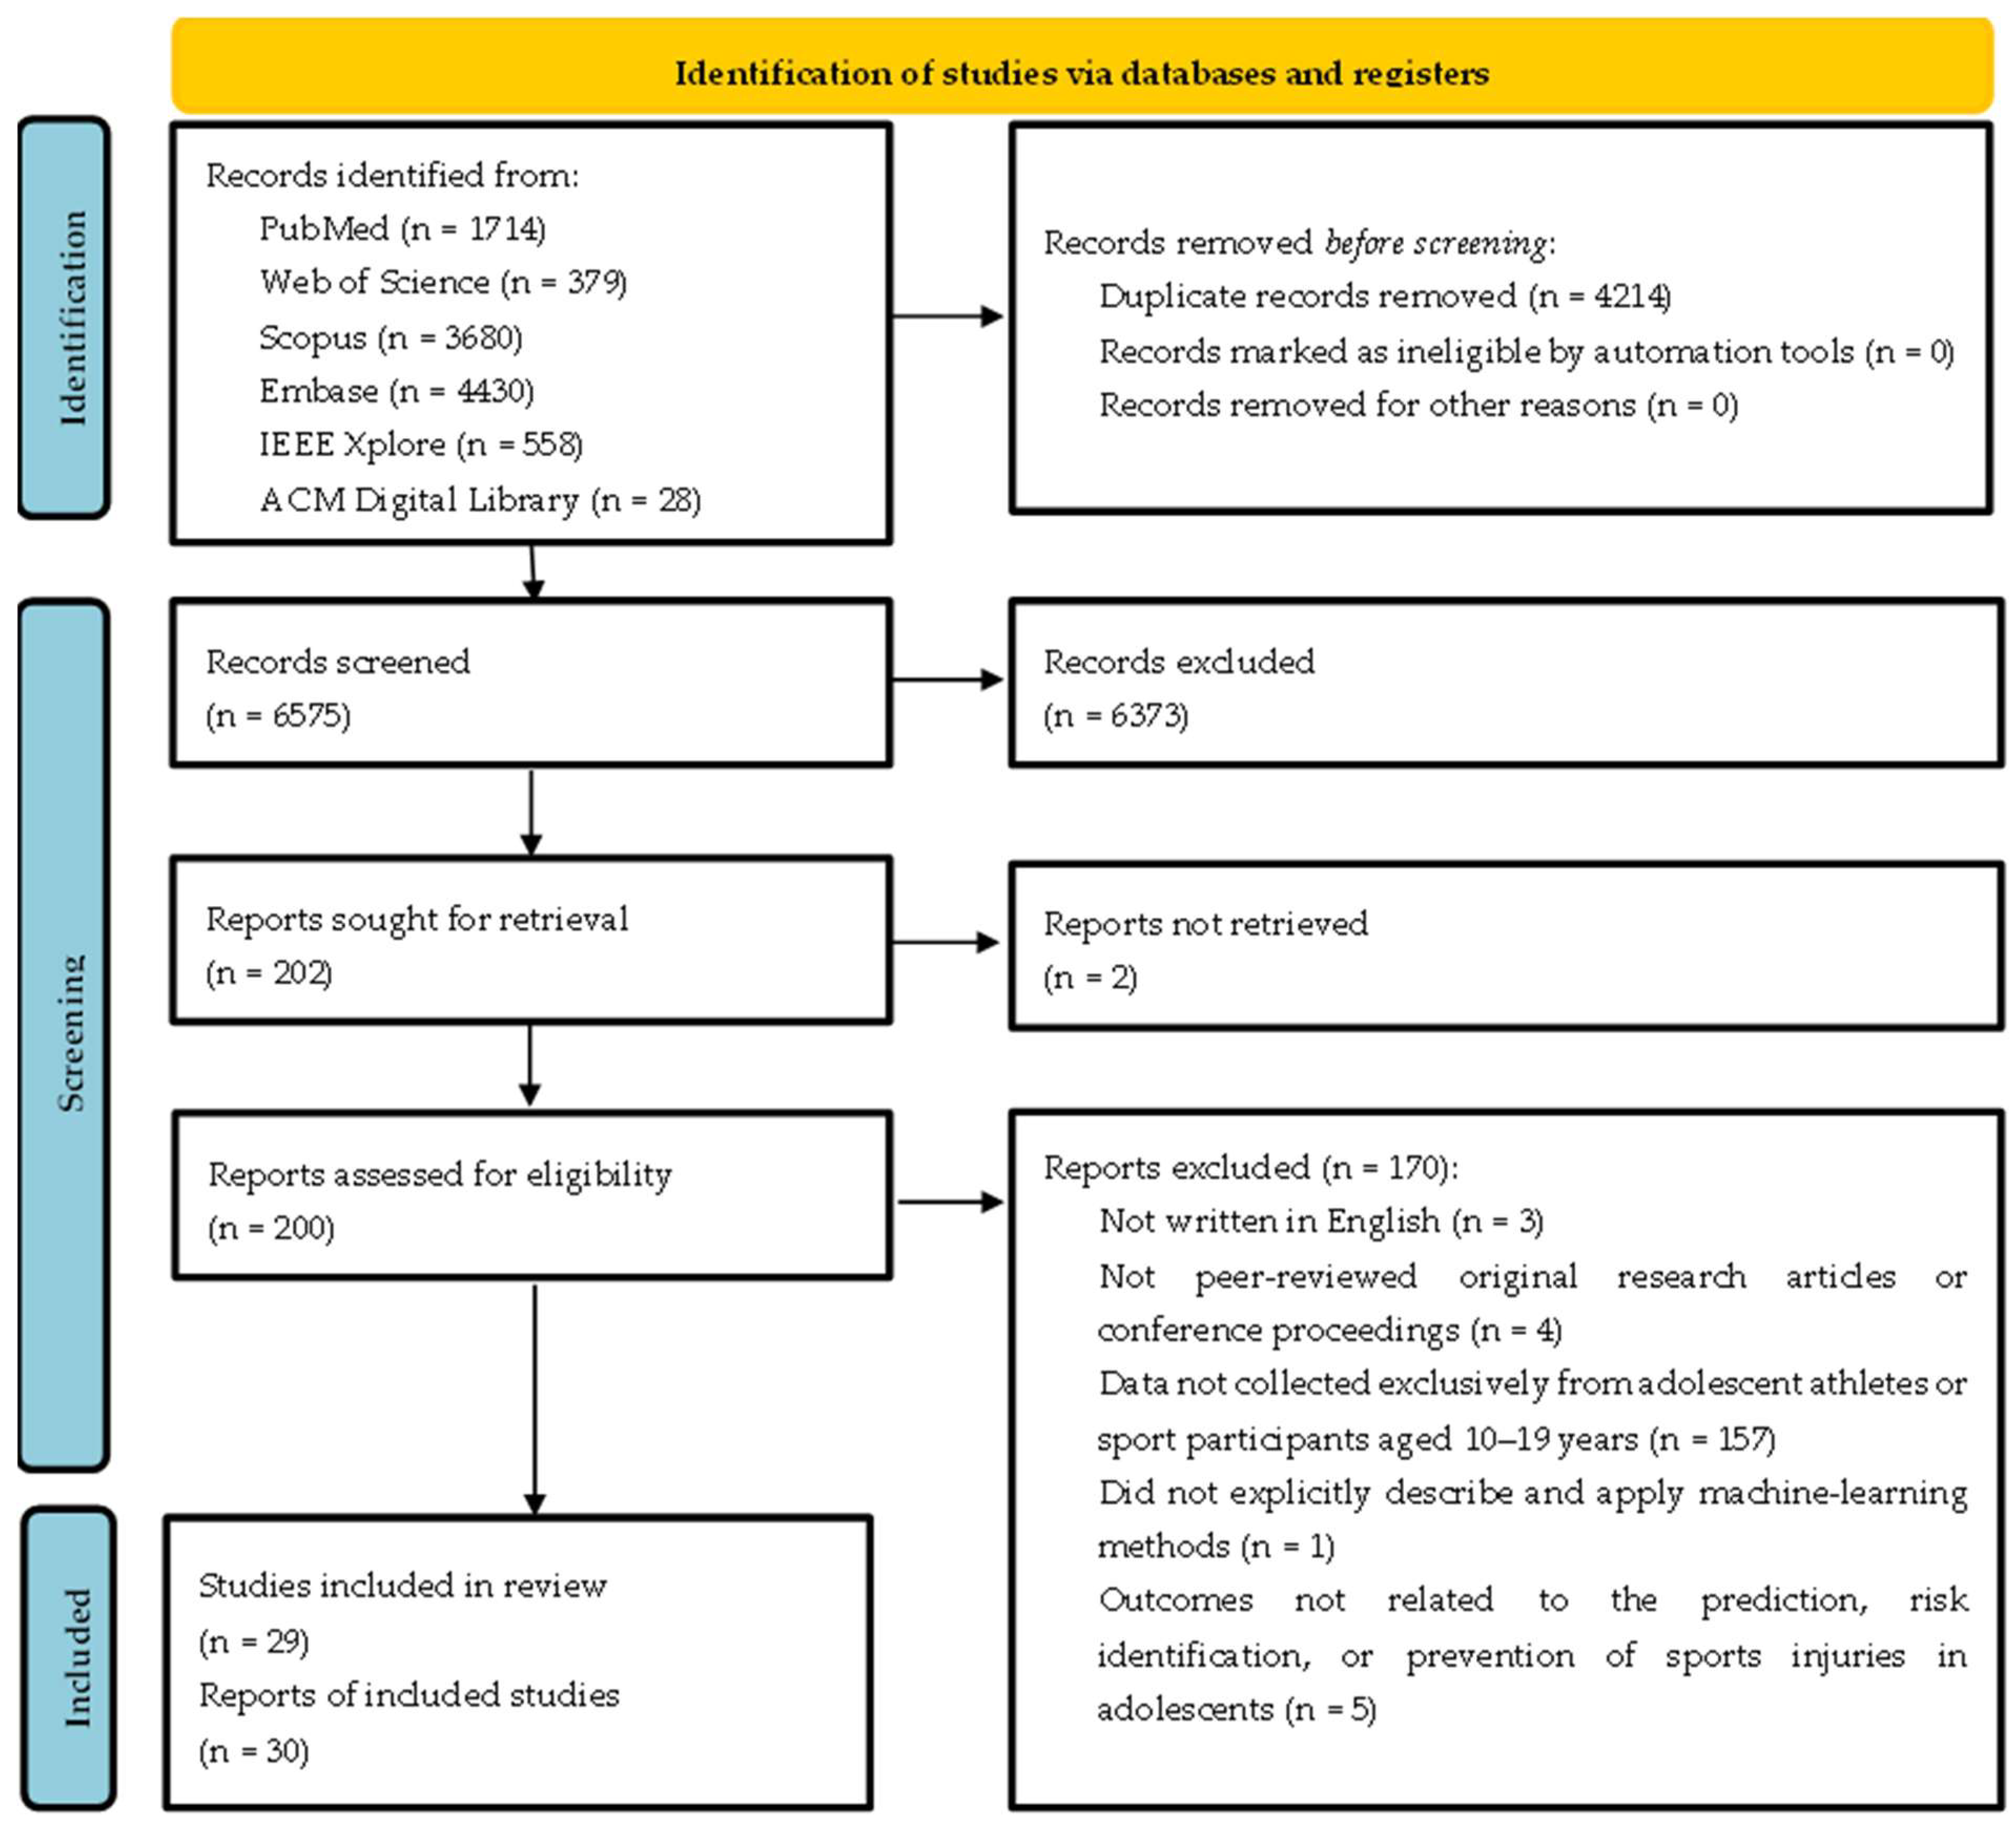

Disclaimer/Publisher’s Note: The statements, opinions and data contained in all publications are solely those of the individual author(s) and contributor(s) and not of MDPI and/or the editor(s). MDPI and/or the editor(s) disclaim responsibility for any injury to people or property resulting from any ideas, methods, instructions or products referred to in the content. |
© 2026 by the authors. Licensee MDPI, Basel, Switzerland. This article is an open access article distributed under the terms and conditions of the Creative Commons Attribution (CC BY) license.