


Abstract
Background: This study examined associations between Sambucus nigra fruit extract (SNE) co-administration and metabolic, endocrine, gut-barrier-related, redox, and histological outcomes during high-fat-diet (HFD) exposure. Methods: Sixty-four male Wistar albino rats were assigned to a 2 × 4 factorial design (n = 8/group), receiving standard diet or HFD with vehicle or SNE at 100, 200, or 400 mg/kg/day for 16 weeks. Diet and SNE administration began concurrently. The extract profile included cyanidin-3-O-sambubioside (68.42 mg/g), cyanidin-3-O-glucoside (42.15 mg/g), total monomeric anthocyanins (122.42 mg/g), and total phenolics (198.50 mg GAE/g). Biochemical endpoints were assessed using clinical chemistry, immunoassay, and spectrophotometric methods; histology was evaluated descriptively. Biochemical data were analyzed using two-way ANOVA followed by Tukey’s HSD test. Results: HFD groups showed higher metabolic and organ injury markers and lower antioxidant measures than standard-diet controls. SNE co-administration was associated with lower body weight, fasting glucose, insulin, HOMA-IR, atherogenic lipid fractions, selected hepatorenal injury markers, circulating LPS/zonulin, and oxidative damage markers. Many outcomes showed their largest numerical differences from HFD controls at 400 mg/kg, although BDNF peaked at 200 mg/kg in HFD-fed animals. Energy intake also declined across HFD-SNE groups. Representative sections showed less conspicuous lesions with SNE. Conclusions: SNE co-administration was associated with attenuation of HFD-related abnormalities during concurrent exposure. Because no pair-fed comparator was included, effects independent of reduced energy intake cannot be established. Descriptive histology does not demonstrate quantitative structural recovery, and the selected tolerability endpoints do not establish comprehensive safety or clinical efficacy.
1. Introduction
Obesity is a multisystem disorder in which excess adiposity, insulin resistance, dyslipidemia, low-grade inflammation, altered redox signaling, and progressive organ injury reinforce one another [1,2,3,4]. High-fat feeding reproduces many of these features in rodents, including weight gain, impaired glucose control, ectopic lipid deposition, oxidative injury, and changes in the intestinal ecosystem; however, model behavior depends on diet composition, duration, strain, sex, and husbandry [5,6]. A rigorous intervention study should therefore evaluate efficacy and safety across multiple physiological domains rather than rely on body weight or a single circulating marker.
The gut–liver axis is increasingly recognized as a component of obesity-associated metabolic dysfunction. Diet-driven barrier impairment may facilitate translocation of bacterial products, including lipopolysaccharide, and amplify hepatic and adipose inflammatory signaling [7,8]. Zonulin has been used as a circulating permeability-associated marker, although assay specificity and interpretation require caution [9]. Glucagon-like peptide-2 supports intestinal growth and barrier function, whereas amphiregulin participates in epithelial repair programs [10,11]. Parallel changes in glucagon-like peptide-1 and nesfatin-1 can reflect altered nutrient sensing and satiety signaling.
Metabolic regulation also intersects with adipokines and neuroendocrine peptides. Asprosin promotes hepatic glucose release and stimulates appetite-related circuitry [12]. Spexin has been linked to adipocyte fatty-acid handling and is often reduced in obesity [13]. Adiponectin promotes fatty-acid oxidation and insulin sensitivity [14], while brain-derived neurotrophic factor contributes to central energy-balance pathways [15]. Evaluating these mediators together may reveal whether a botanical intervention is associated with a coherent endocrine response rather than isolated biochemical shifts.
Black elderberry (Sambucus nigra L.) fruit is rich in anthocyanins, particularly cyanidin glycosides, and also contains other polyphenols with redox- and signaling-related biological activity [16,17,18,19]. Experimental evidence indicates that elderberry-derived anthocyanin preparations can attenuate obesity-associated inflammation and metabolic dysfunction, but dose–response evidence integrating gut permeability, endocrine peptides, oxidative damage, and organ histology remains limited [20]. Botanical studies also require batch-specific chemical characterization because cultivar, processing, storage, and extraction can substantially alter phenolic composition and because cyanogenic glycosides must be considered in safety assessment [18,21]. This study evaluated SNE at 100, 200, and 400 mg/kg during concurrent standard- or high-fat-diet exposure in a 2 × 4 factorial design. The aim was to compare measured metabolic, endocrine, redox, and descriptive histological outcomes across doses and dietary backgrounds. Intake-independent mechanisms and treatment of established obesity were not tested.
2. Materials and Methods
2.1. Animals, Ethical Approval, and Experimental Groups
Sixty-four adult male Wistar albino rats (6–8 weeks old; initial body weight: 180–220 g) were housed under standard environmental conditions (temperature: 21–24 °C; relative humidity: 45–55%; 12 h light/12 h dark cycle) with ad libitum access to assigned diets and drinking water. Animals were housed two per cage in standard polycarbonate cages (four cages per group; 32 cages total). Experimental treatments (assigned dietary regimen and daily oral gavage dose) were allocated strictly at the cage level such that cage mates consistently received the identical diet and extract dosage, preventing discordant exposure within shared housing.
Male rats were selected to reduce sex-related variability in metabolic and endocrine responses within the experimental model. Previous research in Wistar rats has demonstrated sex-dependent responses to high-fat feeding, including differences in body-weight gain and metabolic disturbances [22]. All experimental procedures were conducted in accordance with national animal welfare regulations, following approval by the Local Ethics Committee for Animal Experiments (Decision No: 086/4, Approval Date: 1 November 2024). Study reporting was guided by the ARRIVE 2.0 guidelines [23]. Following a 7-day acclimatization period, rats were stratified based on baseline body weight and randomly allocated into eight experimental groups using a lottery-based randomization procedure conducted by an independent individual who was not involved in the experiment. The study followed a 2 × 4 factorial design (n = 8 per group):
- Control (C) group: Received an AIN-93M-based standard rodent diet and oral vehicle (sterile distilled water) daily for 16 weeks; served as the standard-diet reference control.
- SNE 100 group: Received standard diet and 100 mg/kg Sambucus nigra fruit extract daily via oral gavage.
- SNE 200 group: Received standard diet and 200 mg/kg Sambucus nigra fruit extract daily via oral gavage.
- SNE 400 group: Received standard diet and 400 mg/kg Sambucus nigra fruit extract daily via oral gavage to assess the measured tolerability endpoints under normal dietary conditions.
- HFD-C group: Received a high-fat diet providing 60% of energy from fat and oral vehicle daily for 16 weeks; served as the HFD vehicle control.
- HFD-SNE 100 group: Received HFD and 100 mg/kg Sambucus nigra fruit extract daily via oral gavage.
- HFD—SNE 200 group: Received HFD and 200 mg/kg Sambucus nigra fruit extract daily via oral gavage.
- HFD—SNE 400 group: Received HFD and 400 mg/kg Sambucus nigra fruit extract daily via oral gavage.
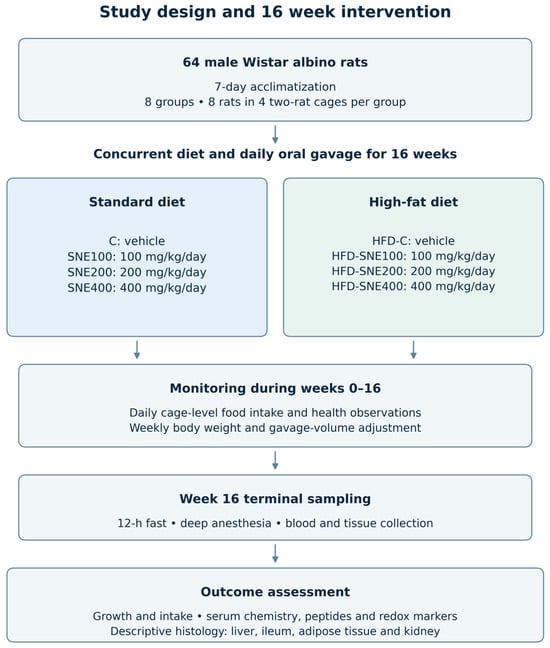
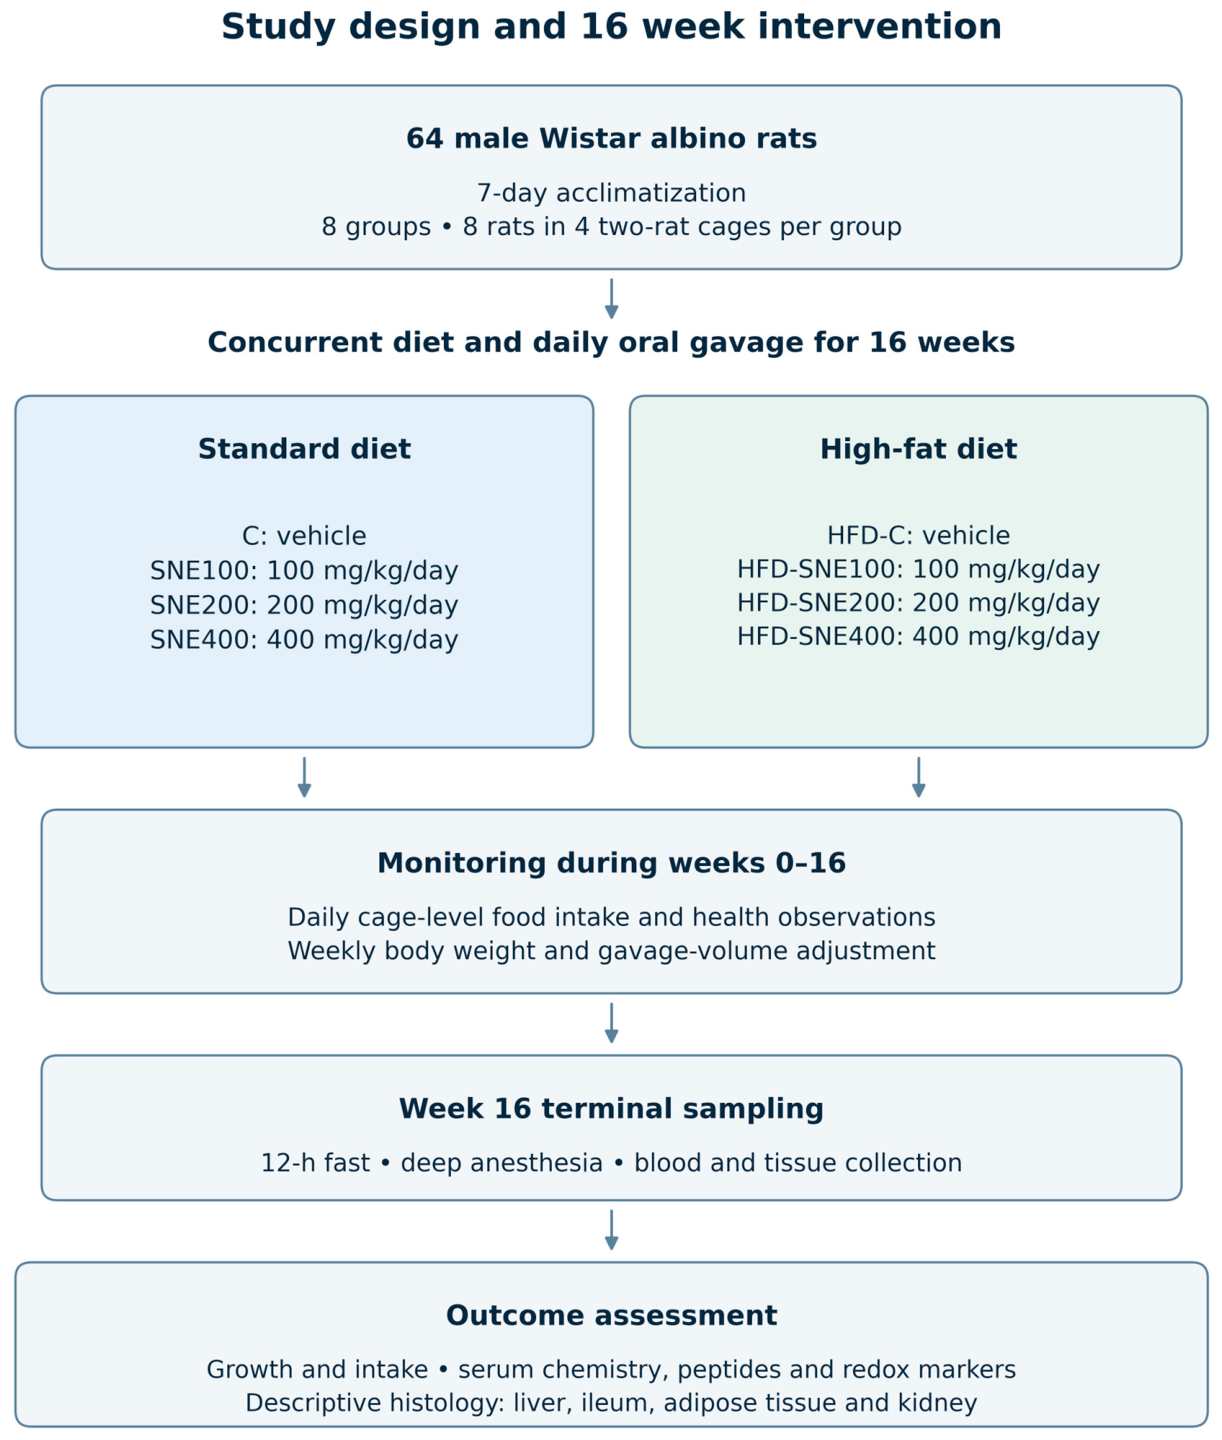
The ingredient quantities listed in Table 1 represent the actual laboratory-prepared batch formulations rather than quantities expressed per kilogram of diet. The standard-diet batch totaled 1000.008 g, whereas the high-fat-diet batch totaled 773.85 g. The high-fat diet was prepared in the laboratory based on the Research Diets D12492 reference formulation [24], including dicalcium phosphate, calcium carbonate, potassium citrate, and food dye. The high-fat diet provided approximately 60% of energy from fat, with a reference energy density of 5.24 kcal/g. The standard diet had an energy density of 3.85 kcal/g. The standard-diet framework follows the AIN-93 reference [25]. Eight animals were included in each experimental group (n = 8/group). All pharmacological treatments were administered once daily via oral gavage (5 mL/kg body weight) between 09:00 and 10:00 A.M. for 16 consecutive weeks. Gavage volumes were adjusted weekly based on serial body weight measurements. Animals were monitored daily for clinical health status, food intake, and signs of distress. At the end of week 16, following an overnight 12-h fast, all animals underwent terminal sampling under deep anesthesia (ketamine hydrochloride, 80 mg/kg; Ketasol, Richter Pharma AG, Wels, Austria and xylazine hydrochloride, 10 mg/kg; Xylasol, Richter Pharma AG, Wels, Austria). The experimental design and study workflow are illustrated in Figure 1.
Table 1.
Ingredient composition and proximate nutritional profiles of the experimental diets.
Figure 1.
Experimental design and 16-week intervention workflow. Sixty-four male Wistar albino rats underwent a 7-day acclimatization period and were allocated to eight groups, each comprising eight rats housed in four two-rat cages. Standard-diet and high-fat-diet groups received vehicle or Sambucus nigra fruit extract (SNE; 100, 200, or 400 mg/kg/day) by daily oral gavage, with diet and extract exposure beginning concurrently. Cage-level food consumption and clinical observations were recorded daily; body weight and gavage volumes were updated weekly. Terminal blood and tissue sampling followed a 12 h fast at week 16. Outcome domains included growth and intake, serum chemistry, peptides, redox markers, and descriptive multiorgan histology. C, standard-diet vehicle control; HFD-C, high-fat-diet vehicle control.
2.2. Induction of Obesity (High-Fat Diet-Induced Obesity Model)
Following a 7-day acclimatization period, rats received either a standard diet described as AIN-93M-based or a high-fat diet (HFD) for 16 consecutive weeks [5,6]. The standard diet and HFD provided 10% and 60% of total energy from fat, respectively. Energy densities of 3.85 kcal/g for the standard diet and 5.24 kcal/g for the HFD were used in energy-intake calculations. Both diets and fresh drinking water were supplied ad libitum. Daily food consumption and weekly body weights were monitored throughout the intervention to quantify cumulative energy intake and monitor body weight for animal monitoring and dose-volume adjustment. Higher final body weight and fasting glycemic–insulinemic parameters were observed in HFD controls relative to standard-diet controls. These findings concern changes during concurrent diet and extract exposure, rather than treatment initiated after obesity had been established. Vehicle-treated control cohorts were maintained under identical ambient conditions and feeding regimens without experimental extract administration.
2.3. Sambucus nigra Fruit Extract Characterization and Phytochemical Fingerprinting
Sambucus nigra fruit extract (SNE) was obtained as a commercial dry extract powder from Bitki Ekstresi Doğal Ürünler Ltd. Şti. (İstanbul, Türkiye; product code: 00060; batch lot no.: BE-SN-2024-03). The supplier described the source material as ripe fruits of Sambucus nigra L. No independent formal botanical taxonomic authentication was performed, no institutional voucher specimen was deposited, and compliance with a European Pharmacopoeia monograph is not claimed. Chemical profiling of the processed extract does not substitute for botanical authentication. The reported preparation process used ethanol:water (70:30, v/v), a drug-to-extract ratio of 10:1, filtration, vacuum concentration below 40 °C, and spray-drying (reported extraction yield approximately 12.5% w/w). All treatments used the same commercial lot to maintain within-study material consistency. The analytical measurements below characterize that lot; they do not establish predefined release specifications, equivalence across production lots, or reproducibility of an identical extract by another manufacturer. Accordingly, SNE is described as a chemically characterized extract rather than a standardized extract.
Quantitative phytochemical fingerprinting and active marker determinations were performed using a reverse-phase high-performance liquid chromatography system equipped with a Photodiode Array Detector (RP-HPLC-DAD; Shimadzu Prominence LC-20A, Kyoto, Japan). Chromatographic separation was carried out on a Phenomenex Luna C18 analytical column (250 × 4.6 mm, 5 µm particle size; Torrance, CA, USA) maintained at 30 °C. The binary gradient mobile phase consisted of 5% (v/v) aqueous formic acid (Eluent A) and HPLC-grade acetonitrile (Eluent B) under the following multi-step program: 0–5 min, 5–10% B; 5–25 min, 10–25% B; 25–35 min, 25–40% B; 35–40 min, 40–90% B; followed by 5 min of re-equilibration at a flow rate of 0.8 mL/min (injection volume: 10 µL). Anthocyanins and flavonols were detected simultaneously at 520 nm and 354 nm against external analytical reference standards (Sigma-Aldrich, St. Louis, MO, USA; purity ≥ 98%; calibration curves demonstrated linearity with r2 > 0.999).
Spectrophotometric analyses determined total phenolic content as 198.50 mg gallic acid equivalents (GAE)/g (Folin–Ciocalteu assay [26]) and total monomeric anthocyanins as 122.42 mg/g dry extract (pH-differential method [27]). Quantitative phytochemical fingerprinting and active marker determinations against authentic reference standards (Sigma-Aldrich, purity ≥ 98.0%; calibration range 5–250 µg/mL, r2 > 0.999) yielded cyanidin-3-O-sambubioside (68.42 mg/g dry extract) and cyanidin-3-O-glucoside (42.15 mg/g dry extract) as primary bioactive markers, with analytical precision (RSD < 2.8%) and recoveries (>96.5%) verified analytically. Sambunigrin was assessed using triple-quadrupole LC-MS/MS (Shimadzu LCMS-8040, Shimadzu Corporation, Kyoto, Japan), electrospray ionization in negative mode, MRM transition m/z 294.1 → 162.1) and yielded concentrations below the method limit of quantification (<LOQ; LOQ = 0.5 mg/kg). This <LOQ result reflects low residual levels within assay sensitivity limits and should not be construed as absolute compound absence or proof of comprehensive toxicological safety. For daily in vivo administration, SNE was freshly suspended in sterile distilled water (vehicle) and administered via oral gavage at target doses of 100, 200, or 400 mg/kg (5 mL/kg body weight) across designated cohorts.
2.4. Treatment Protocol, Experimental Timeline, and Analytical Sampling
Following the 7-day acclimatization period (t = 0), rats were assigned to either an AIN-93M-based standard diet or an HFD providing 60% of total energy from fat. Sambucus nigra fruit extract (SNE; 100, 200, or 400 mg/kg) was freshly suspended in sterile distilled water and administered via daily oral gavage (5 mL/kg body weight) between 09:00 and 10:00 A.M. for 16 consecutive weeks. Standard-diet tolerability cohorts received SNE (100, 200, or 400 mg/kg) orally on the standard diet background to assess selected biochemical and histological tolerability endpoints, whereas standard diet (C) and HFD vehicle control (HFD-C) groups received an equivalent volume (5 mL/kg) of distilled water vehicle. All experimental groups underwent routine monitoring throughout the 16-week period for clinical wellness, daily food and energy intake, stool quality, and weekly body-weight monitoring. Individual gavage volumes were recalibrated weekly according to updated body weight measurements. Animals were monitored daily via routine cage-side observation for gross clinical appearance, posture, and signs of distress. No spontaneous mortality or acute distress episodes requiring premature euthanasia occurred across any experimental group throughout the 16-week period (n = 8 per group evaluated). However, structured animal-level clinical scoring scales or systematic behavioral event monitoring were not implemented, and comprehensive subchronic clinical tolerability was not evaluated through a formal toxicological protocol.
At the conclusion of the 16-week intervention, all animals were subjected to an overnight 12 h fast with unrestricted access to drinking water. Rats were deeply anesthetized via intraperitoneal injection of ketamine (80 mg/kg) and xylazine (10 mg/kg). Thoracotomy was performed, and whole blood was collected immediately via cardiac puncture. Blood samples were centrifuged at 3000× g for 15 min at 4 °C to harvest serum for glycemic (glucose, insulin, HOMA-IR), lipid (TC, TG, HDL-C, LDL-C), hepatorenal (ALT, AST, ALP, urea, creatinine), gut permeability (zonulin, LPS), endocrine/adipokine (asprosin, spexin, adiponectin, BDNF), and redox/DNA damage (TAS, TOS, SOD, GPx, CAT, MDA, 8-OHdG) analyses. Immediately following blood collection, cervical dislocation was performed under deep anesthesia, and target tissues—including the liver, intestine (ileum), epididymal white adipose tissue (eWAT), and kidneys—were excised rapidly on ice. Tissue aliquots were either snap-frozen in liquid nitrogen and stored at −80 °C for molecular/biochemical determinations or fixed in 10% neutral buffered formalin for histopathological evaluation (H&E staining). Standardized harvesting and processing protocols minimized post mortem artifacts and ensured uniform analytical integrity across all experimental cohorts.
2.5. Growth, Intake, and Glycometabolic Assessment
Initial and final body weights, daily energy intake, and feed efficiency ratio (FER) are reported in Table 2. Each experimental group comprised four cages, with two rats housed per cage. Food consumption was measured daily for each cage as the amount offered minus the amount remaining and recovered spilled food. Individual body weights were measured weekly. Mean daily energy intake per animal was calculated by multiplying cumulative cage food consumption over 112 days by the dietary energy density used in the calculations (3.85 kcal/g for the standard diet and 5.24 kcal/g for the HFD), then dividing by 112 days and two animals. Energy intake is expressed as kcal/animal/day. FER (%) was calculated separately for each cage as the combined body-weight gain of its two rats divided by cumulative cage food consumption over the same 112-day period, multiplied by 100. Group FER values represent the mean of four cage-specific ratios, rather than a ratio derived from group means. Energy intake and FER are presented as mean ± SEM across four independent cages per group and were analyzed using two-way ANOVA (diet × treatment), followed by Tukey’s HSD test. Following the 12 h overnight fasting period, blood samples were collected, and serum glucose concentrations were determined by the glucose oxidase-peroxidase enzymatic colorimetric method (Cat. No. 11504; BioSystems S.A., Barcelona, Spain; analytical range: 2.5–500 mg/dL; intra-assay CV < 2.1%) on an automated clinical biochemistry analyzer (AU680; Beckman Coulter, Brea, CA, USA), while serum insulin levels were quantified in duplicate using a high-sensitivity rat-specific insulin enzyme-linked immunosorbent assay (ELISA) kit (Cat. No. 10-1250-01; Mercodia AB, Uppsala, Sweden; dynamic range: 0.15–5.50 µg/L; analytical sensitivity: 0.07 µg/L; intra-assay CV < 3.4%, inter-assay CV < 4.9%). HOMA-IR was calculated as [fasting insulin (µIU/mL) × fasting glucose (mg/dL)]/405 [28] and interpreted as a surrogate index of insulin resistance rather than a direct measurement of insulin sensitivity. Body weight was measured weekly to adjust individual oral gavage volumes and monitor animal health. The present evaluation analyzes final body weight at week 16 as the efficacy endpoint, whereas initial body weight is reported to confirm baseline group comparability. Serial weekly measurements were not analyzed as repeated-measures longitudinal efficacy outcomes, and no inferences regarding growth kinetics or differential rates of weight gain are made.
Table 2.
Body weight, energy intake, feed efficiency ratio, and glycometabolic parameters across experimental groups.
2.6. Serum Lipids and Hepatorenal Biochemistry
Serum lipid fractions including triglycerides (Cat. No. 11528), total cholesterol (Cat. No. 11505), high-density lipoprotein cholesterol (HDL-C; direct clearance method, Cat. No. 11557), and low-density lipoprotein cholesterol (LDL-C; Cat. No. 11585) were measured on an automated clinical biochemistry analyzer (AU680; Beckman Coulter, Brea, CA, USA) using commercial diagnostic kits (BioSystems S.A., Barcelona, Spain), from which non-HDL cholesterol was calculated as total cholesterol minus HDL-C and the atherogenic ratio was derived as total cholesterol divided by HDL-C. Hepatic and renal integrity markers—comprising alanine aminotransferase (ALT; kinetic IFCC, Cat. No. 11533), aspartate aminotransferase (AST; kinetic IFCC, Cat. No. 11531), alkaline phosphatase (ALP; IFCC-DEA, Cat. No. 11592), gamma-glutamyl transferase (GGT; Cat. No. 11520), total protein (Biuret method, Cat. No. 11500), albumin (Bromocresol green, Cat. No. 11573), total bilirubin (DMSO method, Cat. No. 11511), blood urea nitrogen (BUN; Urease-GLDH, Cat. No. 11516), urea, creatinine (Jaffé compensated, Cat. No. 11502), and uric acid (Uricase-POD, Cat. No. 11521)—were quantified using validated commercial diagnostic kits (BioSystems S.A.). Blood urea nitrogen (BUN) was quantified enzymatically using a commercial urease-GLDH reagent kit (Cat. No. 11516; BioSystems S.A.), whereas serum urea concentrations were stoichiometrically calculated from BUN using the standard conversion: Urea (mg/dL) = BUN (mg/dL) × 2.14. Because serum urea is derived directly from BUN, these two parameters represent the same assay output and are not interpreted as independent renal endpoints.
2.7. Thyroid, Enteroendocrine, Gut-Barrier, and Adipokine Measurements
Circulating concentrations of regulatory hormones, incretins, mucosal barrier indices, and adipokines were measured in duplicate using commercial immunoassay kits according to the manufacturers’ protocols, with optical densities recorded on a microplate spectrophotometer (Multiskan SkyHigh; Thermo Fisher Scientific, Waltham, MA, USA) at 450 nm with wavelength correction set at 540 nm or 570 nm using four-parameter logistic (4-PL) calibration curve fitting. The quantified biomarkers included thyroid-stimulating hormone (TSH; Cat. No. CSB-E05115r; Cusabio Technology LLC., Houston, TX, USA; detection range: 0.156–10 µIU/mL), free triiodothyronine (fT3; Cat. No. CSB-E05076r; range: 0.5–20 pg/mL), free thyroxine (fT4; Cat. No. CSB-E05079r; range: 0.2–8.0 ng/dL), zonulin (Cat. No. E-EL-R1103; Elabscience Biotechnology Inc., Houston, TX, USA; range: 0.31–20 ng/mL), amphiregulin (Cat. No. CSB-EL001962RA; Cusabio; range: 7.8–500 pg/mL), glucagon-like peptide-1 (GLP-1; Cat. No. E-EL-R3007; Elabscience; range: 1.56–100 pmol/L), glucagon-like peptide-2 (GLP-2; Cat. No. CSB-E11718r; Cusabio; range: 0.625–40 ng/mL), nesfatin-1 (Cat. No. E-EL-R2514; Elabscience; range: 0.16–10 ng/mL), asprosin (Cat. No. E-EL-R3033; Elabscience; range: 1.56–100 ng/mL), spexin (Cat. No. EK-023-81; Phoenix Pharmaceuticals, Burlingame, CA, USA; range: 10–1000 pg/mL), adiponectin (Cat. No. RRP300; R&D Systems, Minneapolis, MN, USA; range: 0.156–10 µg/mL), and brain-derived neurotrophic factor (BDNF; Cat. No. ERBDNF; Thermo Fisher Scientific; range: 0.03–2.0 ng/mL), while circulating endotoxin lipopolysaccharide (LPS) was quantified using a chromogenic Limulus Amebocyte Lysate endpoint assay (Cat. No. QCL-1000; Lonza Walkersville Inc., Walkersville, MD, USA; range: 0.1–1.0 EU/mL), maintaining intra- and inter-assay coefficients of variation below 6.8% and 9.2%, respectively. For the fT3/fT4 mass ratio, fT4 was converted from ng/dL to pg/mL by multiplication by 10; the ratio is therefore fT3 (pg/mL)/[10 × fT4 (ng/dL)]. Laboratory personnel performing the biochemical and immunoassay analyses were blinded to the experimental group assignments of the samples throughout the analytical procedures.
2.8. Evaluation of Systemic Redox State and Oxidative Damage Markers
Serum total antioxidant status (TAS; Cat. No. RL0017) and total oxidant status (TOS; Cat. No. RL0024) were quantified on an automated clinical analyzer using commercial colorimetric kits (Rel Assay Diagnostics, Gaziantep, Türkiye) according to Erel’s methods [29,30], allowing calculation of the oxidative stress index as OSI (arbitrary units) = [TOS (µmol H2O2 Eq/L)/(TAS (mmol Trolox Eq/L) × 10)]. Serum lipid peroxidation was evaluated as malondialdehyde via the thiobarbituric acid reactive substances colorimetric assay [31] (Cat. No. 10009055; Cayman Chemical, Ann Arbor, MI, USA), systemic antioxidant activities of superoxide dismutase (SOD; Cat. No. 706002), catalase (CAT; Cat. No. 707002), and glutathione peroxidase (GPx; Cat. No. 703102) were quantified spectrophotometrically using assay kits from Cayman Chemical, and oxidative DNA damage was measured using an 8-hydroxy-2′-deoxyguanosine (8-OHdG) competitive ELISA kit (Cat. No. SKT-120; StressMarq Biosciences, Victoria, BC, Canada; range: 0.94–60 ng/mL).
2.9. Multiorgan Histopathological Evaluation
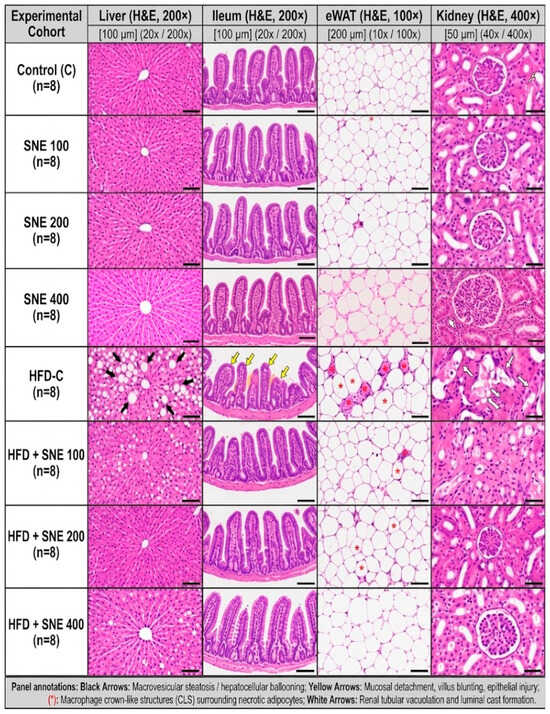
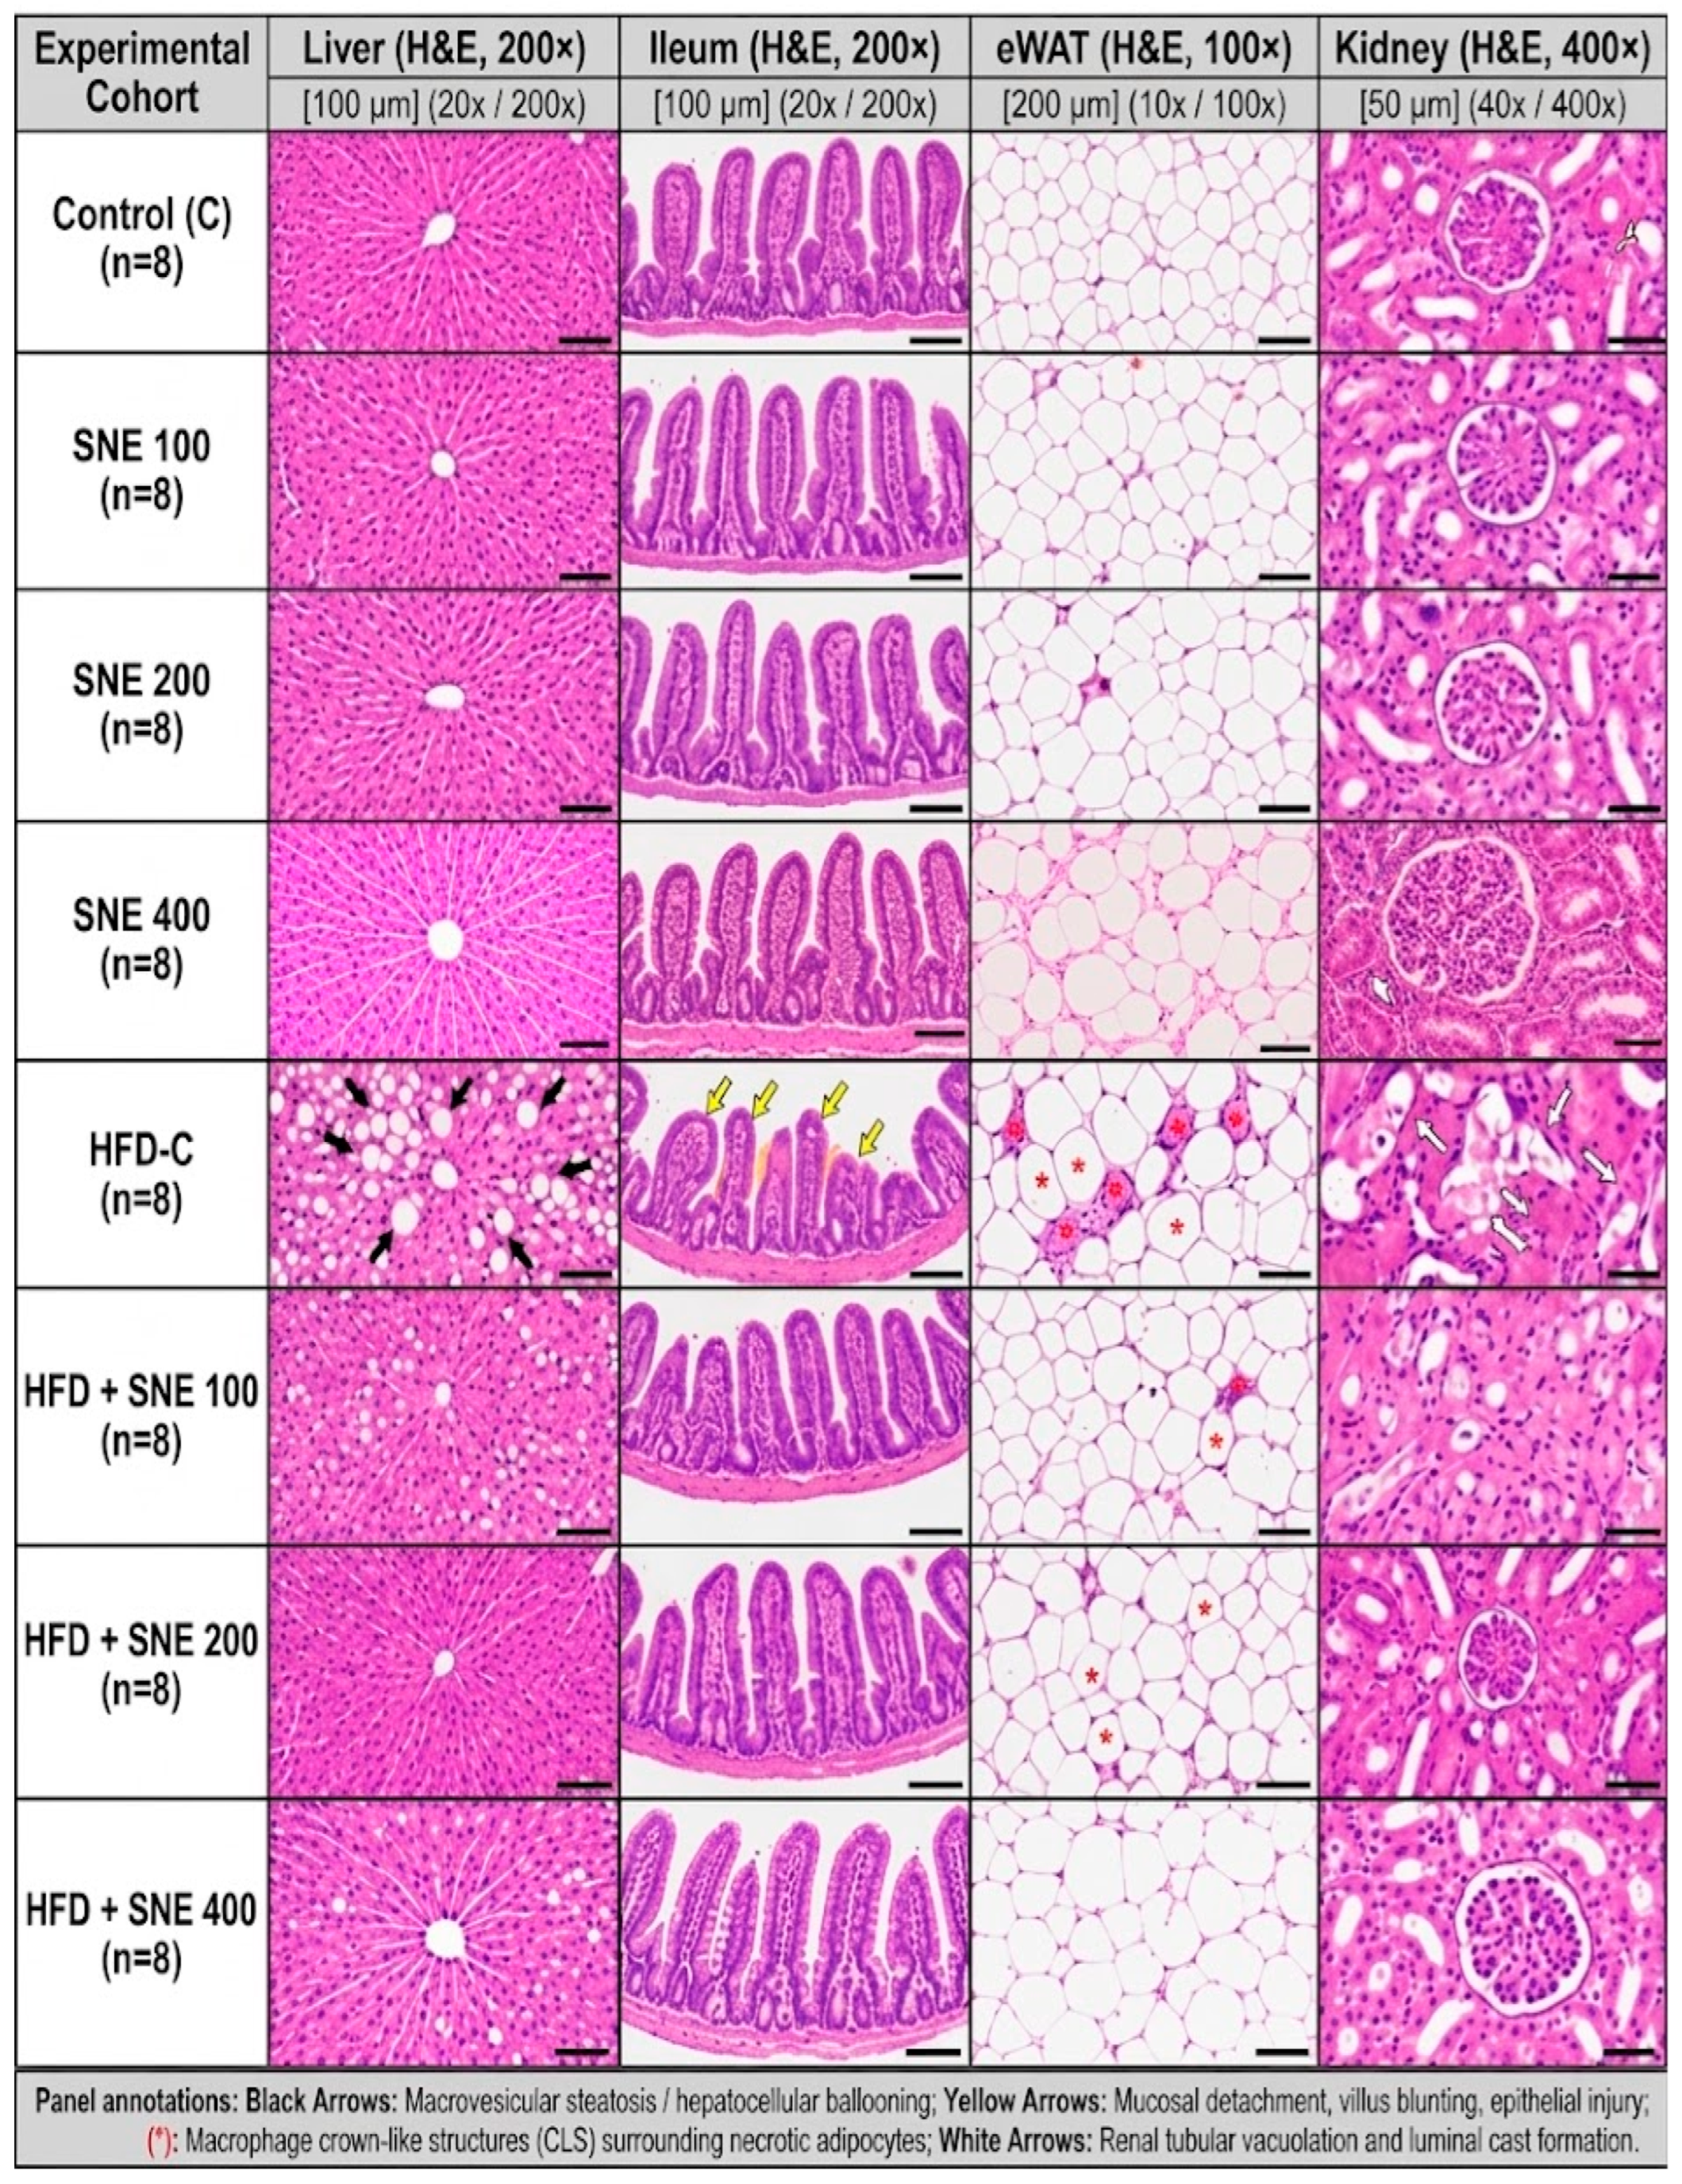
Harvested tissue specimens of the liver, terminal ileum, epididymal white adipose tissue, and kidney were immediately immersed in 10% neutral buffered formalin for 48 h, dehydrated through an ascending series of graded ethanol baths, cleared in xylene, embedded in paraffin wax, and sectioned at a uniform thickness of 4–5 µm using a rotary microtome (RM2235; Leica Biosystems, Nussloch, Germany) before being stained with routine hematoxylin and eosin (H&E).Structural architecture and pathomorphological alterations—specifically macrovesicular steatosis and hepatocellular ballooning in the liver, mucosal detachment, lamina propria inflammatory infiltration, and villus blunting in the ileum, crown-like structures surrounding necrotic adipocytes in epididymal adipose depots, and proximal tubular vacuolation alongside intraluminal proteinaceous cast accumulation in renal parenchyma—were examined and captured under an Olympus BX53 light microscope equipped with a digital image analysis camera at objective magnifications of 10×, 20×, and 40× (Figure 2) by an experienced veterinary pathologist who remained strictly blinded to the experimental group allocations throughout the microscopic evaluation. The histopathological assessment in this study provides qualitative and descriptive comparisons of tissue morphology across cohorts. While blinded qualitative microscopic inspection revealed consistent structural patterns, formal animal-level semi-quantitative scoring, morphometric measurements (e.g., villus height, adipocyte area), and quantified renal injury grading were not conducted. Accordingly, the representative images illustrate prominent histological features without claiming quantified lesion burden.
Figure 2.
Multiorgan histopathological evaluation across the 2 × 4 factorial design. Representative photomicrographs of hematoxylin-and-eosin-stained liver and terminal ileum (scale bar = 100 µm; 20× objective), epididymal white adipose tissue (eWAT; scale bar = 200 µm; 10× objective), and kidney (scale bar = 50 µm; 40× objective) representing the eight groups in the study (eight animals allocated per group). Black arrows indicate macrovesicular steatosis and hepatocellular ballooning; yellow arrows denote ileal mucosal detachment, lamina propria inflammatory infiltration, and villus blunting; red asterisks indicate crown-like structures (CLS) surrounding necrotic adipocytes; white arrows indicate proximal tubular degeneration, intracellular vacuolation, and intraluminal proteinaceous cast accumulation. C, standard-diet control; SNE, Sambucus nigra fruit extract; HFD-C, high-fat-diet control.
2.10. Statistical Analysis
Data are expressed as mean ± standard error of the mean (SEM). Statistical analyses were performed using SPSS version 26.0 and GraphPad Prism version 9.0. Individual body-weight and biochemical outcomes were analyzed with the animal as the experimental unit (n = 8 animals per group). Energy intake and feed efficiency ratio (FER) were analyzed with the cage as the experimental unit (n = 4 cages per group; two animals per cage). Expressing cage-measured energy intake per animal did not increase the number of independent observations. Two-way ANOVA evaluated the main effects of diet, treatment, and their interaction. Pairwise comparisons among the eight groups used Tukey’s honestly significant difference (HSD) test, with statistical significance set at p < 0.05. For Table 2 outcomes, normality was assessed using Shapiro–Wilk tests on within-group residuals, and variance homogeneity was assessed using median-centered Levene tests. Residual normality was rejected for fasting insulin and HOMA-IR, and variance homogeneity was rejected for fasting insulin. Additional sensitivity analyses therefore included HC3 heteroscedasticity-adjusted Wald F tests for factorial effects and Games–Howell pairwise comparisons. HC3 tests used approximate F inference with the residual degrees of freedom. Table 2 superscript letters reflect conventional Tukey HSD comparisons; comparisons whose significance differed under Games–Howell were interpreted cautiously. All outcome analyses are exploratory; no single primary endpoint was prospectively designated as confirmatory. Multiplicity control via Tukey’s HSD test was applied within each endpoint to control family-wise error across group comparisons; it does not control the error rate across the entire outcome panel. Because animals were housed two per cage, individual-level endpoints represent exploratory animal-level comparisons without formal hierarchical cluster adjustment in the summary tables. Shared housing is acknowledged as an experimental constraint, and these exploratory evaluations should be interpreted in the context of this potential clustering dependence.
3. Results
3.1. Body Weight, Energy Intake, and Glycometabolic Outcomes
Initial body weights showed no significant diet, treatment, or interaction effects (p = 0.248, 0.584, and 0.254, respectively; Table 2). Final body weight showed significant diet, treatment, and interaction effects (all p < 0.001). Energy intake and FER were analyzed using four independent cages per group; both endpoints showed significant diet, treatment, and interaction effects (all p < 0.0001). Energy intake is expressed per animal per day, whereas FER represents the mean of four cage-specific ratios. Significant main effects of diet and treatment, as well as significant diet-by-treatment interactions, were observed for fasting glucose, insulin, and HOMA-IR (all p < 0.001).
Within the HFD groups, final body weight, energy intake, and FER decreased across increasing SNE doses, with significant differences between each pair of HFD treatment groups for these endpoints (Tukey-adjusted p < 0.05; Table 2). Compared with HFD controls, the HFD-SNE400 group had lower final body weight (317.49 ± 1.08 vs. 382.79 ± 0.93 g), energy intake (74.35 ± 0.35 vs. 88.70 ± 0.45 kcal/animal/day), and FER (7.78 ± 0.09 vs. 9.98 ± 0.08%). Fasting glucose (94.2 ± 2.3 vs. 146.2 ± 4.1 mg/dL), insulin (10.10 ± 0.40 vs. 22.80 ± 0.90 µIU/mL), and HOMA-IR (2.35 ± 0.11 vs. 8.25 ± 0.42) were significantly lower in HFD-SNE400 than in HFD controls (Tukey-adjusted p < 0.05). Under standard-diet conditions, SNE400 had lower final body weight than the vehicle control and SNE100 groups, but did not differ significantly from SNE200. Energy intake and FER did not differ significantly among the standard-diet groups. No significant differences in fasting glucose, insulin, or HOMA-IR were reported between standard-diet SNE groups and the standard-diet vehicle control. Because no pair-fed comparator was included, the contribution of reduced energy intake cannot be separated from other effects of SNE.
3.2. Lipid Profile
Chronic high-fat feeding induced dyslipidemia, characterized by significant increases in serum triglycerides, total cholesterol, LDL-C, non-HDL-C, and the atherogenic TC/HDL-C ratio, accompanied by a reduction in HDL-C relative to standard-diet controls (all diet main effects: p < 0.001; Table 3). Sambucus nigra fruit extract administration produced dose-dependent improvements in serum lipid parameters (all treatment main effects: p < 0.001), with significant diet-by-treatment interactions across all measured lipid fractions (p < 0.001).
Table 3.
Serum lipid fractions and atherogenic risk indices.
Among obese rats, SNE co-administration was associated with smaller dyslipidemic alterations. High-dose SNE (400 mg/kg) exhibited the largest observed numerical differences, reducing triglycerides (86.4 ± 3.2 vs. 172.5 ± 6.4 mg/dL; p < 0.05), total cholesterol (92.8 ± 3.4 vs. 165.8 ± 5.9 mg/dL; p < 0.05), LDL-C (33.2 ± 1.3 vs. 91.2 ± 3.6 mg/dL; p < 0.05), non-HDL-C (49.3 ± 2.0 vs. 138.0 ± 5.2 mg/dL; p < 0.05), and the TC/HDL-C ratio (2.13 ± 0.08 vs. 5.96 ± 0.24; p < 0.05) relative to HFD vehicle controls, while significantly elevating circulating HDL-C (43.5 ± 1.6 vs. 27.8 ± 1.1 mg/dL; p < 0.05) toward baseline levels (Table 3). In standard-diet cohorts, SNE administration (100–400 mg/kg) caused no unfavorable shifts in lipid metabolism, with no detected adverse changes in these measured lipid endpoints (p > 0.05; Table 3).
3.3. Hepatic and Renal Biochemistry
HFD controls showed higher ALT, AST, ALP, GGT, and total bilirubin, and lower total protein and albumin, than standard-diet controls (Table 4). In HFD-fed animals, SNE co-administration was associated with lower liver enzyme and bilirubin concentrations and higher protein and albumin concentrations. At 400 mg/kg, ALT was 32.5 ± 1.4 versus 81.4 ± 3.6 U/L and AST was 72.1 ± 2.8 versus 152.6 ± 6.0 U/L in HFD controls (Tukey-adjusted p < 0.05). These are biochemical injury-associated observations, rather than direct measurements of hepatic functional recovery.
Table 4.
Comprehensive hepatic enzyme panel and synthetic capacity markers across experimental cohorts.
HFD controls also had higher BUN, urea, creatinine, and uric acid concentrations than standard-diet controls (Table 5). The 400 mg/kg SNE group had lower BUN (17.4 ± 0.7 vs. 32.1 ± 1.3 mg/dL), urea (37.2 ± 1.5 vs. 68.7 ± 2.8 mg/dL), creatinine (0.48 ± 0.02 vs. 0.89 ± 0.04 mg/dL), and uric acid (1.58 ± 0.06 vs. 3.25 ± 0.12 mg/dL) than HFD controls (Tukey-adjusted p < 0.05). The BUN/creatinine ratio showed no significant diet, treatment, or interaction effects (p = 0.113, 0.999, and 0.980, respectively); this finding does not establish intrinsic rather than pre-renal injury. No eGFR or direct clearance measurement is presented, and the selected markers alone do not establish absence of nephrotoxicity.
Table 5.
Comprehensive renal function and nitrogenous metabolite profiling across experimental cohorts.
3.4. Thyroid Hormones and Enteroendocrine Peptides
HFD controls had higher TSH and lower fT3 and fT4 concentrations than standard-diet controls (Table 6). HFD controls also had higher GLP-1 and nesfatin-1 and lower GLP-2. Diet and treatment effects were significant for these hormone and peptide concentrations. In contrast, the fT3/fT4 mass ratio showed no significant diet, treatment, or interaction effects (p = 0.157, 0.850, and 0.805, respectively). This ratio is expressed using common mass-concentration units and does not establish peripheral thyroid-hormone conversion.
Table 6.
Circulating thyroid hormones and enteroendocrine incretin and satiety peptides across experimental cohorts.
In HFD-fed rats, the 400 mg/kg SNE group had lower TSH (0.44 ± 0.02 vs. 0.78 ± 0.04 µIU/mL) and higher fT3 (3.68 ± 0.14 vs. 2.40 ± 0.10 pg/mL) and fT4 (1.65 ± 0.06 vs. 1.15 ± 0.05 ng/dL) than HFD controls (Tukey-adjusted p < 0.05; Table 6). GLP-1 (17.9 ± 0.8 vs. 38.4 ± 1.6 pmol/L) and nesfatin-1 (1.32 ± 0.05 vs. 2.28 ± 0.10 ng/mL) were lower, whereas GLP-2 was higher (3.98 ± 0.17 vs. 1.85 ± 0.08 ng/mL; p < 0.05). These circulating concentrations do not establish restoration of endocrine function. Standard-diet SNE groups showed no significant differences in these measured endocrine endpoints relative to standard-diet controls.
3.5. Gut-Barrier-Related and Adipokine Markers
HFD controls had higher circulating zonulin, LPS, amphiregulin, and asprosin, and lower spexin, adiponectin, and BDNF than standard-diet controls (diet main effect: p < 0.001; Table 7). SNE co-administration was associated with changes in these circulating markers (treatment p < 0.001 and interaction p ≤ 0.007). These associations do not directly establish intestinal permeability, tissue repair, or a gut–liver signaling mechanism.
Table 7.
Gut-barrier integrity, endotoxemia, mucosal repair, and adipokine-related markers across experimental cohorts.
In rats maintained on the high-fat diet, SNE co-treatment was associated with changes in circulating gut-barrier-related and adipokine markers. The 400 mg/kg dosage regimen (HFD—SNE 400) elicited the largest numerical differences for several markers, reducing circulating zonulin (2.85 ± 0.12 vs. 7.85 ± 0.32 ng/mL; p < 0.05), endotoxin LPS (0.24 ± 0.01 vs. 0.82 ± 0.04 EU/mL; p < 0.05), amphiregulin (24.8 ± 1.1 vs. 48.6 ± 2.1 pg/mL; p < 0.05), and serum asprosin (26.0 ± 1.1 vs. 74.5 ± 3.2 ng/mL; p < 0.05) toward baseline levels (Table 7). In parallel, 400 mg/kg SNE was associated with higher circulating spexin (238.6 ± 8.4 vs. 101.8 ± 4.4 pg/mL; p < 0.05) and adiponectin (5.95 ± 0.20 vs. 3.80 ± 0.14 µg/mL; p < 0.05) toward standard-diet control concentrations (Table 7). Circulating BDNF was significantly higher in the HFD-SNE200 (0.272 ± 0.012 ng/mL) and HFD-SNE400 (0.240 ± 0.011 ng/mL) groups than in HFD-C (0.142 ± 0.008 ng/mL; Tukey-adjusted p < 0.05). The HFD-SNE100 group (0.195 ± 0.010 ng/mL) did not differ significantly from HFD-C. The highest mean BDNF concentration among the HFD groups occurred at 200 mg/kg, although the 200 and 400 mg/kg groups did not differ significantly (Table 7). Under standard-diet conditions, administration of SNE across all tested concentrations (100–400 mg/kg) showed no increase in the measured circulating LPS/zonulin concentrations, while standard-diet SNE at 200 and 400 mg/kg was associated with higher concentrations in circulating BDNF (p < 0.05; Table 7).
3.6. Systemic Redox State and Oxidative Damage
Chronic high-fat diet feeding triggered observed systemic redox imbalance, evidenced by substantial surges in total oxidant status (TOS), the oxidative stress index (OSI), lipid peroxidation (serum MDA), and oxidative DNA damage (8-OHdG), alongside a reduction in total antioxidant status (TAS) and the primary antioxidant enzymatic defense machinery comprising superoxide dismutase (SOD), catalase (CAT), and glutathione peroxidase (GPx) relative to standard-diet controls (all diet main effects: p < 0.001; Table 8). Administration of SNE significantly modified all circulating redox metrics in a dose-dependent manner (all treatment main effects: p < 0.001), with two-way ANOVA revealing highly significant diet-by-treatment interactions across all evaluated parameters (all p < 0.001; Table 8).
Table 8.
Systemic redox state, antioxidant enzymatic machinery, and macromolecular oxidative damage across experimental cohorts.
In high-fat-diet-fed cohorts, oral supplementation with SNE was associated with lower systemic oxidative stress and attenuated macromolecular injury in a dose-graded fashion. The high-dose intervention (HFD—SNE 400) demonstrated the largest numerical differences in the listed redox markers, markedly reducing circulating TOS (14.2 ± 0.5 vs. 34.2 ± 1.0 µmol/L; p < 0.05), calculated OSI (0.95 ± 0.04 vs. 4.82 ± 0.22 AU; p < 0.05), serum MDA (2.85 ± 0.10 vs. 6.85 ± 0.24 µmol/L; p < 0.05), and 8-OHdG concentrations (3.95 ± 0.15 vs. 9.85 ± 0.38 ng/mL; p < 0.05) compared to HFD vehicle-control animals (Table 8). Concurrently, 400 mg/kg SNE was associated with higher systemic antioxidant measures, as evidenced by significant elevations in TAS (1.50 ± 0.05 vs. 0.71 ± 0.03 mmol/L; p < 0.05), SOD activity (12.9 ± 0.4 vs. 5.6 ± 0.2 U/mL; p < 0.05), CAT activity (35.0 ± 1.1 vs. 16.0 ± 0.6 kU/L; p < 0.05), and GPx activity (147.0 ± 3.9 vs. 68.5 ± 2.5 U/L; p < 0.05) back toward baseline control ranges (Table 8). Under standard-diet conditions, SNE administration at 200 and 400 mg/kg significantly boosted basal TAS and antioxidant enzyme activities (SOD, CAT, GPx) relative to the vehicle control cohort (C) (p < 0.05), without causing pro-oxidant elevations in TOS, MDA, or 8-OHdG (p > 0.05; Table 8).
3.7. Descriptive Multiorgan Histology
The representative H&E sections show differences in organ appearance between the groups (Figure 2). HFD-control sections show hepatic lipid vacuolation and ballooning, ileal epithelial abnormalities and villus blunting, enlarged adipocytes with inflammatory aggregates, and renal tubular vacuolation and casts. These descriptions concern the illustrated sections and were not quantified as animal-level lesion scores or morphometric outcomes.
Representative HFD-SNE sections show less conspicuous lesions than the illustrated HFD-control sections, particularly at 400 mg/kg. Apparent preservation of ileal, adipose, hepatic, and renal structure is described qualitatively; no quantitative restoration of villus height, adipocyte size, glomerular morphology, or lesion burden is claimed. Standard-diet SNE sections show no conspicuous degenerative lesions in the representative panels. These appearances provide limited tolerability observations and do not establish comprehensive histological safety. Throughout the 16-week intervention, all 64 animals completed the protocol without mortality or treatment interruptions (n = 8 per group). Routine monitoring revealed no overt signs of distress. However, in the absence of a structured clinical scoring methodology, quantified adverse-event frequencies and comprehensive tolerability cannot be established. Observations of favorable profiles in standard-diet SNE cohorts are strictly confined to the reported biochemical biomarkers and qualitative tissue sections, and do not constitute proof of comprehensive toxicological safety.
4. Discussion
The central finding is that SNE was associated with coordinated improvement across glycemic control, circulating lipids, hepatorenal injury markers, gut-barrier-related indices, endocrine peptides, systemic antioxidant defenses, oxidative macromolecular damage, and descriptive organ histology in HFD-fed rats. The reported diet-by-treatment interactions were statistically significant across the evaluated parameters, demonstrating distinct response patterns across dietary backgrounds. The absence of a comparable adverse pattern in standard-diet SNE groups provides observations limited to the selected endpoints, although it does not replace dedicated toxicology.
High-fat feeding commonly drives excess energy intake and adiposity together with insulin resistance and dyslipidemia [3,5,6]. In the present data, HFD-C displayed marked hyperglycemia, hyperinsulinemia, high HOMA-IR, hypertriglyceridemia, increased atherogenic cholesterol fractions, and reduced high-density lipoprotein cholesterol. SNE shifted these outcomes toward control values in a graded manner, with the strongest overall pattern at 400 mg/kg. The metabolic findings are broadly consistent with the study by Farrell et al. [20]. However, that study reported no significant differences in food intake or body-weight gain among the HFD groups, whereas energy intake and final body weight were lower in the present HFD-SNE groups. This difference limits direct comparison of the underlying effects. AMPK activity, glucose transport, hepatic lipid synthesis, fatty-acid oxidation, and inflammatory signaling were not directly measured. Therefore, the present findings cannot establish whether these pathways contributed to the observed differences.
Energy intake and feed efficiency ratio (FER) need to be interpreted together. FER expresses body-weight gain per unit of feed consumed, rather than a direct measure of thermogenesis, nutrient absorption, or energy expenditure. In the HFD groups, the reported FER decreased from 9.98 ± 0.08% in HFD-C to 9.28 ± 0.10%, 8.30 ± 0.14%, and 7.78 ± 0.09% at 100, 200, and 400 mg/kg/day, respectively (Table 2). Energy intake also decreased, from 88.70 ± 0.45 to 74.35 ± 0.35 kcal/animal/day between HFD-C and HFD-SNE400. The lower FER therefore describes less body-weight gain per gram of feed consumed within the HFD background, where the diet composition was shared. It is compatible with a change in the relationship between intake and growth, but it does not demonstrate an intake-independent pharmacological effect: restricting intake can itself change the balance between maintenance requirements and tissue accretion. FER was calculated from four cage-specific ratios per group, and its denominator is feed mass rather than caloric intake; comparisons between different diet formulations therefore require additional caution. Without a pair-fed HFD comparator, body-composition measurements, digestibility assessment, or indirect calorimetry, the contributions of lower intake, altered nutrient utilization, and energy expenditure cannot be separated. We therefore do not use FER to claim that reduced energy intake has been excluded as an explanation.
The hepatic and renal profiles extend the metabolic findings. HFD-C showed elevated liver enzymes, bilirubin, urea-related metabolites, creatinine, and uric acid, with lower circulating protein and albumin. SNE was associated with changes toward standard-diet values accompanied by less conspicuous hepatic and renal injury in the representative sections. Reduced lipid delivery, improved insulin action, and lower oxidant burden could jointly decrease hepatocellular and tubular stress. Nevertheless, serum enzymes are indirect injury markers, and histology was not scored at the animal level. Accordingly, the data support associations with lower measured injury markers but not a definitive structural or mechanistic claim.
The gut-barrier pattern was similarly coherent. HFD-C had higher zonulin and circulating lipopolysaccharide together with higher amphiregulin and lower glucagon-like peptide-2. Metabolic endotoxemia is an established experimental link between diet-induced microbial/barrier disruption and insulin resistance [7,8]. Glucagon-like peptide-2 supports mucosal growth and barrier integrity [10], whereas amphiregulin may rise as part of an epithelial repair response [11]. The simultaneous reduction in lipopolysaccharide-associated endotoxemia and descriptive ileal injury with SNE is compatible with improved barrier function. However, circulating zonulin immunoassays have recognized specificity limitations [9], and this experiment did not include permeability tracers, tight-junction proteins, microbiome profiling, or short-chain fatty acids. The gut-barrier interpretation should therefore remain multimarker and cautious.
SNE also reorganized a broad endocrine-peptide signature. HFD increased asprosin and reduced spexin and adiponectin, changes directionally consistent with impaired glucose regulation, altered lipid handling, and adipose dysfunction [12,13,14]. Brain-derived neurotrophic factor exhibited a non-linear dose–response pattern, with the highest concentration observed at 200 mg/kg in HFD-fed rats. The thyroid profile moved toward standard-diet values with increasing SNE dose. These findings describe an integrated signature, but serum associations do not establish central or tissue-specific signaling; receptor activation, gene expression, and pathway phosphorylation are required for mechanistic attribution.
The circulating peptide findings provide biological context for reduced intake, but do not identify its mediator. Central administration experiments established anorexigenic actions of GLP-1 and nesfatin-1 [32,33]. In the present study, however, HFD-SNE400 had lower fasting GLP-1 (17.9 ± 0.8 versus 38.4 ± 1.6 pmol/L) and nesfatin-1 (1.32 ± 0.05 versus 2.28 ± 0.10 ng/mL) than HFD-C (Table 6). Thus, the reduced intake was not accompanied by increased circulating concentrations of these two satiety-related peptides, and our results do not support a simple “higher satiety hormones caused lower intake” explanation. Concentrations moving toward standard-diet values may reflect altered metabolic state or feedback, but neither receptor sensitivity nor central signaling was measured. Conversely, lower asprosin is directionally compatible with reduced orexigenic drive because experimental asprosin manipulation affects appetite [34]; the concurrent spexin and BDNF findings also motivate further investigation [13,15]. These associations do not establish mediation, and the non-monotonic BDNF response argues against assigning a single linear peptide mechanism to all doses. The samples were obtained after a 12 h fast at the end of the intervention, without serial postprandial measurements, meal-pattern analysis, receptor manipulation, or central tissue endpoints. The peptide differences could consequently be a cause, consequence, or correlate of altered intake and adiposity. Pair-feeding and time-resolved endocrine studies are needed to distinguish these possibilities.
Oxidative imbalance is both a consequence and amplifier of obesity-associated metabolic dysfunction [2,4]. HFD-C combined lower TAS and antioxidant-enzyme activities with higher TOS, OSI, malondialdehyde, and 8-hydroxy-2′-deoxyguanosine, indicating concordant oxidant burden, lipid peroxidation, and oxidative DNA damage. SNE improved each domain, while standard-diet SNE at 200 and 400 mg/kg increased several antioxidant measures without evidence of pro-oxidant injury. The extract’s cyanidin glycosides can contribute through direct radical chemistry, modulation of endogenous antioxidant-response pathways, and microbial metabolites [16,17,18,19]. Because circulating parent anthocyanins are extensively metabolized, however, the in vivo response should not be described as simple direct scavenging; pharmacokinetic and tissue-distribution data are needed.
The study combines a factorial diet-by-dose design, three SNE doses, and multiple metabolic, endocrine, redox, and descriptive histological outcomes. Chemical characterization identified the principal anthocyanin constituents and quantified the total phenolic and monomeric anthocyanin contents of the extract. Biological coherence across outcomes is descriptive evidence and does not eliminate energy-intake confounding or establish a mechanism.
The findings are discussed in relation to the experimental design, dietary conditions, and measured outcomes. The number of outcomes introduces multiplicity beyond endpoint-specific Tukey comparisons. Food consumption was measured daily in four two-rat cages per group, with spilled food accounted for. Energy intake and feed efficiency were analyzed using four independent cages per group, with the cage as the experimental unit. Nevertheless, the small number of independent cages limits the precision of these estimates. Histology remains descriptive, with no quantitative animal-level scoring. The experimental design focused on metabolic, endocrine, redox, and histopathological responses during concurrent high-fat diet and SNE administration. The experimental model included only male Wistar albino rats; therefore, potential sex-dependent differences in metabolic, endocrine, and oxidative stress responses to SNE could not be evaluated. Consequently, the findings should not be directly generalized to female animals. Selected tolerability observations do not establish comprehensive toxicity safety or an effective human dose. Shared housing (two rats per cage) introduces potential clustering dependence that was not hierarchically adjusted in individual-level biochemical models; this constitutes an experimental limitation of the housing framework. The outcome panel is exploratory, with multiplicity control confined to comparisons within each endpoint. No quantified clinical adverse-event dataset is presented; daily monitoring statements therefore do not establish zero event rates. Serum urea was calculated directly from BUN using a stoichiometric factor of 2.14; thus, these parameters reflect a single analytical determination rather than independent corroborating evidence.
Some pairwise conclusions were sensitive to the statistical method. For example, HOMA-IR in the HFD-SNE400 group did not differ significantly from that in the standard-diet control under Tukey HSD (p = 0.295), whereas the Games–Howell comparison indicated a difference (p = 0.0059). Therefore, the findings do not establish complete normalization or equivalence to standard-diet controls. These findings should be interpreted in relation to the observed treatment effects and the corresponding statistical comparisons.
The findings are most defensibly interpreted as associations between SNE co-administration and lower HFD-related abnormalities during concurrent exposure. Many endpoints showed their largest numerical differences at 400 mg/kg, but the BDNF pattern was not monotonic. These observations do not establish effects independent of energy intake or identify the pathway initiating the response.
5. Conclusions
During concurrent 16-week HFD and SNE exposure, SNE co-administration was associated with lower measured metabolic and hepatorenal injury markers, altered circulating gut-barrier-related and endocrine markers, and lower oxidative damage measures. Many endpoints showed their largest numerical differences from HFD controls at 400 mg/kg/day, although this pattern was not uniform. Without pair-feeding, the contribution of reduced energy intake cannot be separated from other effects of the extract. Representative histology supports qualitative comparisons only. The measured endpoints do not establish comprehensive toxicological safety, treatment efficacy in established obesity, or clinical applicability. The statistical findings are exploratory, and individual-level endpoints should be interpreted with consideration of the shared cage housing design. Future studies may further investigate the metabolic and molecular pathways associated with Sambucus nigra fruit extract and explore its effects across different experimental conditions.
Author Contributions
Conceptualization, M.Y., B.B. and H.Ü.; methodology, M.Y., B.B., H.Ü., V.A. and E.T.; validation, B.B., G.C.K., F.G. and M.Y.; formal analysis, B.B., G.C.K. and F.G.; investigation, M.Y., B.B., H.Ü., V.A., E.T., F.G. and G.C.K.; resources, M.Y., V.A. and E.T.; data curation, H.Ü., B.B. and G.C.K.; writing—original draft preparation, B.B., H.Ü. and M.Y.; writing—review and editing, B.B., G.C.K., V.A., E.T., F.G. and M.Y.; visualization, B.B. and G.C.K.; supervision, M.Y.; project administration, M.Y. and B.B. All authors have read and agreed to the published version of the manuscript.
Funding
This research received no external funding.
Institutional Review Board Statement
The animal study protocol was conducted in accordance with national animal welfare regulations and was approved by the Local Ethics Committee for Animal Experiments (Decision No: 086/4, Approval Date: 1 November 2024). Study reporting was guided by ARRIVE 2.0.
Informed Consent Statement
Not applicable.
Data Availability Statement
Group-level summary results are presented in the article. Individual animal-level and cage-level datasets are not publicly available.
Acknowledgments
The authors thank the technical and laboratory staff of the animal experimental research facility for their dedicated assistance during animal maintenance and sampling procedures. During the preparation of this manuscript, the authors utilized artificial intelligence tools for English language editing, stylistic refinement, and formatting support. The authors critically reviewed and edited all outputs and take full responsibility for the integrity and content of this publication.
Conflicts of Interest
The authors declare no conflicts of interest.
References
- World Health Organization. Obesity and Overweight; WHO Fact Sheet; WHO: Geneva, Switzerland, 2024. [Google Scholar]
- Furukawa, S.; Fujita, T.; Shimabukuro, M.; Iwaki, M.; Yamada, Y.; Nakajima, Y.; Nakayama, O.; Makishima, M.; Matsuda, M.; Shimomura, I. Increased oxidative stress in obesity and its impact on metabolic syndrome. J. Clin. Investig. 2004, 114, 1752–1761. [Google Scholar] [CrossRef] [PubMed]
- Hotamisligil, G.S. Inflammation and metabolic disorders. Nature 2006, 444, 860–867. [Google Scholar] [CrossRef] [Scilit] [PubMed]
- Saltiel, A.R.; Olefsky, J.M. Inflammatory mechanisms linking obesity and metabolic disease. J. Clin. Investig. 2017, 127, 1–4. [Google Scholar] [CrossRef] [Scilit] [PubMed]
- Speakman, J.R. Use of high-fat diets to study rodent obesity as a model of human obesity. Int. J. Obes. 2019, 43, 1491–1492. [Google Scholar] [CrossRef] [Scilit] [PubMed]
- Hariri, N.; Thibault, L. High-fat diet-induced obesity in animal models. Nutr. Res. Rev. 2010, 23, 270–299. [Google Scholar] [CrossRef] [Scilit] [PubMed]
- Cani, P.D.; Amar, J.; Iglesias, M.A.; Poggi, M.; Knauf, C.; Bastelica, D.; Neyrinck, A.M.; Fava, F.; Tuohy, K.M.; Chabo, C.; et al. Metabolic endotoxemia initiates obesity and insulin resistance. Diabetes 2007, 56, 1761–1772. [Google Scholar] [CrossRef] [Scilit] [PubMed]
- Cani, P.D.; Bibiloni, R.; Knauf, C.; Waget, A.; Neyrinck, A.M.; Delzenne, N.M.; Burcelin, R. Changes in gut microbiota control metabolic endotoxemia-induced inflammation in high-fat diet-induced obesity and diabetes in mice. Diabetes 2008, 57, 1470–1481. [Google Scholar] [CrossRef] [Scilit] [PubMed]
- Fasano, A. Zonulin, regulation of tight junctions, and autoimmune diseases. Ann. N. Y. Acad. Sci. 2012, 1258, 25–33. [Google Scholar] [CrossRef] [Scilit] [PubMed]
- Drucker, D.J.; Yusta, B. Physiology and pharmacology of the enteroendocrine hormone glucagon-like peptide-2. Annu. Rev. Physiol. 2014, 76, 561–583. [Google Scholar] [CrossRef] [Scilit] [PubMed]
- Zaiss, D.M.W.; Gause, W.C.; Osborne, L.C.; Artis, D. Emerging functions of amphiregulin in orchestrating immunity, inflammation, and tissue repair. Immunity 2015, 42, 216–226. [Google Scholar] [CrossRef] [Scilit] [PubMed]
- Romere, C.; Duerrschmid, C.; Bournat, J.; Constable, P.; Jain, M.; Xia, F.; Saha, P.K.; Del Solar, M.; Zhu, B.; York, B.; et al. Asprosin, a fasting-induced glucogenic protein hormone. Cell 2016, 165, 566–579. [Google Scholar] [CrossRef] [Scilit] [PubMed]
- Walewski, J.L.; Ge, F.; Lobdell, H.; Levin, N.; Schwartz, G.J.; Vasselli, J.R.; Pomp, A.; Dakin, G.; Berk, P.D. Spexin is a novel human peptide that reduces adipocyte uptake of long chain fatty acids and causes weight loss in rodents with diet-induced obesity. Obesity 2014, 22, 1643–1652. [Google Scholar] [CrossRef] [Scilit] [PubMed]
- Yamauchi, T.; Kamon, J.; Waki, H.; Terauchi, Y.; Kubota, N.; Hara, K.; Mori, Y.; Ide, T.; Murakami, K.; Tsuboyama-Kasaoka, N.; et al. The fat-derived hormone adiponectin reverses insulin resistance associated with both lipoatrophy and obesity. Nat. Med. 2001, 7, 941–946. [Google Scholar] [CrossRef] [Scilit] [PubMed]
- Rios, M.; Fan, G.; Fekete, C.; Kelly, J.; Bates, B.; Kuehn, R.; Lechan, R.M.; Jaenisch, R. Conditional deletion of brain-derived neurotrophic factor in the postnatal brain leads to obesity and hyperactivity. Mol. Endocrinol. 2001, 15, 1748–1757. [Google Scholar] [CrossRef] [PubMed]
- Sidor, A.; Gramza-Michałowska, A. Advanced research on the antioxidant and health benefit of elderberry (Sambucus nigra) in food—A review. J. Funct. Foods 2015, 18, 941–958. [Google Scholar] [CrossRef] [Scilit]
- Veberic, R.; Jakopic, J.; Stampar, F.; Schmitzer, V. European elderberry (Sambucus nigra L.) rich in sugars, organic acids, anthocyanins and selected polyphenols. Food Chem. 2009, 114, 511–515. [Google Scholar] [CrossRef] [Scilit]
- Wu, X.; Gu, L.; Prior, R.L.; McKay, S. Characterization of anthocyanins and proanthocyanidins in some cultivars of Ribes, Aronia, and Sambucus and their antioxidant capacity. J. Agric. Food Chem. 2004, 52, 7846–7856. [Google Scholar] [CrossRef] [Scilit] [PubMed]
- Castañeda-Ovando, A.; Pacheco-Hernández, M.L.; Páez-Hernández, M.E.; Rodríguez, J.A.; Galán-Vidal, C.A. Chemical studies of anthocyanins: A review. Food Chem. 2009, 113, 859–871. [Google Scholar] [CrossRef] [Scilit]
- Farrell, N.J.; Norris, G.H.; Ryan, J.; Porter, C.M.; Jiang, C.; Blesso, C.N. Black elderberry extract attenuates inflammation and metabolic dysfunction in diet-induced obese mice. Br. J. Nutr. 2015, 114, 1123–1131. [Google Scholar] [CrossRef] [Scilit] [PubMed]
- Appenteng, M.K.; Krueger, R.; Johnson, M.C.; Ingold, H.; Bell, R.; Thomas, A.L.; Greenlief, C.M. Cyanogenic glycoside analysis in American elderberry. Molecules 2021, 26, 1384. [Google Scholar] [CrossRef] [Scilit] [PubMed]
- Rivero, G.; Cienfuegos, J.A.; Rodríguez, A.; Catalán, V.; Ramírez, B.; Neira, G.; Gómez-Ambrosi, J.; Frühbeck, G.; Becerril, S. Sex- and depot-dependent differences in adipocyte morphology and gene expression in diet-induced obesity. Diabetes Res. Clin. Pract. 2025, 230, 112958. [Google Scholar] [CrossRef] [Scilit] [PubMed]
- Percie du Sert, N.; Hurst, V.; Ahluwalia, A.; Alam, S.; Avey, M.T.; Baker, M.; Browne, W.J.; Clark, A.; Cuthill, I.C.; Dirnagl, U.; et al. The ARRIVE guidelines 2.0: Updated guidelines for reporting animal research. PLoS Biol. 2020, 18, e3000410. [Google Scholar] [CrossRef] [Scilit] [PubMed]
- Pistell, P.J.; Morrison, C.D.; Gupta, S.; Knight, A.G.; Keller, J.N.; Ingram, D.K.; Bruce-Keller, A.J. Cognitive impairment following high fat diet consumption is associated with brain inflammation. J. Neuroimmunol. 2010, 219, 25–32. [Google Scholar] [CrossRef] [Scilit] [PubMed]
- Reeves, P.G.; Nielsen, F.H.; Fahey, G.C., Jr. AIN-93 purified diets for laboratory rodents: Final report of the American Institute of Nutrition ad hoc writing committee on the reformulation of the AIN-76A rodent diet. J. Nutr. 1993, 123, 1939–1951. [Google Scholar] [CrossRef] [Scilit] [PubMed]
- Singleton, V.L.; Rossi, J.A. Colorimetry of total phenolics with phosphomolybdic-phosphotungstic acid reagents. Am. J. Enol. Vitic. 1965, 16, 144–158. [Google Scholar] [CrossRef] [Scilit]
- Giusti, M.M.; Wrolstad, R.E. Characterization and measurement of anthocyanins by UV-visible spectroscopy. Curr. Protoc. Food Anal. Chem. 2001, 1, F1.2.1–F1.2.13. [Google Scholar] [CrossRef] [Scilit]
- Matthews, D.R.; Hosker, J.P.; Rudenski, A.S.; Naylor, B.A.; Treacher, D.F.; Turner, R.C. Homeostasis model assessment: Insulin resistance and beta-cell function from fasting plasma glucose and insulin concentrations in man. Diabetologia 1985, 28, 412–419. [Google Scholar] [CrossRef] [Scilit] [PubMed]
- Erel, O. A novel automated direct measurement method for total antioxidant capacity using a new generation, more stable ABTS radical cation. Clin. Biochem. 2004, 37, 277–285. [Google Scholar] [CrossRef] [Scilit] [PubMed]
- Erel, O. A new automated colorimetric method for measuring total oxidant status. Clin. Biochem. 2005, 38, 1103–1111. [Google Scholar] [CrossRef] [Scilit] [PubMed]
- Ohkawa, H.; Ohishi, N.; Yagi, K. Assay for lipid peroxides in animal tissues by thiobarbituric acid reaction. Anal. Biochem. 1979, 95, 351–358. [Google Scholar] [CrossRef] [Scilit] [PubMed]
- Turton, M.D.; O’Shea, D.; Gunn, I.; Beak, S.A.; Edwards, C.M.B.; Meeran, K.; Choi, S.J.; Taylor, G.M.; Heath, M.M.; Lambert, P.D.; et al. A role for glucagon-like peptide-1 in the central regulation of feeding. Nature 1996, 379, 69–72. [Google Scholar] [CrossRef] [Scilit] [PubMed]
- Oh-I, S.; Shimizu, H.; Satoh, T.; Okada, S.; Adachi, S.; Inoue, K.; Eguchi, H.; Yamamoto, M.; Imaki, T.; Hashimoto, K.; et al. Identification of nesfatin-1 as a satiety molecule in the hypothalamus. Nature 2006, 443, 709–712. [Google Scholar] [CrossRef] [Scilit] [PubMed]
- Duerrschmid, C.; He, Y.; Wang, C.; Li, C.; Bournat, J.C.; Romere, C.; Saha, P.K.; Lee, M.E.; Phillips, K.J.; Jain, M.; et al. Asprosin is a centrally acting orexigenic hormone. Nat. Med. 2017, 23, 1444–1453. [Google Scholar] [CrossRef] [Scilit] [PubMed]

Disclaimer/Publisher’s Note: The statements, opinions and data contained in all publications are solely those of the individual author(s) and contributor(s) and not of MDPI and/or the editor(s). MDPI and/or the editor(s) disclaim responsibility for any injury to people or property resulting from any ideas, methods, instructions or products referred to in the content. |
© 2026 by the authors. Licensee MDPI, Basel, Switzerland. This article is an open access article distributed under the terms and conditions of the Creative Commons Attribution (CC BY) license.