


Abstract
Background: Photoplethysmography (PPG) offers a simple peripheral optical signal that may contain cardiac structure- and function-related information. However, multidomain PPG feature–echocardiographic remodeling phenotype associations and whether these associations vary with kidney function remain incompletely characterized. Methods: We performed a secondary observational analysis of 1283 cardiology participants. Four PPG indices representing temporal, harmonic, and pulse-rate variability domains, including systolic duration (Ts), systolic-to-diastolic duration ratio (Ts/Td), second-harmonic-to-fundamental ratio (H2/H1), and low-frequency-to-high-frequency ratio (LF/HF), were evaluated against the early mitral inflow velocity-to-early diastolic mitral annular velocity ratio (E/e′), left atrial volume index (LAVI), and left ventricular mass index (LVMI). All 1283 participants were included in the primary analyses of each echocardiographic outcome. Multivariable regression was adjusted for age, sex, body mass index, systolic blood pressure, pulse rate, hypertension, diabetes mellitus, coronary artery disease, beta-blocker use, and estimated glomerular filtration rate (eGFR). False-discovery-rate (FDR) correction was applied; kidney-function interactions were investigated using eGFR < 60 versus ≥60 mL/min/1.73 m2. Results: Higher log2(LF/HF) was independently associated with lower E/e′ (−5.02% per 1-standard-deviation increase; 95% confidence interval [CI], −7.51% to −2.46%; q = 0.002), lower LAVI (−5.19%; 95% CI, −7.91% to −2.39%; q = 0.002), and lower LVMI (−2.57%; 95% CI, −4.60% to −0.50%; q = 0.046). Higher Ts/Td was associated with higher LVMI (+4.05%; q = 0.028), whereas higher H2/H1 was associated with lower LVMI (−3.48%; q = 0.049). Kidney function significantly altered several PPG–remodeling associations, most prominently for LAVI; LF/HF–LAVI associations in participants with eGFR ≥ 60 and <60 mL/min/1.73 m2 were −2.91% and −11.92%, respectively (interaction q = 0.007). Sensitivity analyses generally supported the principal findings; however, incorporating the four PPG indices into clinical models yielded minimal incremental predictive improvement. Conclusions: PPG-derived pulse variability and waveform features were associated with diastolic function and cardiac remodeling echocardiographic measures, with considerable kidney-function-dependent heterogeneity. These findings support PPG as a physiological phenotyping tool for cardiorenal and remodeling-related signals but not as a stand-alone replacement for echocardiography.
1. Introduction
Cardiac remodeling and impaired diastolic function represent key features of a broad spectrum of cardiovascular disorders, including hypertension, coronary artery disease, heart failure, and cardiorenal disease [1]. Echocardiographic indices, including the early mitral inflow velocity-to-early diastolic mitral annular velocity ratio (E/e′), left atrial volume index (LAVI), and left ventricular mass index (LVMI), offer complementary information regarding ventricular filling pressure, chronic atrial remodeling, and ventricular hypertrophic remodeling [2,3]. These measurements are clinically informative; however, their assessment warrants dedicated echocardiographic equipment and trained personnel. Accordingly, growing interest exists in whether simpler peripheral physiological signals may capture cardiac structure- and function-related information [4].
Photoplethysmography (PPG) represents a low-cost optical technique that measures pulsatile changes in peripheral blood volume and is increasingly available in wearable devices, smartphones, and bedside monitoring systems [5,6]. Although PPG is frequently employed for pulse-rate and oxygen-saturation estimation, the waveform contains supplementary temporal, morphological, harmonic, and beat-to-beat variability information [5,7]. These features potentially reflect the integrated effects of cardiac ejection, vascular compliance, pulse-wave transmission, peripheral vascular tone, and autonomic regulation [7,8]. Consequently, PPG has been investigated as a possible digital biomarker for blood pressure, vascular aging, autonomic function, and cardiovascular disease phenotyping [5,7].
Previous studies, including our own studies, have revealed that PPG-derived time- and frequency-domain features contain physiologically meaningful vascular load-related information and can support interpretable classification of blood pressure status [8,9]. However, the association of peripheral pulse characteristics with echocardiographic measures of diastolic function and cardiac structural remodeling after accounting for conventional clinical covariates remains inadequately elucidated [10]. This distinction is crucial, as a signal may carry physiologically meaningful population-level information despite a limited incremental individual-level predictive performance [11].
Among PPG-derived measures, pulse-rate variability (PRV) is particularly noteworthy. PRV, derived from beat-to-beat pulse intervals, shares some characteristics with electrocardiographic heart-rate variability; however, they are not physiologically identical [10,12]. Besides sinus-node timing, PPG pulse intervals may be impacted by pulse-transit time, arterial stiffness, vascular tone, and peripheral perfusion [7,10]. Therefore, spectral PRV indices, including the low-frequency-to-high-frequency ratio (LF/HF), should be interpreted as integrated peripheral cardiovascular markers rather than direct quantitative measures of sympathovagal balance [10,13]. Similarly, waveform timing features and harmonic ratios may encode ventricular ejection and arterial wave transmission features that could be modified in the presence of cardiac remodeling [7,14].
Kidney function may further alter these associations. An association exists between decreased estimated glomerular filtration rate (eGFR) and volume expansion, arterial stiffness, endothelial dysfunction, vascular calcification, autonomic dysregulation, and altered ventricular loading [15,16]. These processes can impact cardiac remodeling and peripheral pulse-wave characteristics [17]. Therefore, a specified PPG feature and an echocardiographic phenotype may not exhibit a constant association across kidney-function levels. Investigating kidney function as an effect modifier, rather than solely as an adjustment covariate, may therefore offer further insights into the physiological context wherein PPG-derived biomarkers function.
This study evaluated the associations between selected PPG features and three echocardiographic phenotypes, including E/e′, LAVI, and LVMI, in a 1283-participant cardiology cohort. Four PPG indices representing complementary signal domains were investigated: the systolic duration (Ts), systolic-to-diastolic duration ratio (Ts/Td), second-harmonic-to-fundamental ratio (H2/H1), and PRV-derived LF/HF. The primary objectives were to determine whether an independent association exists between these indices and diastolic function and cardiac remodeling echocardiographic measures and to test whether kidney function altered these associations. Secondary analyses evaluated robustness across alternative model specifications, associations with categorical structural abnormalities, incremental predictive value beyond clinical variables, and exploratory signals across a wider set of PPG features.
We hypothesized that selected PPG-derived temporal, harmonic, and variability features would demonstrate quantifiable associations with echocardiographic cardiac phenotypes and that the magnitude of these associations would vary according to kidney function. Considering the observational and exploratory nature of this study, the analyses aimed to characterize physiological associations and yield hypotheses for future prospective validation rather than to establish a stand-alone diagnostic application.
2. Materials and Methods
2.1. Study Design and Study Population
This study was a secondary observational analysis of a clinical PPG database obtained from a cardiology outpatient acquisition program at China Medical University Hospital, Taichung, Taiwan. The analytical dataset encompassed 1283 independent participants. Adult records were screened for physiologically plausible clinical values and availability of the variables required for the present analyses. All 1283 participants were retained in the primary analyses of E/e′, LAVI, and LVMI, with no outcome-specific reduction in sample size. As the four focused PPG indices were prioritized following preliminary evaluation of a broader feature set, this study was designed as an exploratory hypothesis-generating analysis.
2.2. PPG Acquisition
Our previously described single-sensor system served as the basis of the general PPG acquisition framework [8]. Peripheral PPG signals were acquired from the left index fingertip using a reflective optical sensor (MAX30102; Maxim Integrated, San Jose, CA, USA) interfaced with a Raspberry Pi 5 (Raspberry Pi Foundation, Cambridge, UK) through an I2C communication protocol. The sampling frequency was set at 500 Hz to preserve high-resolution waveform morphology and support harmonic-domain analysis. To minimize short-term autonomic and hemodynamic fluctuations, participants remained quietly seated for at least 10 min before recording. Each recording spanned 90 s under standardized outpatient resting conditions. Participants were instructed to reduce finger movement and excessive muscle tension and maintain spontaneous breathing. To reduce optical interference, ambient-light exposure was diminished during signal capture [5,18]. Rather than reprocessing the raw optical waveforms, the present analysis utilized the stored PPG-derived features generated by the signal-processing pipeline described below.
2.3. PPG Signal Processing and Feature Extraction
2.3.1. Preprocessing and Signal Conditioning
The general signal-processing and feature extraction framework followed our previously published PPG studies, with study-specific modifications applied for this analysis [8,9].
A Kaiser-window finite-impulse-response band-pass filter with a 0.5–5 Hz passband and 0.3- and 6 Hz stopband frequencies was used for conditioning raw infrared PPG signals. The filter order was determined using the MATLAB R2023b (MathWorks, Natick, MA, USA) kaiserord function and capped at 300 to maintain a practical filter length. Subsequently, to avoid phase distortion of waveform landmarks, zero-phase filtering was applied using filtfilt. Residual baseline variation was removed using a 1.5 s moving-average baseline. This preprocessing pipeline was intended to suppress slow baseline drift and high-frequency noise while preserving the principal pulse-wave morphology and fiducial timing used for subsequent time-domain and harmonic feature extraction [19,20]. Because filter characteristics, including cutoff frequency, filter order, and phase response, can influence waveform contour, landmark timing, and harmonic-energy estimates, the derived Ts, Ts/Td, and harmonic ratios should be interpreted as features obtained under a standardized processing pipeline rather than as filter-independent physiological quantities [19,20,21].
Because the 5 Hz upper cutoff was fixed across participants, higher-order cardiac harmonics may approach or exceed the passband as heart rate increases; consequently, attenuation of higher-frequency waveform content and associated effects on harmonic ratios or fiducial-point morphology cannot be excluded.
2.3.2. Signal Quality Assessment
PPG signals are vulnerable to motion contamination and other beat detection- and waveform feature extraction-impairing artifacts [22,23]. Signal quality was evaluated using the pulsatile component-to-static optical background ratio. The signal quality index (SQI) was calculated as SQI (%) = (AC/DC) × 100, where AC was the peak-to-trough amplitude of the filtered infrared waveform, and DC was the mean intensity of the corresponding raw infrared signal. Recordings with SQI < 0.2% were excluded from feature extraction owing to inadequate pulsatile content or possible motion contamination. To confirm morphological plausibility before automated feature analysis, all retained waveforms were further visually inspected. This study investigated the stored feature dataset generated following this source-level signal quality procedure. These quality-control procedures were intended to improve the stability of downstream morphological and harmonic feature extraction by minimizing low-amplitude, motion-contaminated, or morphologically implausible waveforms.
2.3.3. Pulse-Cycle Detection and Time-Domain Feature Extraction
To improve systolic peak (P1) localization, peak-detection algorithms with derivative-assisted validation were used for identifying individual pulse cycles. Within each artifact-free cardiac cycle, systolic and diastolic timing landmarks were identified using the waveform contour together with derivative-assisted validation. Ts was defined as the interval from the beginning of the pulse cycle to the dicrotic notch or equivalent post-systolic inflection landmark, whereas Td was defined as the interval from this landmark to the end of the same pulse cycle. When this landmark could not be reliably identified because of absent notch morphology, excessive noise, or waveform distortion, the corresponding beat was excluded from Ts and Td estimation. Beats with implausible cycle duration, abnormal morphology, excessive amplitude distortion, or failed peak/landmark detection were also excluded from beat-level feature calculation. The source processing pipeline additionally derived pulse morphology measurements, including peak amplitude, integrated pulse area, cycle duration, pulse rate, and systolic upstroke characteristics. The standard deviation of pulse area (Std_AREA) was used to summarize beat-to-beat variability in pulse energy. For the focused analyses in this study, Ts and Ts/Td were the stored temporal indices of interest. Participant-level time-domain values were calculated by averaging the retained artifact-free valid cycles.
2.3.4. Frequency-Domain and Harmonic Analysis
Welch’s method was used for waveform frequency-domain analysis of the 500 Hz PPG signal. A Hamming window of 8192 samples, corresponding to a segment duration of 16.384 s, was applied with 50% overlap, and an 8192-point FFT was used for spectral estimation. At the 500 Hz sampling frequency, this configuration yielded a frequency-bin spacing of approximately 0.061 Hz. The relatively long analysis window was selected to provide adequate spectral separation between the cardiac fundamental frequency and its low-order harmonics and to support local harmonic-energy integration within ±0.2 Hz of each expected harmonic frequency. The fundamental frequency (H1) was defined as the largest non-DC spectral component, and higher-order harmonics (H2–H4) were located at integer multiples of the fundamental frequency. Harmonic energy was integrated within ±0.2 Hz of each expected harmonic frequency. This bandwidth was selected as a pragmatic spectral-integration window rather than as a physiological threshold. The purpose was to capture energy distributed around each nominal harmonic because of finite-window spectral leakage, limited frequency resolution, and small beat-to-beat variability in the fundamental frequency, while limiting contamination from neighboring spectral components. Because the estimated harmonic energy depends on the integration bandwidth, H2/H1 should be interpreted as a processing-dependent spectral descriptor rather than an absolute physiological constant. To quantify the redistribution of pulsatile energy from the fundamental component to higher-order components, harmonic ratios were subsequently calculated [14]. In this focused analysis, H2/H1 was retained as the primary harmonic index.
2.3.5. PRV Analysis
PRV was derived from beat-to-beat intervals between consecutive systolic PPG peaks. Systolic peaks were identified as local maxima of the filtered waveform and validated using derivative-based zero-crossing detection, as described above. Only intervals derived from retained artifact-free pulse cycles with successfully identified systolic peaks were included in the PRV analysis. The resulting pulse-interval series was interpolated at 4 Hz using cubic spline interpolation to generate an evenly sampled time series suitable for frequency-domain analysis. Power spectral density was subsequently estimated using Welch’s method. Low-frequency (LF) power was calculated by integrating spectral power over 0.04–0.15 Hz, whereas high-frequency (HF) power was calculated over 0.15–0.40 Hz. LF/HF was calculated as the ratio of LF power to HF power [24]. Because these intervals were derived from peripheral PPG pulse peaks rather than electrocardiographic R waves, LF/HF was interpreted as a PPG-derived PRV index rather than as a direct quantitative measure of sympathovagal balance [10,13].
2.3.6. Focused PPG Features and Statistical Transformation
For the focused analyses, four PPG indices representing complementary physiological and signal-processing domains were selected: Ts, Ts/Td, H2/H1, and LF/HF. Ts and Ts/Td, H2/H1, and LF/HF represented temporal pulse characteristics, harmonic-domain waveform morphology, and beat-to-beat PRV spectral characteristics, respectively. Nonpositive values of the ratio-based indices were considered unavailable. Ts was analyzed on its stored scale, whereas Ts/Td, H2/H1, and LF/HF were log2-transformed to minimize right skew. Within the full analytical cohort (N = 1283), the four selected indices were standardized to a mean of zero and an Std of one. Accordingly, regression effect estimates were expressed per 1-Std higher PPG index.
2.4. Echocardiographic Assessment and Outcomes
Transthoracic echocardiography was performed as part of routine clinical evaluation at China Medical University Hospital and interpreted by board-certified cardiologists according to standard clinical practice [3,4]. Echocardiographic examinations obtained within 1 year of the PPG recording were considered for the source clinical dataset. For participants with more than one eligible echocardiographic examination within this interval, central cardiac assessment–peripheral pulse measurement temporal proximity was maximized by selecting the examination closest to the PPG recording. Exact PPG-to-echocardiography intervals were inconsistently available for all participants. Because cardiac loading conditions, volume status, blood pressure, and treatment may change over time, a longer interval between PPG and echocardiography could introduce temporal misclassification and weaken the observed physiological correspondence between peripheral pulse features and contemporaneous cardiac structure or filling conditions.
Left ventricular ejection fraction (LVEF) was mainly assessed using the modified Simpson’s biplane method from apical two- and four-chamber views whenever image quality permitted [4]. Comprehensive visual assessment according to established echocardiographic practice was performed for estimating LVEF when endocardial border delineation was suboptimal. LVEF was used in sensitivity analyses, including restriction to participants with preserved systolic function (LVEF ≥ 50%).
E/e′, LAVI, and LVMI, as recorded in the clinical echocardiography reports, were the echocardiographic outcomes evaluated in this study. E/e′ was treated as an index associated with left ventricular filling conditions, whereas LAVI and LVMI were evaluated as left atrial and left ventricular structural remodeling markers, respectively [3,4]. The available clinical echocardiography records inconsistently specified whether e′ represented the septal, lateral, or averaged annular velocity; therefore, E/e′ was investigated according to the values recorded in the clinical reports. Likewise, detailed acquisition formulas for LAVI and LVMI were not uniformly available in the source dataset. For supplementary structural analyses, left atrial enlargement was defined as LAVI > 34 mL/m2. Left ventricular hypertrophy was defined as LVMI > 115 and >95 g/m2 in males and females, respectively [4]. These binary outcomes were analyzed using multivariable logistic regression.
2.5. Kidney Function and Clinical Covariates
In the fully adjusted models, eGFR was included as a continuous covariate. For subgroup and interaction analyses, participants were classified according to documented kidney function as eGFR < 60 or ≥60 mL/min/1.73 m2 [25]. This classification was employed for examining effect modification and was not interpreted as establishing chronic kidney disease, as chronicity could not be established from one recorded value.
Age, sex, body mass index (BMI), systolic blood pressure (SBP), pulse rate, hypertension, diabetes mellitus, coronary artery disease, and beta-blocker use were the clinical covariates. The kidney-adjusted model additionally included eGFR. For sensitivity analyses, further adjustment was performed for calcium-channel blockers, angiotensin-converting-enzyme inhibitors or angiotensin receptor blockers, and loop diuretics.
2.6. Data Quality and Analytical Dataset
Before analysis, broad plausibility screening was performed. Values considered physiologically implausible, including height outside 120–220 cm, weight outside 20–250 kg, BMI outside 10–80 kg/m2, SBP outside 60–300 mmHg, diastolic blood pressure outside 30–200 mmHg or greater than or equal to SBP, and pulse rate outside 30–220 beats/min, were excluded during data cleaning. No values were imputed or replaced.
The final analytical cohort comprised 1283 participants with complete data for all variables required in the primary models. This same cohort was used for E/e′, LAVI, LVMI, and kidney-function interaction analyses.
2.7. Primary Association Models and Multiple-Testing Control
Each selected PPG index was separately entered into an ordinary least-squares regression model of the natural-log-transformed echocardiographic outcome. Two nested adjustment models were evaluated. Age, sex, BMI, SBP, pulse rate, hypertension, diabetes mellitus, coronary artery disease, and beta-blocker use were included in the clinical model. The fully adjusted model further included continuous eGFR. Heteroskedasticity-robust (HC1) standard errors were employed for statistical inference.
For a standardized PPG index with regression coefficient β, the effect estimate was transformed as 100 × [exp(β) − 1] and reported as the adjusted percentage difference in the conditional geometric mean of the outcome per 1-Std higher PPG index. Two-sided p values and 95% confidence intervals (CIs) were reported.
The four selected PPG indices were examined against three echocardiographic outcomes, yielding 12 primary comparisons in the fully adjusted model. These 12 tests were treated as one multiplicity family and adjusted using the Benjamini–Hochberg false-discovery-rate (FDR) procedure [26]. FDR-adjusted q values of <0.05 were considered statistically significant for the primary association analyses.
2.8. Kidney-Function Interaction Analyses
Effect modification by kidney function was investigated by adding an indicator for eGFR < 60 mL/min/1.73 m2 and an interaction term between this indicator and the standardized PPG index to the fully adjusted regression model while retaining continuous eGFR and the other covariates. Moreover, stratum-specific estimates were calculated for participants with eGFR ≥ 60 and <60 mL/min/1.73 m2.
Evidence for heterogeneity was based on the pooled interaction term rather than on whether statistical significance was present in one stratum but absent in the other. The 12 interaction tests (four PPG indices × three outcomes) were treated as a separate FDR family and corrected using the Benjamini–Hochberg procedure.
2.9. Sensitivity Analyses
Several sensitivity analyses were performed to assess the robustness of the main associations. These analyses encompassed exclusion of participants outside the 1st–99th percentiles of either the PPG exposure or the echocardiographic outcome; restriction to participants with LVEF ≥ 50%; restriction according to rhythm and valve status, retaining participants with sinus rhythm and excluding those with atrial fibrillation or flutter, pacemaker rhythm, severe aortic or mitral valve disease, and hypertrophic obstructive cardiomyopathy; nonlinear eGFR modeling using a cubic B-spline basis; and further adjustment for calcium-channel blockers, angiotensin-converting enzyme inhibitors or angiotensin receptor blockers, and loop diuretics.
Kidney-function interaction analyses were repeated under similar sensitivity specifications. Interaction p values underwent FDR correction within each sensitivity-analysis set.
2.10. Structural Abnormality Analyses
To investigate whether the four selected PPG indices were associated with categorical left atrial enlargement and left ventricular hypertrophy, supplementary logistic regression models were employed. Each PPG index was separately entered, with adjustment for the same clinical and renal covariates as in the fully adjusted continuous-outcome models. Associations were summarized as adjusted odds ratios (ORs) with 95% CIs. The eight comparisons (four PPG indices × two structural outcomes) were treated as a separate Benjamini–Hochberg FDR family.
2.11. Incremental Prediction Analysis
A clinical model containing the prespecified covariates and eGFR was compared with a model that further included all four selected PPG indices to evaluate whether the selected PPG indices provided incremental predictive information beyond conventional clinical variables. Twenty repetitions of fivefold cross-validation were used for evaluating prediction performance. Parameters estimated from the training data within each fold were employed for standardizing continuous predictors; performance was assessed in the held-out data. Model performance was summarized using the coefficient of determination (R2) and root mean squared error on the log-transformed outcome scale. Repeated cross-validation estimates were summarized descriptively.
2.12. Exploratory Screening of the Broader PPG Feature Set
Thirty available non-heart-rate PPG features were separately screened against E/e′, LAVI, and LVMI using the same clinical and renal adjustment strategy to place the focused four-feature analysis in the context of the broader PPG signal space. This approach generated 90 exploratory comparisons, which were treated as a separate FDR family and corrected using the Benjamini–Hochberg procedure. These analyses were considered exploratory and were utilized for identifying whether additional PPG domains demonstrated signals beyond the four focused indices.
2.13. Statistical Software and Ethical Considerations
All statistical tests were two-sided. Analyses were performed in Python (version 3.11.9) with pandas (version 2.2.2), NumPy (version 1.26.4), SciPy (version 1.13.1), and statsmodels (version 0.14.2); figures were generated using Matplotlib (version 3.9.0). Statistical significance was interpreted alongside effect size, CIs, and FDR-adjusted q values rather than nominal p values alone.
The Research Ethics Committee III of China Medical University and Hospital (Taichung, Taiwan) approved this source clinical study (IRB No. CMUH114-REC3-111). Participants provided written informed consent; this study was conducted following the Declaration of Helsinki and applicable institutional requirements.
3. Results
3.1. Analytical Population
The study cohort encompassed 1283 independent participants. All participants were included in the E/e′, LAVI, and LVMI analyses (Figure 1). The baseline demographic, clinical, renal, and echocardiographic characteristics of the cohort are summarized in Table 1.
Figure 1.
Study flow and analytical framework. The final analytical cohort comprises 1283 participants with complete data for the selected photoplethysmographic (PPG) indices, echocardiographic outcomes, and prespecified clinical covariates. Four focused PPG indices, including the systolic duration (Ts), systolic-to-diastolic duration ratio (Ts/Td), second-harmonic-to-fundamental ratio (H2/H1), and pulse-rate-variability-derived LF/HF, are evaluated against the early mitral inflow velocity-to-early diastolic mitral annular velocity ratio (E/e′), left atrial volume index (LAVI), and left ventricular mass index (LVMI). The primary analysis includes 12 PPG–echocardiographic comparisons with Benjamini–Hochberg false-discovery-rate correction. Kidney-function interaction, sensitivity, structural abnormality, incremental prediction, and exploratory feature-screening analyses are performed as secondary analyses.
Table 1.
Baseline characteristics of the study cohort (N = 1283).
3.2. Associations Between PPG Indices and Echocardiographic Phenotypes
In the fully adjusted models, PPG-derived LF/HF exhibited consistent inverse associations with all three echocardiographic outcomes (Table 2; Figure 2).
Table 2.
Associations between selected PPG indices and echocardiographic phenotypes.
Figure 2.
Primary associations between selected PPG indices and echocardiographic phenotypes. Forest plot demonstrating adjusted percentage differences in E/e′, LAVI, and LVMI per 1 standard deviation (Std) higher PPG index. Separate multivariable models are fitted for Ts, Ts/Td, H2/H1, and LF/HF and adjusted for age, sex, body mass index, systolic blood pressure, pulse rate, hypertension, diabetes mellitus, coronary artery disease, beta-blocker use, and estimated glomerular filtration rate (eGFR). Error bars indicate 95% confidence intervals (CIs). The vertical dashed line at 0% represents the null reference line (no adjusted percentage difference). Ratio-based PPG indices are log2-transformed before standardization. q values represent Benjamini–Hochberg false-discovery-rate-adjusted p values across the 12 primary comparisons.
For E/e′, a 1-Std higher log2(LF/HF) was associated with a 5.02% lower E/e′ (95% CI, −7.51% to −2.46%; p < 0.001; FDR q = 0.002). For LAVI, a 1-Std higher log2(LF/HF) was associated with a 5.19% lower LAVI (95% CI, −7.91% to −2.39%; p < 0.001; FDR q = 0.002).
For LVMI, several PPG indices remained significant following correction for the 12 primary comparisons. A 1-Std higher log2(Ts/Td) was associated with a 4.05% higher LVMI (95% CI, 1.09–7.11%; p = 0.007; FDR q = 0.028). Higher log2(H2/H1) was associated with a 3.48% lower LVMI (95% CI, −6.34% to −0.54%; p = 0.021; FDR q = 0.049), whereas a higher log2(LF/HF) was associated with a 2.57% lower LVMI (95% CI, −4.60% to −0.50%; p = 0.015; FDR q = 0.046). Ts was not significantly associated with LVMI following FDR correction. Moreover, following multiplicity adjustment, Ts, Ts/Td, and H2/H1 demonstrated no significant associations with either E/e′ or LAVI (Table 2).
3.3. Effects of Kidney-Function Adjustment
Following eGFR adjustment, the associations of LF/HF with E/e′ and LAVI were only modestly attenuated. Before eGFR adjustment, a 1-Std higher log2(LF/HF) was associated with a 5.20% lower E/e′ and a 5.28% lower LAVI. Following eGFR adjustment, the corresponding associations remained at −5.02% and −5.19% for E/e′ and LAVI, respectively. These findings indicate that kidney function alone could not account for the observed LF/HF associations.
3.4. Kidney Function Modified Several PPG–Cardiac Associations
Several PPG–echocardiographic associations, particularly those involving LAVI, exhibited significant heterogeneity according to kidney-function strata (Table 3; Figure 3). For LF/HF and LAVI, a 1-Std higher log2(LF/HF) was associated with a 2.91% lower LAVI among participants with eGFR ≥ 60 mL/min/1.73 m2 (95% CI, −6.02% to +0.31%; p = 0.076) compared with an 11.92% lower LAVI among participants with eGFR < 60 mL/min/1.73 m2 (95% CI, −16.85% to −6.70%; p < 0.001). The interaction remained significant following FDR correction (interaction p = 0.003; q = 0.007).
Table 3.
Kidney-function modification of PPG–echocardiographic associations.
Figure 3.
Kidney-function modification of PPG–LAVI associations. Adjusted associations between the four selected PPG indices and LAVI, stratified by kidney function. Estimates represent the adjusted percentage difference in LAVI per 1-Std higher PPG index among participants with eGFR ≥ 60 mL/min/1.73 m2 and those with eGFR < 60 mL/min/1.73 m2. Error bars denote 95% CIs. The vertical dashed line at 0% represents the null reference line (no adjusted percentage difference in LAVI). q values correspond to Benjamini–Hochberg false-discovery-rate-adjusted interaction p values. Models include the PPG index, kidney-function stratum, their interaction term, continuous eGFR, and the prespecified clinical covariates.
Furthermore, significant kidney-function interactions were identified for the other selected PPG indices in relation to LAVI (Table 3; Figure 3). In the lower-eGFR stratum, higher Ts was associated with a 12.04% higher LAVI, higher Ts/Td with a 14.67% higher LAVI, and higher H2/H1 with a 12.05% lower LAVI. Corresponding interaction q values were 0.002, <0.001, and <0.001, respectively.
For LVMI, significant kidney-function interactions were also noted for Ts, Ts/Td, H2/H1, and LF/HF. Participants with eGFR <60 mL/min/1.73 m2 exhibited associations with generally larger magnitudes. For example, in the lower-eGFR stratum, higher Ts/Td was associated with an 11.39% higher LVMI (95% CI, 7.18–15.77%), whereas higher H2/H1 was associated with a 9.23% lower LVMI (95% CI, −13.48% to −4.77%). For E/e′, kidney-function interaction outcomes were less consistent. Ts/Td and H2/H1 exhibited FDR-positive interactions, whereas LF/HF demonstrated no significant interaction following multiplicity adjustment.
3.5. Sensitivity Analyses
The inverse associations of LF/HF with E/e′ and LAVI were generally robust across multiple sensitivity analyses. For E/e′, the LF/HF association remained significant following exclusion of observations outside the 1st–99th percentiles, restriction to participants with LVEF ≥ 50%, rhythm and valve restriction, nonlinear eGFR modeling, and further medication adjustment. Across these analyses, effect estimates remained consistently negative.
Likewise, the LF/HF–LAVI association remained significant following tail trimming, restriction to LVEF ≥ 50%, rhythm and valve restriction, nonlinear eGFR modeling, and further adjustment for cardiovascular medications. For LVMI, the positive association with Ts/Td was comparatively stable across sensitivity analyses. Moreover, in most analyses, the inverse H2/H1 association was also retained; however, it was attenuated following tail trimming. The LF/HF–LVMI association exhibited greater variability and was weaker in some sensitivity analyses.
3.6. Robustness of Kidney-Function Interactions
The kidney-function interactions involving LAVI were generally preserved across alternative analytical specifications. For the LF/HF–LAVI association, the interaction remained FDR significant following tail trimming, rhythm and valve restriction, nonlinear eGFR modeling, and further medication adjustment. The interaction was attenuated in the LVEF ≥ 50% subset and no longer met the FDR threshold. Across most sensitivity analyses, the Ts/Td–LAVI and H2/H1–LAVI interactions were more stable and remained significant. These findings indicate that kidney-function-related heterogeneity was not reliant on one model specification; however, the magnitude and robustness of individual interactions varied.
3.7. Associations with Structural Abnormalities
Categorical structural abnormalities underwent supplementary logistic regression analyses. Among participants included in the LAVI analysis, 199 met the criterion for left atrial enlargement. A 1-Std higher log2(LF/HF) was associated with significantly lower odds of left atrial enlargement (adjusted OR, 0.697; 95% CI, 0.580–0.837; p < 0.001; FDR q < 0.001). No other selected PPG index exhibited an FDR-significant association with left atrial enlargement.
Among participants evaluated for left ventricular hypertrophy, 58 met the predefined LVMI criterion. Several PPG indices demonstrated nominal associations; however, none remained significant following FDR correction.
3.8. Incremental Predictive Information
Adding the four selected PPG indices offered only restricted incremental predictive information beyond conventional clinical variables. For log-transformed E/e′, the mean cross-validated R2 increased from 0.1942 in the clinical model to 0.2042 after adding the four PPG indices, corresponding to a mean ΔR2 of +0.0100. For LAVI, cross-validated R2 was essentially unchanged (0.0660 vs. 0.0657), whereas for LVMI, it slightly decreased (0.0867 vs. 0.0814). These findings indicate that statistically significant PPG–echocardiographic associations did not translate into marked improvement in individual-level prediction.
3.9. Exploratory Screening of the Broader PPG Feature Set
An exploratory analysis screened 30 non-heart-rate PPG features against the three echocardiographic outcomes, yielding 90 adjusted comparisons. Following FDR correction across all 90 tests, two associations remained significant, both involving LAVI. Higher deltaT was significantly associated with lower LAVI (FDR q = 0.034), whereas higher pNN50 was significantly associated with higher LAVI (FDR q = 0.034). No broader-screen association involving either E/e′ or LVMI remained significant following FDR correction.
4. Discussion
4.1. Principal Findings
We evaluated the associations between selected PPG indices and diastolic function and cardiac remodeling echocardiographic measures. Several findings emerged. First, among the four primary PPG indices, PRV-derived LF/HF revealed the most consistent associations with the echocardiographic phenotypes. A 1-Std increase in log2(LF/HF) was associated with approximately 5% lower E/e′, 5% lower LAVI, and 3% lower LVMI following adjustment for demographic characteristics, cardiovascular risk factors, beta-blocker use, and kidney function. These associations remained significant following FDR correction.
Second, PPG features from domains other than PRV were also associated with cardiac structure. Higher Ts/Td was associated with greater LVMI, whereas higher H2/H1 was associated with lower LVMI. Therefore, the observed PPG–cardiac associations were not restricted to one signal-processing domain but also encompassed pulse timing, waveform harmonic composition, and PRV.
Third, the magnitude of several PPG–cardiac associations substantially differed according to kidney function. LAVI most prominently demonstrated this heterogeneity. For example, the association between higher LF/HF and lower LAVI was modest among participants with eGFR ≥ 60 mL/min/1.73 m2 but considerably stronger among those with eGFR < 60 mL/min/1.73 m2. Ts, Ts/Td, and H2/H1 exhibited comparable effect modification. These findings suggest that the peripheral pulse characteristic–cardiac remodeling association relies on the broader cardiorenal physiological environment.
Fourth, the principal associations were generally preserved across multiple sensitivity analyses, including exclusion of extreme observations, restriction by rhythm and valvular status, nonlinear eGFR adjustment, further medication adjustment, and, for several outcomes, restriction to participants with preserved LVEF. Finally, the incremental predictive value of adding the selected PPG indices to conventional clinical variables was limited despite statistically detectable associations. The increase in cross-validated R2 was approximately 0.01 for E/e′ and negligible for LAVI and LVMI. This association–prediction discrepancy is important: the present findings indicate that peripheral PPG contains physiologically relevant information at the population level, but the modest effect sizes and limited incremental predictive performance do not support its use as a stand-alone diagnostic tool for diastolic dysfunction or cardiac remodeling.
4.2. Interpretation of the LF/HF Associations
In the present analysis, PRV-derived LF/HF represented the most reproducible finding. An independent association was noted between higher LF/HF and lower E/e′, LAVI, and LVMI, suggesting that pulse-to-pulse interval dynamics measured at the fingertip can carry functional- and structural cardiac phenotype-related information.
Notably, in this study, LF/HF was derived from PPG pulse intervals rather than from electrocardiographic RR intervals. Therefore, it should be interpreted as a PRV metric rather than a direct conventional heart-rate variability surrogate [10,12]. Peripheral pulse intervals incorporate cardiac cycle length variations but also beat-to-beat differences in electromechanical delay, pulse-transit time, vascular tone, arterial propagation, and peripheral perfusion [7,10]. Consequently, these associations potentially represent an integrated cardiovascular signal rather than a direct measure of one autonomic or myocardial process [10,13].
The LF/HF–E/e′ inverse association may reflect several overlapping mechanisms. Higher E/e′ is generally associated with impaired left ventricular relaxation and/or increased filling pressure; however, the broader echocardiographic context influences interpretation [3]. These hemodynamic abnormalities may coexist with changes in autonomic regulation, vascular stiffness, ventricular–arterial coupling, and pulse transmission [7,15]. Any of these processes could modify the beat-to-beat timing structure observed in peripheral PPG.
The LF/HF–LAVI association is particularly noteworthy, as LAVI reflects a more chronic structural phenotype than a single filling-pressure-related index. Left atrial enlargement can originate from chronically elevated filling pressures, impaired ventricular relaxation, atrial myopathy, volume loading, and systemic cardiovascular disease [3,27]. The finding of an association between LF/HF and both continuous LAVI and lower odds of categorical left atrial enlargement offers internally consistent evidence that the signal may relate to longer-term cardiac remodeling rather than transient hemodynamic variability alone.
However, this association should not be interpreted causally. Higher LF/HF should not be considered protective, nor should increasing LF/HF be anticipated to decrease E/e′ or atrial size. LF/HF is a derived ratio whose numerator and denominator can change for diverse physiological reasons [13,27]. An observed ratio may reflect altered LF power, altered HF power, or both. The underlying physiological pathway cannot be determined without simultaneous ECG, respiratory monitoring, arterial stiffness measurements, invasive filling pressures, or controlled autonomic testing [10,13].
4.3. PRV Versus Conventional Autonomic Interpretation
Moreover, these findings reinforce the need for caution when assigning autonomic meaning to LF/HF. Historically, LF/HF has frequently been interpreted as a sympathovagal balance index; however, this interpretation is physiologically oversimplified [13,27]. Multiple regulatory systems, including respiration, baroreflex activity, vascular tone, and nonstationary changes in cardiovascular control, can influence LF and HF oscillations [13,27].
This issue is particularly relevant for PPG-derived LF/HF. Unlike ECG-derived HRV, PPG PRV contains an additional vascular component. Beat-to-beat changes in the timing of pulse arrival at the finger can alter the measured interval independent of sinus-node timing [7,10]. Therefore, the LF/HF association observed here suggests a composite of cardiac autonomic modulation and peripheral vascular dynamics [10,13]. Therefore, these findings are better interpreted as evidence of the peripheral pulse variability–cardiac phenotype association, rather than evidence that sympathetic or parasympathetic activity directly explains diastolic function or cardiac remodeling.
This distinction reinforces rather than weakens the physiological interpretation of this study. PPG is fundamentally a peripheral hemodynamic signal. Its potential value may precisely lie in integrating information from cardiac ejection, vascular transmission, arterial stiffness, pulse-wave propagation, and autonomic modulation into one inexpensive optical measurement.
4.4. Left Atrial Remodeling as the Most Consistent Structural Phenotype
Among the structural outcomes, LAVI exhibited the most coherent association with the PPG feature set. Several findings support this observation. First, LF/HF was significantly associated with LAVI in the primary multivariable model. Second, higher LF/HF was also associated with lower odds of left atrial enlargement. Third, kidney-function interaction outcomes were particularly strong and consistent for LAVI. Finally, the broader exploratory screening identified additional PPG variables (deltaT and pNN50) that remained associated with LAVI following correction across 90 tests.
Collectively, these findings suggest that left atrial remodeling can be a particularly valuable cardiac phenotype for investigating peripheral pulse characteristics. Plausible physiological reasons for this pattern are noted. LAVI integrates the cumulative effects of filling pressure, volume status, ventricular compliance, atrial function, and chronic cardiovascular disease burden [3,28]. Unlike a single instantaneous hemodynamic measurement, atrial size denotes longer-term exposure to abnormal loading conditions [3,28]. These identical systemic processes can impact vascular tone, arterial compliance, pulse-wave reflection, and autonomic regulation, all of which may influence PPG morphology and pulse variability [7,29].
Accordingly, the PPG–LAVI association may arise because the peripheral pulse and left atrium reflect shared chronic cardiovascular and hemodynamic stress. Nevertheless, the findings do not establish that PPG specifically measures atrial remodeling. The low incremental predictive performance for LAVI challenges a simple one-to-one association. Rather, LAVI may represent one component of a broader cardiovascular phenotype that is partially expressed in peripheral pulse dynamics.
4.5. Associations of Ts/Td and H2/H1 with LVMI
Alongside the LF/HF findings, Ts/Td and H2/H1 were independently associated with LVMI. An association was observed between higher Ts/Td and greater LVMI. Ts/Td represents the relative systolic and diastolic component duration within the pulse waveform. Alterations in this ratio may reflect alterations in ventricular ejection timing, arterial transmission, heart rate-dependent systolic–diastolic timing, and wave reflection [7,29]. Altered ventricular mechanics, vascular load, and arterial stiffness typically accompany increased LV mass, providing several potential pathways through which LV remodeling could impact peripheral pulse timing [1,17].
The H2/H1–LVMI inverse association suggests the potential association of waveform harmonic composition with ventricular structural phenotype. In our previous study, higher SBP was accompanied by lower higher-order harmonic ratios, including H2/H1 [8]; subsequently, in our machine-learning analysis, H2/H1 was retained as an interpretable hypertensive status predictor [9]. Therefore, the present findings extend these prior vascular-load observations by suggesting that reduced higher-order harmonic content can also be associated with ventricular structural remodeling. However, whether arterial stiffness, wave reflection, or ventricular–arterial coupling mediates this association cannot be determined from the present data.
Nevertheless, these associations should be interpreted with greater caution than the LF/HF findings. The effect sizes were modest, and H2/H1 was close to the FDR significance boundary. Harmonic-domain features are particularly sensitive to several technical and physiological factors. From a signal-processing perspective, filter characteristics, including cutoff frequency, filter order, and phase response, can modify waveform contour and the apparent timing of fiducial landmarks. Such effects may influence derived temporal indices, including Ts and Ts/Td. Filtering may also attenuate or redistribute higher-frequency spectral content, thereby altering the estimated energy of the fundamental and higher-order harmonics and, consequently, H2/H1. Spectral-window length, frequency resolution, harmonic-band integration width, and peak identification can further influence these estimates. Although the same preprocessing pipeline was applied uniformly to all recordings and zero-phase filtering was used to minimize phase-related landmark displacement, the absolute values of timing- and harmonic-domain features remain processing-dependent. An additional limitation is the fixed 5 Hz upper cutoff. As heart rate increases, the fundamental frequency and its higher-order harmonics shift toward higher frequencies, such that a fixed low-pass boundary may progressively attenuate harmonic content. This effect could lead to underestimation of higher-order harmonic energy, including H2/H1, and may smooth waveform features such as the systolic upstroke, dicrotic notch, and post-systolic inflection points used for timing measurements. Consequently, some degree of heart-rate-dependent estimation bias in Ts and Ts/Td cannot be excluded. Extending the upper cutoff to approximately 10–15 Hz could preserve a broader range of morphological information, but would also increase susceptibility to high-frequency noise. Future studies should therefore evaluate wider-band and heart-rate-adaptive preprocessing approaches, including harmonic-selective filtering in which filter centers and bandwidths are adjusted according to the detected cardiac fundamental frequency [21].
In particular, the ±0.2 Hz integration window used in this study was selected as a methodological compromise between capturing locally distributed harmonic energy and avoiding excessive inclusion of adjacent spectral content; therefore, alternative integration widths could yield somewhat different estimated harmonic ratios. In addition, peripheral vascular tone, arterial stiffness, local temperature, vasoconstriction, and changes in pulse-wave reflection can modify the contour and transmission of the peripheral pulse independently of cardiac structure. Pulse amplitude also affects the signal-to-noise ratio; low-amplitude waveforms may reduce the stability of harmonic-energy estimates and increase susceptibility to noise. Waveform quality is therefore critical, because motion artifact, poor sensor–skin contact, ambient-light interference, and distorted or poorly detected pulse cycles may disproportionately affect higher-order harmonic components. In the present system, standardized resting acquisition, ambient-light reduction, band-pass filtering, SQI-based quality control, visual waveform inspection, and artifact-free cycle averaging were used to mitigate these influences. Nevertheless, residual variability related to peripheral vascular state and signal quality cannot be fully excluded. Accordingly, H2/H1 should be interpreted as a peripheral waveform phenotype influenced by both cardiovascular physiology and measurement conditions, rather than as a direct measure of ventricular remodeling. Replication using standardized raw-signal processing, simultaneous vascular measurements, and external validation will be important before harmonic features can be considered robust system-level biomarkers.
4.6. Kidney Function as an Effect Modifier
The robust effect modification by kidney function, particularly for PPG–LAVI associations, represents one of the most distinctive findings of this study. Participants with eGFR < 60 mL/min/1.73 m2 demonstrated a considerably stronger LF/HF–LAVI association than those with higher eGFR. Ts, Ts/Td, and H2/H1 exhibited comparable interaction patterns. These findings suggest that lower kidney function may modify the relationship between cardiac remodeling and the peripheral pulse by altering the vascular and hemodynamic pathway through which central cardiac changes are transmitted to the fingertip.
Numerous physiological mechanisms could contribute. Reduced kidney function is frequently associated with volume expansion, sodium retention, vascular calcification, endothelial dysfunction, increased arterial stiffness, sympathetic activation, inflammation, and altered ventricular loading [15,17]. These abnormalities can affect cardiac remodeling and peripheral pulse transmission [15,30]. Therefore, a certain degree of cardiac structural modification may generate a more pronounced peripheral hemodynamic signature in individuals with impaired kidney function.
Furthermore, renal dysfunction may aggravate ventricular–arterial coupling abnormalities. Increased arterial stiffness and wave reflection can impact systolic load, ventricular hypertrophy, left atrial pressure, and pulse-wave morphology [19,30]. As PPG captures the peripheral consequence of these central and vascular interactions, the PPG feature–cardiac structure association may become stronger with increasing cardiorenal disease burden. This proposed cardiorenal context is summarized schematically in Figure 4. Volume status may also contribute. Intravascular volume alterations can impact left atrial size, filling pressures, vascular tone, and peripheral pulse amplitude or timing. Therefore, participants with lower eGFR may demonstrate greater coupling between central filling conditions and peripheral pulse characteristics [15,17].
Figure 4.
Conventional schematic framework of the associations among peripheral PPG features, echocardiographic phenotypes, and kidney function. PPG represents an integrated peripheral cardiovascular signal influenced by cardiac ejection, vascular properties, pulse-wave transmission, and autonomic regulation. In the present study, PPG-derived LF/HF showed the most consistent inverse associations with E/e′, LAVI, and LVMI, whereas Ts/Td and H2/H1 were additionally associated with LVMI. Kidney function modified several PPG–echocardiographic associations, particularly those involving LAVI. The dashed pathways indicate hypothesized physiological mechanisms and should not be interpreted as demonstrated causal relationships.
Nevertheless, these explanations remain mechanistic hypotheses rather than demonstrated pathways. This study excluded direct measurements of volume status, arterial stiffness, sympathetic activity, inflammatory biomarkers, or invasive hemodynamics. Moreover, without documented chronicity, an eGFR of <60 mL/min/1.73 m2 in this cross-sectional dataset should not automatically be interpreted as established chronic kidney disease [25,31]. Therefore, the interaction findings should be viewed as evidence of cardiorenal effect modification, not proof of a specific renal mechanism.
4.7. Why the eGFR Interaction May Be More Informative than Simple Adjustment
The renal analysis offers a crucial conceptual distinction between confounding and effect modification. When kidney function solely confounded the PPG–cardiac phenotype association, adjustment for eGFR would be anticipated to considerably attenuate the PPG effect estimates. In this study, adjustment for eGFR only modestly modified the LF/HF associations with E/e′ and LAVI. This finding suggests that kidney function alone did not account for the main association.
By contrast, the interaction analyses revealed markedly different PPG effect sizes across kidney-function strata. This finding suggests that kidney function may operate more importantly as a modifier of the PPG–cardiac association than as a conventional confounder. The physiological information contained in a peripheral optical signal is likely to depend on the systemic environment in which the signal is generated and transmitted. In patients with lower eGFR, alterations in arterial stiffness, endothelial function, vascular calcification, sympathetic activity, volume status, and ventricular loading may modify pulse-wave propagation, reflection, peripheral perfusion, and beat-to-beat timing. As a result, an identical degree of cardiac remodeling may produce a different peripheral PPG signature in patients with different renal and vascular backgrounds. Conversely, the same measured PPG feature value may arise from different combinations of cardiac, vascular, and volume-related influences. Therefore, the biological meaning of a PPG feature is unlikely to be universal across heterogeneous cardiorenal phenotypes.
This concept may pose broader implications for digital biomarkers. Instead of assuming that PPG features carry universal biological meaning, future studies may need to account for disease-state-dependent changes in signal interpretation.
4.8. Sensitivity Analyses and Robustness
The sensitivity analyses offer substantial support for the stability of the principal findings. The inverse associations of LF/HF with E/e′ and LAVI remained evident following the removal of extreme observations, restricting the sample according to rhythm and valvular characteristics, modeling eGFR nonlinearly, and adjusting for additional cardiovascular medications. This consistency suggests that outliers, a simple linear specification of kidney function, or a limited set of medication-related confounders did not solely influence the findings.
Additionally, the persistence of the LF/HF associations in the LVEF ≥ 50% subset is noteworthy. Constraining the analysis to participants with preserved systolic function diminishes the probability that reduced LVEF or overt systolic dysfunction exclusively account for the findings. This approach supports the likelihood that pulse variability may relate to diastolic and remodeling phenotypes beyond conventional systolic impairment.
However, not all sensitivity analyses yielded comparable effect sizes or statistical significance levels. In particular, some kidney-function interactions were attenuated following restriction to preserved LVEF, and the LF/HF–LVMI association was less stable than the associations with E/e′ and LAVI. This heterogeneity should temper claims of universality. Accordingly, the most defensible interpretation is that the LF/HF–E/e′ and LF/HF–LAVI associations are relatively robust, whereas some of the LVMI and interaction findings require additional replication.
4.9. Insights from the Broader PPG Feature Screening
The exploratory analysis of 30 non-heart-rate PPG features offers further context for the primary findings. Following correction across 90 comparisons, deltaT and pNN50 remained associated with LAVI. This finding is pertinent as it suggests that the PPG–atrial remodeling association cannot solely rely on the four initially selected indices.
deltaT reflects pulse-wave timing characteristics, whereas pNN50 denotes pulse-interval variability. Therefore, their associations with LAVI offer convergent evidence from two different PPG domains. Nevertheless, only 2 of the 90 broad-screen associations survived FDR correction, indicating that most PPG features did not exhibit robust independent associations with the echocardiographic outcomes.
This unfavorable result is informative. It challenges a broad claim that cardiac remodeling is diffusely encoded across the entire PPG feature space. Instead, the signal appears to be relatively selective and concentrated in particular temporal–pulse-variability characteristics. Moreover, this selectivity reinforces the significance of conservative biomarker development. Future studies should avoid relying exclusively on nominal significance across large feature sets and incorporate independent validation or prespecified feature selection [32].
4.10. Association Does Not Imply Predictive Utility
The cross-validation results offer a crucial counterbalance to the statistically significant regression findings. Adding the four selected PPG indices heightened cross-validated R2 for E/e′ by approximately 0.01. By contrast, no improvement for LAVI was essentially noted, and LVMI prediction exhibited no improvement. These results reveal that a statistically significant population-level association does not necessarily translate into clinically meaningful individual-level prediction [11].
Several factors may explain why statistically significant PPG–echocardiographic associations did not translate into clinically meaningful individual-level prediction. First, the observed effect sizes were modest; a 3–5% relative difference in an echocardiographic outcome per 1-standard-deviation change in a PPG feature may be detectable at the population level without providing sufficient discrimination between individuals. Second, E/e′, LAVI, and LVMI are influenced by multiple biological determinants, including myocardial fibrosis, chamber geometry, preload, afterload, valvular function, rhythm, medication effects, and body composition, many of which are not directly captured by a brief peripheral PPG recording. Third, peripheral PPG itself is affected by vascular tone, arterial stiffness, skin contact, temperature, respiratory pattern, and motion, which may introduce additional interindividual variability. Accordingly, the present findings support PPG as a source of complementary physiological information rather than as a direct surrogate for echocardiographic measurements. If PPG were to function as a stand-alone diagnostic tool, substantially greater and independently validated discrimination, calibration, reproducibility, and incremental predictive value would be required. The limited cross-validated improvement observed in the present study therefore argues against a stand-alone diagnostic role for diastolic dysfunction or cardiac remodeling.
Therefore, the present findings indicate that PPG contains physiologically relevant information at the population level, but the modest effect sizes and limited incremental predictive performance do not support its use as a stand-alone diagnostic substitute for echocardiography.
4.11. Implications for Digital Biomarker Development
These findings have broader implications for PPG-based digital biomarker development. The current literature on wearable and optical cardiovascular sensing centers on prediction accuracy. However, the present results suggest that physiologically informative associations can exist despite minimal incremental predictive performance.
This observation generates two distinct research pathways. One is predictive biomarker development, where the goal is to categorize disease or accurately estimate clinical measurements sufficient to influence decision-making. The other is physiological phenotyping, where the aim is to determine whether inexpensive peripheral signals reflect specific cardiovascular physiology dimensions. This study fits more naturally into the second category.
Therefore, despite being insufficient for diagnostic classification, PPG features may be valuable as low-cost markers for physiological stratification, longitudinal hypothesis generation, or multimodal integration. Future studies could examine whether incorporating PPG into ECG, blood pressure, renal markers, respiratory signals, or wearable longitudinal data enhances cardiac remodeling characterization beyond one short recording.
4.12. Clinical Interpretation
From a clinical viewpoint, these findings require cautious interpretation. The observed PPG associations are unlikely to substitute for established echocardiographic evaluation. However, they raise the likelihood that peripheral optical signals may reflect systemic cardiovascular remodeling in ways that vary across patient phenotypes.
As patients with renal impairment represent a population in whom cardiovascular remodeling, volume disturbance, vascular dysfunction, and cardiac events are frequent, the kidney-function interaction is particularly relevant. PPG could eventually contribute to low-cost physiological monitoring in cardiorenal populations when prospectively confirmed. For example, longitudinal changes in pulse variability or morphology could potentially be investigated alongside volume status, renal function, and echocardiographic remodeling.
However, whether within-person changes in PPG track changes in E/e′, LAVI, or LVMI cannot be determined in this cross-sectional analysis. Longitudinal studies are warranted before proposing any monitoring application.
4.13. Strengths
Several aspects of this study strengthen the analysis. First, the dataset comprised a relatively large cardiology cohort with 1283 independent participants and comprehensive clinical, echocardiographic, renal, and PPG information. Second, this study evaluated PPG features from several signal domains rather than relying on one waveform descriptor. Third, the primary analyses adjusted for significant cardiovascular confounders, including age, sex, BMI, SBP, pulse rate, hypertension, diabetes, coronary artery disease, beta-blocker use, and eGFR. Fourth, FDR correction was employed to explicitly address multiplicity. Fifth, effect modification by kidney function was formally examined using interaction models rather than inferred by comparing significance across subgroups. Sixth, multiple sensitivity analyses, including alternative eGFR modeling, medication adjustment, rhythm and valve restrictions, preserved-LVEF restriction, and outlier trimming, were performed. Finally, including cross-validated predictive analyses precluded the overinterpretation of statistically significant associations as evidence of diagnostic utility.
Taken together, these methodological strengths support a framework for future PPG–cardiac phenotyping studies in which multidomain signal features are evaluated alongside comprehensive clinical adjustment, formal interaction testing, multiplicity control, sensitivity analyses, and out-of-sample predictive assessment. We recommend that subsequent studies adopt a similarly layered analytical strategy rather than relying solely on univariable associations or nominal statistical significance. In particular, prespecified feature selection, independent external validation, standardized signal quality procedures, and prospective synchronization of PPG with echocardiographic and laboratory measurements should be prioritized to improve reproducibility and clinical interpretability.
4.14. Limitations
Several limitations should be acknowledged. First, this was an observational analysis; causal associations could not be inferred. The PPG feature–cardiac remodeling directionality remained unknown, and both may reflect shared underlying cardiovascular disease processes.
Second, this analysis was based on stored PPG-derived features rather than reprocessing raw optical waveforms. This approach restricted the ability to independently validate signal quality, artifact handling, peak detection, spectral settings, and processing consistency.
Third, PPG and echocardiography were not acquired simultaneously. Although the echocardiographic examination closest to the PPG recording within a one-year window was selected, changes in loading conditions, renal function, blood pressure, medication exposure, or cardiac status during the intervening period may have attenuated or otherwise modified the observed associations. Because exact PPG-to-echocardiography intervals were not consistently available for all participants, the extent of this temporal misclassification could not be quantified.
Fourth, the 90 s recording duration was relatively short for LF spectral analysis. At the lower boundary of the LF band, 0.04 Hz corresponds to 25 s, indicating that a 90 s recording contains only approximately 3.6 cycles. Therefore, LF power and LF/HF may be sensitive to nonstationarity, respiratory variation, windowing, and artifacts. To establish measurement reliability, longer recordings and test–retest assessment are necessary.
Fifth, LF/HF was obtained from PPG pulse intervals rather than ECG RR intervals. Therefore, the findings could not be directly generalized to conventional HRV; simultaneous ECG would be warranted to separate cardiac interval variation from peripheral pulse-transit effects.
Sixth, residual confounding was possible. Although major cardiovascular risk factors and selected medications were adjusted for, other factors, including respiratory rate, physical activity, autonomic medications, anemia, volume status, arterial stiffness, inflammatory state, and detailed valvular severity, may impact PPG and cardiac outcomes.
Seventh, the eGFR-based subgroup analysis failed to confirm chronic kidney disease. A single eGFR measurement of <60 mL/min/1.73 m2 does not establish chronicity. Therefore, the renal-related findings should be described as differences according to documented kidney function rather than CKD-specific effects.
Eighth, this study was conducted in a cardiology cohort. The findings may not be generalizable to healthy individuals or community-based populations.
Ninth, the feature-selection strategy was exploratory. The four main indices were prioritized from a larger PPG feature set, and the broader screening was performed within a similar dataset. Despite applying FDR correction, independent validation remains necessary for addressing feature-selection optimism.
Tenth, the relatively minimal incremental predictive improvement indicated that the identified associations were insufficient for supporting individual-level diagnostic use.
Finally, external validation was not available. Confirmation of the present findings will require a prospective cohort in which PPG, ECG, echocardiography, and laboratory measurements are acquired within a predefined and synchronized time window under standardized signal quality conditions. Such a design would reduce temporal misclassification, allow direct comparison of pulse-rate variability with electrocardiographic rhythm variability, improve attribution of PPG changes to contemporaneous cardiac and renal physiology, and enable prospective assessment of reproducibility and predictive performance.
4.15. Future Directions
Future validation should prioritize a prospective synchronized acquisition protocol. PPG, ECG, echocardiography, and laboratory testing should be obtained within a predefined time window, with standardized participant preparation, signal quality criteria, and raw-signal storage. This design would provide several methodological advantages: it would minimize temporal discordance between peripheral and central measurements, permit direct separation of pulse-rate variability from electrocardiographic rhythm variability, allow contemporaneous assessment of renal and hemodynamic status, and support test–retest evaluation of PPG feature stability. Such a framework would also facilitate independent validation of effect sizes, interaction patterns, and diagnostic performance. Methodologically, future PPG studies should prioritize prespecified analytical plans, standardized signal quality criteria, external validation cohorts, and multimodal physiological reference measurements.
Direct measures of arterial stiffness, including pulse-wave velocity or augmentation index, could help elucidate whether vascular properties mediate the PPG harmonic feature–cardiac remodeling association. Renal phenotyping should encompass continuous monitoring of eGFR, albuminuria, volume status, and cardiorenal stress biomarkers. The observed kidney-function interactions should be examined in an independent cohort with varying renal impairment severity.
Furthermore, future analyses should evaluate whether longitudinal changes in PPG features can track changes in LAVI, E/e′, or clinical congestion. Finally, multimodal models combining PPG with conventional clinical variables, ECG, blood pressure, laboratory data, and longitudinal wearable measurements may be more informative than PPG alone.
4.16. Overall Interpretation
Collectively, these findings indicate that peripheral PPG contains quantifiable but modest echocardiographic cardiac phenotype-related information. LF/HF, which was inversely associated with E/e′, LAVI, and LVMI, demonstrated the strongest and most reproducible signal. Further associations involving Ts/Td and H2/H1 suggest that pulse timing and harmonic morphology can also reflect aspects of ventricular remodeling. The conceptual framework incorporating these PPG domains into cardiac remodeling and kidney-function-dependent heterogeneity is illustrated in Figure 4.
The particularly robust kidney-function interaction for LAVI suggests that the peripheral pulse characteristic–cardiac structure association can be context-dependent. Reduced kidney function may alter the hemodynamic, vascular, and autonomic environment, associating central cardiac remodeling with peripheral pulse characteristics (Figure 4). Nevertheless, the limited incremental predictive performance indicates that these associations should not be interpreted as evidence that PPG can replace echocardiography.
Therefore, this study supports PPG as a tool for cardiovascular physiological phenotyping and hypothesis generation, while highlighting the significance of prospective validation before clinical application.
5. Conclusions
In this cardiology cohort of 1283 participants, PPG-derived pulse-rate variability and waveform features were independently associated with echocardiographic measures of diastolic function and cardiac remodeling after multivariable adjustment for demographic characteristics, cardiovascular risk factors, medication use, and kidney function. LF/HF demonstrated the most consistent inverse associations with E/e′, LAVI, and LVMI, whereas Ts/Td and H2/H1 were additionally associated with LVMI. Several PPG–remodeling relationships, particularly those involving LAVI, varied substantially according to kidney function. These principal associations were generally preserved across sensitivity analyses incorporating alternative renal modeling, medication adjustment, rhythm and valvular restrictions, exclusion of extreme observations, and preserved-LVEF analyses.
Supplementary structural-abnormality models provided partial concordance with the continuous-outcome analyses: higher LF/HF was independently associated with lower odds of left atrial enlargement, whereas no PPG index remained significantly associated with left ventricular hypertrophy after FDR correction. However, repeated cross-validation demonstrated only limited incremental predictive value beyond conventional clinical variables, with a modest improvement for E/e′ and essentially no improvement for LAVI or LVMI.
Taken together, these findings suggest that peripheral PPG should not be viewed as a direct optical surrogate of cardiac structure or as a stand-alone diagnostic replacement for echocardiography. Rather, PPG appears to capture integrated physiological information shaped by cardiac function, vascular transmission, autonomic regulation, and the broader cardiorenal environment. Its biological meaning may therefore be context-dependent across patients. PPG may be most appropriately positioned as a complementary physiological phenotyping tool, while prospective studies using synchronized PPG, ECG, echocardiography, laboratory measurements, and external validation are required before clinical implementation.
Author Contributions
Conceptualization, C.-N.L. and P.-Y.K.; methodology, C.-N.L. and P.-Y.K.; software, C.-N.L.; validation, J.-T.W.; formal analysis, C.-N.L.; investigation, C.-P.C. and C.-C.W.; resources, C.-P.C., C.-C.W., J.-J.L. and J.-T.W.; data curation, C.-N.L., C.-P.C., C.-C.W., J.-J.L., Y.-C.H. and J.-T.W.; writing—original draft preparation, C.-N.L.; writing—review and editing, P.-Y.K.; visualization, C.-N.L. and Y.-C.H.; supervision, C.-C.W., P.-Y.K. and L.J. All authors have read and agreed to the published version of the manuscript.
Funding
This research received no external funding.
Institutional Review Board Statement
The study was conducted in accordance with the Declaration of Helsinki, and approved by the Ethics Committee of the Research Ethics Committee of China Medical University & Hospital (CMUH114-REC3-111, 9 July 2025).
Informed Consent Statement
Informed consent was obtained from all subjects involved in the study.
Data Availability Statement
The datasets analyzed in this study are not publicly available due to patient privacy and ethical restrictions. De-identified data may be made available from the corresponding authors upon reasonable request, subject to approval by the relevant Institutional Review Board and applicable institutional data-sharing policies.
Conflicts of Interest
Author Yen-Ching Hung was employed by the CardiAxis Technology Company Limited. The remaining authors declare that the research was conducted in the absence of any commercial or financial relationships that could be construed as a potential conflict of interest.
Abbreviations
The following abbreviations are used in this manuscript:
| BMI | Body Mass Index |
| CI | Confidence Interval |
| eGFR | Estimated Glomerular Filtration Rate |
| FDR | False Discovery Rate |
| H2/H1 | Second-Harmonic-To-Fundamental Ratio |
| LAVI | Left Atrial Volume Index |
| LVMI | Left Ventricular Mass Index |
| LVEF | Left Ventricular Ejection Fraction |
| OR | Odds Ratio |
| PPG | Photoplethysmography |
| PRV | Pulse-Rate Variability |
| SBP | Systolic Blood Pressure |
| SQI | Signal Quality Index |
| Std | Standard Deviation |
| Ts | Systolic Duration |
| Ts/Td | Systolic-To-Diastolic Duration Ratio |
References
- Messerli, F.H.; Rimoldi, S.F.; Bangalore, S. The Transition From Hypertension to Heart Failure: Contemporary Update. JACC Heart Fail 2017, 5, 543–551. [Google Scholar]
- Sharpe, N. Cardiac remodeling in coronary artery disease. Am. J. Cardiol. 2004, 93, 17B–20B. [Google Scholar] [CrossRef] [Scilit]
- Nagueh, S.F.; Sanborn, D.Y.; Oh, J.K.; Anderson, B.; Billick, K.; Derumeaux, G.; Klein, A.; Koulogiannis, K.; Mitchell, C.; Shah, A.; et al. Recommendations for the Evaluation of Left Ventricular Diastolic Function by Echocardiography and for Heart Failure With Preserved Ejection Fraction Diagnosis: An Update From the American Society of Echocardiography. J. Am. Soc. Echocardiogr. 2025, 38, 537–569. [Google Scholar] [CrossRef] [Scilit]
- Lang, R.M.; Badano, L.P.; Mor-Avi, V.; Afilalo, J.; Armstrong, A.; Ernande, L.; Flachskampf, F.A.; Foster, E.; Goldstein, S.A.; Kuznetsova, T.; et al. Recommendations for cardiac chamber quantification by echocardiography in adults: An update from the American Society of Echocardiography and the European Association of Cardiovascular Imaging. Eur. Heart J. Cardiovasc. Imaging 2015, 16, 233–270. [Google Scholar] [CrossRef] [Scilit]
- Allen, J. Photoplethysmography and its application in clinical physiological measurement. Physiol. Meas. 2007, 28, R1-39. [Google Scholar] [CrossRef] [Scilit]
- Charlton, P.H.; Kyriacou, P.A.; Mant, J.; Marozas, V.; Chowienczyk, P.; Alastruey, J. Wearable Photoplethysmography for Cardiovascular Monitoring. Proc. IEEE Inst. Electr. Electron Eng. 2022, 110, 355–381. [Google Scholar] [CrossRef] [Scilit]
- Charlton, P.H.; Paliakaitė, B.; Pilt, K.; Bachler, M.; Zanelli, S.; Kulin, D.; Allen, J.; Hallab, M.; Bianchini, E.; Mayer, C.C.; et al. Assessing hemodynamics from the photoplethysmogram to gain insights into vascular age: A review from VascAgeNet. Am. J. Physiol. Heart Circ. Physiol. 2022, 322, H493–H522. [Google Scholar] [CrossRef] [Scilit]
- Lin, C.-N.; Chang, C.-P.; Lin, J.-J.; Chang, J.-N.; Hung, Y.-C.; Ko, P.-Y. Clinical validation of comprehensive time- and frequency-domain photoplethysmography features from a single-sensor system for non-invasive assessment of vascular load and systolic blood pressure. Front. Physiol. 2025, 16, 1695391. [Google Scholar] [CrossRef] [Scilit]
- Lin, C.-N.; Wang, C.-C.; Chao, P.-C.; Lin, J.-J.; Chang, C.-P.; Lu, H.-M.; Lin, P.-W.; Ko, P.-Y. Interpretable photoplethysmography-based machine-learning model for noninvasive assessment of systolic blood pressure. Front. Physiol. 2026, 17, 1779262. [Google Scholar] [CrossRef] [Scilit]
- Mejía-Mejía, E.; May, J.M.; Torres, R.; A Kyriacou, P. Pulse rate variability in cardiovascular health: A review on its applications and relationship with heart rate variability. Physiol. Meas. 2020, 41, 07TR01. [Google Scholar] [CrossRef] [Scilit]
- Jiang, S.; Rosner, B.A.; Colditz, G.A. Statistically Significant Association Does not Imply Improvement in Prediction of Clinical Outcomes. Cancer Prev. Res. 2025, 18, 727–733. [Google Scholar] [CrossRef] [Scilit]
- Kantrowitz, A.B.; Ben-David, K.; Morris, M.; Wittels, H.L.; Wishon, M.J.; McDonald, S.M.; Renaghan, E.J.; Feigenbaum, L.A.; Wittels, S.H. Pulse rate variability is not the same as heart rate variability: Findings from a large, diverse clinical population study. Front. Physiol. 2025, 16, 1630032. [Google Scholar] [CrossRef] [Scilit]
- del Paso, G.A.R.; Langewitz, W.; Mulder, L.J.M.; van Roon, A.; Duschek, S. The utility of low frequency heart rate variability as an index of sympathetic cardiac tone: A review with emphasis on a reanalysis of previous studies. Psychophysiology 2013, 50, 477–487. [Google Scholar] [CrossRef] [Scilit]
- Hsiao, K.-Y.; Kang, J.-H.; Wu, Y.-S.; Chang, H.-H.; Yang, C.-T. Peripheral pulse harmonic analysis and its clinical application: A systematic review. J. Tradit. Complement. Med. 2024, 14, 223–236. [Google Scholar] [CrossRef] [Scilit]
- Inserra, F.; Forcada, P.; Castellaro, A.; Castellaro, C. Chronic Kidney Disease and Arterial Stiffness: A Two-Way Path. Front. Med. 2021, 8, 765924. [Google Scholar] [CrossRef] [Scilit]
- Baaten, C.; Vondenhoff, S.; Noels, H. Endothelial Cell Dysfunction and Increased Cardiovascular Risk in Patients With Chronic Kidney Disease. Circ. Res. 2023, 132, 970–992. [Google Scholar] [CrossRef] [Scilit]
- Taddei, S.; Nami, R.; Bruno, R.M.; Quatrini, I.; Nuti, R. Hypertension, left ventricular hypertrophy and chronic kidney disease. Heart Fail Rev. 2011, 16, 615–620. [Google Scholar] [CrossRef] [Scilit]
- Charlton, P.H.; Pilt, K.; Kyriacou, P.A. Establishing best practices in photoplethysmography signal acquisition and processing. Physiol. Meas. 2022, 43, 050301. [Google Scholar] [CrossRef] [Scilit]
- Park, J.; Seok, H.S.; Kim, S.-S.; Shin, H. Photoplethysmogram Analysis and Applications: An Integrative Review. Front. Physiol. 2021, 12, 808451. [Google Scholar] [CrossRef] [Scilit]
- Liu, H.; Allen, J.; Khalid, S.G.; Chen, F.; Zheng, D. Filtering-induced time shifts in photoplethysmography pulse features measured at different body sites: The importance of filter definition and standardization. Physiol. Meas. 2021, 42, 074001. [Google Scholar] [CrossRef] [Scilit]
- Dominguez-Hernandez, S.; Paez, G.; Padilla, M. Harmonic-Selective Gaussian Filtering for Morphology and Timing Preservation in PPG Signals. Sensors 2026, 26, 3710. [Google Scholar] [CrossRef] [Scilit]
- Elgendi, M. Optimal Signal Quality Index for Photoplethysmogram Signals. Bioengineering 2016, 3, 21. [Google Scholar] [CrossRef] [Scilit]
- Papini, G.B.; Fonseca, P.; Aubert, X.L.; Overeem, S.; Bergmans, J.W.; Vullings, R. Photoplethysmography beat detection and pulse morphology quality assessment for signal reliability estimation. Annu. Int. Conf. IEEE Eng. Med. Biol. Soc. 2017, 2017, 117–120. [Google Scholar] [CrossRef] [Scilit]
- Antali, F.; Kulin, D.; Lucz, K.I.; Szabó, B.; Szűcs, L.; Kulin, S.; Miklós, Z. Multimodal Assessment of the Pulse Rate Variability Analysis Module of a Photoplethysmography-Based Telemedicine System. Sensors 2021, 21, 5544. [Google Scholar] [CrossRef] [Scilit]
- Kidney Disease: Improving Global Outcomes, C.K.D.W.G. KDIGO 2024 Clinical Practice Guideline for the Evaluation and Management of Chronic Kidney Disease. Kidney Int. 2024, 105, S117–S314.
- Benjamini, Y.; Hochberg, Y. Controlling the False Discovery Rate: A Practical and Powerful Approach to Multiple Testing. J. R. Stat. Soc. Ser. B 1995, 57, 289–300. [Google Scholar] [CrossRef] [Scilit]
- Heathers, J.A. Everything Hertz: Methodological issues in short-term frequency-domain HRV. Front. Physiol. 2014, 5, 177. [Google Scholar] [CrossRef] [Scilit]
- Tamura, H.; Watanabe, T.; Nishiyama, S.; Sasaki, S.; Arimoto, T.; Takahashi, H.; Shishido, T.; Miyashita, T.; Miyamoto, T.; Nitobe, J.; et al. Increased left atrial volume index predicts a poor prognosis in patients with heart failure. J. Card. Fail 2011, 17, 210–216. [Google Scholar] [CrossRef] [Scilit]
- Karimpour, P.; May, J.M.; Kyriacou, P.A. Photoplethysmography for the Assessment of Arterial Stiffness. Sensors 2023, 23, 9882. [Google Scholar] [CrossRef] [Scilit]
- Toussaint, N.D.; Kerr, P.G. Vascular calcification and arterial stiffness in chronic kidney disease: Implications and management. Nephrology 2007, 12, 500–509. [Google Scholar] [CrossRef] [Scilit]
- Levey, A.S.; Eckardt, K.-U.; Tsukamoto, Y.; Levin, A.; Coresh, J.; Rossert, J.; Zeeuw, D.D.; Hostetter, T.H.; Lameire, N.; Eknoyan, G. Definition and classification of chronic kidney disease: A position statement from Kidney Disease: Improving Global Outcomes (KDIGO). Kidney Int. 2005, 67, 2089–2100. [Google Scholar] [CrossRef] [Scilit]
- Alba, A.C.; Agoritsas, T.; Walsh, M.; Hanna, S.; Iorio, A.; Devereaux, P.J.; McGinn, T.; Guyatt, G. Discrimination and Calibration of Clinical Prediction Models: Users’ Guides to the Medical Literature. JAMA 2017, 318, 1377–1384. [Google Scholar]
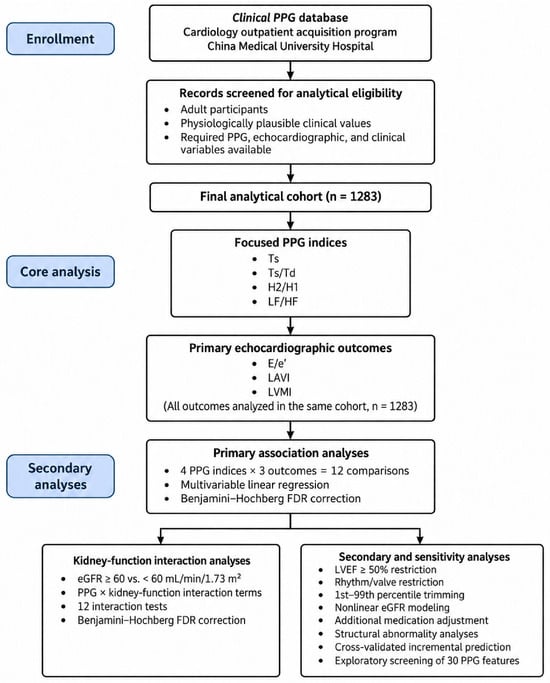
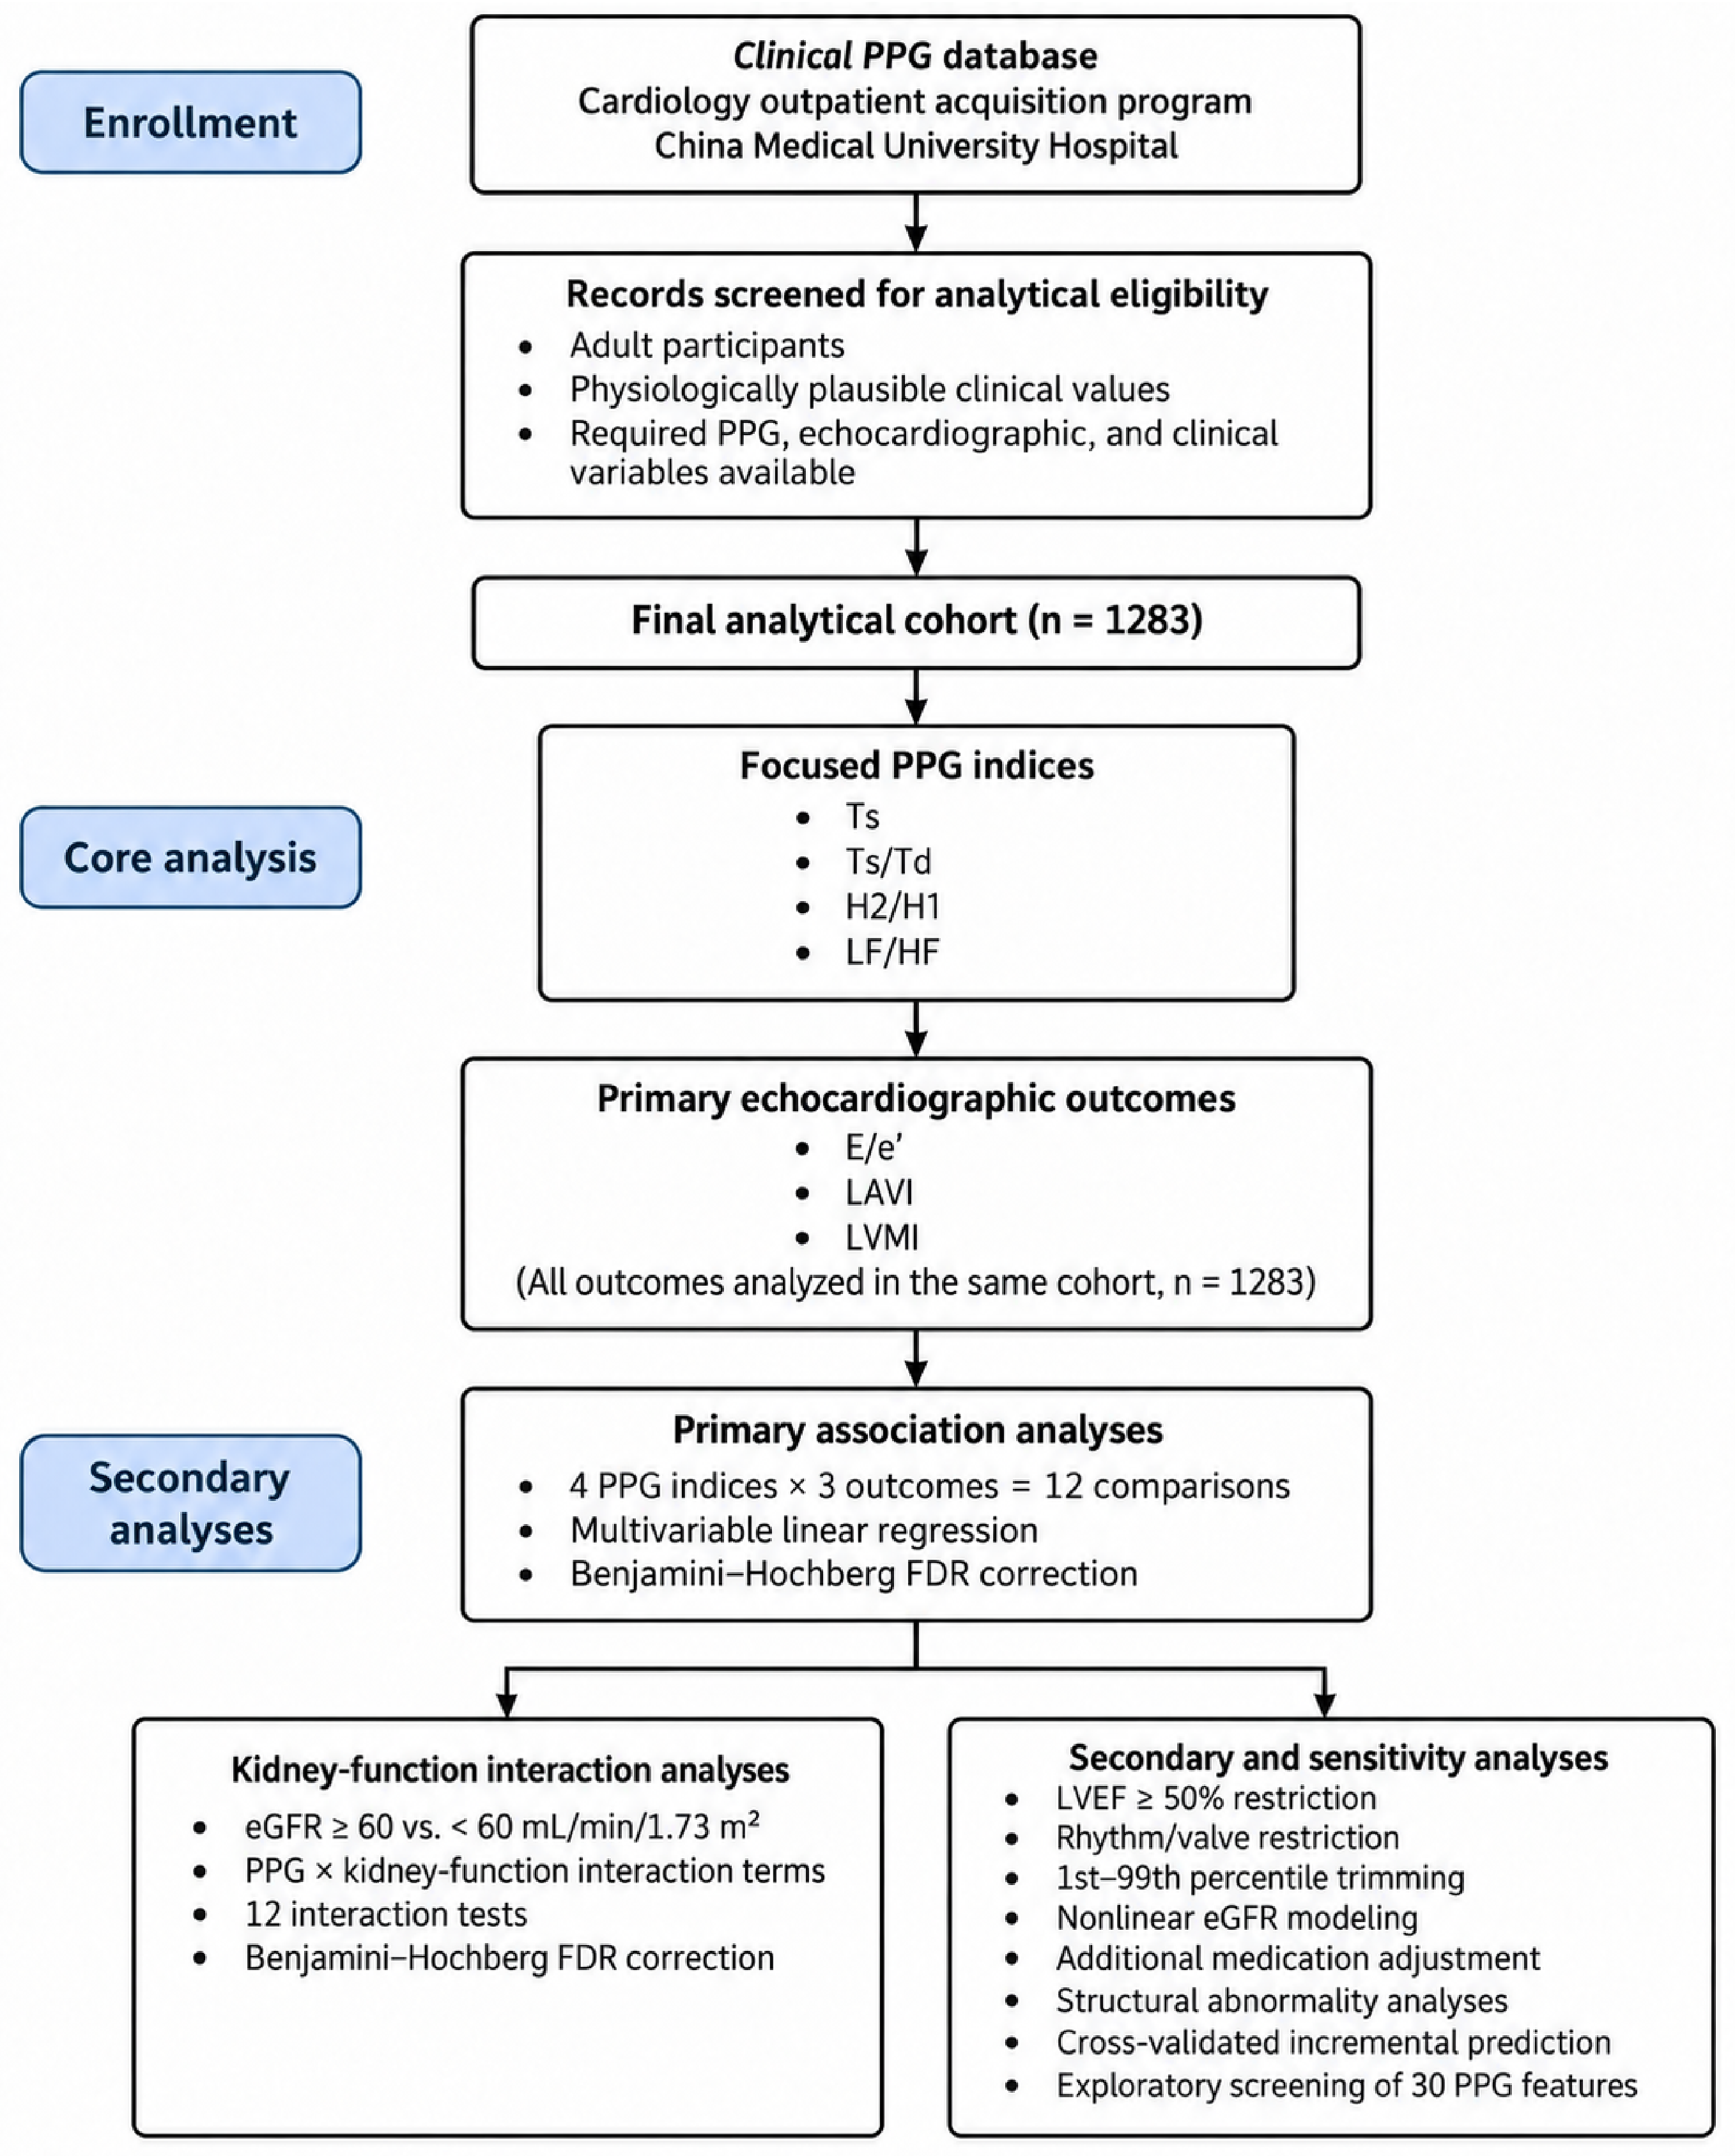
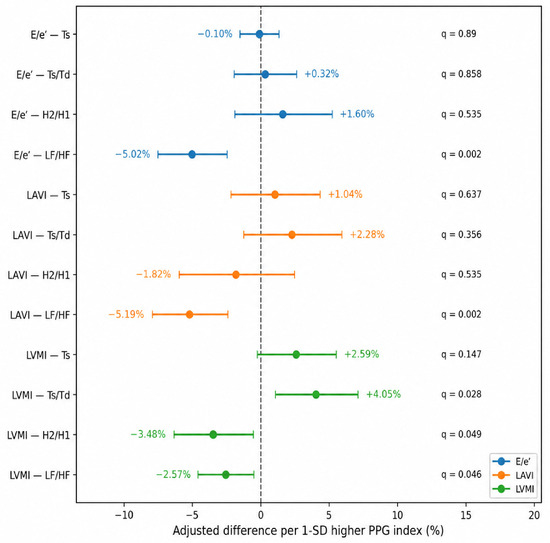
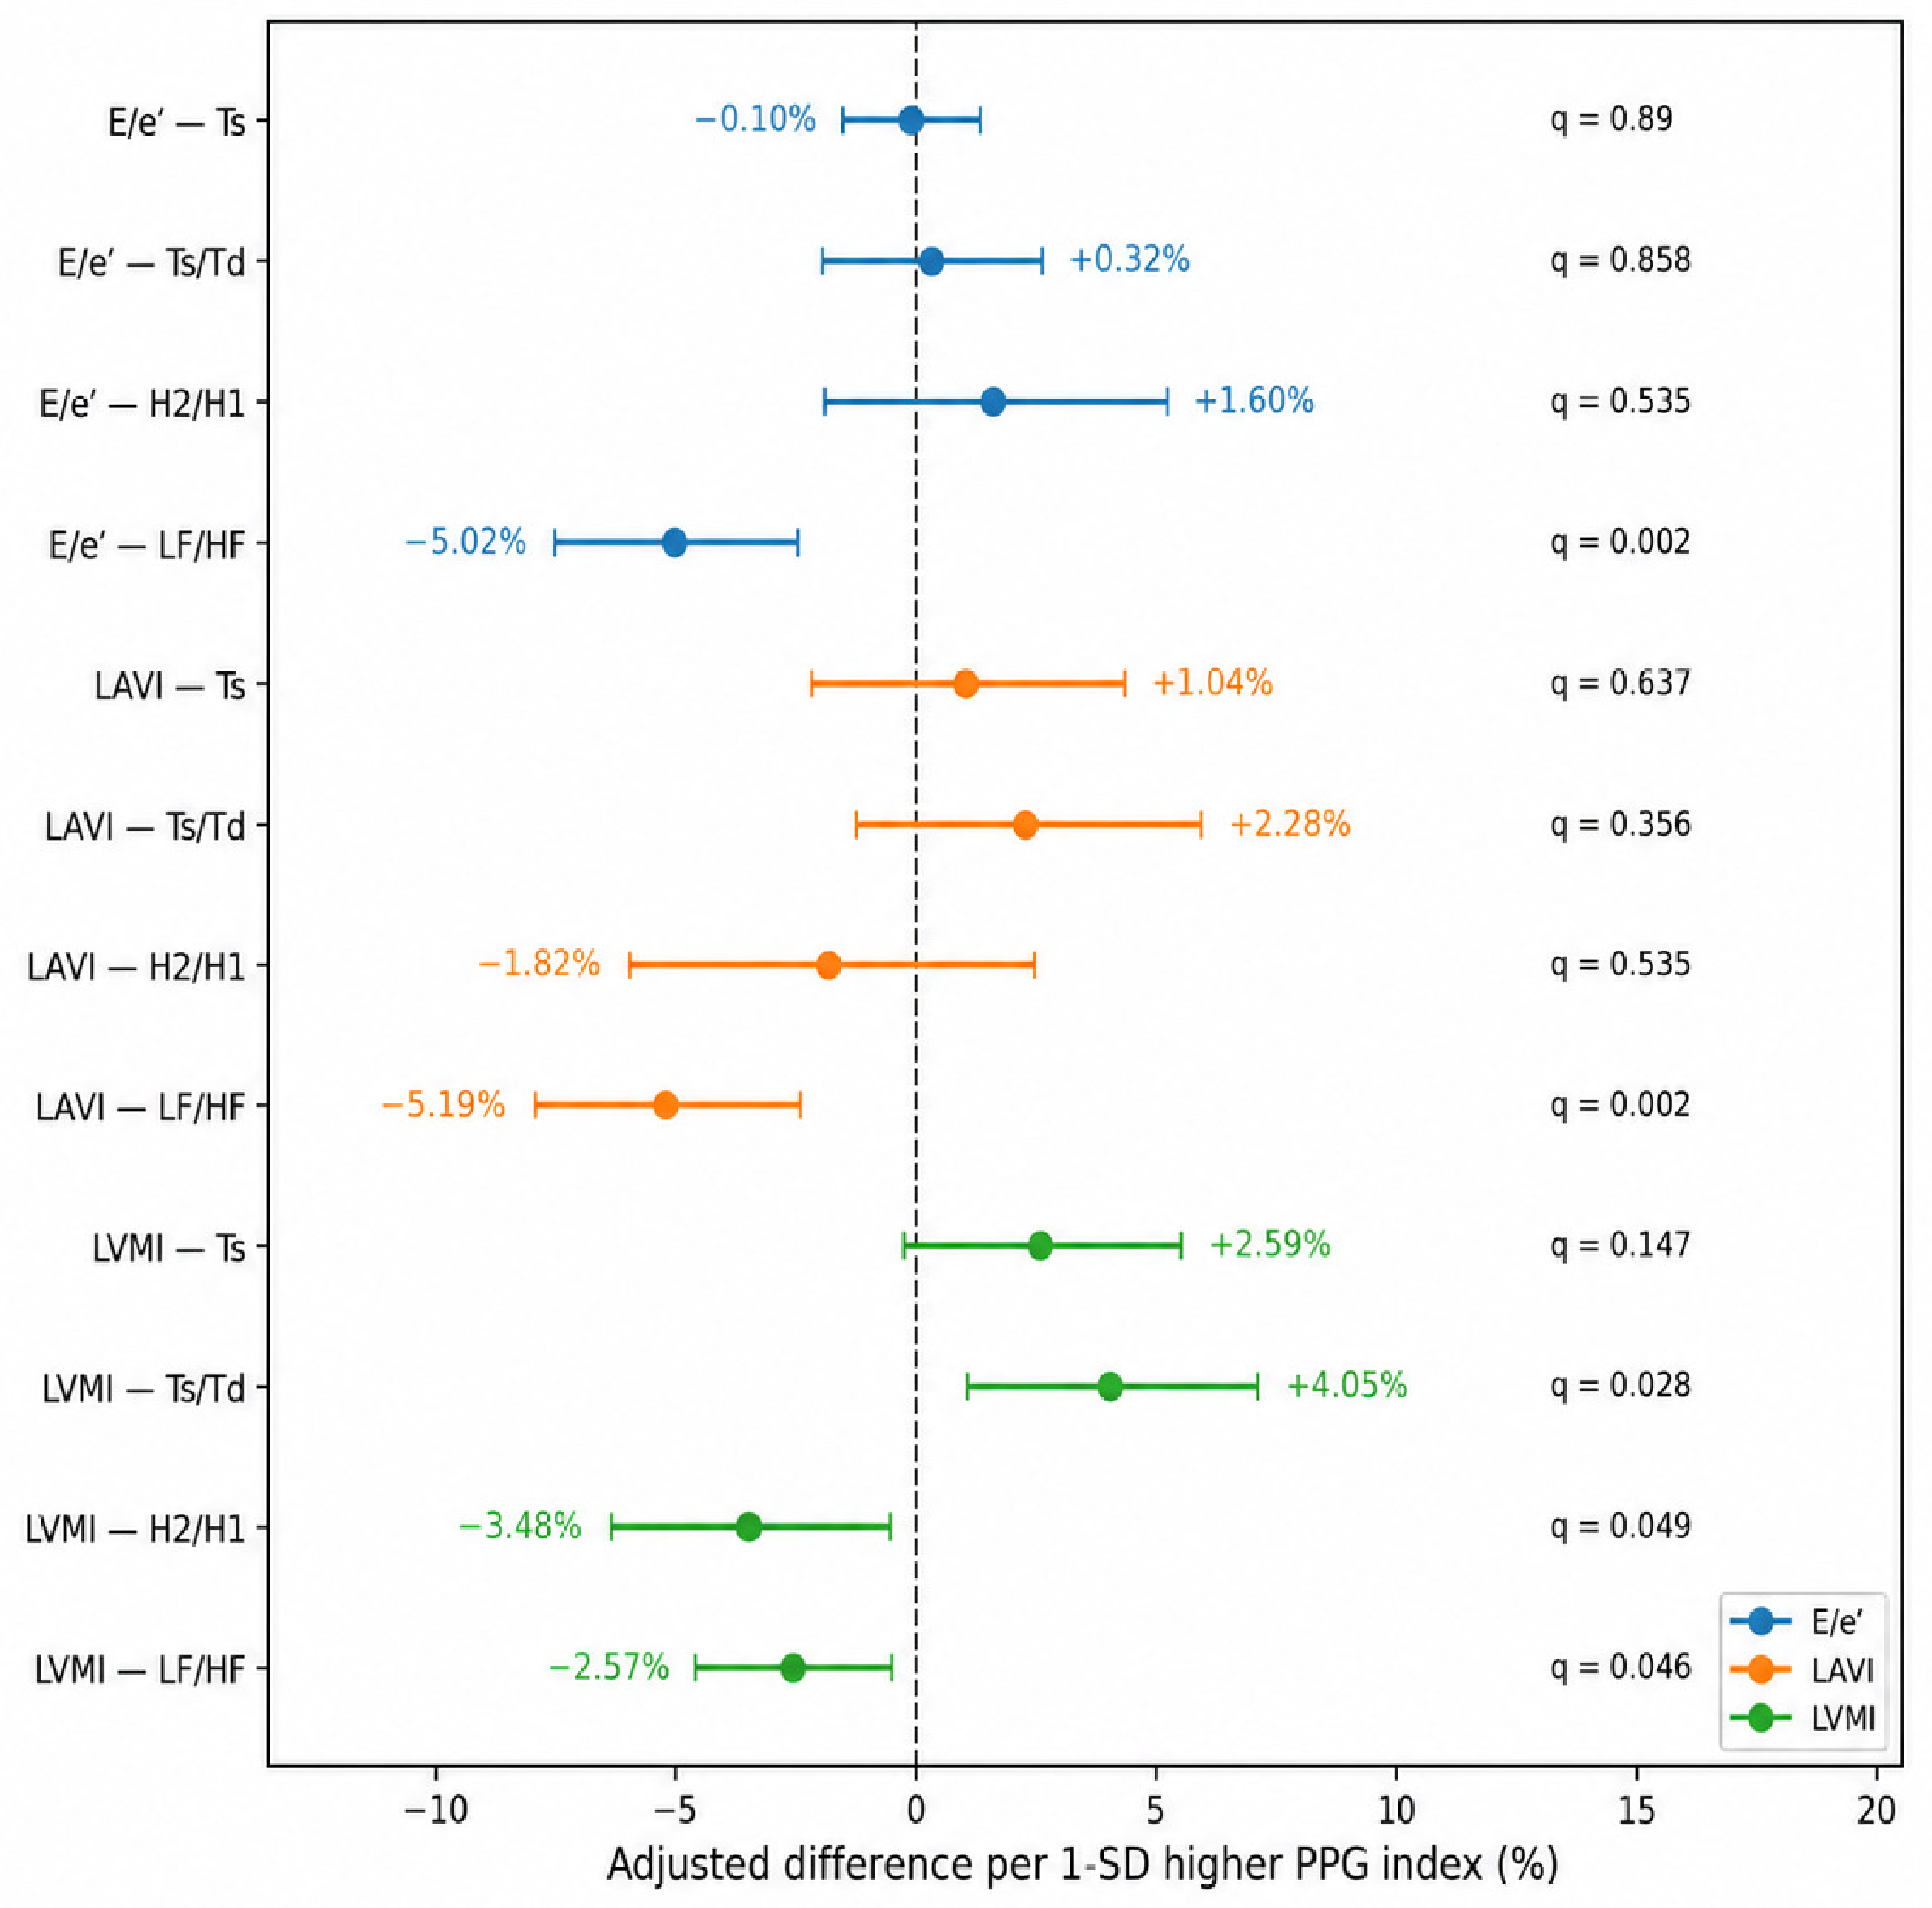
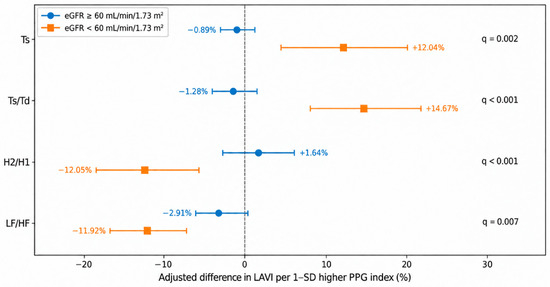
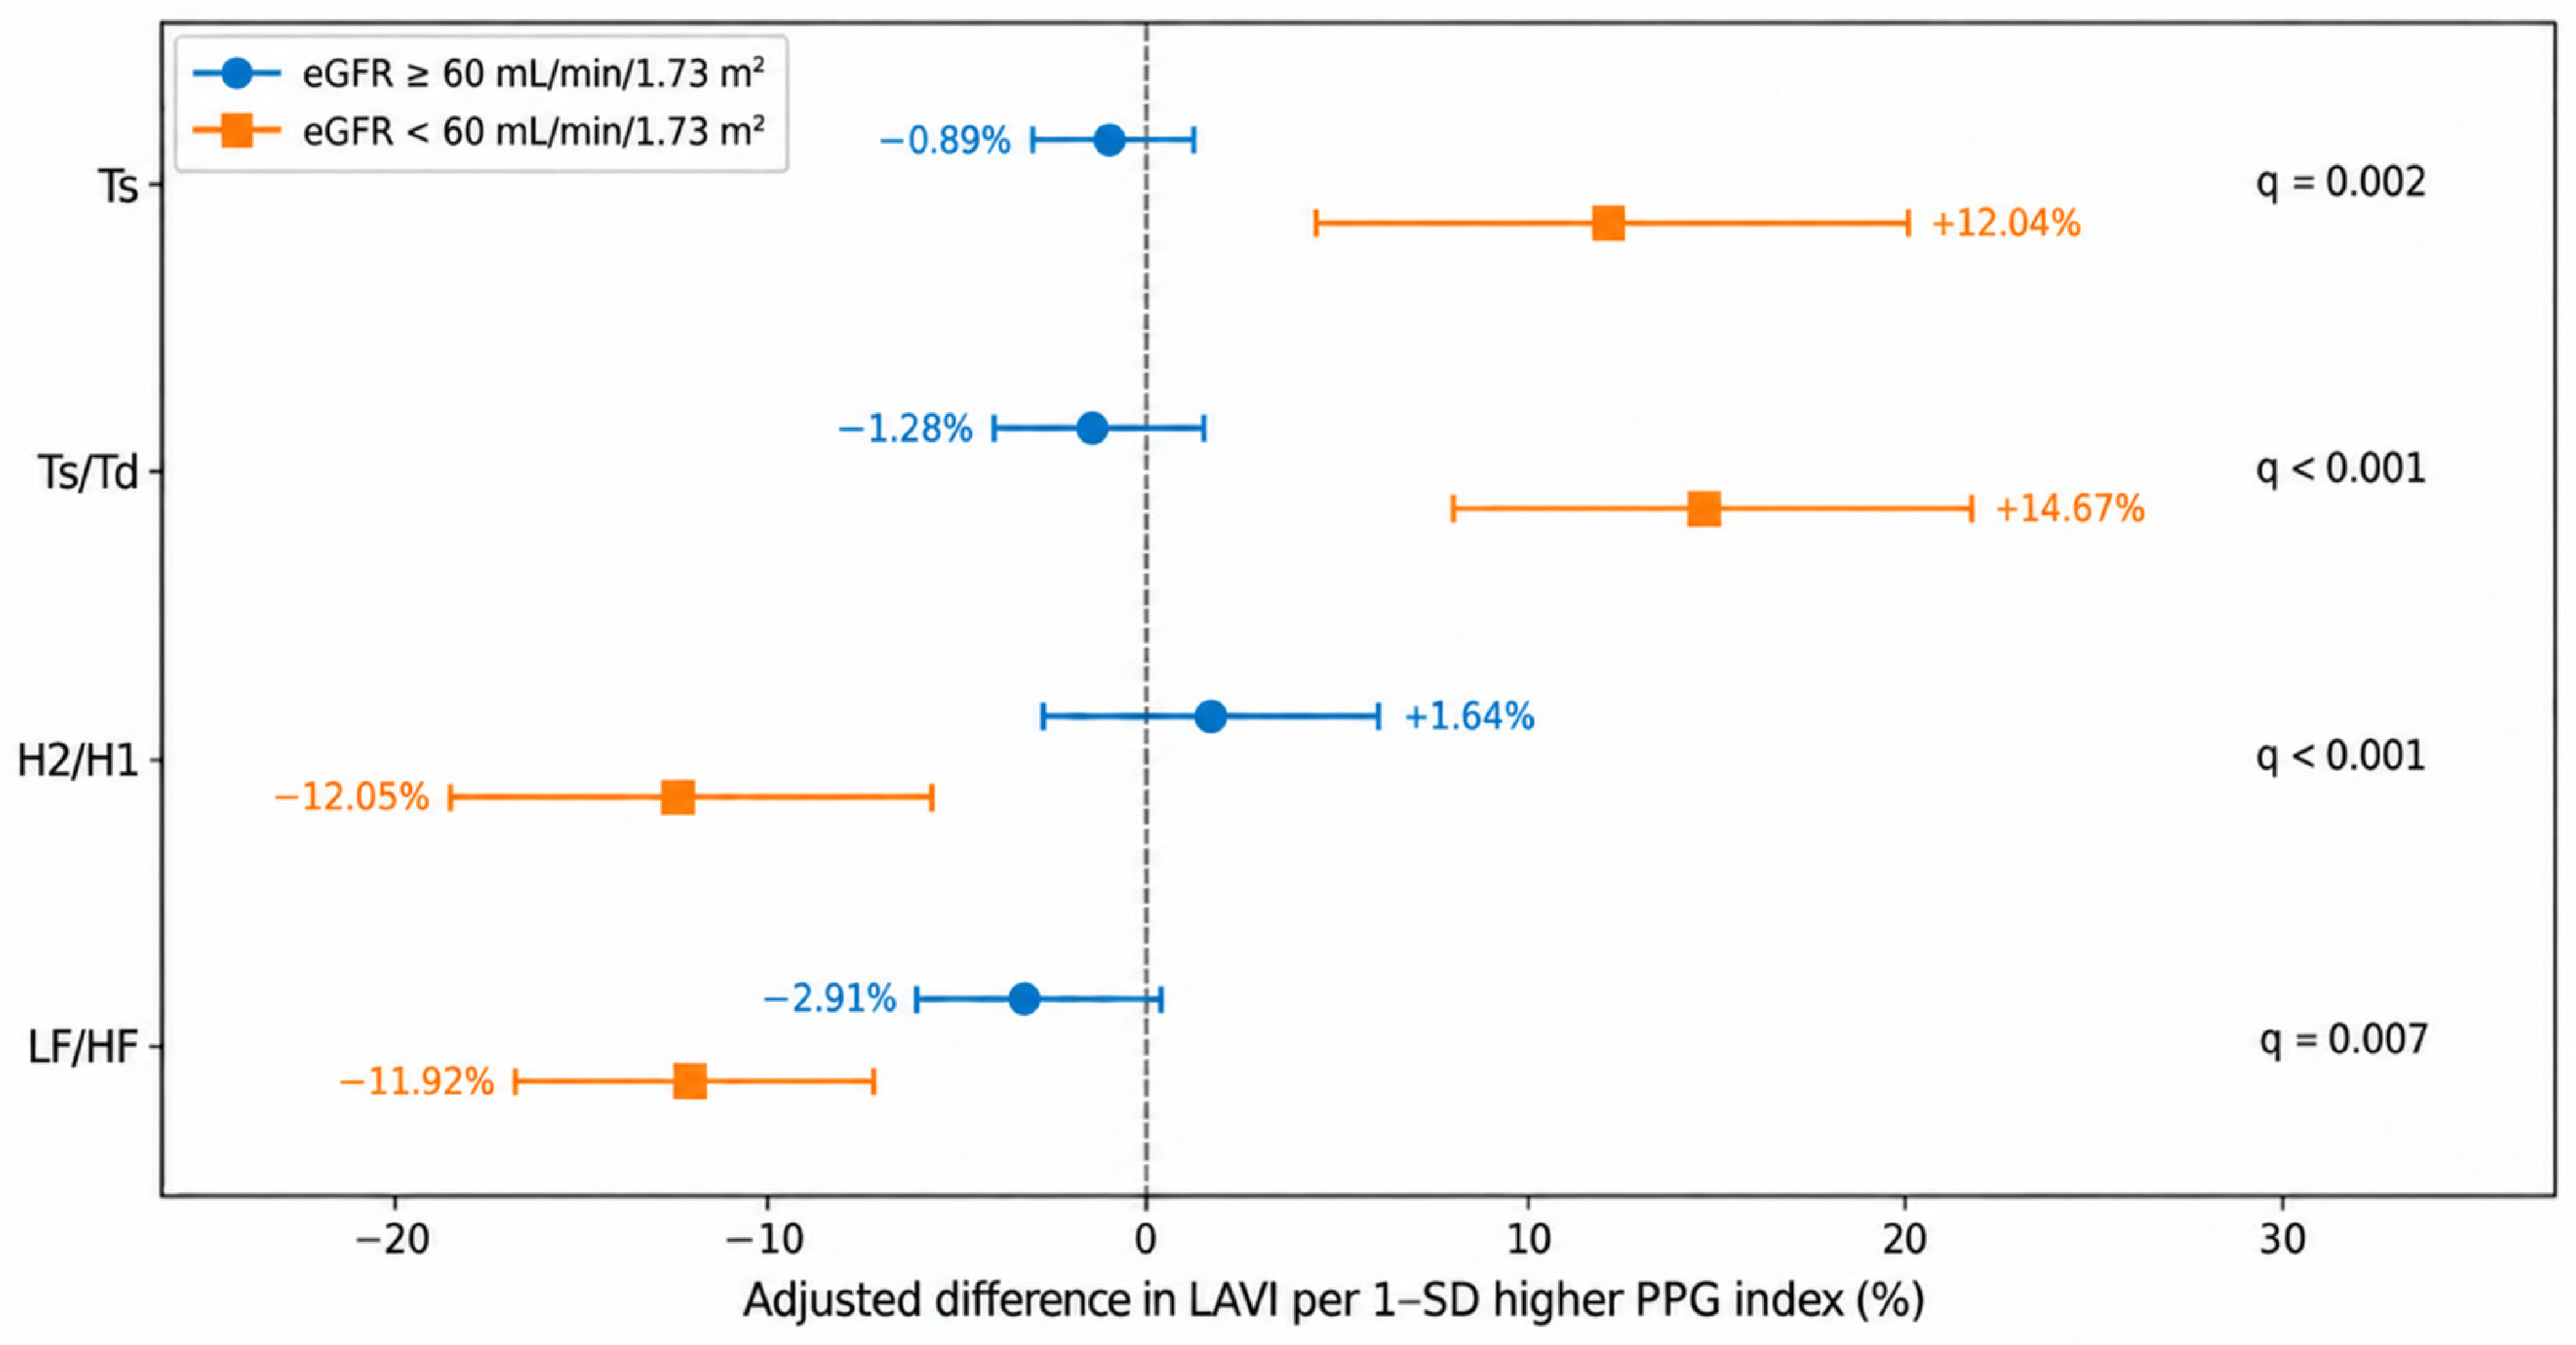
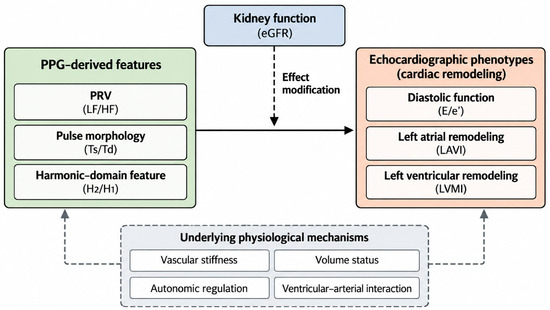
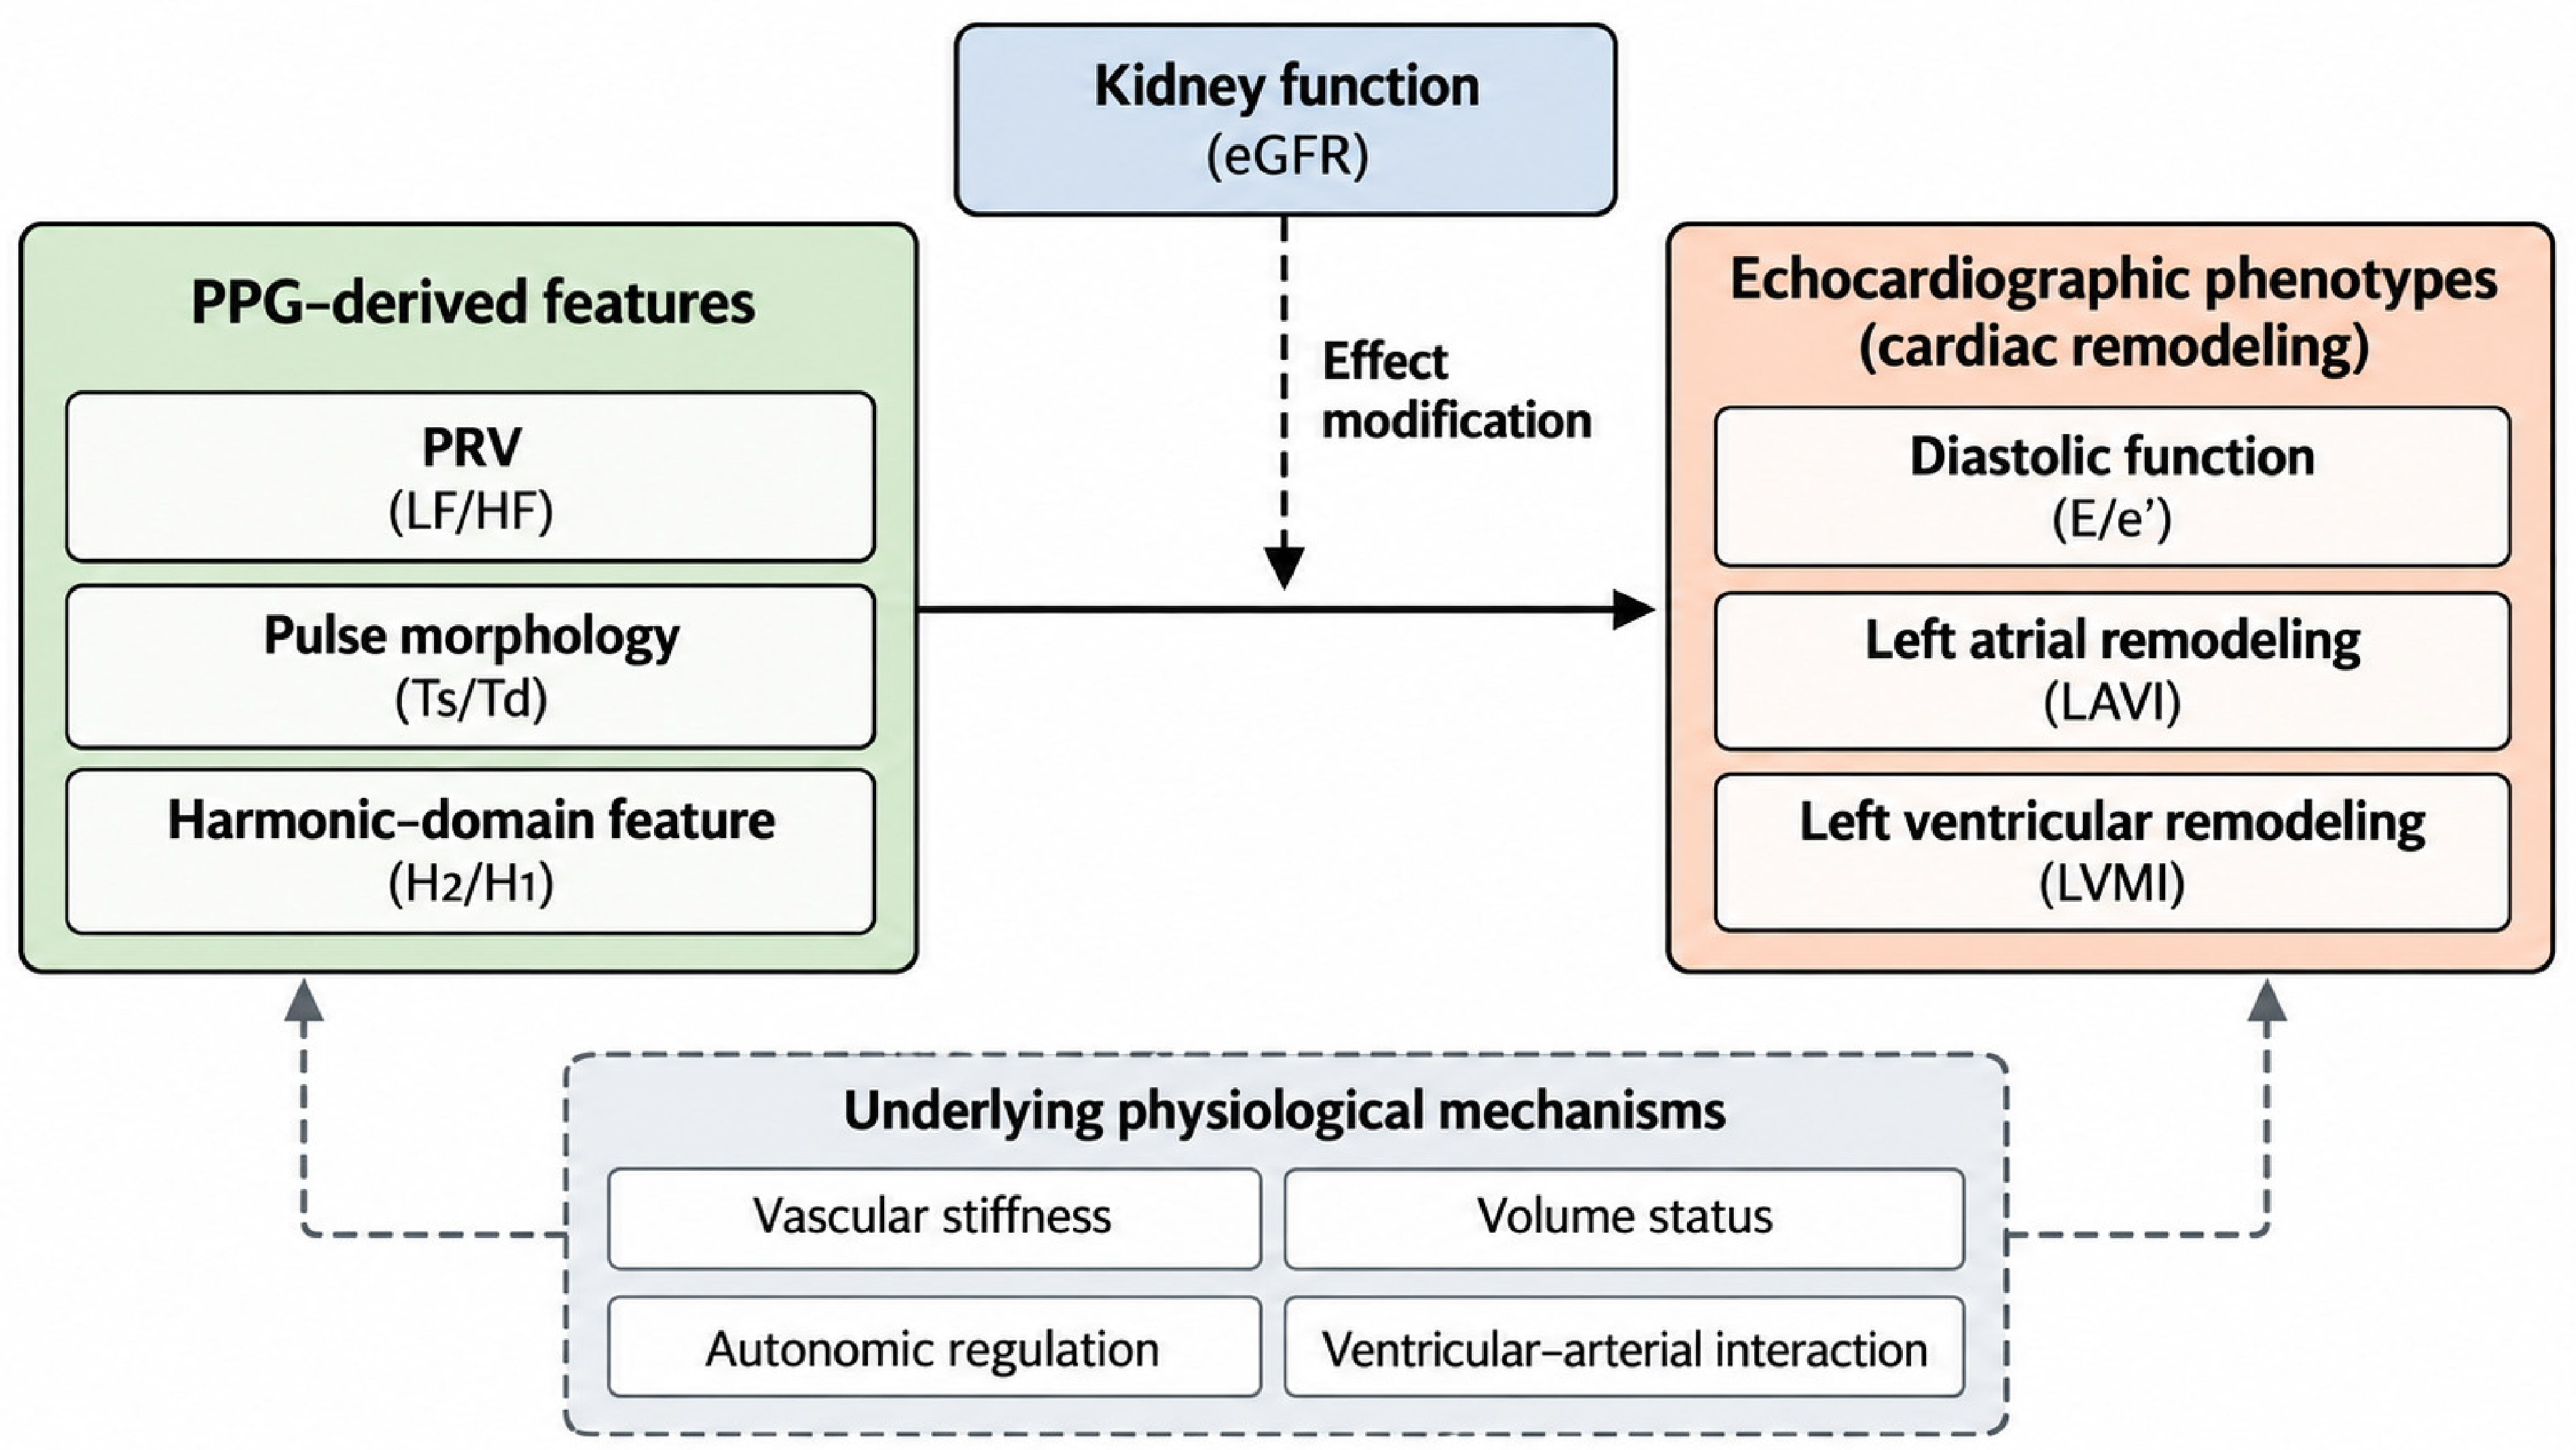

Disclaimer/Publisher’s Note: The statements, opinions and data contained in all publications are solely those of the individual author(s) and contributor(s) and not of MDPI and/or the editor(s). MDPI and/or the editor(s) disclaim responsibility for any injury to people or property resulting from any ideas, methods, instructions or products referred to in the content. |
© 2026 by the authors. Licensee MDPI, Basel, Switzerland. This article is an open access article distributed under the terms and conditions of the Creative Commons Attribution (CC BY) license.