


Abstract
Background: Overactivation of the left dorsolateral prefrontal cortex (L-DLPFC) has been hypothesized to contribute to repetitive stereotyped behaviors in hyperactive autism spectrum disorder (ASD). This pilot study adopted transcranial-focused ultrasound (tFUS) targeting the L-DLPFC, combined with functional near-infrared spectroscopy (fNIRS) collected during a cartoon-viewing resting-like condition, to evaluate intervention feasibility and explore prefrontal functional connectivity (FC) plasticity. Methods: Nine children aged 4–9 years with hyperactive ASD completed a 4-week tFUS protocol. Behavioral assessments were conducted at pre-tFUS, post-tFUS, and during follow-ups. Cartoon-viewing resting-like oxygenated hemoglobin (HbO) signals covering bilateral prefrontal regions were analyzed using Network-Based Statistics (NBS), seed-based FC, and aggregated network indices. Results: Data on intervention feasibility and safety were collected. Descriptive within-group changes in the Autism Treatment Evaluation Checklist (ATEC) and the Repetitive Behavior Scale-Revised (RBS-R) subscale scores were observed across time points. No statistically significant differences were found in corrected whole-network FC analyses. Global and interhemispheric FC exhibited a biphasic trajectory: transient post-treatment decline followed by 1-month rebound, with interhemispheric connectivity elevated relative to the post-tFUS time point (Δ = 0.14, p = 0.03). Conclusions: This pilot demonstrates the feasibility of L-DLPFC-targeted tFUS combined with fNIRS assessment in young children with hyperactive ASD. Observed behavioral score trends and exploratory neuroimaging findings are hypothesis-generating only. Larger, sham-controlled trials are required to evaluate the safety and potential effects of this intervention.
1. Introduction
Autism spectrum disorder (ASD) encompasses a group of neurodevelopmental disorders defined by social communication impairments and repetitive stereotyped behaviors [1]. Epidemiological surveillance indicates a steady upward trend in ASD global incidence [2]. According to the latest report from the U.S. Centers for Disease Control and Prevention (CDC), the ASD prevalence among 8-year-old children has reached 1 in 31 [3], highlighting the urgency of this as a major public health issue. ASD severely affects pediatric patients’ social adaptability and quality of life while imposing substantial socioeconomic and caregiver strain [4]. Although early behavioral interventions, including Applied Behavior Analysis (ABA), have been widely used, their efficacy shows significant individual differences, takes a long time to take effect, and has limited improvement in core symptoms [5]. At present, there are no specific drug treatments for ASD core symptoms. The clinical field urgently needs to develop a new type of intervention method that is precise, safe, and capable of regulating abnormal brain functions.
Advancements in neuroimaging have gradually revealed the neural mechanism basis of ASD: it is not a lesion in a single brain region but involves functional connectivity (FC) abnormalities in multiple large-scale brain networks such as social cognition and executive control networks [6]. Restricted and repetitive behaviors (RRBs) in ASD correlate strongly with resting-state prefrontal network FC of the brain. Among them, the left dorsolateral prefrontal cortex (L-DLPFC) is regarded as an important target for regulating the core symptoms of ASD, given its crucial role in executive control, behavioral inhibition, emotion regulation, and social decision-making [7].
Functional near-infrared spectroscopy (fNIRS) provides an important objective neurophysiological method for quantifying prefrontal functional abnormalities in children with ASD. Previous reviews have shown that fNIRS can assess the cortical activation and FC characteristics of the prefrontal and temporal lobes and related social cognitive networks in children and high-risk infants. It has the advantages of being non-invasive, having good tolerance in children, and being able to collect signals in relatively natural task contexts [8,9]. The resting-state fNIRS study revealed diminished interhemispheric connectivity and abnormal brain network synchronization among children with ASD [10]. Studies based on task-based fNIRS demonstrate that children with ASD exhibit abnormal prefrontal cortex (PFC) activation and FC when performing executive control, working memory, and social cognition tasks. These abnormalities may vary depending on the task type, cognitive load, age, and clinical phenotype, presenting as low response, over-recruitment, or low-efficiency activation in multiple patterns [11,12]. Additionally, some studies have further proposed the “overactivation hypothesis,” suggesting that the L-DLPFC may be in a compensatory or pathological state of excessive activation under specific cognitive or social processing conditions. This abnormal over-recruitment may reflect the inefficient operation of the prefrontal regulatory network and may interfere with social information processing, cognitive flexibility, and behavioral inhibition functions [13]. Therefore, targeted modulation of the L-DLPFC is not merely a reduction in the brain region’s activity, but aims to lower the abnormal and excessive recruitment of the prefrontal activity state, promoting its transformation from a high-load, low-efficiency compensatory mode to a more coordinated and stable functional mode. Based on this, this study introduced fNIRS as an objective neurophysiological evaluation indicator to observe changes in the oxygenated hemoglobin (HbO) responses of the L-DLPFC and related prefrontal regions, as well as longitudinal alterations in interhemispheric functional connectivity patterns before and after the intervention, in order to further explore the potential brain functional mechanism of targeting the regulation of the L-DLPFC to improve the behavioral impairments of children with ASD.
Transcranial-focused ultrasound (tFUS) represents a highly promising non-invasive brain stimulation (NIBS) modality, with its unique advantages including high spatial precision (up to millimeter level) and excellent safety [14]. Animal model studies have shown that chronic tFUS stimulation can effectively improve social avoidance in mice experiencing social defeat stress [15]. In human research, tFUS has been successfully used for targeted intervention in diseases such as Parkinson’s disease and has demonstrated good tolerance and initial efficacy [16]. A recent case report on patients with ASD also confirmed that tFUS can safely and precisely act on the L-DLPFC, accompanied by improvements in social behavior and stereotyped behaviors [17]. However, there is currently a lack of systematic prospective clinical evidence to evaluate the impact of tFUS targeting the L-DLPFC on the core symptoms of ASD.
Based on the above background, this single-arm prospective pilot study was designed to evaluate the intervention outcomes of targeted tFUS modulation of the L-DLPFC on core symptoms in children with ASD. We hypothesized that tFUS targeting the prefrontal region would yield reductions in RRBs, and such behavioral improvement may correlate with the normalization of the prefrontal FC (particularly the circuits related to inhibitory control and habitual behaviors). This study systematically assessed both immediate and sustained outcomes of tFUS. If the hypothesis is supported, this pilot work will provide preliminary evidence for a novel, precise neural regulation strategy for ASD and deepen mechanistic insights into the pathological contributions of the L-DLPFC to autistic pathophysiology, with potential scientific value and clinical translational significance.
2. Materials and Methods
2.1. Participants
Nine children with ASD were recruited, including five boys (mean age: 5.4 ± 1.2 years) and four girls (mean age: 6.9 ± 1.7 years). All clinical ASD diagnoses were formally confirmed by specialized neuropediatricians in accordance with the Diagnostic and Statistical Manual of Mental Disorders, Fifth Edition (DSM-5). Included subjects were those with ASD accompanied by clinically hyperactive/impulsive symptoms, referred to herein as “hyperactive ASD”. Comorbid attention deficit/hyperactivity disorder (ADHD) was diagnosed by pediatric neurodevelopmental clinicians following DSM-5 criteria. Exclusion criteria comprised tuberous sclerosis, Fragile-X syndrome, past seizure disorder, severe traumatic brain injury, metal implants, medication with anticonvulsant or antipsychotic drugs, and any history of important medical or neurological disorders.
The Childhood Autism Rating Scale, Second Edition (CARS-2), was used to evaluate the overall severity of autistic symptoms. The Social Responsiveness Scale (SRS) is an established tool for screening autism [18], and it is a 65-item questionnaire that measures autistic traits using a Likert-type scale with responses ranging from “0 = Not true” to “3 = Almost always true” [19]. The original SRS-2 manual suggests that T scores can be interpreted as follows: ≤59 T, within normal limits; 60–65 T, mild; 66–75 T, moderate; ≥76 T, severe. The SRS-2 consists of three forms according to age: the Preschool Form (2.6–4.6 years), School-Age Form (4.0–18.0 years), and Adult Form (19–89 years). The School-Age Form was completed by primary caregivers to quantify participants’ baseline social responsiveness deficits, and individual SRS-2 T-scores are reported in Table 1.
Table 1.
Baseline demographic and clinical characteristics of participants before tFUS intervention.
Throughout the study period, participants continued stable pre-existing concurrent therapies, including speech therapy and occupational therapy. No participants initiated new psychotropic medications or adjusted their medication regimens during the 4-week tFUS intervention and follow-up (F/U) window. None of the children had received any neuromodulation treatment in the 30 days before enrolment.
This study was registered in the Chinese Clinical Trial Registry (ChiCTR), registration number: ChiCTR2500096862, registered on 7 February 2025. The originally registered primary outcome was the change in the Childhood Autism Rating Scale, Second Edition (CARS-2), and the secondary outcome was resting-state electroencephalography (EEG). In this sample of young children with ASD, EEG recordings were severely affected by head-motion artifacts with high noise levels, which prevented valid analysis. fNIRS was adopted as the alternative neuroimaging approach because it offers higher robustness against minor head movements in pediatric populations. Compared with CARS-2, which is oriented toward formal diagnostic assessment and severity stratification, the Autism Treatment Evaluation Checklist (ATEC) serves as a rapid, practical tool for tracking intervention response, and dynamic reductions in its total and subscale scores can intuitively reflect therapeutic gains in children following treatment.
The study protocol received ethical approval from the Medical Ethics Committee of Shanghai Yangzhi Rehabilitation Hospital (Shanghai Sunshine Rehabilitation Center, Approval No. [2024] 032). Written informed consent was obtained from all children’s parents prior to enrolment. All caregivers were fully informed of the entire experimental process and confirmed that their children had not received any neuromodulation treatment in the past 30 days. Among the nine enrolled children with ASD, nine participants received a formal comorbid ADHD diagnosis by a pediatric neurodevelopmental clinician. Hyperactive symptoms were quantified using the Conners Rating Scale. Table 1 summarizes the participant demographics and clinical characteristics at pre-tFUS, including corrected CARS-2 severity classifications. Table 1 summarizes the participant demographics and clinical characteristics at pre-tFUS.
2.2. tFUS Transducer and Stimulation Parameters
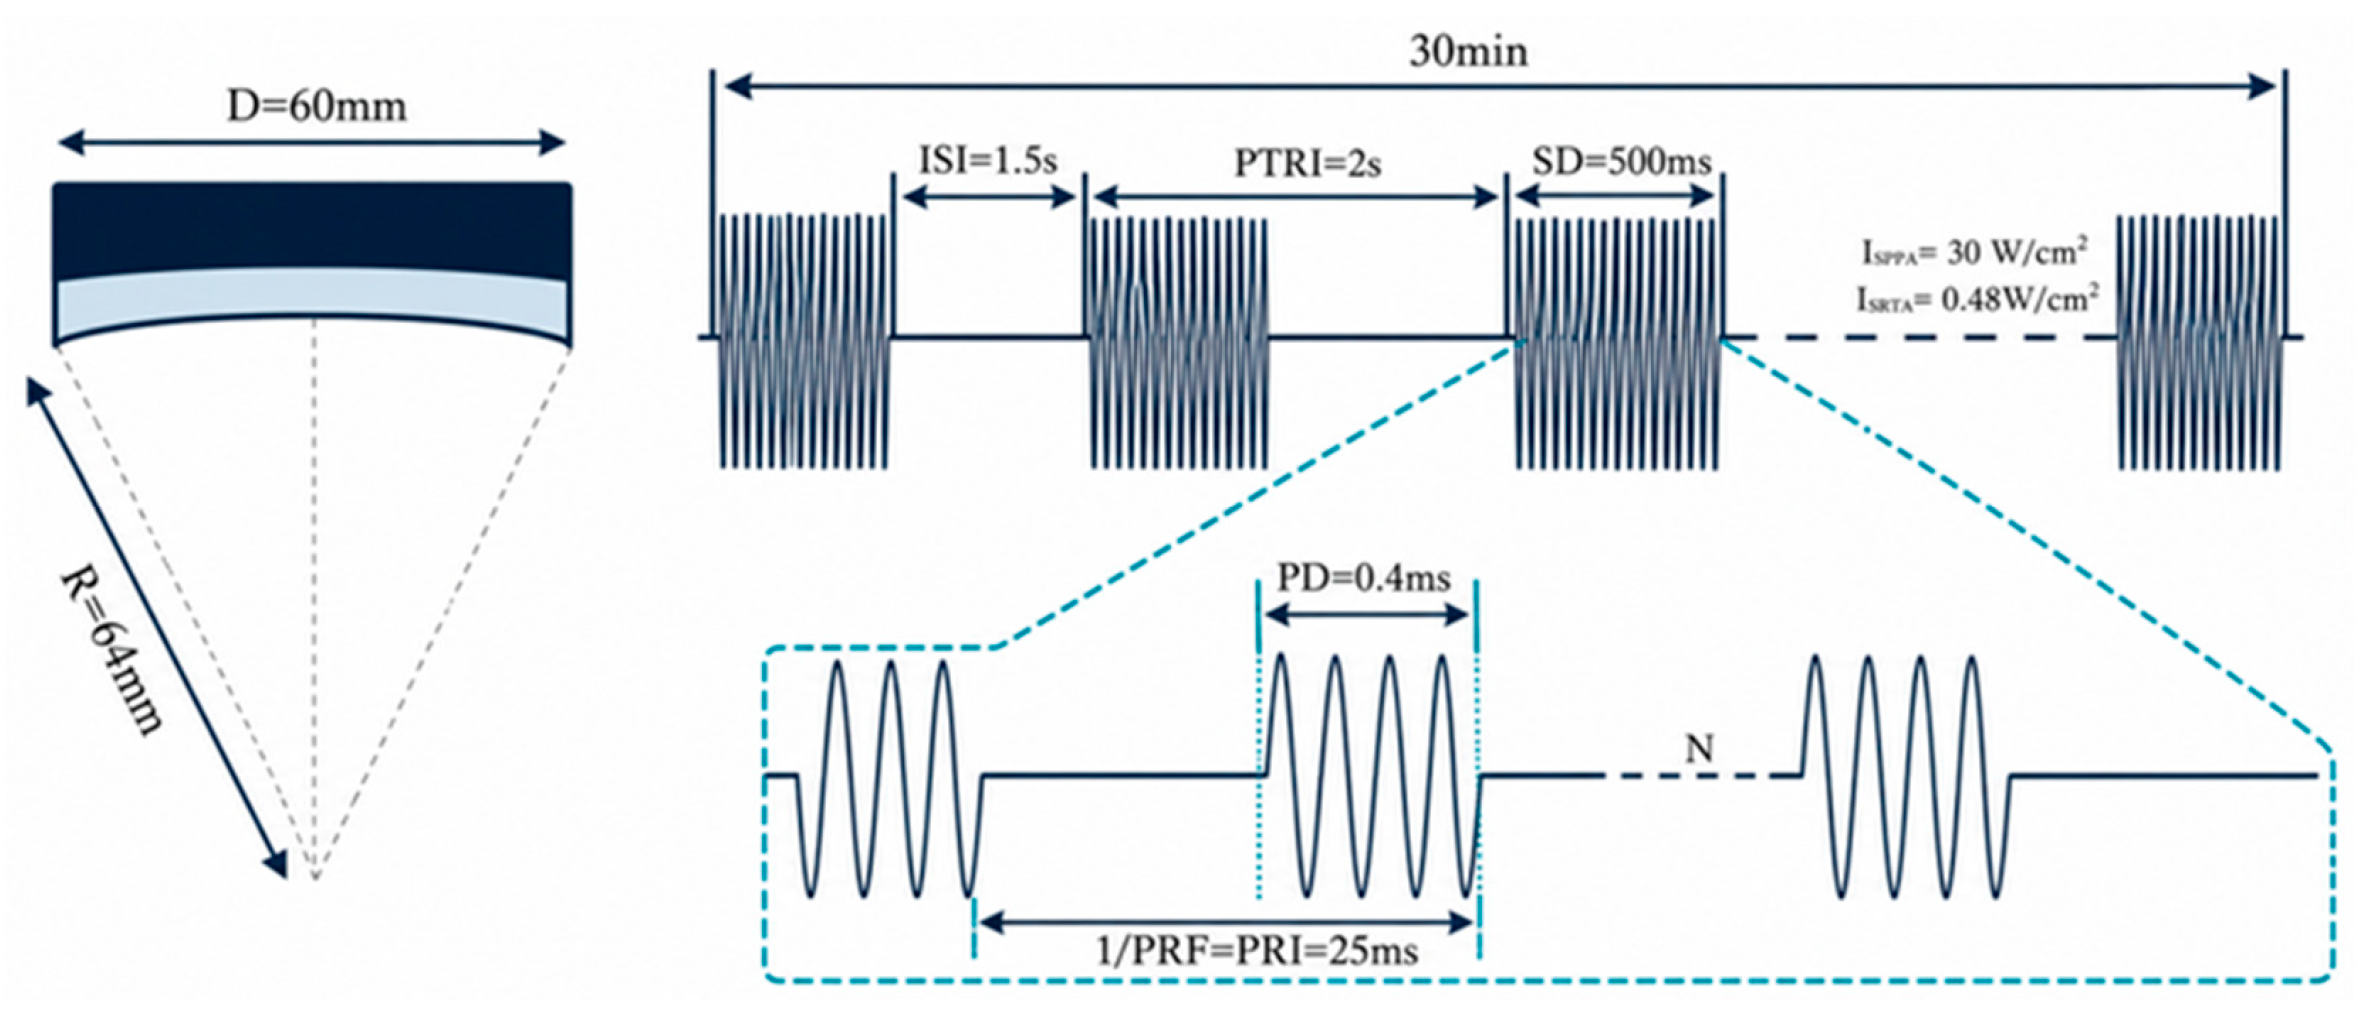
The four-element DPX-500-4CH transducer coupled with the NeuroFus PRO TPO-203 system (Sonic Concepts, Brainbox Ltd., Cardiff, UK; fundamental frequency: 500 kHz) was utilized. The transducer features an outer aperture diameter of 60 mm and a radius of curvature of 64 mm. The ultrasound gel was applied at the subject skin–transducer interface [20].
The tFUS transducer and detailed stimulation parameters are illustrated in Figure 1. These settings determine the temporal–spatial characteristics of the acoustic pressure waveform as well as the energy delivered at the intended brain target. The blocked design has a stronger inhibitory effect than the interleaved design [21].
Figure 1.
Illustration of the geometry and parameters of the tFUS transducer, the schematic of pulsed ultrasound waves, and associated stimulation parameters. Note: These parameters define the sonication protocol. D: Transducer’s aperture diameter. R: Transducer’s curvature radius. ISI: Inter-stimulus interval. PTRI: Pulse train repetition interval. SD: Sonication duration. PD: Pulse duration. PRF: Pulse repetition frequency. PRI: Pulse repetition interval.
2.3. Experimental Procedure
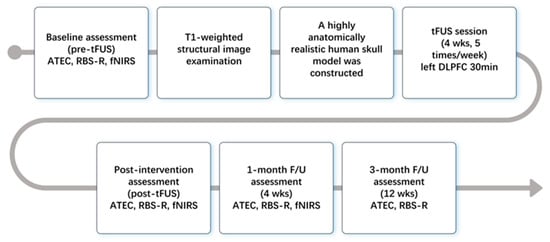
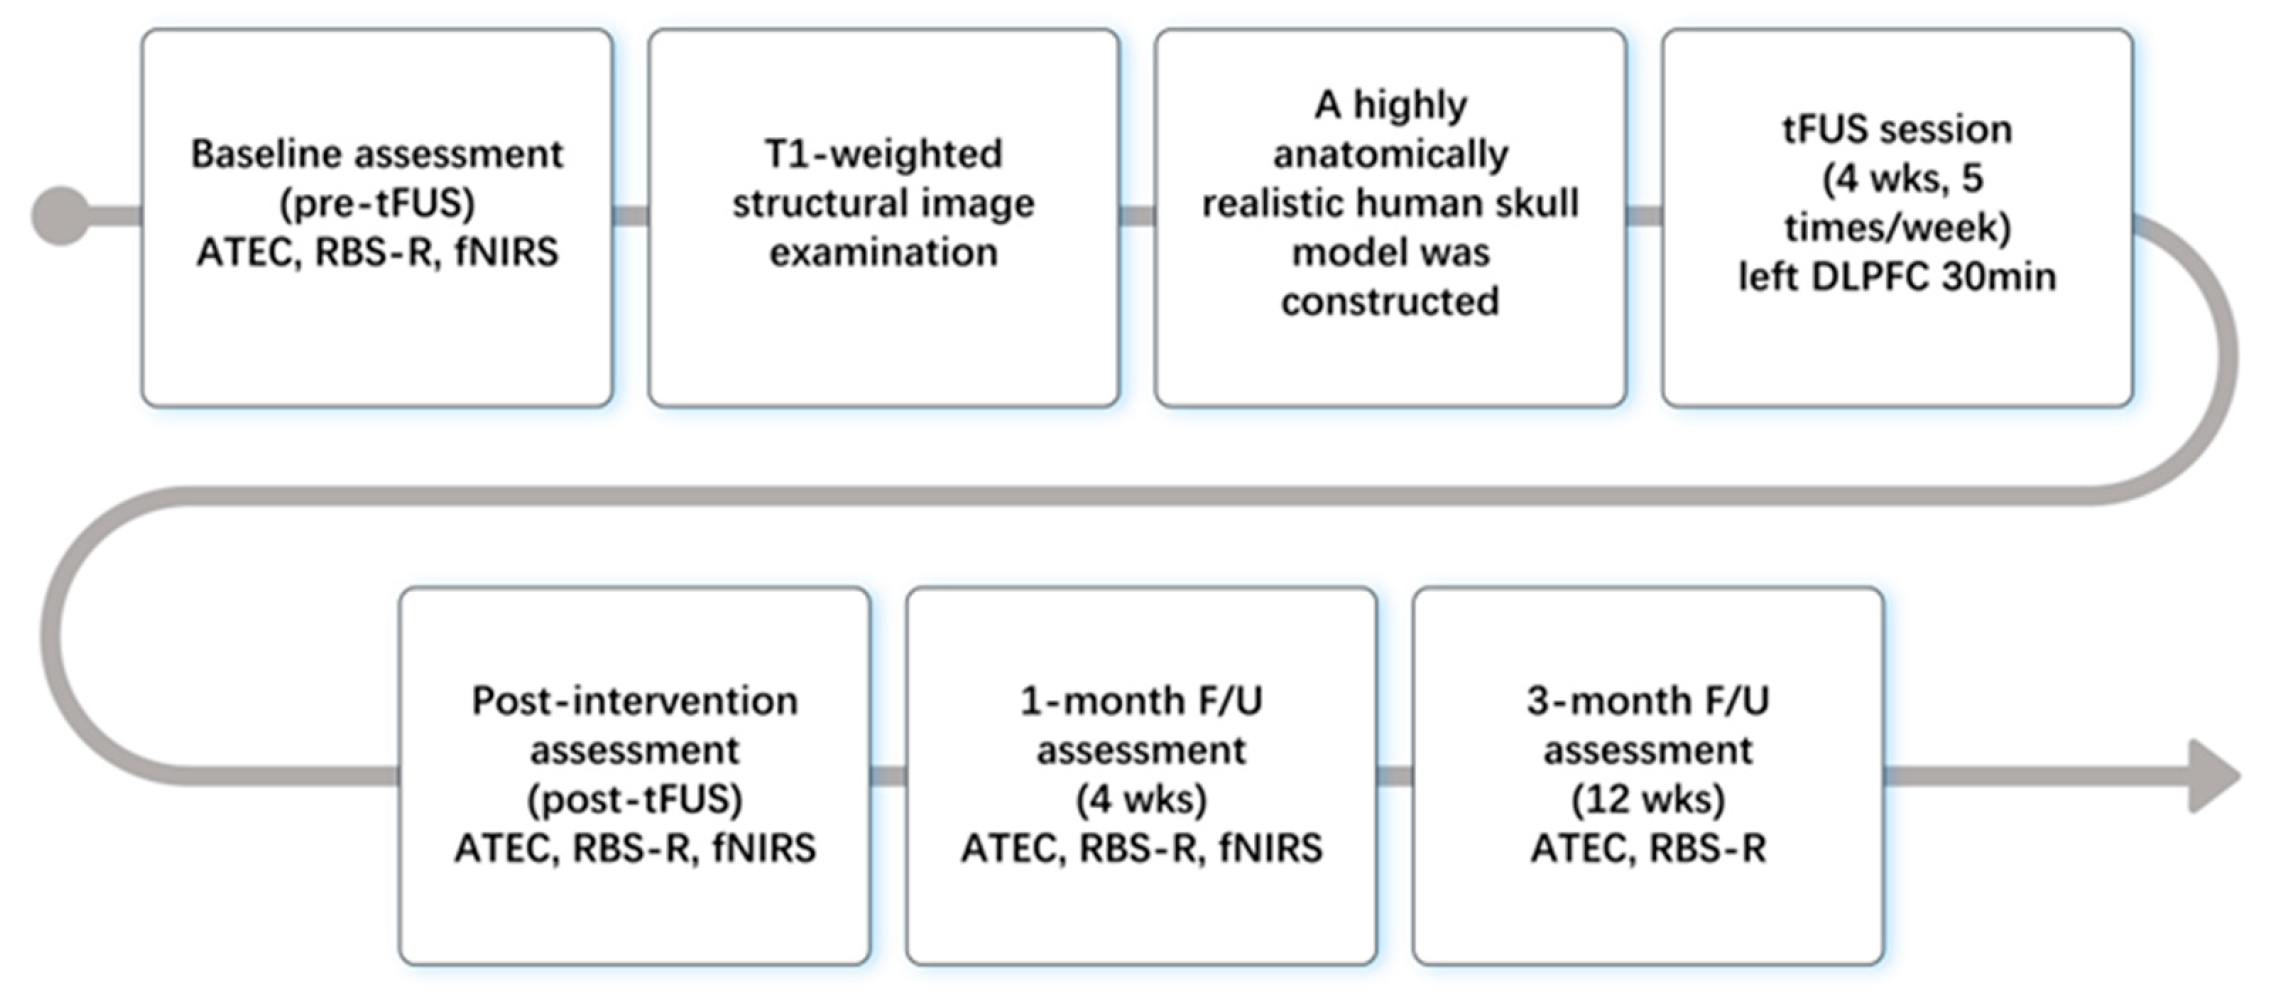
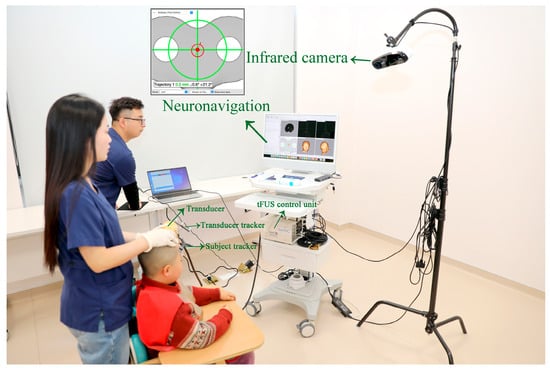
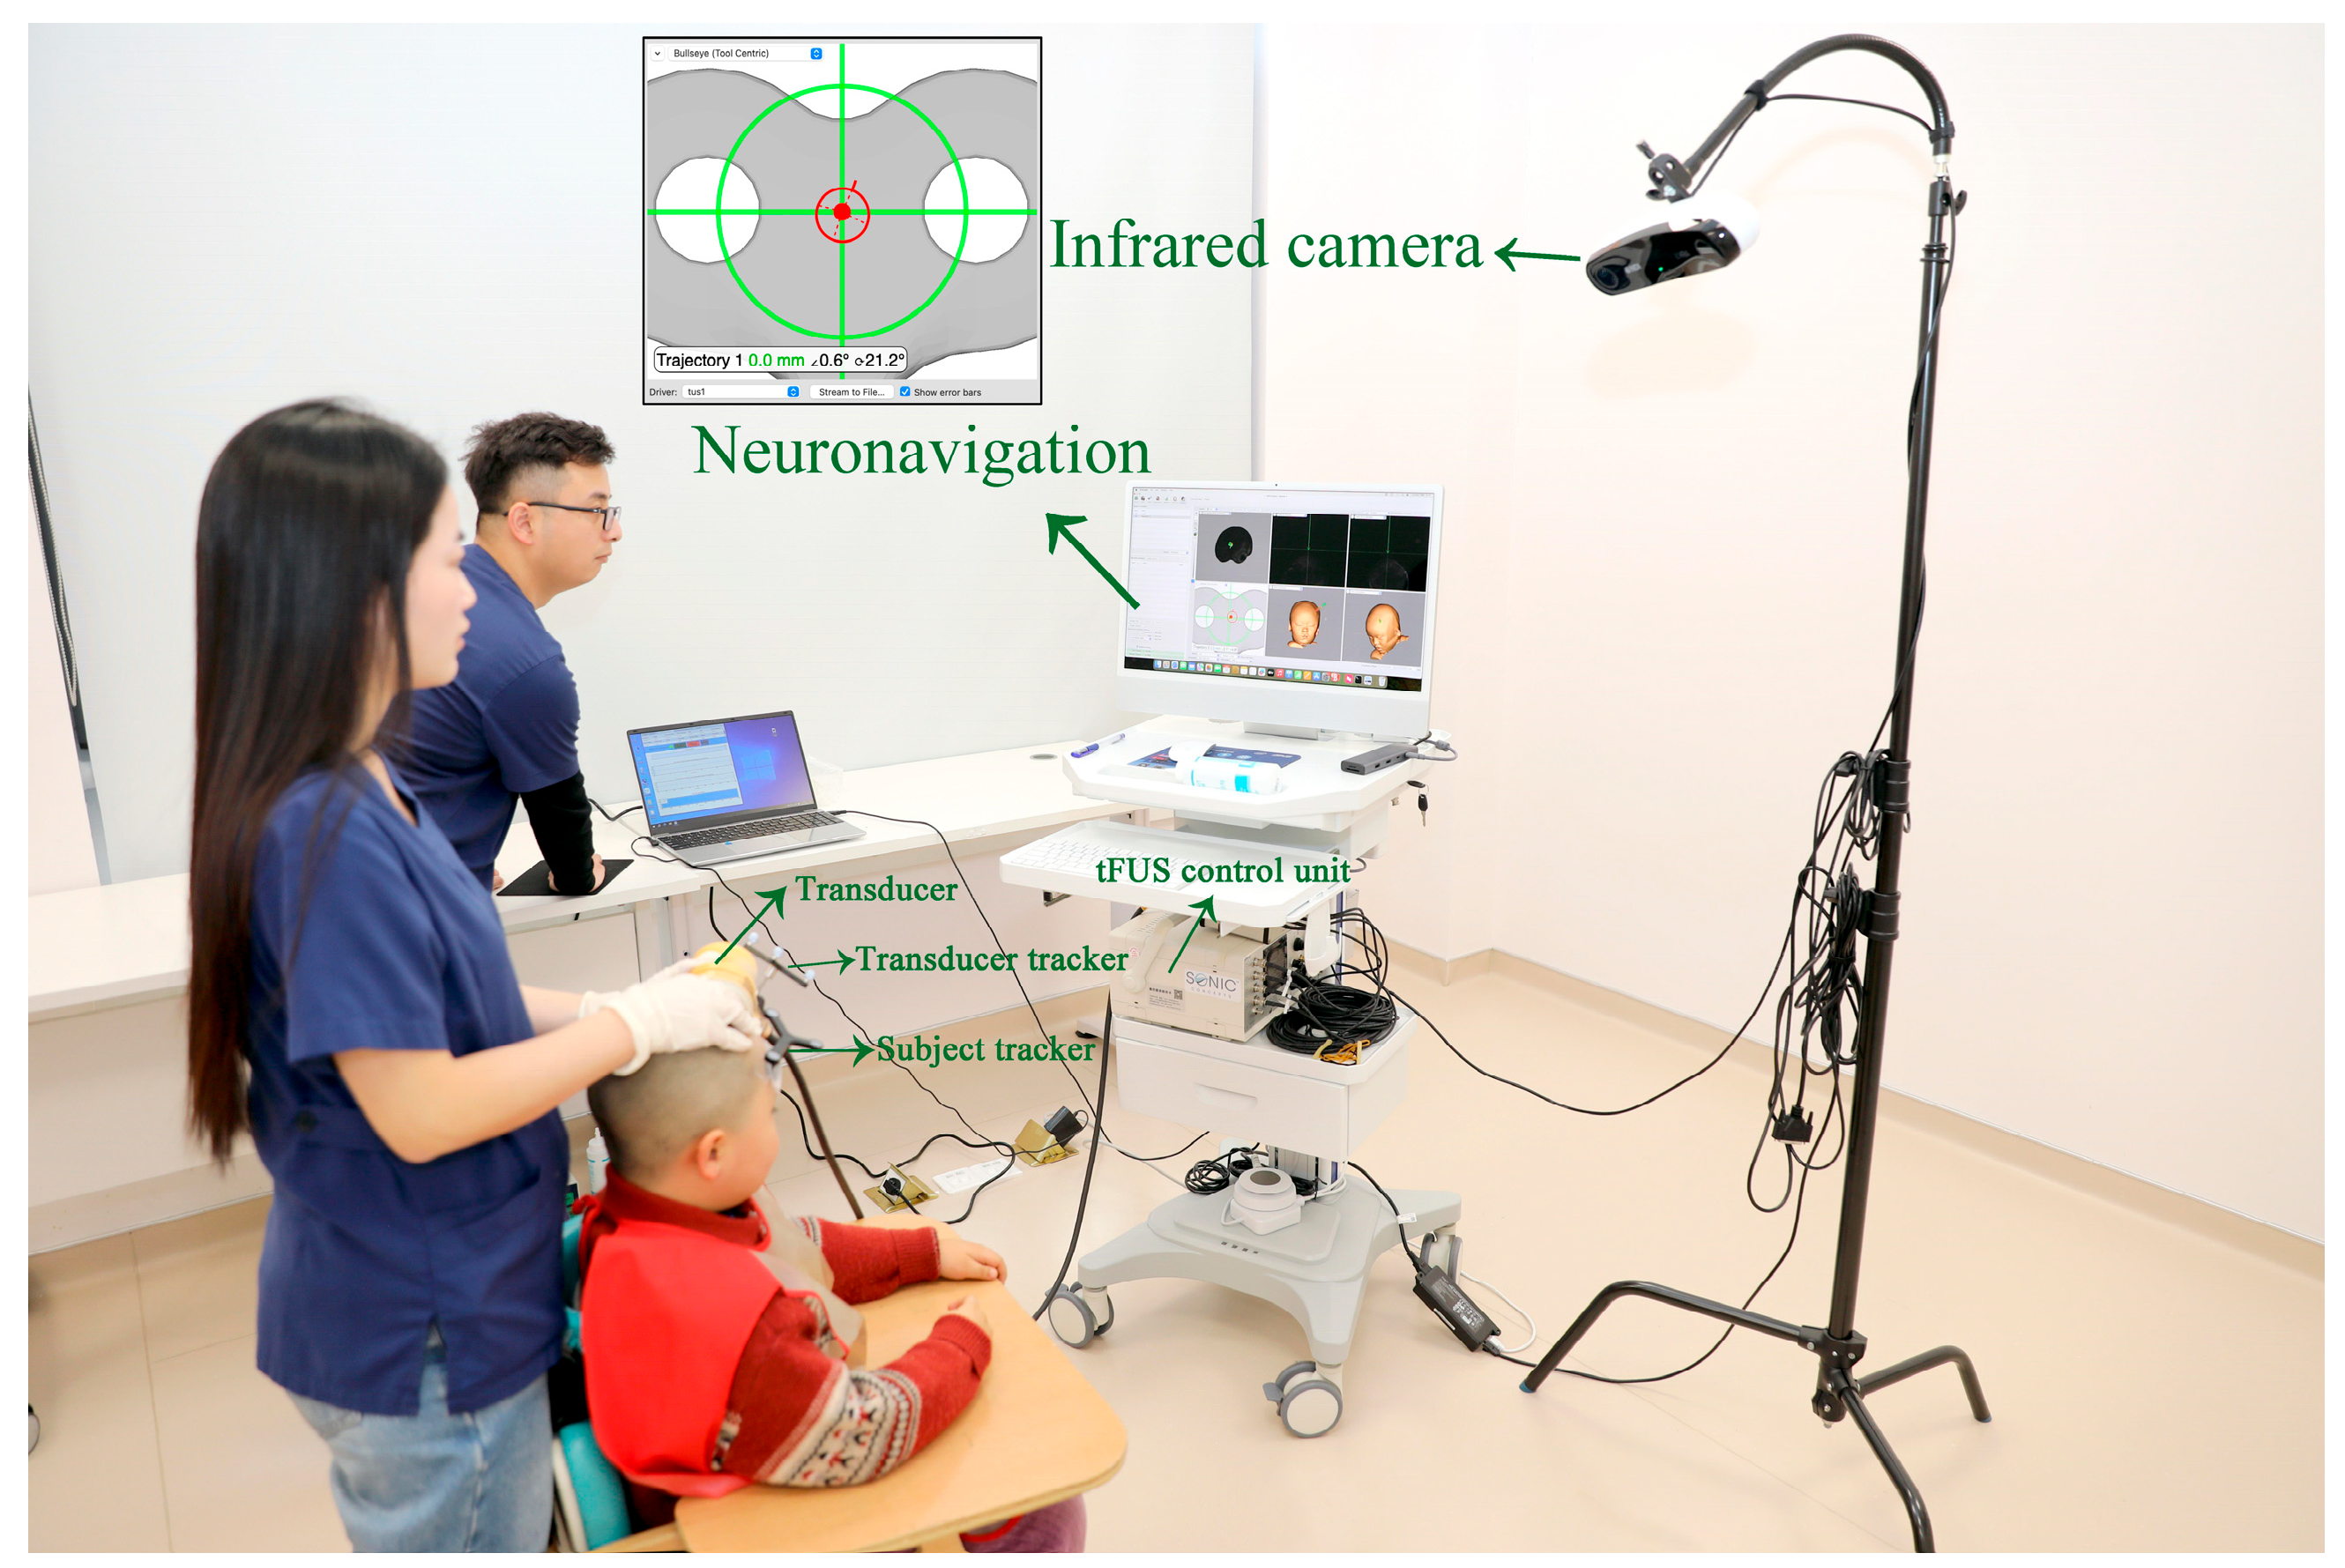
The overall study workflow was implemented sequentially across baseline evaluation, individual skull modeling, repetitive tFUS intervention, immediate post-tFUS testing, and 1-month F/U assessments, as illustrated in the experimental flow chart (see Figure 2). The standardized behavioral scale assessment was conducted using the ATEC and the Repetitive Behavior Scale-Revised (RBS-R). The full on-site tFUS-navigated intervention setup is displayed in Figure 3.
Figure 2.
Flow chart of the study design and procedures in a neuromodulation study. Note: The protocol comprised baseline assessment, neuroimaging-guided targeting preparation, a 4-week tFUS) intervention, post-tFUS evaluation, and 4-week and 12-week F/U. Behavioral outcomes were quantified using the Autism Treatment Evaluation Checklist (ATEC) and RBS-R, while cortical activity was measured using fNIRS. F/U: follow-up.
Figure 3.
Experimental setup for individualized tFUS targeting guided by structural imaging. Note: The T1-weighted structural images were used to determine the individualized stimulation targets, and a realistic skull model was constructed. The tFUS transducer was positioned over the scalp using neuronavigation guidance, ensuring accurate focal localization before delivering the pulsed ultrasound waves to the L-DLPFC. Real-time visualization and targeting parameters were displayed on the monitoring system during stimulation. tFUS: transcranial-focused ultrasound.
The L-DLPFC target was defined with MNI coordinates: x = −38, y = 44, z = 26. For neuronavigation targeting, individual T1-weighted structural images were used to build subject-specific realistic skull models. Landmark-based registration (nasion, bilateral preauricular points, and bilateral Lateral Canthus) was performed prior to stimulation. Target registration error (TRE) was measured for every participant, and TRE ranged between 0 and 1.3 mm, well below the range of 1–3 mm [22]. Participants received one 30 min tFUS session per day, 5 days per week for 4 consecutive weeks, for a total of 20 stimulation sessions. During each 30 min tFUS session, an infrared optical tracking system continuously recorded the real-time positions of both the participant’s head and the ultrasound transducer. A trained rehabilitation therapist remained present throughout stimulation to comfort participants and mitigate large-amplitude head movements, a critical quality-control measure for this hyperactive pediatric cohort to sustain stable target engagement.
All acoustic intensity values reported in this manuscript are free-field measurements. Subject-specific skull attenuation modeling was performed to estimate the in situ acoustic pressure at the target. The simulated in situ peak negative pressure (PNP) at the L-DLPFC target was 0.595 MPa at 500 kHz. The mechanical index (MI) was calculated as 0.84, well below the FDA clinical safety threshold of 1.9. The calculated thermal dose was 0.007 CEM43, indicating minimal expected temperature rise during stimulation; acoustic simulation predicted no cavitation or thermal tissue risk.
All participants completed the full 4-week tFUS intervention protocol, yielding a 100% session completion rate. No participants required early termination or missed stimulation sessions. No sedation was administered before or during any tFUS session.
Adverse-event monitoring was conducted throughout the 4-week intervention phase and all F/U time points. During each tFUS session, the therapist continuously observed participants for immediate physical or behavioral reactions. At baseline, post-intervention, and 1-month and 3-month F/U visits, caregivers completed a structured interview querying any adverse symptoms, including scalp discomfort, headache, or other new-onset complaints. All reported events were recorded, graded by severity, and assessed for relatedness to tFUS stimulation. No serious adverse events were observed. No scalp heat or headaches occurred in any participant.
2.4. fNIRS Measurement, Preprocessing, Data Quality Metrics, and Analysis
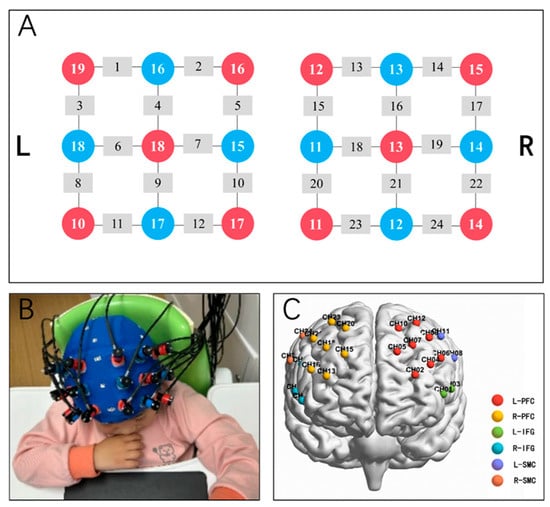
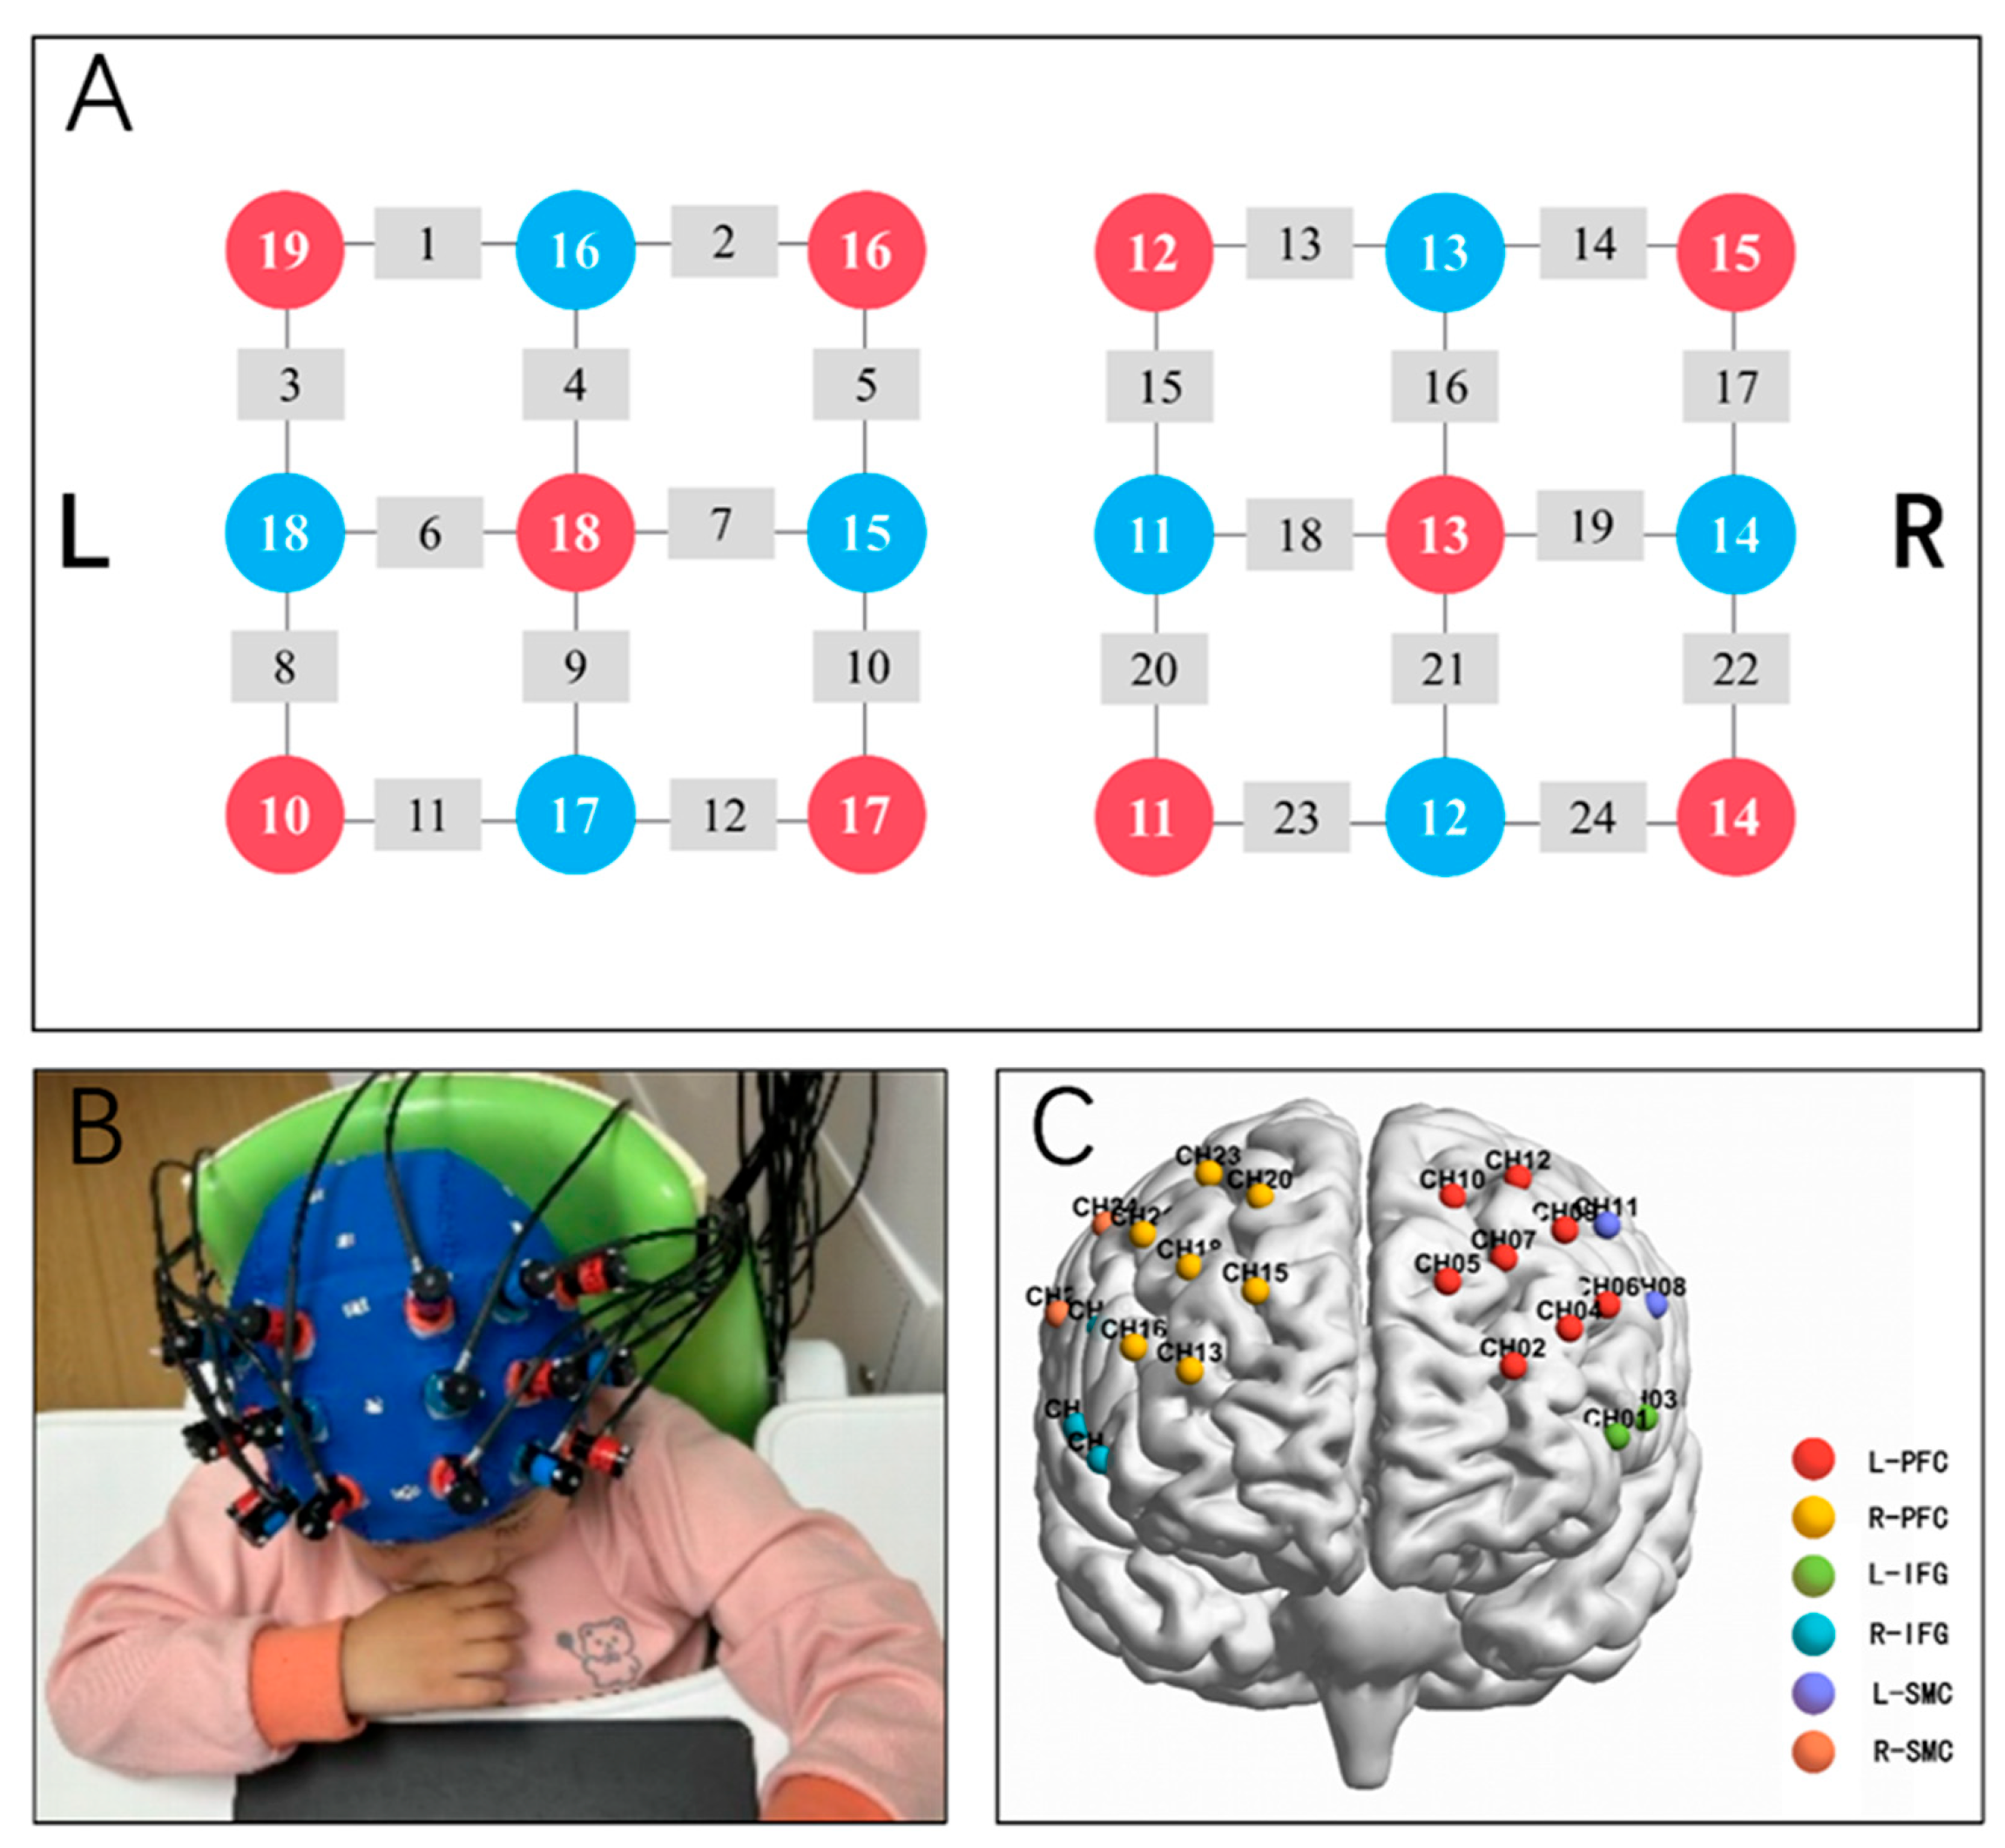
The 24-channel NIRS system (ETG-4100; Hitachi Medical Co., Tokyo, Japan) was used to acquire the changes in the cartoon-viewing resting-like condition brain signals at a sampling rate of 10 Hz. Near-infrared light was emitted at two wavelengths (695 nm and 830 nm), with a 3 cm separation between each paired light source and detector. The configuration of 10 light sources and 8 detectors produced 24 channels (see Figure 4A). A 10 min fNIRS recording was obtained in a dimly lit and quiet room (see Figure 4B). To improve compliance and reduce motion in children with ASD, participants viewed cartoons during acquisition and were not instructed to perform any explicit cognitive task. Accordingly, this condition was regarded as a cartoon-viewing resting-like state rather than a conventional resting state. All participants viewed the same age-appropriate cartoon under identical audiovisual conditions. The fNIRS montage primarily covered the frontal cortex and comprised 24 channels, which were assigned to six predefined regions of interest for subsequent functional connectivity analysis (ROIs; see Figure 4C).
Figure 4.
fNIRS measurement. Note: (A) fNIRS channel locations (10 sources, red, 8 detectors, blue). Sources and detectors were symmetrically positioned across the left and right hemispheres to generate 24 measurement channels, enabling signal acquisition over the frontal lobe (i.e., PFC, IFG, and SMC). (B) Photograph showing fNIRS data collection from a study participant. (C) Spatial distribution of the 24 channels on the cerebral cortex. fNIRS: functional near-infrared spectroscopy, PFC: prefrontal cortex, IFG: inferior frontal gyrus, SMC: somatosensory cortex.
Optode positions were recorded using a 3D digitizer, and channel locations were subsequently registered to the Montreal Neurological Institute (MNI) standard space using NIRS-SPM. Anatomical localization was determined according to the Automated Anatomical Labeling (AAL) atlas, based on the spatial overlap between each channel and the corresponding cortical regions. Because individual channels could overlap with more than one anatomical region, ROI assignment was determined according to the predominant anatomical overlap together with the anatomical consistency of adjacent cortical regions. Channels were then grouped a priori into six regions of interest (ROIs): the left and right prefrontal cortex (PFC), inferior frontal gyrus (IFG), and sensorimotor cortex (SMC). The MNI coordinates, AAL anatomical labels, and ROI assignments for all channels are provided in Supplementary Table S1.
fNIRS data were preprocessed using Homer2. Channels were subjected to quality control based on signal intensity, signal-to-noise ratio, and source–detector separation (0–45 mm), resulting in the exclusion of approximately one channel per participant on average. The remaining signals were converted from raw intensity to optical density, corrected for motion artifacts using spline interpolation, and band-pass filtered at 0.01–0.10 Hz. Optical density signals were subsequently converted to changes in HbO and HbR concentrations using the modified Beer–Lambert law with a partial path-length factor of 5.5. FC analyses were primarily conducted using HbO signals. Pairwise Pearson correlations between channels were calculated and Fisher r-to-z transformed to generate individual FC matrices. Longitudinal network changes were assessed using NBS v1.2 with paired comparisons among pre-tFUS, post-tFUS, and 1-month F/U. Positive and negative contrasts were tested separately. The primary component-forming threshold was set at t = 1.85, with additional sensitivity analyses at t = 2.5, 3.0, and 3.5. Component significance was assessed using 5000 permutations with FWE correction at p < 0.05. HbR-based FC was additionally analyzed as a complementary sensitivity analysis using the same FC construction and NBS procedures. No further seed-based, ROI-level, or aggregated FC analyses were performed for HbR.
For each participant and session, the measurement retention rate was calculated as the number of source–detector–wavelength measurements marked as active in standard deviation (SD). MeasListAct was divided by the total number of recorded measurements. Retention rates were summarized across participants as mean ± SD for each session.
Considering the limited sample size and the neuromodulation target in the L-DLPFC, additional a priori ROI-based analyses were performed, including the L_PFC, right PFC (R_PFC), left inferior frontal gyrus (L_IFG), right inferior frontal gyrus (R_IFG), left sensorimotor cortex (L_SMC), and right sensorimotor cortex (R_SMC). For seed-to-ROI connectivity, the seed was defined as the mean HbO time series within L_PFC, and Pearson correlations (Fisher z-transformed) were computed between this seed and the remaining five ROIs. Fisher z-transformed HbO connectivity matrices were generated for each participant across the three assessment time points. Several predefined aggregated indices were then calculated to summarize the organization of the fNIRS-covered prefrontal network. Global mean connectivity was defined as the mean connectivity across all prefrontal ROI pairs, excluding self-connections. Intra-hemispheric connectivity was calculated separately within the left and right prefrontal regions, reflecting within-hemisphere functional coordination. InterHemi represents non-homotopic interhemispheric prefrontal connectivity. Homotopic connectivity referred to the average connectivity between anatomically corresponding left–right ROI pairs. These indices were used as exploratory summary measures to characterize overall prefrontal network integration, intra-hemispheric coordination, and interhemispheric coupling over time.
2.5. Statistical Analysis
This study used GraphPad Prism software (Version 10.1.2) for statistical analysis. Descriptive statistics reporting central tendency and data dispersion were calculated as the mean and SD. The Shapiro–Wilk test was employed prior to inferential statistics to verify the normality of data distribution. The primary outcome was predefined as the change in the ATEC total score. All other behavioral scale metrics (4 ATEC subscales, RBS-R total score, and 6 RBS-R subscales) were treated as secondary exploratory endpoints. A one-way repeated-measures ANOVA was utilized to evaluate treatment-related changes in social and behavioral outcomes among children with ASD. Mauchly’s test of sphericity was conducted to validate the sphericity assumption. If the test result was significant (p < 0.05), indicating a violation of the sphericity assumption, the Greenhouse–Geisser correction method was used to adjust degrees of freedom; otherwise, uncorrected degrees of freedom were applied. Effect size was estimated using η2, with Cohen’s criteria defining effect sizes as small (0.01), medium (0.06), and large (0.14). Results from the ANOVA were reported with F-statistic, p-value, and effect size η2. When the main effect was found to be significant (p < 0.05), post hoc pairwise comparisons were conducted. To control the family-wise error rate associated with multiple comparisons, all post hoc tests applied the Bonferroni correction method to adjust p-values. Final results were reported as mean difference (MD), t-value, adjusted p-value (adjp), and 95% confidence intervals (95% CIs).
For aggregated network-level FC metrics (GlobalMean, IntraLeft, IntraRight, InterHemi, Homotopic), two-sided paired sample t-tests were used for three pairwise comparisons: post-tFUS vs. pre-tFUS, 1-month F/U vs. pre-tFUS, and 1-month F/U vs. post-tFUS. Mean differences and their 95% confidence intervals (CIs) were calculated for each comparison. Standardized effect sizes were expressed as Hedges’ (g_z), calculated from Cohen’s (d_z) with a small-sample bias correction. The corresponding 95% CIs were estimated by inverting the noncentral t-distribution, consistent with the paired-sample t-test framework. Statistical significance was set at p < 0.05.
The universal statistical significance level for all analyses was set at α < 0.05.
3. Results
3.1. Behavioral Data
We focused on the assessment of clinical outcomes using specific evaluation scales: ATEC and RBS-R. The measurement data underwent a Shapiro–Wilk normality test, and all data met the criteria for normal distribution. The data are presented as mean ± standard deviation. The data in Table 2 show that after completing the tFUS course, in the subscales of ATEC, two out of four subscales (including social interactions, health and behavioral problems) showed significant decreases (p < 0.05); in the subscales of RBS-R, two out of six subscales (including stereotypy behavior and compulsive behavior) showed significant decreases (p < 0.01).
Table 2.
Clinical-scale scores obtained from each evaluation stage (N = 9).
Cross-temporal comparisons between the treatment period and the F/U period are summarized in Table 3. For the primary outcome (ATEC total score), reductions relative to baseline remained statistically significant immediately after tFUS and at 1- and 3-month F/Us (p < 0.01). The RBS-R total score showed no significant change over the study period (p = 0.17). When comparing 1-month F/U with post-tFUS, 3-month F/U with post-tFUS, and 3-month F/U with 1-month F/U, no significant differences were found in either ATEC or RBS-R subscale (all p > 0.05).
Table 3.
Comparison of ATEC and RBS-R results pre- and post-tFUS and 1- and 3-month F/Us.
3.2. Alterations in Brain Network Functional Connectivity
Measurement retention rates (mean ± SD; n = 9) were 0.985 ± 0.024 at pre-tFUS, 0.977 ± 0.030 at post-tFUS, and 0.963 ± 0.048 at 1-month F/U.
Neither HbO- nor HbR-based NBS identified significant network components in any pairwise longitudinal comparison. The results remained non-significant across all tested primary thresholds (t = 1.85, 2.5, 3.0, and 3.5), with no component surviving FWE correction at p < 0.05. Further ROI-level analyses also failed to reveal robust temporal effects: none of the five L_PFC seed-to-ROI functional connectivity measures reached a significant main time effect in repeated-measures ANOVA, and no connection achieved statistical significance after Benjamini–Hochberg false discovery rate (BH-FDR) correction.
In exploratory analyses of aggregated network-level FC metrics, both GlobalMean and InterHemi showed similar temporal patterns, decreasing from pre-tFUS to post- tFUS, and subsequently increasing at the 1-month F/U (see Table 4). GlobalMean showed a trend toward an increase at F/U compared with post-tFUS (Δ = 0.14, p = 0.06, Hedges’ g = 0.73, 95% CI: 0.05 to 1.3). InterHemi also increased from post-tFUS to F/U (Δ = 0.14, uncorrected p = 0.03, Hedges’ g = 0.73) (see Figure 5). Although no significant connectivity changes were identified in the NBS or seed-to-ROI analyses after correction for multiple comparisons, the exploratory aggregated FC findings suggest a possible temporal pattern of changes in prefrontal network connectivity, particularly in interhemispheric connectivity.
Figure 5.
Longitudinal changes in aggregated prefrontal connectivity indices across pre-tFUS, post- tFUS, and 4-week F/U time points. Note: The line graphs show changes in global prefrontal mean connectivity (GlobalMean, left panel) and interhemispheric prefrontal connectivity (InterHemi, right panel) across three time points. The y-axis represents FC values calculated from HbO signals and transformed using the Fisher r-to-z transformation. Light blue lines indicate longitudinal trajectories for individual subjects, dark blue lines represent group averages, and error bars denote standard errors. HbO: oxygenated hemoglobin.
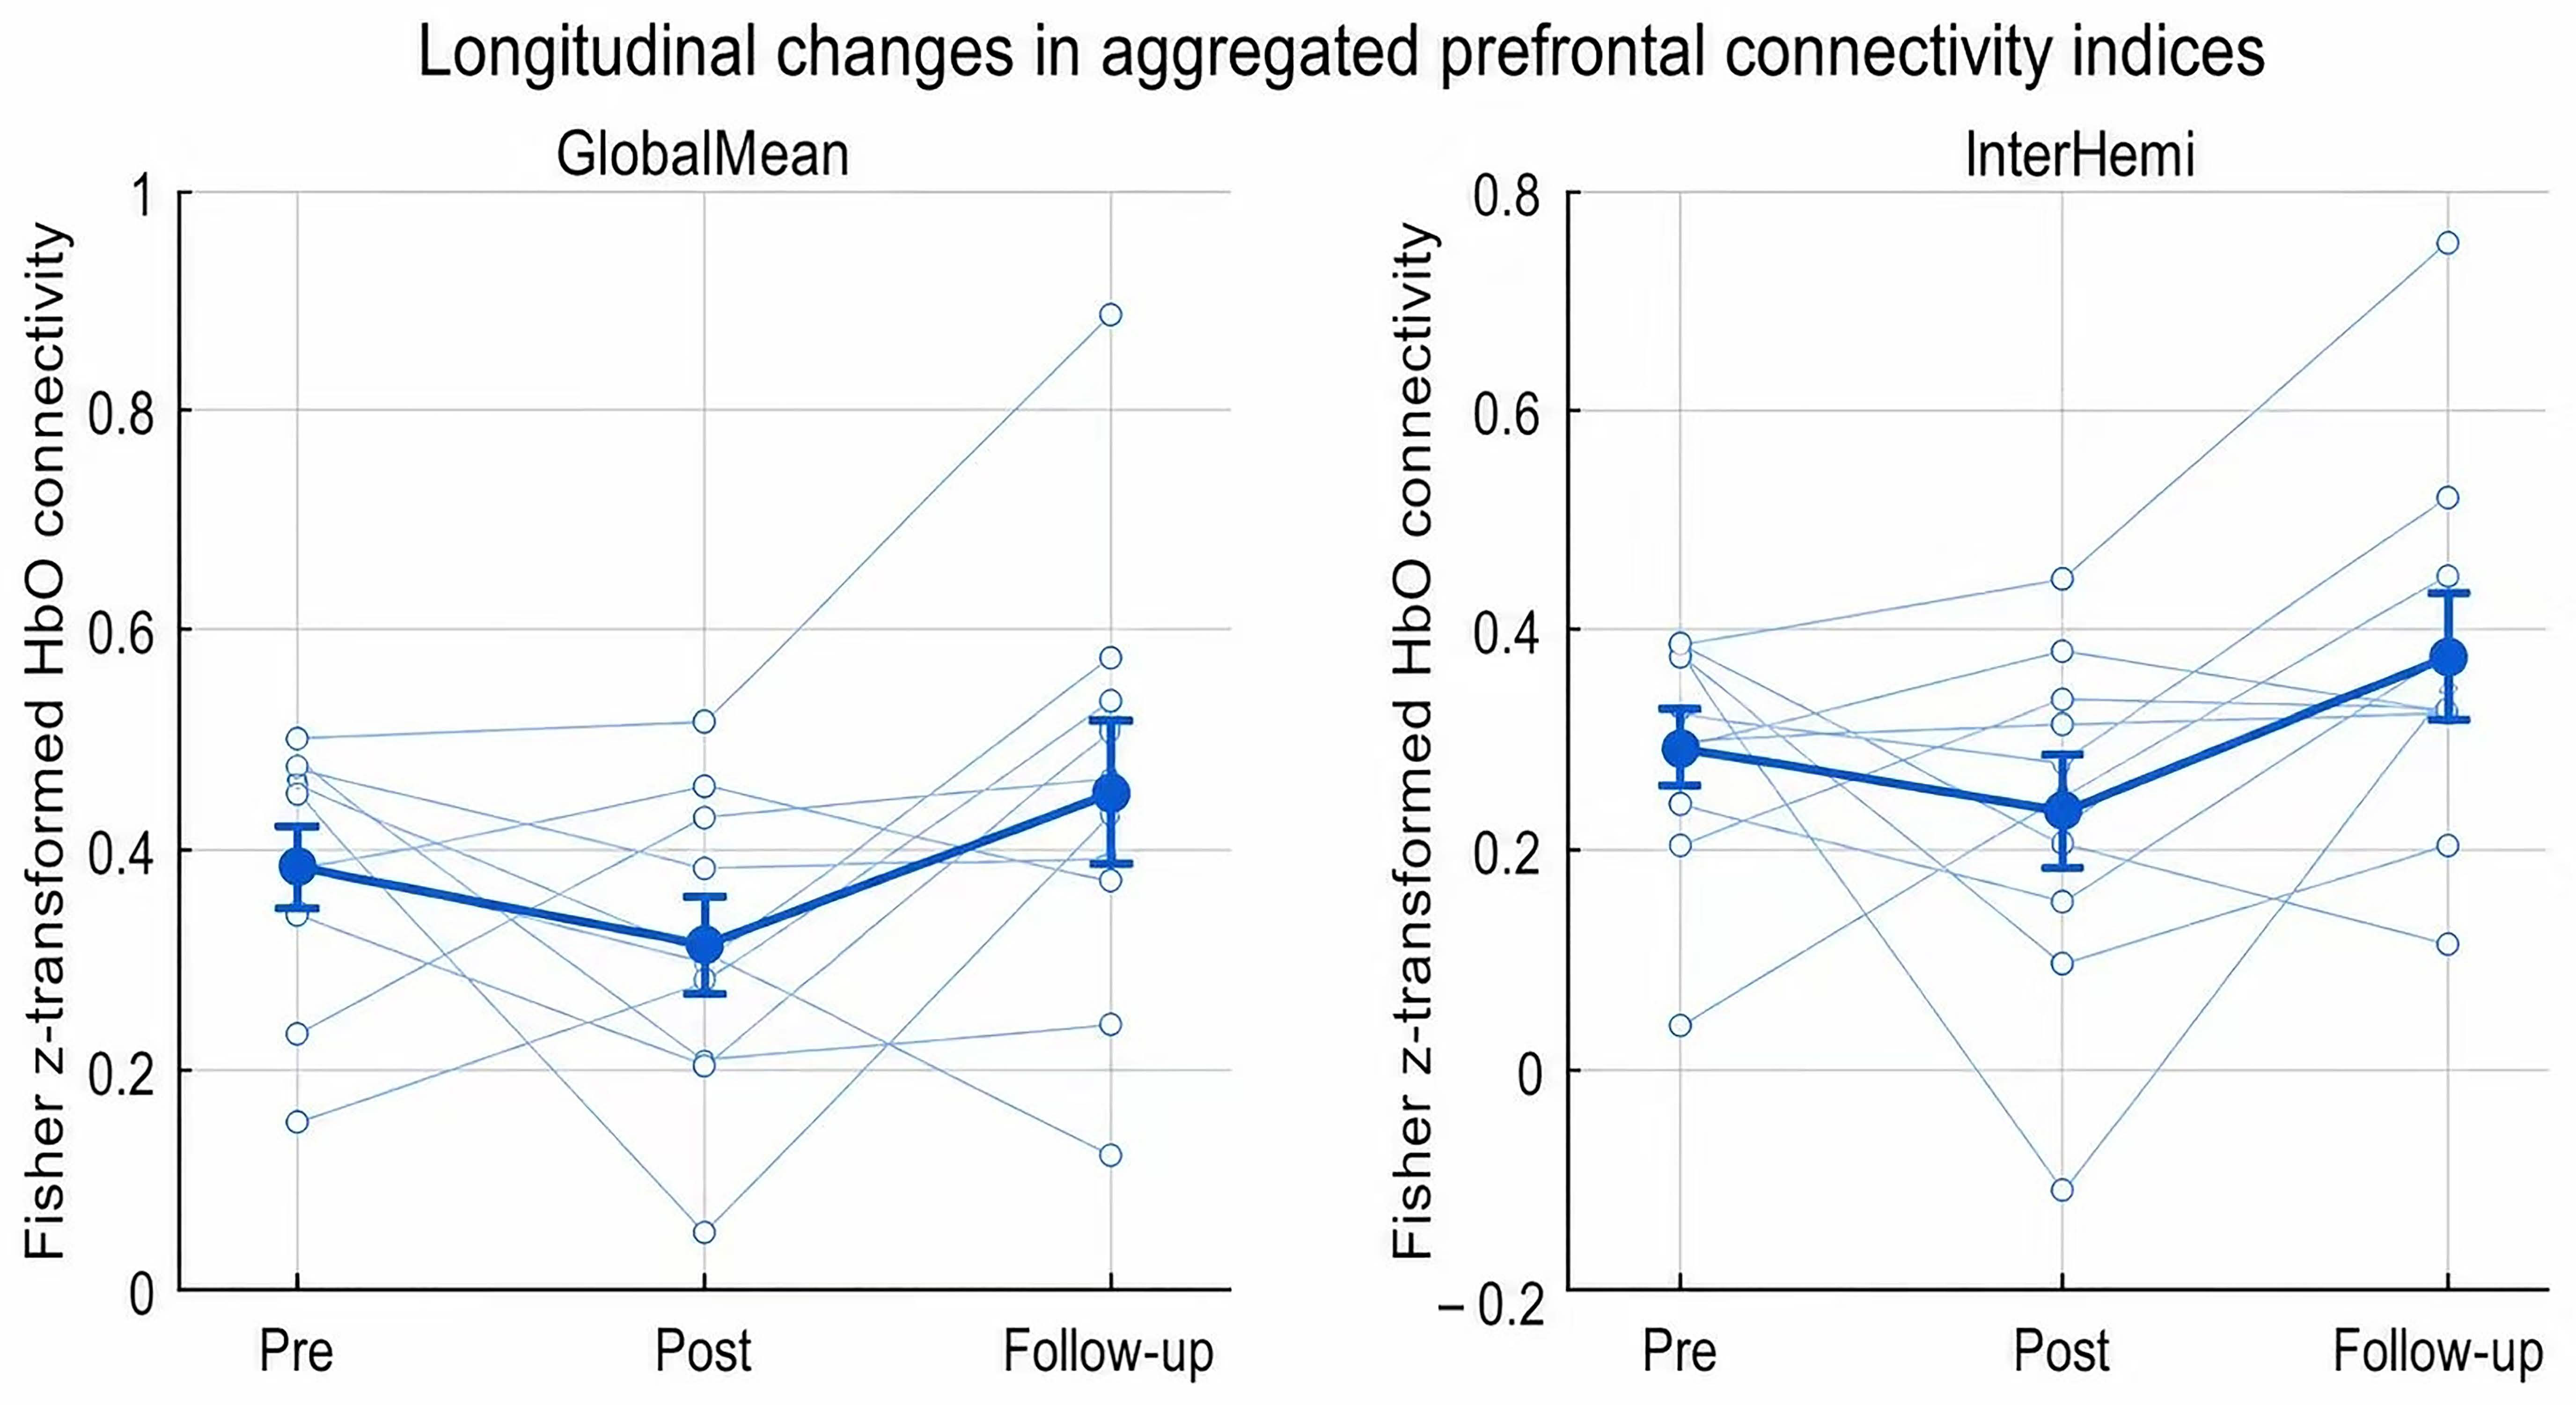
Table 4.
Changes in network connectivity metrics from pre to post-tFUS and 1-month F/U.
4. Discussion
The present single-arm pilot investigated the feasibility and safety of L-DLPFC-targeted tFUS in children with ASD. Numerical shifts in ATEC and RBS-R scores were noted across assessment time points. However, given the uncontrolled open-label design, these within-group trends cannot be attributed to tFUS. NBS and seed-based analyses revealed no statistically significant changes in prefrontal functional connectivity after correction for multiple comparisons.
We observed reductions in total ATEC scores across baseline, post-tFUS, and 1-month and 3-month F/U time points, representing sustained within-group behavioral trends over the study period. For ATEC subdomains, social interaction and health and behavioral problems showed statistically significant within-group score changes. In terms of RRBs evaluated by RBS-R, within-group trends toward reduction in stereotypy behavior and compulsive behavior were observed across assessment time points; this pattern aligns with the core function of the prefrontal network in mediating behavioral inhibition and impulse control [23]. These preliminary observations describe score variation over time in this small sample and cannot be interpreted as evidence that targeted tFUS modulation of the L-DLPFC alters ASD-related behaviors. This work only supports the feasibility of implementing tFUS as a novel non-invasive neuromodulatory strategy for ASD research, which requires further validation in controlled studies. Post hoc pairwise comparisons further confirmed that these behavioral trends persisted throughout the 3-month F/U period without obvious attenuation, showing the trajectory of scale scores over the F/U window in this sample.
Current neuroimaging studies have shown that the activation patterns of the PFC in some patients with ASD are heterogeneous [24]: some patients exhibit insufficient prefrontal function (low activation), which is associated with social aloofness, while a subset of ASD children is manifested as excessive excitation of the L-DLPFC, which has been hypothesized to relate to impulsivity and repetitive behaviors. This neural heterogeneity leads to inconsistent responses to a unified neuromodulation plan, as demonstrated by the research results of Ni et al. (2023). In their double-blind, randomized sham-stimulus-controlled cTBS trial targeting the L-DLPFC, they did not observe significant symptom improvement in the non-stratified mixed ASD population [25]. Their negative results indicate that if stimulation is indiscriminately applied to all ASD participants—including those with low L-DLPFC activation at baseline—consistent behavioral changes cannot be achieved. In contrast, our single-arm pilot study specifically recruited participants with clinical manifestations of ADHD to reduce phenotypic heterogeneity. The targeted tFUS protocol we adopted was selected based on the hypothesized hyperexcitatory pathophysiological mechanism of this subgroup, which provides a plausible speculative explanation for the observed score trends after the intervention. Future randomized trials should stratify ASD patients based on baseline hyperactivity or PFC activation biomarkers to standardize the selection of stimulation protocols and reduce the variability in individual responses.
Prior non-invasive neuromodulation work targeting the L-DLPFC in autistic children and adolescents using tDCS and rTMS has produced mixed clinical outcomes [26,27]. Most tDCS and rTMS trials in this population are small pilot studies with variable stimulation parameters and heterogeneous outcome measures, and findings across trials are inconsistent. A key limitation of both tDCS and rTMS is limited spatial focality, as electromagnetic stimulation spreads widely across the scalp and prefrontal tissue [28,29]. By contrast, tFUS can deliver focal mechanical neuromodulation to defined cortical targets [30]. Published pediatric tFUS safety data remain preliminary and limited to case reports [17,31,32]. In these reports, tFUS was generally well tolerated, and no serious adverse events or evidence of brain tissue injury were reported. Nevertheless, long-term safety data for prefrontal tFUS in autistic children are still lacking.
With regard to FC derived from HbO signals acquired under the cartoon-viewing resting-like condition, NBS analysis detected no significant whole-brain connected component differences across pre-intervention, post-tFUS, and F/U assessments after FWE correction. Similarly, seed-based connectivity analyses using the L-DLPFC as the seed region found no significant main effect of time on seed-to-region of interest (ROI) connectivity, and none of these connectivity metrics survived BH-FDR correction. It should be noted that our aggregated network indices (GlobalMean, IntraLeft, IntraRight, InterHemi, Homotopic) were predefined as a priori exploratory summary metrics before data analysis. Strict multiple-comparison correction for seed–ROI analyses substantially reduces statistical power and may mask coherent global network-level trends. Aggregated summary metrics can therefore serve as hypothesis-generating tools to capture these potential large-scale patterns, although results from these uncorrected indices cannot constitute definitive proof of network-level alterations. The absence of significant internal network connectivity changes may be partially attributed to the small sample size of this pilot study or substantial inter-individual variability among participants. Nevertheless, exploratory quantitative analysis of aggregated network parameters identified a consistent decrease-then-rebound trajectory. Global mean connectivity and interhemispheric (InterHemi) connectivity both declined immediately after tFUS delivery and gradually recovered at the 1-month F/U. Notably, InterHemi connectivity presented a statistically significant increase from post-tFUS to 1-month F/U (Δ = 0.14, uncorrected p = 0.03, Hedges’ g = 0.73). The absence of significant NBS findings was consistent across multiple primary thresholds and in both HbO- and HbR-based connectivity analyses, supporting the robustness of the null whole-network result. However, subtle connectivity changes cannot be excluded given the small sample size and the lack of short-separation measurements.
From post-tFUS to the 1-month F/U period, ATEC and RBS-R scale scores showed continuous longitudinal change within this sample. Interestingly, this sustained behavioral score trajectory was not consistent with the dynamic trajectory of the prefrontal FC reflected by the fNIRS aggregated network indicators. GlobalMean and InterHemi connectivity exhibited a descriptive biphasic pattern: an immediate decline following tFUS stimulation, followed by a rebound at the 1-month F/U. We propose this as a speculative working hypothesis: tFUS targeting the L-DLPFC may exert short-term down-modulatory effects that transiently reduce abnormal over-recruitment or inefficient connectivity states, which could then be followed by prefrontal network reintegration during the 1-month F/U phase. Under this hypothetical framework, shifts in behavioral scale scores would not necessarily depend on immediate connectivity enhancement but could follow a sequence of “short-term modulation–delayed network reorganization–sustained behavioral improvement”. Importantly, this proposed mechanistic sequence is derived solely from exploratory uncorrected aggregated network metrics; our primary corrected NBS and seed-to-ROI connectivity analyses revealed no statistically significant longitudinal network alterations. Therefore, this biphasic model remains unproven and requires formal testing in larger cohorts.
We acknowledge that this mechanistic account remains highly speculative. fNIRS detects oxygenated-hemoglobin-related hemodynamic changes rather than direct neuronal firing; transient cerebrovascular adjustments triggered by ultrasound exposure might contribute to connectivity fluctuations independent of genuine neural network plasticity. Multimodal studies integrating electrophysiological recordings alongside fNIRS in larger cohorts will be required to disambiguate vascular versus neuronal contributions to these longitudinal connectivity changes.
Beyond neuromodulation research, the pursuit of precise, individualized therapeutic strategies represents a shared priority across contemporary biomedical disciplines. Although transcranial-focused ultrasound neuromodulation and precision genome engineering operate at fundamentally different biological levels, they face overlapping translational requirements, including strict target specificity, appropriate participant stratification, reliable delivery performance, mitigation of unintended off-target effects, and thorough safety evaluation prior to clinical deployment. Recognizing these cross-domain parallels helps contextualize the importance of our rigorous neuronavigation targeting, phenotype-based participant selection, and systematic adverse-event monitoring for advancing pediatric neuromodulation therapeutics [33].
All exploratory analyses aim to reveal potential trends and individual differences. These results should be interpreted as hypothesis-generating rather than confirmatory.
5. Limitations
This pilot study has several limitations. First, the single-arm design without a sham control group cannot exclude placebo effects and natural developmental changes among children with ASD over time. Second, the relatively small sample size (n = 9) limits statistical power to detect subtle neural changes and reduces the generalizability of findings. Third, we only assessed fNIRS signals at baseline, post-tFUS, and the 1-month F/U, and lacked long-term neuroimaging monitoring at the 3-month F/U, making it impossible to track the persistent changes in local brain activity and network connectivity alongside long-term behavioral effects. Fourth, all behavioral outcomes in this study were measured using caregiver-reported scales (ATEC and RBS-R). As this was an open-label, single-arm pilot intervention without blinded raters, the behavioral improvements may be influenced by parental expectation bias and subjective reporting tendencies, which limits the objectivity of behavioral outcome evaluation. Fifth, the putative neuromodulatory direction of prefrontal tFUS was primarily extrapolated from previous tFUS findings obtained in the primary motor cortex (M1). Therefore, the mechanistic explanations for the observed prefrontal network trajectory in this pilot study should be interpreted as speculative rather than definitive. Sixth, our primary NBS and seed-to-ROI connectivity analyses returned null findings after correction. Only one nominally significant pairwise comparison was observed: increased interhemispheric connectivity at 1-month F/U relative to post-tFUS. This result remains uncorrected across 15 connectivity tests, and the pre-to-post change in interhemispheric connectivity was non-significant. In addition, the hypothesized association between functional connectivity changes and behavioral improvements was not formally tested in this pilot study, so we cannot confirm a direct brain–behavior relationship within the current sample. Seventh, we cannot fully rule out the possibility that ongoing concurrent therapies contributed to the observed behavioral improvements. Eighth, between-session differences in motion contamination remain a potential confound in the longitudinal FC comparisons. Although spline-based motion correction was applied, residual motion effects and their variation across sessions were not independently quantified. The longitudinal FC findings should therefore be interpreted cautiously in light of potential residual motion-related confounding. Ninth, fNIRS data were collected under a cartoon-viewing resting-like paradigm instead of a conventional resting-state protocol. Passive audiovisual input from the cartoons may modulate prefrontal hemodynamic signals and FC estimates, which should be considered when interpreting the neuroimaging results.
Future controlled trials should incorporate standardized clinician-administered behavioral assessments and adopt independent blinded evaluators to eliminate subjective response bias and obtain more rigorous and verifiable clinical outcomes.
6. Conclusions
In conclusion, this pilot study supports the feasibility and safety profile of a 4-week tFUS protocol targeting the L-DLPFC in children with ASD. Descriptive within-sample behavioral score trends were observed across the 3-month F/U window. Exploratory fNIRS data revealed a biphasic connectivity pattern: reduction immediately after stimulation followed by recovery at F/U. We propose a working hypothesis that tFUS targeting the L-DLPFC may transiently modulate abnormal or inefficient prefrontal connectivity states, which could be followed by delayed prefrontal network reorganization; this hypothetical framework may offer one potential explanation for the observed longitudinal behavioral score trends within this sample. Collectively, these fNIRS and behavioral observations generate mechanistic hypotheses for future tFUS research in ASD. This work supports further investigation of tFUS as a research tool for studying prefrontal neuromodulation in ASD. Larger randomized sham-controlled trials incorporating multimodal neuroimaging and extended longitudinal monitoring are required to validate these observations and systematically explore underlying neural mechanisms.
Supplementary Materials
The following supporting information can be downloaded at: https://www.mdpi.com/article/10.3390/life16111782/s1, Supplementary Table S1. Anatomical localization and ROI assignment of the fNIRS channels; Supplementary Table S2. Individual participant ATEC and RBS-R raw scores at pre-tFUS, post-tFUS, 1-month follow-up and 3-month follow-up.
Author Contributions
Conceptualization, C.Y. and L.A.; methodology, C.Y.; software, S.L. and Y.Z.; validation, C.Y.; resources, L.A. and B.Z.; data curation, S.L., G.Z., Y.Z., W.C., Q.X., Z.W. (Zhiyuan Wu), Z.W. (Zheng Wang), T.J. and X.S.; formal analysis, C.Y., S.L. and Y.Z.; investigation, C.Y.; writing—original draft preparation, C.Y., S.L. and Y.Z.; writing—review and editing, C.Y. and W.C.; visualization, S.L. and Y.Z.; supervision, Z.B. and L.A.; funding acquisition, L.A., B.Z. and C.Y. All authors have read and agreed to the published version of the manuscript.
Funding
This research was funded by the National Key Clinical Specialty Discipline Construction Project of China, grant number Z155080000004; the Shanghai Research Center of Rehabilitation Medicine (Top Priority Research Center of Shanghai), grant number 2023ZZ02027; the Shanghai Municipal Health and Wellness Commission Health Industry Clinical Research Specialization, grant number 202340119; the China Disabled Persons’ Federation, grant number 2024CDPFHS-16 and the Songjiang District Science and Technology Key Project (Medical and Health Category) Shanghai, grant number 2024SJKJGG120.
Institutional Review Board Statement
The study was conducted following the Declaration of Helsinki and approved by the Medical Ethics Committee of Shanghai Yangzhi Rehabilitation Hospital (Shanghai Sunshine Rehabilitation Center) under approval number [2024] 032.
Informed Consent Statement
Informed consent for publication and participation was obtained from all parents/guardians of the participants of the subjects involved in the study.
Data Availability Statement
The datasets used and/or analyzed during the current study are available from Beihua Zhang upon reasonable request.
Conflicts of Interest
The authors declare no conflicts of interest.
Abbreviations
The following abbreviations are used in this manuscript:
| ADHD | Attention-Deficit/Hyperactivity Disorder |
| ANOVA | Analysis of variance |
| ASD | Autism Spectrum Disorder |
| ATEC | Autism Treatment Evaluation Checklist |
| ChiCTR | Chinese Clinical Trial Registry |
| CI | Confidence interval |
| DSM-5 | Diagnostic and Statistical Manual of Mental Disorders, Fifth Edition |
| FC | Functional connectivity |
| FDR | False discovery rate |
| F/U | Follow-up |
| FWE | Family-wise error |
| HbO | Oxygenated hemoglobin |
| L-DLPFC | Left dorsolateral prefrontal cortex |
| L_IFG | Left inferior frontal gyrus |
| L_PFC | Left prefrontal cortex |
| L_SMC | Left sensorimotor cortex |
| MD | Mean difference |
| NBS | Network-Based Statistic |
| NIBS | Non-invasive brain stimulation |
| RBS-R | Repetitive Behavior Scale-Revised |
| R_IFG | Right inferior frontal gyrus |
| R_PFC | Right prefrontal cortex |
| R_SMC | Right sensorimotor cortex |
| ROI | Region of interest |
| SRS-2 | Social Responsiveness Scale, Second Edition |
| fNIRS | Functional near-infrared spectroscopy |
| tFUS | Transcranial-focused ultrasound |
References
- Zhuang, H.; Liang, Z.; Ma, G.; Qureshi, A.; Ran, X.; Feng, C.; Liu, X.; Yan, X.; Shen, L. Autism Spectrum Disorder: Pathogenesis, Biomarker, and Intervention Therapy. MedComm 2024, 5, e497. [Google Scholar] [CrossRef] [Scilit]
- Salari, N.; Rasoulpoor, S.; Rasoulpoor, S.; Shohaimi, S.; Jafarpour, S.; Abdoli, N.; Khaledi-Paveh, B.; Mohammadi, M. The Global Prevalence of Autism Spectrum Disorder: A Comprehensive Systematic Review and Meta-Analysis. Ital. J. Pediatr. 2022, 48, 112. [Google Scholar] [CrossRef] [Scilit]
- Shaw, K.A.; Williams, S.; Patrick, M.E.; Valencia-Prado, M.; Durkin, M.S.; Howerton, E.M.; Ladd-Acosta, C.M.; Pas, E.T.; Bakian, A.V.; Bartholomew, P.; et al. Prevalence and Early Identification of Autism Spectrum Disorder Among Children Aged 4 and 8 Years—Autism and Developmental Disabilities Monitoring Network, 16 Sites, United States, 2022. MMWR Surveill. Summ. 2025, 74, 1–22. [Google Scholar] [CrossRef] [Scilit]
- Lord, C.; Elsabbagh, M.; Baird, G.; Veenstra-Vanderweele, J. Autism Spectrum Disorder. Lancet 2018, 392, 508–520. [Google Scholar] [CrossRef] [Scilit]
- Sandbank, M.; Bottema-Beutel, K.; Crowley, S.; Cassidy, M.; Dunham, K.; Feldman, J.I.; Crank, J.; Albarran, S.A.; Raj, S.; Mahbub, P.; et al. Project AIM: Autism Intervention Meta-Analysis for Studies of Young Children. Psychol. Bull. 2020, 146, 1–29. [Google Scholar] [CrossRef] [Scilit]
- Hull, J.V.; Dokovna, L.B.; Jacokes, Z.J.; Torgerson, C.M.; Irimia, A.; Van Horn, J.D. Resting-State Functional Connectivity in Autism Spectrum Disorders: A Review. Front. Psychiatry 2017, 7, 205. [Google Scholar] [CrossRef] [Scilit]
- Alvarez, J.A.; Emory, E. Executive Function and the Frontal Lobes: A Meta-Analytic Review. Neuropsychol. Rev. 2006, 16, 17–42. [Google Scholar] [CrossRef] [Scilit]
- Zhang, F.; Roeyers, H. Exploring Brain Functions in Autism Spectrum Disorder: A Systematic Review on Functional near-Infrared Spectroscopy (fNIRS) Studies. Int. J. Psychophysiol. 2019, 137, 41–53. [Google Scholar] [CrossRef] [Scilit]
- Liu, T.; Liu, X.; Yi, L.; Zhu, C.; Markey, P.S.; Pelowski, M. Assessing Autism at Its Social and Developmental Roots: A Review of Autism Spectrum Disorder Studies Using Functional near-Infrared Spectroscopy. NeuroImage 2019, 185, 955–967. [Google Scholar] [CrossRef] [Scilit]
- Zhu, H.; Fan, Y.; Guo, H.; Huang, D.; He, S. Reduced Interhemispheric Functional Connectivity of Children with Autism Spectrum Disorder: Evidence from Functional near Infrared Spectroscopy Studies. Biomed. Opt. Express 2014, 5, 1262. [Google Scholar] [CrossRef] [Scilit]
- Krishnamurthy, K.; Yeung, M.K.; Chan, A.S.; Han, Y.M.Y. Effortful Control and Prefrontal Cortex Functioning in Children with Autism Spectrum Disorder: An fNIRS Study. Brain Sci. 2020, 10, 880. [Google Scholar] [CrossRef] [Scilit]
- Han, Y.M.Y.; Chan, M.-C.; Chan, M.M.Y.; Yeung, M.K.; Chan, A.S. Effects of Working Memory Load on Frontal Connectivity in Children with Autism Spectrum Disorder: A fNIRS Study. Sci. Rep. 2022, 12, 1522. [Google Scholar] [CrossRef] [Scilit]
- Philip, R.C.M.; Dauvermann, M.R.; Whalley, H.C.; Baynham, K.; Lawrie, S.M.; Stanfield, A.C. A Systematic Review and Meta-Analysis of the fMRI Investigation of Autism Spectrum Disorders. Neurosci. Biobehav. Rev. 2012, 36, 901–942. [Google Scholar] [CrossRef] [Scilit]
- Keihani, A.; Sanguineti, C.; Chaichian, O.; Huston, C.A.; Moore, C.; Cheng, C.; Janssen, S.A.; Donati, F.L.; Mayeli, A.; Moussawi, K.; et al. Transcranial Focused Ultrasound Neuromodulation in Psychiatry: Main Characteristics, Current Evidence, and Future Directions. Brain Sci. 2024, 14, 1095. [Google Scholar] [CrossRef] [Scilit]
- Wang, Y.; Bai, Y.; Xiao, X.; Wang, L.; Wei, G.; Guo, M.; Song, X.; Tian, Y.; Ming, D.; Yang, J.; et al. Low-Intensity Focused Ultrasound Stimulation Reverses Social Avoidance Behavior in Mice Experiencing Social Defeat Stress. Cereb. Cortex 2022, 32, 5580–5596. [Google Scholar] [CrossRef] [Scilit]
- Zhong, Y.-X.; Liao, J.-C.; Liu, X.; Tian, H.; Deng, L.-R.; Long, L. Low Intensity Focused Ultrasound: A New Prospect for the Treatment of Parkinson’s Disease. Ann. Med. 2023, 55, 2251145. [Google Scholar] [CrossRef] [Scilit]
- Cheng, S.; Xu, X.; Yan, C.S.; Mao, M.C.; Luo, K.X.; Zhang, X.F.; Liang, Q.H.; Long, X.J.; Ao, L.J.; Chen, M.X. Case Report: Low-Intensity Transcranial Focused Ultrasound Stimulation Improves Social Interaction and Stereotyped Behavior in a Boy with Autism Spectrum Disorder. Front. Psychiatry 2025, 16, 1606300. [Google Scholar] [CrossRef] [Scilit]
- Huang, L.; Huang, R.; Sui, G.; Du, W.; Zhou, L.; Luo, Q.; Ren, T.; Li, F. Demographic, Genetic, Neuroimaging, and Behavioral Correlates of Short Social Responsiveness Scale in a Large Pediatric Cohort. Transl. Psychiatry 2025, 15, 396. [Google Scholar] [CrossRef] [Scilit]
- Bölte, S.; Poustka, F.; Constantino, J.N. Assessing Autistic Traits: Cross-cultural Validation of the Social Responsiveness Scale (SRS). Autism Res. 2008, 1, 354–363. [Google Scholar] [CrossRef] [Scilit]
- Hou, L.; Lei, Y. Spinal Cord Ultrasound Stimulation Modulates Corticospinal Excitability in Humans. Brain Stimul. 2025, 18, 1116–1130. [Google Scholar] [CrossRef] [Scilit]
- Xia, X.; Fomenko, A.; Nankoo, J.-F.; Zeng, K.; Wang, Y.; Zhang, J.; Lozano, A.M.; Chen, R. Time Course of the Effects of Low-Intensity Transcranial Ultrasound on the Excitability of Ipsilateral and Contralateral Human Primary Motor Cortex. NeuroImage 2021, 243, 118557. [Google Scholar] [CrossRef] [Scilit]
- Phipps, M.A.; Manuel, T.J.; Sigona, M.K.; Luo, H.; Yang, P.F.; Newton, A.; Chen, L.M.; Grissom, W.; Caskey, C.F. Practical Targeting Errors During Optically Tracked Transcranial Focused Ultrasound Using MR-ARFI and Array-Based Steering. IEEE Trans. Biomed. Eng. 2024, 71, 2740–2748. [Google Scholar] [CrossRef] [Scilit]
- Li, B.; Nguyen, T.P.; Ma, C.; Dan, Y. Inhibition of Impulsive Action by Projection-Defined Prefrontal Pyramidal Neurons. Proc. Natl. Acad. Sci. USA 2020, 117, 17278–17287. [Google Scholar] [CrossRef] [Scilit]
- Rajabi, P.; Noori, A.S.; Sargolzaei, J. Autism Spectrum Disorder and Various Mechanisms behind It. Pharmacol. Biochem. Behav. 2024, 245, 173887. [Google Scholar] [CrossRef] [Scilit]
- Ni, H.; Chen, Y.; Chao, Y.; Wu, C.; Chen, R.; Chou, T.; Gau, S.S.; Lin, H. A Lack of Efficacy of Continuous Theta Burst Stimulation over the Left Dorsolateral Prefrontal Cortex in Autism: A Double Blind Randomized Sham-controlled Trial. Autism Res. 2023, 16, 1247–1262. [Google Scholar] [CrossRef] [Scilit]
- Qiu, J.; Kong, X.; Li, J.; Yang, J.; Huang, Y.; Huang, M.; Sun, B.; Su, J.; Chen, H.; Wan, G.; et al. Transcranial Direct Current Stimulation (tDCS) over the Left Dorsal Lateral Prefrontal Cortex in Children with Autism Spectrum Disorder (ASD). Neural Plast. 2021, 2021, 6627507. [Google Scholar] [CrossRef] [Scilit]
- Rehman, A.; Siddiqui, M.T.; Jamal, M. Transcranial magnetic stimulation in autism spectrum disorder: A narrative review of neurobiological mechanisms, clinical efficacy, and future directions. Egypt. J. Neurosurg. 2026, 41, 163. [Google Scholar] [CrossRef] [Scilit]
- Lin, Z.; Cheng, J.; Tan, C.; Liu, Z.; Han, D. Clinical development and guiding theory of transcranial magnetic stimulation: A literature review. Ann. Med. 2025, 57, 2581921. [Google Scholar] [CrossRef] [Scilit]
- Meinzer, M.; Shahbabaie, A.; Antonenko, D. Investigating the neural mechanisms of transcranial direct current stimulation effects on human cognition: Current issues and potential solutions. Front. Neurosci. 2024, 18, 1389651. [Google Scholar] [CrossRef] [Scilit]
- Shi, C.; Zhao, Q.; Zhang, G.; Wang, Z.; Zhou, J.; Chang, X.; Liao, Z.; Zhang, W.; Li, H.; Xue, H.; et al. Transcranial focused ultrasound stimulation in schizophrenia: Current evidence, mechanisms, and future directions. Front. Psychiatry 2026, 17, 1859036. [Google Scholar] [CrossRef] [Scilit]
- Yan, C.; Zhu, G.; Liang, S.; Zhao, Y.; Chen, W.; Xia, Q.; Jian, J.; Wang, Z.; Zhang, B.; Ao, L. Feasibility and Safety of Transcranial Focused Ultrasound on Language Impairment in a Patient with Autism Spectrum Disorder: A Case Report. Int. Med. Case Rep. J. 2026, 19, 653087. [Google Scholar] [CrossRef] [Scilit]
- Zhang, X.; Zhu, G.L.; Wang, Z.; Gao, D.; Sun, X.H.; Ao, L.J. Low-intensity focused ultrasound for a child with chronic disorders of consciousness: A promising case report. Brain Inj. 2026, 40, 821–824. [Google Scholar] [CrossRef] [Scilit]
- Huang, K.; Tian, J.; Zhao, W.; Zhang, S.; Xiang, L.; Yang, M.; Liu, L.; Huang, Y.; Zhang, N.; Sun, L.; et al. Strategies and mechanisms of precision genome engineering: From gene editing to genome writing. iMetaOmics 2026, 3, e70115. [Google Scholar] [CrossRef] [Scilit]

Disclaimer/Publisher’s Note: The statements, opinions and data contained in all publications are solely those of the individual author(s) and contributor(s) and not of MDPI and/or the editor(s). MDPI and/or the editor(s) disclaim responsibility for any injury to people or property resulting from any ideas, methods, instructions or products referred to in the content. |
© 2026 by the authors. Licensee MDPI, Basel, Switzerland. This article is an open access article distributed under the terms and conditions of the Creative Commons Attribution (CC BY) license.