


Abstract
Pavement cracks pose significant challenges to the driving stability and operational safety of automated guided vehicles (AGV) in industrial and logistics environments. The complex geometry of cracks and their nonlinear coupling with vehicle dynamics make conventional rule-based or single-modal approaches insufficient for reliable engineering decision-making. To address this issue, this study proposes an artificial intelligence–driven multi-modal perception and engineering analysis framework for AGV speed optimization under representative operating conditions. From the artificial intelligence perspective, an improved lightweight instance segmentation model based on YOLO11 is developed by integrating a dynamic upsampling strategy, a hybrid multi-scale feature representation module, and a large-kernel attention mechanism, enabling robust and fine-grained crack extraction in complex pavement scenes. In addition, a multi-modal learning strategy is adopted to fuse two-dimensional visual features with three-dimensional point cloud-derived geometric parameters, allowing accurate quantification of crack width, depth, and surface damage. From the engineering analysis perspective, the relationship between AI-extracted crack geometric characteristics and AGV dynamic responses is established to investigate the influence of pavement defects on vehicle vibration behavior. A triaxial vibration acquisition system is constructed under controlled experimental conditions, and the relationship between crack severity, vibration characteristics, and driving speed is quantitatively analyzed. Based on vibration constraints, a hierarchical speed optimization strategy is formulated for different crack levels. Experimental results demonstrate that the proposed method achieves accurate crack perception and effective geometric feature characterization, providing a quantitative basis for AGV speed adjustment under different pavement conditions.
1. Introduction
Pavement cracks [1,2,3] are common forms of infrastructure diseases in industrial parks, logistics warehousing and intelligent manufacturing scenarios. Their geometric shape and distribution state directly affect the driving stability and operation safety of automated guided vehicles (AGVs). When AGV passes through a cracked road surface, the geometric mutation of the road surface will cause wheel–ground impact and vibration response, accelerate the damage of key components, and even lead to safety risks such as operation deviation. Therefore, for AGV operation scenarios, how to accurately obtain the geometric structure information of cracks and effectively map it to vehicle dynamic response and operation decision-making has become a key engineering problem that needs to be solved in the field of intelligent inspection and autonomous navigation.
In recent years, deep learning has made significant progress in the field of crack detection and image segmentation [4,5], promoting improvements in crack recognition accuracy and automation levels. Guo et al. [6] proposed a new two-stage framework for pixel-level automatic pavement detection, which paved the way for the large-scale application of efficient automatic pavement crack detection. Zhang et al. [7] designed a rapid detection method for pavement cracks based on machine learning and image processing and analyzed the effect of multi-layer perceptron and convolutional neural network in asphalt pavement state recognition. Fu et al. [8] trained a self-built dataset based on Faster R-CNN to achieve road crack object detection and automatic recognition. Guo et al. [9] proposed a novel Crack Transformer model to improve crack detection performance under noisy conditions. Fan et al. [10] developed a two-stage crack detection method for shadow removal and a data augmentation strategy based on brightness differences and introduced a residual feature enhancement algorithm to detect small cracks. Zhai et al. [11] proposed a single-stage MFFNet method, which takes the detected bounding box coordinates as the multi-modal features of the same pavement crack area and proves its effectiveness. In order to achieve efficient and accurate pavement crack detection, Yu et al. [12] improved a lightweight semantic segmentation model based on BiSeNetv2, incorporating the detail branch, semantic branch, and guided aggregation module for automatic road crack detection. Using classification and segmentation tasks, Al-Huda et al. [13] proposed the KTCAM-Net method, which integrates crack location maps and image features, develops a hybrid loss function optimization network, and shows the segmentation effect through experimental comparison. Jiang et al. [14] proposed the GSkYOLOv5 method for accurate crack detection in infrared images of asphalt pavement. Yang et al. [15] proposed a new global–local fusion network based on edge enhancement and Transformer for pavement crack defect segmentation. Sun et al. [3] used and enhanced DeepLabv3+ for road pavement crack detection. Experiments show that attention mask can effectively help the model to better combine multi-scale features and generate more accurate pavement crack segmentation results. Ma et al. [16] proposed an automatic intelligent road crack detection and tracking system consisting of a pavement crack generative adversarial network (PCGAN), YOLO-MF, and a tracking network. Dong et al. [17] developed two methods for direct extraction and detection of cracks. The improved sliding window algorithm can efficiently extract pavement cracks, and the method based on YOLOv5 has a better detection effect on pavement cracks. Sabouri et al. [18] developed a pavement scoring system to detect the presence and severity of longitudinal and transverse cracks in asphalt pavements through digital images. Zhang et al. [19] extracted encoded features from crack images using an autoencoder to establish the correlation between cracks and structural conditions. Fu et al. [20] utilized FWD data from semi-rigid pavements to rapidly and nondestructively distinguish cracking in AC and AC+CTB structures. Liu et al. [21] proposed a deep domain adaptation-based crack detection network (DDACDN), which leverages source-domain knowledge to predict the locations of multi-class cracks in the target domain. Wen et al. [22] proposed a multi-scale context feature and cross-attention based on convolutional neural network for accurate and robust pavement crack segmentation. Liu et al. [23] proposed a YOLOv3 model with four-scale detection layer (FDL), which uses multi-scale fusion structure, efficient intersection-over-union (EIoU) loss function, K-means++ clustering and hyper-parameter optimization to further improve the detection performance. Wu et al. [24] proposed a lightweight MobileNetV2_DeepLabV3 image segmentation network, modified the gap space pyramid pooling (ASPP) module parameters in the DeepLabV3+ network structure, and used a multi-feature fusion structure to replace the parallel structure, so that the network can obtain richer crack features. Chu et al. [25] proposed a multi-scale feature fusion network with attention mechanism, named TCN, and the ability of the network to segment tiny cracks was significantly enhanced. Tran et al. [26] proposed a novel process-based deep learning method, integrating YOLOv7 and U-Net for bridge deck crack detection and segmentation. Kang, DH et al. [27] proposed an automatic crack detection, localization and quantification method, which uses a faster integrated region proposal convolutional neural network (Faster R-CNN) algorithm to detect crack regions. Qiu et al. [28] proposed the integration of YOLO into Unmanned Aerial Vehicles (UAV) to achieve real-time crack detection of paved pavements. It shows excellent adaptability to environmental conditions such as shadows, rainwater, and motion-induced blur. Ye et al. [29] investigated a pixel-level crack segmentation and quantification method for nighttime slab tracks. They proposed a segmentation network that aggregates multi-scale information to extract crack morphology, and then calculated crack width using another quantification method.
From the perspective of engineering informatics, pavement cracks are not a single visual target, but a kind of complex structural information with large scale span, irregular shape, boundary weakening and significant spatial sparsity. The geometric properties of the crack, such as width, depth, extension direction and volume, jointly determine its influence on the wheel–ground contact conditions and vehicle vibration characteristics. However, in practical engineering applications, these geometric features often exhibit unstructured and multi-source heterogeneous characteristics, making them difficult to directly apply to vehicle dynamics analysis and operational control decisions. Consequently, a significant information gap exists between “damage perception—information representation—dynamic response—decision optimization.” With the development of 3D imaging technology, road detection based on 3D point cloud information also shows broad prospects. Hu et al. [30] proposed a structural automatic 3D crack detection system based on high-precision light detection and ranging (LiDAR) and camera fusion. Fei et al. [31] proposed an efficient deep network called CrackNet-V for automatic pixel-level crack detection of 3D asphalt pavement images. Zhang et al. [32,33] proposed an efficient CNN-based structure, CrackNet, and a recurrent neural network (RNN)-based model, CrackNet-R, for fully automated pixel-level crack detection of three-dimensional (3D) asphalt pavements.
Pan et al. [34] proposed a single-stage pavement crack detection and quantification method, which directly extracted the crack geometry from the three-dimensional pavement profile. Based on the generated three-dimensional profile, an integrated crack detection and quantification algorithm was developed to simultaneously obtain the crack map, length, width and depth. Dong et al. [35] proposed a three-dimensional point cloud enhancement and segmentation system for pavement potholes. It has been verified that the proposed segmentation network can accurately and efficiently identify and segment the three-dimensional point cloud data of potholes. Ali et al. [36] combined computer vision algorithms and augmented reality (AR) to locate fatigue cracks in visual inspections, which were verified by two-dimensional and three-dimensional benchmark tests and semi-proportional steel bridge specimens. Cao et al. [37] proposed a pavement crack detection method based on three-dimensional edge representation and digital twin data communication. A large number of experiments have verified that the proposed method can achieve better results. Qiu et al. [38] investigated pavement crack segmentation based on the fusion of two-dimensional and three-dimensional image features using CNNs. They proposed a Res2Net-based dual-modal segmentation method that integrates grayscale images and depth maps. The core idea is to exploit the complementary characteristics of 2D texture information and 3D structural information to enhance crack detection performance in complex environments. Yang et al. [39] proposed RC-SegNet based on multi-modal feature fusion, which improves crack segmentation completeness and boundary quality by integrating multi-modal information from RGB and depth images. In recent years, with the progress of dynamics, finite element simulation, intelligent control algorithm and signal processing technology, the research focus has been further extended to vehicle coupled vibration modeling, road random excitation response, and data-driven condition monitoring and fault diagnosis. Wang et al. [40] systematically reviewed the rapid development and application evolution of the bridge indirect measurement method ‘Vehicle Scanning Method’ (VSM) in the fields of modal identification and damage detection. Shi et al. [41] proposed a sliding mode control method based on disturbance observer, which is applied to the active vertical suspension system of high-speed railway vehicles, and can effectively suppress the rigid and bending vibration of the car body. The simulation comparison shows that the control effect is superior. Jin et al. [42] proposed a robust finite frequency H-Infinity control strategy to improve the vibration performance and ride comfort of electric vehicles through the in-wheel motor active suspension system (IWM-ASS).
Although existing studies have achieved certain progress in two-dimensional pavement crack detection, semantic segmentation, and three-dimensional reconstruction, most methods still focus on visual recognition accuracy and emphasize pixel-level or instance-level morphological feature extraction. Such methods generally face three limitations in engineering applications. First, the geometric parameters of cracks lack direct modeling with vehicle dynamic responses, making the detection results insufficient to support stability evaluation. Secondly, crack perception and vehicle operation analysis are often independent of each other, and a closed-loop analysis process for AGV actual working conditions has not yet been formed. Third, there is a lack of unified information fusion and collaborative analysis mechanism between multi-modal data (such as images and 3D point clouds), which leads to the disconnection between detection results and engineering decisions. To address the above issues, this study develops a multi-modal crack perception and speed matching analysis framework for AGV operational stability analysis from the perspective of engineering information modeling and system applications. The proposed framework establishes the correlation among crack structural information extraction, vibration response analysis, and speed strategy formulation. Based on the three-dimensional geometric reconstruction of cracks, the framework combines two-dimensional visual information to realize the refined expression of crack structure, and enhances the separability and stability of crack boundary and detail information through efficient feature reorganization and fusion mechanism. On this basis, the vehicle vibration data under real working conditions are further introduced, and the quantitative correlation between the geometric characteristics of cracks and the dynamic response of AGV is established, so as to realize the end-to-end closed-loop analysis from crack perception to speed optimization decision.
The main contributions of this paper are reflected in the following three aspects:
- (1)
- A crack multi-modal perception method combining two-dimensional image and three-dimensional point cloud is constructed. The two-dimensional image is used for crack category recognition and instance contour extraction, and the three-dimensional point cloud is used to obtain geometric parameters such as crack width, depth and surface area, so as to realize the collaborative description of crack visual features and spatial geometric features, and provide sufficient information basis for crack severity evaluation.
- (2)
- Aiming at the characteristics of pavement cracks, such as slender, boundary weakening, large scale change and irregular branch shape, a YOLO11-PCS instance segmentation model integrating DySample, C3k2_Mix and DLKA is constructed. The three modules enhance the expression of fracture features from three aspects: spatial detail recovery, multi-scale local feature fusion and long-distance deformation structure modeling, so as to realize the collaborative recognition and fine segmentation of fine, medium and severe fractures.
- (3)
- The relationship between crack severity, AGV speed and vehicle vibration response is established. Through the triaxial vibration test under different crack levels and speed conditions, the common influence of crack state and running speed on the stability of AGV is analyzed, and the recommended speed range under different crack levels is proposed accordingly, which provides a theoretical basis for the operation state evaluation and speed optimization of AGV in complex pavement environment.
The technical route of this paper is as follows: In Section 2, the crack data set is constructed, and the multi-modal crack data set composed of point cloud and 1500 labeled images is established, which provides data basis for three-dimensional reconstruction, classification and segmentation model training. In Section 3, the geometric characteristics of the fracture area are studied. Through the reconstruction of high-precision three-dimensional point cloud and the quantification of geometric structure characteristics such as fracture width, depth and area, three types of fracture grade systems are established. In Section 4, the pavement crack segmentation model based on improved YOLO11 is studied. A YOLO11-PCS model combining Dysample, C3k2_Mix and DLKA is proposed to achieve high-precision crack instance segmentation. The ablation experiment verifies that it is superior to the performance improvement of the original model. In Section 5, the stability of AGV based on accurate segmentation of cracks is studied, and a three-axis vibration acquisition platform is constructed. The coupling law of different crack grades and vehicle speed on vibration response is analyzed, and the optimal safe speed interval corresponding to fine, medium and serious cracks is proposed. Section 6 discusses the applicability boundaries, current limitations, and future development directions of the proposed multi-modal closed-loop system, including its adaptability to complex working conditions, computational efficiency, real-time deployment, and integration with AGV path planning and adaptive speed control. Section 7 summarizes the theoretical and engineering contributions of the multi-modal closed-loop system in this paper, and points out the future research prospects such as model lightweight, complex working condition expansion and dynamic speed control.
2. Multi-Modal Data Construction for AGV Crack Sensing and Stability Analysis
The purpose of this study is to construct a multi-modal data basis that can simultaneously support the three-dimensional geometric representation of cracks and the segmentation modeling of deep learning examples. Traditional data sets based on only two-dimensional images are difficult to reflect the true depth and scale characteristics of cracks, which limits the correlation analysis between crack structure parameters and AGV dynamic response. Therefore, this study simultaneously collects high-precision three-dimensional point cloud data of cracks and two-dimensional image data of real scenes, and constructs a multi-modal crack data set containing spatial geometric information and semantic annotation information, which provides unified data support for subsequent three-dimensional reconstruction, crack grading and segmentation model training.
2.1. Collection of Crack Point Cloud Data Set
The collection of three-dimensional crack point cloud data [43] is realized by laser scanning technology. In order to obtain high-precision structural information that can reflect the true three-dimensional morphology of cracks, this study uses a high-precision structured light 3D scanner to perform non-contact scanning on typical pavement crack samples to obtain high-density point cloud data to obtain three-dimensional spatial coordinate information of the crack area. The acquisition equipment is REVOPOINT MINI2 (Revopoint 3D Technologies Inc., Shenzhen, China). The rated resolution and nominal measurement accuracy meet the requirements of sub-millimeter level (nominal accuracy is about 0.05 mm). During the acquisition process, the laser beam is projected onto the road surface and reflected to generate dense point cloud data. Accurately record the geometric shape, depth and surface fluctuation characteristics of cracks. The scanning process includes calibration, sequence exposure acquisition and multi-angle coverage to ensure that the geometric details of cracks are fully sampled. After the acquisition, the original point cloud is processed by denoising, multi-view registration, correction and down-sampling in order to eliminate environmental interference (such as dust and foreign matter), and finally the high-fidelity point cloud data set for gridding and measurement is derived. All the scanned raw data and processing engineering files are stored in the project file, and a large number of actual pavement crack samples are scanned and sampled using a three-dimensional scanner, and the scanning results are archived and saved. The example of the crack point cloud obtained by scanning is shown in Figure 1. Through the above process, high-density point cloud data that can accurately characterize the depth fluctuation and boundary morphology of cracks are obtained, which provides a reliable three-dimensional structural basis for quantitative measurement and classification of crack geometric features.
Figure 1.
Example of pavement crack point cloud sample.
2.2. Collection of Crack Image Data Set
In order to study the method of pavement crack detection and instance segmentation, this paper independently builds a pavement crack data set acquisition system, as shown in Figure 2, which provides an experimental basis for crack image data acquisition in real road environment. Aiming at the characteristics of pavement cracks in typical application scenarios such as industrial parks and roads, industrial cameras are used to carry out actual collection work. In order to improve the adaptability of the data set to the complex engineering environment, the influence of different light and weather conditions is fully considered in the collection process, and the crack image samples under different light conditions such as normal light, strong light and weak light, as well as different weather conditions such as sunny, cloudy and rainy days are obtained, so that the data set can be closer to the actual road environment.
Figure 2.
Pavement crack data set acquisition system.
In this paper, a total of 1500 pavement crack images are collected, and the original image resolution is 640 × 480 pixels. According to the degree of crack damage and geometric morphological characteristics, the samples are divided into three categories: fine cracks, medium cracks and severe cracks. The number of samples for each type of cracks is 500. The specific number of samples is shown in Table 1, and the crack samples are shown in Figure 3. All images use the Labelme annotation tool for pixel-level instance contour annotation (Mask). At the same time, the corresponding category labels are given according to the actual damage degree of the crack, and the pavement crack instance segmentation data set containing semantic information and morphological information is constructed.
Table 1.
Number of pavement crack samples.
Figure 3.
Sample examples of pavement crack data set.
In the process of model training, in order to improve the adaptability of the model to complex environmental changes, data enhancement methods such as random horizontal flipping, scale scaling, translation, HSV color perturbation and Mosaic are used to expand the feature diversity of training samples. In the experiment, the data set is randomly divided into training set, validation set and test set according to the ratio of 8:1:1. The training set is used for model parameter learning, the validation set is used for model performance evaluation and optimal model selection, and the test set is used for final performance verification.
The two-dimensional crack image data set constructed by not only provides training and test samples in real scenes for improving the YOLO11 instance segmentation model, but also maintains a corresponding relationship with the crack geometric parameters obtained by three-dimensional point cloud reconstruction, which provides a unified data basis for subsequent crack structure feature analysis, vibration response research and AGV speed decision.
3. Three-Dimensional Modeling of Crack Structure and Quantification of Engineering Geometric Features
This section aims to construct a quantitative index system that can directly reflect the structural characteristics of cracks through high-precision three-dimensional point cloud reconstruction and geometric parametric modeling, and further establish a bridge between the geometric characteristics of cracks and the vibration response of AGV driving. Different from only relying on two-dimensional shape description, three-dimensional geometric parameters can more realistically describe the physical nature of the crack excitation on the wheel, which is the key prerequisite for subsequent vibration analysis and speed decision modeling. In this part, the laser three-dimensional crack point cloud data is obtained by scanning the scanner, and the high-precision three-dimensional reconstruction and geometric parametric modeling of the crack area are realized through multiple steps. Based on this, the crack categories are further divided. The following is the detailed technical process and method.
3.1. Research on Three-Dimensional Reconstruction of Cracked Areas
In order to obtain the real three-dimensional feature model of the crack, the REVOPOINT MINI2 three-dimensional scanner (accuracy of 0.05 mm) is used for scanning. The structured light scanning technology depends on the combination of the projection light source and the camera. The technology projects the laser onto the surface of the object through a specific encoding method. Due to the different surface characteristics (reflectivity, roughness and reflection angle, etc.) of the object, the light obtained by the camera changes accordingly. After subsequent calculation and analysis, the three-dimensional point cloud information of the object is captured. Its basic working principle and process are as follows:
- (1)
- Image acquisition and preprocessing:
After the projected coded light pattern is deformed by the surface of the object, the camera captures and generates multiple frames of images. The system performs image denoising, calibration and distortion correction to improve the quality of the original data.
- (2)
- Point cloud generation and matching:
Based on the principle of triangulation, the three-dimensional coordinates of each point of the object are calculated by binocular camera parallax, and the initial point cloud data is generated. Its multi-frequency phase unwrapping technology reduces the mismatch problem of complex surfaces or highly reflective materials, and improves the density and accuracy of point clouds.
- (3)
- 3D model reconstruction:
Using point cloud data for surface fitting and meshing processing, a high-resolution 3D model is generated.
The core equipment configuration of the three-dimensional scanning experiment includes a three-dimensional scanner, a computing terminal and a special support for the testing machine. Among them, the three-dimensional scanner is connected to the computing terminal through the USB interface, which realizes the data communication between the devices and the power supply function of the scanner. The main body of the scanner is fixedly installed in the preset station of the test machine bracket, so as to ensure the stability of the spatial position of the equipment during the scanning process and avoid the scanning deviation caused by displacement. The experimental process of scanning and collecting crack point clouds using a three-dimensional scanner (Revopoint 3D Technologies Inc., Shenzhen, China) is shown in Figure 4.
Figure 4.
Three-dimensional crack point cloud acquisition experiment.
During the experiment, the high-precision continuous scanning operation was carried out for the crack target to obtain the complete point cloud data covering the whole crack region. All the original point cloud data were stored in the exclusive project engineering documents of Revo Scan 5 software to ensure the traceability and management standardization of the data. After the scanning is completed, the original point cloud data is first rendered and visualized, and then the point cloud fusion processing is performed: through the registration of multi-view point clouds and the removal of redundant data, the spatial continuity and data accuracy of the point cloud are optimized, and finally a three-dimensional point cloud model of cracks with high precision, no missing and high reliability is constructed. In order to meet the requirements of subsequent model export and application, the optimized point cloud data is further triangulated to generate a polygonal mesh model with complete topological structure, which provides the basic data carrier for the three-dimensional shape analysis of cracks. Through multi-view registration and grid processing, the influence of noise and occlusion on fracture boundary and depth measurement is effectively reduced, and the reliability of the reconstructed model in scale consistency and local detail expression is ensured, which provides stable input for subsequent geometric parameter measurement.
3.2. Measurement of Crack Geometric Features and Classification of Categories
In order to realize the quantitative evaluation of irregular crack diseases, this study uses industrial-grade detection software Geomagic Control X (version 2020.1) [44] to parameterize the reconstructed STL mesh model. The software is widely used in manufacturing, engineering inspection and scientific research. The operation interface is shown in Figure 5. The tool uses fitting algorithms such as least square method to reconstruct local reference datum in three-dimensional space, which effectively solves the problem that non-parametric defects are difficult to measure repeatedly under the interference of complex road curvature. By transforming fuzzy visual perception features into geometric indicators with clear physical meaning, it provides high-precision ground truth values for the verification of subsequent perception algorithms.
Figure 5.
Interface of Geomagic Control X software.
In this study, professional three-dimensional detection software was used to realize the parametric extraction of pavement crack width, spatial surface area and maximum depression depth through dynamic section cutting, triangular mesh area integration and datum fitting. This method effectively compensates for the underestimation of the projection area of the traditional two-dimensional image and the lack of representativeness of the artificial single-point measurement. It objectively restores the evolution degree of the disease and the amount of structural damage from the multi-dimensional geometric scale, and provides a high-reliability geometric reference for the accurate division of the crack grade and subsequent engineering decisions. The following key feature extraction is performed on the fracture samples by using the built-in parametric measurement operator of the software to construct the physical input feature vector supporting the dynamic analysis.
The quantitative analysis process of the geometric characteristics of the fracture area is as follows:
Crack depth measurement: The reference surface of the surrounding intact pavement is used as the reference to fit the reference plane P1, and the plane P2 is constructed based on the fitting plane at the bottom of the crack. The vertical distance between the two planes is measured by the intelligent size measurement module, which is used as the depth parameter of the crack. The value is defined as the minimum vertical distance (mm) of the two planes along the normal direction.
Measurement of the upper surface area of the crack: Under the projection of the reference plane P1, the surface contour boundary of the crack is fitted by the spline curve, and the target area in the contour is accurately selected by the regional brush tool. The projection area of the area is calculated by the area measurement function, which is the upper surface area parameter of the crack.
Crack width measurement: At the characteristic section of the crack (perpendicular to the main direction of the crack), the reference planes P3 (fitting the edge of one side of the crack) and P4 (fitting the edge of the other side of the crack) perpendicular to the direction of the two ends of the crack extension are constructed respectively. The vertical distance between the two planes is obtained by the length measurement tool as the width parameter of the crack.
Based on the above measurement method, batch processing of multiple sets of three-dimensional crack data was carried out, and a large number of samples of geometric parameters of cracks were obtained. Based on a large number of geometric measurement samples of cracks collected, combined with engineering experience and the discrimination analysis of subsequent vibration experiments, this paper takes the crack width as the leading index, supplemented by the degree of surface damage, and classifies the cracks into three levels, namely, slight cracks, moderate cracks and severe cracks. This classification method shows good discrimination in subsequent vibration response experiments, which provides a structural basis for constructing the matching relationship between crack grade and velocity. The surface damage is slight, and the cracks with a crack width less than 5 mm are divided into slight cracks. The surface damage degree is medium, and the cracks with a crack width of 5–10 mm (including 5 and 10 mm) are divided into moderate cracks; the surface damage is serious, and the cracks with a crack width of more than 10 mm are divided into severe cracks. The geometric parameter measurement of typical pavement cracks is shown in Figure 6.
Figure 6.
Example of crack geometry characteristic parameter measurement.
4. Research on YOLO11 Instance Segmentation Model for Fine Fracture Characterization
The experimental data used in this study are derived from the pavement crack images collected in the real road environment, covering different pavement materials, crack shapes and lighting conditions, which can truly reflect the engineering complexity faced in the actual road inspection process. The data contains not only fine linear cracks, but also moderate and severe cracks with uneven width and irregular shape. At the same time, it is accompanied by shadows, stains and background texture interference, which puts forward higher requirements for the engineering perception ability of the model. In engineering practice, pavement cracks often show the characteristics of large-scale change, fuzzy boundary and complex background. The traditional manual inspection method is not only inefficient, but also has strong subjectivity. Therefore, the selection of such engineering data for experimental verification is helpful for the system to evaluate the applicability, stability and information extraction ability of the proposed method under real engineering conditions.
In order to comprehensively evaluate the performance of the proposed method in engineering information processing tasks, this paper selects the YOLO series model to represent the end-to-end detection framework widely used in current engineering visual perception, and the related improved network structure reflects the difference in the effect of different feature modeling strategies in engineering information extraction. The models are trained and tested in the same data set and unified experimental environment to ensure the fairness and repeatability of the comparison results. Through the above experimental settings, the comprehensive performance of different methods in crack recognition accuracy, robustness and information expression ability can be systematically analyzed from the perspective of engineering application.
4.1. Improvement of the YOLO11 Network Model
The YOLO11 network model consists of four main components: Input, Backbone, Neck and Head. First, Input performs preprocessing, including data enhancement, to prepare the image for further processing. Then, these preprocessed images are transmitted through Backbone, from which Backbone extracts relevant features. Then, the Neck module is used to fuse the extracted features to generate feature maps of different sizes. Finally, the fused features are input to Head, and object detection is performed to output the detection results.
In view of the tortuous characteristics of pavement cracks, this paper modifies the original detection head of YOLO11 in the Head part to the segmentation head, so that the model can do the instance segmentation task rather than the target detection. The contour of the crack is directly calibrated by the pixel-level mask (Mask), which will better characterize the morphological characteristics of the crack, reduce the phenomenon of missed detection or misjudgment, and analyze the detection results more intuitively. Based on the original model of YOLO11, the Dysample dynamic upsampling module is used to replace the Upsample module in the original network. The network structure principle model is shown in Figure 7, which can effectively improve the detection and segmentation performance of slight, moderate and severe cracks. At the same time, the resource utilization is more efficient, the number of parameters is reduced, the amount of calculation is reduced, and the memory and delay are saved. Dysample dynamically adjusts the up-sampling kernel parameters and receptive field through the content-aware weight generation mechanism: for slight cracks, a small kernel is used to sharpen the edges and fuse high-frequency details to compensate for the loss of down-sampling information and improve the sub-pixel positioning ability; for moderate cracks, the feature response is enhanced by multi-scale hybrid kernel and channel attention to suppress background interference. For severe fractures, large receptive field kernel and deformable convolution are used to capture long-range structural dependence and optimize the segmentation accuracy of complex boundaries. Moreover, Dysample enhances the recovery ability of crack edge details through the content-aware dynamic sampling mechanism. The module can dynamically adjust the sampling position according to the input features to improve the recovery ability of crack edge details.
Figure 7.
Dysample network structure principle.
In YOLO11, the hybrid structure module Mix Structure Block is integrated into C3k2 to form a new C3k2_Mix module, which is applied to perform instance segmentation tasks for three types of pavement cracks (slight, moderate, and severe). Multi-scale feature fusion (standard convolution to maintain details, dilated convolution to expand the receptive field) and attention mechanism focus on key areas, which can enhance the model’s ability to express features of cracks with different widths, improve the detection sensitivity of small targets (such as slight cracks), boundary segmentation accuracy, and context discrimination ability, and effectively reduce over-segmentation or under-segmentation problems. At the same time, it can enhance the expression ability of fracture characteristics of different scales and improve the recognition ability of the model to fine fractures and complex background areas. The DLKA attention mechanism is combined with YOLO11’s C2PSA to apply to the instance segmentation of slight, moderate and severe pavement cracks. The large convolution kernel feature of DLKA can enhance the ability of C2PSA to capture global context information and help the model better understand the distribution and overall morphology of cracks with different degrees in the pavement. The structural principle is shown in Figure 8. Its deformable convolution characteristics can flexibly adapt to the irregular edges of cracks (such as complex branches of severe cracks and fine lines of slight cracks), and improve the discrimination of C2PSA on local details and morphological differences in cracks. At the same time, DLKA can use the large convolution kernel and the deformable sampling mechanism to enhance the long-distance context information modeling ability, improve the perception ability of the model to the irregular crack boundary and the small crack area, reduce the background interference, and then improve the classification accuracy of the three types of cracks and the accuracy of the segmentation boundary, especially in the complex pavement environment, it can more stably identify the feature differences in different degrees of cracks. YOLO11-PCS is not a simple superposition of multiple modules, but a targeted design for fracture detail recovery, multi-scale feature expression and complex structural modeling requirements. The functions of each improved module are shown in Table 2.
Figure 8.
DLKA attention mechanism.
Table 2.
Each improved module of YOLO11-PCS model and its function.
The improved YOLO11-PCS network model structure is shown in Figure 9.
Figure 9.
Improved YOLO11-PCS network structure model.
4.2. Experiment and Analysis
4.2.1. Experimental Environment, Training Parameters and Evaluation Index
The experimental framework is based on Python (version 3.8.18) language, using NVIDIA RTX A4000 GPU and PyTorch (version 2.1.2) framework under Windows10 for training. Similar to most detection tasks, all samples in this data set are randomly divided into training set, verification set and test set in a ratio of 8:1:1. In order to ensure the fairness of the comparison of different models, YOLO11 n, each single module improved model and YOLO11-PCS all adopt the same data set division, training strategy and hyperparameter setting, only the network structure is different. All models were initialized by YOLO11n-seg pre-training weights. The training rounds were set to 200, the input image size was set to 640 × 640, and the batch size was set to 16. The optimizer adopts the Ultralytics automatic optimizer selection strategy. The initial learning rate and final learning rate coefficients are set to 0.01, and the momentum and weight attenuation coefficients are set to 0.937 and 0.0005, respectively. The cosine learning rate scheduling is not enabled, and the preheating round is set to 3. The random seed is set to 0, and deterministic training is enabled to improve the reproducibility of the experimental results. During the training process, data enhancement methods such as Mosaic, HSV color perturbation, random horizontal flipping, translation and scale scaling were used. Among them, the Mosaic enhancement coefficient was set to 1.0 and closed in the last 10 training cycles; the random horizontal flip probability is 0.5. The translation and scale scaling coefficients are 0.1 and 0.5, respectively. The HSV hue, saturation and brightness enhancement coefficients are 0.015, 0.7 and 0.4, respectively. MixUp and Copy-Paste enhancement are not enabled. The IoU threshold in the verification phase is set to 0.7, and the confidence threshold adopts the default setting of the Ultralytics verification program. During the training process, the optimal model is saved according to the comprehensive fitness of the verification set, and the best.pt weight is used for the final test.
In order to evaluate the detection and segmentation performance of each model objectively and accurately, this paper selects Precision, Recall and mAP50 as the core evaluation indicators. In the task of object detection and instance segmentation, Precision is defined as the proportion of True Positive in the samples predicted by the model as positive examples, and its value range is [0, 1]. This index directly reflects the reliability of the model prediction results. The higher the value, the lower the false detection rate of the model and the stronger the prediction accuracy. The recall rate refers to the proportion of all the actual positive samples correctly identified by the model, and the value is also [0, 1]. Its level reflects the coverage ability of the model to the global positive samples. The higher the value, the lower the missed detection rate of the model and the more comprehensive the capture of the target. The mean average precision (mAP) is a key indicator to comprehensively measure the performance of the model. By integrating the average precision (AP) calculated under different categories and different confidence thresholds, it can fully reflect the comprehensive detection ability of the model on various types of targets. The mAP50 specifically refers to the mAP value when the IoU threshold is set to 0.5, which focuses on the core requirements of target positioning and contour matching. The higher the value, the better the comprehensive detection and segmentation performance of the model under the requirements of conventional positioning accuracy.
4.2.2. Comparative Experiment
In order to further verify the performance improvement effect of the improved model proposed in this paper in the instance segmentation task, and analyze the contribution of each improved module to the model performance, this paper carries out comparative experimental research.
In this paper, the segmentation data set used in the comparative experiment is crack-seg.yal. This data set is specially constructed for the segmentation task of pavement crack examples, including labeled samples of various types of cracks, and provides pixel-level mask (Mask) for training and evaluating the segmentation performance of the model. The dataset covers mild, moderate and severe cracks, including fine textures, long trunks and complex branch structures, which can fully reflect the diversity and complexity of actual pavement cracks, and provide a reliable benchmark for the performance evaluation of the model in the instance segmentation task. The crack-seg data set used in the experiment contains a total of 4029 image samples. All images have completed the instance segmentation and labeling, and provided category labels and target contour information. The data set is divided into 3717 training sets, 200 validation sets and 112 test sets, which provides complete support for model training, parameter adjustment and performance evaluation.
Under the same experimental environment and training parameter settings, the baseline model YOLO11n-seg and the YOLO11-Dy, YOLO11-Mix, YOLO11-LKA models after gradually introducing different improved modules were trained and tested. At the same time, the final model YOLO11-PCS constructed by integrating multiple improvement strategies is included in the comparative analysis. By comprehensively comparing the performance of Mask-P, Mask-R and Mask-mAP in Precision, Recall, mAP and segmentation-related evaluation indicators, the influence of each improved module on the segmentation performance of the model instance is systematically evaluated, and the overall performance improvement effect of the model after multi-module fusion in the instance segmentation task in complex scenes is further verified. During the training process, the training cycle of the instance segmentation task is uniformly set to 200 epochs, the input image size (imgsz) is set to 640 × 640, and the remaining hyperparameters are consistent, so as to avoid interference with the experimental results due to parameter differences. The comparative experimental results before and after the improvement of YOLO11 instance segmentation model are shown in Table 3.
Table 3.
Comparative experimental results of the YOLO11 segmentation model before and after improvement.
From the data in Table 3, it can be seen that the indicators of the baseline model YOLO11n-seg in the instance segmentation task are: Box-P is 0.835, Box-R is 0.774, Box-mAP50 is 0.800, Mask-P is 0.764, Mask-R is 0.669, Mask-mAP50 is 0.680, which provides a comparison benchmark for subsequent model improvement.
Firstly, the overall performance of the YOLO11-Dy model obtained after introducing the DySample dynamic upsampling module is improved. Among them, Mask-mAP50 increased from 0.680 of the baseline model to 0.694, an increase of 2.1%. The Mask-R is improved from 0.669 to 0.683, an increase of 2.1%, indicating that the dynamic upsampling mechanism can recover high-resolution feature information more effectively, thereby enhancing the model’s ability to capture fracture detail areas. At the same time, the detection index Box-P increased from 0.835 to 0.866, an increase of 3.7%. The Box-mAP50 is improved from 0.800 to 0.815, an increase of 1.9%, indicating that the module has a positive impact on the positioning accuracy of target detection while improving the segmentation ability.
Secondly, the YOLO11-Mix model with Mix Structure Block shows different degrees of change in some indicators. Among them, Box-R increased from 0.774 to 0.775, with no significant change, while Box-P increased from 0.835 to 0.855, an increase of 2.4%, and Box-mAP50 increased from 0.800 to 0.810, indicating that the structure has a certain role in improving the accuracy of the model, but there is a certain fluctuation in accuracy. In terms of segmentation indicators, Mask-mAP50 increased from 0.680 to 0.685, with a slight increase in only 0.7%, and Mask-R increased from 0.669 to 0.677, with an increase of 1.2%, indicating that the multi-scale hybrid convolution structure can enhance the model’s ability to express the characteristics of complex fracture structures to a certain extent, but the overall increase is relatively limited when used alone.
Thirdly, the YOLO11-LKA model formed after adding the DLKA attention mechanism is further enhanced in terms of feature modeling capabilities. Among them, Mask-mAP50 increased from 0.680 of the baseline model to 0.691, an increase of 1.6%; mask-P increased from 0.764 to 0.785, an increase of 2.8%, indicating that the large-core attention mechanism can effectively expand the network receptive field, so that the model can better capture the long-distance continuous structural characteristics of cracks. At the same time, in terms of detection indicators, Box-P is 0.859, Box-R is 0.769, and Box-mAP50 is 0.814. The overall performance is more stable than the baseline model, indicating that the module plays a positive role in enhancing the ability of global feature modeling.
Finally, the final model YOLO11-PCS, which combines DySample, Mix Structure Block and DLKA attention mechanism, achieves the best overall performance. Specifically, Box-P increased from 0.835 to 0.904, and the overall accuracy was significantly improved. Box-R reached 0.780, Box-mAP50 increased from 0.800 to 0.826, Mask-R was 0.682, and Mask-P increased from 0.764 to 0.820, an increase of 7.3%. On the most critical segmentation evaluation index Mask-mAP50, the model is improved from 0.680 of the baseline to 0.699, an overall increase of 2.8%, indicating that the model has been significantly enhanced in target area positioning, crack boundary recognition and fine-grained segmentation ability after integrating multiple improvement strategies.
In summary, each improved module improves the performance of the model at different levels. Among them, DySample has a significant effect on detail recovery, Mix Structure Block improves the ability of multi-scale feature expression, and DLKA attention mechanism strengthens the ability of global structure modeling. When the three improved strategies are fused, the model achieves the best performance in both detection and segmentation indicators, which verifies the effectiveness and superiority of the YOLO11-PCS model proposed in this paper in the fracture instance segmentation task.
4.2.3. Ablation Experiment
In order to further analyze the role of each improved module in engineering information extraction, this paper designs an ablation experiment to compare and analyze the performance of the model under different structural combinations. By gradually introducing each improvement module, its impact on crack perception can be intuitively evaluated. The experimental results show that after the introduction of Upsample, the model’s expression ability of slight crack features is enhanced while the number of parameters and computational complexity remain low, indicating that the structure helps to improve the perception ability of small disease information in engineering scenarios. When the DLKA attention mechanism is further introduced, the model is more stable in the location of the crack area under complex background conditions, and can effectively suppress the interference information of the non-crack area, indicating that the module plays a positive role in strengthening the key engineering information and improving the ability of feature discrimination. After ablation experiments, the performance data of YOLO11 model before and after improvement are shown in Table 4 below.
Table 4.
Comparison of ablation experimental data.
It can be seen from the data in the table that compared with yolo11n, the Mask-mAP50 value of the improved yolo11-Dy increased by 4.3%, Mask-P increased by 2.5%, Mask-R increased by 5.8%, Box-P increased by 0.9%, Box-R increased by 7.3%, and Box-mAP50 also increased by 2.7%. The Mask-mAP50 value of the improved yolo11-Mix increased by 2.6%, Mask-R increased by 9%, Box-R increased by 7.6%, but Mask-P, Box-P and Box-mAP50 decreased slightly. The Mask-mAP50 value of the improved yolo11-LKA increased by 4%, Mask-P increased by 3.6%, Mask-R increased by 4.7%, Box-R increased by 7.6%, Box-mAP50 also increased by 3%, but Box-P decreased slightly. The Mask-mAP50 value of the improved yolo11-PCS increased by 5.4%, Mask-P increased by 5.5%, Mask-R increased by 12%, Box-P increased by 1%, Box-R increased by 11%, and Box-mAP50 also increased by 4.6%. From the performance comparison results, it can be seen that compared with the benchmark model yolo11n, the proposed four improved versions (yolo11-Dy, yolo11-Mix, yolo11-LKA, yolo11-PCS) show a differentiated optimization effect on the core evaluation indicators of instance segmentation and target detection, which verifies the effectiveness of the improvement strategy as a whole. Among them, YOLO11-PCS has the most outstanding performance, showing the advantages of collaborative optimization in accurate extraction of target contour, detection and positioning accuracy and global target recall ability.
It can be seen from the results that the proposed improved YOLO11-PCS network model has achieved better performance in key evaluation indicators such as mAP, Precision and Recall, indicating that it has obvious advantages in fracture area identification and boundary characterization. From the perspective of engineering, the improvement of Mask-mAP not only reflects the improvement of the overall segmentation accuracy of the model, but also shows that the model’s ability to express crack boundary and detail information is enhanced. This refined crack segmentation result is helpful for the quantitative analysis of key parameters such as crack length, width and distribution range in subsequent engineering maintenance, and provides a reliable basis for disease assessment and maintenance decision-making. In addition, the improvement of the Recall index means that the missed detection rate of the model in the potential crack area during the engineering inspection process is reduced, which helps to reduce the structural safety hazards caused by the omission of cracks, thereby improving the reliability and safety of the automated road inspection system.
In order to fully verify this conclusion and show the improved detection and segmentation effect more clearly, the Mask-mAP50, Mask-P, Mask-R, Box-P, Box-R and Box-mAP50 of the algorithm before and after the improvement are compared with the change curve of the number of training iterations, and the visual detection result map of the algorithm before and after the improvement is displayed to compare the detection performance of the algorithm before and after the improvement for different cracks. The variation curves of Mask-mAP50, Mask-P, Mask-R, Box-P, Box-R and Box-mAP50 of the five algorithms of yolo11-n, yolo11-Dy, yolo11-Mix, yolo11-LKA and yolo11-PCS with the number of training iterations are shown in Figure 10, Figure 11 and Figure 12, respectively. The difference between the original yolo11n crack detection segmentation effect and the final improved yolo11-PCS crack detection segmentation effect is shown in Figure 13.
Figure 10.
The change curve of the number of iterations of the accuracy rate of different YOLO11 models.
Figure 11.
The change curve of the number of iterations of different YOLO11 models’ recall rates.
Figure 12.
Variation curves of mAP50 iteration times of different YOLO11 models.
Figure 13.
Visualization results of fracture segmentation of YOLO11 model before and after improvement.
Figure 13 shows the visual segmentation results of different methods in typical pavement crack scenarios. It can be observed that the proposed method shows better results in fracture continuity maintenance, boundary integrity and fine fracture identification. From the perspective of engineering application, this method can more accurately describe the real shape of cracks, reduce the phenomenon of fracture segmentation or over-segmentation, and provide engineers with a more valuable form of crack information expression, which is conducive to the subsequent crack grade determination and maintenance plan formulation.
The comprehensive experimental results show that the proposed method can effectively improve the accuracy of crack recognition and segmentation, and show good feature extraction ability in complex road environment, which can provide effective information support for subsequent road inspection and infrastructure detection. The output of each module is quantifiable parameters, which can be directly used as the input of AGV control or scheduling system, so as to reduce the dependence of manual experience on the operation decision. This method can provide reliable visual information support for automated pavement detection, disease assessment and engineering maintenance decision. It should be pointed out that the performance of the model may still be affected in the case of extreme light conditions or limited number of crack samples. Future research can combine multi-source sensing information or introduce adaptive learning strategies to further improve the generalization ability and robustness of the method in complex engineering environments.
5. Analysis of Dynamic Response and Speed Decision of AGV Driven by Crack Structure Information
Based on the optimized accurate segmentation of cracks, this part designs and carries out multivariate control experiments. By studying the vibration effects of AGV passing through different types and damage degree crack areas at different driving speeds, it aims to propose the best road condition–speed matching model based on vibration feedback under different damage degrees. This section will reveal the practical significance of crack structure information to AGV operation safety and control decision-making from the perspective of engineering application.
5.1. The AGV Experimental Platform and Data Acquisition System for Vibration Response Assessment
The core equipment of the vibration signal acquisition experiment includes ROS AGV car (wheel diameter size is 12 cm, equipped with autonomous navigation module, supporting multi-speed adjustment), three-axis vibration sensor WTVB05 (sampling frequency is 16 kHz to ensure high-fidelity acquisition of vibration signals) and data storage and analysis terminal (PC terminal). The connection and deployment of the device follow the principle of ‘precise perception-real-time transmission-stable storage’: the vibration sensors are fixed at three key stress positions near the front and rear wheels of the AGV car to avoid the load-bearing area of the body and reduce the interference of non-road factors. The sensor establishes two-way communication with the PC through the USB interface, which not only realizes the real-time data transmission of 9600 bps baud rate, but also provides stable power supply for the sensor. WitMotion data acquisition software (version V2025.7.8.0) is deployed on the PC side to automatically record the displacement and frequency data of the X-axis (driving direction), Y-axis (transverse direction) and Z-axis (vertical direction) of the vibration signal, and generate structured data files to ensure data traceability. The experimental process of vibration characteristic signal acquisition is shown in Figure 14. The design of this experimental platform is not only for the purpose of high-frequency vibration analysis, but also for the operation stability evaluation and speed decision-making requirements of AGV in engineering inspection and logistics operation scenarios. Therefore, the layout position, sampling frequency and speed setting of the vibration sensor are all aimed at capturing the transient impact and structural excitation response induced by the crack, so as to ensure that the acquisition results can directly serve the construction of the subsequent road condition–speed matching model.
Figure 14.
Vibration signal acquisition experiment.
In the experiment, the crack type and AGV running speed are taken as the core independent variables, and the three-axis vibration parameters are taken as the dependent variables. The irrelevant variables such as ambient temperature and road humidity are controlled to be consistent, so as to avoid the interference of external environment on the vibration signal. Among them, the types of cracks are based on the classification criteria for geometric features in Section 3. Three typical samples of cracks are selected: fine cracks (width < 5 mm), moderate cracks (width 5–10 mm), and severe cracks (width > 10 mm). Multiple parallel test areas are selected for each type of crack, and ensure that the AGV passes through the crack area completely. The driving speed of the AGV is set according to the actual industrial scene requirements and the results of the previous pre-experiment, at five levels: 0.5 m/s, 0.7 m/s, 0.85 m/s, 1 m/s, and 1.15 m/s, covering the common speed range for AGV low-speed inspection to medium-speed transportation. Under each gear, the AGV is controlled to continuously pass through the same type of crack area many times along the preset trajectory as the final sample under this working condition, so as to obtain effective vibration data. In the experimental stage, the AGV car is controlled to continuously pass through different types of cracks in the selected area at different speeds. The vibration sensors at three positions collect the vibration signals in real time and collect and save them in the PC-side software. Finally, the vibration frequency and displacement data of X, Y and Z axes are collected. The results provide a basis for prioritizing key crack parameters in engineering as operation evaluation indicators, and provide high-fidelity data support for subsequent AGV stability analysis and road condition–speed matching model construction.
Based on the above crack geometric feature extraction and AGV vibration experiment results, this paper further analyzes the relationship between crack structure information and AGV dynamic response from the perspective of engineering application, so as to explore the application value and feasibility of the proposed method in the actual AGV operation system.
5.2. Analysis of the Crack-Vibration–Speed Relationship for Operational Decision-Making
In this section, the vibration frequency and displacement of X, Y and Z axes of AGV car passing through three types of cracks at different speeds are analyzed by comprehensive consideration, so as to obtain the correlation between cracks and speed, and then the best road condition–speed matching model based on vibration feedback under different disease damage degrees is obtained. In order to further clarify the basis for determining the road condition–speed matching relationship, this paper takes the stability of AGV operation as the goal, and takes the vehicle vibration response as the speed constraint condition. Since the pavement cracks mainly generate impact excitation through the sudden change in wheel–ground contact state, and lead to the enhancement of vehicle vertical vibration, the Z-axis (vertical direction) vibration displacement is selected as the main stability evaluation index, and the vibration response in the X-axis and Y-axis directions is combined to assist the analysis. When the vehicle passes through the crack area at a certain speed, if the vibration response amplitude is low and the change trend is stable, it is considered that the speed meets the stable operation requirements under the corresponding crack level; on the contrary, when the vibration response increases significantly due to the increase in speed, it is not suitable as the recommended running speed.
Based on the collected multi-dimensional vibration data, the idea of single factor difference analysis + multivariate correlation modeling is used to systematically explore the influence of crack type and driving speed on AGV vibration response. Finally, the road condition–speed matching model is constructed. The specific analysis process is as follows:
In order to quantitatively analyze the influence of different crack grades and running speeds on the dynamic response of AGV, this paper takes the vibration displacement of Z axis (vertical direction) as the core evaluation index, and combines the vibration displacement of X axis (driving direction) and Y axis (transverse direction) as the auxiliary index. At the same time, the vibration response of the front wheel is taken as the main analysis object, and the response of the left and right rear wheels is used as a supplement to compare and analyze the velocity variation law under different crack levels. Finally, the suitable running speed of all kinds of cracked pavements is determined, and the road condition–speed matching relationship based on vibration feedback is constructed. The vibration responses of the front wheel, the left rear wheel and the right rear wheel when AGV passes through slight cracks, moderate cracks and severe cracks at different speeds are shown as follows. Specifically, the vibration responses of AGV passing through slight cracks at different speeds are shown in Figure 15, Figure 16 and Figure 17, respectively. The vibration responses of AGV passing through moderate cracks at different speeds are shown in Figure 18, Figure 19 and Figure 20, respectively. The vibration responses of AGV passing through severe cracks at different speeds are shown in Figure 21, Figure 22 and Figure 23, respectively.
Figure 15.
Vibration response of the front wheel when AGV passes through slight cracks at different speeds.
Figure 16.
Vibration response of the right rear wheel when AGV passes through slight cracks at different speeds.
Figure 17.
Vibration response of the left rear wheel when AGV passes through slight cracks at different speeds.
Figure 18.
The vibration response of the front wheel when AGV passes through moderate cracks at different speeds.
Figure 19.
Vibration response of the right rear wheel when AGV passes through moderate cracks at different speeds.
Figure 20.
Vibration response of the left rear wheel when AGV passes through moderate cracks at different speeds.
Figure 21.
Vibration response of the front wheel when AGV passes through severe cracks at different speeds.
Figure 22.
Vibration response of the right rear wheel when AGV passes through severe cracks at different speeds.
Figure 23.
Vibration response of left rear wheel when AGV passes through severe cracks at different speeds.
The analysis of vibration characteristics under the condition of slight cracks is as follows: the depth and width of slight cracks are small, and the impact on AGV car is limited. From the vibration response of the front wheel, it can be observed that the Z-axis vibration displacement is in the low amplitude range as a whole. In the process of increasing the vehicle speed from 0.5 m/s to 1.15 m/s, the vibration amplitude shows a slow growth trend. When the vehicle speed is 0.5–0.7 m/s, the Z-axis peak growth is gentle, the curve shape is stable, and there is no obvious pulse impact; when the vehicle speed is increased to more than 0.85 m/s, the front wheel has a slight cyclical fluctuation, but it has not yet formed a sudden peak; when the speed continues to rise to 1.0–1.15 m/s, the vibration peak increases slightly, but there is no obvious sharp impact or high-frequency dense superposition. The vibration amplitude of the left and right rear wheels is lower than that of the front wheels, and the growth trend is more stable, indicating that the influence of fine cracks on the overall stability of the car body is weak. It can be judged that under the condition of slight cracks, the impact risk of AGV on goods and structures is low and acceptable, so it can operate at a higher speed on the premise of ensuring operation efficiency.
Summary of the suitable speed of slight cracks: Based on the above characteristics, AGV can use a higher speed to balance efficiency and stability under the condition of slight cracks, and the suitable speed range is 0.7–1.15 m/s.
The analysis of the vibration characteristics under the condition of moderate crack is as follows: the width and depth of the moderate crack increase significantly, and the vertical impact generated by the AGV car when passing through is obviously enhanced. The Z-axis vibration response of the front wheel has more obvious speed sensitivity: when the vehicle speed is 0.5 m/s, the Z-axis vibration is improved compared with the fine cracks, but the overall is still in the controllable range; in the range of 0.7–0.85 m/s, the vibration amplitude of the Z-axis appears to be enlarged in stages, accompanied by local spikes, indicating that the crack structure has a significant single impact on the wheel; when the vehicle speed exceeds 1.0 m/s, the Z-axis curve shows the characteristics of continuous peak superposition, the impact peak increases greatly, and the phenomenon of high-frequency vibration superposition occurs in some time periods, which easily causes cargo sloshing or vehicle body fatigue. The change trend of the vibration amplitude of the rear wheel is consistent with that of the front wheel, but the value is slightly lower, indicating that the front wheel is still the main impact area. The X-axis and Y-axis vibrations show obvious enhancement characteristics in medium cracks: the X-axis vibration is intensified at the medium-high-speed stage, showing more obvious forward and backward swing; the Y-axis vibration increases significantly after the vehicle speed is greater than 0.85 m/s, indicating that there is a certain lateral disturbance when the crack passes, which may affect the navigation accuracy. The above characteristics indicate that moderate cracks will significantly amplify the vibration of AGVs and increase the fatigue risk of goods or vehicle bodies at medium and high speeds.
The suitable speed of moderate cracks: the vehicle speed has obvious vibration amplification effect, and there is a large impact risk in the middle and high-speed stage, so the suitable speed range is: 0.5–0.85 m/s.
The analysis of vibration characteristics under severe crack conditions is as follows: Severe cracks generally have large widths, depths or faults, and AGV cars are significantly impacted when passing through, which is the type of road surface that most affects AGV stability. The Z-axis vibration curve of the front wheel shows the following rules: an obvious single impact peak appears at 0.5 m/s, indicating that the severe crack still has a significant vertical impact even at low speed; when the speed is increased to 0.7 m/s, the vibration peak of the front wheel increases rapidly, and the Z-axis displacement is approximately abrupt. In the speed range of 0.85–1.15 m/s, the vibration curve shows a high-amplitude dense peak, with frequent and large-amplitude peak superposition, accompanied by significant oscillation of X and Y axes, and there is a clear risk of beating. The rear wheel vibration also shows a large irregular fluctuation, further indicating that severe cracks will significantly affect the stability of the vehicle. In the transverse direction: the X-axis vibration shows a large displacement change of ‘forward and backward’ type; the Y-axis vibration rises sharply in the middle and high-speed stage, indicating that the crack may force the AGV vehicle to produce lateral offset, which brings potential safety hazards.
The suitable speed of severe cracks: Under the condition of severe cracks, AGV should adopt a low-speed traffic strategy based on safety to avoid structural impact and lateral instability. Therefore, the suitable speed range is 0.5–0.7 m/s (less than 0.5 m/s if necessary), and the extreme or extremely deep cracks should be further decelerated or bypassed.
The experimental results show that the geometric characteristics of pavement cracks have a significant effect on the vibration response of AGV during driving. Compared with the crack length, the crack depth and width have a more significant effect on the vibration amplitude. This is because the depth and width of the crack directly determine the geometric mutation degree of the wheel-road contact interface. When the AGV passes through such areas, the wheel–ground normal force and contact stiffness change dramatically in a short period of time, thus stimulating stronger impact response. The results show that in engineering applications, the crack depth and width should be given priority as the key geometric parameters for pavement condition assessment and AGV driving risk judgment, providing a quantitative basis for the formulation of subsequent operation strategies. Further analysis of the vibration response characteristics in different directions shows that the vibration in the Z-axis direction of the AGV front wheel is most sensitive to the geometric changes in the cracks. The main reason is that the front wheel has first contact with the crack as the vehicle travels. At this time, the vertical impact has not been fully attenuated by the suspension system, which can more truly reflect the transient excitation caused by the geometric discontinuity of the road surface. From the perspective of vehicle dynamics, the excitation induced by cracks mainly acts on the wheel-road contact interface along the vertical direction, while the vibration responses in the X-axis and Y-axis directions are more affected by the driving control strategy and vehicle structure constraints, and the sensitivity to the geometric characteristics of cracks is relatively low. Therefore, in the actual engineering deployment, the crack impact monitoring and AGV stability evaluation index can be constructed based on the front wheel Z-axis vibration signal, which provides engineering basis for sensor layout and signal selection.
On this basis, the coupling effect of crack grade and AGV running speed on vibration response is further analyzed. The experimental results show that the vibration amplitude increases monotonically with the vehicle speed, and shows obvious accelerated growth characteristics under moderate and severe crack conditions, indicating that there is a significant coupling amplification effect between the geometric mutation of the crack and the vehicle speed. Under the condition of slight cracks, even if the AGV runs at a higher speed, its vibration response remains within a relatively controllable range; under moderate and severe crack conditions, higher operating speed will significantly amplify the vertical impact amplitude and increase the risk of structural fatigue and operational safety. Therefore, the results of this study support the hierarchical management of AGV running speed based on crack level in engineering practice, rather than adopting a unified speed strategy. Different crack levels correspond to different safe running speed intervals, which can provide direct decision-making basis for AGV speed control.
In summary, based on the three-axis vibration response law and the difference analysis of the front and rear wheels, the optimal operating speed range under different crack disease degrees is obtained as follows: due to the small vibration amplitude of the slight cracks, the speed influence is limited, so the suitable speed range is 0.7–1.15 m/s; due to the medium impact, the velocity amplification effect of moderate fracture is obvious, so the suitable velocity range is 0.5–0.85 m/s. The vertical impact of severe cracks is strong, and there is a risk of jumping at high-speed. Therefore, the appropriate speed range is 0.5–0.7 m/s, and cracks with extreme or abnormal depth should be further slowed down or detour. The basis for determining the above speed range is: under the corresponding crack level, the vibration response of AGV in this range remains low, and there is no obvious impact increase, so the stability constraint of vehicle operation is satisfied. This mapping relationship will provide an engineering-feasible way to transform the fracture perception results into an executable operation strategy.
The speed matching model proposed in this study can provide a quantitative basis for the safe driving of AGV under complex road conditions, which is of great significance to improve the robustness of autonomous navigation. The crack-vibration–velocity mapping relationship established in this section not only verifies the engineering effectiveness of the fine perception results of the previous cracks, but also provides a key intermediate layer for the AGV intelligent system to transform from the perception results to the control decision-making, and realizes the effective integration of multi-modal information at the engineering decision-making level.
6. Discussion
Although the proposed method shows good engineering applicability under experimental conditions, its application boundary still needs to be clarified. The current research mainly focuses on typical industrial park roads and medium-low speed AGV operation scenarios, and its applicability under extreme loads, complex road materials or high-speed operation conditions still needs to be further verified. At the same time, the verification of this paper is mainly based on the crack data set and AGV vibration test platform constructed in the laboratory. There are complex factors such as environmental illumination changes, road surface state differences, vehicle load fluctuations, and long-term operating state changes in the actual industrial environment. There are still some differences between the experimental conditions and the actual deployment scenarios. In addition, this method relies on high-quality image acquisition equipment and three-dimensional information acquisition equipment to ensure the accuracy of crack structure information extraction. In practical engineering applications, sensor performance, installation conditions and data quality fluctuations may affect the detection results. At the same time, this paper mainly focuses on the improvement of crack feature expression and instance segmentation performance, and has not yet carried out systematic computational resource consumption and real-time reasoning performance verification for the actual AGV vehicle computing platform.
Future research can further improve the adaptability of the model to complex environments based on the existing framework, and combine lightweight network design, model compression and calculation optimization strategies to make it better adapt to embedded platforms or AGV vehicle computing units to achieve more efficient online detection capabilities. At the same time, online sensing and real-time decision-making mechanisms can be introduced, and multi-vehicle collaboration and adaptive control strategies can be combined to further enhance the promotion and application potential of the method in complex engineering environments. The future work can be carried out from the following aspects:
Firstly, long-term tests can be carried out in more types of industrial scenarios, and a more comprehensive road condition–crack-vibration response database can be constructed by combining different pavement materials, complex working conditions and more types of ground defects (such as potholes, steps and uneven areas) to improve the generalization ability of the method. In addition, the speed-matching strategy proposed in this study can be combined with the path planning and control algorithm of AGV to form a dynamic and adaptive multi-scenario speed adjustment mechanism to further improve the safety and intelligence level of the vehicle in the actual scene.
In general, with the continuous development of sensors, computing platforms and intelligent algorithms, the framework proposed in this study still has a wide range of extension space. In the future, higher levels of application landing and performance improvement can be achieved in more complex and real industrial environments.
7. Conclusions
Aiming at the problems of ‘insufficient representation of crack structure, disconnection between perception results and AGV dynamics, and lack of closed-loop mechanism from detection to speed control’, this study constructs a multi-modal road condition cognition method system with ‘crack 3D reconstruction-geometric feature quantification-intelligent segmentation detection-vibration response analysis-speed optimization decision’ as the main line. High-precision three-dimensional point cloud is used to make up for the limitation of depth and scale in two-dimensional detection. The improved YOLO11-PCS is introduced to realize the fine instance segmentation of the fracture area. Based on the real triaxial vibration test, the quantitative coupling relationship between the geometric characteristics of the fracture and the vehicle impact response is revealed. Finally, a hierarchical speed matching strategy with vibration risk as constraint is formed. The system realizes the closed-loop integration from structural perception to decision optimization, provides a systematic technical path for the safe and adaptive operation of AGV under complex road conditions, constructs a road-disease perception and stability guarantee method for AGV, and realizes the systematic study of road cracks from structural characterization to vehicle dynamic response. The main conclusions of this paper are as follows:
- (1)
- High-precision structural characterization is achieved by quantifying the geometric features of cracks based on three-dimensional reconstruction.
In this paper, high-precision structured light scanner is used to collect point cloud of pavement cracks. After denoising, registration, meshing and other processing, a high-precision three-dimensional model of cracks is established. Combined with the geometric measurement software, the key parameters such as crack width, depth and surface area were extracted, and a quantitative index system for crack structure analysis was constructed. The research shows that the three-dimensional reconstruction can effectively make up for the problem that the two-dimensional image does not reflect the crack depth and the real size, and provides a reliable data basis for the subsequent crack classification. Based on the geometric parameters obtained by three-dimensional reconstruction, this paper divides the cracks into three grades: slight cracks, moderate cracks and severe cracks according to the crack width and surface damage degree. The classification matches the actual disease severity of the project, and shows obvious response differences in the vibration experiment, which lays a foundation for studying the quantitative correlation between crack structure characteristics–vehicle vibration response.
- (2)
- The improved YOLO11-PCS model improves the accuracy of crack detection and instance segmentation.
Aiming at the characteristics of fuzzy boundary and complex shape of pavement cracks, this paper improves the structure of YOLO11 model, introduces Dysample dynamic upsampling module, C3k2_Mix multi-scale hybrid structure module and DLKA large convolution kernel attention mechanism, and constructs YOLO11-PCS crack instance segmentation model. The experimental results show that the Mask-mAP, accuracy and recall rate of the model are significantly improved compared with the benchmark model, especially in the boundary extraction of slight cracks and irregular cracks, which can provide more accurate crack area information for subsequent vibration analysis.
- (3)
- There is a significant coupling relationship between the geometric characteristics of cracks and the vibration response of AGV.
By constructing the AGV three-axis vibration acquisition experimental platform, this paper systematically analyzes the influence of different crack types and vehicle speed on the stability of AGV operation. The experimental results show that the Z-axis (vertical) vibration displacement can best reflect the crack excitation intensity and is the core index to evaluate the vehicle impact risk. The vibration amplitude of the front wheel is larger than that of the rear wheel, which is more sensitive to the impact caused by the crack. The higher the crack grade is, the larger the vibration peak and pulse amplitude are, and the severe cracks even produce the ‘forward and backward’ response with obvious impact characteristics. The vehicle speed is significantly positively correlated with the vibration amplitude, and the impact on moderate and severe cracks in the medium and high-speed stage is nonlinearly amplified. The results verify the key influence of crack structure characteristics in the study of AGV dynamic response.
- (4)
- A road condition–speed matching model that can effectively improve the stability of AGV driving is constructed.
Based on crack classification, accurate segmentation results and vibration response analysis, this paper proposes a hierarchical speed matching strategy for AGV. The research shows that for slight cracks, AGV can run smoothly in the range of 0.7–1.15 m/s; for moderate cracks, the suitable speed is 0.5–0.85 m/s; for severe cracks, it is recommended to control the speed at 0.5–0.7 m/s or lower to avoid large impact. The model can provide quantitative basis for AGV path planning, speed control and safe driving, and has clear engineering application value.
Finally, this paper constructs a comprehensive research framework including three-dimensional reconstruction, geometric quantification, intelligent recognition, vibration acquisition and speed matching, and realizes the deep integration of pavement crack detection and AGV stability guarantee. This framework breaks through the limitations of traditional methods that only rely on images or only rely on vibration signals, and forms a complete AGV road condition adaptability evaluation system from structural perception to decision optimization, which provides theoretical basis and technical support for the autonomous and safe operation of AGV in intelligent logistics scenarios.
From the perspective of engineering system, the method proposed in this paper is not an isolated crack detection or vibration analysis module, but a multi-modal perception–analysis–decision closed-loop process for AGV actual operation is constructed. The process obtains fine geometric information of cracks through visual segmentation and three-dimensional point cloud reconstruction, and further maps it to the AGV vibration response analysis and speed decision module, which realizes the direct correlation from road state perception to operation strategy adjustment. The outputs of each module are quantifiable parameters, which can be directly used as the input of AGV control or scheduling system, thereby reducing the dependence of manual experience in operation decision-making and improving the automation and intelligence level of the system.
Author Contributions
Conceptualization, P.C., Y.Y. and C.Z.; methodology, P.C.; software, P.C.; validation, P.C., C.Z. and X.Z.; formal analysis, P.C.; investigation, P.C., C.Z. and X.Z.; resources, Y.Y.; data curation, P.C. and J.L.; writing—original draft preparation, P.C.; writing—review and editing, Y.Y., C.Z. and X.L.; visualization, C.Z., X.Z. and Y.L.; supervision, Y.Y.; project administration, Y.Y.; funding acquisition, Y.Y. All authors have read and agreed to the published version of the manuscript.
Funding
This work was supported by National Natural Science Foundation of China (Grant Nos. 52304143, 52574198), Shandong Province Higher Education Institutions Youth Innovation Team Development Program (Science and Technology Category) (Grant No. 2024KJH061), Young Talent of Lifting engineering for Science and Technology in Shandong (Grant No. SDAST2025QTA055), Jining City key research and development project (2024KJHZ010).
Data Availability Statement
The datasets generated during and/or analyzed during the current study are available from the corresponding author on reasonable request.
Conflicts of Interest
The authors declare no conflicts of interest.
References
- Meng, A.; Zhang, X.; Yu, X.; Jia, L.; Sun, Z.; Guo, L.; Yang, H. Investigation on lightweight identification method for pavement cracks. Constr. Build. Mater. 2024, 447, 138017. [Google Scholar] [CrossRef] [Scilit]
- Liu, J.; Yang, X.; Lau, S.; Wang, X.; Luo, S.; Lee, V.C.S.; Ding, L. Automated pavement crack detection and segmentation based on two-step convolutional neural network. Comput.-Aided Civ. Infrastruct. Eng. 2020, 35, 1291–1305. [Google Scholar] [CrossRef] [Scilit]
- Sun, X.; Xie, Y.; Jiang, L.; Cao, Y.; Liu, B. DMA-Net: DeepLab with multi-scale attention for pavement crack segmentation. IEEE Trans. Intell. Transp. Syst. 2022, 23, 18392–18403. [Google Scholar] [CrossRef] [Scilit]
- Liu, Y.; Ye, S.; Wang, J.; Xiao, Q.; Zhu, L. Deep supervised pavement crack segmentation algorithm based on multi-scale attention and feature fusion. J. Optoelectron. Laser 2025, 36, 1140. [Google Scholar]
- Guo, F.; Liu, J.; Lv, C.; Yu, H. A novel transformer-based network with attention mechanism for automatic pavement crack detection. Constr. Build. Mater. 2023, 391, 131852. [Google Scholar] [CrossRef] [Scilit]
- Guo, F.; Liu, J.; Xie, Q.; Yu, H. A two-stage framework for pixel-level pavement surface crack detection. Eng. Appl. Artif. Intell. 2024, 133, 108312. [Google Scholar] [CrossRef] [Scilit]
- Zhang, W.; Zhong, J.; Yu, J.; Li, Z.; Liu, Y. Research on pavement crack detection technology based on machine learning and image processing. J. Cent. South Univ. (Nat. Sci. Ed.) 2021, 52, 2402–2415. [Google Scholar]
- Fu, Q.; Bu, F.; Ren, H.; Gong, J. Pavement crack object detection based on deep learning methods. Highway 2023, 68, 395–405. [Google Scholar]
- Guo, F.; Qian, Y.; Liu, J.; Yu, H. Pavement crack detection based on transformer network. Autom. Constr. 2023, 145, 104646. [Google Scholar] [CrossRef] [Scilit]
- Fan, L.; Li, S.; Li, Y.; Li, B.; Cao, D.; Wang, F.Y. Pavement cracks coupled with shadows: A new shadow-crack dataset and a shadow-removal-oriented crack detection approach. IEEE/CAA J. Autom. Sin. 2023, 10, 1593–1607. [Google Scholar] [CrossRef] [Scilit]
- Zhai, J.; Sun, Z.; Huyan, J.; Yang, H.; Li, W. Automatic pavement crack detection using multimodal features fusion deep neural network. Int. J. Pavement Eng. 2023, 24, 2086692. [Google Scholar] [CrossRef] [Scilit]
- Yu, H.; Deng, Y.; Guo, F. Real-time pavement surface crack detection based on lightweight semantic segmentation model. Transp. Geotech. 2024, 48, 101335. [Google Scholar] [CrossRef] [Scilit]
- Al-Huda, Z.; Peng, B.; Algburi, R.N.A.; Al-antari, M.A.; Al-Jarazi, R.; Zhai, D. A hybrid deep learning pavement crack semantic segmentation. Eng. Appl. Artif. Intell. 2023, 122, 106142. [Google Scholar] [CrossRef] [Scilit]
- Jiang, J.; Li, P.; Wang, J.; Chen, H.; Zhang, T. Asphalt pavement crack detection based on infrared thermography and deep learning. Int. J. Pavement Eng. 2024, 25, 2295906. [Google Scholar] [CrossRef] [Scilit]
- Yang, L.; Ma, M.; Wu, Z.; Liu, Y. A global-local fusion model via edge enhancement and transformer for pavement crack defect segmentation. IEEE Trans. Intell. Transp. Syst. 2024, 26, 1964–1981. [Google Scholar] [CrossRef] [Scilit]
- Ma, D.; Fang, H.; Wang, N.; Zhang, C.; Dong, J.; Hu, H. Automatic detection and counting system for pavement cracks based on PCGAN and YOLO-MF. IEEE Trans. Intell. Transp. Syst. 2022, 23, 22166–22178. [Google Scholar] [CrossRef] [Scilit]
- Dong, Q.; Wang, S.; Chen, X.; Jiang, W.; Li, R.; Gu, X. Pavement crack detection based on point cloud data and data fusion. Philos. Trans. R. Soc. A 2023, 381, 20220165. [Google Scholar] [CrossRef] [Scilit] [PubMed]
- Sabouri, M.; Sepidbar, A. U-Net-based integrated framework for pavement crack detection and zone-based scoring. Int. J. Pavement Eng. 2024, 25, 2308183. [Google Scholar] [CrossRef] [Scilit]
- Zhang, M.; Zhong, J.; Zhou, C.; Jia, X.; Zhu, X.; Huang, B. Deep learning-driven pavement crack analysis: Autoencoder-enhanced crack feature extraction and structure classification. Eng. Appl. Artif. Intell. 2024, 132, 107949. [Google Scholar] [CrossRef] [Scilit]
- Fu, G.; Wang, H.; Zhao, Y.; Yu, Z.; Li, Q. Non-destructive evaluation of longitudinal cracking in semi-rigid asphalt pavements using FWD deflection data. Struct. Control Health Monit. 2022, 29, e3050. [Google Scholar] [CrossRef] [Scilit]
- Liu, H.; Yang, C.; Li, A.; Huang, S.; Feng, X.; Ruan, Z.; Ge, Y. Deep domain adaptation for pavement crack detection. IEEE Trans. Intell. Transp. Syst. 2022, 24, 1669–1681. [Google Scholar] [CrossRef] [Scilit]
- Wen, X.; Li, S.; Yu, H.; He, Y. Multi-scale context feature and cross-attention network-enabled system and software-based for pavement crack detection. Eng. Appl. Artif. Intell. 2024, 127, 107328. [Google Scholar] [CrossRef] [Scilit]
- Liu, Z.; Gu, X.; Chen, J.; Wang, D.; Chen, Y.; Wang, L. Automatic recognition of pavement cracks from combined GPR B-scan and C-scan images using multiscale feature fusion deep neural networks. Autom. Constr. 2023, 146, 104698. [Google Scholar] [CrossRef] [Scilit]
- Wu, Z.; Tang, Y.; Hong, B.; Liang, B.; Liu, Y. Enhanced precision in dam crack width measurement: Leveraging advanced lightweight network identification for pixel-level accuracy. Int. J. Intell. Syst. 2023, 2023, 9940881. [Google Scholar] [CrossRef] [Scilit]
- Chu, H.; Wang, W.; Deng, L. Tiny-Crack-Net: A multiscale feature fusion network with attention mechanisms for segmentation of tiny cracks. Comput.-Aided Civ. Infrastruct. Eng. 2022, 37, 1914–1931. [Google Scholar] [CrossRef] [Scilit]
- Tran, T.S.; Nguyen, S.D.; Lee, H.J.; Tran, V.P. Advanced crack detection and segmentation on bridge decks using deep learning. Constr. Build. Mater. 2023, 400, 132839. [Google Scholar] [CrossRef] [Scilit]
- Kang, D.; Benipal, S.S.; Gopal, D.L.; Cha, Y.J. Hybrid pixel-level concrete crack segmentation and quantification across complex backgrounds using deep learning. Autom. Constr. 2020, 118, 103291. [Google Scholar] [CrossRef] [Scilit]
- Qiu, Q.; Lau, D. Real-time detection of cracks in tiled sidewalks using YOLO-based method applied to unmanned aerial vehicle (UAV) images. Autom. Constr. 2023, 147, 104745. [Google Scholar] [CrossRef] [Scilit]
- Ye, W.; Ren, J.; Zhang, A.A.; Lu, C. Automatic pixel-level crack detection with multi-scale feature fusion for slab tracks. Comput.-Aided Civ. Infrastruct. Eng. 2023, 38, 2648–2665. [Google Scholar] [CrossRef] [Scilit]
- Hu, K.; Chen, Z.; Kang, H.; Tang, Y. 3D vision technologies for a self-developed structural external crack damage recognition robot. Autom. Constr. 2024, 159, 105262. [Google Scholar] [CrossRef] [Scilit]
- Fei, Y.; Wang, K.C.; Zhang, A.; Chen, C.; Li, J.Q.; Liu, Y.; Li, B. Pixel-level cracking detection on 3D asphalt pavement images through deep-learning-based CrackNet-V. IEEE Trans. Intell. Transp. Syst. 2019, 21, 273–284. [Google Scholar] [CrossRef] [Scilit]
- Zhang, A.; Wang, K.C.; Li, B.; Yang, E.; Dai, X.; Peng, Y.; Chen, C. Automated pixel-level pavement crack detection on 3D asphalt surfaces using a deep-learning network. Comput.-Aided Civ. Infrastruct. Eng. 2017, 32, 805–819. [Google Scholar] [CrossRef] [Scilit]
- Zhang, A.; Wang, K.C.; Fei, Y.; Liu, Y.; Chen, C.; Yang, G.; Qiu, S. Automated pixel-level pavement crack detection on 3D asphalt surfaces with a recurrent neural network. Comput.-Aided Civ. Infrastruct. Eng. 2019, 34, 213–229. [Google Scholar] [CrossRef] [Scilit]
- Pan, Z.; Guan, J.; Yang, X.; Fan, K.; Ong, J.C.; Guo, N.; Wang, X. One-stage 3D profile-based pavement crack detection and quantification. Autom. Constr. 2023, 153, 104946. [Google Scholar] [CrossRef] [Scilit]
- Dong, J.; Wang, N.; Fang, H.; Lu, H.; Ma, D.; Hu, H. Automatic augmentation and segmentation system for three-dimensional point cloud of pavement potholes by fusion convolution and transformer. Adv. Eng. Inform. 2024, 60, 102378. [Google Scholar] [CrossRef] [Scilit]
- Ali, M.; Malek, K.; Mojidra, R.; Li, J.; Bennett, C.; Collins, W.; Moreu, F. Augmented reality-computer vision combination for automatic fatigue crack detection and localization. Comput. Ind. 2023, 149, 103936. [Google Scholar] [CrossRef] [Scilit]
- Cao, T.; Wang, Y.; Liu, S. Pavement crack detection based on 3D edge representation and data communication with digital twins. IEEE Trans. Intell. Transp. Syst. 2022, 24, 7697–7706. [Google Scholar] [CrossRef] [Scilit]
- Qiu, X.; Zhang, T.F.; Tao, J.Q.; Liang, Y. Research on pavement crack segmentation based on CNN fusion of two-dimensional and three-dimensional image features. J. Zhejiang Norm. Univ. (Nat. Sci.) 2026, 49, 33–44. [Google Scholar] [CrossRef]
- Yang, Y.; Xu, Z.C. Highway crack segmentation method based on multimodal feature fusion. Transp. Sci. Technol. 2026, 3, 130–135. [Google Scholar]
- Wang, Z.L.; Yang, J.P.; Shi, K.; Xu, H.; Qiu, F.Q.; Yang, Y.B. Recent advances in researches on vehicle scanning method for bridges. Int. J. Struct. Stab. Dyn. 2022, 22, 2230005. [Google Scholar] [CrossRef] [Scilit]
- Shi, H.; Zeng, J.; Guo, J. Disturbance observer-based sliding mode control of active vertical suspension for high-speed rail vehicles. Veh. Syst. Dyn. 2024, 62, 2912–2935. [Google Scholar] [CrossRef] [Scilit]
- Jin, X.; Wang, J.; He, X.; Yan, Z.; Xu, L.; Wei, C.; Yin, G. Improving vibration performance of electric vehicles based on in-wheel motor-active suspension system via robust finite frequency control. IEEE Trans. Intell. Transp. Syst. 2023, 24, 1631–1643. [Google Scholar] [CrossRef] [Scilit]
- Han, X.; Liu, C.; Zhou, Y.; Tan, K.; Dong, Z.; Yang, B. WHU-Urban3D: An urban scene LiDAR point cloud dataset for semantic instance segmentation. ISPRS J. Photogramm. Remote Sens. 2024, 209, 500–513. [Google Scholar] [CrossRef] [Scilit]
- Guo, Z.; Deng, H.F. Research on reverse modeling of blade products based on Geomagic. Mod. Mach. 2023, 3, 71–74. [Google Scholar]
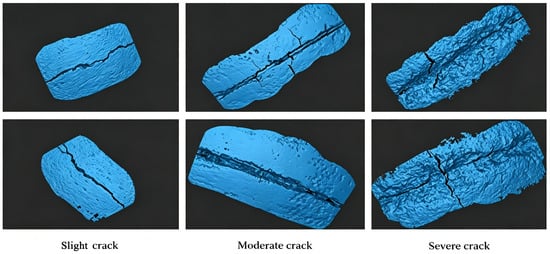
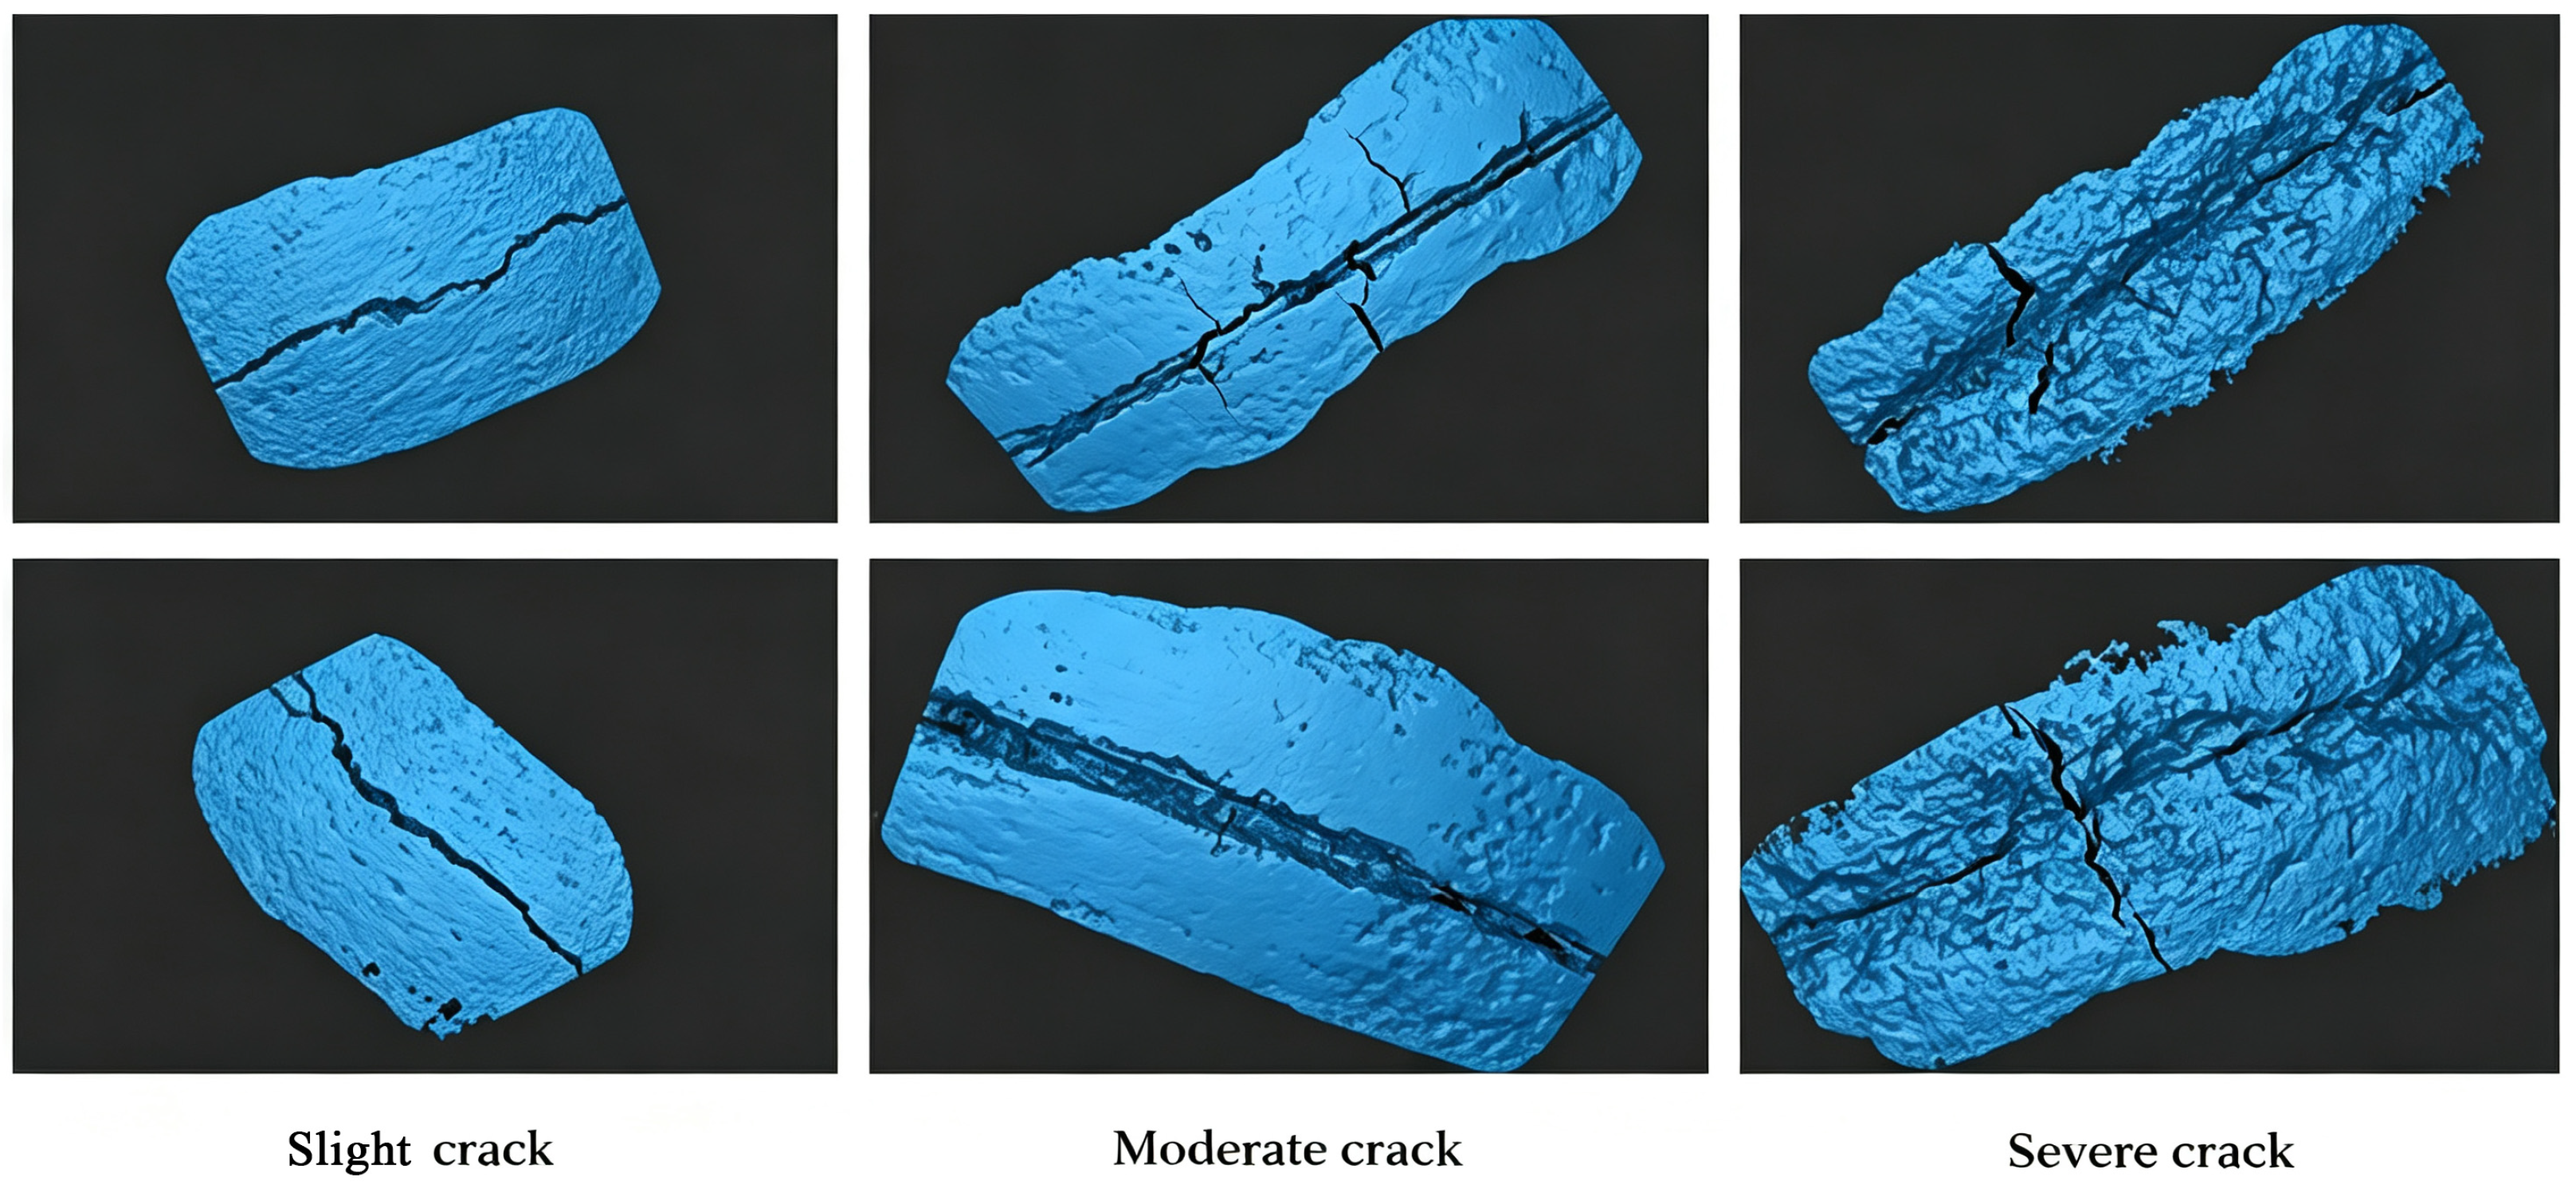
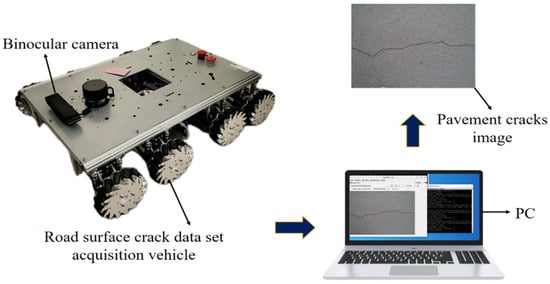
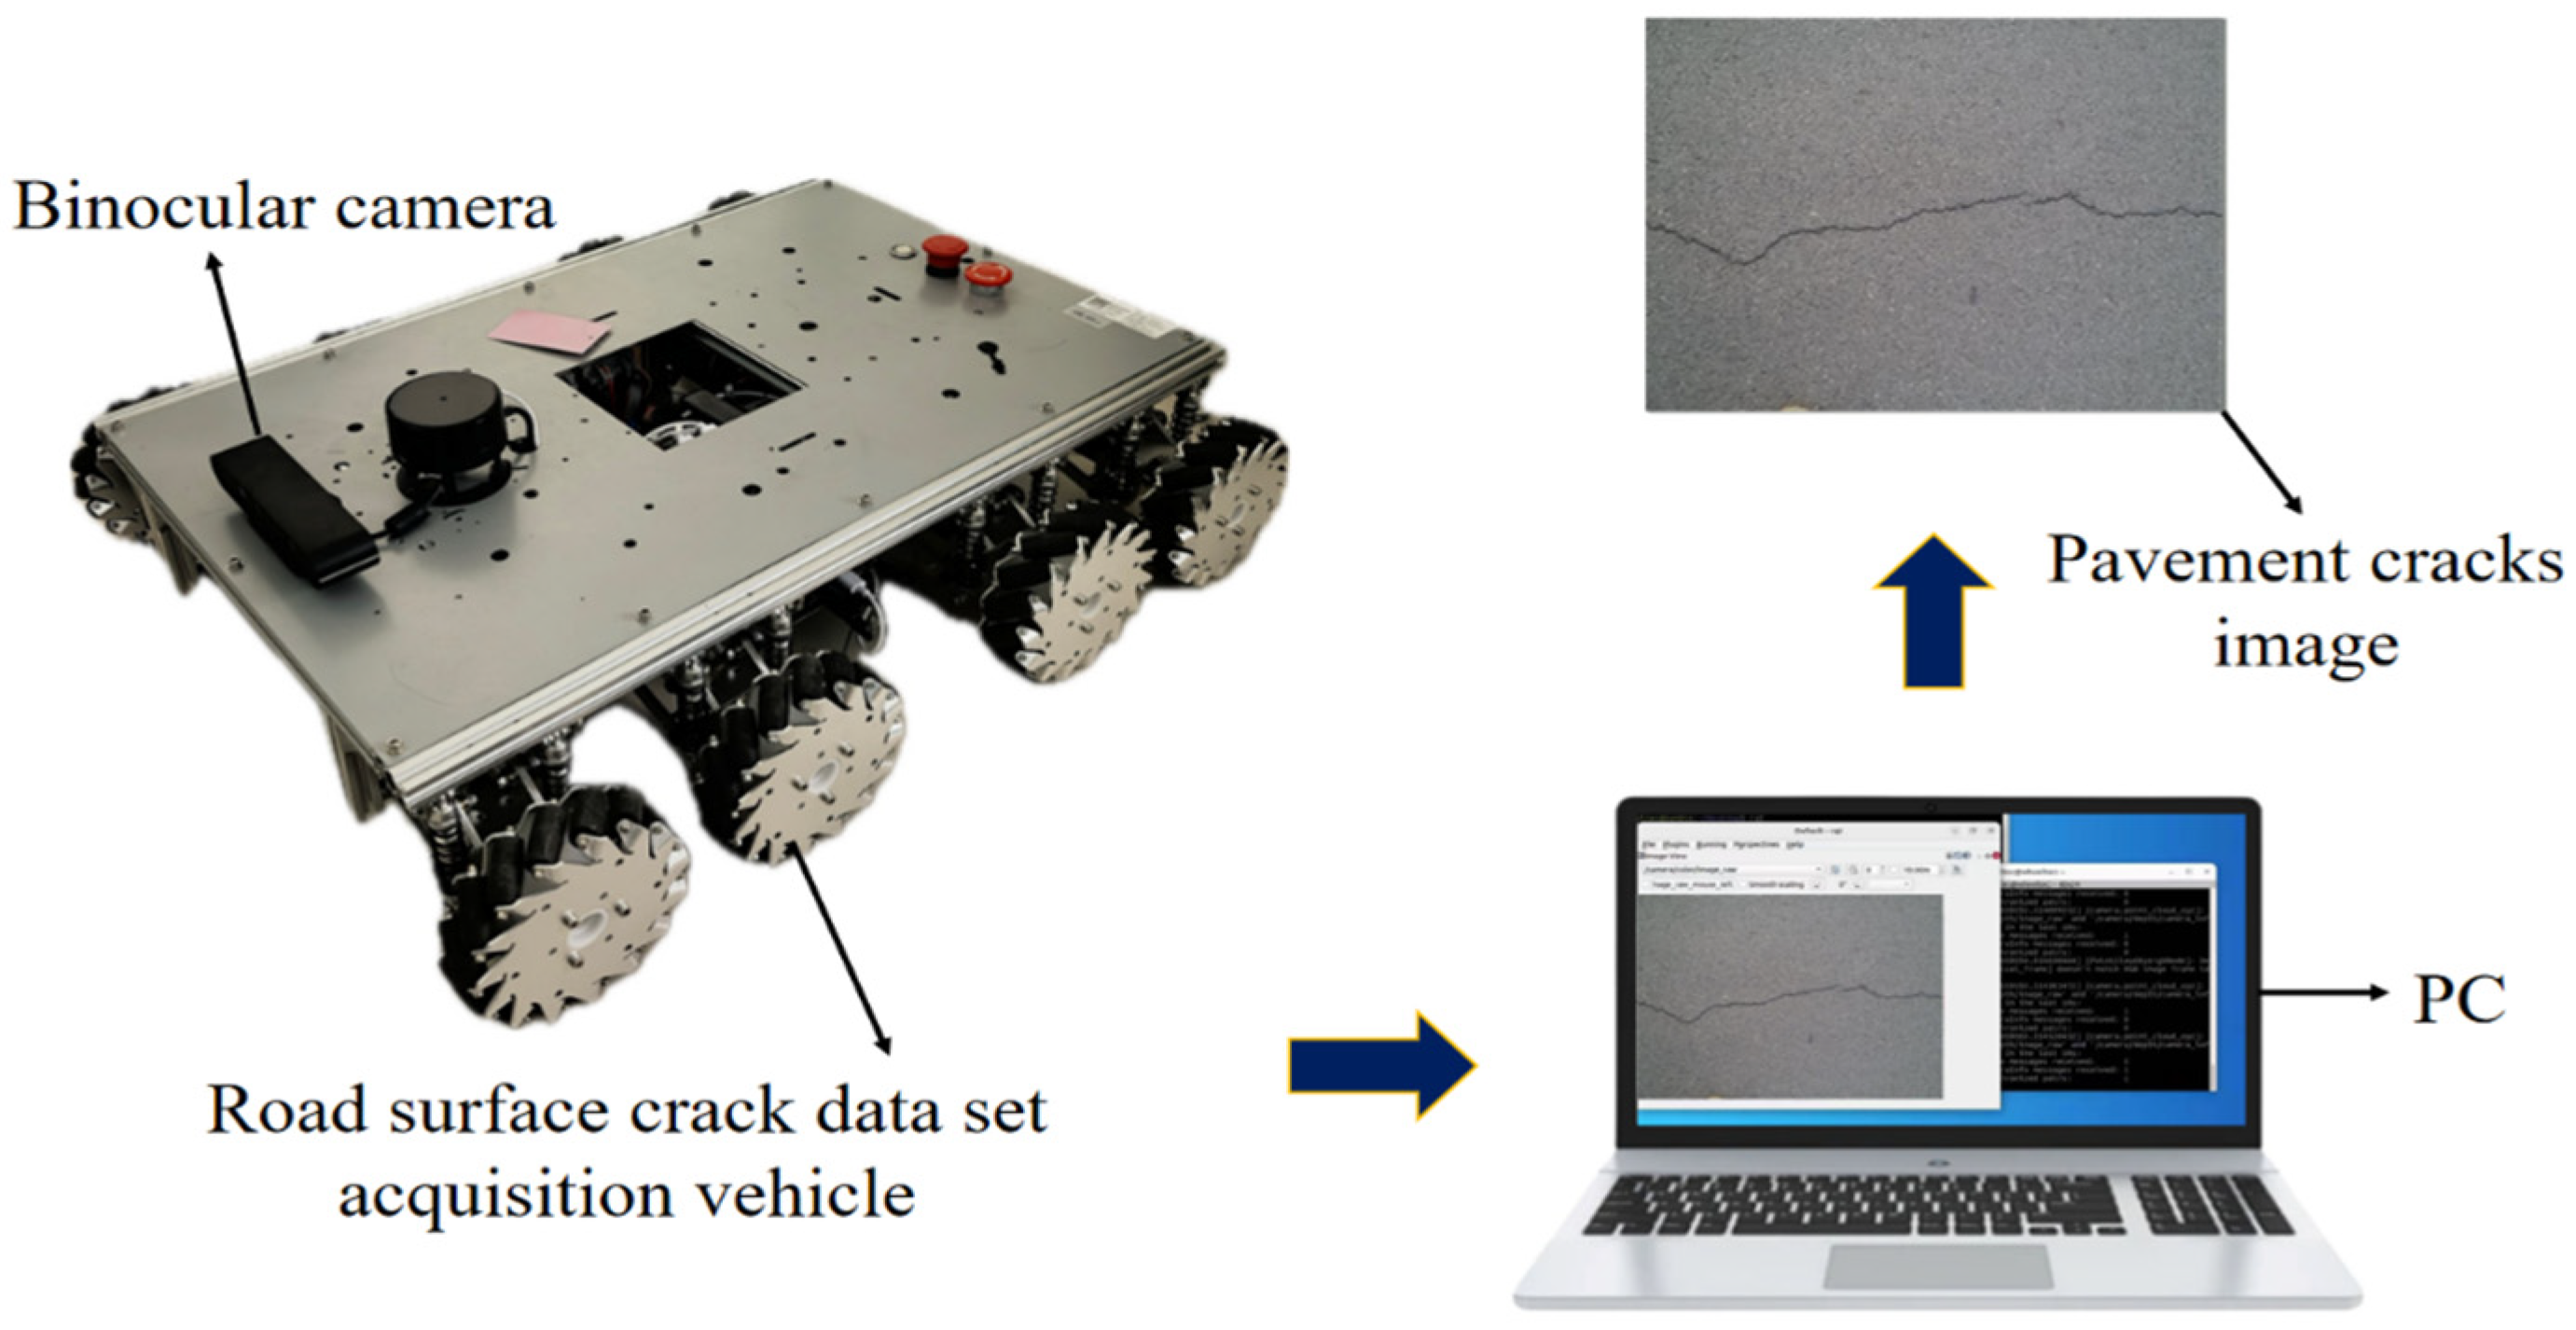
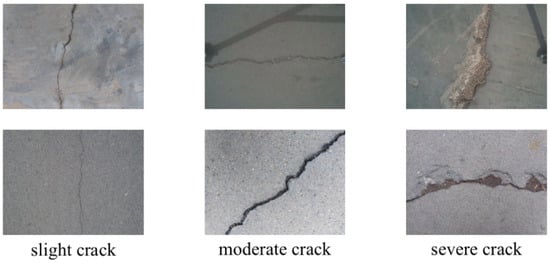
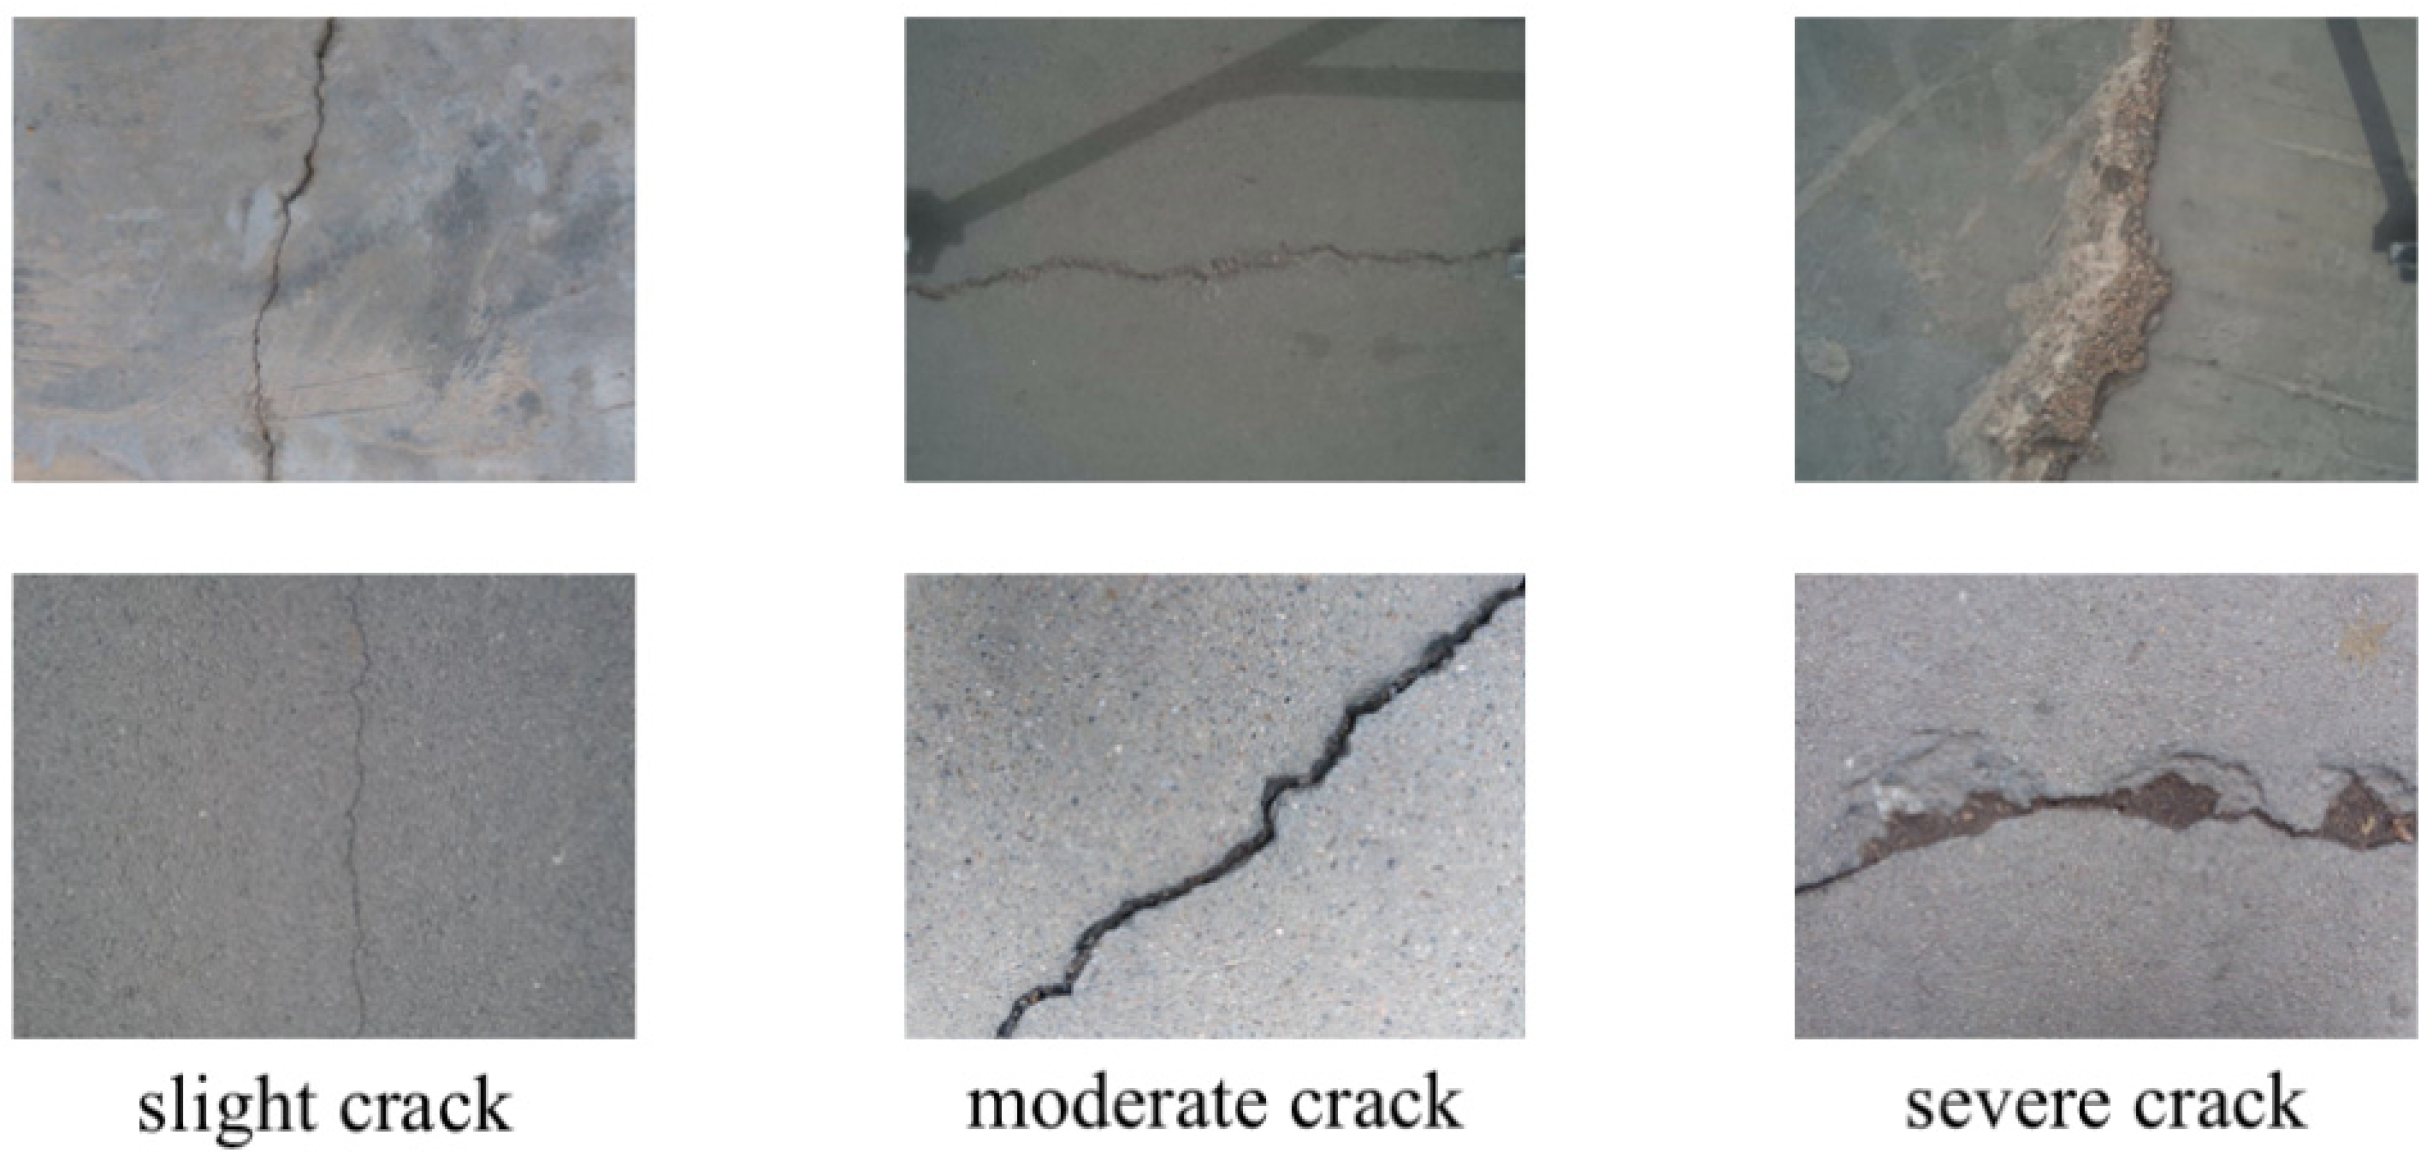
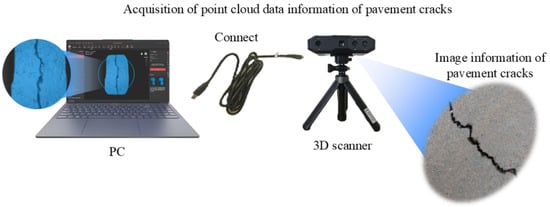
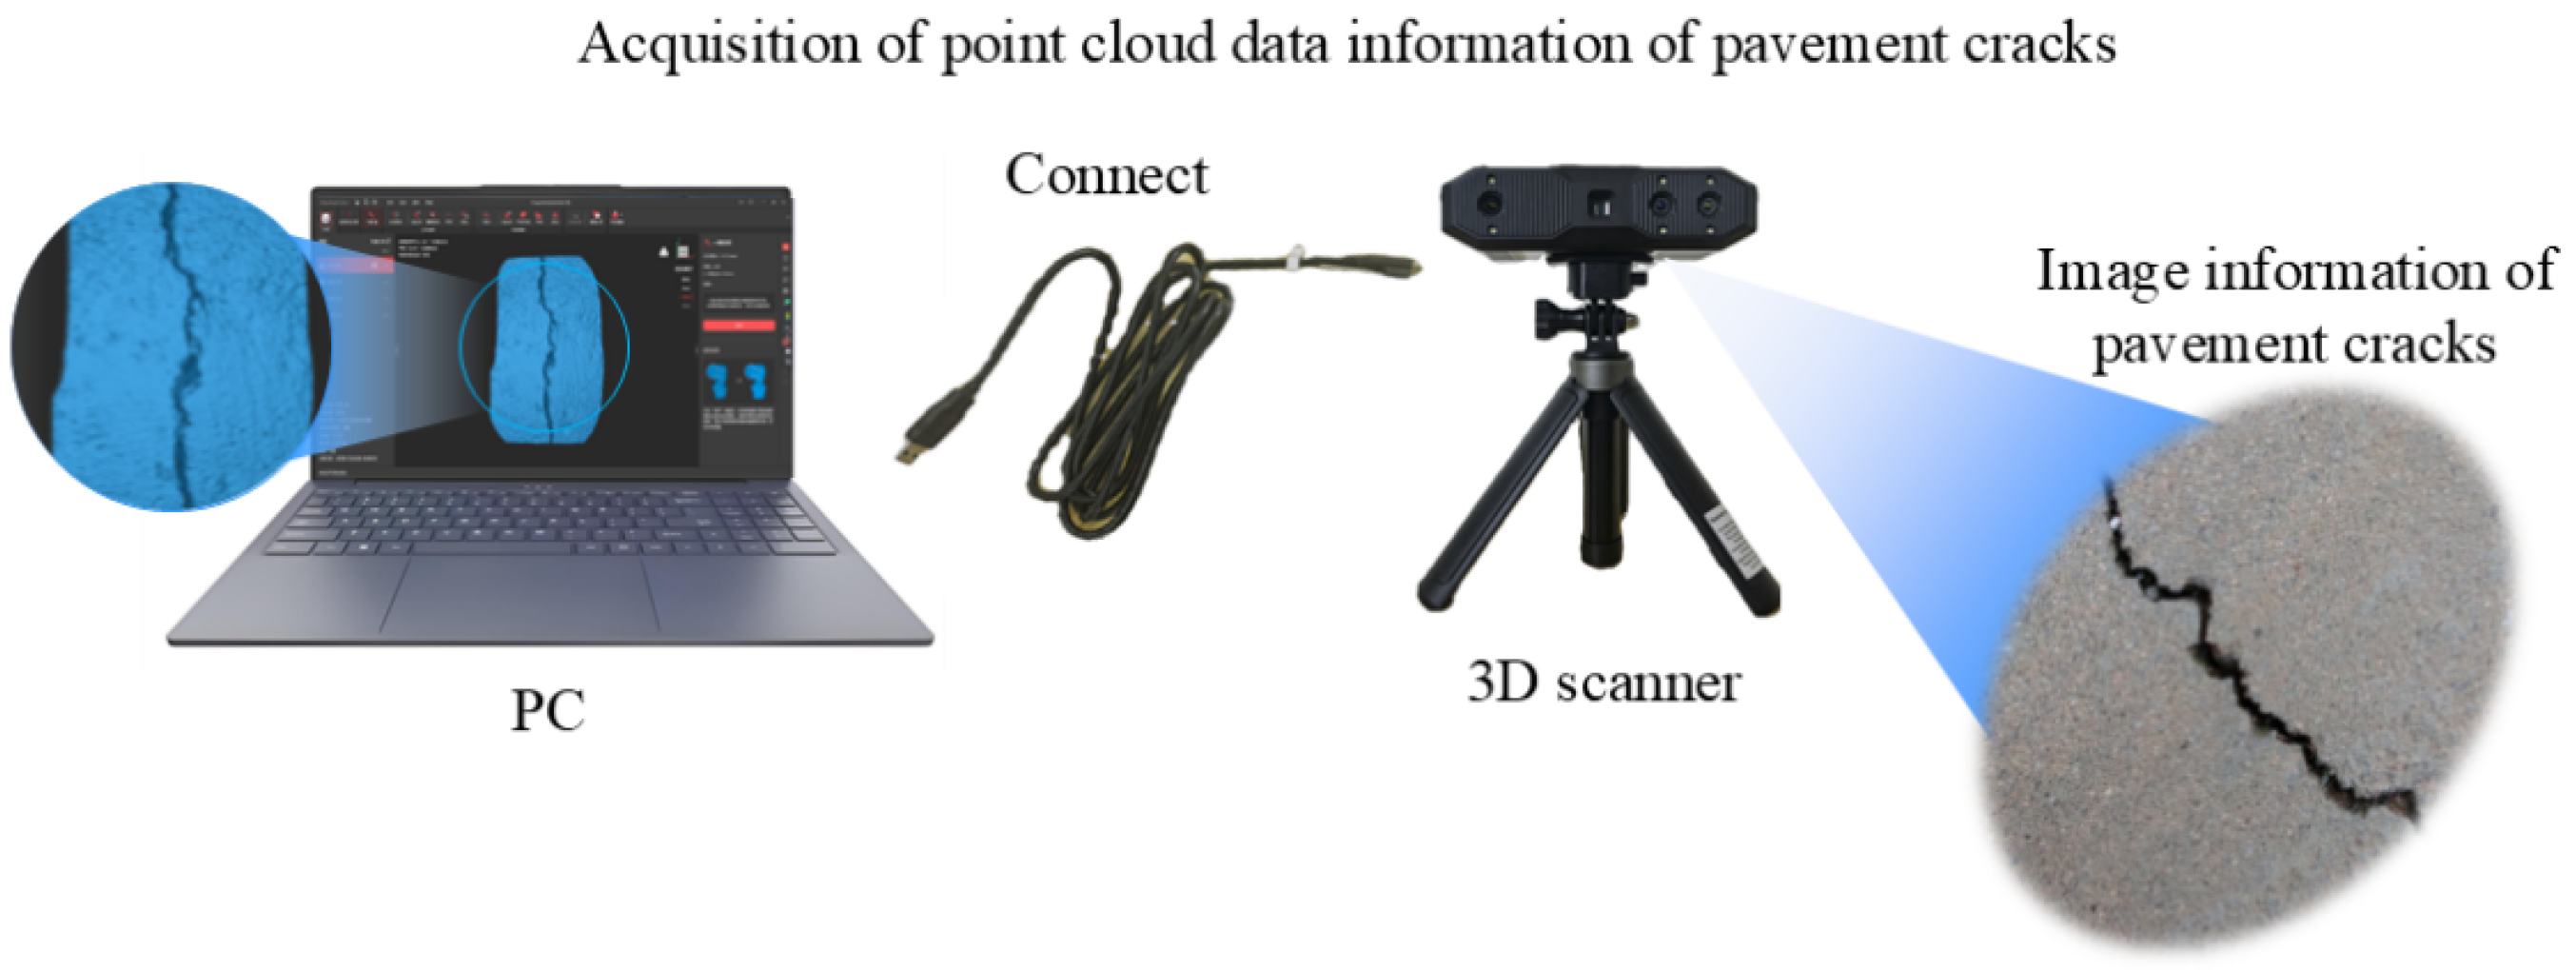
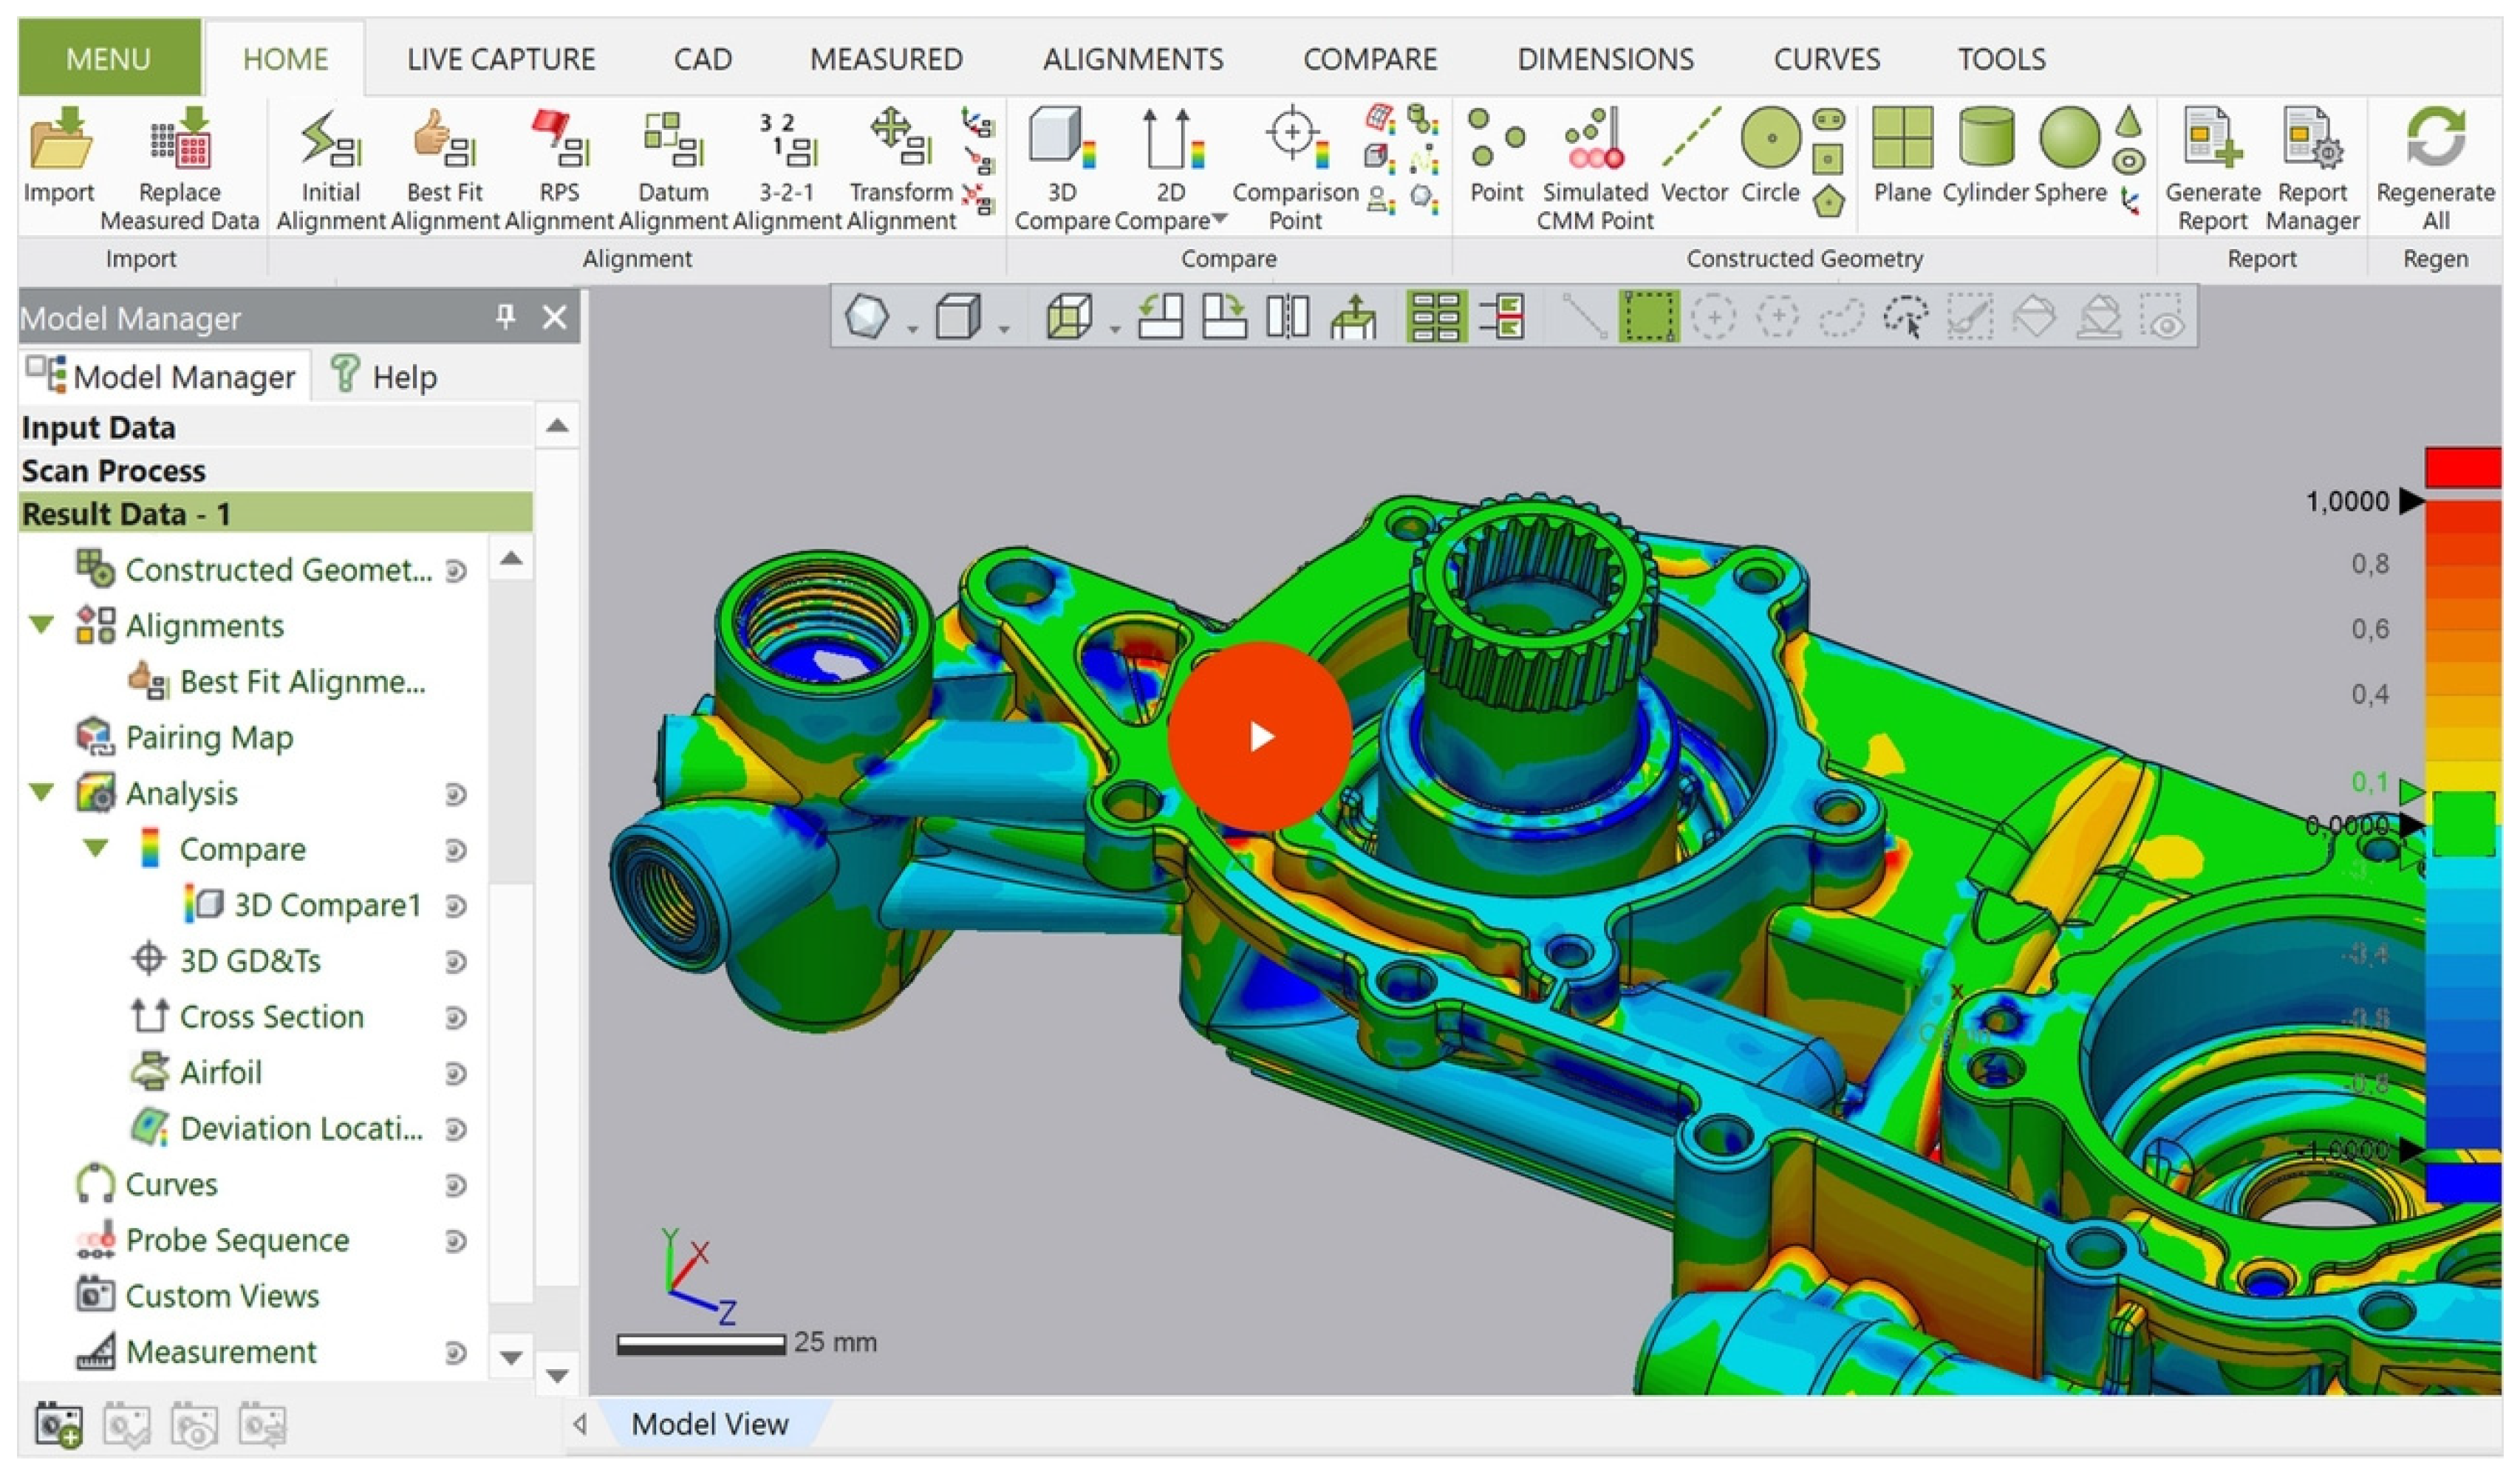
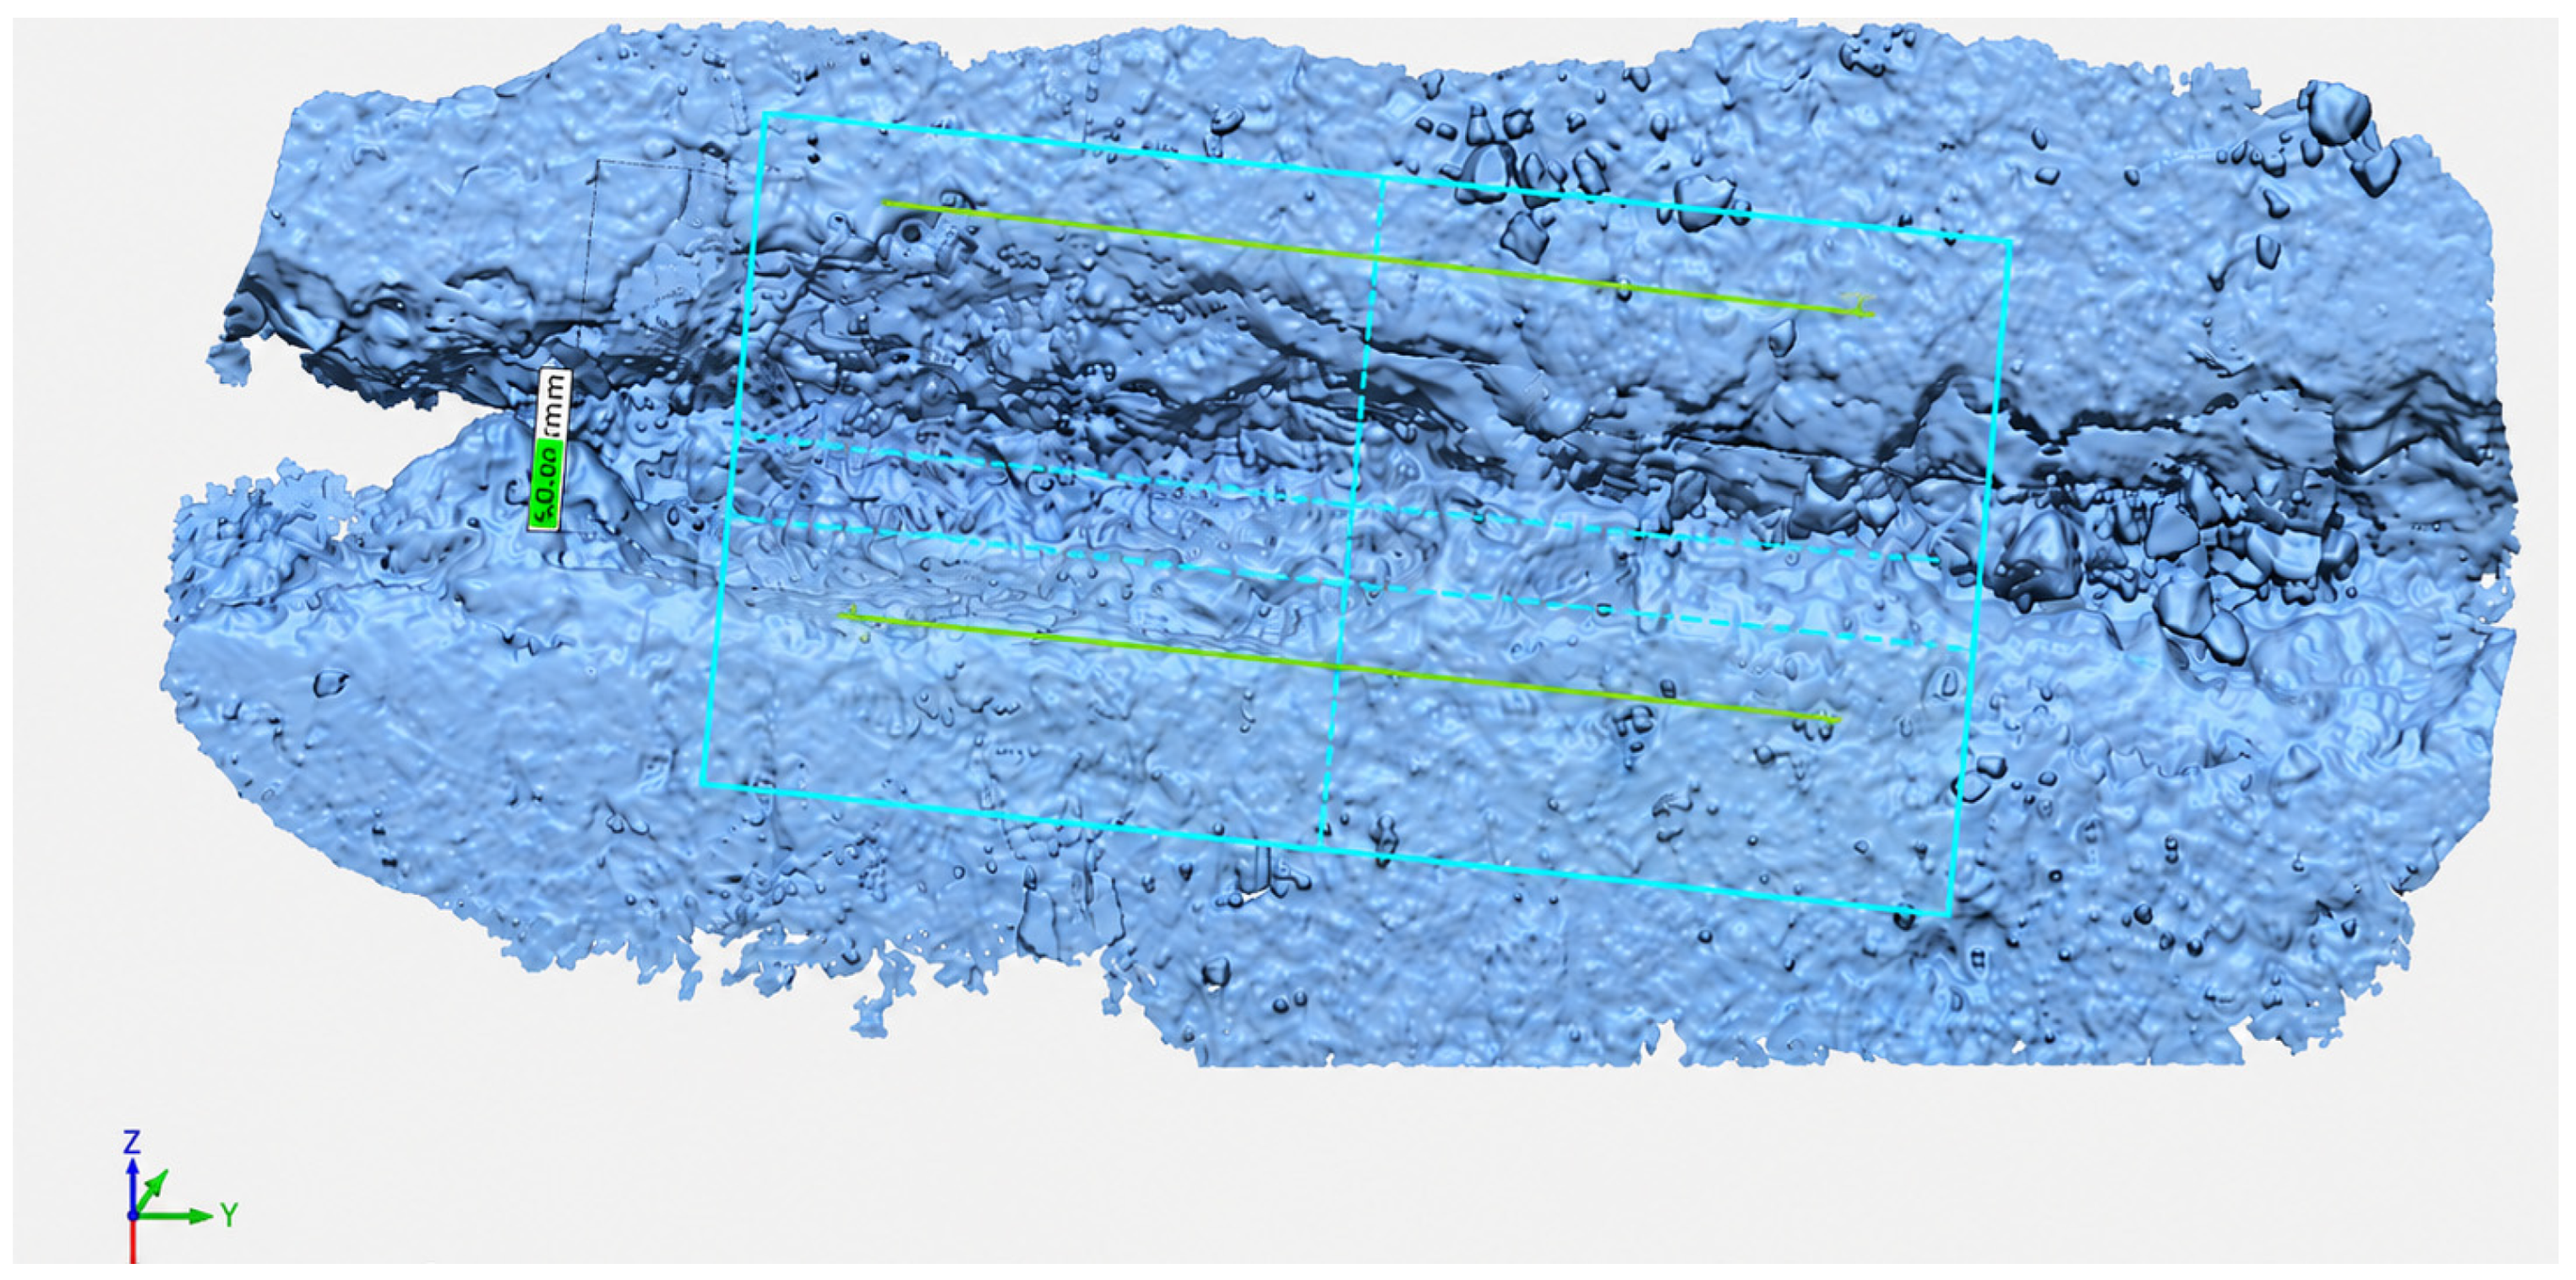
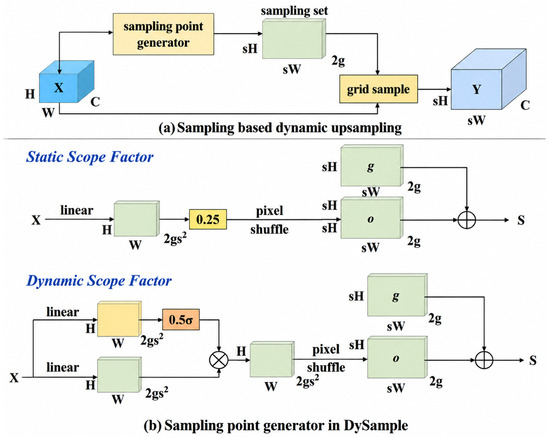
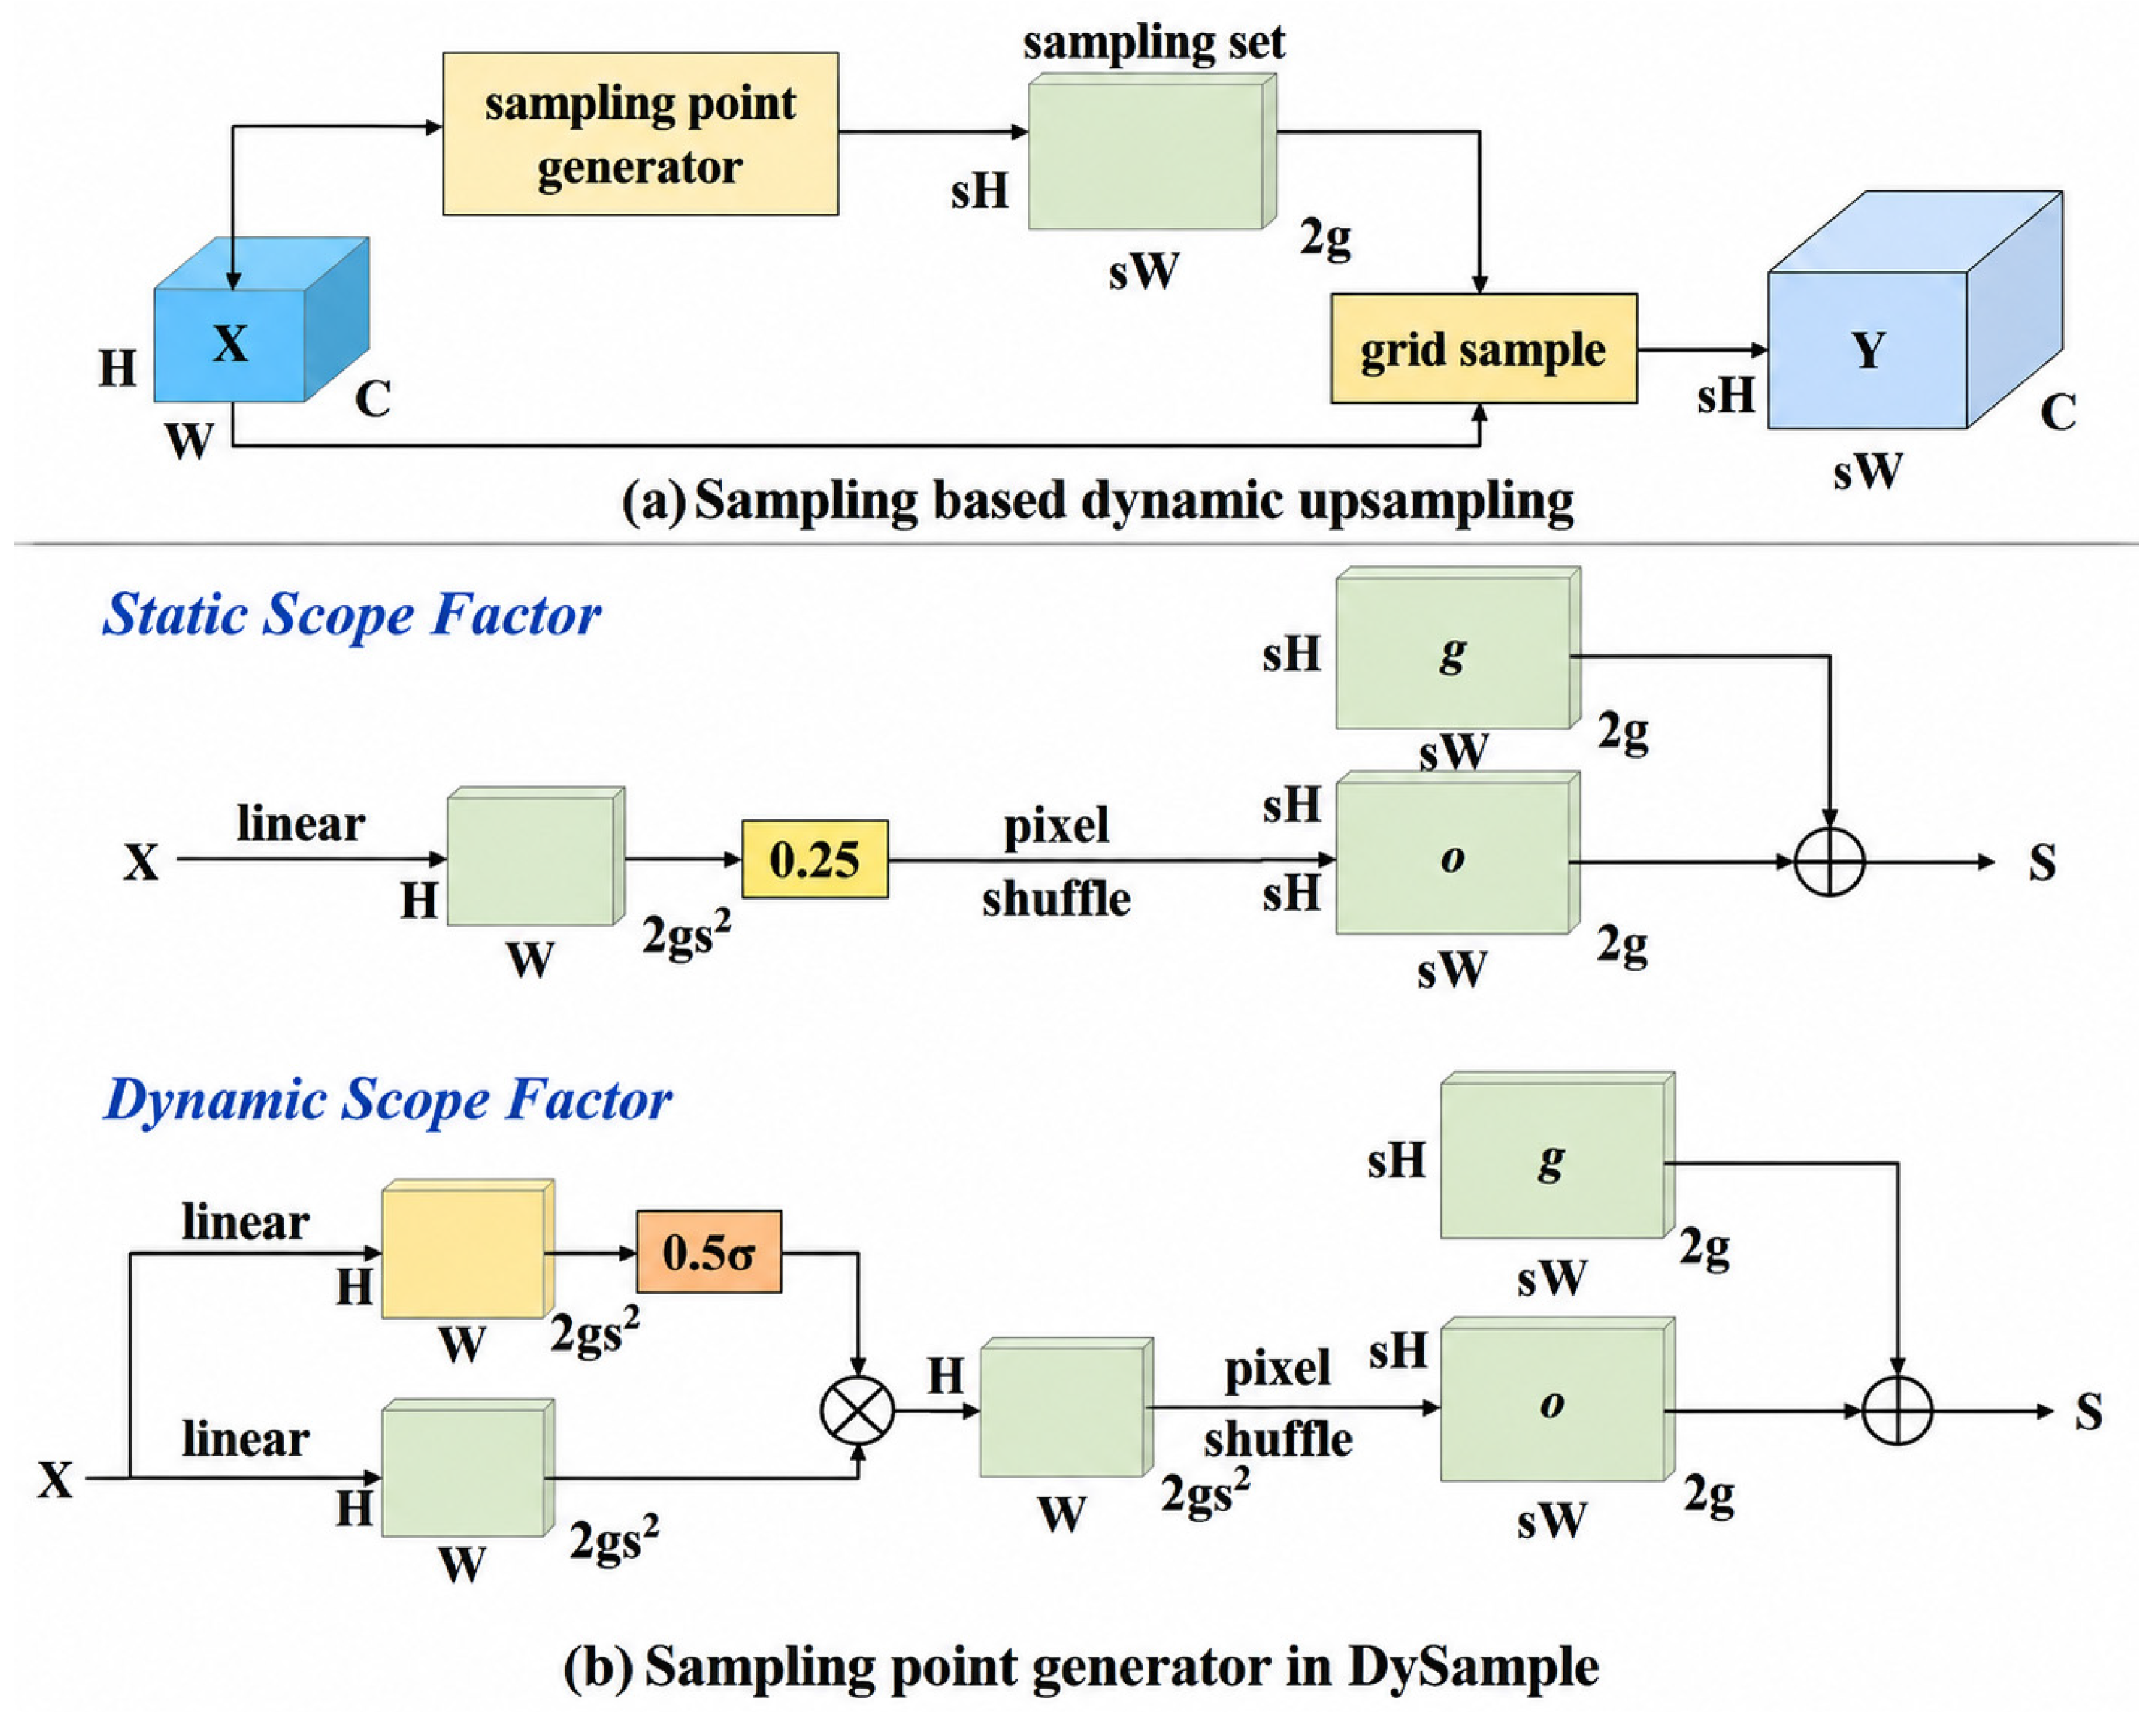
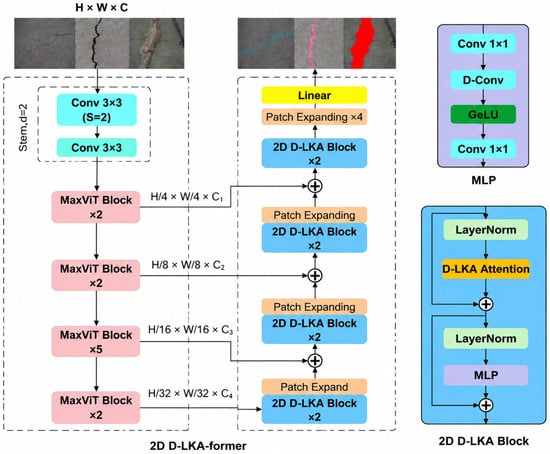
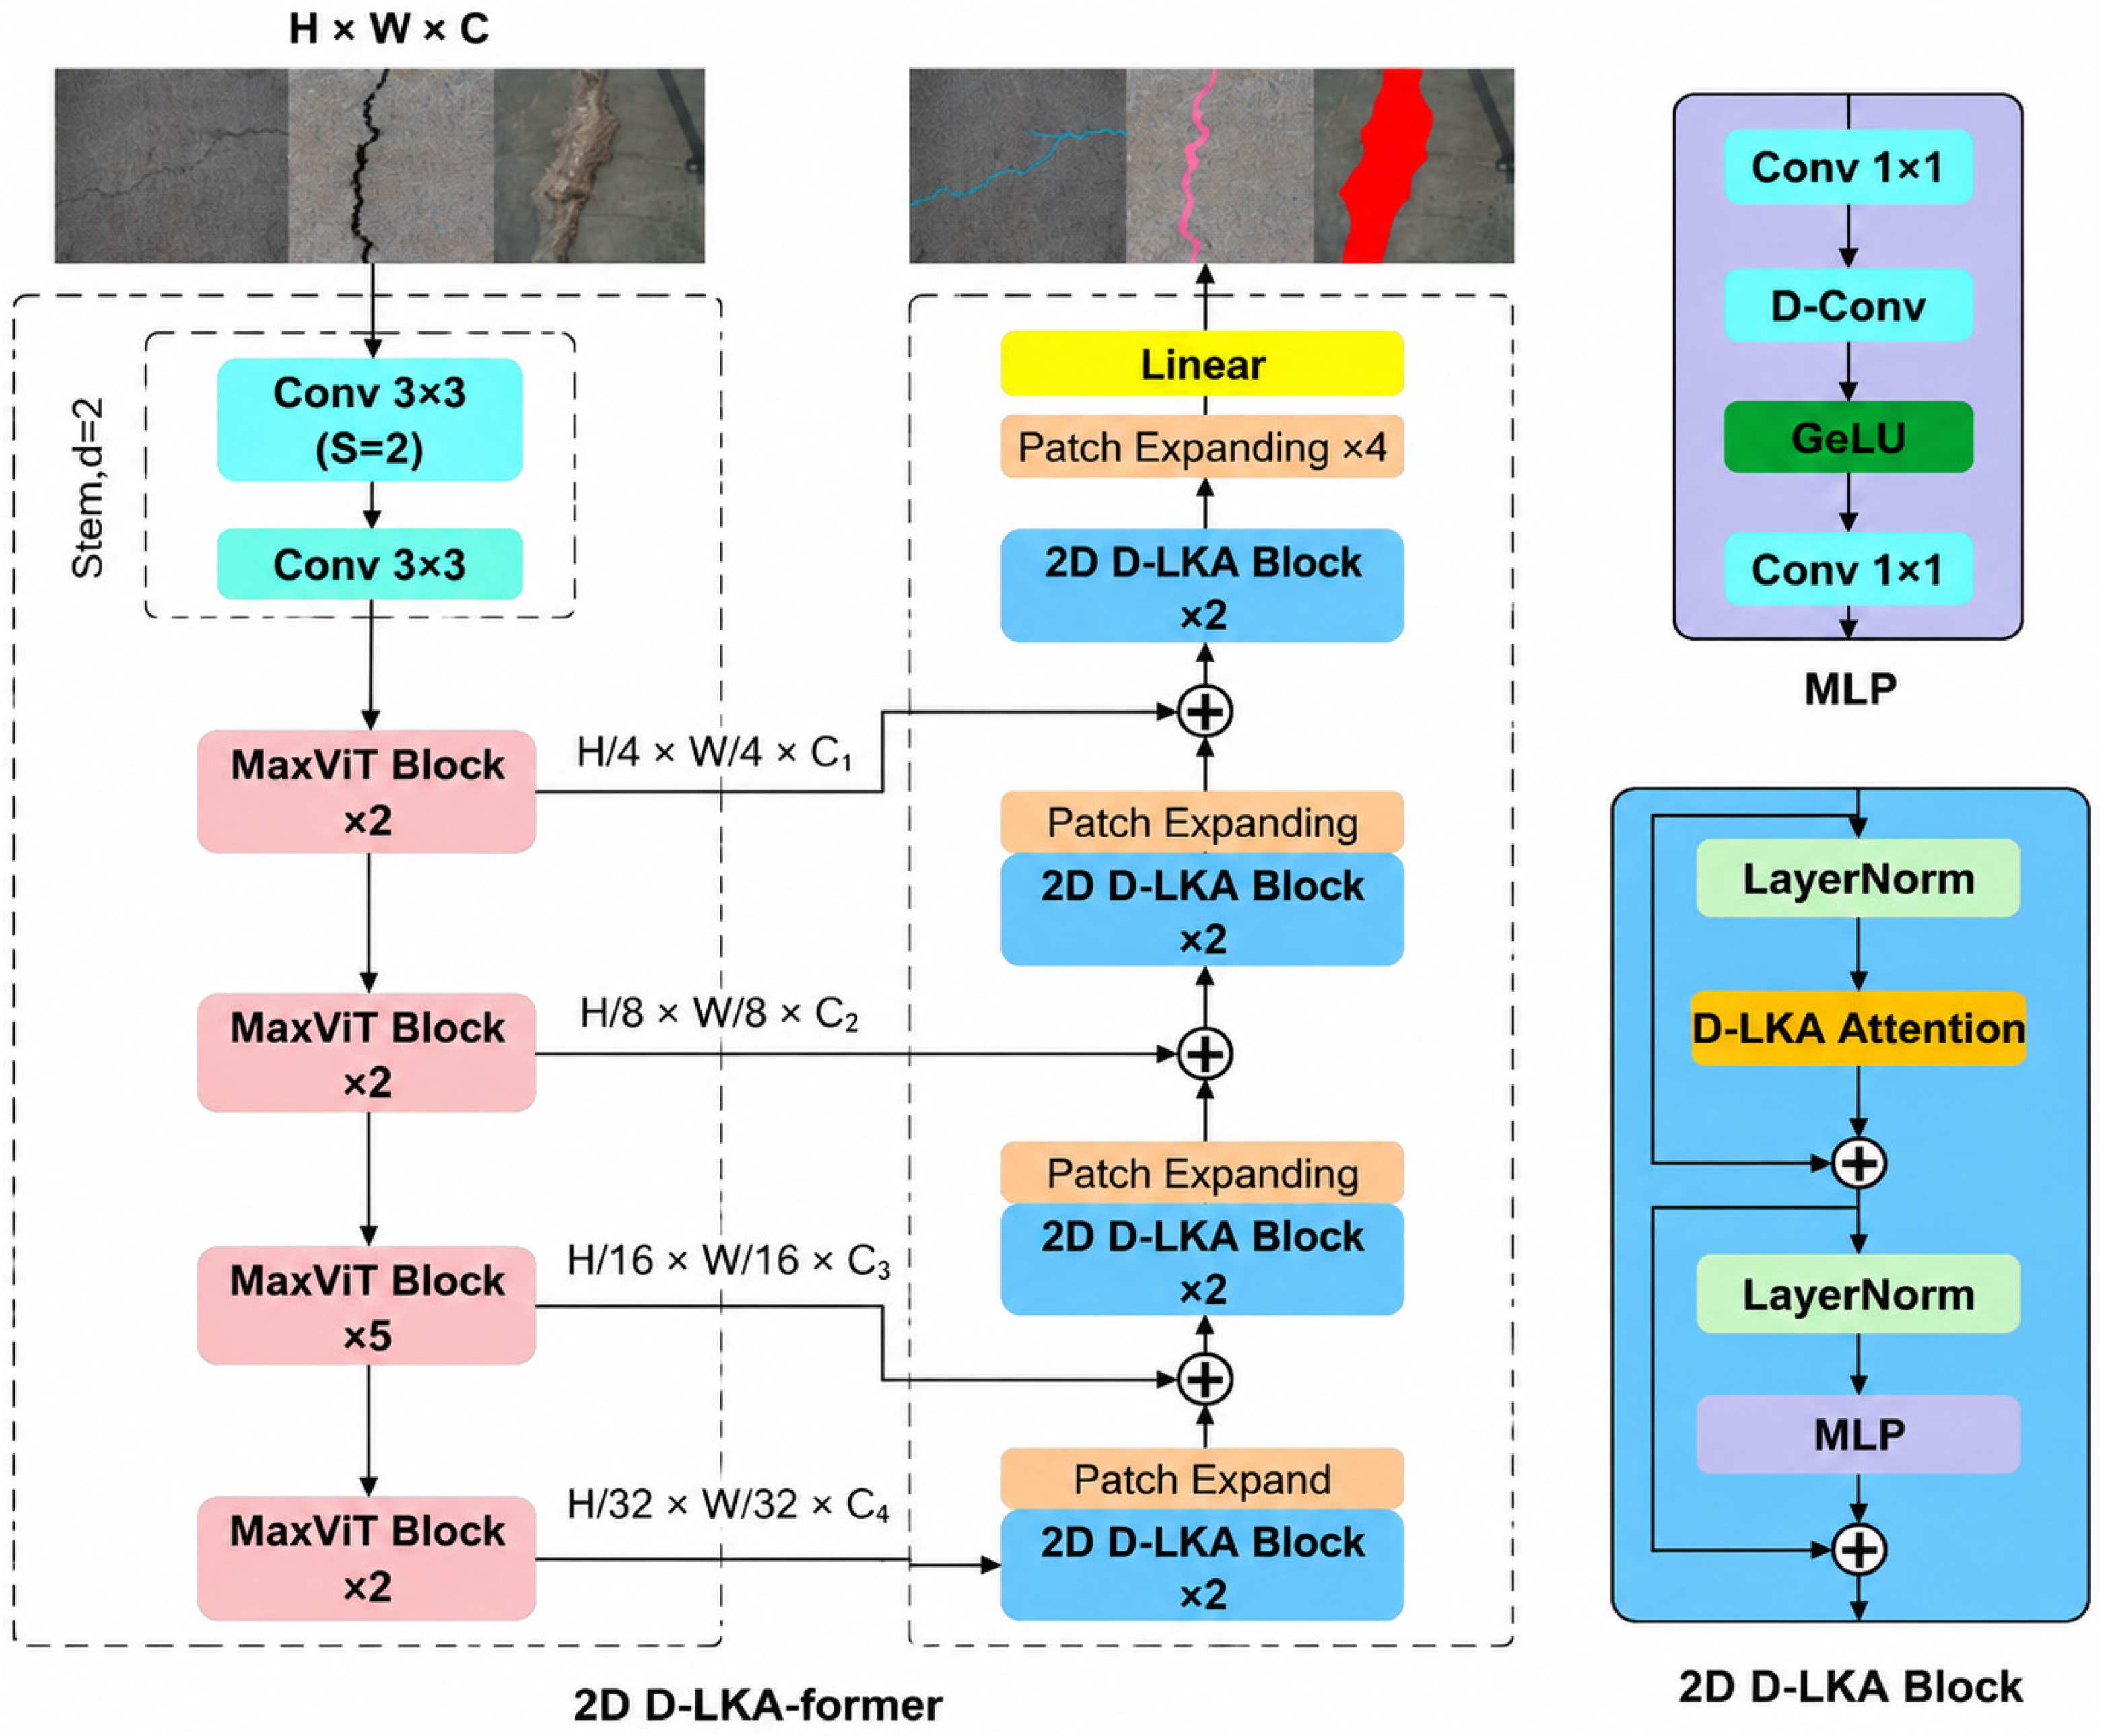
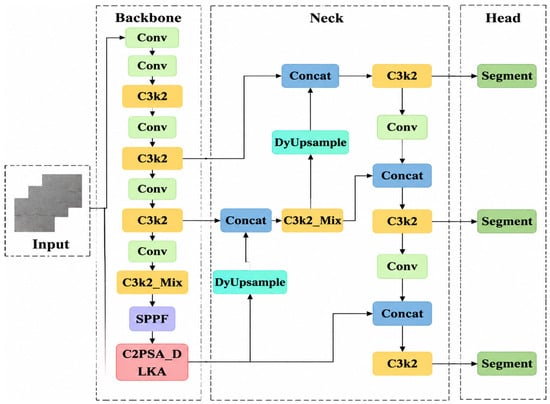
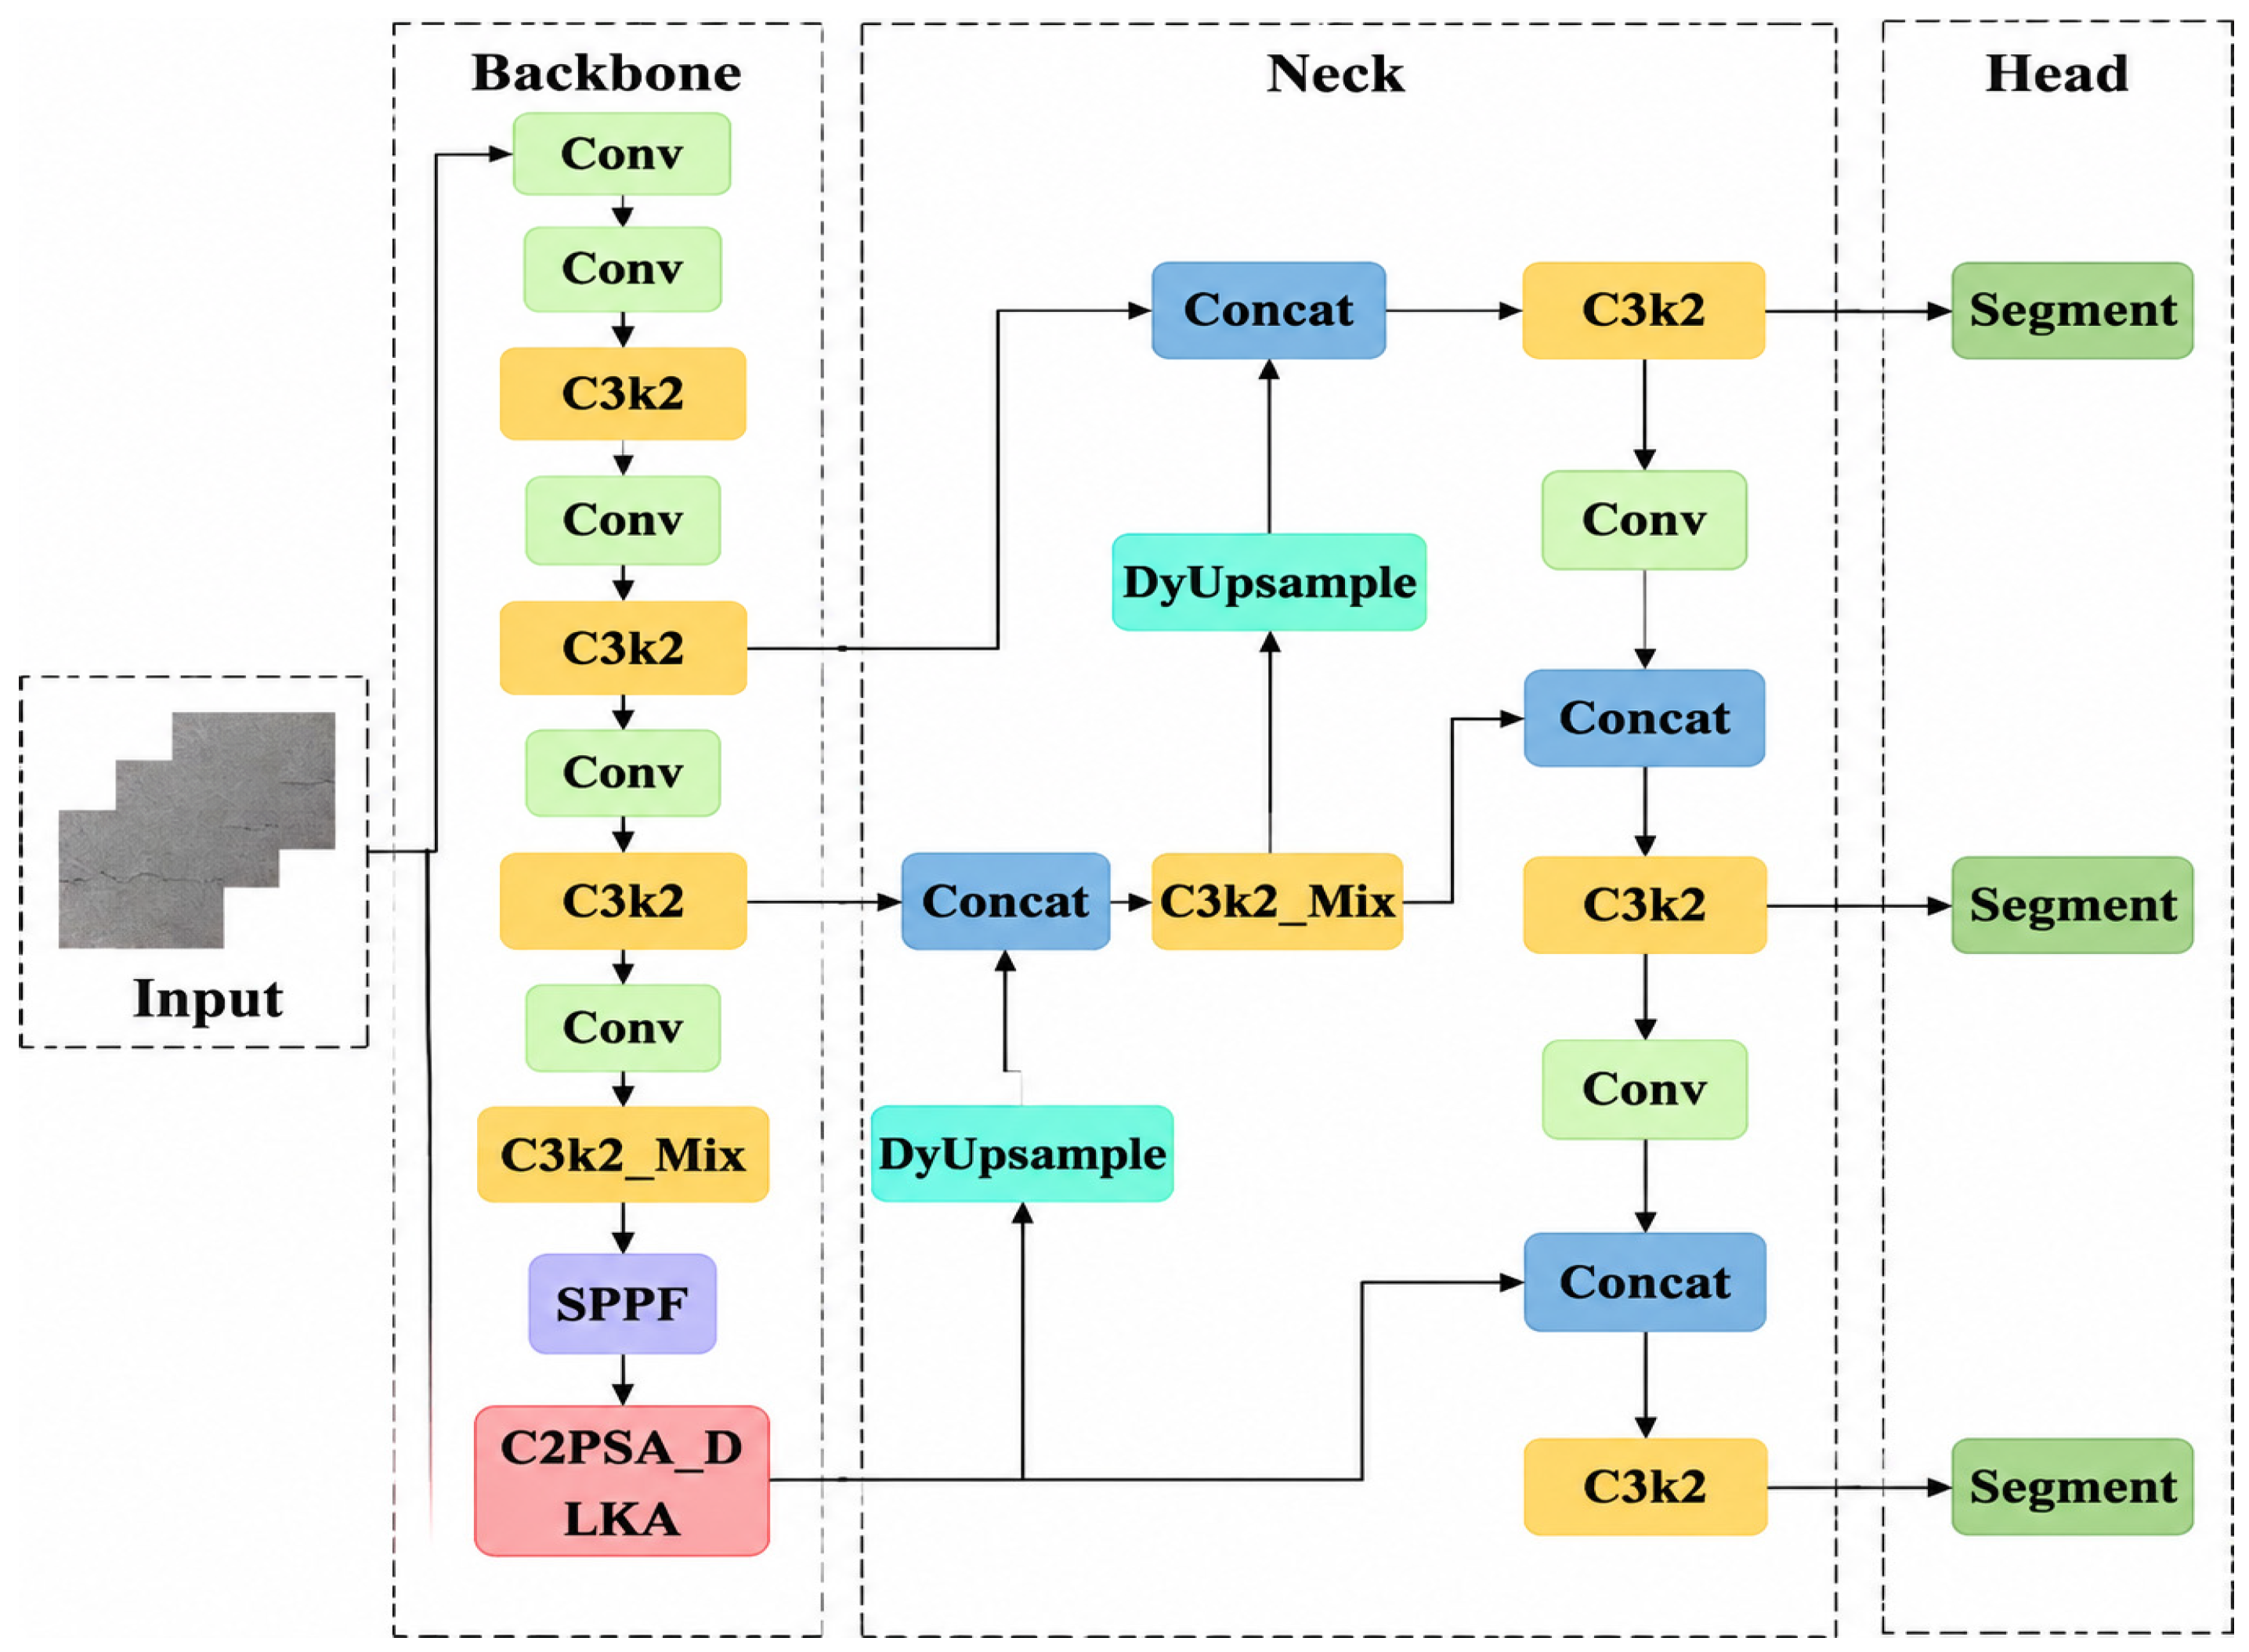
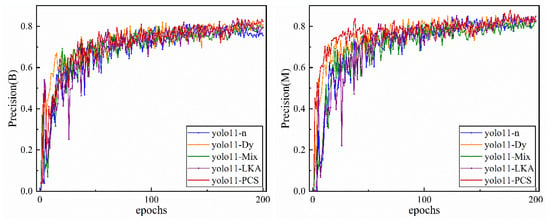
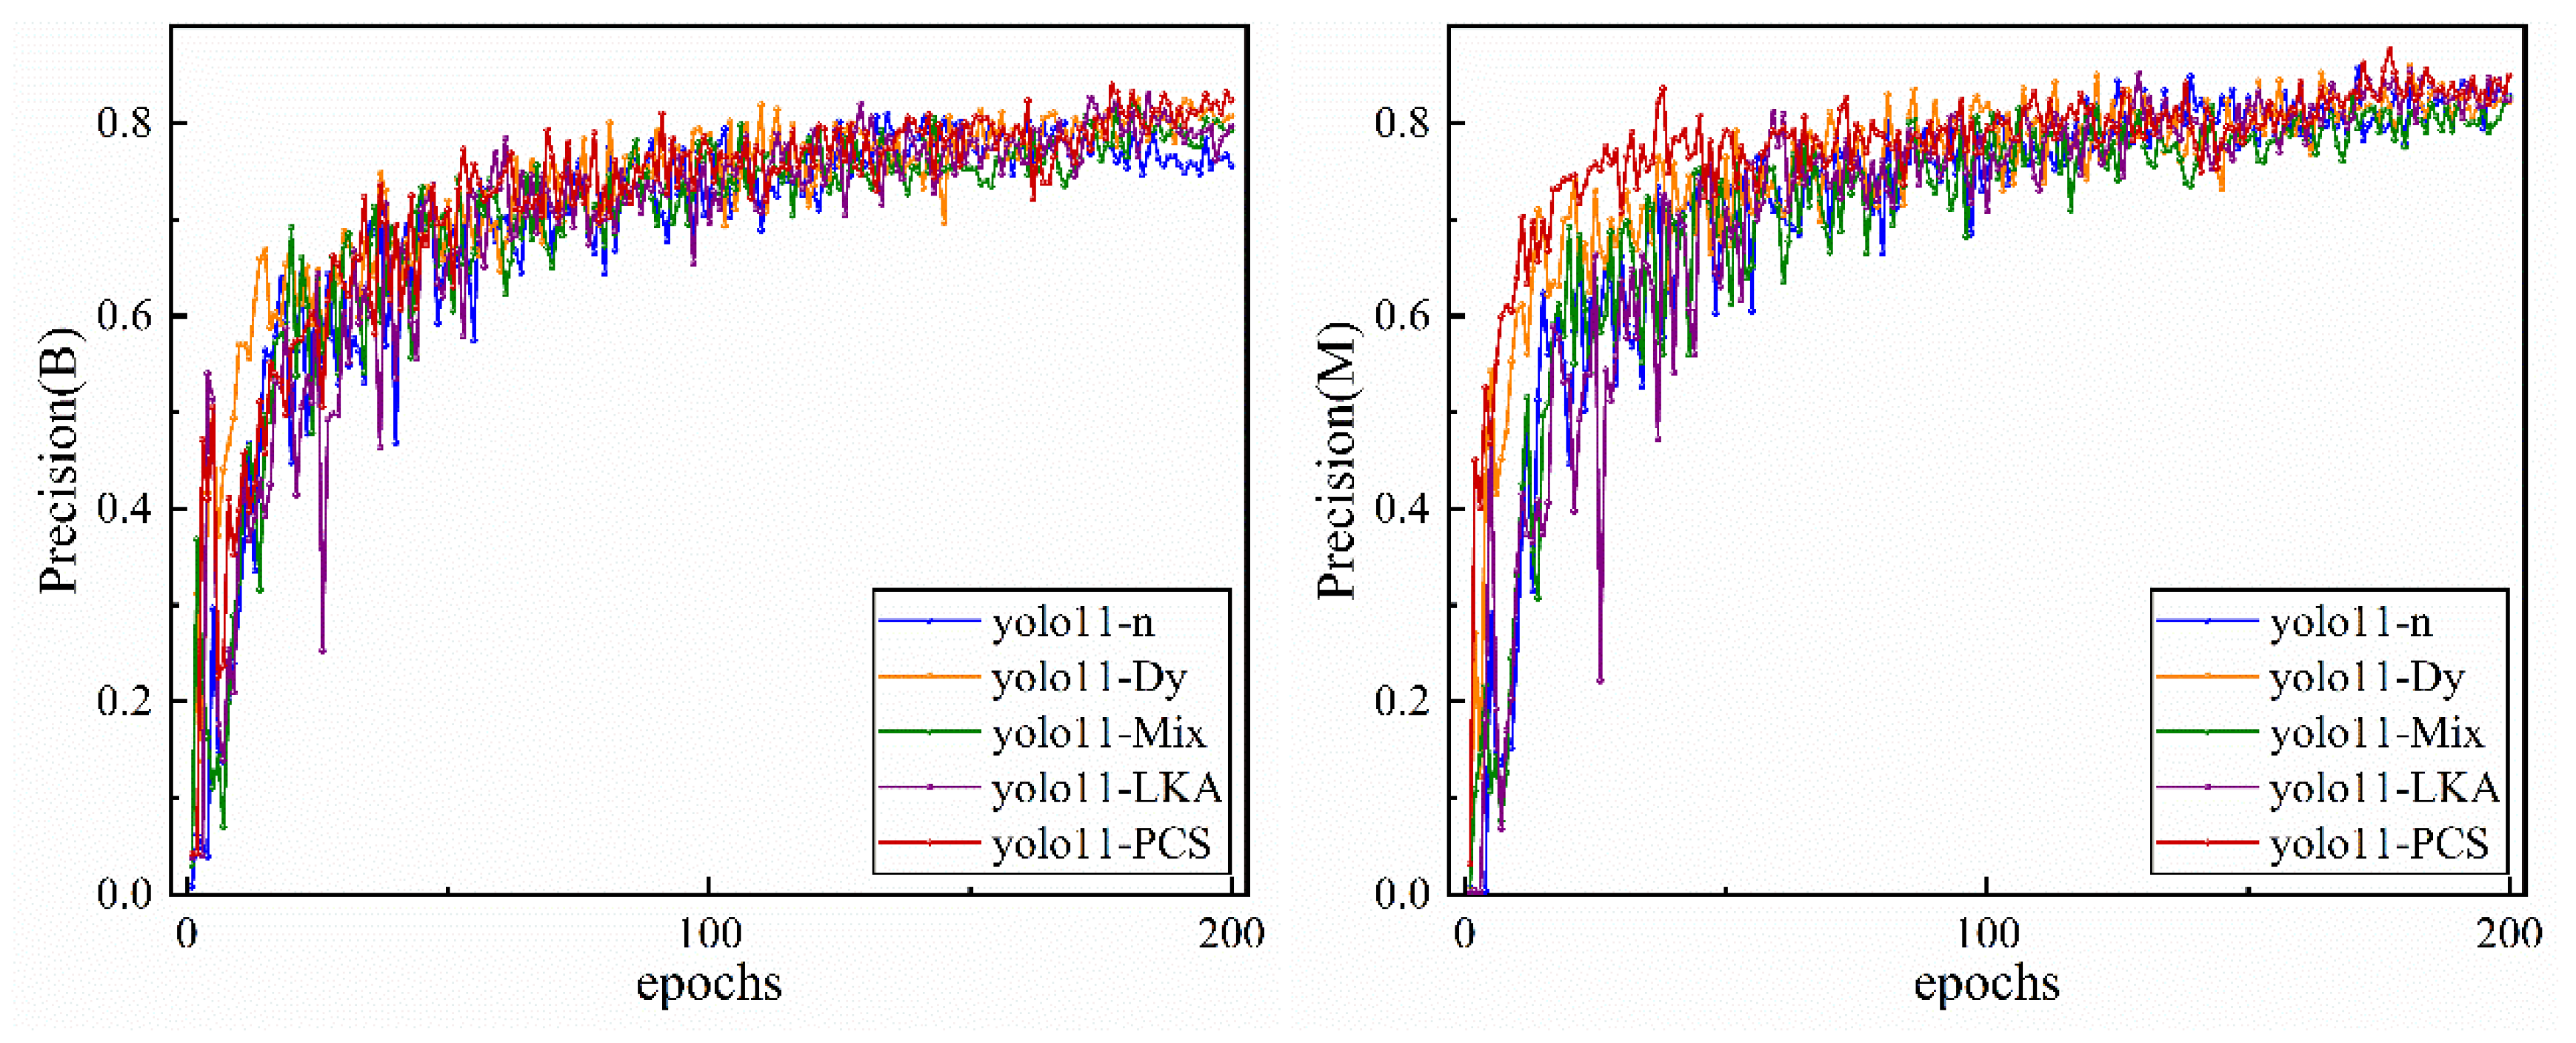
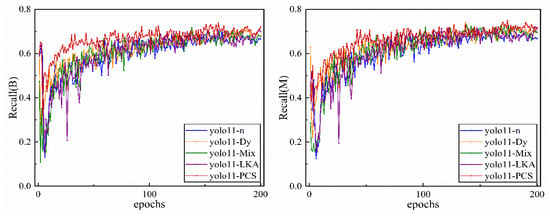
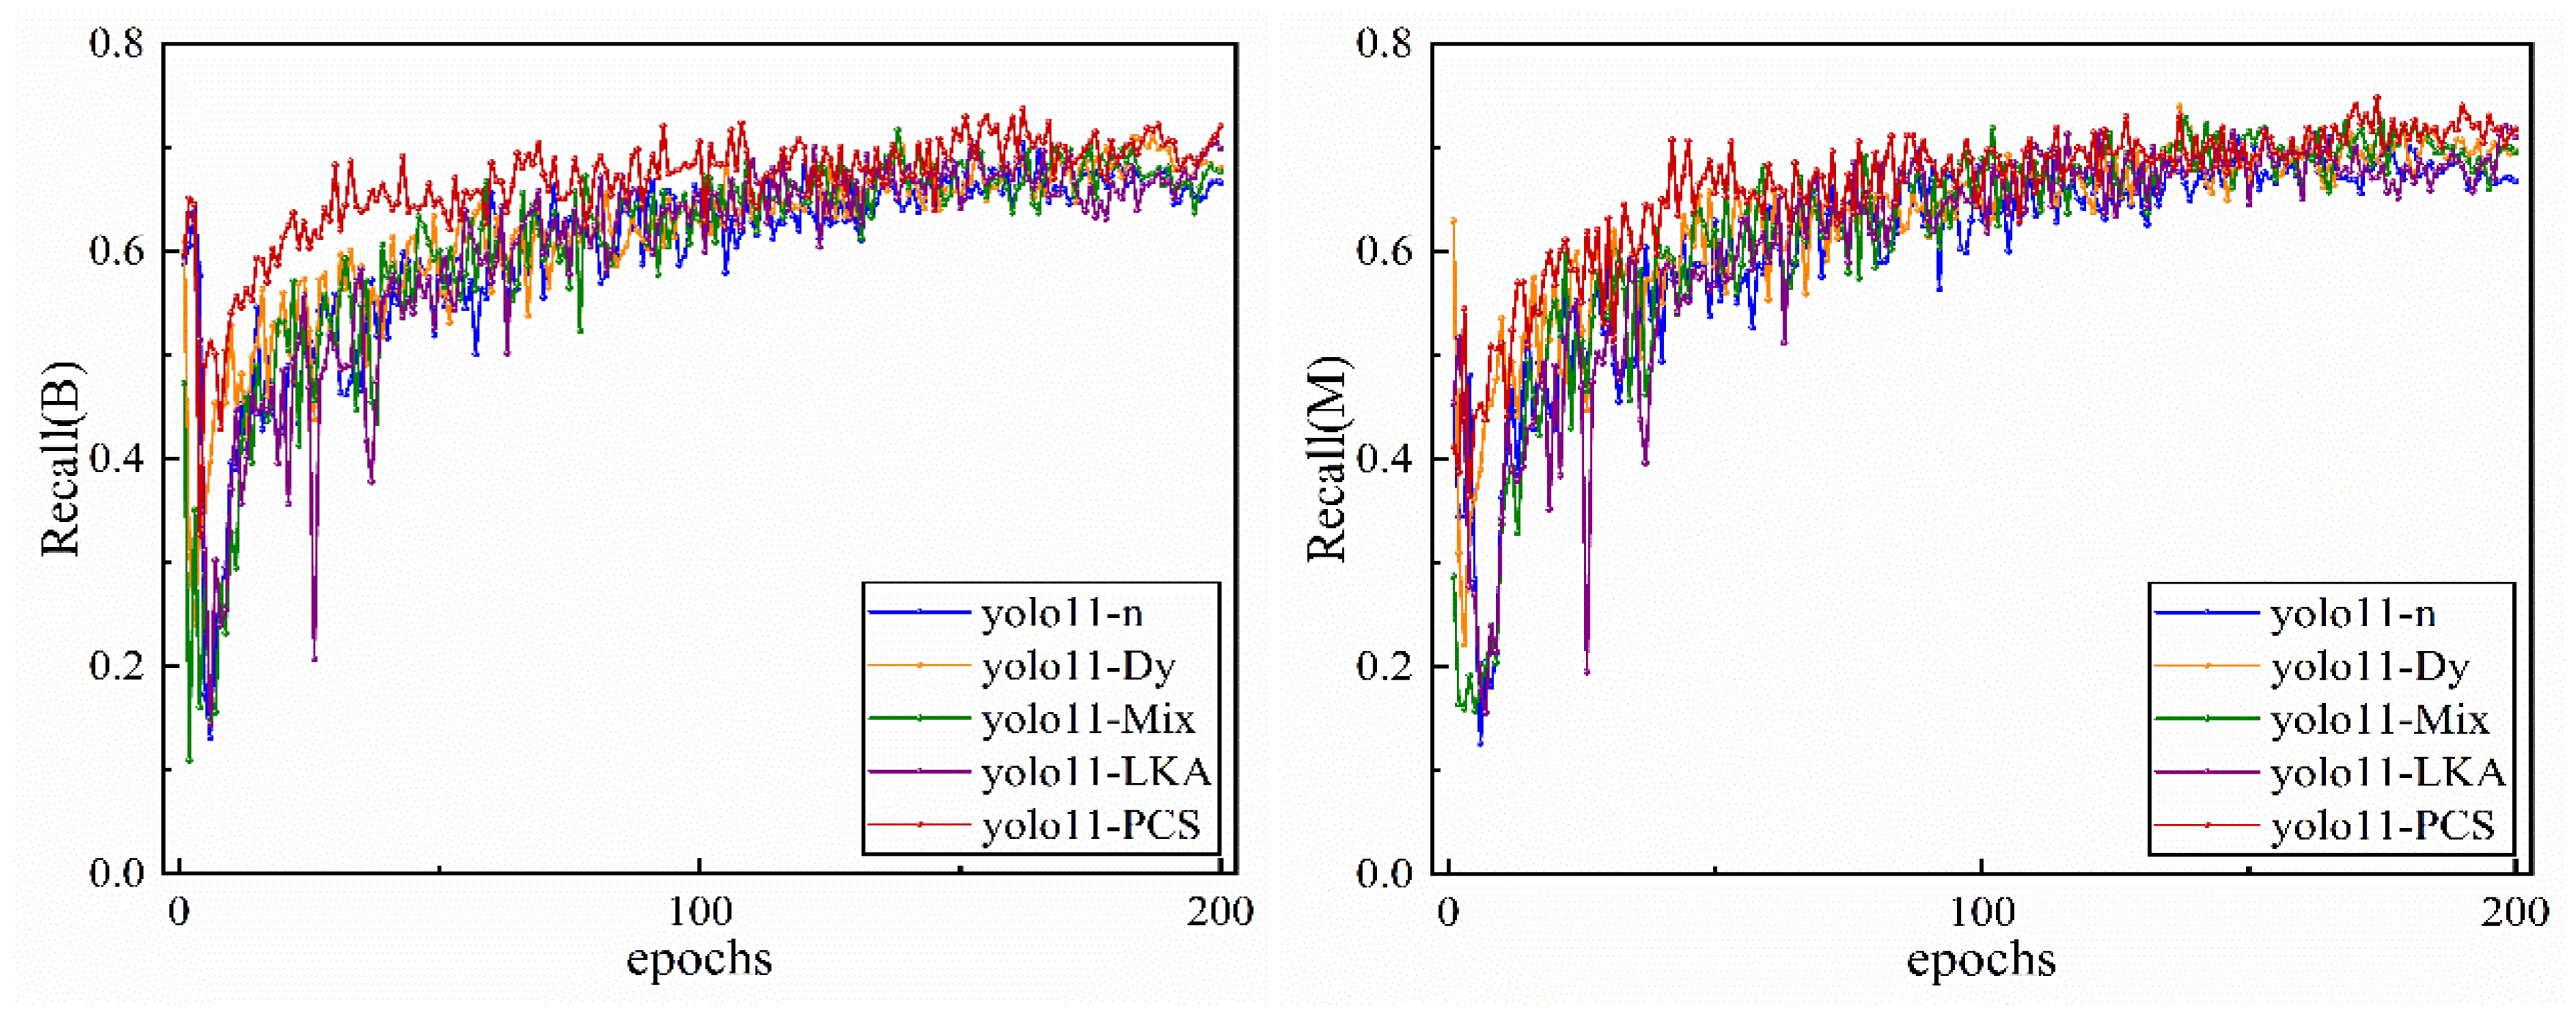
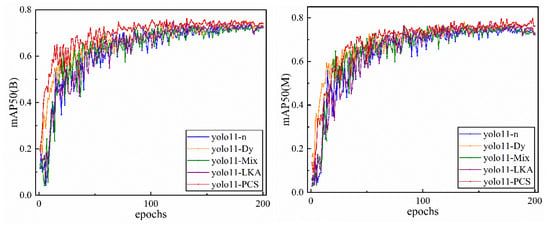
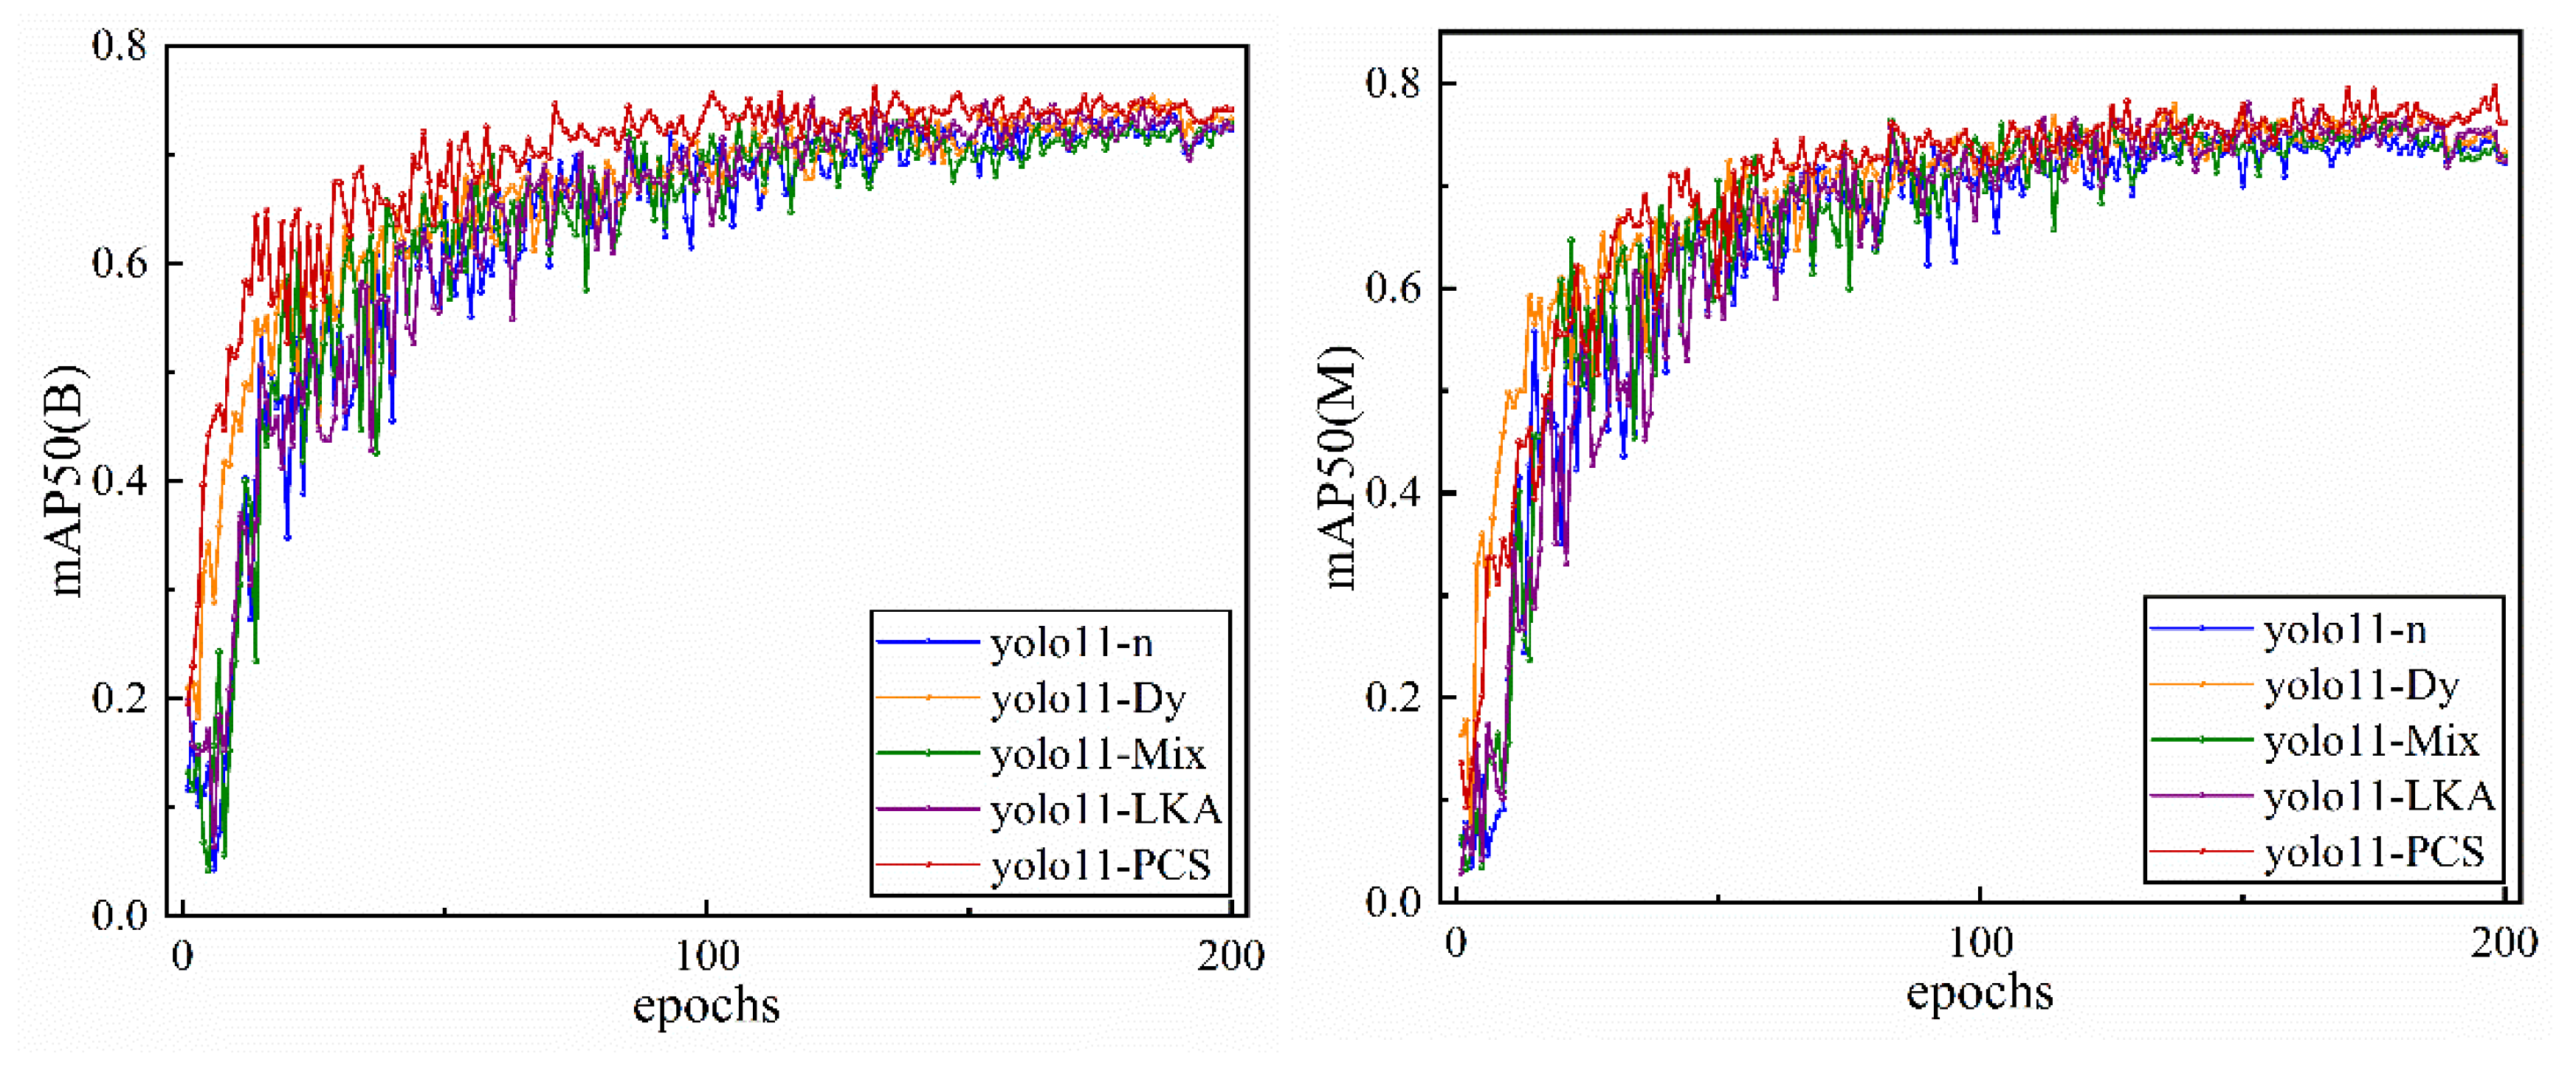
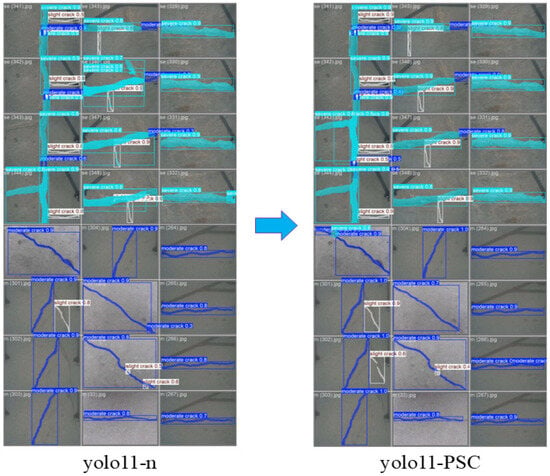
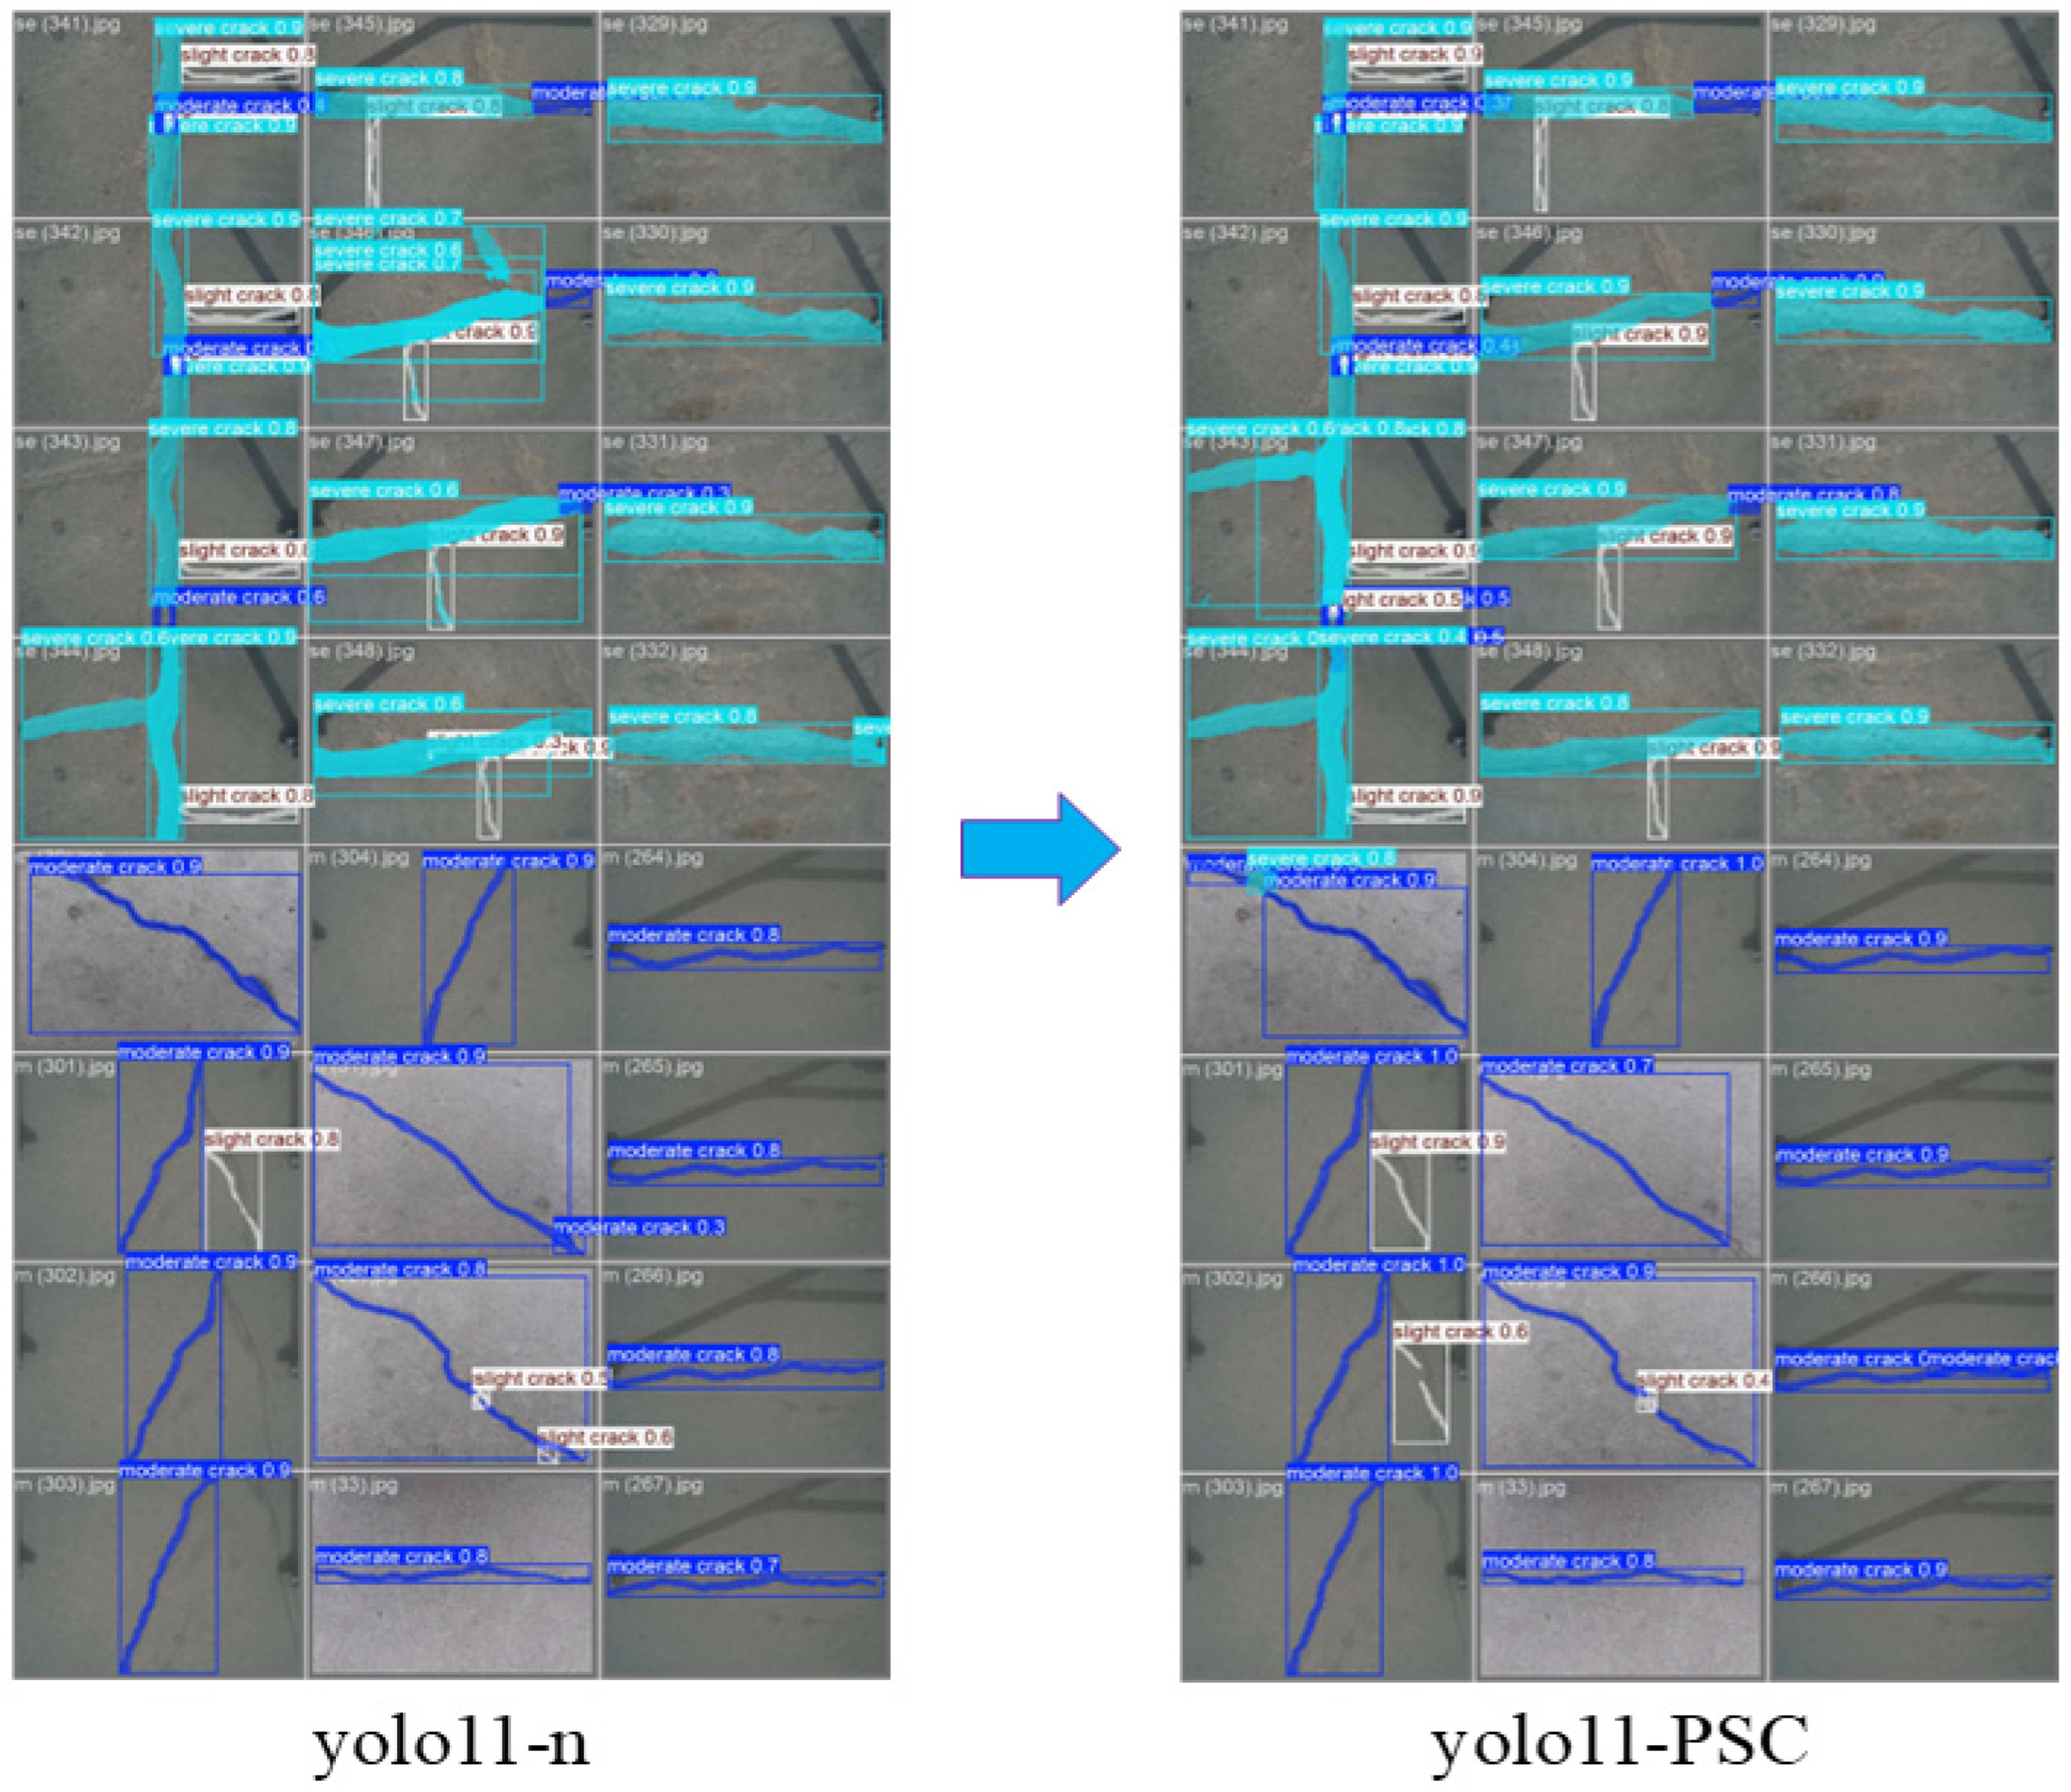
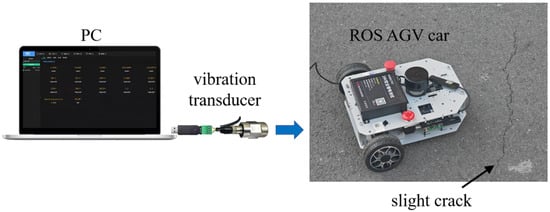
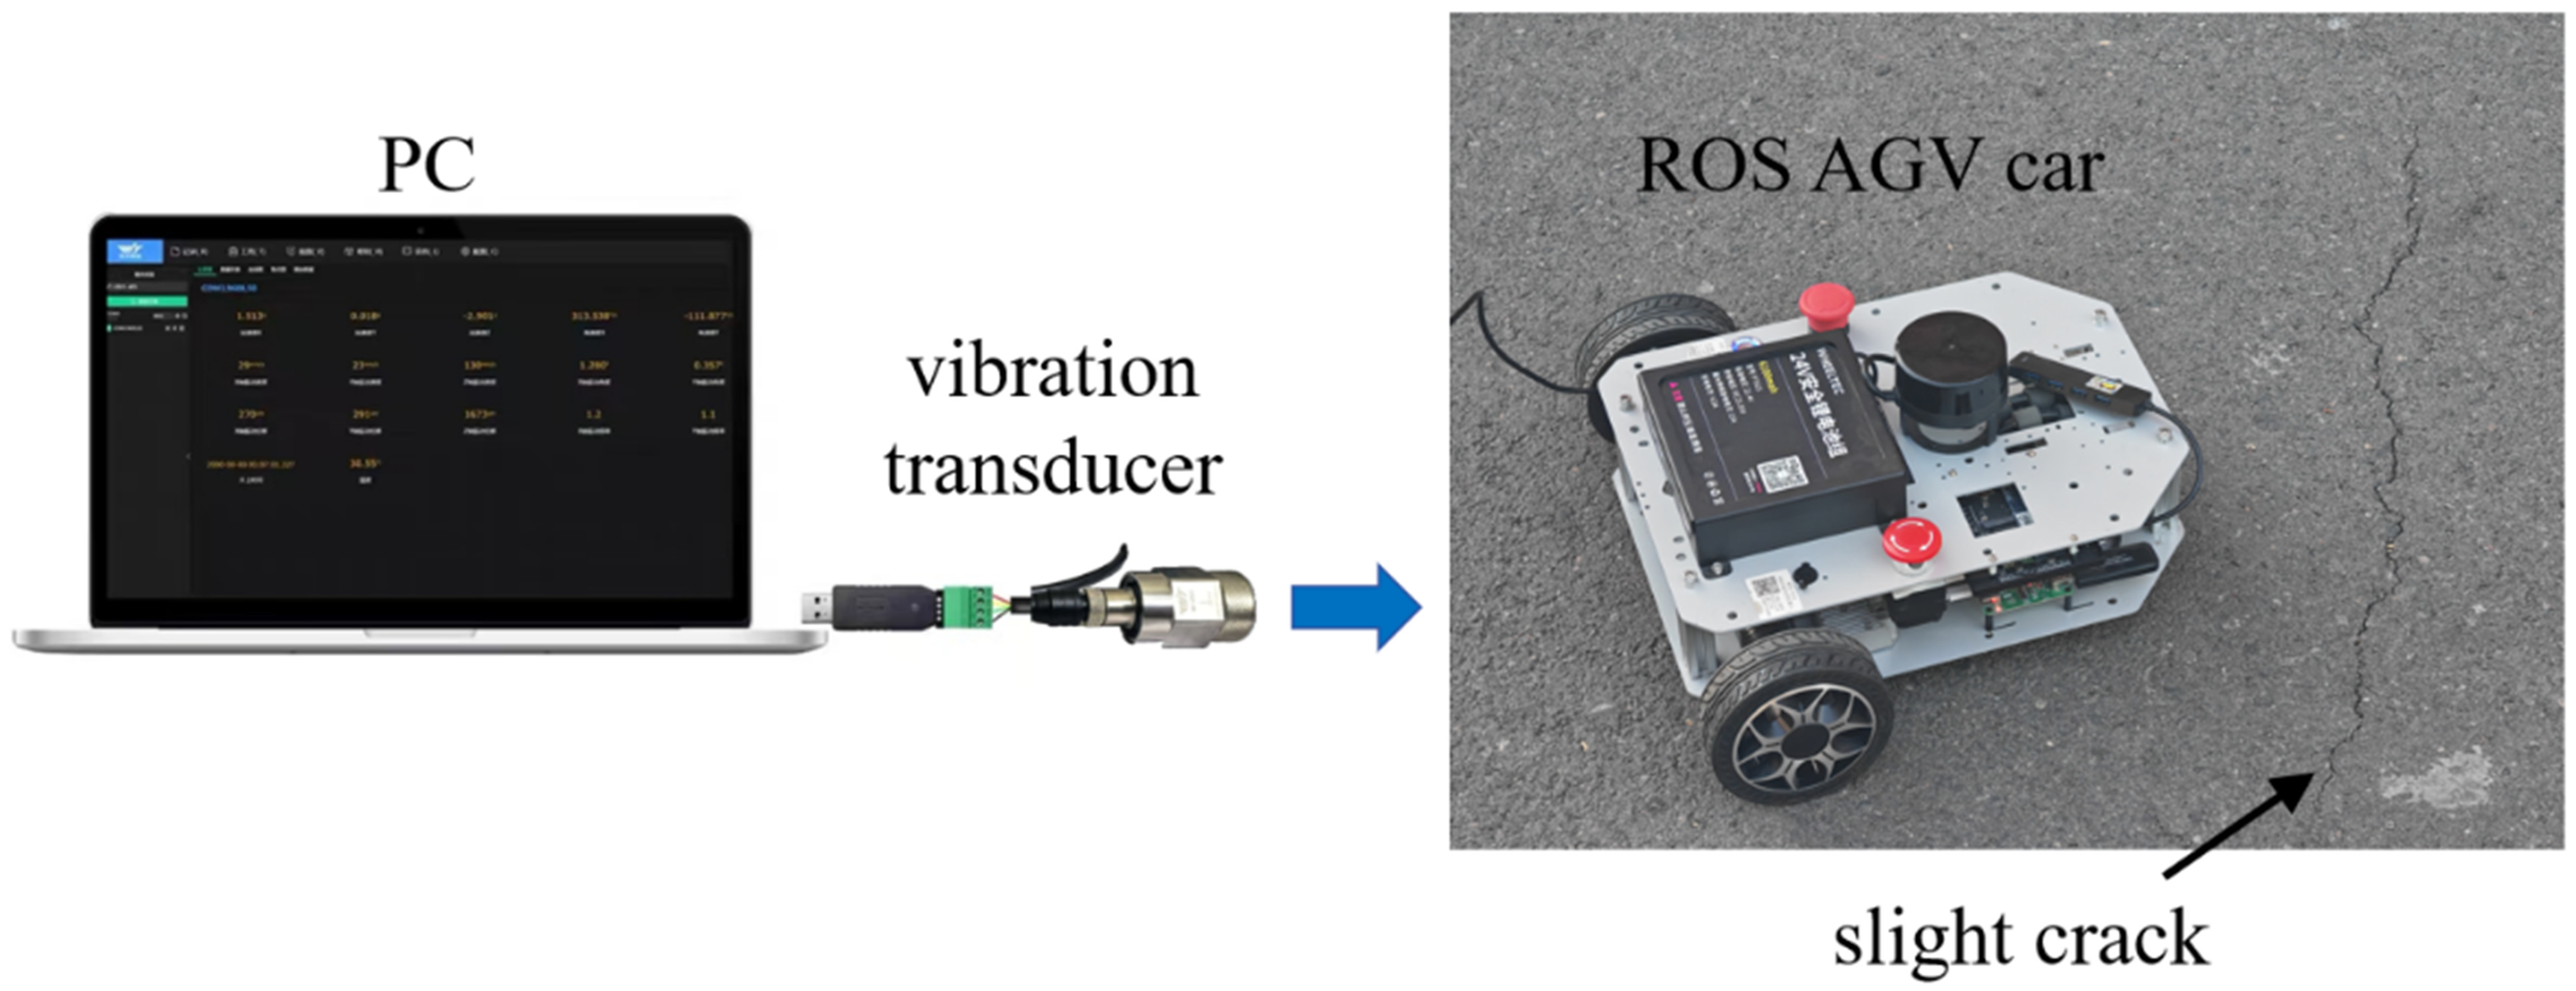
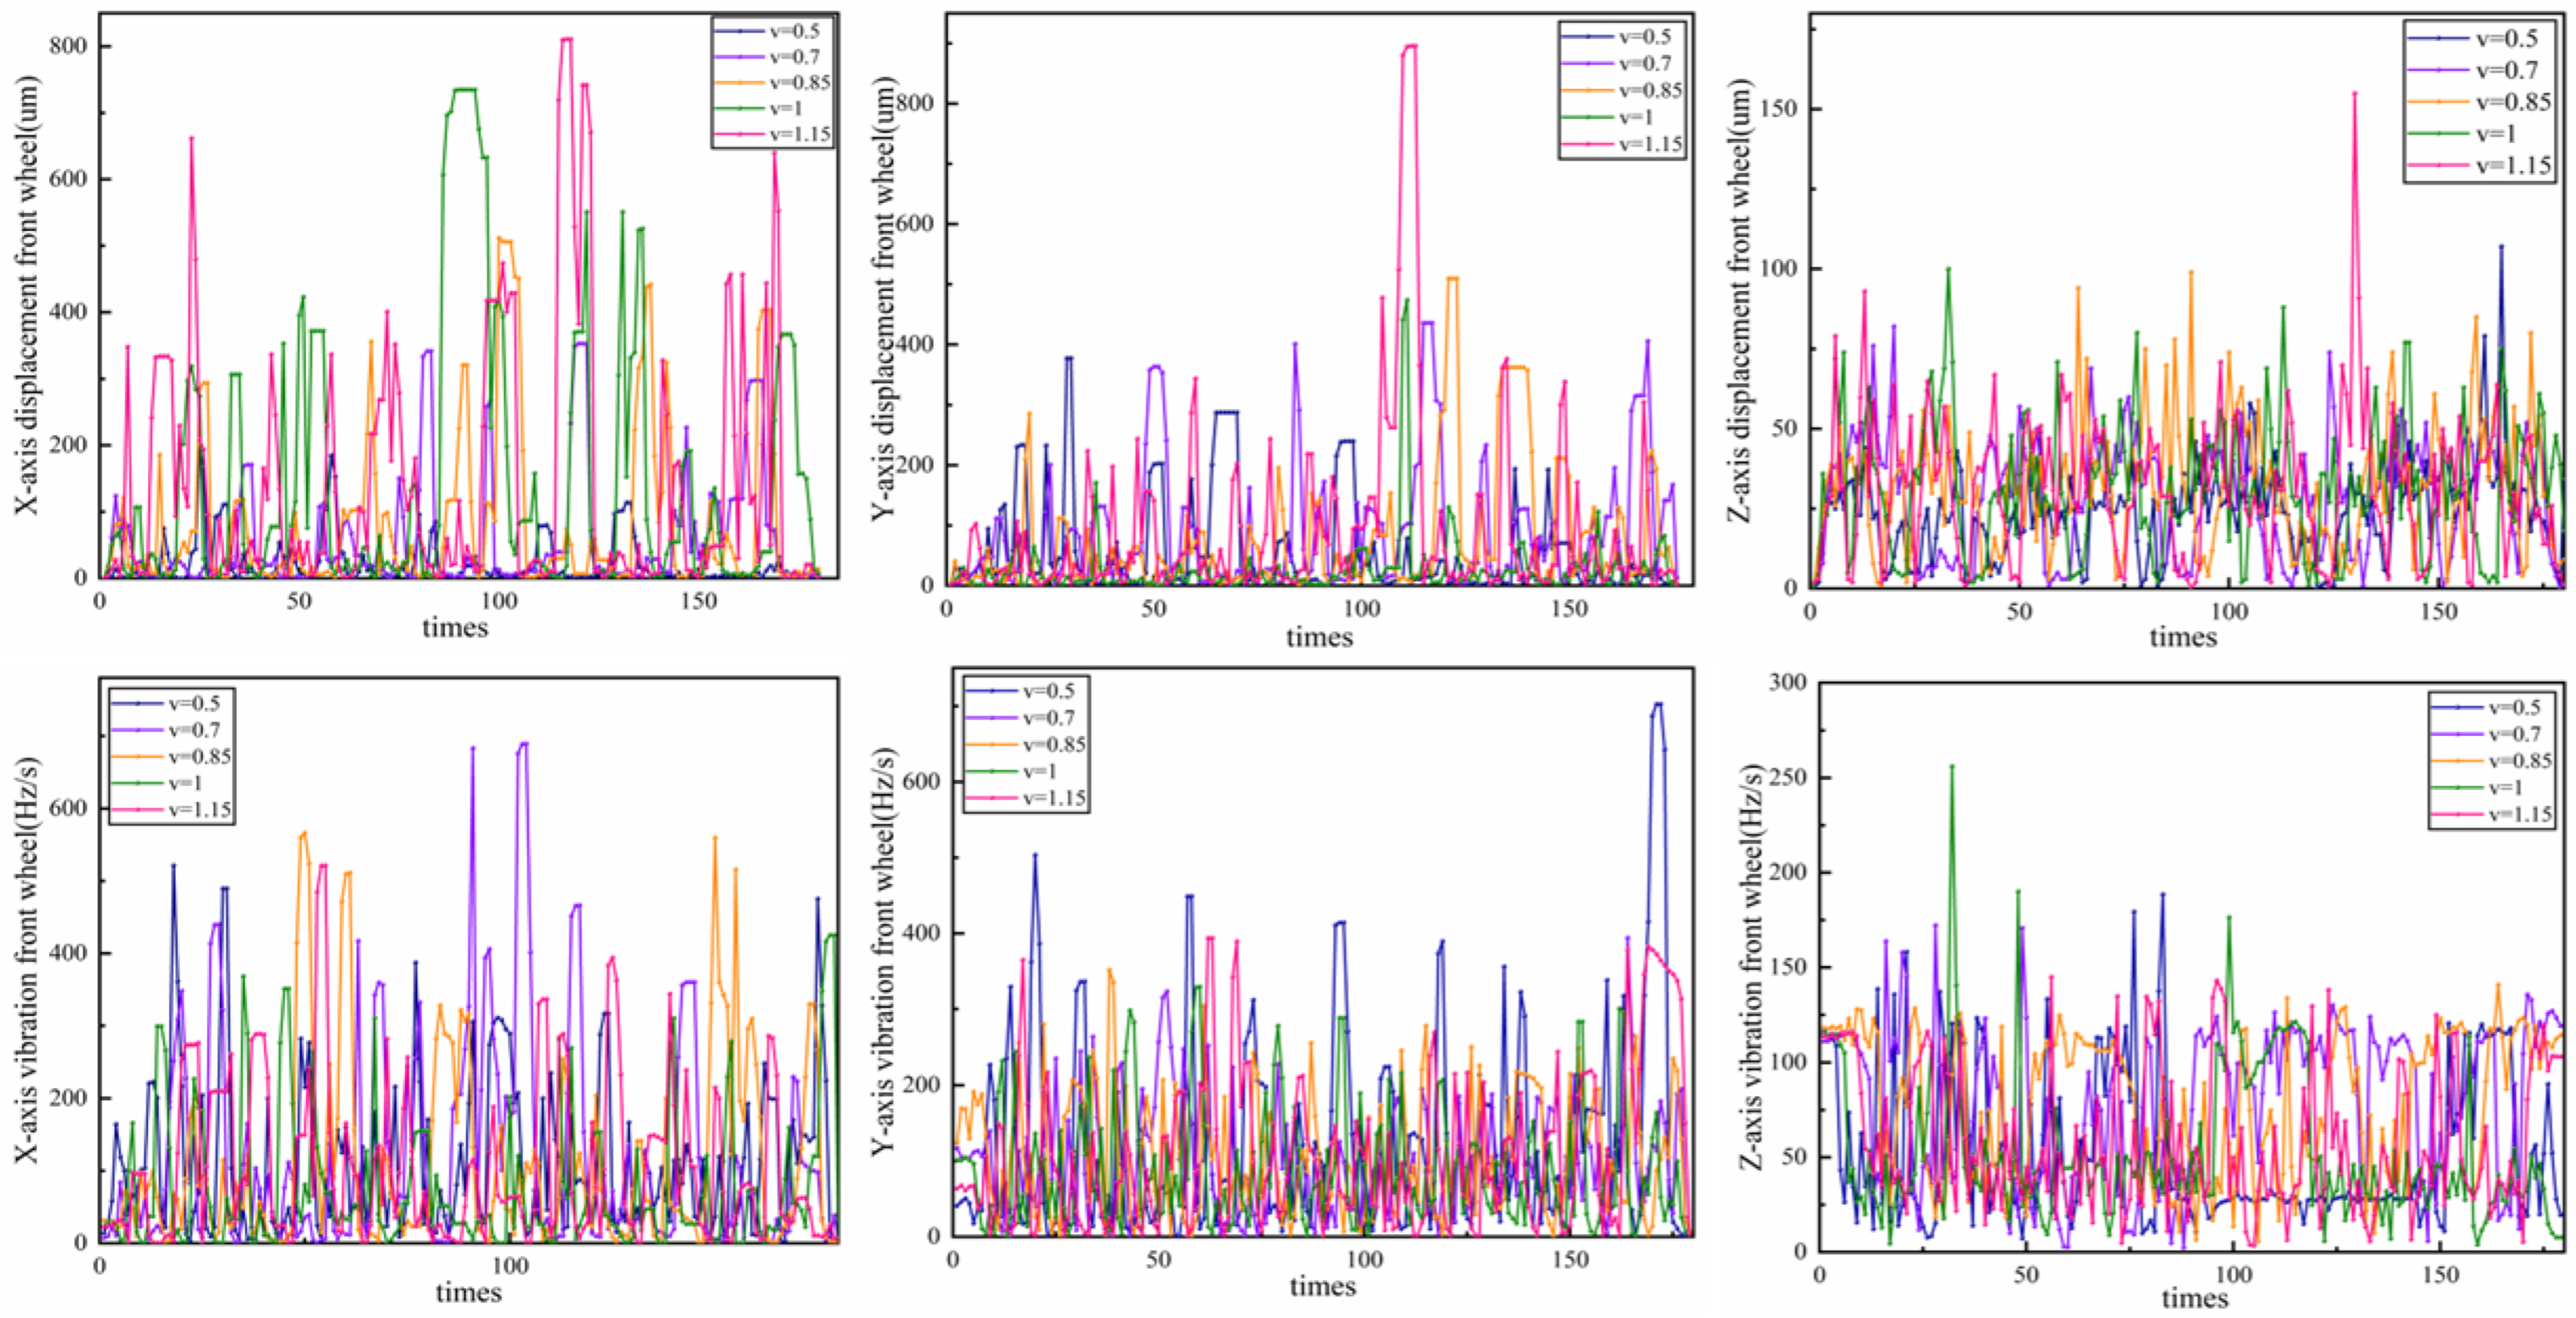
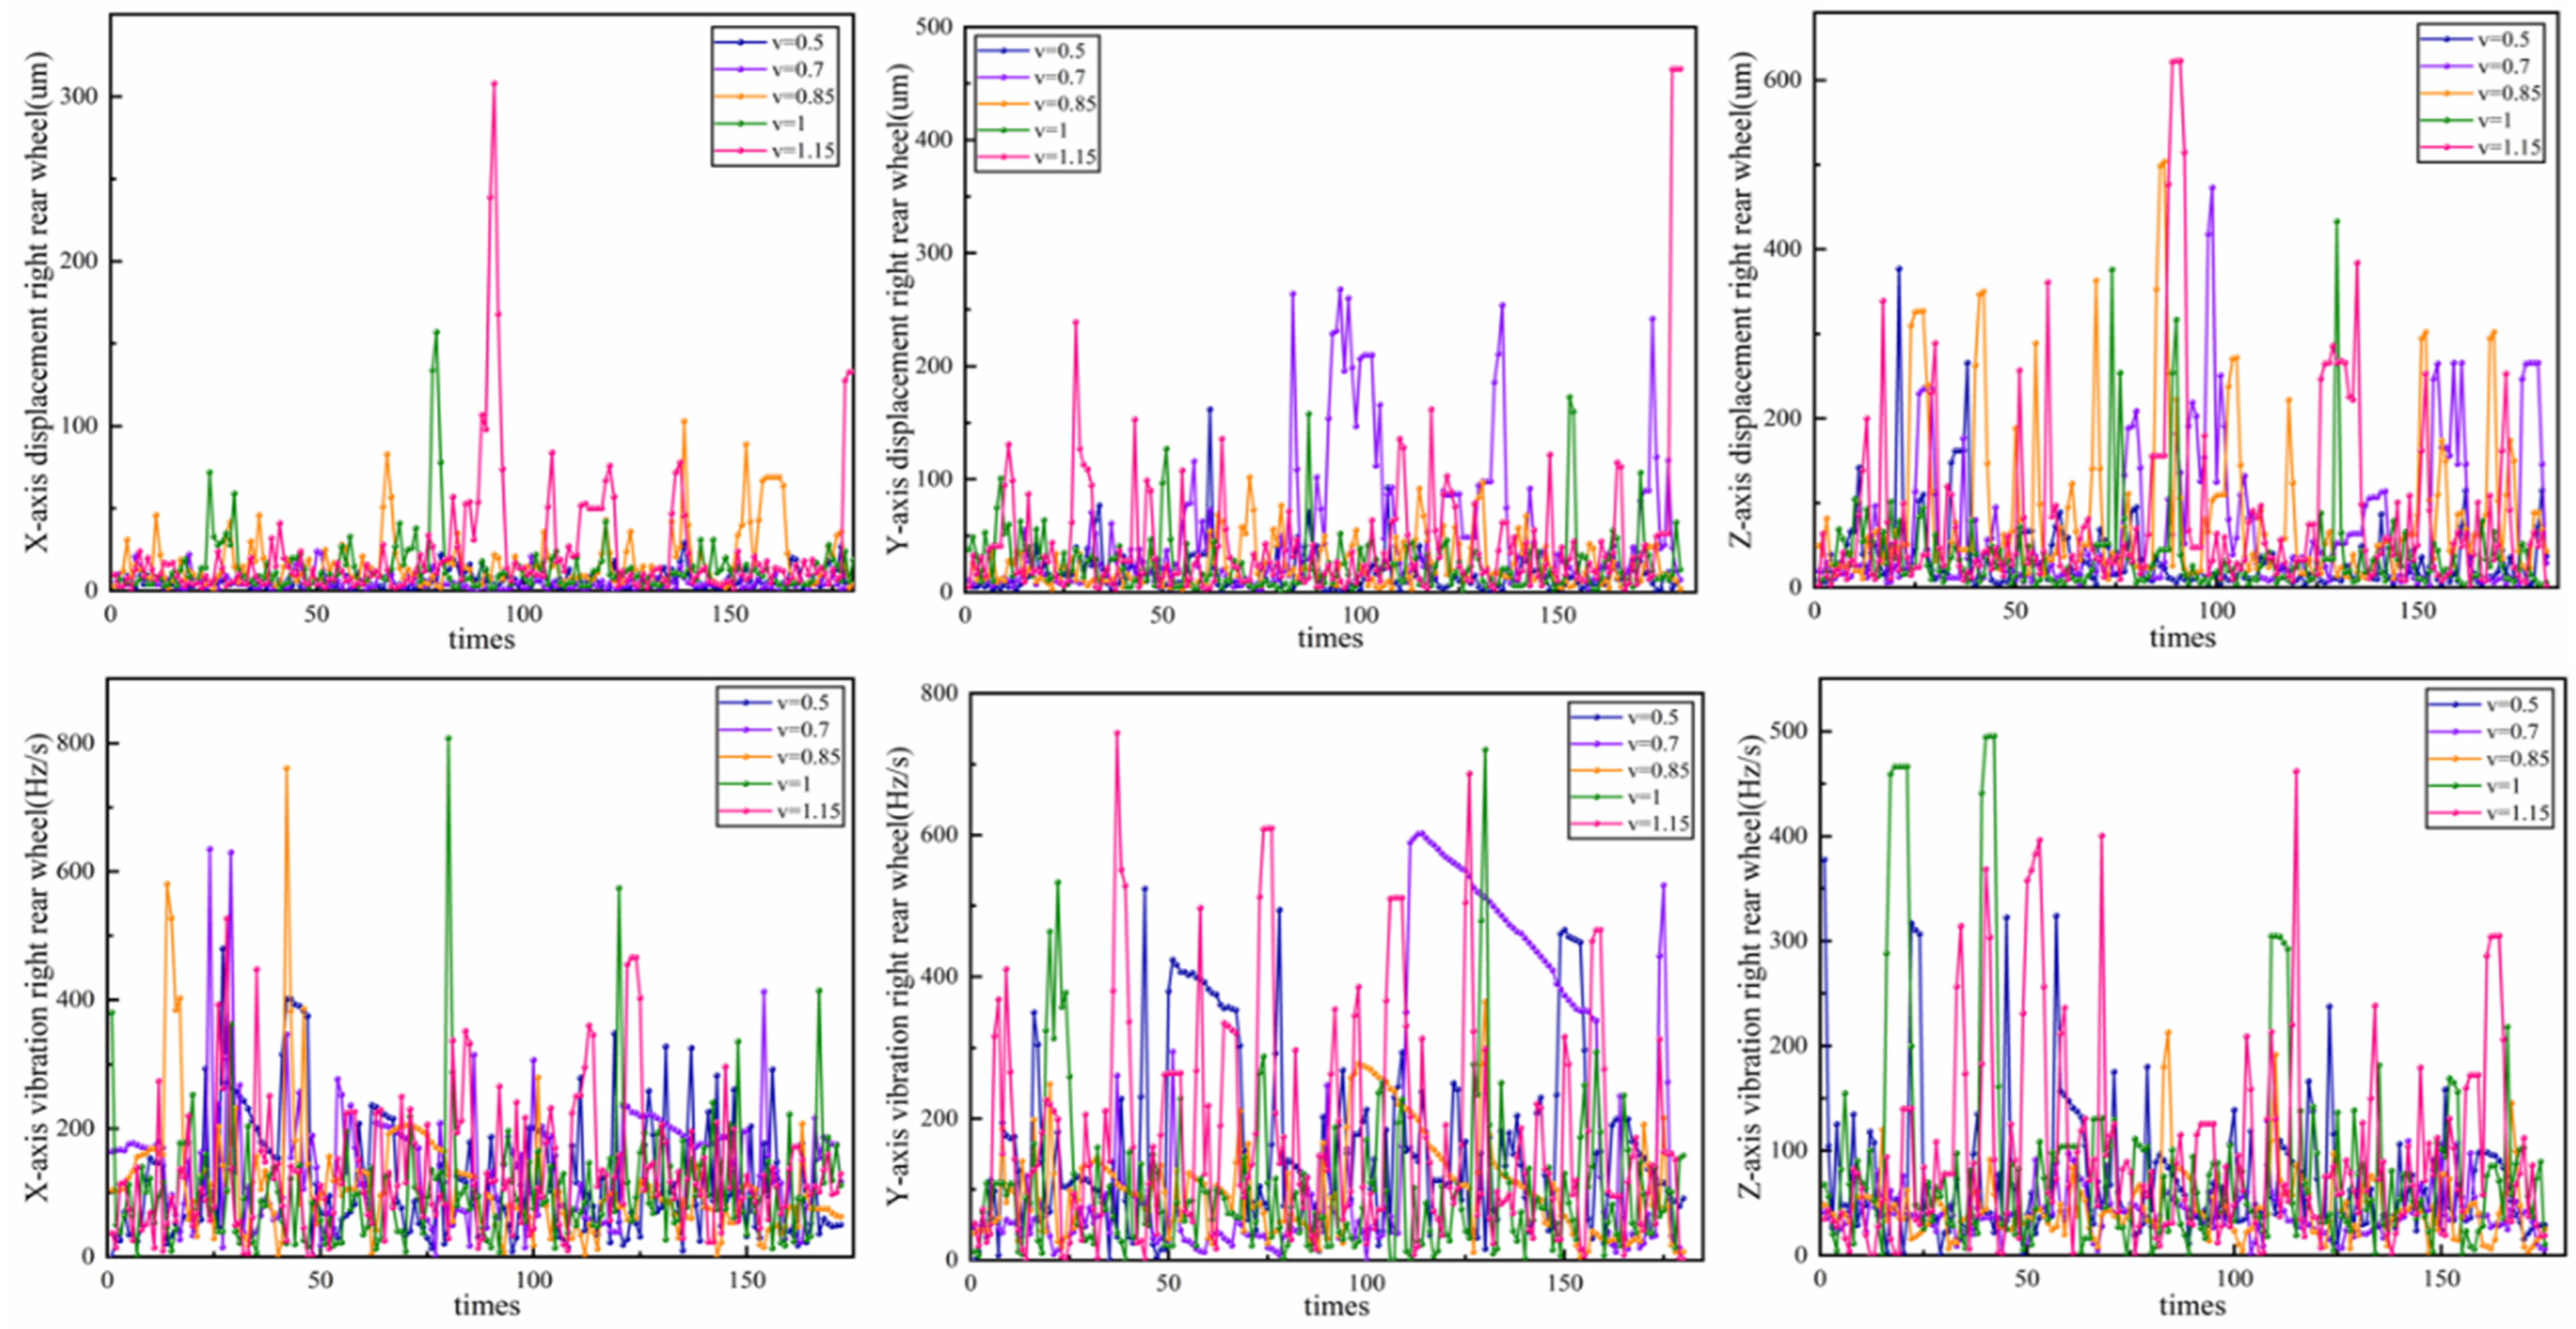
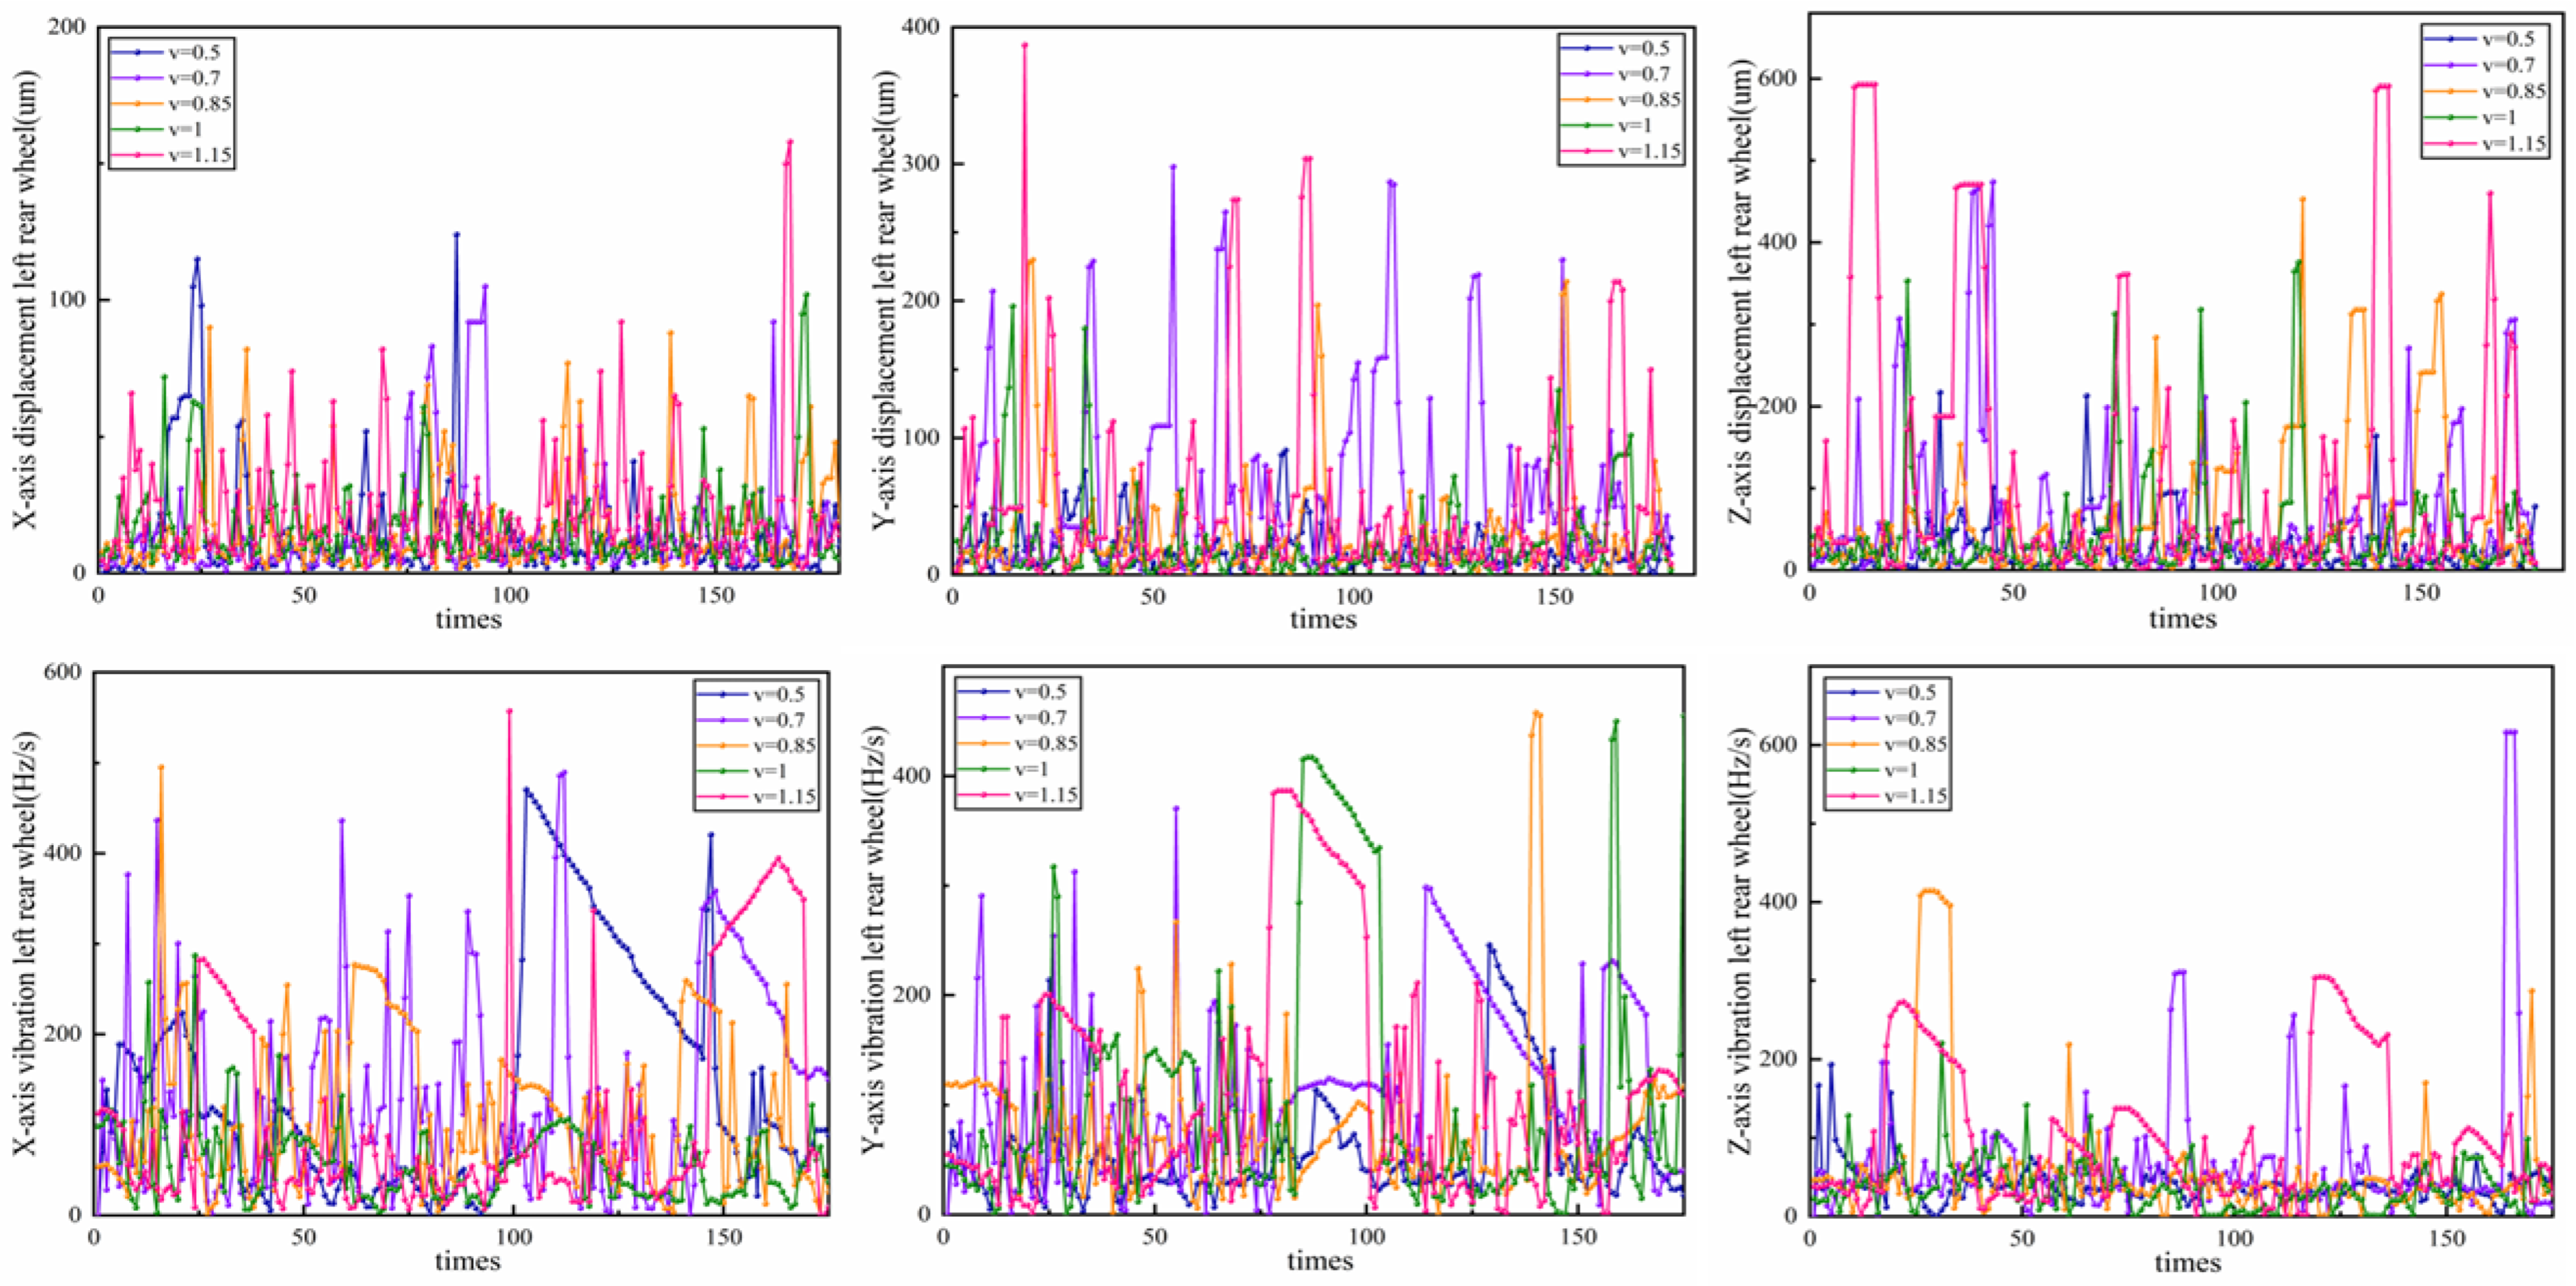
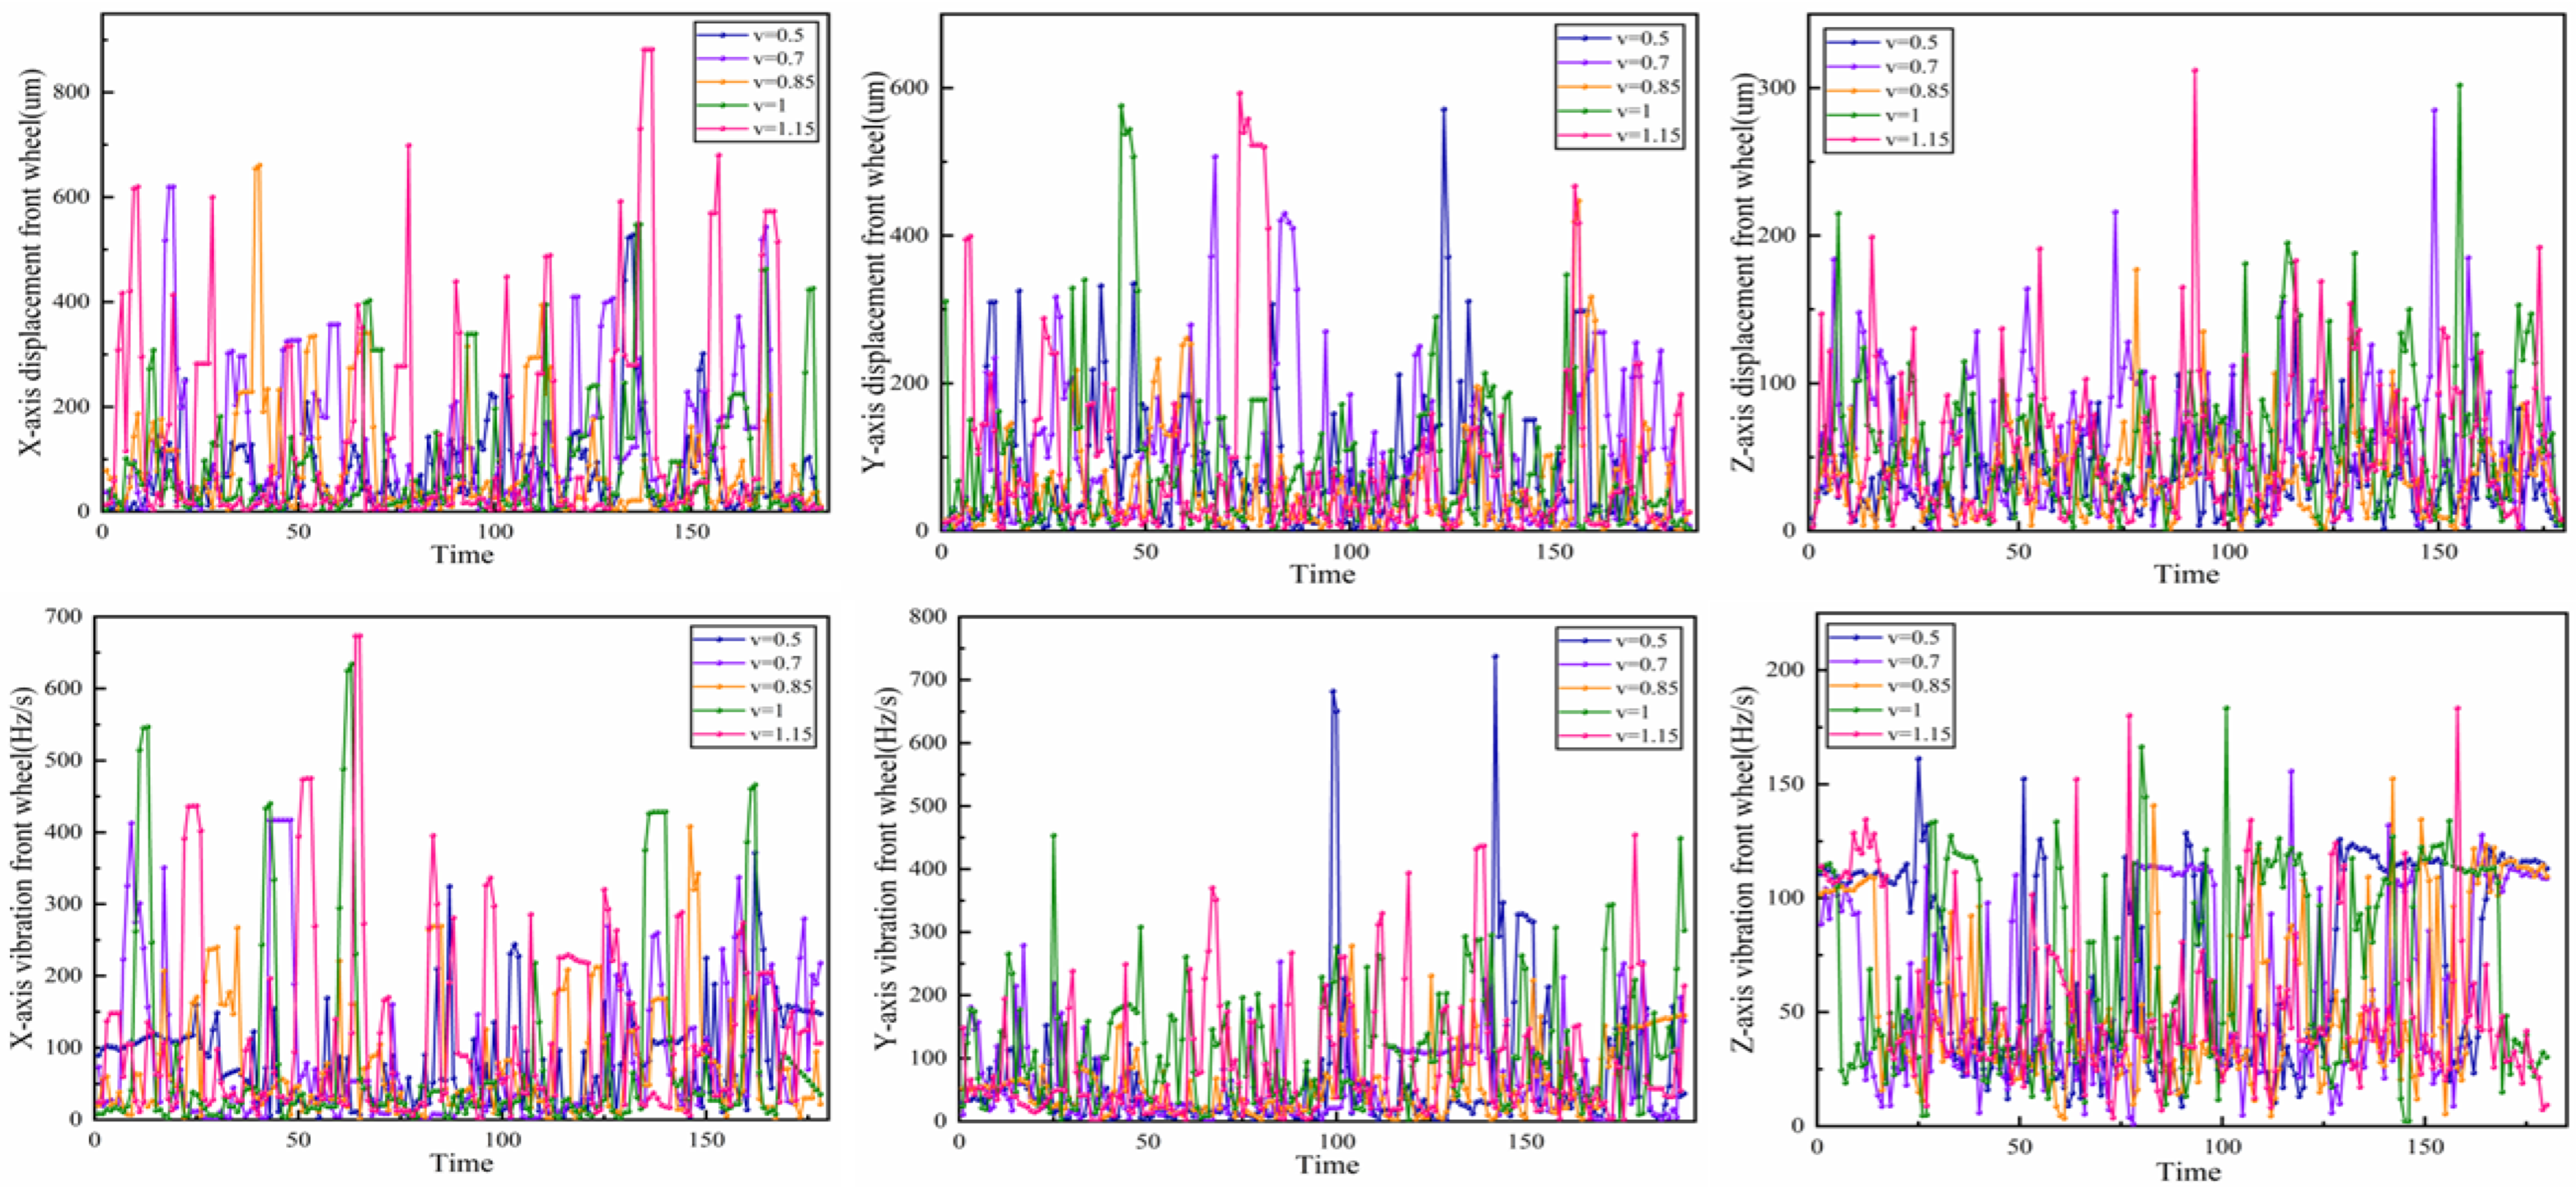
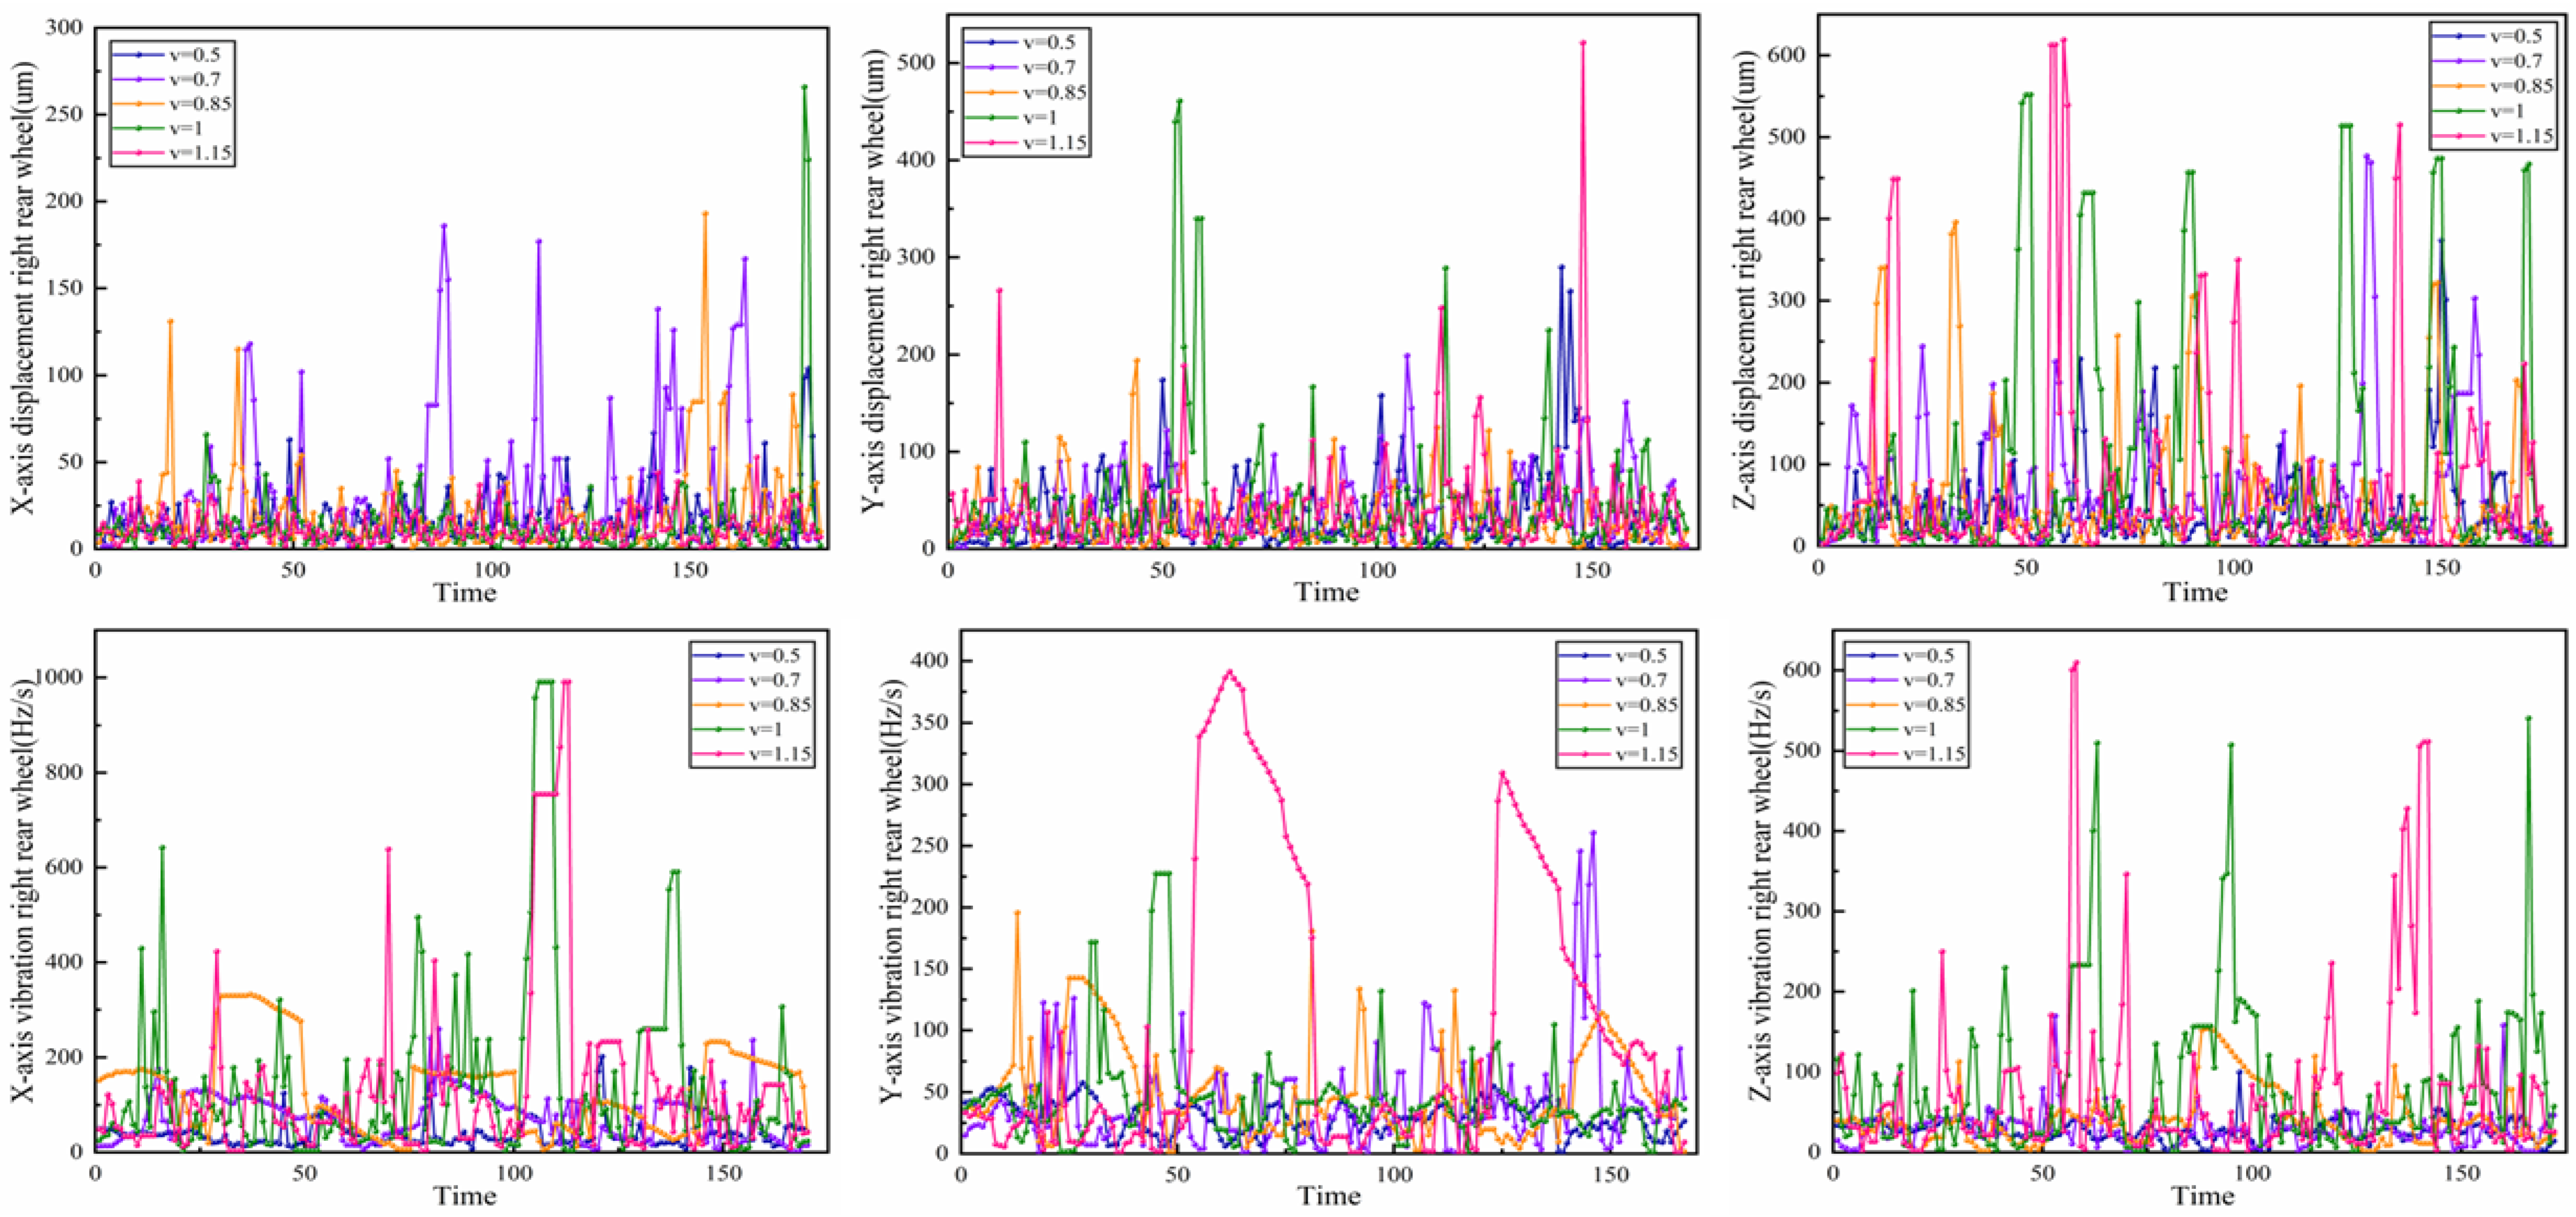
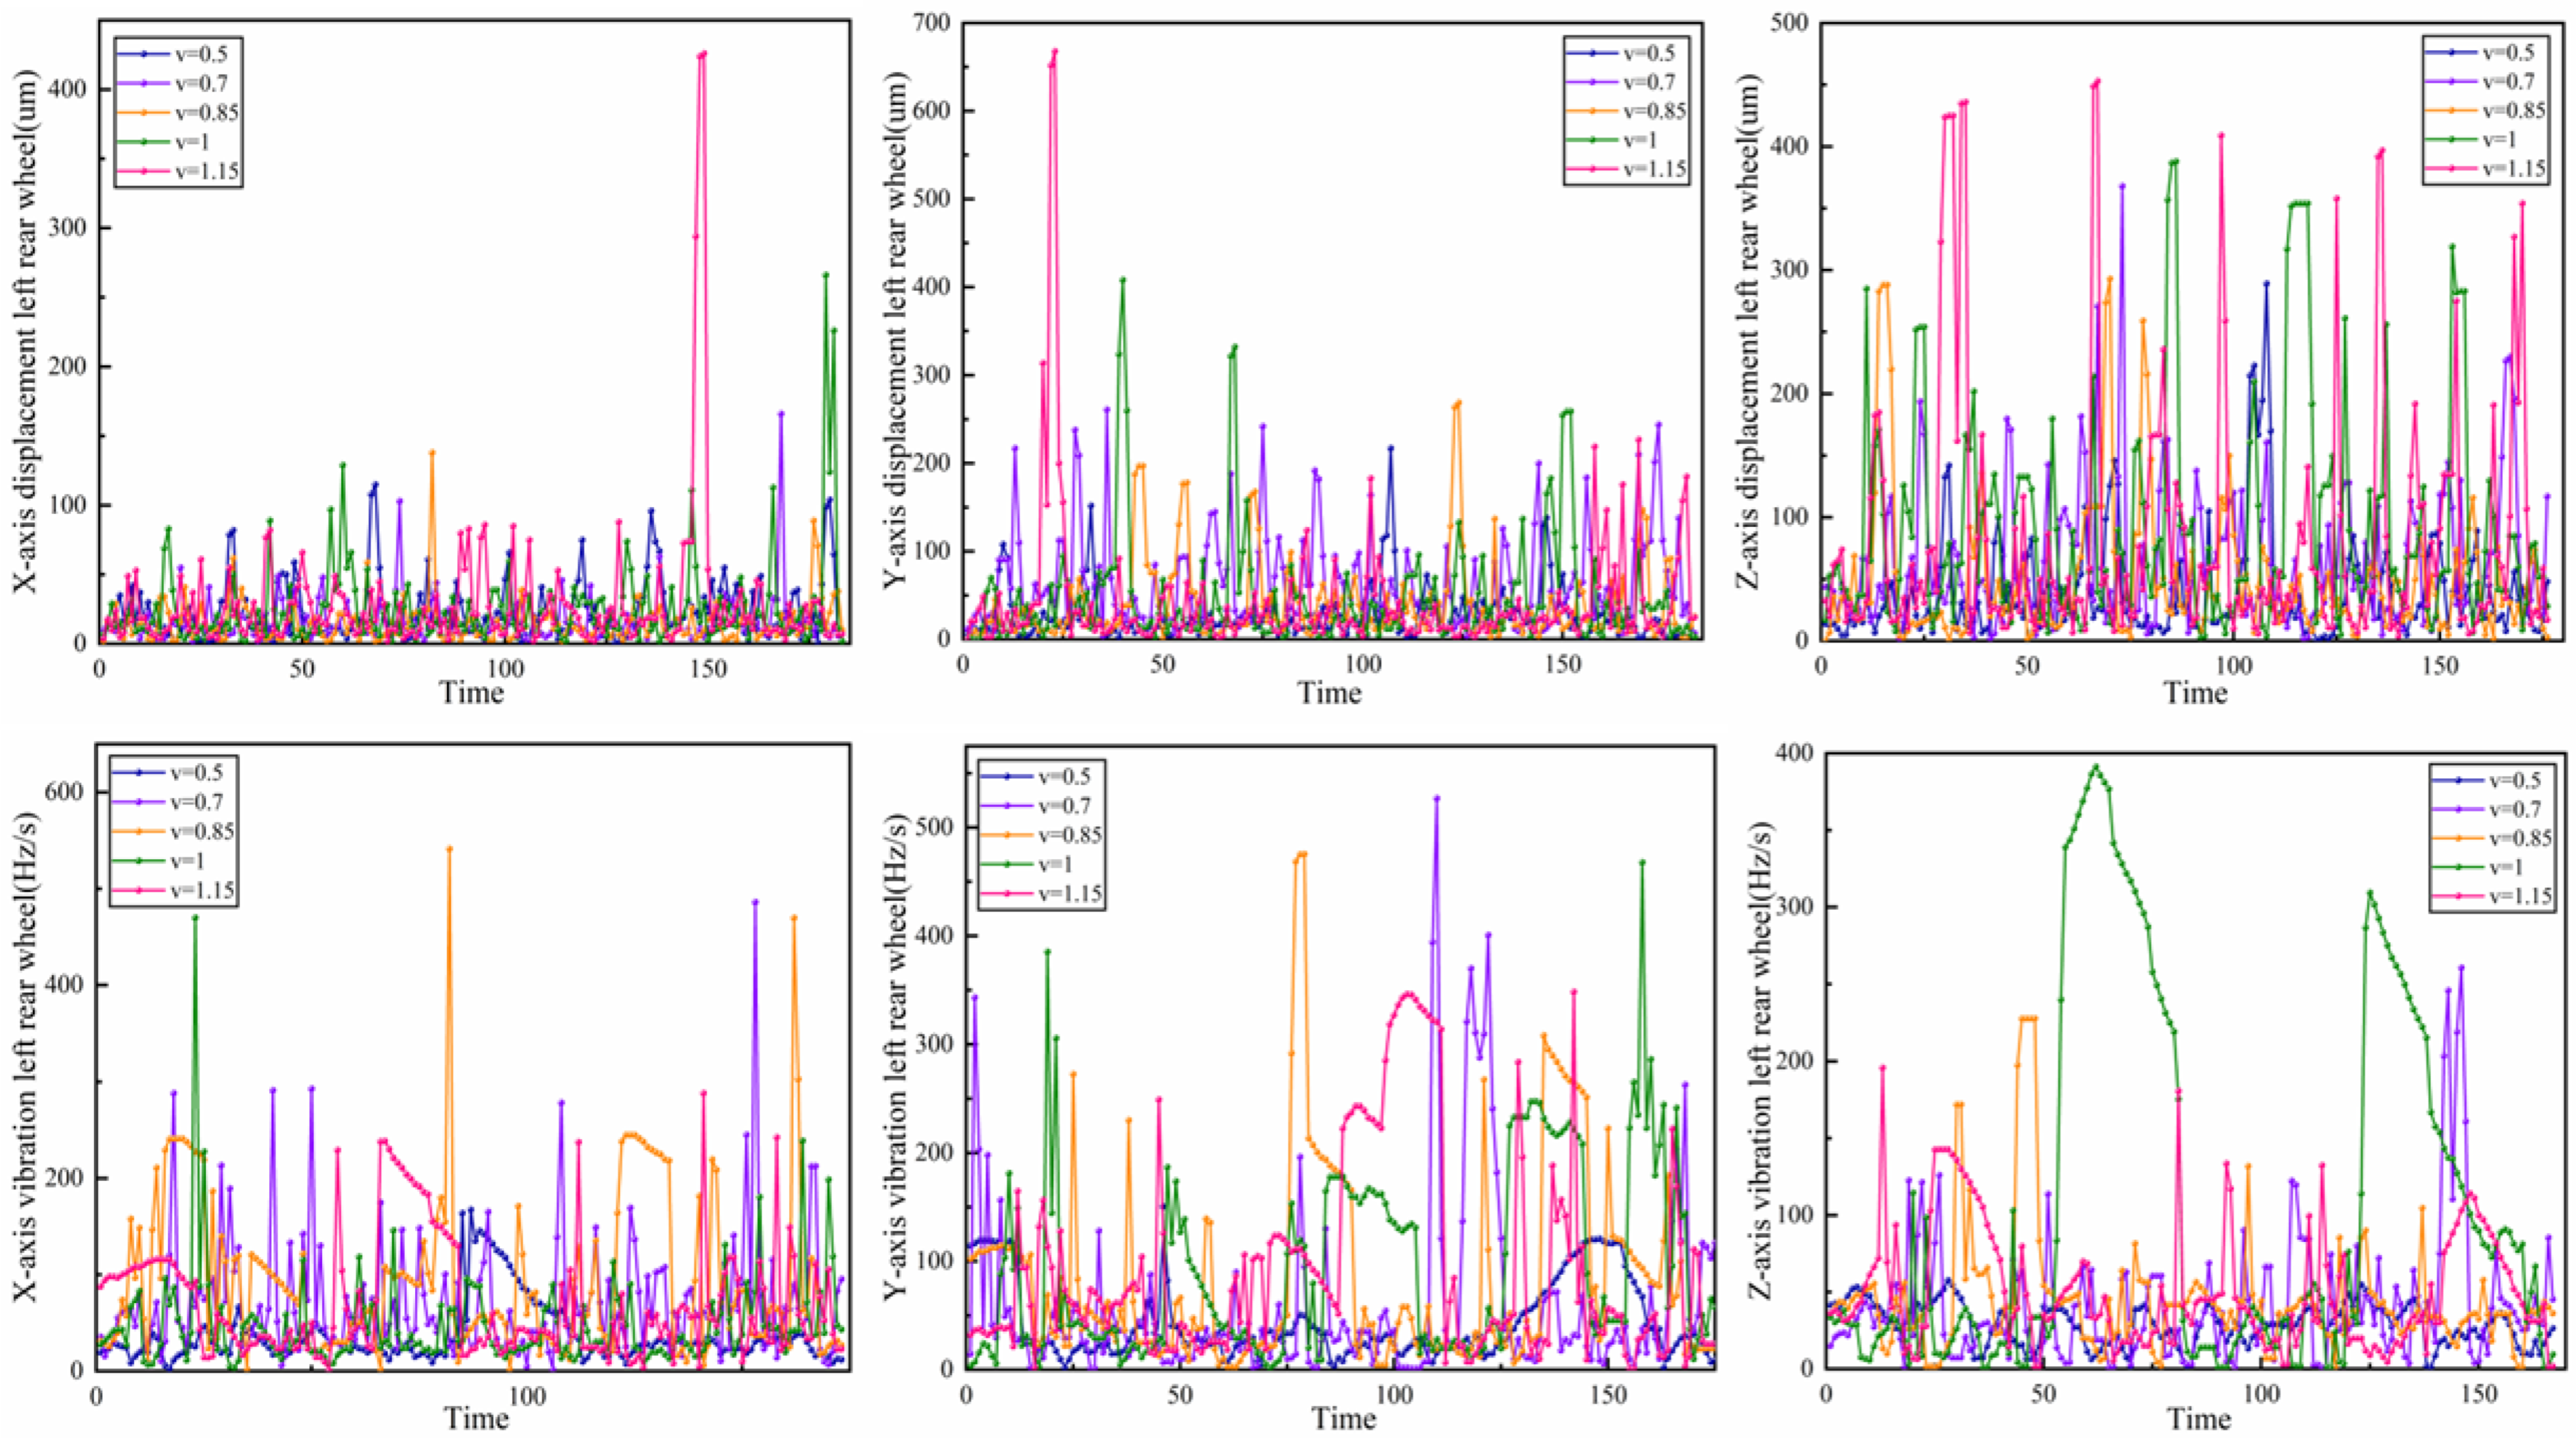
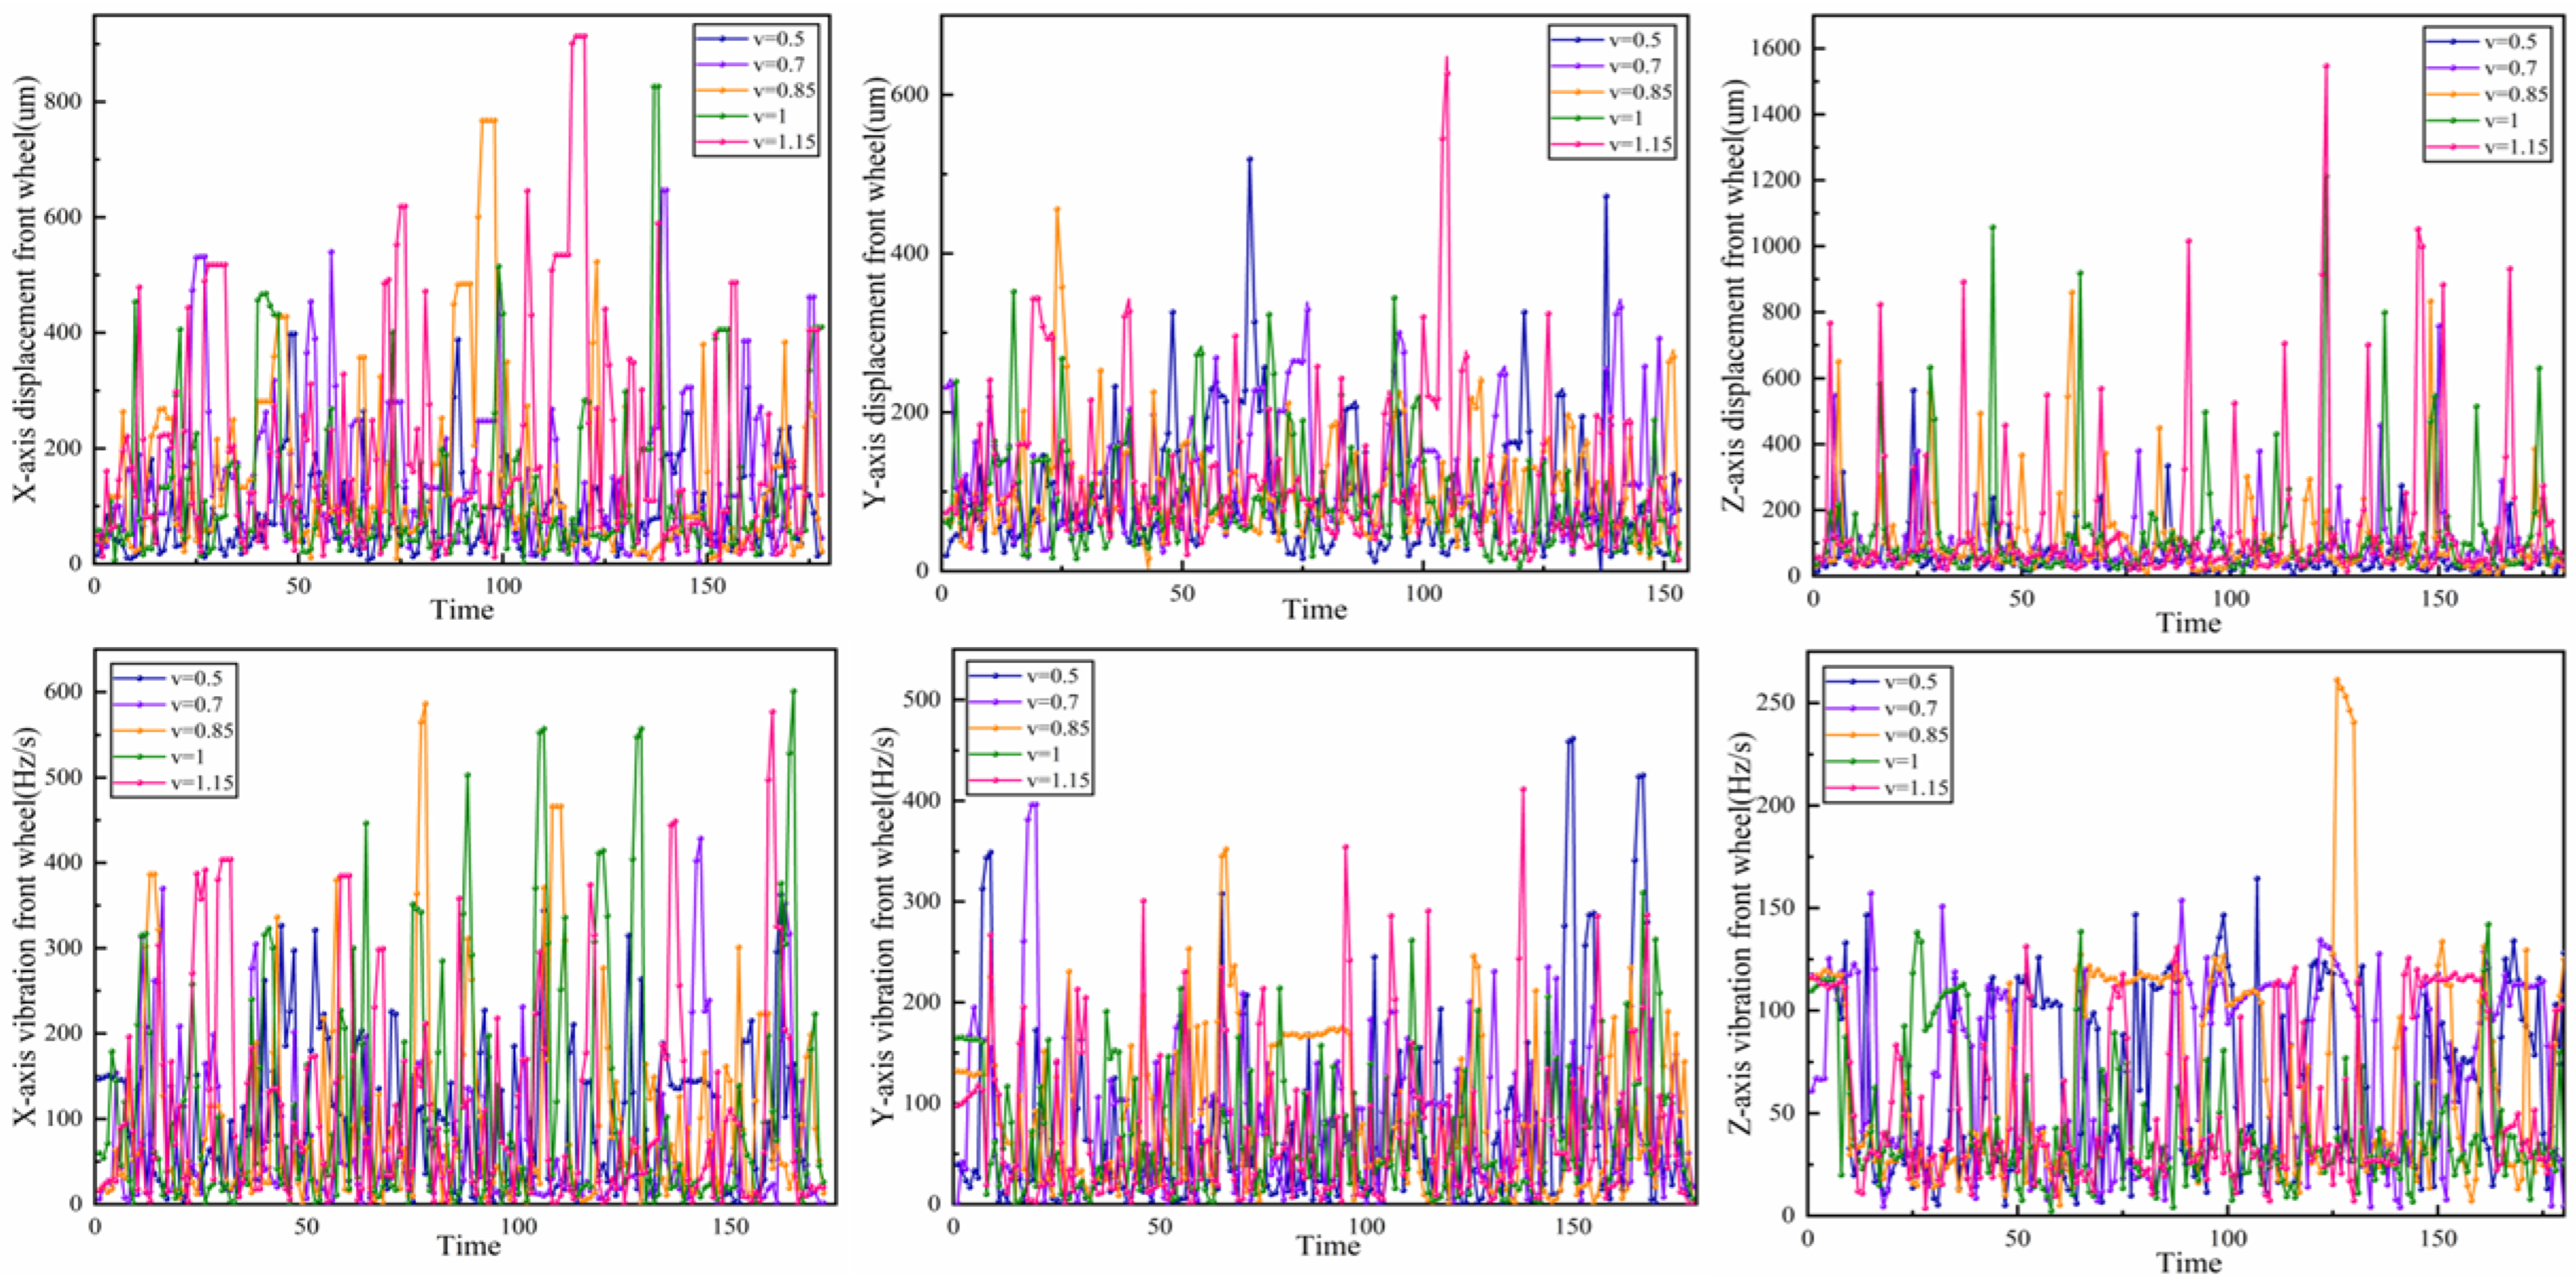
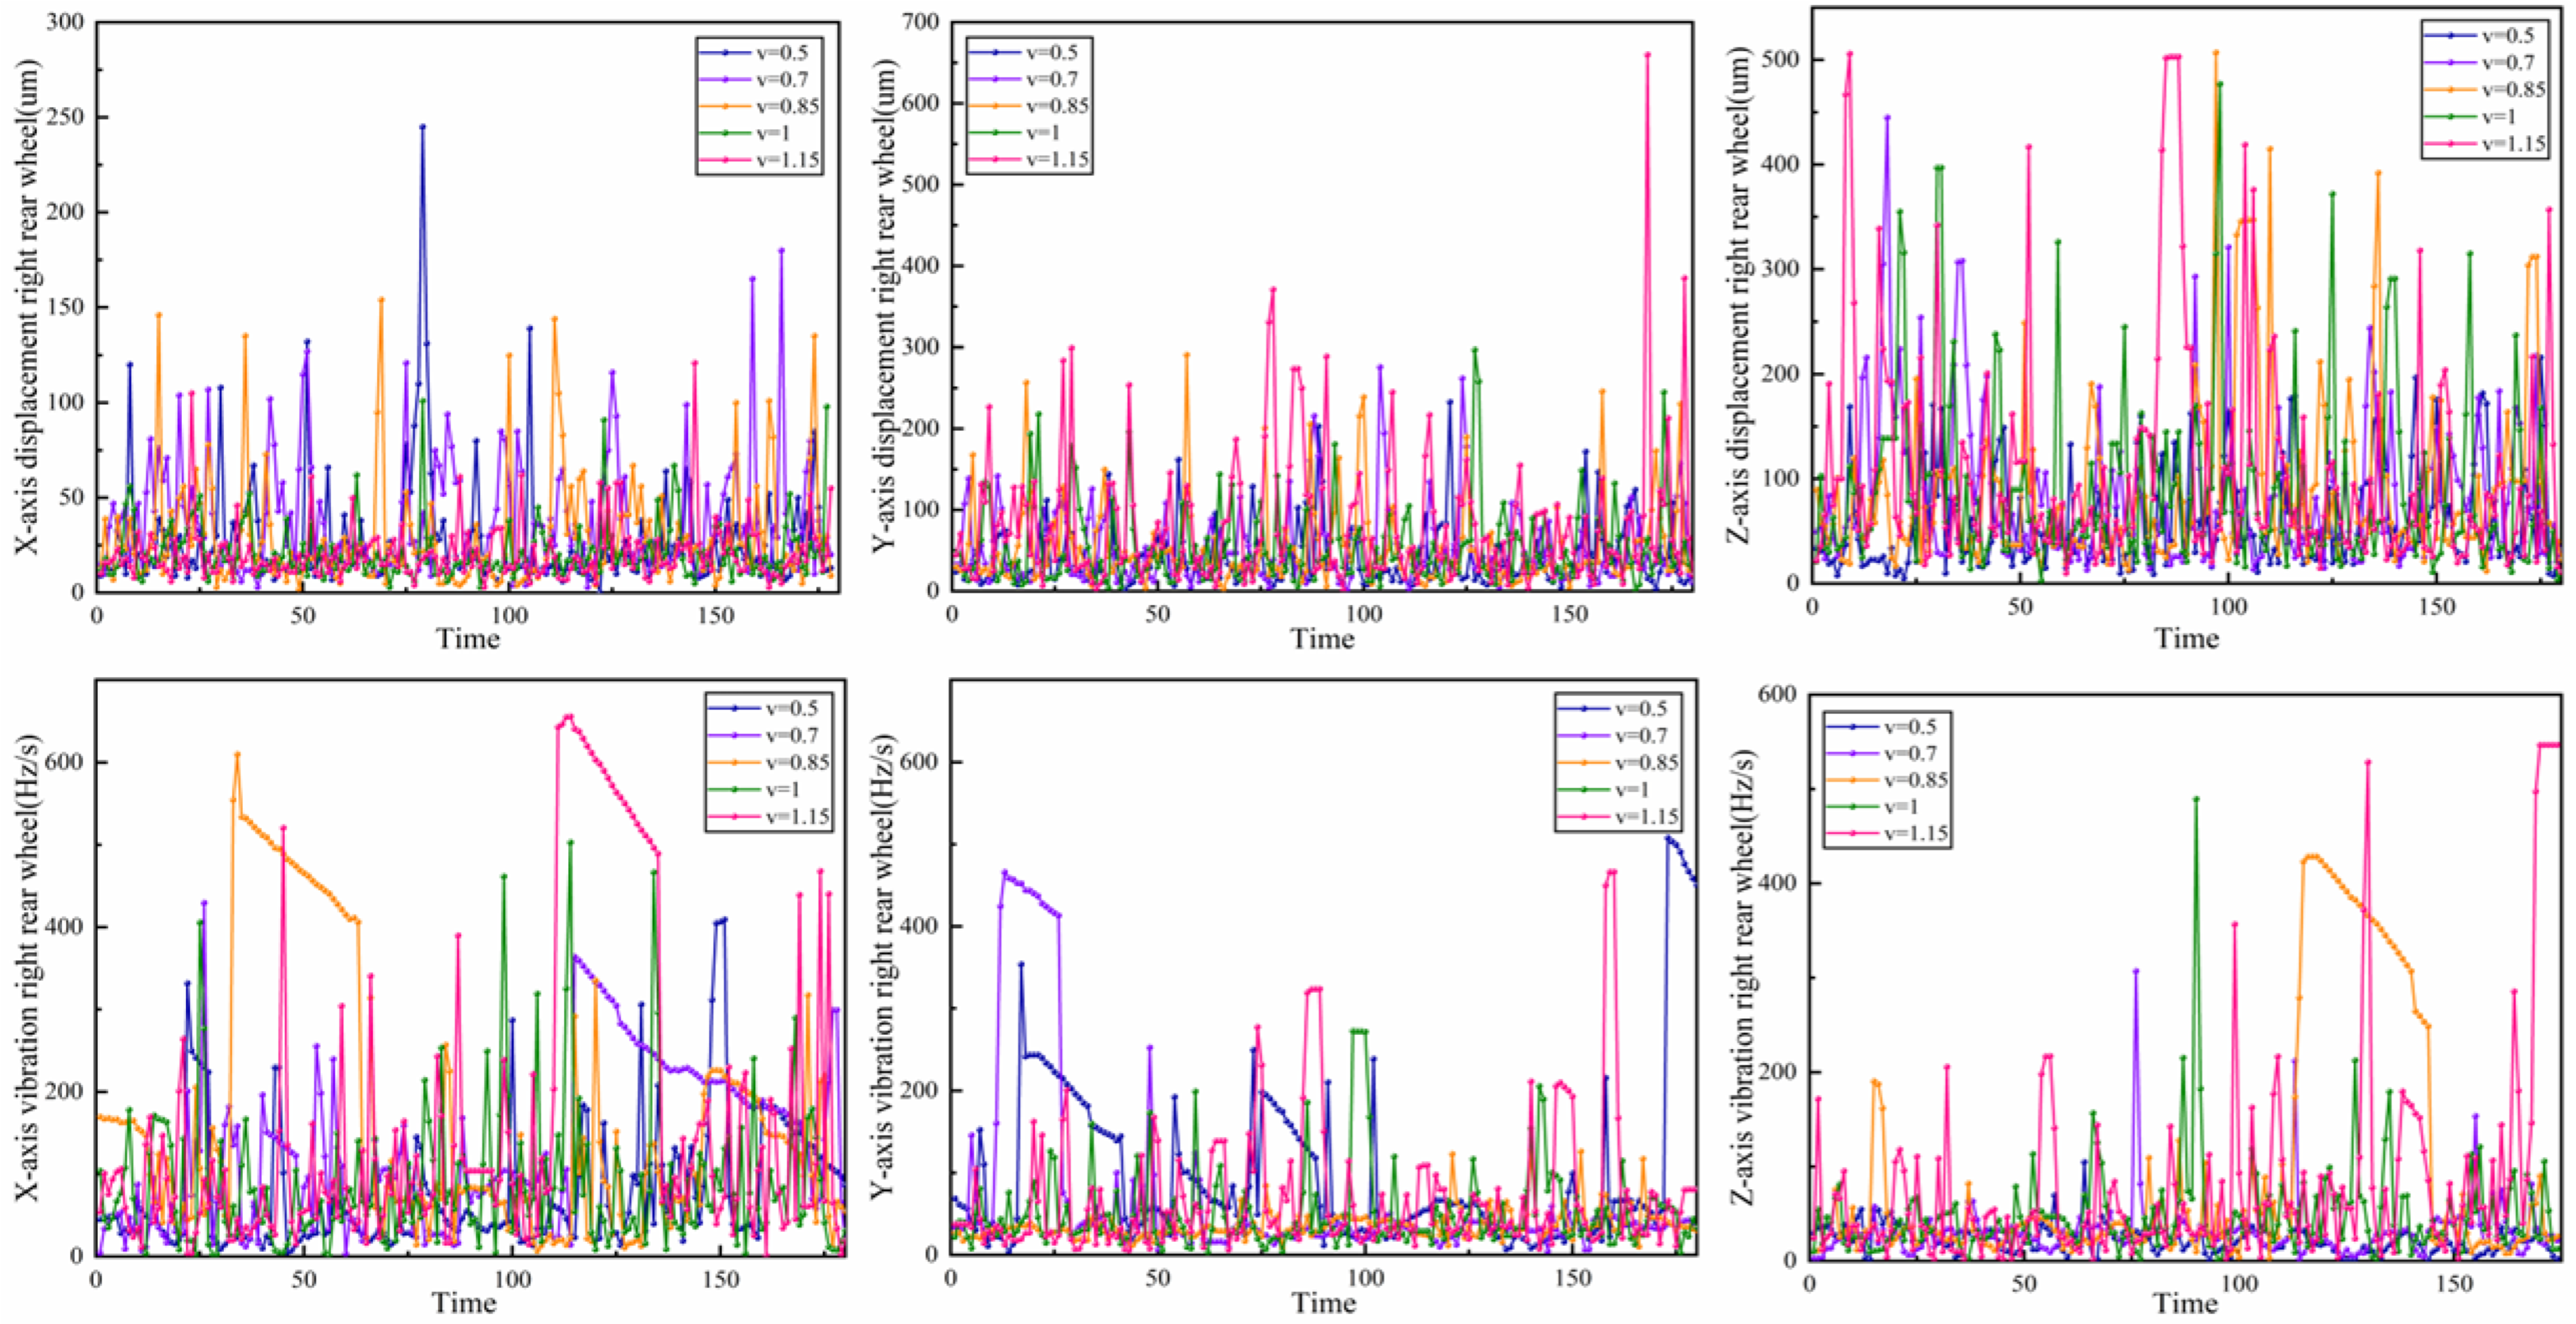
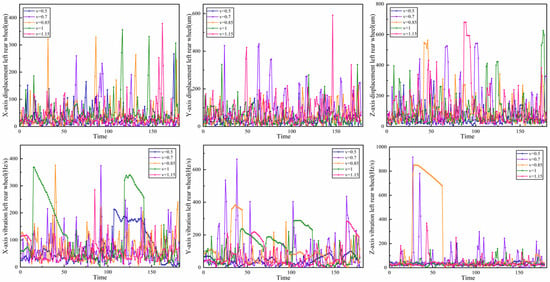
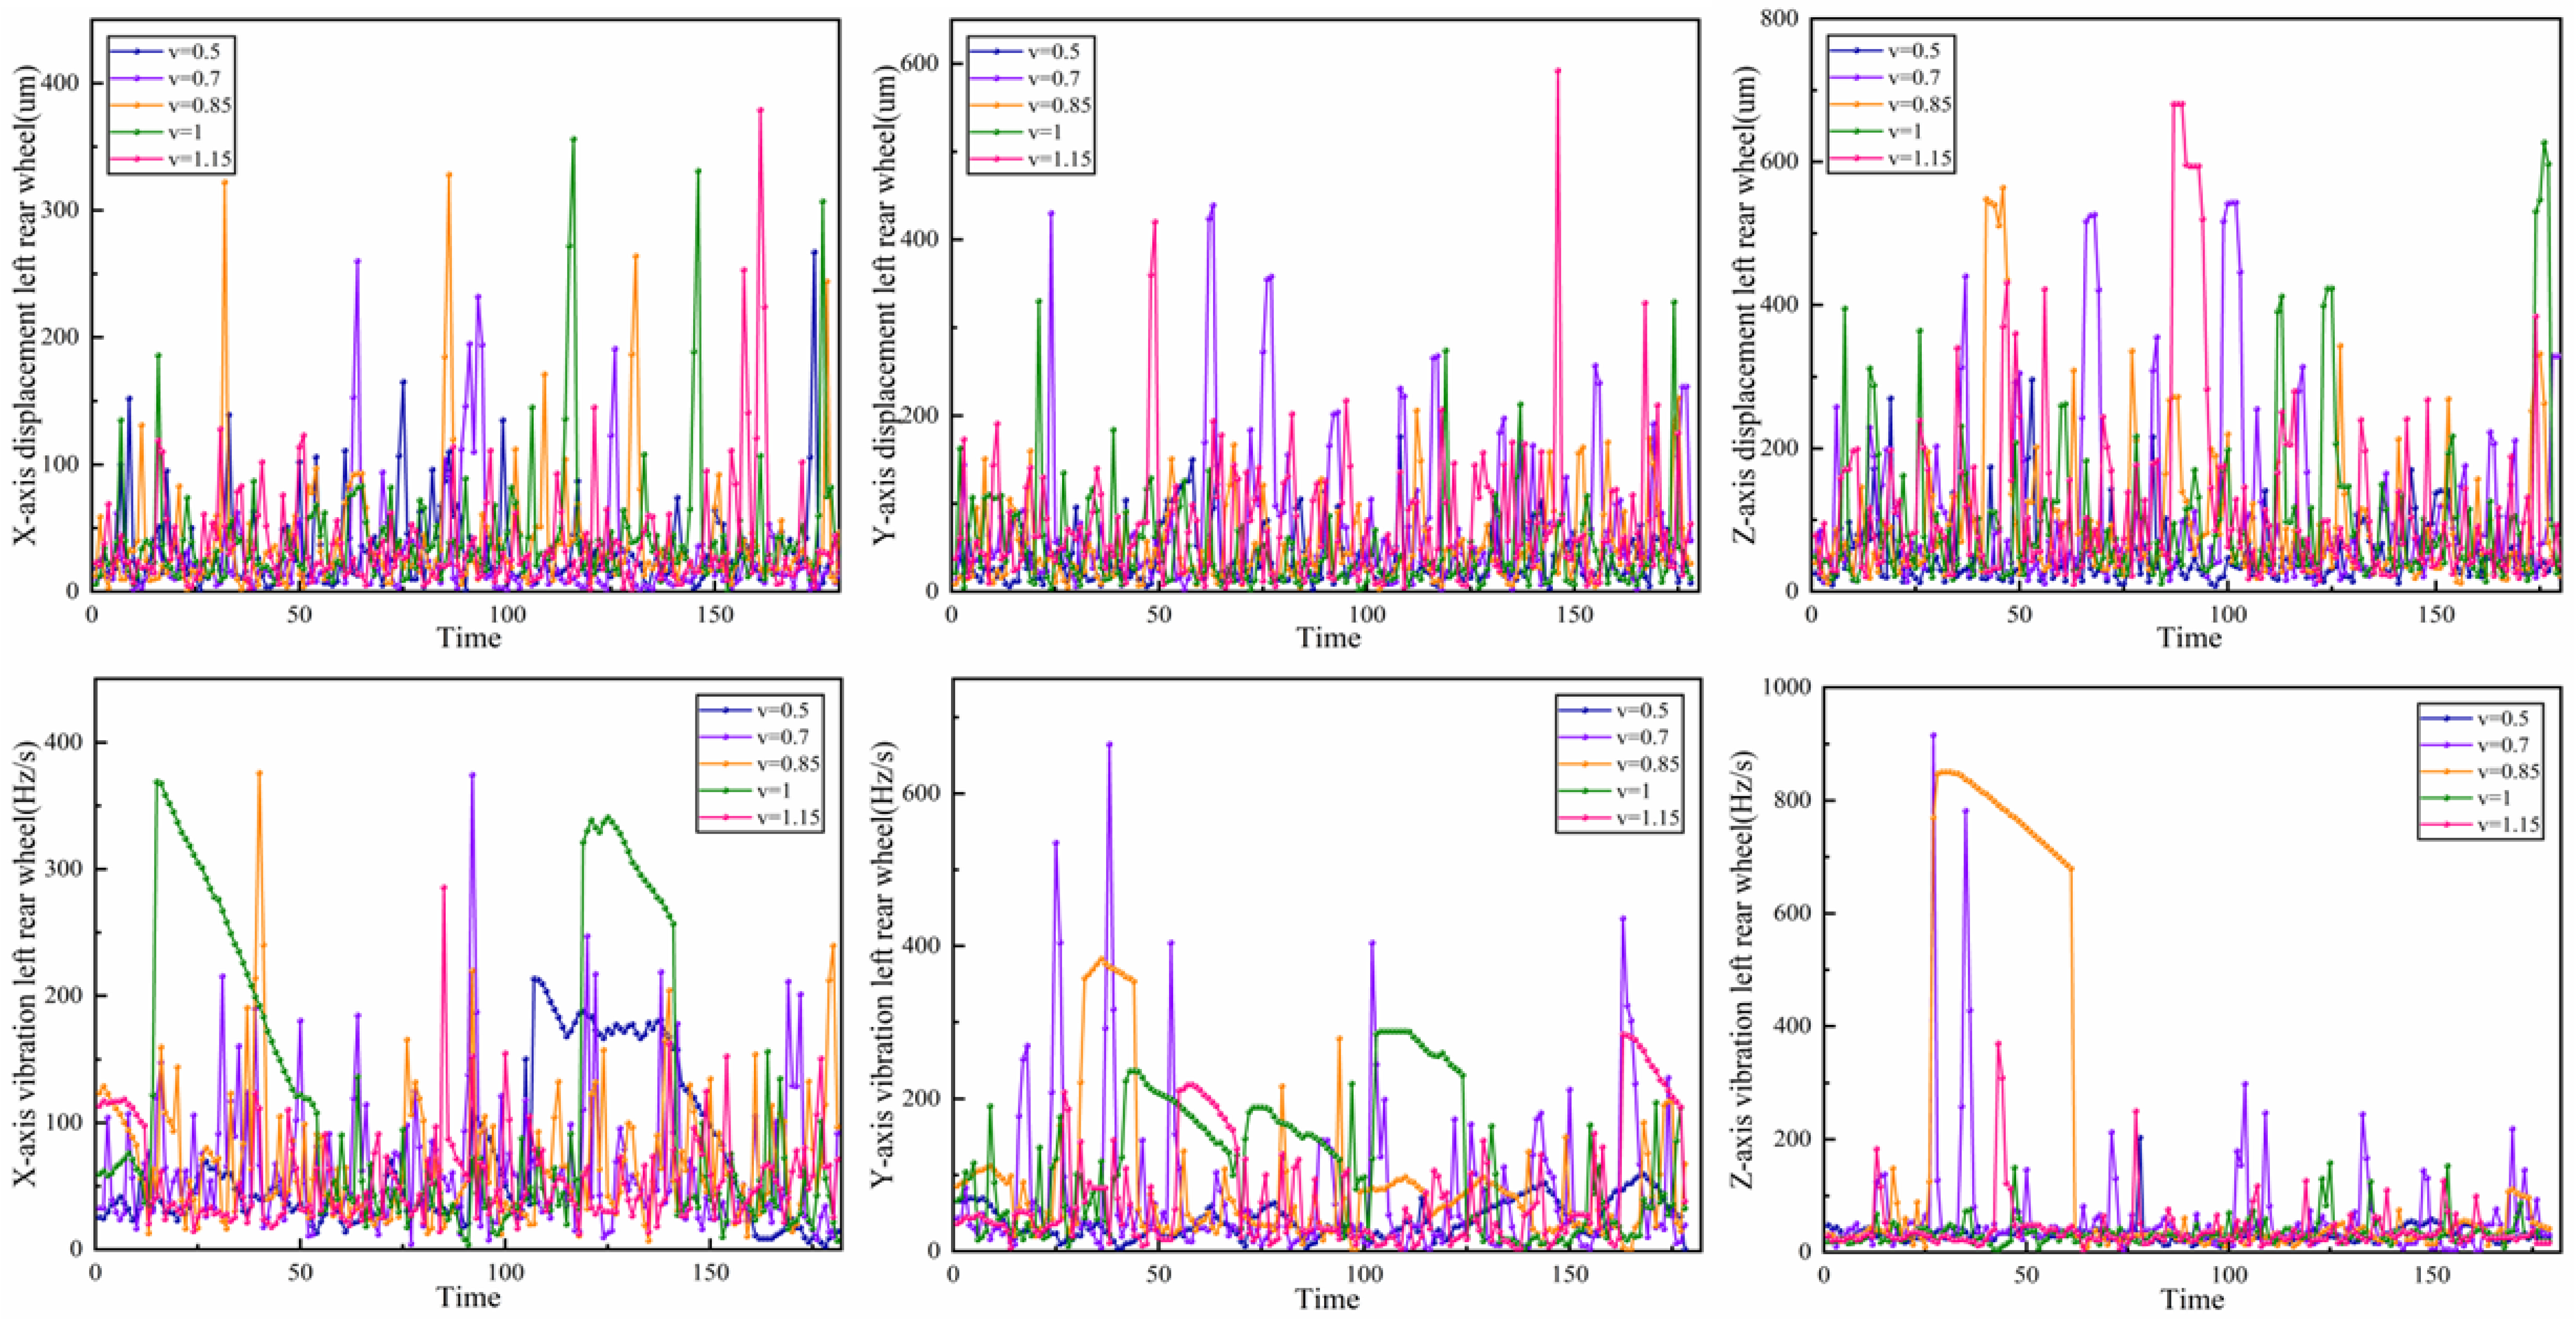

Disclaimer/Publisher’s Note: The statements, opinions and data contained in all publications are solely those of the individual author(s) and contributor(s) and not of MDPI and/or the editor(s). MDPI and/or the editor(s) disclaim responsibility for any injury to people or property resulting from any ideas, methods, instructions or products referred to in the content. |
© 2026 by the authors. Licensee MDPI, Basel, Switzerland. This article is an open access article distributed under the terms and conditions of the Creative Commons Attribution (CC BY) license.