


Abstract
Conventional linear isolators struggle to combine high static load-bearing capacity with effective low-frequency vibration isolation. To address this limitation, this study proposes an inclined rhombic crab-inspired quasi-zero-stiffness (I-QZS) isolator. A generalized static model is established based on the segmented linkage of crab walking legs. A physics-constrained NSGA-II algorithm is used to optimize the key geometric parameters while preventing bistable snap-through by imposing a positive-stiffness constraint over the full stroke. A stiffness-compensation strategy bridges the gap between the ideal rigid-body model and the actual 3D-printed compliant structure. The dynamic response is represented by a cubic polynomial restoring-force model, and the resulting equations are solved using the incremental harmonic balance method with SVD (singular value decomposition)-based null-space continuation. Large-amplitude excitation experiments show that the I-QZS shifts the resonance peak to 0.77 Hz, reducing the peak frequency by 64.19% and the peak transmissibility by 67.06% relative to a linear isolator, while substantially broadening the isolation bandwidth. Bifurcation analysis further identifies stability boundaries for engineering design. These results provide an integrated theoretical and experimental framework for ultra-low-frequency passive vibration isolation.
1. Introduction
Vibration control remains a fundamental challenge in precision instrumentation [1,2], aerospace systems [3,4,5,6], ocean engineering [7,8], and civil engineering [9,10,11]. Conventional linear isolators are constrained by the inherent trade-off between high static load-bearing capacity and low dynamic stiffness. Consequently, the onset frequency of isolation is generally limited by the natural frequency of the system. Simply reducing the stiffness to extend the low-frequency isolation range inevitably increases static deflection and shifts the operating point, potentially causing structural instability [12,13,14]. To overcome this long-standing engineering limitation, quasi-zero-stiffness (QZS) isolation has emerged as an active research topic in nonlinear dynamics [15,16,17].
Researchers have investigated several approaches to realizing negative-stiffness mechanisms [18,19,20,21,22]. Mechanical spring assemblies and shape memory alloy springs can exhibit near-zero stiffness over a prescribed displacement range through preload adjustment [23,24]. Nonlinear curved beams and pre-buckled beam structures generate negative stiffness through geometric nonlinearity without external energy input; however, once fabricated, their stiffness characteristics are fixed and difficult to adapt to different loads [25,26]. Magnetic regulation and smart flexible materials enable real-time stiffness variation through external fields, but this tunability increases system complexity and requires external energy and control hardware [27,28,29]. Thus, although these approaches offer distinct advantages, their stiffness is either difficult to adapt to changing operating conditions or achieved at the expense of system simplicity and reliability. By contrast, purely geometric nonlinear structures offer clear force-transmission paths, readily adjustable design parameters, modular construction, and passive QZS behavior, providing advantages in reliability and maintainability [30,31,32].
The refined configurations of biological locomotion and vibration-mitigation systems in nature provide rich geometric and topological inspiration for engineering isolator design. Configuration features have been extracted from secretary birds, spider legs, kangaroo hind limbs, and polygonal biological skeletons to develop a range of bio-inspired isolation topologies with tailored mechanical responses [33,34,35,36,37,38]. However, many of these designs attempt to reproduce biological multi-degree-of-freed40om motion and adaptive functions, which increases mechanism complexity and the number of design parameters and limits their translation into practical engineering devices. Current QZS isolators still face the following key challenges in global stability, rigid–compliant mapping calibration, and the coupled understanding of parameters and stability:
First, most existing QZS optimization designs use single-objective or weighted-sum strategies and therefore lack a systematic Pareto trade-off between maximizing the QZS interval and minimizing stiffness deviation. More importantly, studies on the threshold conditions for snap-through bifurcation are often limited to identifying critical points on force-displacement curves. They rarely incorporate non-negative stiffness over the full stroke as a mandatory hard boundary constraint at the design stage.
Second, most nonlinear dynamic analyses rely on ideal pseudo-rigid-body and ideal-hinge assumptions, treating links as purely rigid members and hinges as frictionless ideal revolute pairs. When such theoretical models are transferred to real compliant continua, however, the links inevitably experience Euler buckling and lateral parasitic bending under large deformation, while flexible hinges also exhibit parasitic bending and stress concentration.
Third, studies of existing bio-inspired QZS isolators mainly focus on proposing specific configurations and verifying isolation performance under selected operating conditions, while the global bifurcation evolution path of the system under base excitation remains insufficiently characterized. In addition, parametric analysis and bifurcation analysis are often treated separately: the former emphasizes the qualitative influence of parameters on transmissibility curves, whereas the latter examines the evolution of global stability with parameter variation. The coupling between these two aspects has not yet been systematically clarified.
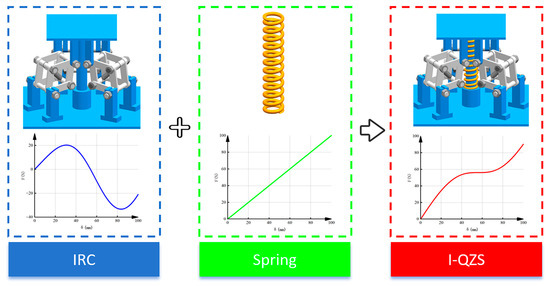
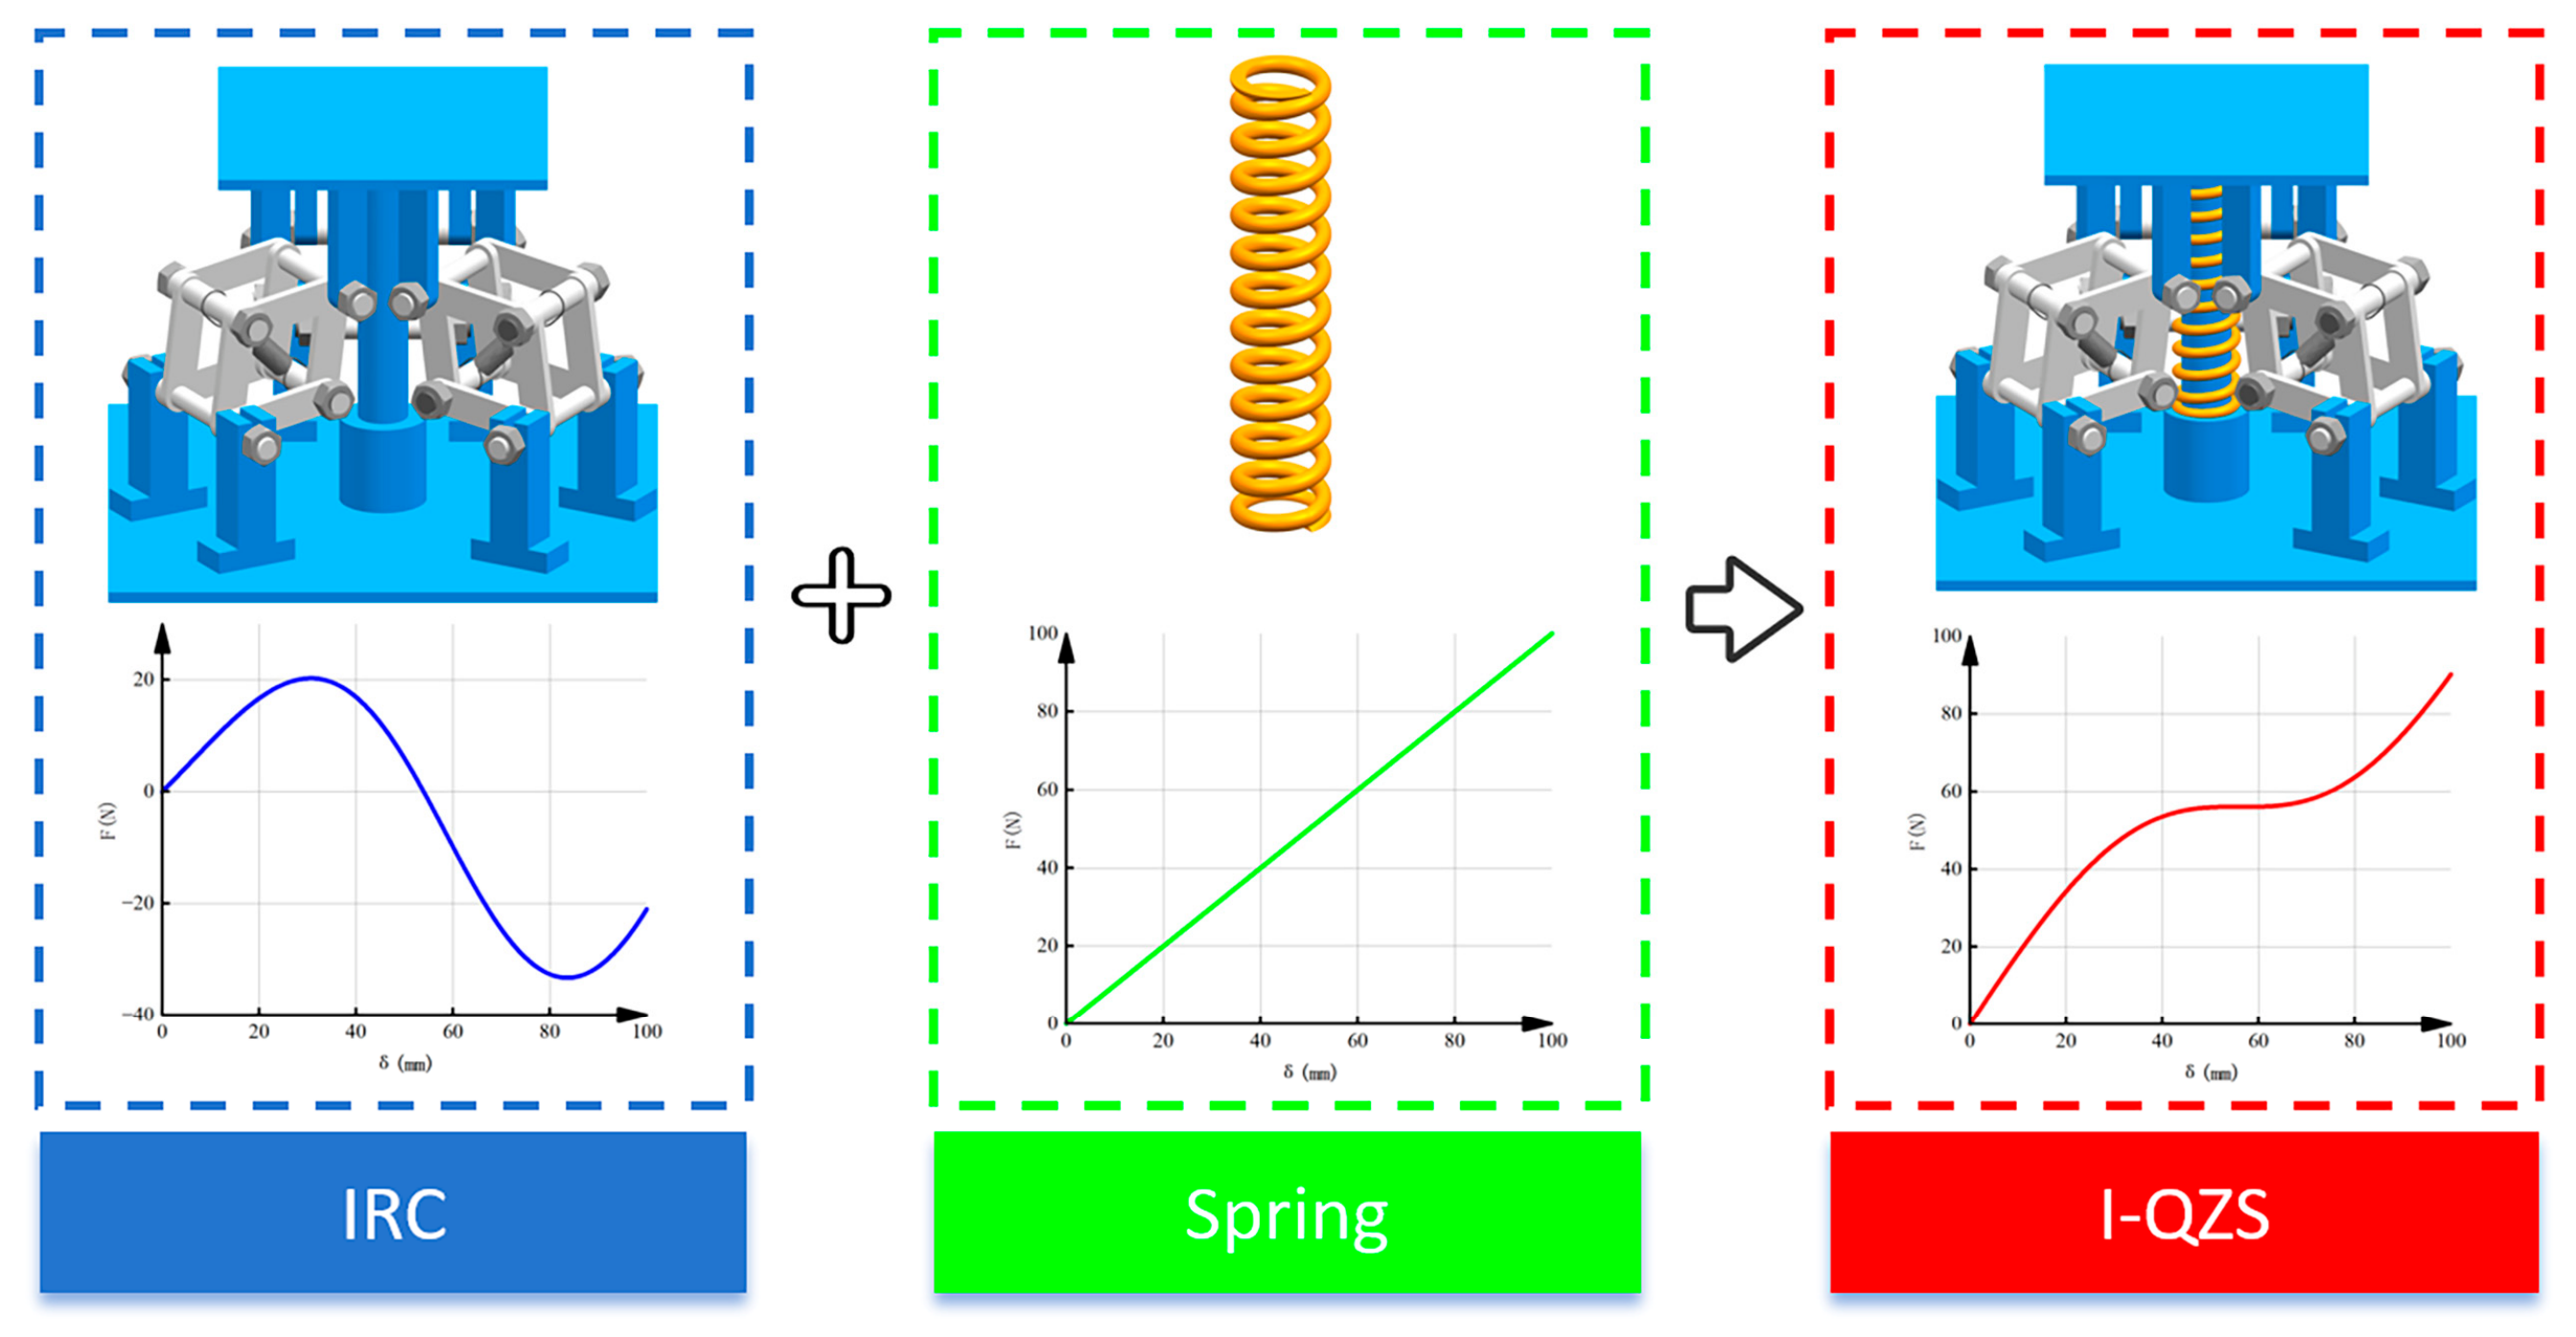
To address these limitations, this paper proposes a circumferentially distributed, crab-inspired inclined rhombic quasi-zero-stiffness isolator (I-QZS), as shown in Figure 1. A nonlinear static and dynamic analytical model incorporating compliance compensation is established. An NSGA-II algorithm with a full-stroke hard constraint is used for parameter optimization. The incremental harmonic balance (IHB) method, dynamic experiments, and bifurcation analysis are then combined to characterize the low-frequency isolation performance of the proposed structure.
Figure 1.
3D model of the rhombic structure.
The remainder of this paper is organized as follows: Section 2 presents the structural design, static modeling, and finite-element calibration. Section 3 establishes the dynamic model and analyzes displacement transmissibility, parameter sensitivity, and nonlinear response characteristics. Section 4 presents the quasi-static and dynamic experimental validation and bifurcation analysis, followed by a discussion of the results and limitations. Section 5 summarizes the main conclusions.
2. Structural Design and Static Modeling of the Crab-Inspired Isolator
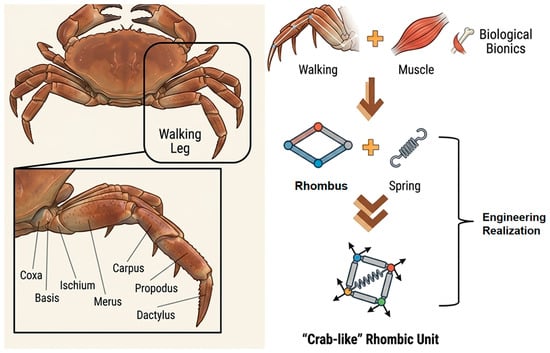
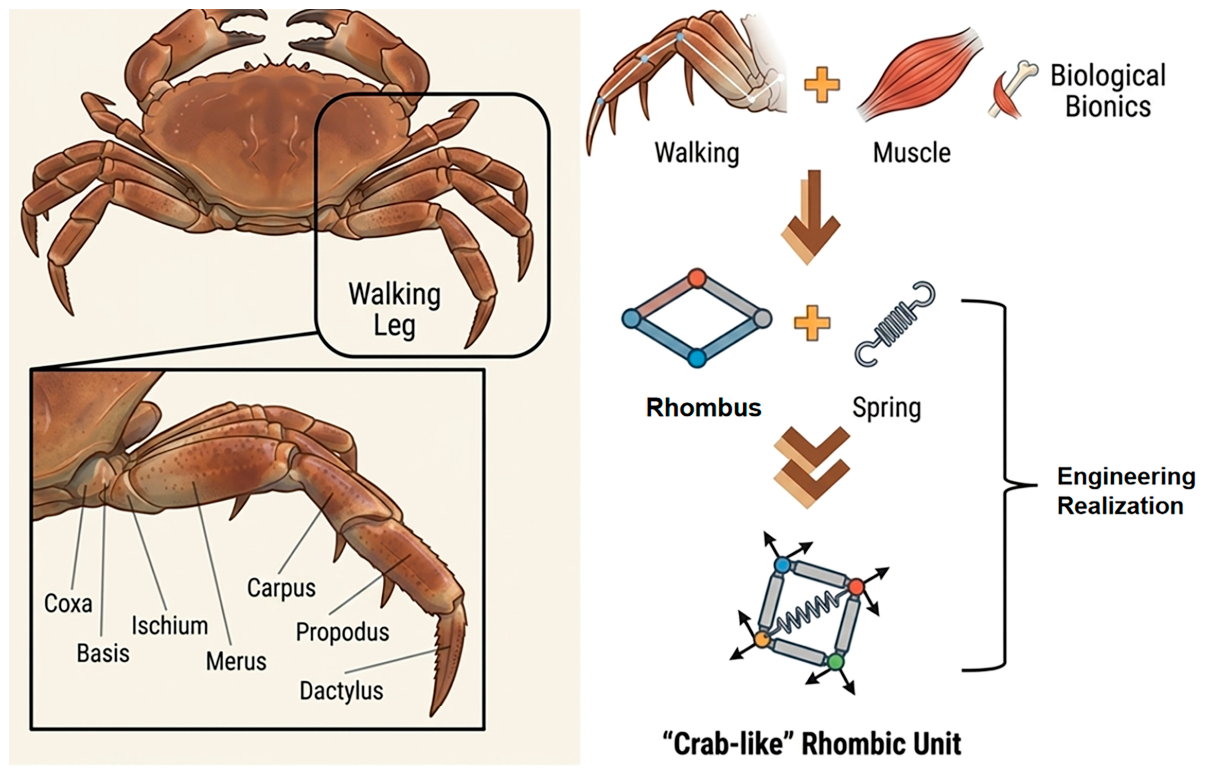
In nature, organisms have evolved highly efficient motion and vibration-reduction mechanisms through long-term adaptation, providing valuable inspiration for engineering innovation. Crabs are arthropods characterized by their unique lateral locomotion and adaptability to complex environments. Each crab walking leg consists of seven segments extending outward from the body: coxa, basis, ischium, merus, carpus, propodus, and dactylus. This study proposes a bio-inspired mechanism based on the segmented and articulated structure of crab legs, as shown in Figure 2. The coxa, basis, and ischium are abstracted as an upper support frame of the rhombic mechanism. The merus serves as the upper link of the rhombic unit, while the carpus and propodus together form the lower link, and the dactylus acts as the lower support frame. The merus, carpus, and propodus together constitute one side of the rhombus, while the other side is introduced to complete the rhombic mechanism unit. A tension spring is used to mimic the elastic restoring behavior of leg muscles. To improve overturning stability, multiple rhombic units are uniformly distributed along the circumference, and a vertical positive-stiffness spring is arranged at the center. These components together form the inclined crab-inspired quasi-zero-stiffness isolator (I-QZS).
Figure 2.
Biomimetic evolution of the crab-inspired gait design and its schematic principle.
It should be noted that the crab-leg analogy adopted in this study is based on structural configuration rather than biological function. The biomechanical advantages of crab legs primarily arise from their multi-degree-of-freedom flexibility and adaptability to complex terrain. In contrast, this study abstracts the segmented linkage of crab legs into a rhombic mechanism and uses a central spring to mimic muscle-like elastic recovery. Only the geometric relationship is exploited to generate negative stiffness, which is then combined in parallel with the positive stiffness provided by the central spring to form a QZS system. This geometric and kinematic analogy is intended to simplify the structure for engineering implementation while retaining the desired passive vibration-isolation characteristics.
This section first presents the static analysis of the crab-inspired unit, hereafter referred to as the Inclined Rhombic Crab-like Unit (IRC). The structural parameters and performance indices of the IRC are determined. The effects of the main structural parameters on the performance of the IRC are then investigated. The conditions required to achieve QZS behavior, including those related to the central angle and inclination angle, are identified, and the corresponding structural design equations are derived.
2.1. IRC Structural Design and Static Analysis
Each crab-inspired inclined rhombic crab-like (IRC) unit is assembled from two rhombic frames interconnected via four rotary hinges. A pre-tensioned tension spring is mounted across a pair of opposite rotary hinges of the double frames, constructing the composite linkage-spring mechanism with bionic crab-leg characteristics.
The structural parameters of the IRC unit include the rod length of the rhombic mechanism, the inclination angle, the included angle between adjacent rods, and the stiffness ratio. The simulated motion trajectory of the mechanism is shown in Figure 3.
Figure 3.
Simulated motion trajectory of the mechanism.
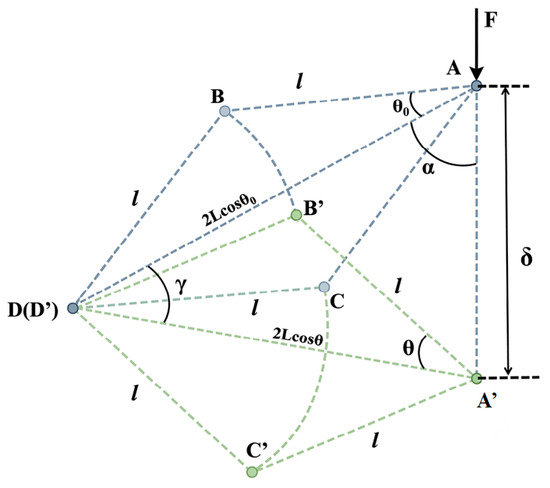
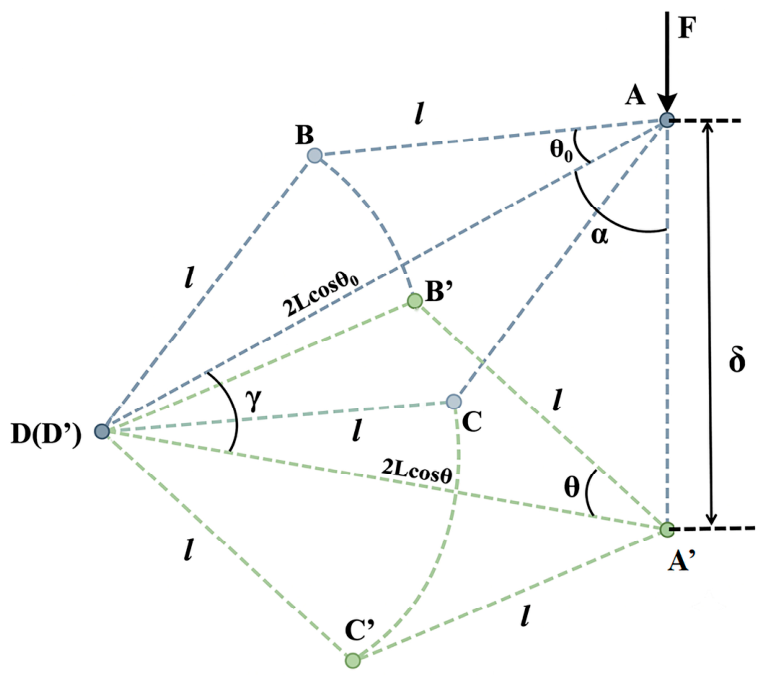
Considering the geometric relationships of the rhombic structure, the rod length is l, initial included angle is , vertical compression is δ, rhombic height is , rhombic width is , and compressed angle is θ. When the vertical spring compresses , the top of the diamond moves in the global Y direction by −δ.
When the structure is inclined at an angle α, the geometric relationship between and θ can be derived via the cosine law. For the rhombic configuration, the governing equation is:
Let x denote the lateral deformation, which is defined as the difference between the instantaneous width and the initial width in the local coordinate system. Based on the constraint of rod length, the following expression is derived:
The vertical force of the rhombic isolator is given by (for N tension springs connected in parallel)
The compressive force of the compression spring is
The vertical tensile force generated by the tension spring is
where represents the angle of the vertical centerline before and after compression. In accordance with the sine law (asinA = b/sinB = c/sinC = 2R), the following relation is established:
The stiffness ratio is defined as
The compression ratio is defined as
By combining Equations (2)–(9) and transforming the equations into a dimensionless form, the dimensionless restoring force is derived as:
where:
From Equations (10)–(12), the dimensionless restoring force of the isolator is governed by three key parameters: the stiffness ratio , the initial rhombic angle , and the inclination angle α. Adjusting the spring stiffness alone is insufficient to achieve the desired QZS characteristics; therefore, the relationship among these parameters must be jointly considered during the design stage.
2.2. Static Characteristic Analysis
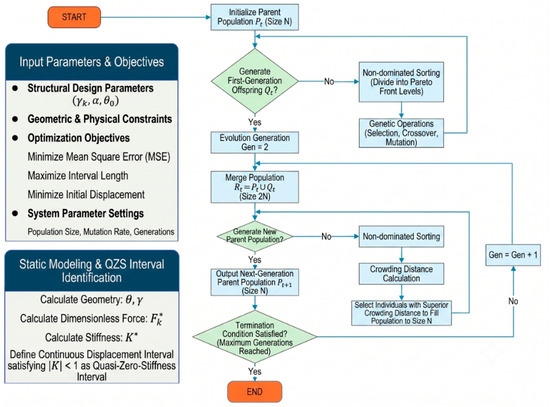
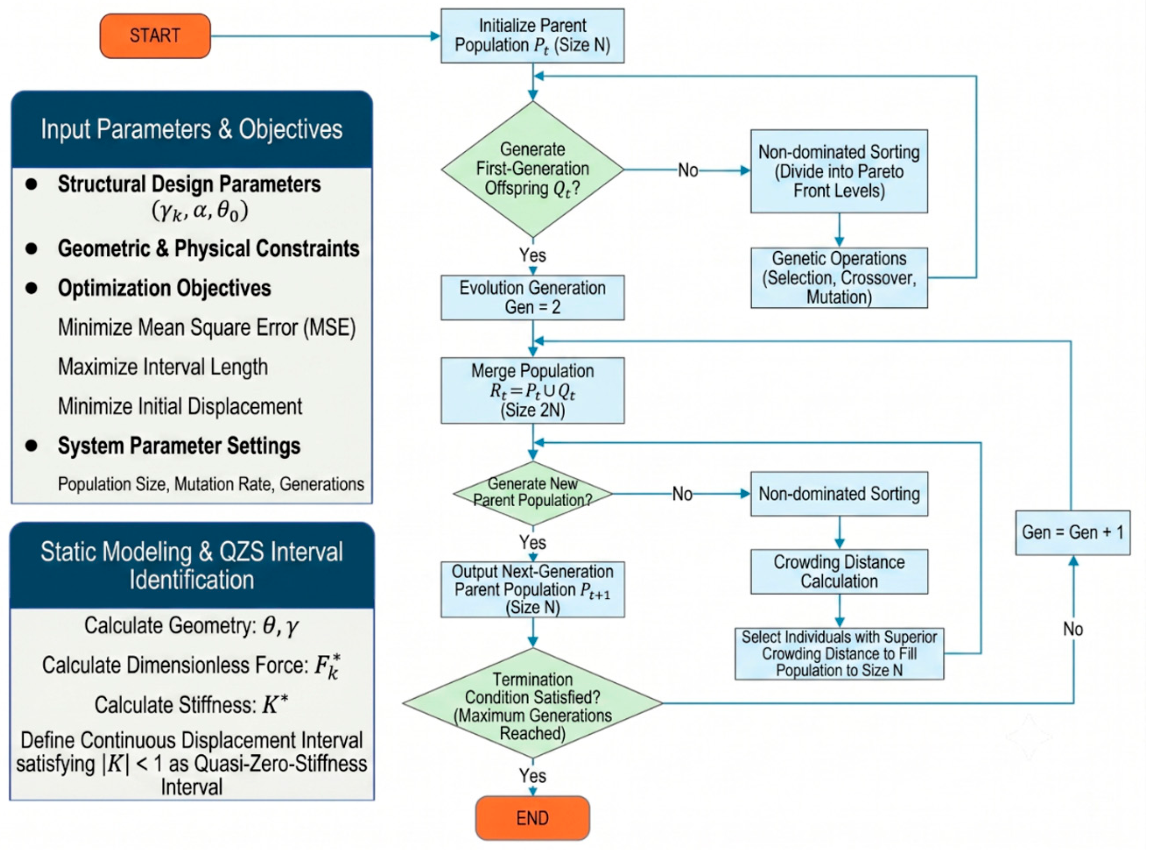
In this study, the non-dominated sorting genetic algorithm II (NSGA-II) is used to perform multi-objective optimization of the rhombic isolator parameters. The engineering design procedure is illustrated in Figure 4. During implementation, the algorithm iteratively optimizes three competing objectives: minimizing the mean-square error (MSE), maximizing the QZS-interval length, and minimizing the initial displacement to maintain a compact configuration and avoid excessive static deflection.
Figure 4.
Flowchart of the NSGA-II optimization algorithm.
Unlike conventional optimization strategies that prioritize negative-stiffness magnitude without explicitly enforcing full-stroke stability, this optimization framework introduces full-stroke positive stiffness () as a rigid physical boundary constraint. From an engineering perspective, this constraint eliminates negative-stiffness regions over the prescribed stroke, thereby reducing the risk of static snap-through and bistable responses. Consequently, infeasible configurations prone to static instability are excluded during optimization, improving the load-bearing stability of the resulting design.
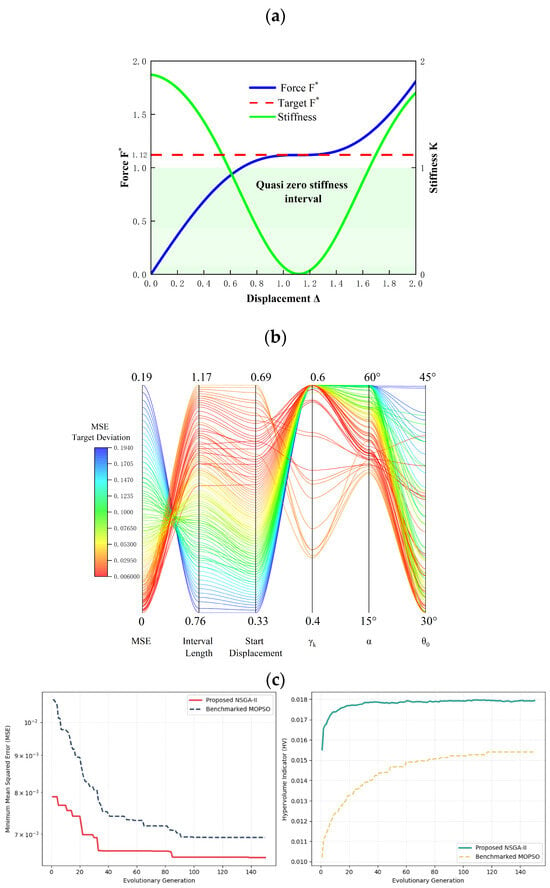
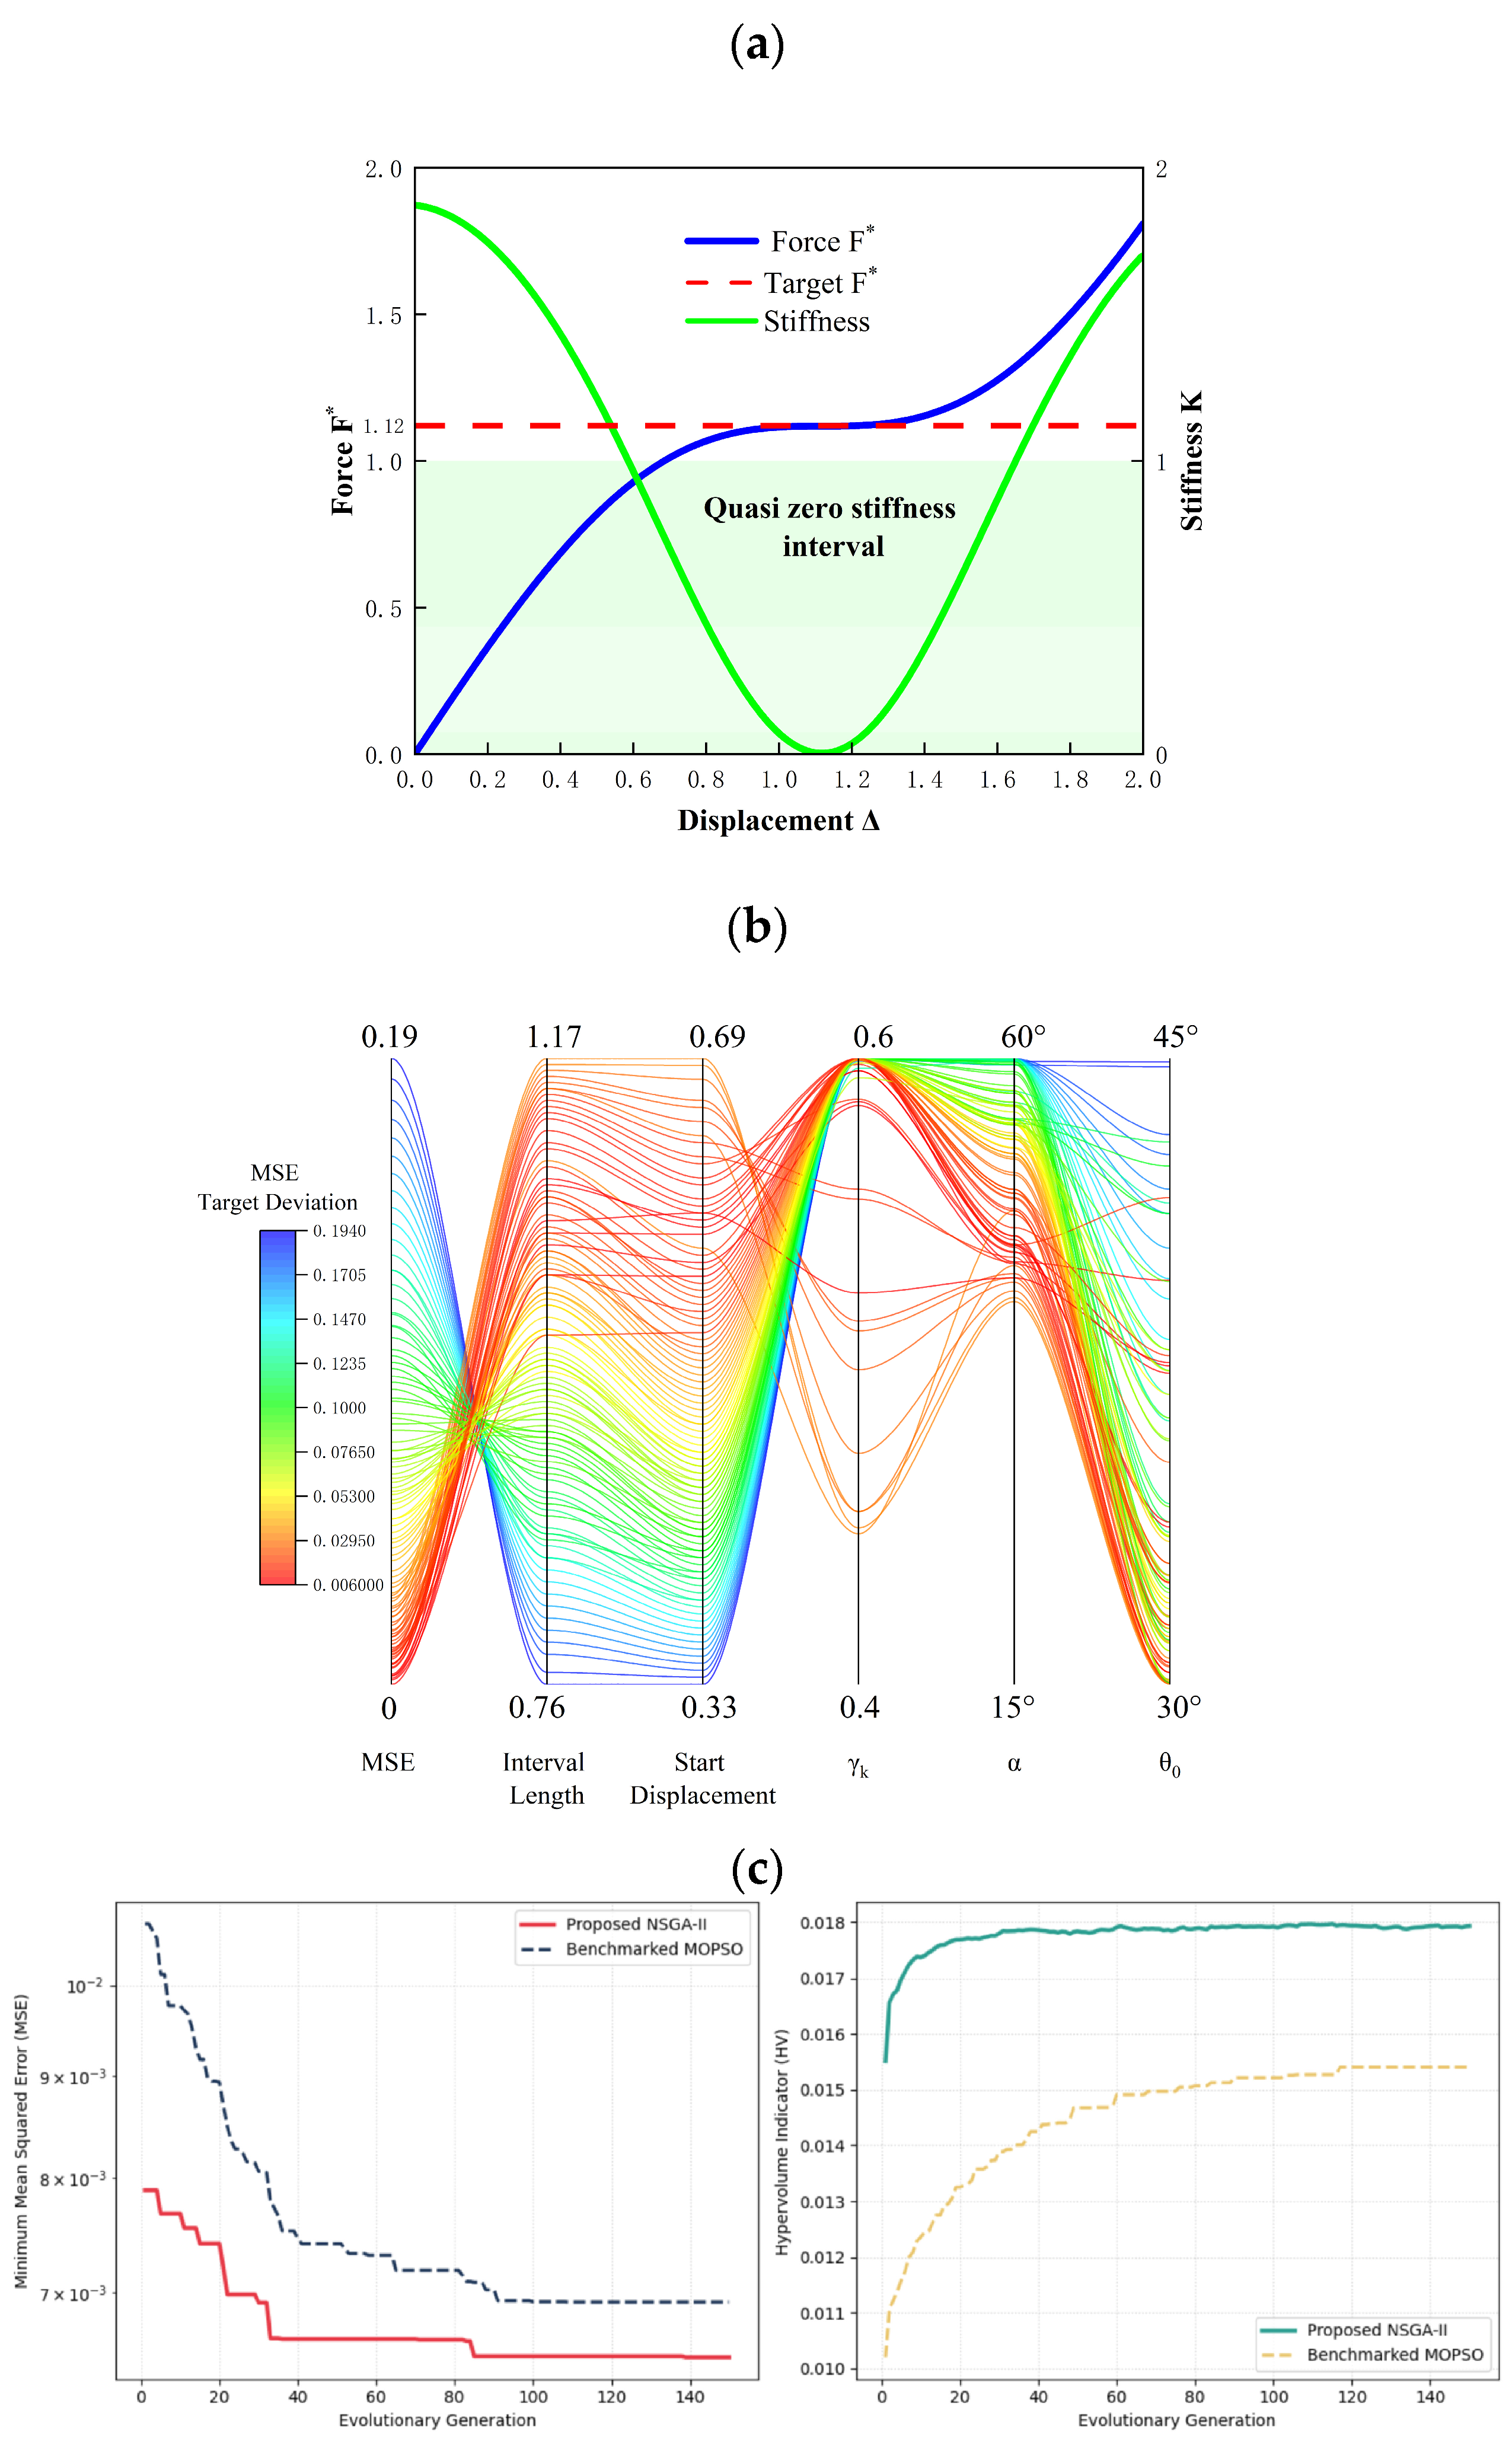
To comprehensively evaluate the effectiveness and optimization performance of the NSGA-II multi-objective optimization algorithm in the parametric design of the rhombic isolator, taking the preset target static load capacity (Ftarget = 1.12) as an example, this paper conducts an in-depth analysis of the optimization process and results through target convergence plots, hypervolume indicator plots, and a parallel coordinates plot of the Pareto front solution set. The parallel coordinates plot is specifically introduced to intuitively reveal the high-dimensional mapping relationships between the geometric design variables and the conflicting performance objectives. As depicted in Figure 5b, each continuous polyline represents a non-dominated Pareto optimal design scheme, tracing its specific geometric configuration—stiffness ratio , inclination angle α, and initial angle —directly to its corresponding performance metrics. A pronounced intersecting pattern is observed between the MSE and QZS length axes, which visually confirms the strong physical trade-off between the precision of the target load capacity and the effective working range of the isolation system.
Figure 5.
(a) Force–displacement and stiffness curves under the target load. (b) Three-dimensional scatter plot of the Pareto-front solution set. (c) Objective convergence and hypervolume index plots for the optimal parameters under the specified load.
The MSE curve obtained during NSGA-II optimization does not necessarily decrease smoothly or monotonically. Because genetic algorithms generate new individuals through selection, crossover, and mutation, the recorded best MSE decreases only when a superior non-dominated solution is found. Plateaus, therefore, occur when the population explores a local region without improving the current best solution. The plateaus around generations 30–83 and 85–140 in Figure 5c reflect temporary population convergence and elitist retention rather than algorithmic failure. Subsequent decreases indicate that improved solutions were generated through mutation or recombination. The Hypervolume (HV) indicator measures the objective-space volume dominated by the non-dominated solution set relative to a reference point. A larger HV generally indicates improved convergence toward the Pareto front and better solution-set coverage. In Figure 5c, the rapid initial increase in HV indicates that high-quality non-dominated solutions are obtained early, whereas the later plateau indicates convergence and subsequent local refinement.
To assess the search performance of the proposed optimization strategy for the high-dimensional nonlinear constitutive model, multi-objective particle swarm optimization (MOPSO) is used as a baseline. As shown in Figure 5c, the physics-constrained NSGA-II converges faster and reaches a lower target MSE than MOPSO. Its HV indicator also increases more rapidly and stabilizes at a higher level, indicating better convergence and solution-set diversity. By contrast, MOPSO is more prone to becoming trapped in multimodal local optima under the full-stroke stability constraints. These results indicate that the constraint-guided NSGA-II more efficiently excludes infeasible regions and provides robust convergence for the geometric design problem considered here.
The optimal parameters corresponding to different target load capacities are presented in Table 1. It can be observed that as the target load capacity increases, the initial angle, stiffness ratio, and inclination angle do not vary monotonically. Near the target load capacity , the optimal parameters are , , and . Notably, as the target load capacity increases from 0.9 to 1.3, decreases monotonically from to approximately —indicating that higher load capacities require a flatter rhombic configuration, while lower load capacities permit a more upright one. This trend provides engineers with an intuitive design guideline: the higher the load requirement, the smaller the initial rhombic angle should be.
Table 1.
Optimal parameters corresponding to different target load-bearing forces.
On this basis, when investigating the nonlinear characteristics of the rhombic negative-stiffness isolation system, it is first necessary to determine the number of rhombic units N and then to analyze the effects of structural parameter variations on the force-displacement characteristics of the system. The optimal parameters are determined via the NSGA-II algorithm based on Equations (10)–(12). Subsequently, the theoretically optimal solutions output by NSGA-II () are rounded for practical engineering implementation. The support included angle is set to (i.e., ), and the inclination angle is set to . This adjustment mainly aims to reduce the machining complexity of the physical prototype, improve assembly accuracy, and guarantee experimental repeatability and structural stability.
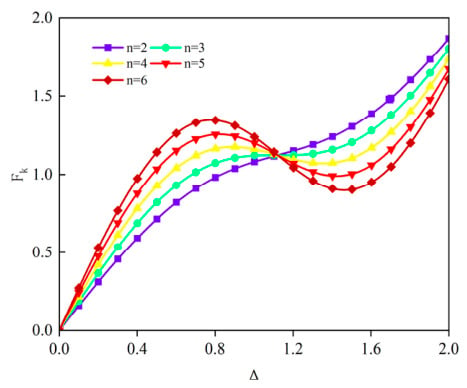
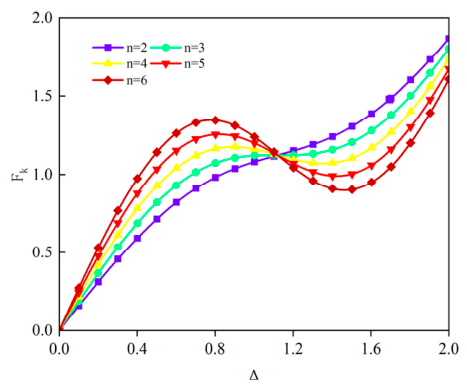
The relationship between the dimensionless force and the compression ratio for different parallel numbers can then be obtained, as shown in Figure 6, under the condition that the stiffness ratio is 0.58, the initial rhombic angle is 37.5°, and the inclination angle is 45°.
Figure 6.
Force–displacement curves for different numbers of parallel rhombic mechanisms.
Structural parameters such as the rod length , the ratio of positive to negative stiffness , the inclination angle , and the included angle of the rhombus all affect the nonlinear characteristics of the rhombic negative-stiffness isolation system. Variations in these parameters are crucial to both the static load capacity and the isolation performance of the isolator. Therefore, investigating their influences on the force–displacement curve is necessary and is of practical significance for engineering applications.
When studying the effects of structural-parameter variations, the rod length is fixed at 50 mm by default. Only one parameter is changed at a time, while the remaining parameters are kept unchanged. The effects of the three design parameters on the relationship between the dimensionless force Fk and the compression ratio are then analyzed.
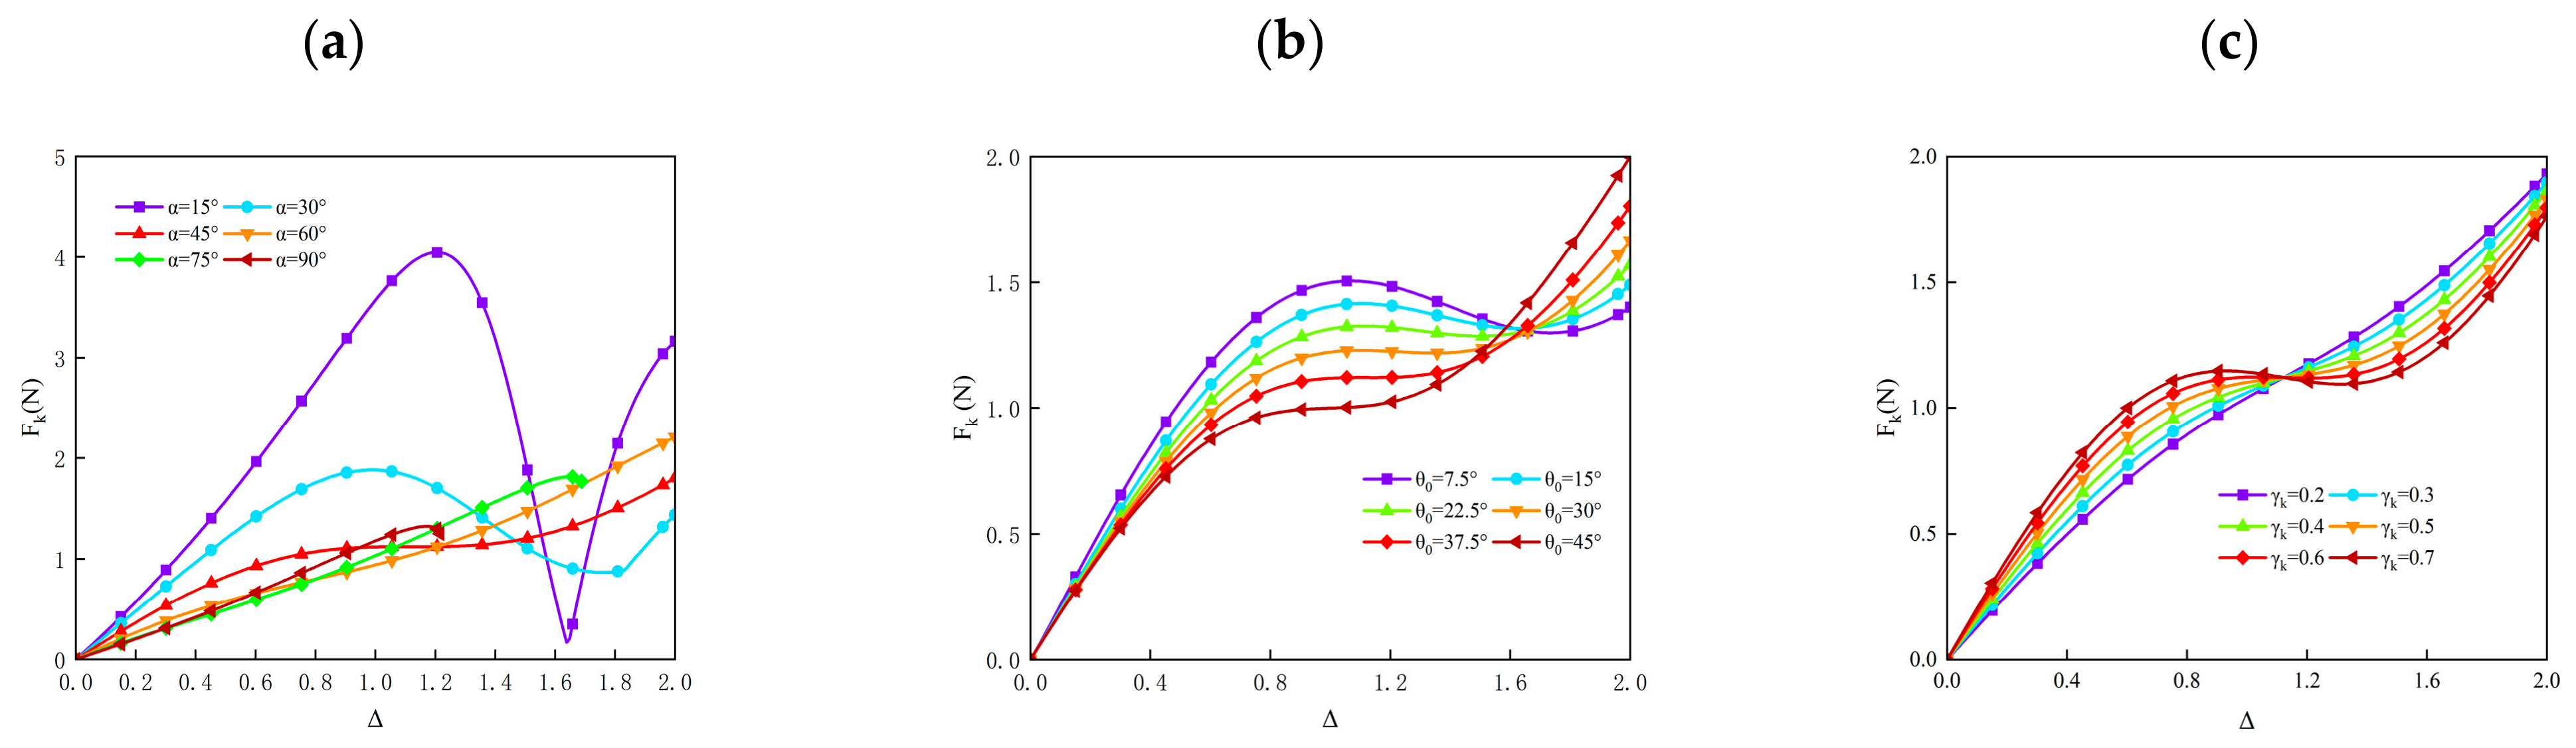
Figure 7a illustrates the variations of the Fk- curves corresponding to different inclination angles under fixed stiffness ratio = 0.58 and initial rhombus angle = 37.5. It can be observed that the inclination angle significantly affects the fluctuation of the characteristic curve, and the quasi-zero-stiffness (QZS) interval turns out to be the smoothest and widest at = 45°. Figure 7b presents the curves of dimensionless force against compression ratio for various rhombus included angles , with = 0.58 and = 45° kept constant. The figure reveals that a negative-stiffness region occurs at small values of . As the included angle between adjacent sides of the rhombus increases, the QZS feature of the Fk- curve becomes more prominent, and the effective QZS interval expands continuously. Furthermore, there exists an optimal critical included angle that yields the comprehensive optimal QZS performance for the isolator. Figure 7c explores the effect of stiffness ratio on the static mechanical properties, where the inclination angle and rhombus included angle are maintained constant. The results demonstrate that the Fk- curve possesses the smoothest and broadest QZS interval when = 0.6.
Figure 7.
Effects of structural parameter variations on the force–displacement curves. (a) Force–displacement curves under different inclination angles (b). Force–displacement curves under different included angles between adjacent rhombic edges. (c) Force–displacement curves under different stiffness ratios.
2.3. Performance Analysis of the Crab-Inspired Isolator
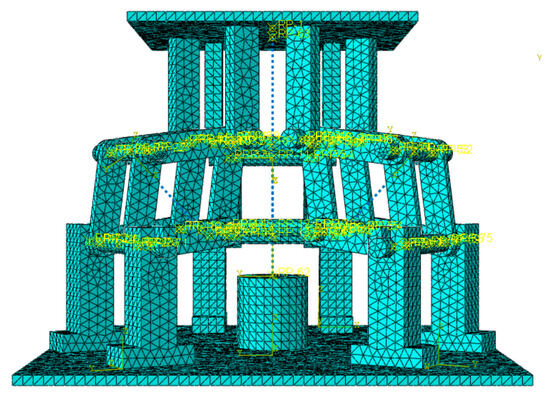
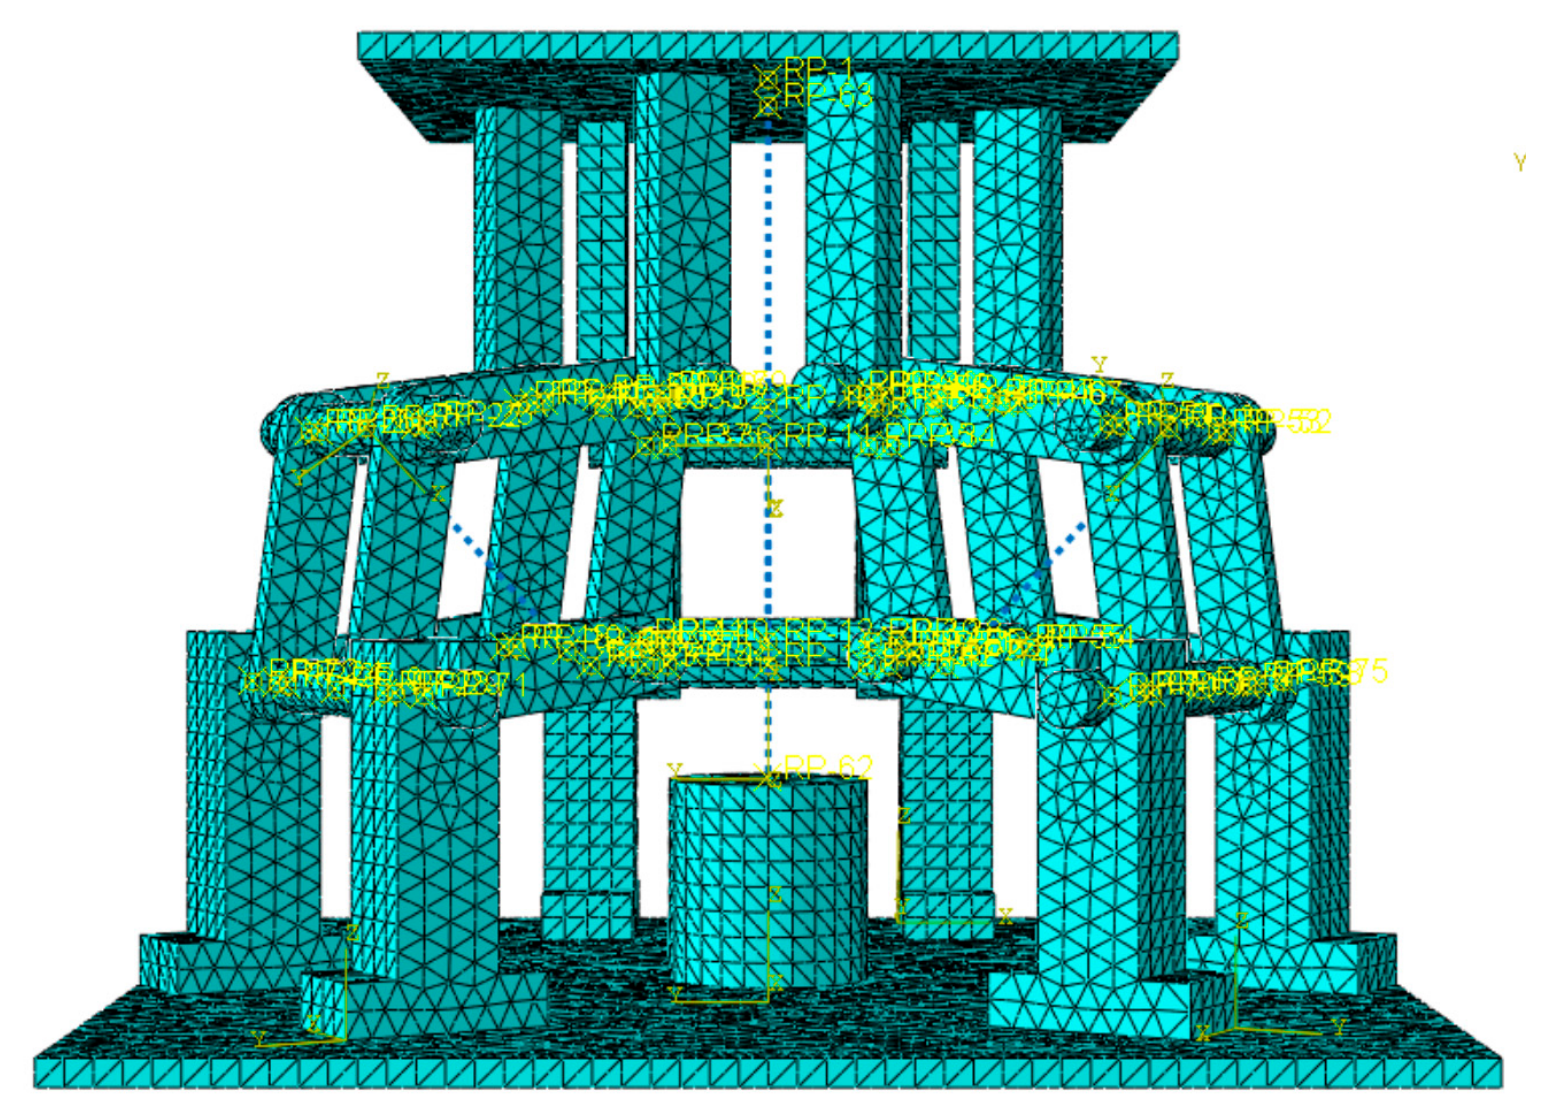
To further verify that the proposed structure exhibits QZS characteristics, the finite-element model of the crab-inspired quasi-zero-stiffness isolator shown in Figure 8 is constructed.
Figure 8.
Finite-element model of the crab-inspired quasi-zero-stiffness isolator.
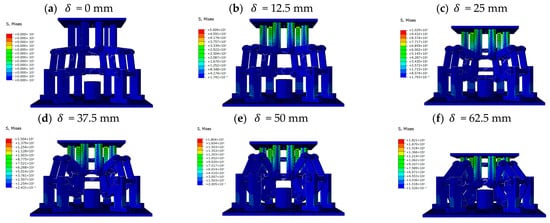
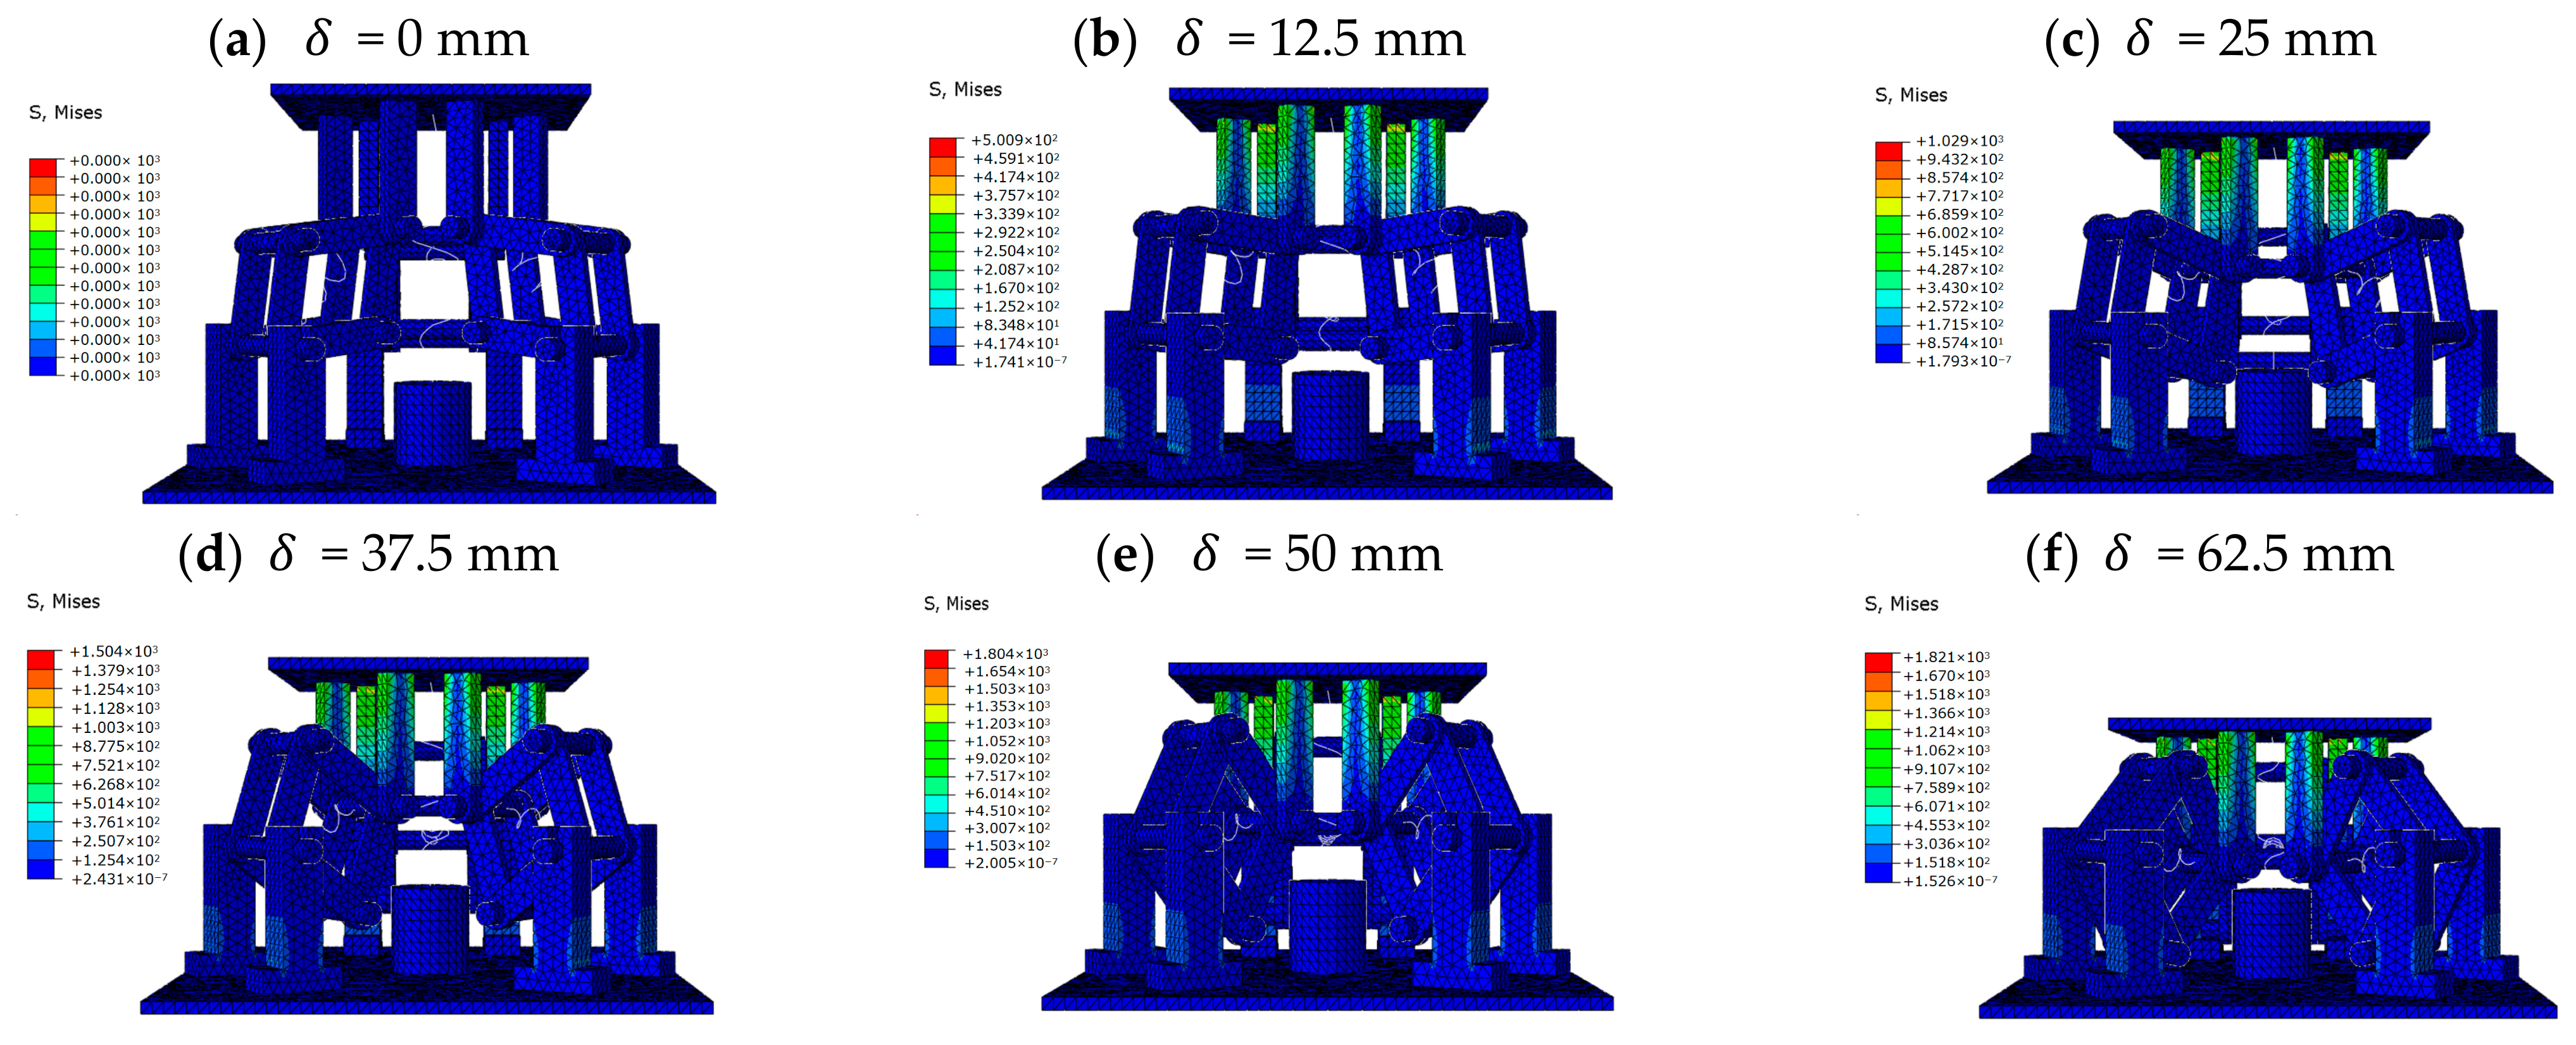
Displacement loading and fixed supports are applied to the upper and lower plates of the isolator, respectively. A free tetrahedral mesh is adopted, and the mesh size of the I-QZS is restricted to less than 4 mm to ensure high computational accuracy. It should be noted that the automatic highly nonlinear solver option is used because the isolator undergoes large bending deformation, and the prototype is fabricated by 3D printing. The preset material of the I-QZS is polylactic acid (PLA), and its material and structural parameters are listed in Table 2. In each simulation, the imposed displacement is gradually increased from 0 mm to 100 mm with a step size of 0.1 mm. Figure 9 shows the stress distribution and geometric evolution of the crab-inspired isolator during compression, clearly depicting the entire process from initial loading to the onset of the quasi-zero-stiffness (QZS) characteristic. In the pre-QZS stage, shown in Figure 9a–c, as the vertical displacement increases from 0 mm to 25 mm, the system is mainly supported by the positive stiffness of the vertical compression spring, while the rhombic mechanism begins to expand laterally and the negative-stiffness effect has not yet fully emerged. In the QZS stage, shown in Figure 9d,e, when the displacement reaches 37.5–50 mm, the inclined rods approach the horizontal critical position, and the negative stiffness generated by the mechanism effectively offsets the positive stiffness of the system, resulting in a flattened vertical resultant force and the formation of the expected QZS platform region. In the post-QZS stage, shown in Figure 9f, as the displacement further increases to 62.5 mm, the rods move beyond the horizontal position and enter a strengthening phase, with stress becoming more concentrated at the hinges and the roots of the elastic elements. This behavior reveals the geometric nonlinear response and good structural reliability of the structure under large deformation.
Table 2.
Structural parameters and material properties of the IRC unit used for finite-element analysis.
Figure 9.
Simulated deformation of the crab-inspired isolator. (a–c) Pre-QZS stage; (d,e) QZS stage; (f) post-QZS stage.
However, when the ideal pseudo-rigid-body model is converted into an actual compliant continuous structure to realize the QZS characteristic, a significant stiffness-mapping discrepancy arises between the theoretical analysis and the finite-element simulation. In the purely theoretical kinematic model, the stiffness ratio required to achieve QZS behavior is only 0.58, whereas in the flexible-body simulation based on the ABAQUS 2023 software, the oblique rods inevitably undergo Euler buckling and slight lateral bending during the large-deformation compression process. These geometric nonlinearities introduce additional compliant deformation and alter the strain-energy distribution, resulting in a reduction in the effective vertical stiffness. As a result, the stiffness ratio in the simulation must be increased to 0.82 to compensate for this stiffness loss and reproduce the QZS characteristic.
To address this essential physical discrepancy, this paper proposes a stiffness compensation mapping strategy for compliant mechanisms. First, a stiffness compensation coefficient ( is introduced to correct the amplitude difference in energy transfer between ideal rigid bodies and actual flexible bodies, thereby guaranteeing the equivalence of macroscopic stiffness characteristics. It is worth noting that the compensation coefficient is not an empirically fitted constant but carries clear physical and geometric significance.
According to the nonlinear constitutive equation of the mechanism, the vertical force transmission efficiency of negative stiffness is governed by the projection factor . Given the initial spatial inclination angle adopted in this work, the attenuation benchmark of the globally equivalent normal stiffness within the primary operating range is predominantly determined by . Therefore, is used to amplify the original stiffness ratio of 0.58, and a corrected stiffness ratio of 0.82 is obtained for practical application. It should be emphasized that is a configuration-specific value corresponding to the inclination angle adopted in the present design, rather than a universal compensation coefficient. Under the present projection-based mapping assumption, the compensation coefficient for a general inclination angle can be expressed approximately as . Therefore, if the inclination angle is changed, the compensation coefficient and the corresponding stiffness ratio must be recalculated accordingly. This correction implies that the compliant mechanism requires approximately 41.4% more tension-stiffness contribution than the rigid-body prediction to offset the flexibility-induced softening effect, providing a straightforward design rule for prototype fabrication.
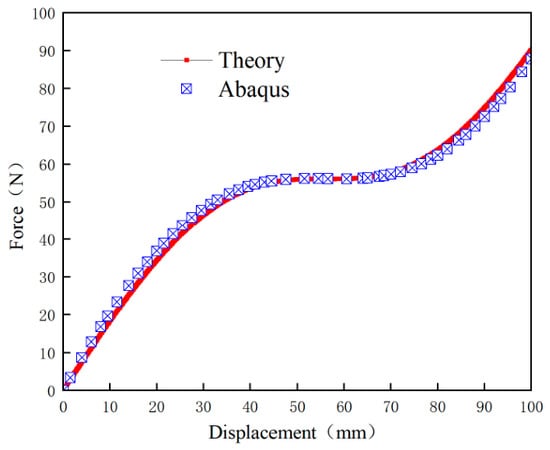
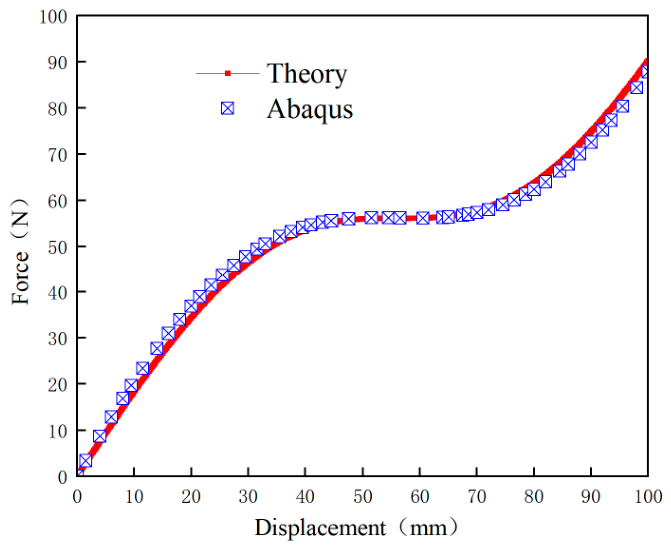
As shown in Figure 10, the analytically derived curves with stiffness compensation agree closely with the finite-element results over the full stroke, validating the accuracy of the modified theory in characterizing the nonlinear behavior of the compliant structure. It should be noted that this single-parameter compensation strategy represents a macro-level energy-equivalent mapping and cannot fully account for the localized deformation fields caused by buckling and parasitic bending of the oblique rods at the microscopic level. However, within the target QZS operating range of 40–70 mm, this strategy adequately compensates for the stiffness degradation induced by compliant deformation, resulting in good agreement between the theoretical predictions and measured responses. Outside the target operating range, such as during the initial loading and final stiffening stages, localized stress concentrations and parasitic bending introduce minor deviations, but these deviations do not affect the evaluation of low-frequency isolation performance near the equilibrium position. This compensation method, grounded in clear physical–geometrical meaning, ensures prediction accuracy in the core working range while avoiding high-dimensional nonlinear solutions, thereby establishing the practical value of the analytical model for parametric design and engineering prediction of vibration isolators.
Figure 10.
Fitted curves comparing the theoretical derivation and the simulation analysis.
3. Dynamic Modeling and Theoretical Analysis
In this section, a cubic polynomial is used to fit the force-displacement curve of the I-QZS isolator, and a nonlinear dynamic model under base-displacement excitation is established. The expression for the displacement transmissibility is then derived. Subsequently, the IHB method, combined with pseudo-arclength continuation and an SVD-based null-space solution strategy, is adopted to trace the amplitude-frequency response curves, and Runge–Kutta numerical integration is used for cross-validation. On this basis, the effects of parameters such as excitation amplitude, damping ratio, and cubic stiffness coefficient on low-frequency isolation performance are discussed.
3.1. Dynamic Model of the QZS Isolator
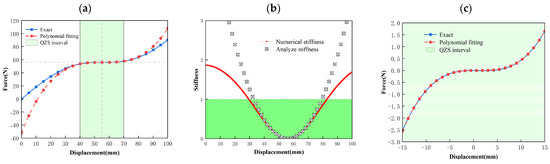
Figure 11a,b present the exact solution and the cubic polynomial fitting of the Fk- curve of the I-QZS isolator, respectively. In practical applications, the external load compresses the QZS isolator to its static equilibrium position, where FQZS = mg under gravity. The experimental data at the static equilibrium position are fitted by a polynomial. Before fitting, the dimensionless variables are converted into dimensional quantities and a coordinate rotation is performed, as shown in Figure 11c. The goodness of fit R2 is used as the evaluation index for the fitting performance. A cubic polynomial is adopted for curve fitting, and the corresponding coefficients are determined as follows:
Figure 11.
(a) Force–displacement curves of the exact solution and polynomial fitting for the I-QZS isolator. (b) Numerical and analytical stiffness of the I-QZS isolator. (c) Force–displacement curves of the exact solution and the polynomial fitting after coordinate rotation.
k1 = 0.00225080 N/mm
k2 = −0.00201637 N/mm2
k3 = 0.00061357 N/mm3
The coefficient of determination is calculated as R2 = 0.99990882, which reflects high fitting accuracy.
A sensitivity comparison between the full third-order polynomial model and the reduced cubic model showed that the linear and quadratic terms have only a minor influence on the steady-state response within the operating range considered in this study. Therefore, following the commonly adopted reduced-order treatment for QZS systems, only the dominant cubic term is retained in the subsequent dynamic formulation.
3.2. Dynamic Formulation
Under the base displacement excitation , the relative displacement is defined as . Accordingly, the original differential equation of motion is transformed into:
where is the mass, is the damping coefficient, denotes the cubic stiffness, is the excitation amplitude, and represents the excitation frequency.
To obtain a generalized dynamic evaluation framework, the time domain is normalized by setting and (where is the frequency ratio). This transformation normalizes the excitation frequency to unity, yielding the dimensionless governing equation:
where and is the damping ratio.
To capture the complex nonlinear dynamic behaviors—such as resonance peak bending and jump phenomena—the Incremental Harmonic Balance (IHB) method is employed [39]. The steady-state periodic response is approximated by a truncated Fourier series . In practical vibration isolation, retaining these high-order harmonics is crucial for predicting secondary resonances that may cause fatigue damage to the supporting structures of rotating machinery.
Substituting the assumed solution into the governing equation and applying the Galerkin averaging procedure over one period transforms the nonlinear differential equation into a set of incremental algebraic equations:
The detailed derivations of the perturbation increments and the specific element expansions of the matrices , , and follow standard IHB procedures and are omitted here for brevity.
In practical large-amplitude vibration scenarios, strongly nonlinear isolators often experience snap-through instability or jump phenomena, corresponding to the turning points on the amplitude-frequency response curves. At these critical points, the Jacobian stiffness matrix becomes singular (), causing conventional iteration methods to diverge. To overcome this numerical bottleneck, a pseudo-arclength continuation algorithm combined with Singular Value Decomposition (SVD) is integrated. The tangent-direction equation is rewritten in an augmented-matrix form:
By applying SVD to the augmented full-row-rank Jacobian matrix , the null-space basis vector corresponding to the zero singular value is extracted directly as the unnormalized tangent vector:
For actual engineering implementation, the extraction of this null-space vector allows the algorithm to seamlessly trace both stable and unstable solution branches without explicitly inverting the singular matrix. Precisely mapping these unstable branches is of great practical impact; it explicitly determines the critical jump frequencies and the boundary of the effective QZS isolation region, providing quantitative guidelines to prevent catastrophic resonance failure under severe shock or swept-sine excitations. Finally, based on the resolved harmonic coefficients, the displacement transmissibility —which acts as the primary evaluation metric for industrial vibration isolators—is calculated as
When solving with the IHB method, the primary numerical difficulty lies in the multiplicity of solutions and jumping phenomena near the resonance peak in strongly nonlinear systems. The conventional Newton–Raphson method fails to continue tracing at the turning points where the Jacobian matrix becomes singular. To address this issue, an SVD-based null-space arc-length continuation strategy is introduced, which enables the algorithm to stably “bypass” the turning points and completely trace both the upper and lower branches of the amplitude–frequency response. Consequently, engineers can predict in the design stage whether the system will exhibit jump instability under different excitation amplitudes, thereby avoiding unstable regions during parameter selection—this constitutes the engineering contribution of the dynamic analysis method presented in this work. It should be noted that displacement transmissibility is consistently adopted throughout the following discussion for evaluating isolation performance. The amplitude ratio is defined as , and its dB form is expressed as , which is numerically equivalent to . All figure captions, formula descriptions, and result discussions are presented in terms of this definition to avoid confusion with force transmissibility.
3.3. Dynamic Characteristic Analysis
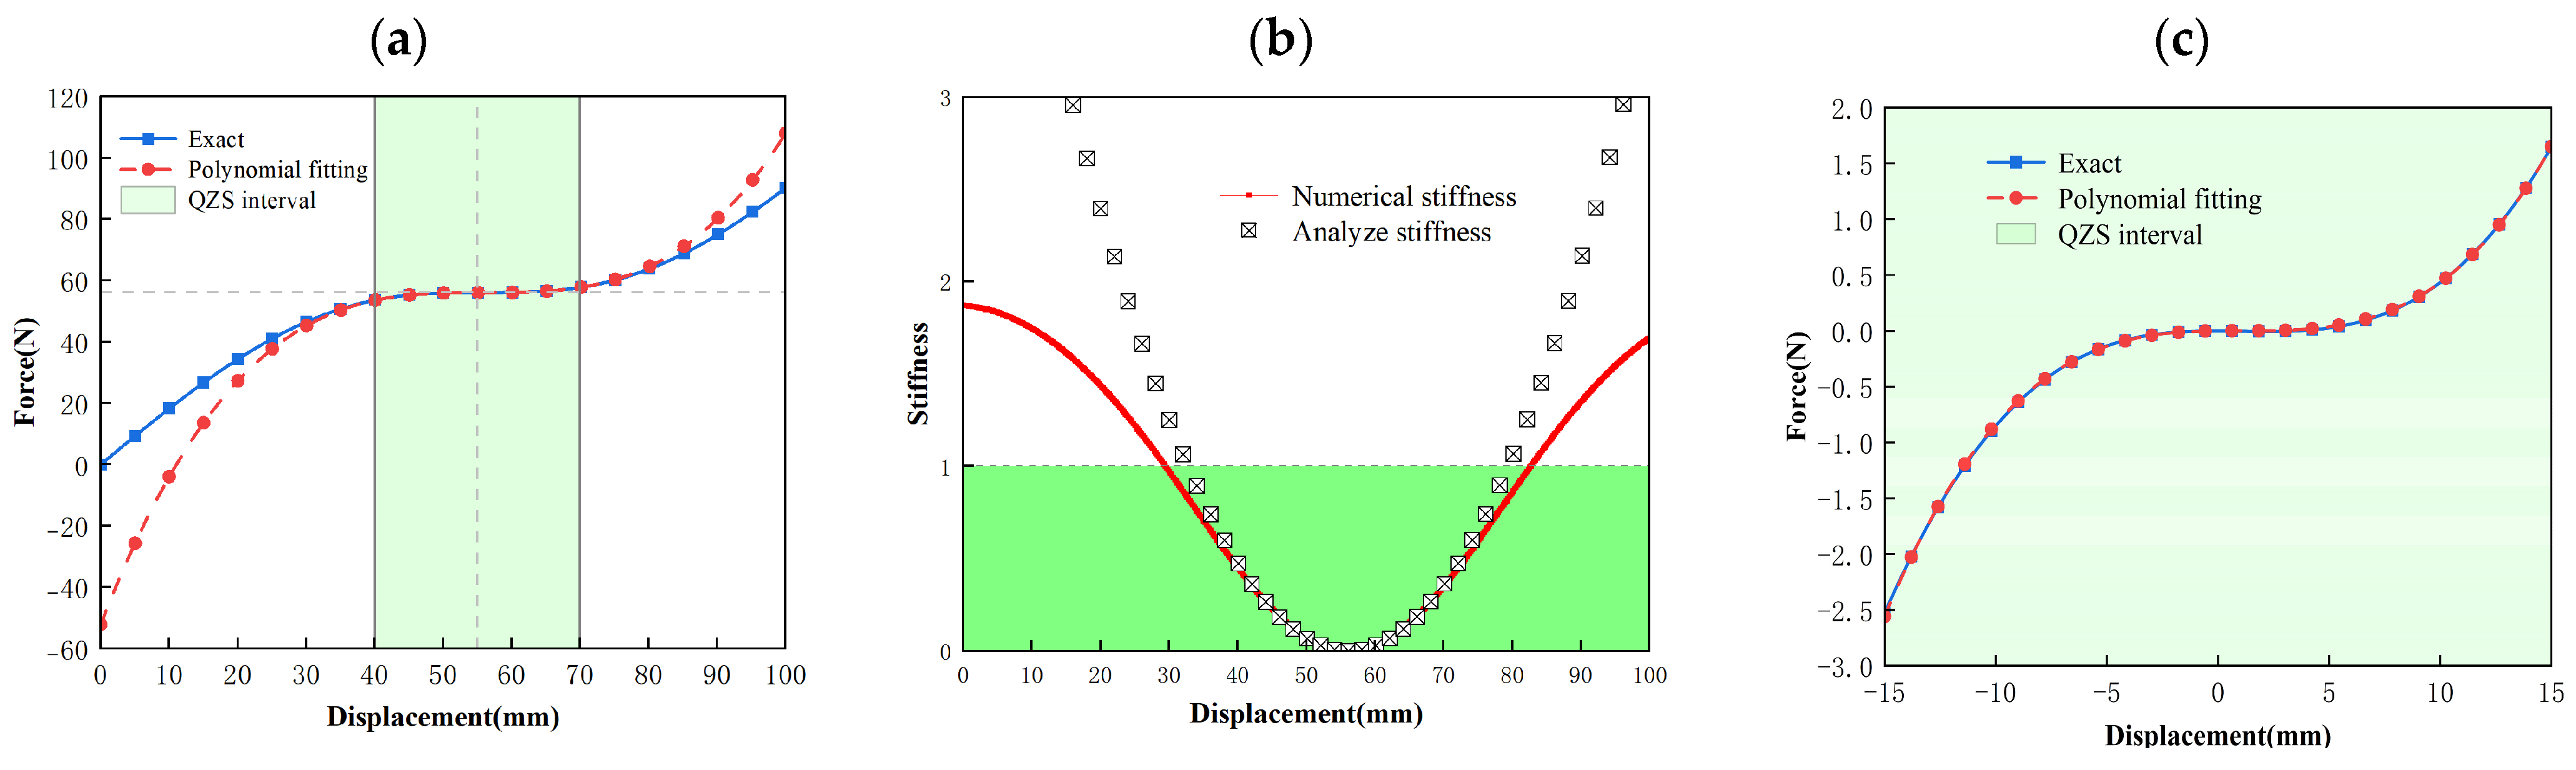
After the system parameters are substituted into the IHB solution framework, the phase–frequency curve, amplitude–frequency curve, and displacement transmissibility curve can be obtained. As shown in Figure 12, the IHB analytical results demonstrate excellent agreement with the numerical simulations, validating the accuracy of the cubic polynomial restoring-force model. Quantitative analysis reveals that the I-QZS system significantly improves vibration isolation performance: the resonant frequency is shifted from 2.12 Hz to 0.375 Hz (an 82.29% reduction), and the peak displacement transmissibility is suppressed from 27.97 dB to 12.93 dB (a 53.75% reduction). These findings confirm that the I-QZS isolator not only extends the isolation bandwidth toward the ultra-low frequency range but also effectively mitigates resonant amplitudes, demonstrating substantial potential for engineering applications.
Figure 12.
Comparison of the displacement transmissibility curves obtained by IHB and the linear reference system.
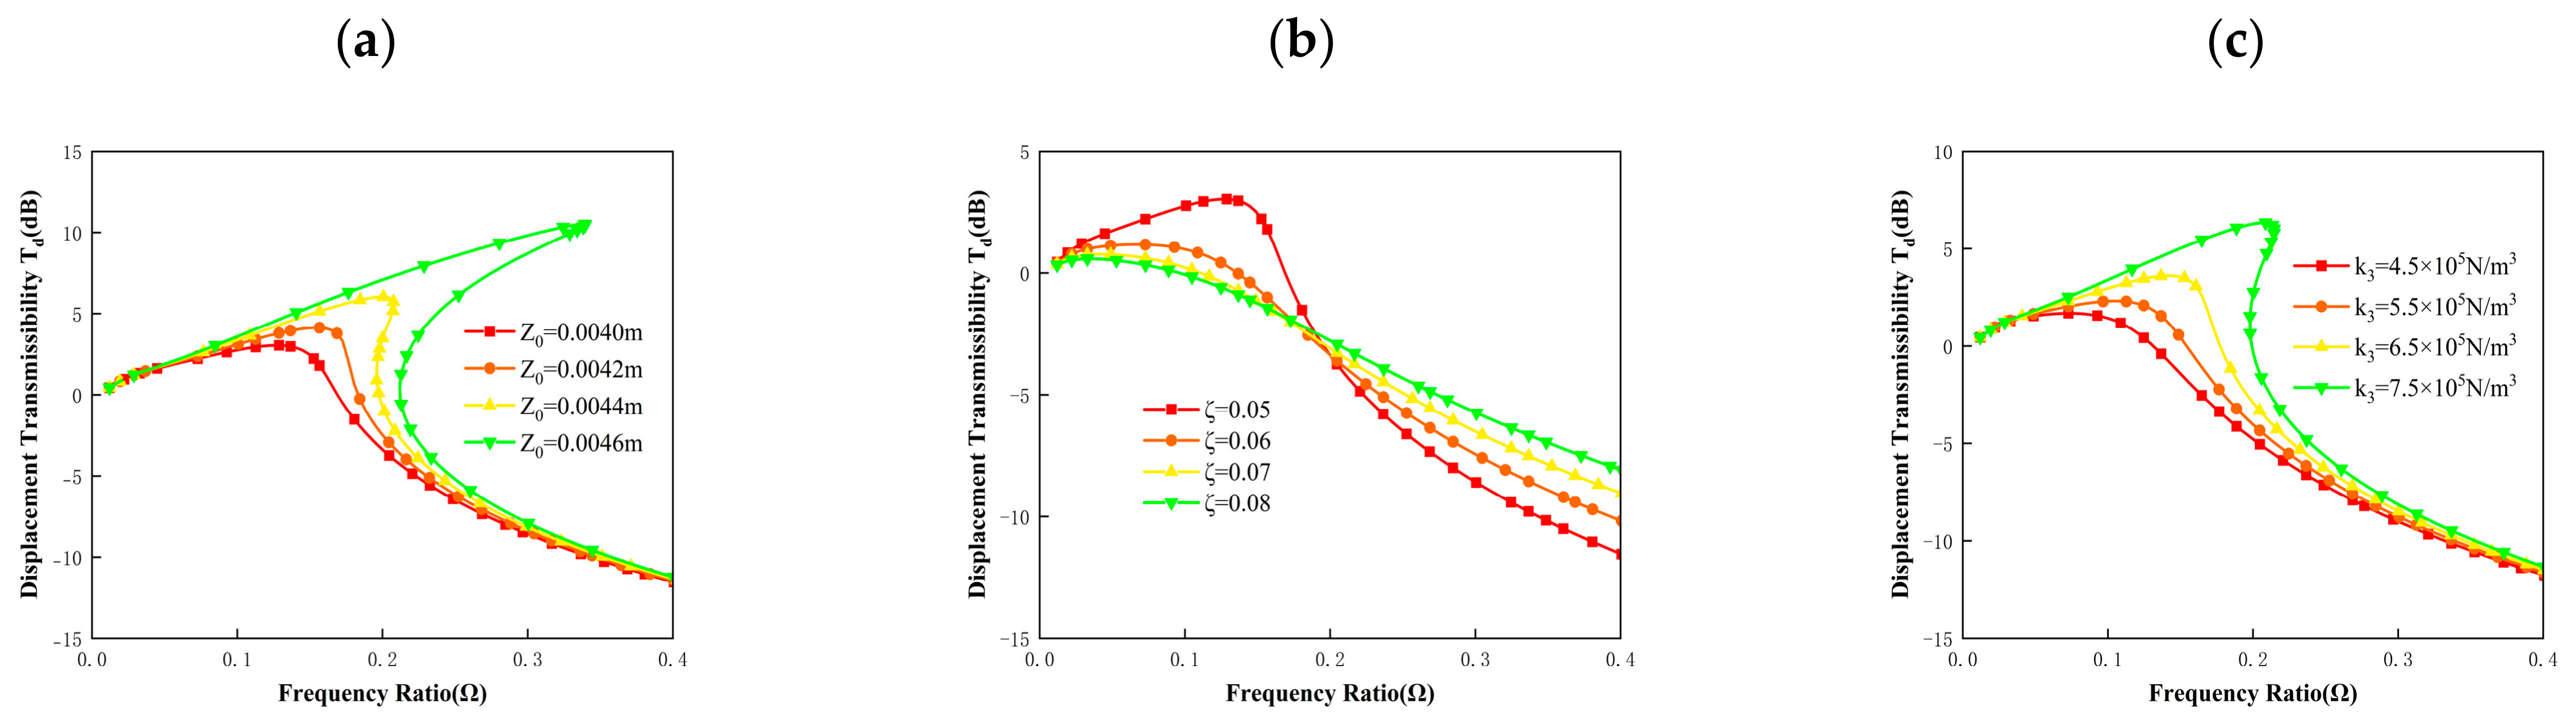
Figure 13a shows the influence of the base-excitation amplitude on the displacement transmissibility under a fixed damping ratio and cubic stiffness coefficient. As the excitation amplitude increases, the nonlinear hardening effect gradually strengthens, the resonance peak shifts toward higher frequencies, and both the onset frequency of vibration isolation and the strong-isolation bandwidth exhibit a certain amplitude dependence. Figure 13b indicates that increasing the damping ratio can effectively suppress the resonance peak, although it weakens the high-frequency isolation effect to some extent. Figure 13c shows that the cubic stiffness coefficient is the key parameter governing the hardening nonlinearity and jump phenomena.
Figure 13.
Displacement transmissibility curves under different parameters. (a) Different excitation amplitudes. (b) Different damping ratios. (c) Different cubic coefficients.
Overall, the base-excitation amplitude Z0 and the cubic stiffness coefficient k3 are the main factors affecting nonlinear hardening, peak migration, and jump responses, whereas the damping ratio mainly affects the resonance-peak magnitude and the attenuation rate in the isolation region. A proper combination of these parameters is essential for achieving a low peak value, a low isolation-onset frequency, and a stable working interval.
4. Experimental Validation and Discussion
Based on the theoretical analysis, a prototype is fabricated, and quasi-static and dynamic test systems are established in this section. The quasi-static experiment is used to verify the force–displacement characteristics, the QZS interval, and the effectiveness of the compliant-compensation model. The dynamic experiment is used to obtain the acceleration responses and displacement transmissibility curves under different excitation amplitudes and to compare them with the theoretical and numerical results.
4.1. Quasi-Static Experimental Validation
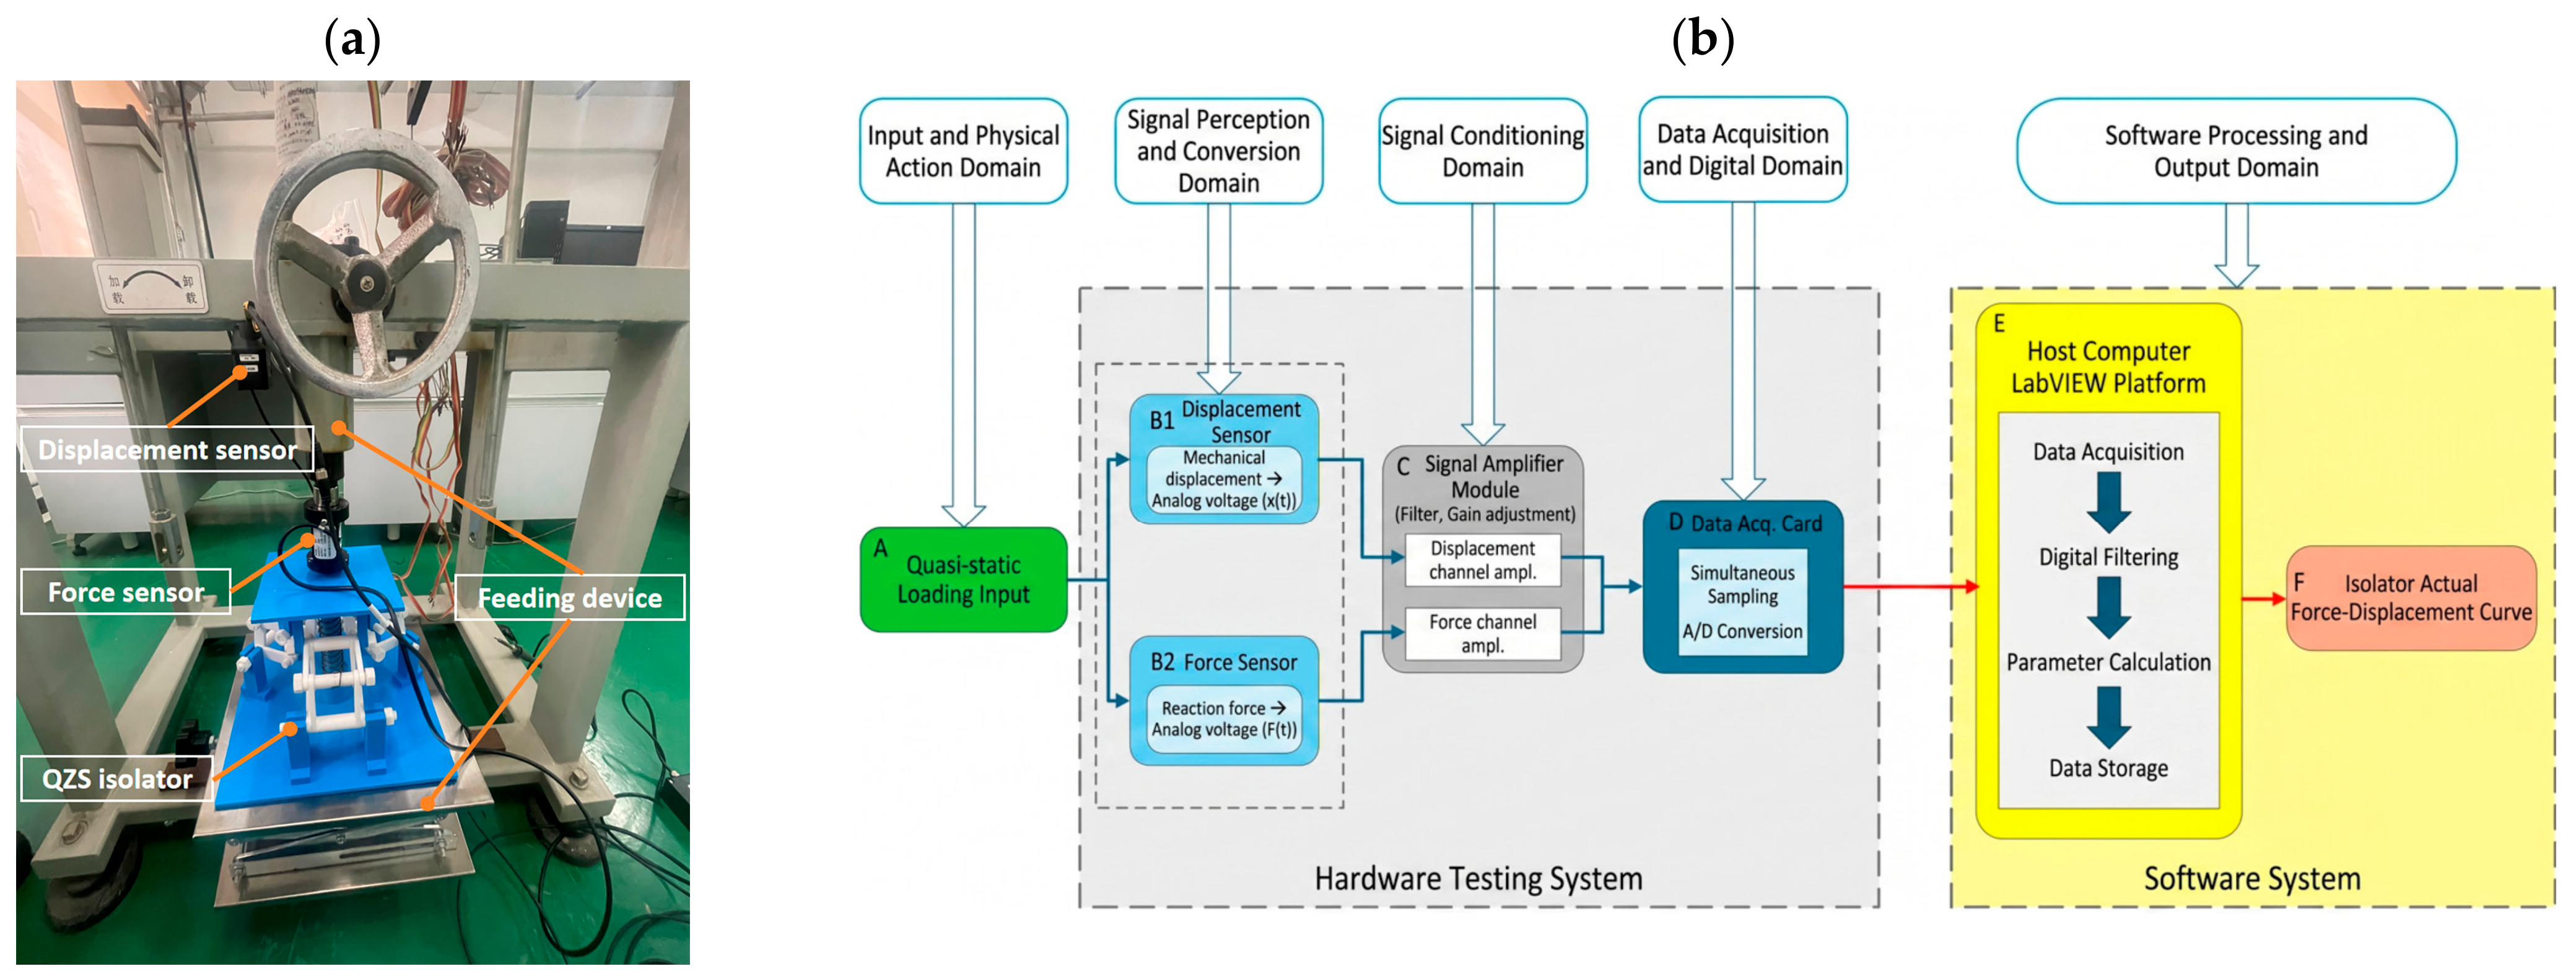
To verify the accuracy of the static theoretical model and optimization results established in this paper, a static-performance test system for the rhombic isolator is constructed. The experimental system consists of a force sensor, a displacement sensor, a signal conditioner, a data-acquisition unit, and LabVIEW 2024 Q1-based host-computer software, enabling synchronous acquisition and real-time processing of the reaction force and displacement signals during static loading. As shown in Figure 14a, the isolator is subjected to quasi-static stepwise loading during the experiment. The real-time downward displacement is recorded by the displacement sensor, and the corresponding reaction force is collected by the force sensor. After signal conditioning by the amplifier, the data are transmitted to the LabVIEW platform through the data-acquisition unit for filtering, calculation, and storage, and the measured force–displacement curve of the isolator is finally obtained. The experimental procedure is illustrated in Figure 14b.
Figure 14.
(a) Physical quasi-static force–displacement experimental platform, including the loading device, force sensor, displacement sensor, I-QZS prototype, feeding device, and data-acquisition circuitry. (b) Flowchart of the quasi-static force–displacement experiment.
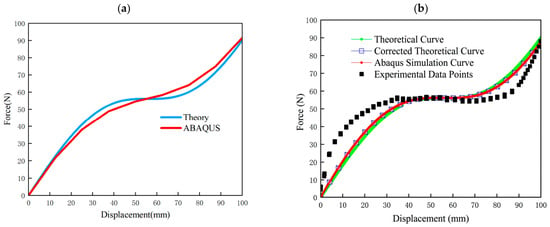
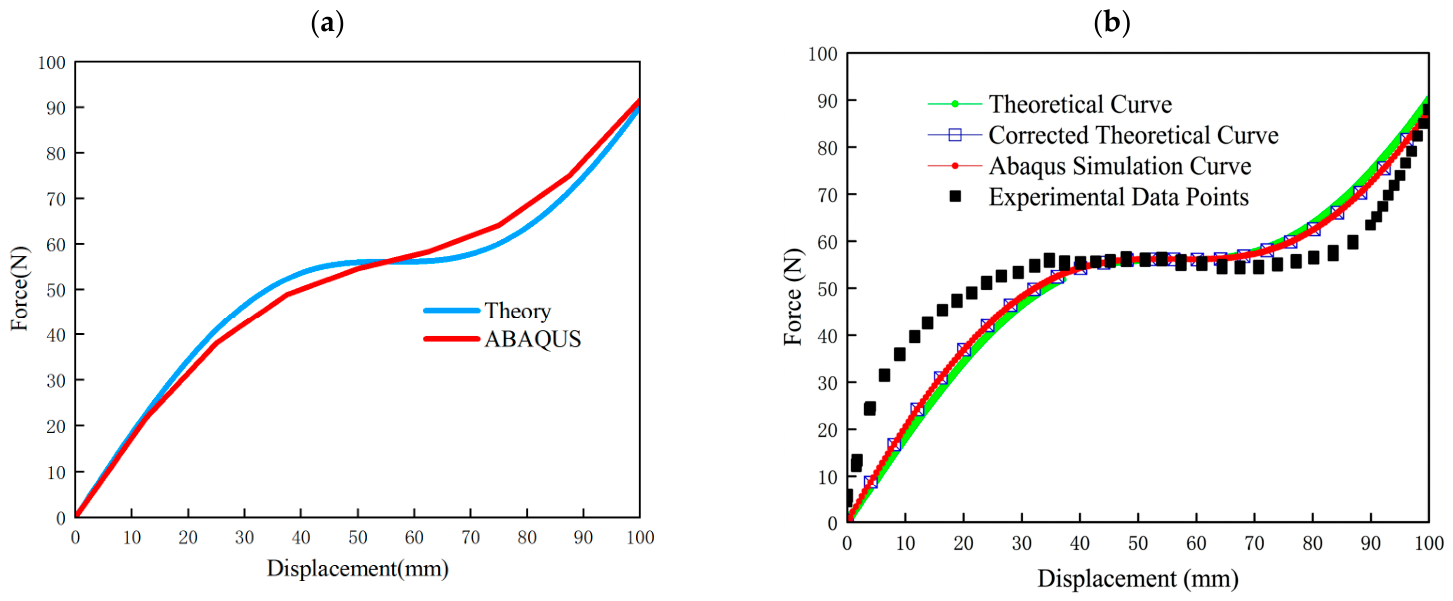
Quasi-static force–displacement experiments are carried out in this study. In the preliminary verification, when both the simulation model and the experimental prototype adopt a stiffness ratio of 0.58, the measured curve exhibits a very high degree of agreement with the simulation result, as shown in Figure 15a. On this basis, combined with the finite-element analysis in Section 2.3, a stiffness correction coefficient is introduced to compensate for the geometric nonlinearity and structural flexibility discrepancy between the ideal analytical model and the physical entity. Specifically, the optimal stiffness ratio of 0.58 is retained at the analytical level, while the corresponding structural parameter in the finite-element simulation and physical experiment is mapped to a stiffness ratio of 0.82 so as to achieve the expected dynamic response.
Figure 15.
(a) Comparison of the force–displacement characteristics of the I-QZS isolator without structural flexibility compensation. (b) Experimental validation of the full-stroke mechanical characteristics of the I-QZS isolator after considering additional compliance and manufacturing-tolerance corrections.
The experimental results are shown in Figure 15b. The measured force–displacement curve deviates from the theoretical and simulation results only in the end ranges of 0–40 mm and beyond 70 mm, while in the target working range of 40–70 mm, the three curves are in close agreement, demonstrating that the proposed model can reliably predict the mechanical behavior within the core QZS operating range. In the initial segment of 0–40 mm, the measured force is slightly higher, which is attributed to the pre-tension of the extension springs and the additional resistance from hinge friction. Beyond 70 mm, the measured force is slightly lower due to structural stiffness degradation caused by flexible bending of the rods and assembly clearances under large deformation. These two types of deviations occur only in the non-target stroke and do not affect the analysis accuracy within the effective working range of the isolator.
4.2. Vibration Experimental Validation
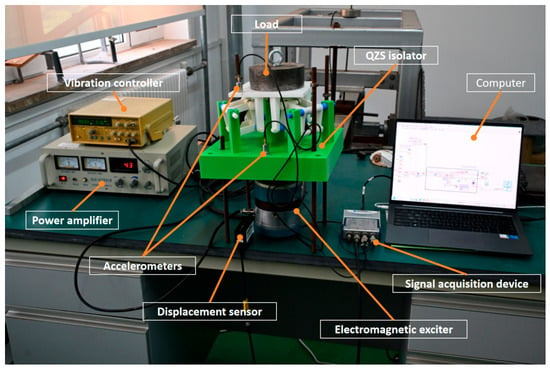
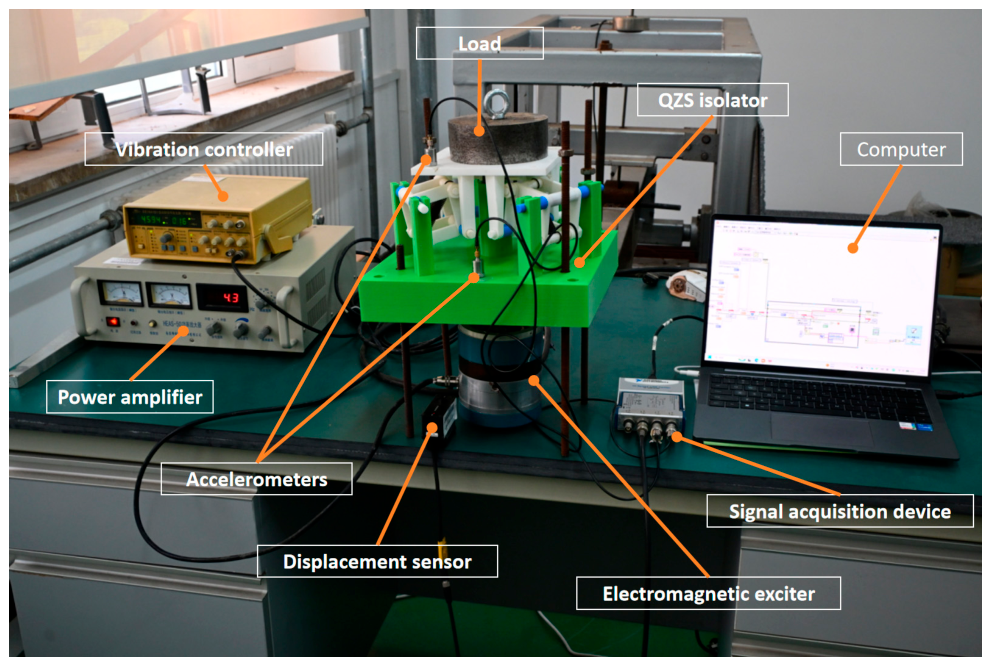
The vibration isolation performance testing platform comprises a signal excitation device, the I-QZS prototype, a data acquisition system, and a host computer analysis program based on LabVIEW. Figure 16 illustrates the overall configuration and signal transmission path of the dynamic testing system [40]. Following the design concept of inertial suspension test rigs, an electromagnetic shaker applies controlled base displacement excitation to the “base plate–isolator–payload mass” system. Two IEPE piezoelectric accelerometers are mounted at the input and output ends, respectively, for synchronous acquisition of the system response. After conversion by an NI data-acquisition module, the signals are sent to the computer, where the LabVIEW program performs time-domain recording, frequency response function estimation, and displacement transmissibility calculation.
Figure 16.
Dynamic vibration-isolation test system.
It should be noted that while the theoretical analysis (Section 3.3) demonstrates the system’s potential under ideal conditions (Z0 = 1.8 mm, ζ = 0.02), practical dynamic experiments face inherent physical constraints. At ultra-low frequencies, the acceleration response under a 1.8 mm excitation is extremely weak, failing to overcome the static friction of the prototype’s hinges and falling below the accelerometer’s noise floor. To ensure a reliable signal-to-noise ratio, the experimental excitation amplitude was increased to 8.8 mm. In the present dynamic model, the dissipative effects arising from hinge-contact friction, material viscoelasticity, air damping, and other minor loss mechanisms are collectively represented by an equivalent macroscopic viscous damping ratio rather than being independently decoupled through separate quasi-static cyclic loading–unloading tests. Based on the measured resonance-peak responses in the dynamic experiments, the equivalent damping ratio was estimated to lie within the range of , and was adopted for the subsequent theoretical–experimental comparison. Testing the system under this severe 8.8 mm amplitude—which typically exacerbates hardening nonlinearity—rigorously verifies the robustness and practical superiority of the proposed I-QZS isolator.
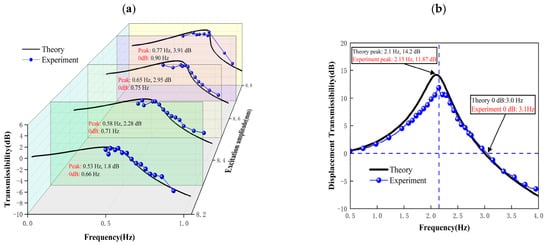
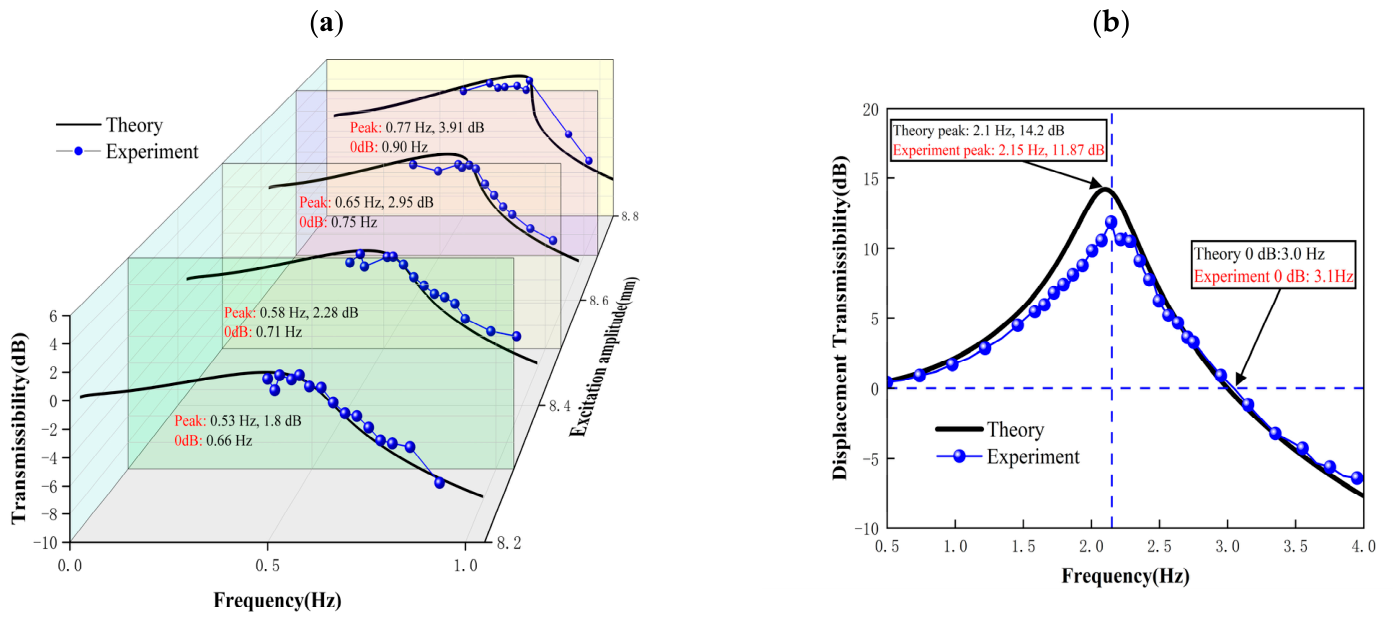
As shown in Figure 17a,b, under the severe excitation condition of 8.8 mm amplitude, the I-QZS system dramatically shifts the resonance peak down to 0.77 Hz and limits the maximum displacement transmissibility to 3.91 dB. Compared with the experimental results of the equivalent linear system (with a damping ratio of 0.1, peak frequency of 2.15 Hz and maximum transmissibility of 11.87 dB), the I-QZS isolator achieves a 64.19% reduction in peak frequency and a 67.06% reduction in peak transmissibility. The displacement transmissibility curves of the nonlinear system further show that the experimental and theoretical results are generally consistent for different amplitudes. As the amplitude increases, the resonance peak progressively shifts toward higher frequencies, reflecting a typical hardening-type nonlinear characteristic. Within the current experimental amplitude range, no pronounced resonance jump or abrupt response-branch transition was observed, indicating that the prototype remained on a stable response branch under the tested operating conditions. This observation is consistent with the parameter-dependent stability characteristics predicted by the nonlinear dynamic model.
Figure 17.
Dynamic performance. (a) Experimental and theoretical comparison of the displacement transmissibility of the nonlinear QZS system under different excitation amplitudes. (b) Experimental and theoretical comparison of the displacement transmissibility of the linear system.
4.3. Bifurcation Analysis
To further reveal the global dynamic behavior of the QZS isolation system under strong nonlinearity, the present study adopts Poincaré sections and phase-space trajectory analysis to investigate the system response under different combinations of damping ratio, excitation frequency, and cubic stiffness coefficient. This analysis helps identify periodic responses, period-doubling bifurcations, and chaotic intervals, thereby providing stability constraints for parameter selection.
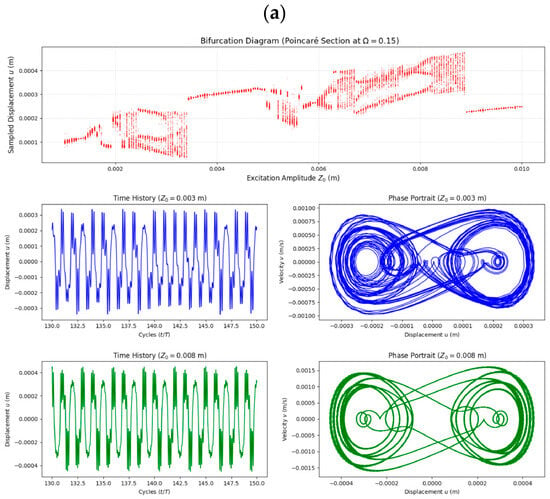
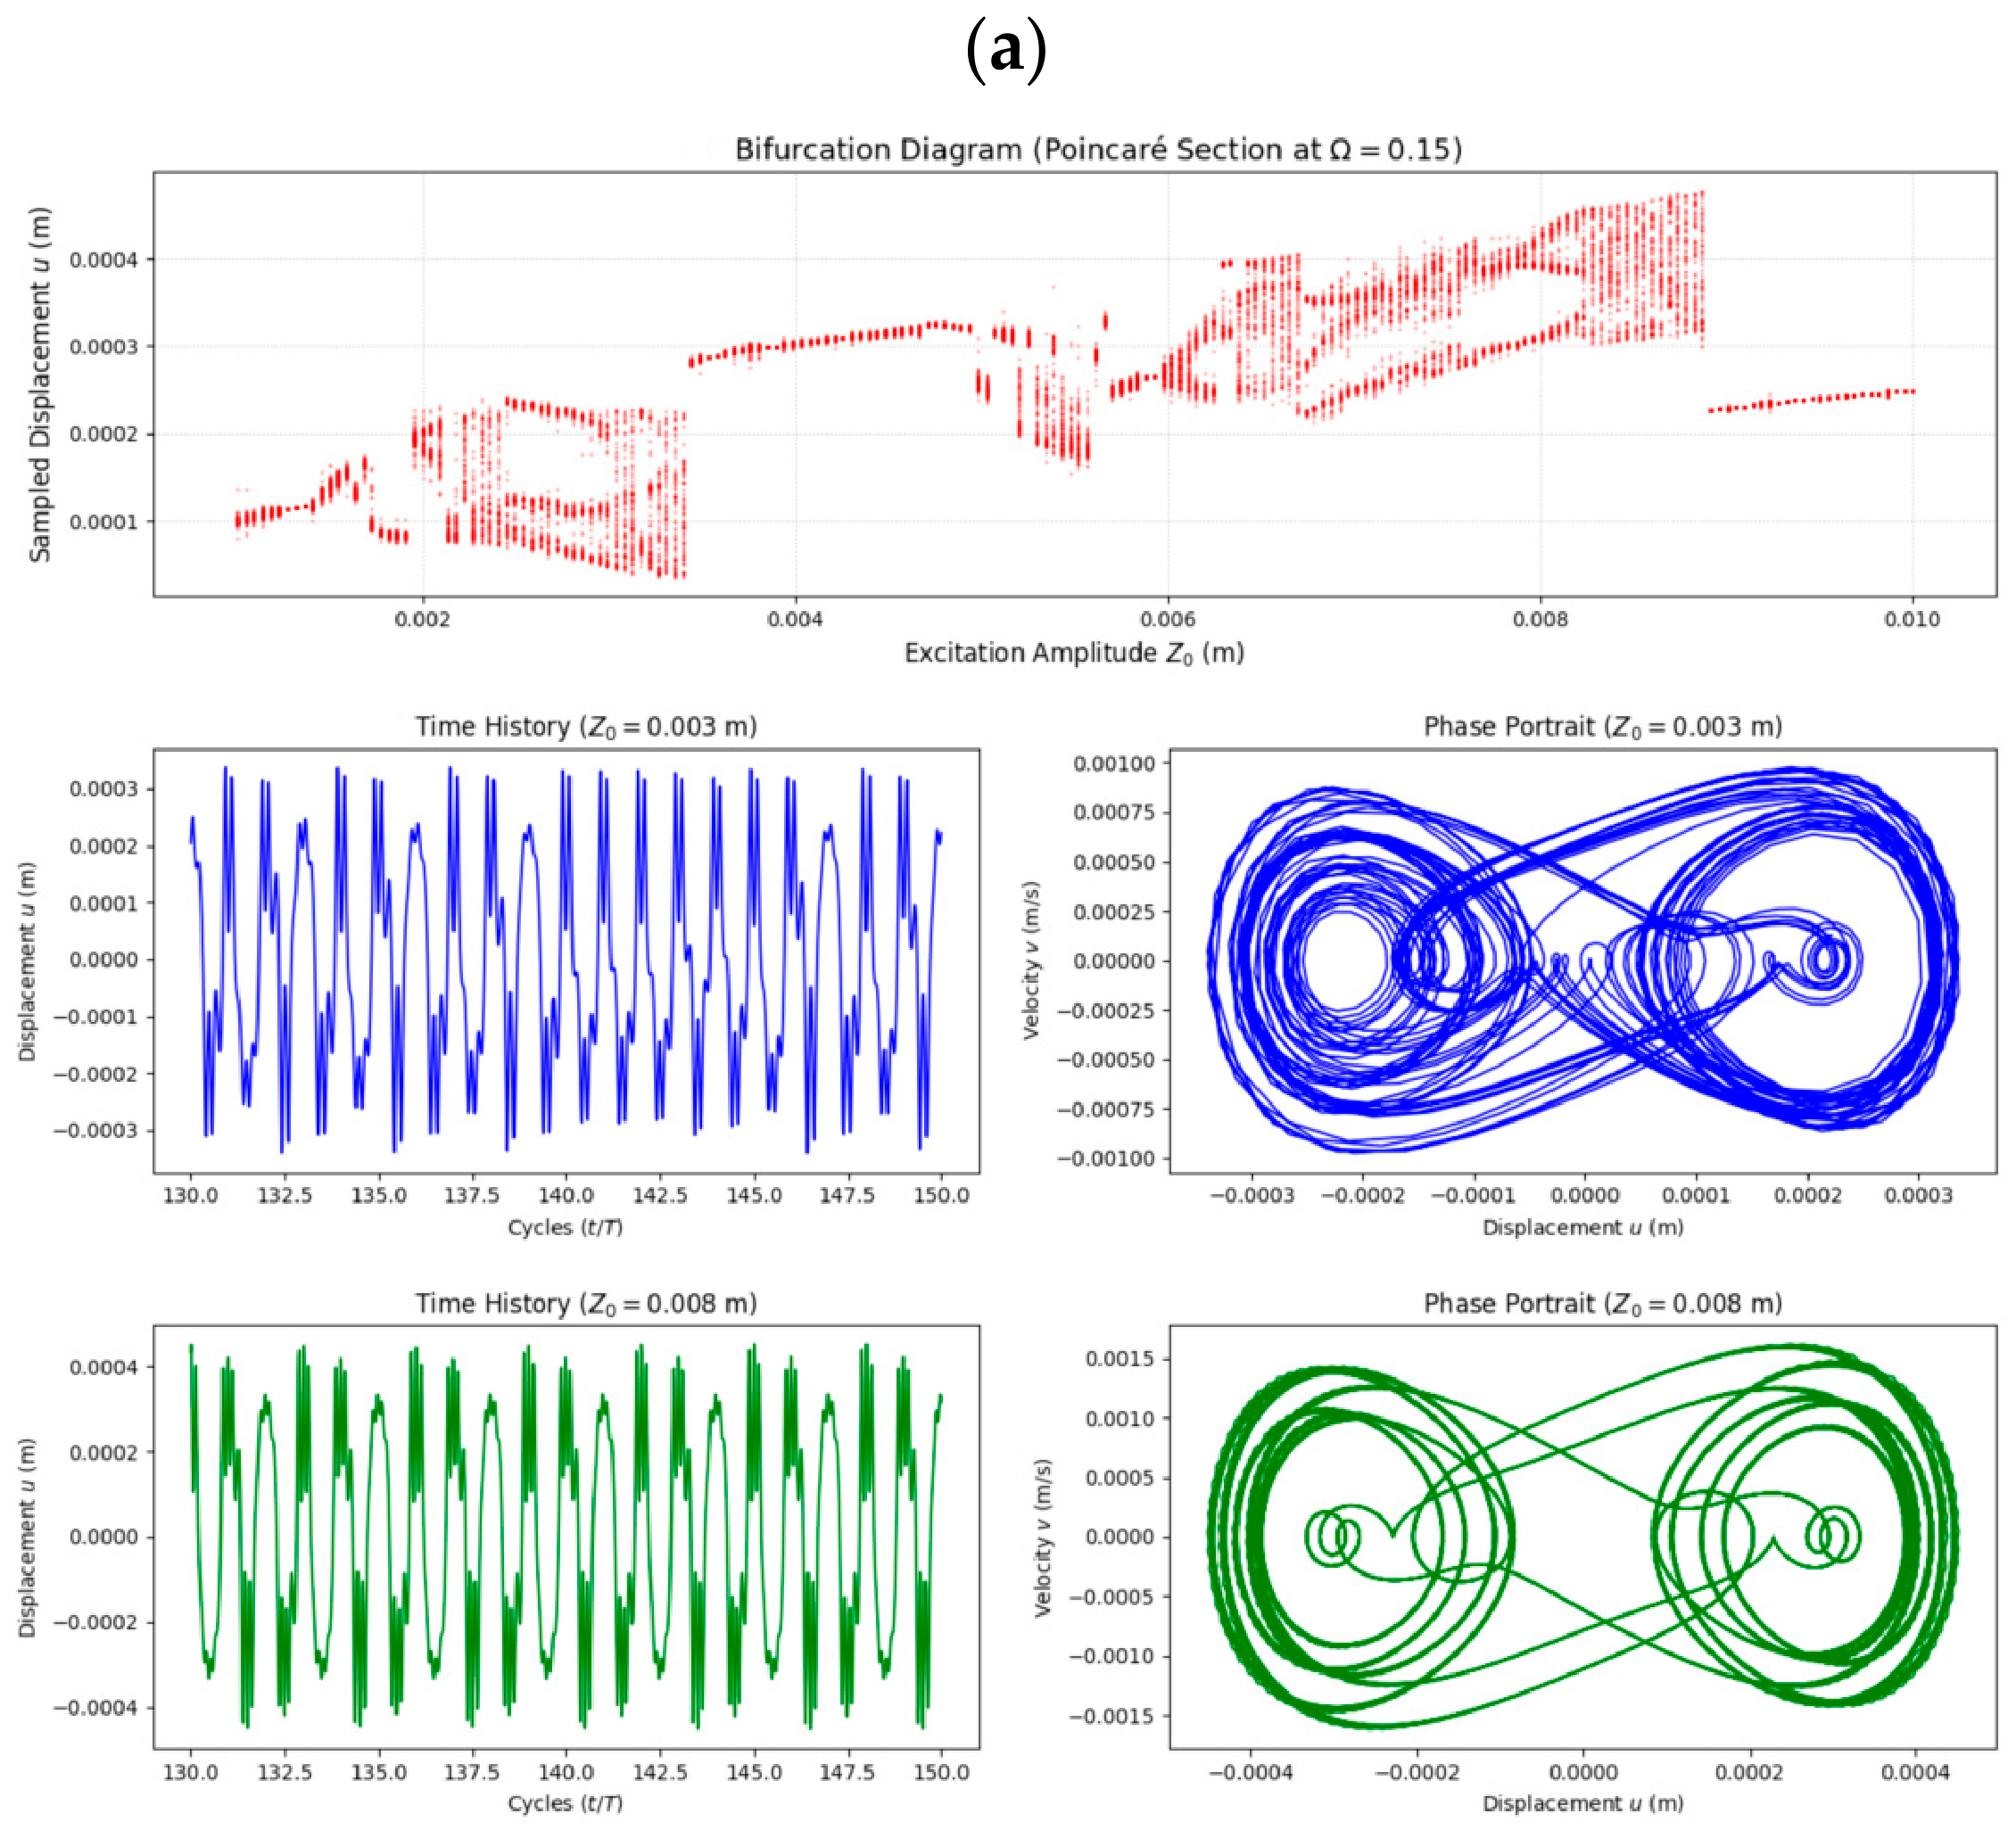
Under the operating condition shown in Figure 18a, with a damping ratio of 0.02, a fixed frequency of 0.15, and a cubic stiffness of 6.1357 × 10⁹, the system presents complex nonlinear dynamic behaviors, including periodic motion, period-doubling bifurcation, and chaos. Here, moderate damping dissipation competes with very strong nonlinear stiffness, and the Poincaré bifurcation diagram clearly records the alternating evolution of periodic motion, period-doubling bifurcation, chaos, and obvious periodic windows as the excitation amplitude Z0 increases. From the local states, it can be observed that, at a low excitation amplitude (Z0 = 0.003 m), the phase-plane trajectory forms a regular closed limit cycle and the system remains in a stable periodic state. When the excitation amplitude exceeds the critical threshold and reaches a high level (Z0 = 0.008 m), the phase trajectory rapidly disintegrates and folds, eventually evolving into a chaotic strange attractor with a complex fractal structure, indicating that the system has entered a highly unpredictable state of motion.
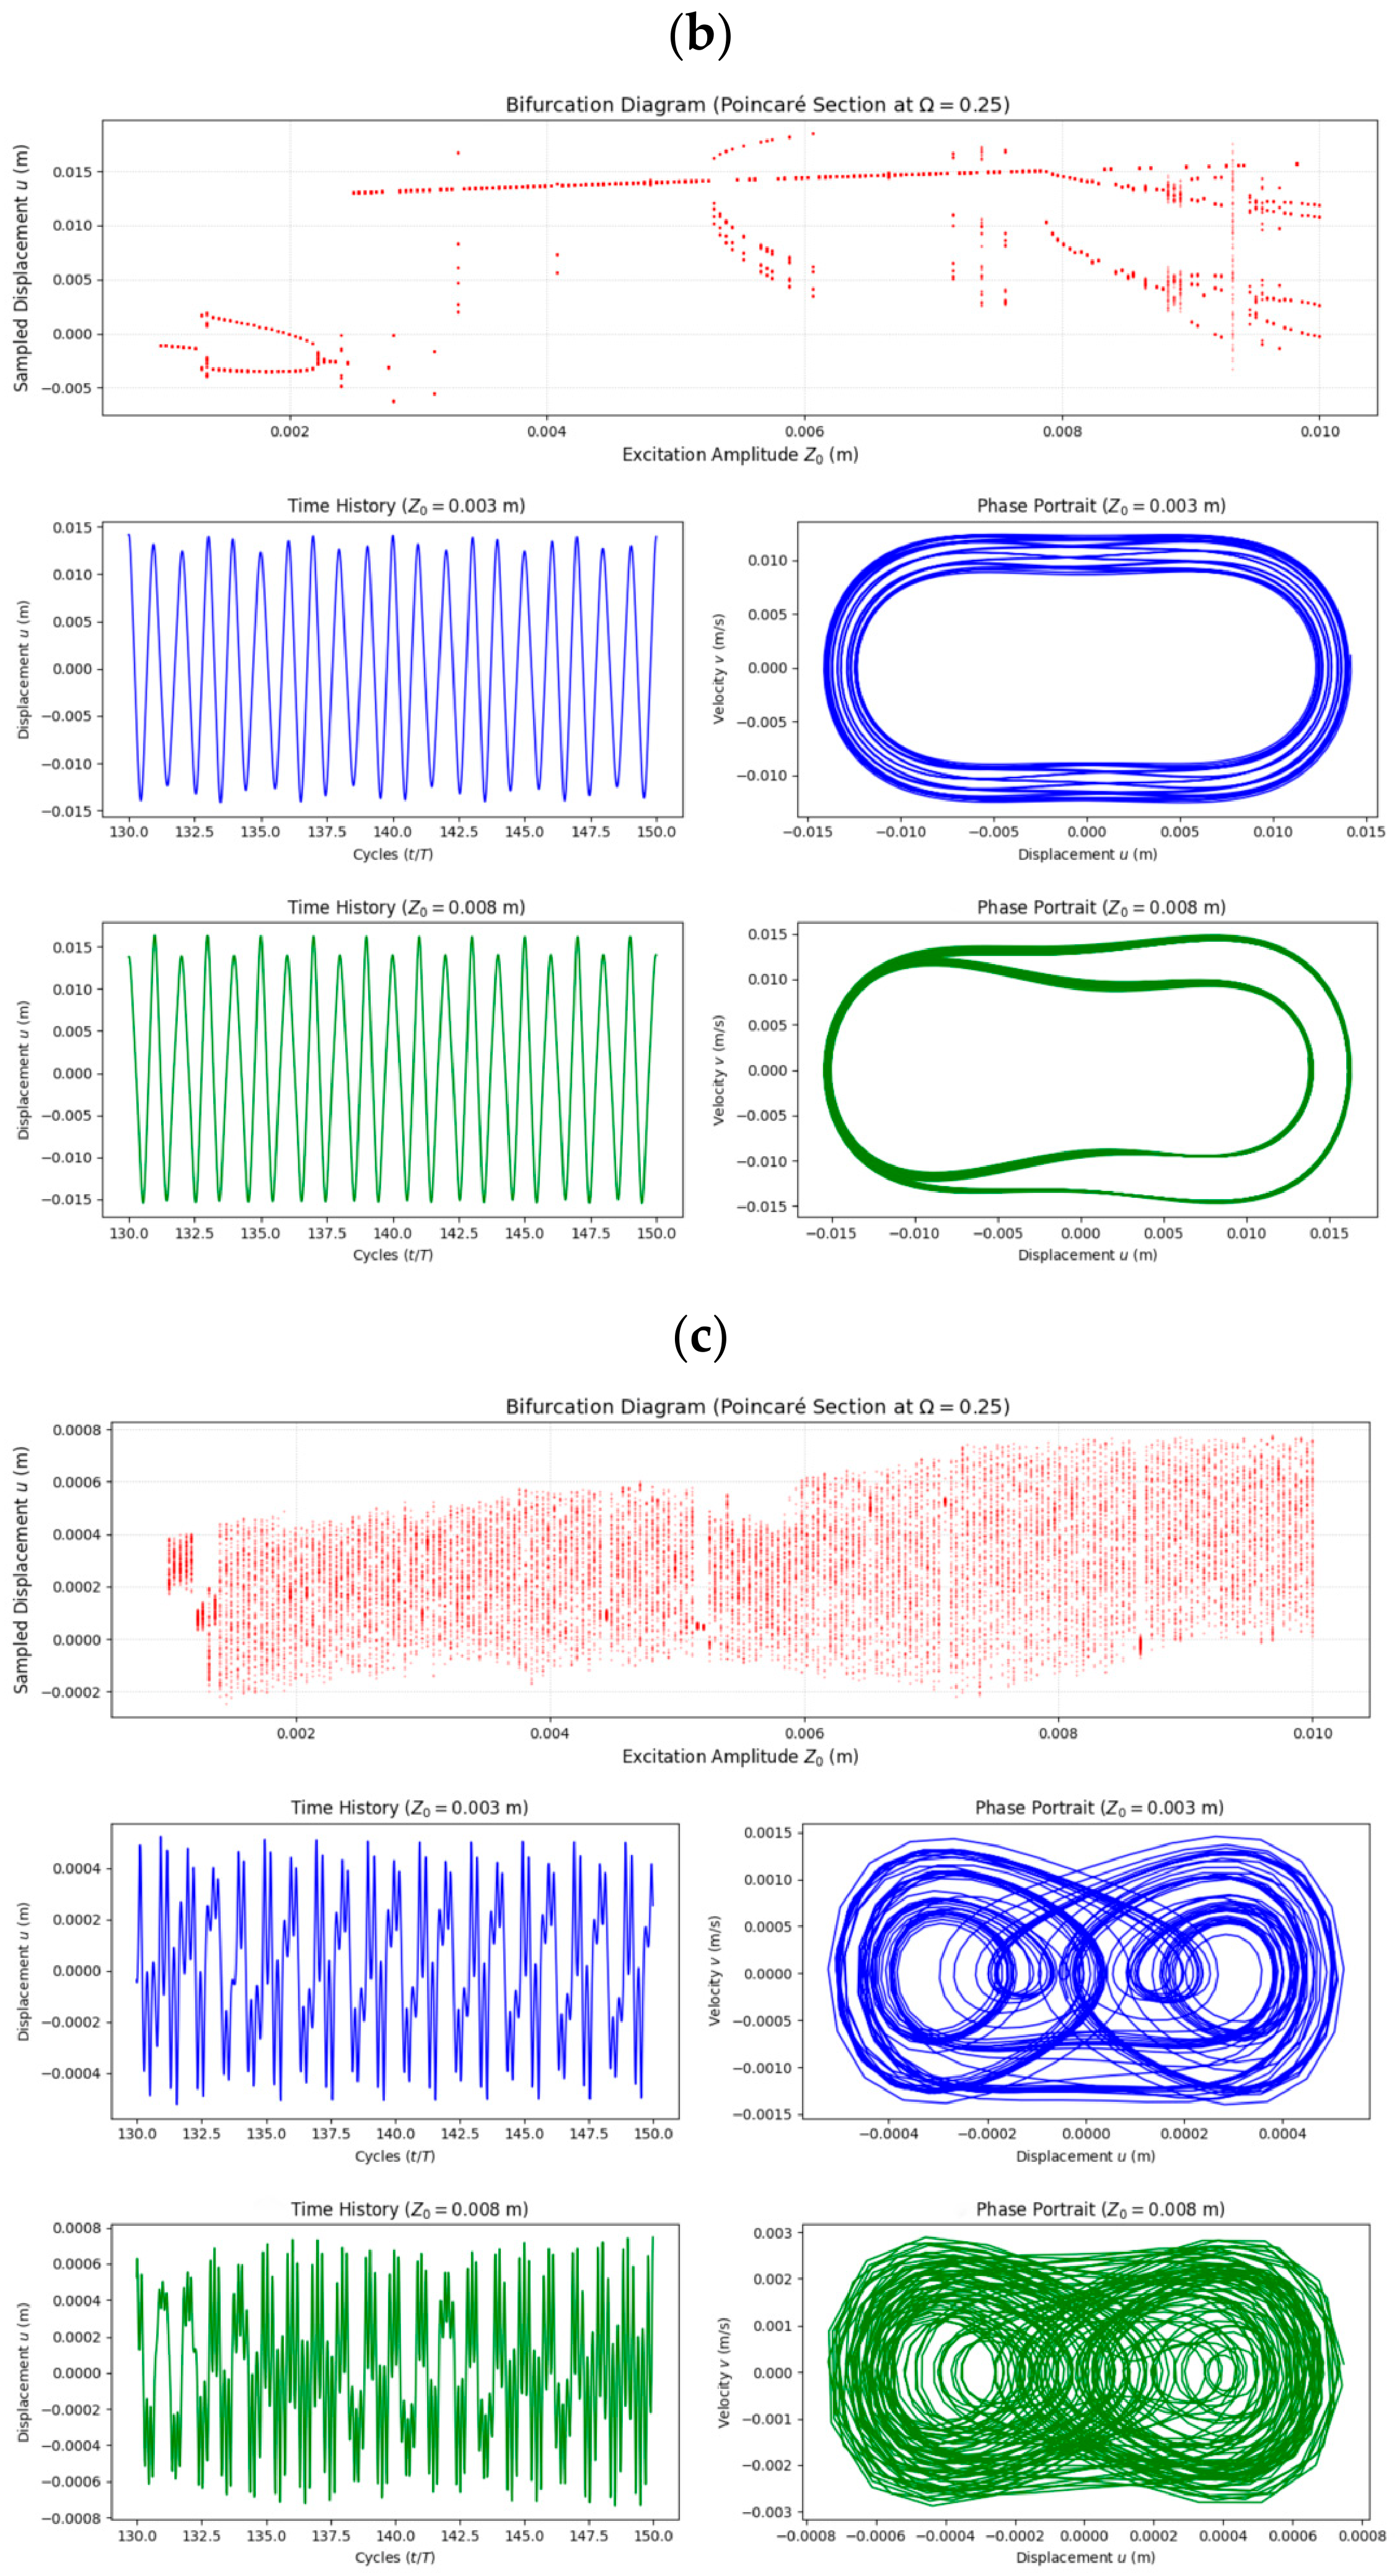
Figure 18.
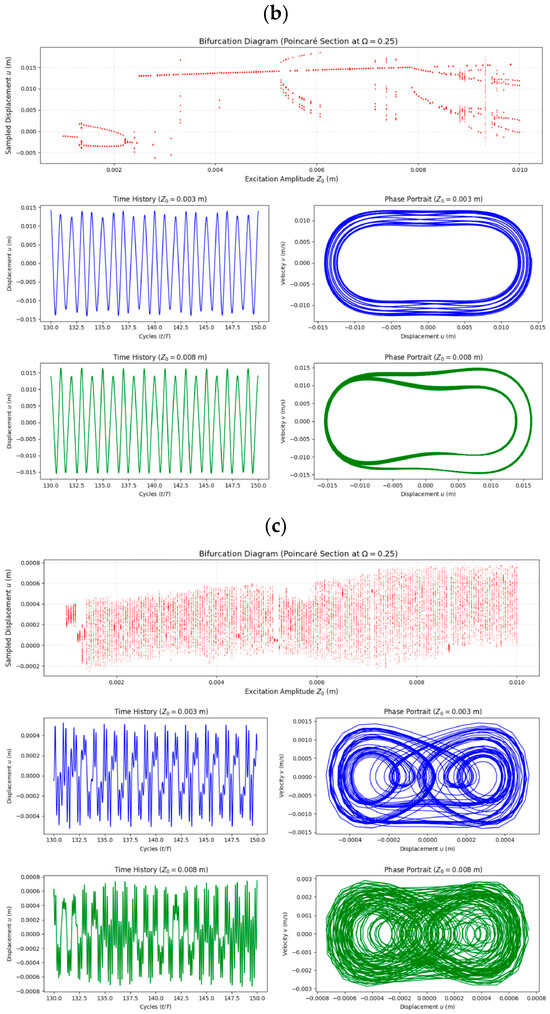
Global dynamic response characteristics of the system under different combinations of damping ratio, excitation frequency, and cubic nonlinear stiffness. (a) Damping ratio 0.02, fixed frequency 0.15, cubic stiffness 6.1357 × 10⁹. (b) Damping ratio 0.0005, fixed frequency 0.25, cubic stiffness 6.1357 × 10⁵. (c) Damping ratio 0.0005, fixed frequency 0.25, cubic stiffness 6.1357 × 10⁹.
When the system parameters change to those in Figure 18b, namely an extremely low damping ratio of 0.0005, a higher fixed frequency of 0.25, and a substantially reduced cubic stiffness of 6.1357 × 10⁵, the dynamic evolution of the system becomes entirely different. Although the damping is extremely weak and the energy dissipation is therefore very small, the nonlinear intensity of the restoring force is also greatly reduced because the cubic stiffness is much lower. As a result, the system mainly exhibits sparse and discrete bifurcation branches over the entire excitation-amplitude scan range. The corresponding time histories and phase portraits show that, whether under low or high excitation, the system maintains a high degree of regularity and periodicity, and the phase trajectory remains a closed ring. This phenomenon clearly indicates that lowering the nonlinear stiffness level can effectively suppress the excitation of chaotic energy, enabling the system to maintain a stable periodic quasi-resonant state even under weak damping and thereby avoid motion instability.
Under the extreme condition shown in Figure 18c, the coupling of extremely low damping and relatively strong cubic nonlinearity may drive the system response into a complex chaotic state. In this situation, conventional transmissibility evaluation at a single frequency can no longer fully describe the energy-transmission characteristics of the system; stability should instead be judged comprehensively by combining time-domain responses, phase portraits, and bifurcation diagrams. Therefore, the bifurcation analysis reveals that the coupling of excessively low damping ratio and overly strong cubic nonlinearity can lead to chaotic responses, and such parameter combinations should be avoided in engineering design.
4.4. Discussion
As summarized in Table 3, compared with recently reported bio-inspired quasi-zero-stiffness isolators in the literature, the proposed I-QZS achieves a superior balance between load capacity and low-frequency isolation performance. The spider-like structure employs curved beams to mimic spider legs and linear springs to mimic muscles, providing negative stiffness through the buckling effect of inclined curved beams, achieving an initial isolation frequency of 2.71 Hz and a peak frequency of 1.76 Hz under a 4.51 kg load. Inspired by the axially continuous porous core and peripheral hexagonal scaffold of the loofah sponge, a compact multi-layer hexagonal link-spring isolator was designed, achieving an initial isolation frequency of approximately 5 Hz and a peak frequency of 3.25 Hz under a 5.775 kg load. The kangaroo leg-like structure uses two main rods of different lengths to simulate the tibia and femur, and two linear springs to simulate the internal and external muscles, achieving an initial isolation frequency of 1.06 Hz and a peak frequency of 0.81 Hz under a 1.2 kg load, demonstrating excellent ultra-low-frequency isolation capability under light-load conditions. The secretary bird-like structure combines an X-shaped stiffness adjustment mechanism with pendulum-type vibration absorbers, achieving an initial isolation frequency of 3.4 Hz and a peak frequency of 3.23 Hz under a 12.4 kg load. Compared with the above bio-inspired structures, the proposed crab-inspired rhombic isolator achieves an initial isolation frequency as low as 0.9 Hz and a peak frequency of only 0.77 Hz under a 5.724 kg load. The kangaroo leg-like structure achieves a slightly lower peak frequency but under a much lighter load of only 1.2 kg. The loofah sponge-like structure, though offering higher load capacity, exhibits initial isolation and peak frequencies that are considerably higher than those of the present design. Neither the spider-like nor the loofah sponge-like structures outperform the present work in terms of load capacity or frequency indices. This indicates that the proposed I-QZS achieves a superior balance between load capacity and low-frequency isolation performance—effectively shifting the resonance peak to the ultra-low-frequency region below 1 Hz while maintaining a relatively high load capacity.
Table 3.
Performance comparison of the proposed isolator with recently reported bio-inspired QZS isolators.
Although the I-QZS exhibits clear advantages in low-frequency isolation performance, its engineering application still faces several limitations. First, the compliance compensation coefficient depends on a specific geometrical inclination angle (); machining deviations or assembly errors can cause the actual stiffness to deviate from the design value, as the QZS range width is sensitive to geometrical parameters. Second, the extension springs in the rhombic mechanism may suffer from fatigue and preload relaxation under long-term cyclic loading, leading to drift in the stiffness ratio , for which long-term fatigue test data are currently lacking. Third, the present design has been optimized for a specific target load; varying load conditions would require re-execution of the optimization process, as the system does not yet possess self-adaptive load adjustment capability. Fourth, the revolute joints are formed by directly fitting 3D-printed holes with metallic shafts. Although this reduces assembly complexity and manufacturing cost, the limited printing accuracy inevitably introduces assembly clearances and contact friction. In addition, the PLA material itself exhibits viscoelasticity, which produces hysteresis effects under cyclic loading. In the dynamic modeling of this work, joint friction, material hysteresis, air damping, and other dissipative effects are collectively represented by an equivalent macroscopic viscous damping ratio (), estimated from the measured resonance responses. These individual dissipation mechanisms have not yet been independently decoupled or directly quantified through dedicated quasi-static cyclic loading–unloading tests. Although this equivalent damping model can effectively predict the resonance peak shift and transmissibility characteristics under the low-frequency steady-state excitation conditions considered in this study, it remains difficult to accurately capture the higher-order dissipation laws of strong friction nonlinearity during the large-amplitude reciprocating motion of the system.
From an engineering application perspective, the passive, compact, and structurally simple characteristics of the I-QZS make it suitable for two types of scenarios. The first is lightweight personal mobility systems—including electric scooters, bicycles, wheelchairs, and compact autonomous vehicles [41,42]—which are sensitive to low-frequency vibration in terms of ride comfort and component fatigue life, and impose high requirements on the passivity, compactness, and low-maintenance nature of the isolator. The I-QZS is entirely composed of passive components and requires no external power supply. By scaling the linkage dimensions and adjusting the spring stiffness, it can be adapted to different loads. In the experiments, the resonance peak was shifted from 2.15 Hz to 0.77 Hz, thereby reducing resonance amplification in the low-frequency range and potentially improving ride comfort by decreasing vibration transmitted to the occupant. The second scenario is industrial vibration isolation—including precision manufacturing equipment, machine tools, compressors, pumps, and other rotating machinery [43]. By replacing materials (e.g., using metallic springs instead of PLA) and scaling the geometric dimensions, the design philosophy of this work can be extended to medium- and high-load conditions. These equipment types are sensitive to low-frequency vibration transmission and generally require the isolator to maintain stable performance over long-term operation without external intervention. However, it should be noted that the current validation has been performed only under a single load condition; the adaptability to variable loads in industrial scenarios still needs to be addressed by introducing adjustable preload mechanisms or modular spring replacement strategies.
The above limitations point toward directions for future research. In the short term, systematic quasi-static cyclic loading–unloading tests will be conducted to precisely identify and quantify the dry friction and hysteresis parameters, thereby establishing a more comprehensive nonlinear damping constitutive model. Meanwhile, the introduction of adjustable preload mechanisms or magnetorheological elements is expected to enhance the load adaptability and long-term stability of the system without sacrificing low-frequency isolation performance. In the long term, multi-directional coupled excitation experiments and durability tests under different environmental conditions are also necessary steps to promote the engineering application of this structure.
5. Conclusions
Inspired by the segmented linkage configuration and articulated structure of crab walking legs, this paper proposes a crab-inspired quasi-zero-stiffness isolator (I-QZS) consisting of circumferentially distributed rhombic units and a central vertical spring. Static analysis shows that the geometric deformation of the rhombic linkages under compression generates a negative-stiffness effect. When combined in parallel with the positive stiffness provided by the central spring, this effect produces a quasi-zero-stiffness region within the target displacement range. A compliance compensation coefficient is introduced to compensate for the stiffness discrepancy between the theoretical model and the actual compliant structure. For the dynamic analysis, a cubic polynomial restoring-force model is established, and the steady-state response and displacement transmissibility of the strongly nonlinear system are obtained using the incremental harmonic balance method combined with SVD-based null-space arc-length continuation. Experiments demonstrate that the I-QZS shifts the resonance peak to the ultra-low-frequency region and significantly reduces the peak transmissibility. Compared with an equivalent linear isolator, the I-QZS exhibits a lower isolation onset frequency and a wider isolation bandwidth. Quasi-static and dynamic experiments validate the theoretical model and confirm the improved isolation performance of the proposed QZS isolator. Bifurcation analysis further reveals that the combination of excessively low damping and overly strong cubic nonlinearity can lead to chaotic responses; such parameter combinations should therefore be avoided in engineering design. The proposed isolator shows potential for low-frequency vibration isolation in lightweight personal mobility systems and precision manufacturing equipment.
Based on the conclusions drawn from this paper, future work will establish a more comprehensive theoretical model for the large-deformation behavior of compliant linkages and obtain optimal geometric dimensions under different load conditions through parametric studies. Since friction and material-hysteresis effects have not yet been decoupled, quasi-static cyclic loading–unloading tests will be conducted to separately quantify the dry-friction and viscous-damping components, thereby refining the nonlinear damping constitutive model. In addition, the fatigue behavior of the hinges and extension springs under long-term cyclic loading and the influence of ambient temperature on the mechanical properties of 3D-printed PLA need to be investigated to facilitate the engineering application of the proposed structure.
Author Contributions
Z.Y.: Writing—original draft; visualization; writing—review & editing; methodology. X.-C.W.: Project administration; formal analysis; data curation; supervision. W.-G.F.: Supervision; validation; formal analysis; software. S.-K.L.: Supervision; validation; formal analysis; resources. Z.W.: Conceptualization; funding acquisition; project administration; validation; formal analysis. All authors have read and agreed to the published version of the manuscript.
Funding
This research was funded by Department of Science and Technology of Liaoning Province grant number 2025JH2/101800357.
Data Availability Statement
The original contributions presented in this study are included in the article. Further inquiries can be directed to the corresponding author.
Acknowledgments
We would like to thank all those who contributed to the experiments and manuscript preparation in this study.
Conflicts of Interest
The authors declare no conflict of interest.
References
- Li, L.; Wang, L.; Yuan, L.; Zheng, R.; Wu, Y.; Sui, J.; Zhong, J. Micro-vibration suppression methods and key technologies for high-precision space optical instruments. Acta Astronaut. 2021, 180, 417–428. [Google Scholar] [CrossRef] [Scilit]
- Su, L.; Zhang, C.; Ma, X.; Shen, C.; Zhang, X.; Gao, W.; Zhou, M. Discrete-Time Output Feedback Sliding Mode Control of Piezoelectric-Actuated Hybrid Isolator for Vibration-Sensitive Instruments. IEEE Trans. Instrum. Meas. 2026, 75, 3000214. [Google Scholar] [CrossRef] [Scilit]
- Xing, W.; Tuo, W.; Li, X.; Wang, T.; Yang, C. Micro-vibration suppression and compensation techniques for in-orbit satellite: A review. Chin. J. Aeronaut. 2024, 37, 1–19. [Google Scholar] [CrossRef] [Scilit]
- Chen, Y.; Hou, L.; Lin, R.; Wang, Y.; Saeed, N.A.; Chen, Y. Combination resonances of a dual-rotor-bearing-casing system. Nonlinear Dyn. 2024, 112, 4063–4083. [Google Scholar] [CrossRef] [Scilit]
- Duan, K.; Hou, F. The Design and Application of a Rubber Vibration Isolator for Aerospace Equipment. Eng. Proc. 2025, 80, 42. [Google Scholar] [CrossRef] [Scilit]
- Jiao, X.; Zhang, J.; Li, W.; Wang, Y.; Ma, W.; Zhao, Y. Advances in spacecraft micro-vibration suppression methods. Prog. Aerosp. Sci. 2023, 138, 100898. [Google Scholar] [CrossRef] [Scilit]
- Xie, X.; Li, M.; Du, X. Nonlinear dynamics of marine rotor-bearing system coupled with vibration isolation structure subject to ship rolling motion. Appl. Math. Model. 2022, 103, 344–359. [Google Scholar] [CrossRef] [Scilit]
- Li, X.; Huang, S.; Xu, Y.; Liu, J.; Liu, J.; Pan, G. Dynamic analysis of a quasi-zero stiffness vibration isolator in propulsion shaft system. Ocean Eng. 2024, 313, 119544. [Google Scholar] [CrossRef] [Scilit]
- Ji, Y.; Wang, X.; Li, J. Preliminary Study on Pollution Isolation of Civil Air Defence Underground Engineering. E3S Web Conf. 2020, 194, 04045. [Google Scholar] [CrossRef] [Scilit]
- Ghaderi, A.; Nouri, M.; Hoseinzadeh, L.; Ferdousi, A. Correction: Hybrid Vibration Control of Tall Tubular Structures via Combining Base Isolation and Mass Damper Systems Optimized by Enhanced Special Relativity Search Algorithm (Iranian Journal of Science and Technology, Transactions of Civil Engineering, (2024), 10.1007/s40996-024-01366-0). Iran. J. Sci. Technol.—Trans. Civ. Eng. 2025, 49, 1031. [Google Scholar] [CrossRef] [Scilit]
- Mu, F.; Xu, Z.-D.; Zhang, M. Locally resonant elastic metamaterials for low frequency vibration isolation and mitigation: A review of theoretical modeling, tuning mechanisms, and civil engineering applications. J. Build. Eng. 2026, 123, 115885. [Google Scholar] [CrossRef] [Scilit]
- Zhang, C.; He, J.; Zhou, G.; Wang, K.; Xu, D.; Zhou, J. Compliant quasi-zero-stiffness isolator for low-frequency torsional vibration isolation. Mech. Mach. Theory 2023, 181, 105213. [Google Scholar] [CrossRef] [Scilit]
- Singh, Y.P.; Ahmad, N.; Ghosal, A. Dynamically isotropic Gough–Stewart platform for micro-vibration isolation in spacecrafts. Mech. Mach. Theory 2024, 201, 105735. [Google Scholar] [CrossRef] [Scilit]
- Zhang, W.; Che, J.; Shu, H.; Bai, Y.; Liu, X.; Jiang, W.; Wu, J.; Chen, X. Stewart-inspired vibration isolation mechanisms for precision equipment: Current status and future research trend. Mech. Mach. Theory 2025, 214, 106153. [Google Scholar] [CrossRef] [Scilit]
- Zheng, Z.; Wang, S.; Jiang, B.; Li, D. Characteristics of a Quasi-Zero-Stiffness Isolator Using a Double-Curved Beam as a Negative Stiffness Mechanism. J. Ocean Univ. China 2024, 23, 1409–1422. [Google Scholar] [CrossRef] [Scilit]
- Zhou, J.; Wang, X.; Xu, D.; Bishop, S. Bishop Nonlinear dynamic characteristics of a quasi-zero stiffness vibration isolator with cam–roller–spring mechanisms. J. Sound Vib. 2015, 346, 53–69. [Google Scholar] [CrossRef] [Scilit]
- Stabile, A.; Yotov, V.V.; Aglietti, G.S.; Francesco, P.D.; Richardson, G. Effect of boundary conditions on a high-performance isolation hexapod platform. Mech. Mach. Theory 2022, 177, 105020. [Google Scholar] [CrossRef] [Scilit]
- Pu, H.; Liu, J.; Wang, M.; Ding, J.; Sun, Y.; Peng, Y.; Luo, J. Bio-inspired quasi-zero stiffness vibration isolator with quasilinear negative stiffness in full stroke. J. Sound Vib. 2024, 574, 118240. [Google Scholar] [CrossRef] [Scilit]
- Lu, Z.; Brennan, M.; Ding, H.; Chen, L. High-static-low-dynamic-stiffness vibration isolation enhanced by damping nonlinearity. Sci. China (Technol. Sci.) 2019, 62, 1103–1110. [Google Scholar] [CrossRef] [Scilit]
- Yu, N.; Yang, K.; Wu, Z.; Zhang, W.; Yan, B. Low-frequency vibration absorption of magnetic quasi-zero-stiffness structures with lever mechanism. Int. J. Mech. Sci. 2024, 267, 108973. [Google Scholar] [CrossRef] [Scilit]
- Hu, X.; Zhou, C. The effect of various damping on the isolation performance of quasi-zero-stiffness system. Mech. Syst. Signal Process. 2022, 171, 108944. [Google Scholar] [CrossRef] [Scilit]
- Chong, X.; Wu, Z.; Li, F. Vibration isolation properties of the nonlinear X-combined structure with a high-static and low-dynamic stiffness: Theory and experiment. Mech. Syst. Signal Process. 2022, 179, 109352. [Google Scholar] [CrossRef] [Scilit]
- Chunyan, K.; Jie, X.; Mingkun, Y.; Yang, L.; Yi, L. Analysis of static and dynamic characteristics of membrane air springs for small passenger cars. J. Braz. Soc. Mech. Sci. Eng. 2024, 46, 682. [Google Scholar] [CrossRef] [Scilit]
- Sheng, P.; Jing, S.; Ding, L.; Zhou, H.; Zhang, Z. Performance Improvement of Three-Spring Quasi-Zero-Stiffness Isolator by Shape Memory Alloy Damper. Int. J. Appl. Mech. 2024, 16, 2450077. [Google Scholar] [CrossRef] [Scilit]
- Hu, C.; Li, Z.; Tan, X.; Chen, M. Accelerated inverse design of vibration isolators with customizable low dynamic stiffness characteristics via deep neural network. Aerosp. Sci. Technol. 2024, 155, 109735. [Google Scholar] [CrossRef] [Scilit]
- Zhu, J.; Wang, C.; Chen, K.; Shi, H.; Wang, Z.; Wu, B.; Wu, H.; Zhang, H.; Wu, H. Design and Vibration Isolation Investigation of a Load-Adjustable Quasi-Zero Stiffness Isolator. Int. J. Struct. Stab. Dyn. 2025, 25, 2550216. [Google Scholar] [CrossRef] [Scilit]
- Lin, Y.; Wen, G.; Liu, C.; He, J.; Liu, J. A magnetorheological elastomer-based hybrid vibration isolation system with semi-active control and quasi-zero stiffness performance. Int. J. Non-Linear Mech. 2025, 174, 105063. [Google Scholar] [CrossRef] [Scilit]
- Leng, D.; Zhou, X.; Feng, W.; Ning, D.; Liu, G. A tunable quasi-zero-stiffness vibration isolator (QZS-VI) with magnetorheological elastomer (MRE). Smart Mater. Struct. 2025, 34, 035026. [Google Scholar] [CrossRef] [Scilit]
- Xing, X.; Chen, Z.; Liu, Y.; Jin, J. Design and analysis of semi-active quasi-zero stiffness vibration isolator based on magnetorheological damper and halbach array magnetic spring. Mech. Adv. Mater. Struct. 2026, 33, 2471957. [Google Scholar] [CrossRef] [Scilit]
- Liu, B.; Gu, L.; Dong, M. Bifurcation and dynamic analysis of quasi-zero stiffness isolator with asymmetric stiffness and mismatched load based on X-shaped negative stiffness structure. Acta Mech. 2024, 235, 3447–3462. [Google Scholar] [CrossRef] [Scilit]
- Zhu, Z.; Li, Y. Biomimetic Nonlinear X-Shaped Vibration Isolation System for Jacket Offshore Platforms. Machines 2025, 13, 998. [Google Scholar] [CrossRef] [Scilit]
- Yu, X.; Yao, G. Nonlinear vibration suppression of a beam subjected to concentrated mass loads with an X-shaped local isolator. Mech. Syst. Signal Process. 2026, 251, 114222. [Google Scholar] [CrossRef] [Scilit]
- Sui, G.; Hou, S.; Zhang, X.; Shan, X.; Hou, C.; Song, H.; Hou, W.; Li, J. A bio-inspired spider-like structure isolator for low-frequency vibration. Appl. Math. Mech. 2023, 44, 1263–1286. [Google Scholar] [CrossRef] [Scilit]
- Ou, H.; Sun, X.; Wu, Q.; Chen, Z.; Chen, Z.; Chen, Q.; Hu, L. A novel bio-inspired kangaroo leg structure for low-frequency vibration isolation. Nonlinear Dyn. 2024, 112, 1797–1814. [Google Scholar] [CrossRef] [Scilit]
- Yan, G.; Wang, S.; Zou, H.; Zhao, L.; Gao, Q.; Zhang, W. Bio-inspired polygonal skeleton structure for vibration isolation: Design, modelling, and experiment. Sci. China Technol. Sci. 2020, 63, 2617–2630. [Google Scholar] [CrossRef] [Scilit]
- Zhang, Y.; Wen, H.; Hu, H.; Jin, D. A novel quasi-zero stiffness isolator with designable stiffness using cam-roller-spring-rod mechanism. Acta Mech. Sin. 2025, 41, 524210. [Google Scholar] [CrossRef] [Scilit]
- Yi, S.; Zeng, L.; Jiang, Z.; Li, X.; Xu, L.; Yan, Y.; Wang, S.; Zhang, Q. Dynamics study of a novel secretary bird inspired vibration isolator: Modeling, analysis and experiment. Nonlinear Dyn. 2025, 113, 16083–16107. [Google Scholar] [CrossRef] [Scilit]
- Tian, W.; Li, X.; Wu, X.; Huang, H.; Kong, L. A Bio-inspired Low-frequency Vibration Isolator Based on Loofah Sponge Structure. J. Bionic Eng. 2026, 23, 842–862. [Google Scholar] [CrossRef] [Scilit]
- Wu, Z.; Zhang, Y.; Yao, G.; Yang, Z. Nonlinear primary and super-harmonic resonances of functionally graded carbon nanotube reinforced composite beams. Int. J. Mech. Sci. 2019, 153, 321–340. [Google Scholar] [CrossRef] [Scilit]
- Yang, Y.; Liu, C.; Chen, L.; Zhang, X. Phase deviation of semi-active suspension control and its compensation with inertial suspension. Acta Mech. Sin. 2024, 40, 523367. [Google Scholar] [CrossRef] [Scilit]
- Karpenko, M. Safety and reliability assessment of personal electric kick-scooter riding with different tire types. Eksploat. Niezawodn.-Maint. Reliab. 2026, 28, 218675. [Google Scholar] [CrossRef] [Scilit]
- Karpenko, M. Analysing the impact of electric kick-scooters on drivers: Vibration and frequency transmission during the ride on different types of urban pavements. Eksploat. Niezawodn. 2025, 27, 199893. [Google Scholar] [CrossRef] [Scilit]
- Karpenko, M.; Ževžikov, P.; Stosiak, M.; Skačkauskas, P.; Borucka, A.; Delembovskyi, M. Vibration Research on Centrifugal Loop Dryer Machines Used in Plastic Recycling Processes. Machines 2024, 12, 29. [Google Scholar] [CrossRef] [Scilit]

Disclaimer/Publisher’s Note: The statements, opinions and data contained in all publications are solely those of the individual author(s) and contributor(s) and not of MDPI and/or the editor(s). MDPI and/or the editor(s) disclaim responsibility for any injury to people or property resulting from any ideas, methods, instructions or products referred to in the content. |
© 2026 by the authors. Licensee MDPI, Basel, Switzerland. This article is an open access article distributed under the terms and conditions of the Creative Commons Attribution (CC BY) license.