


Abstract
Engineering drawings are one of the most essential references in the product research and development process. With the rapid advancement of computer hardware and software, the presentation of engineering drawings has evolved from traditional hand-drafting to computer-aided design (CAD). However, in current practice, transforming 2D drawings into 3D models still requires manual operation in CAD software. This process is time-consuming, labor-intensive, and prone to errors if engineers misinterpret the drawings, which may result in defective models. To address this issue, this study employs the Darknet SDK (Software Development Kit) to train YOLO (You Only Look Once) models using 2D engineering drawings as training data. By performing image segmentation and classification of drawing features, seven feature-specific YOLO models were trained to detect: orthographic views (100%), geometric features (100%), convex/concave features (99.9%), dimension groups (99.8%), dimension lines (99.1%), theoretical dimensions (98.6%), and text characters (93.6%). These pretrained models are then used to extract dimensional and geometric information from 2D drawings. The corresponding dimensional values are matched with the relative size and edge lengths of detected objects in the images and stored in a relational database. Subsequently, Siemens NX CAD software, along with its NX Open secondary development modules, was integrated to convert the recognized 2D drawing features into 3D models. This approach reduces dimensional errors in 2D-to-3D model conversion, ensures the accuracy of feature recognition, and improves the efficiency of model generation.
1. Introduction
With the widespread adoption of computer-aided design (CAD) software and the advancement of 3D modeling technologies, communication between product design and manufacturing has significantly improved. In the era of smart manufacturing, 3D digital models have become the foundation of advanced engineering workflows, including Digital Twins, Computer-Aided Manufacturing (CAM), and Product Lifecycle Management (PLM). However, many manufacturing enterprises continue to maintain extensive collections of legacy 2D engineering drawings that contain valuable design knowledge accumulated over decades. In practical industrial scenarios, such as maintenance, repair, and overhaul (MRO), reverse engineering of legacy components, and supply chain migration, these 2D drawings must be reconstructed into 3D CAD models to support digital simulation, automated manufacturing, quality inspection, and lifecycle management.
Despite advances in CAD technologies, the conversion of 2D engineering drawings into 3D models still relies heavily on the expertise of experienced engineers and remains a time-consuming and labor-intensive process. As digital transformation accelerates the demand for customized products and intelligent manufacturing, manual 2D-to-3D reconstruction has become a major bottleneck that prevents legacy engineering data from being fully integrated into modern digital manufacturing workflows. Furthermore, manual reconstruction is susceptible to human errors and inconsistencies, while the industry faces a growing shortage of skilled engineering personnel. To address these challenges, this study proposes an automated 2D-to-3D conversion system designed to bridge the gap between legacy engineering drawings and smart manufacturing workflows.
Previous research has explored various approaches for the automatic recognition of drawing features. Harish et al. [1] employed shape recognition and the Ramer–Douglas–Peucker algorithm to construct wireframe contours and convert them into point cloud representations. Tyan et al. [2] highlighted the diversity of feature recognition techniques and analyzed the development of both 2D and 3D feature recognition methods. However, the complexity of engineering drawings often makes the development of recognition systems highly challenging. Hoang [3] argued that reconstructing 3D models from 2D views is more difficult than generating 2D projections from 3D models, and current CAD software remains underdeveloped in this area. In addition, Cui et al. [4] utilized Unigraphics (UG)-based secondary development for parametric design, thereby simplifying the modeling process and increasing efficiency. Krahe et al. [5] developed an AI-assisted system that converts 3D models into multi-view 2D drawings and applies convolutional neural networks (CNNs) to classify developing components, providing engineers with guidance for subsequent design steps.
In terms of automated text detection and recognition technologies, Trischler et al. [6] proposed a Parallel–Hierarchical neural network model that analyzes words, sentence fragments, and sentence sequences through a multi-layered architecture to enhance machine text comprehension. Their results indicate that this method effectively improves text understanding performance even with limited data, outperforming traditional feature engineering approaches. Epshtein et al. [7] introduced the Stroke Width Transform (SWT) algorithm, which detects text by calculating the stroke width of pixels within an image, offering the advantages of fast computation and eliminating the need for multi-scale scanning; this method achieves strong detection performance across various fonts and multilingual text. To address Chinese text recognition in natural scenes, Yu et al. [8] combined methods such as MSER, mathematical morphology, HOG, and SVM for text region detection and classification, using KNN for text recognition, which effectively enhances the accuracy of Chinese scene text recognition. Wan et al. [9] proposed a Chinese text localization method based on Chinese character features, utilizing MSER and mathematical morphology to extract and connect text regions, and integrating SWT with text line merging techniques to complete text localization, efficiently improving the accuracy of Chinese text localization in natural scenes.
In recent years, deep learning has driven rapid advances in image recognition and object detection, with CNNs being widely applied. Liu et al. [10] proposed the Single Shot MultiBox Detector (SSD), which generates prediction boxes of varying scales and assigns class confidence scores. Redmon et al. [11] introduced YOLO (You Only Look Once), which formulates detection as a regression problem to predict bounding boxes and class probabilities, outperforming previous methods. Han et al. [12] proposed Optimized YOLOv2 (O-YOLOv2), which enhances the YOLOv2 framework by adding convolutional layers for improved feature extraction and gradient handling, thereby increasing detection accuracy for small-scale vehicles. Xiu et al. [13] developed YOLO-CS, which refines bounding box assignment and incorporates loss optimization to improve accuracy in highly overlapping objects. Bochkovskiy et al. [14] further advanced YOLOv4 by introducing CutMix and Mosaic data augmentation, leveraging image rotation, scaling, and background diversity to enhance detection performance. The maturity of these techniques provides a solid foundation for automatic feature extraction from engineering drawings and the automation of 2D-to-3D conversion.
To understand the transition from 2D representations to 3D spaces, it is essential to examine the evolution of various CAD modeling techniques. Requicha [15] established a rigorous mathematical framework to compare solid representation schemes, proposing a multi-representation geometric modeling system to enhance reliability and efficiency in CAD/CAM workflows. Requicha and Voelcker [16] further demonstrated that solid modeling represents a critical breakthrough in CAD/CAM development by providing complete, unambiguous geometric descriptions that lay the foundation for subsequent design and manufacturing automation. Building upon these geometric primitives, feature-based modeling, as highlighted by Shah [17], integrated pure geometry with engineering semantics to support advanced reasoning and automated product development. In recent years, these foundational techniques have paved the way for various 3D automated modeling methods. For instance, Zhang et al. [18] introduced a two-stage approach that automatically generates 3D CAD models from 2D orthographic drawings by combining a pattern-matching algorithm with a clustering method, showcasing the potential of rule-based automation in bridging the dimensionality gap. Despite these advances, existing studies primarily focus on individual tasks, such as geometric feature recognition, text detection, or object detection. Few studies have integrated these techniques into a complete and automated framework capable of converting complex engineering drawings into editable parametric 3D CAD models. Moreover, practical engineering drawings contain dense dimensions, annotations, and multiple orthographic views, making feature interpretation and semantic association considerably more challenging than generic object detection. Consequently, the gap between feature recognition and CAD model generation remains a major obstacle to practical 2D-to-3D reconstruction.
To bridge this gap, this study proposes an integrated framework that combines deep learning-based feature recognition, optical character recognition, CAD secondary development, and database management. By establishing semantic relationships between recognized geometric entities and engineering dimensions, the proposed system automatically reconstructs editable parametric 3D CAD models from 2D drawings containing fundamental geometric features. Consequently, the proposed framework provides a proof-of-concept for a human–AI collaborative CAD reconstruction paradigm, thereby establishing a solid technical foundation for future automated workflows involving legacy engineering drawings.
2. Research Technical Background
This study aims to develop a system that utilizes YOLO for the recognition of 2D engineering drawings and the automatic construction of 3D models. The approach employs the open-source OpenCV (Open Source Computer Vision Library) together with the YOLO object detection framework to train deep neural network models for object detection and image segmentation. The bounding box information generated by the models is then used for feature classification and integration. Finally, Siemens’ CAD secondary development toolkit is incorporated to implement 3D drafting capabilities, resulting in an automated system capable of both recognizing 2D engineering drawings and generating corresponding 3D models.
2.1. Learning Model
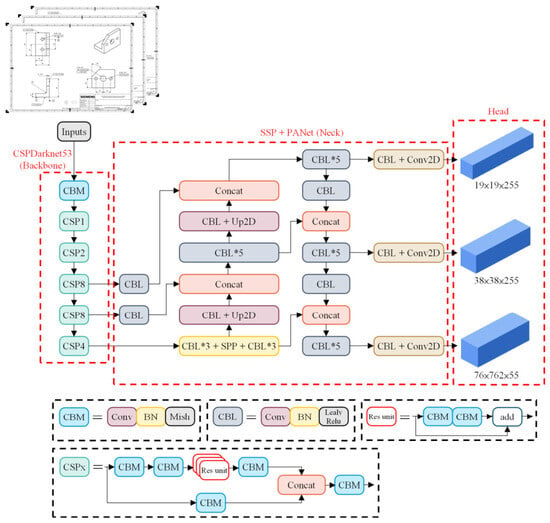
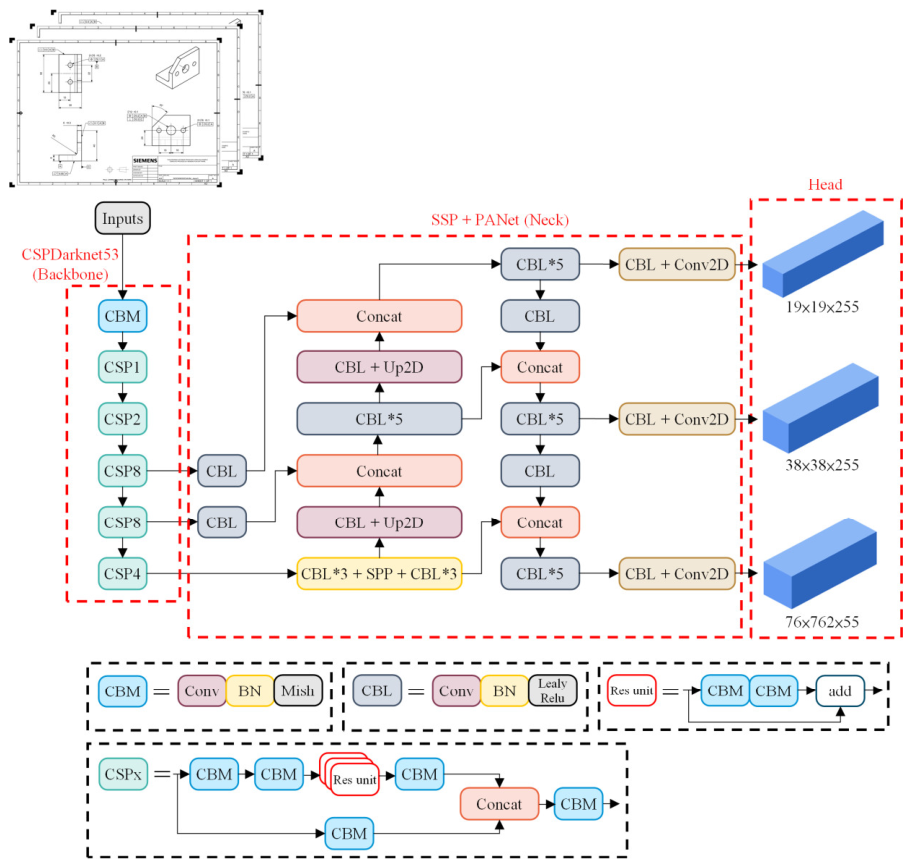
This study adopts the YOLOv4 network architecture to recognize geometric features and dimensions in 2D engineering drawings. YOLOv4 achieves a balance between high speed and accuracy in object detection tasks, making it a significant technique in the field of computer vision. Its overall architecture is divided into four components: Input, Backbone, Neck, and Head, as illustrated in Figure 1.
Figure 1.
YOLOv4 Network Architecture.
In the Input stage, YOLOv4 applies Mosaic Data Augmentation and Self-Adversarial Training (SAT) to enhance the diversity of training data.
In the Backbone, the model employs CSPDarknet53 as the main feature extractor, combined with CSPNet to improve the learning capacity of the convolutional neural network. The final fully connected layer is removed to allow flexibility in input image sizes. Additionally, the Mish activation function and DropBlock regularization are applied to enhance the model’s generalization ability.
In the Neck, Spatial Pyramid Pooling (SPP) is used to perform multi-scale max pooling, enabling multi-scale feature fusion. Subsequently, the Path Aggregation Network (PANet) is employed to enhance bottom-up feature transmission, preserving and integrating both low-level and high-level features.
Finally, in the Head, the network predicts the class, location, and size of objects within each grid cell. The Complete IoU (CIoU) loss function is adopted, which jointly considers the overlap area, center distance, and aspect ratio of bounding boxes to improve detection accuracy.
2.2. NX Secondary Development
This study utilizes Siemens NX (version 1926) as the core platform for system implementation and secondary development. To achieve an automated 2D-to-3D conversion workflow, specific programming tools within the NX Open framework—including NX Open API, MenuScript, and Block UI Styler—were leveraged to seamlessly integrate our proposed algorithms with the CAD environment. Specifically, the NX Open API was employed to programmatically manipulate 3D geometric models, manage internal CAD databases, and execute the automated reconstruction of features derived from image recognition. Additionally, customized user toolbars and interactive dialog windows were developed using MenuScript and Block UI Styler to provide an intuitive interface for engineers. By leveraging these secondary development capabilities, the proposed system effectively automates the creation of 3D solid models from legacy data, bridging the gap between external engineering text/feature recognition results and the internal CAD modeling environment.
3. Engineering Drawing Recognition and 3D Modeling
Deep learning enables neural networks to simulate human perception of images, allowing for the recognition of text and symbols and the accurate localization of features through supervised learning. In part design, engineering drawings must be annotated according to drafting standards to fully convey dimensions and contours. Such annotations explicitly represent lengths, diameters, radii, and the relationships among part features, ensuring that 2D drawings can accurately communicate design intent. However, while this high degree of annotation facilitates manual interpretation, it also increases the complexity of automated recognition, posing greater challenges in feature analysis and data processing. Moreover, 3D parts generated automatically through the NX secondary development interface may deviate from the original design models. To address this issue, this study identifies features in complex 2D engineering drawings based on the parameter requirements of the automated modeling system, followed by classification and integration of the extracted drawing information. This approach not only shortens the time required for 3D modeling but also reduces the risk of errors caused by manual interpretation, thereby improving the accuracy and efficiency of automated drafting.
3.1. System Architecture
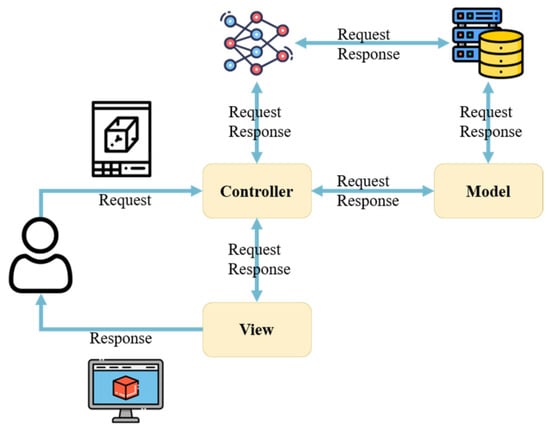
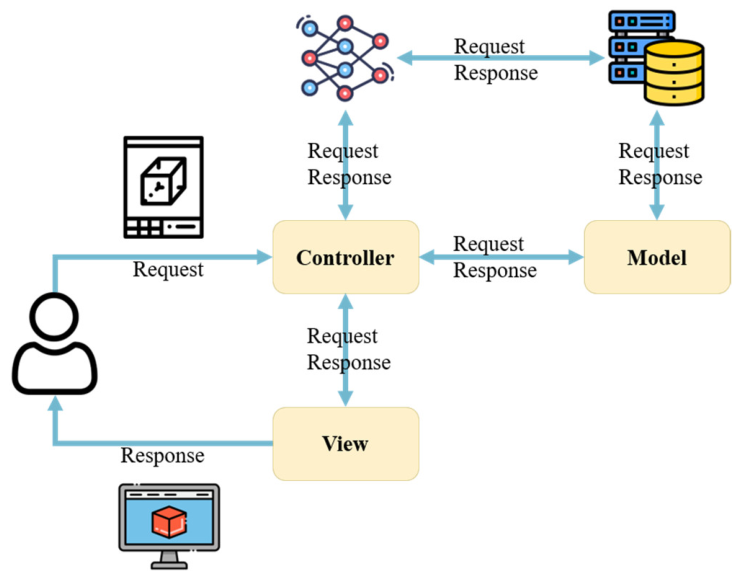
The proposed system is implemented through a Python Flask API platform in conjunction with an ASP.NET MVC (Model-View-Controller) web application framework. Within the Python Flask module, OpenCV is utilized to load the YOLOv4 model for feature recognition from 2D engineering drawings. Data storage and management are supported by a Microsoft® SQL Server relational database. Based on the recognition results, the system integrates contour and dimensional features to construct a dimension-matching list, which is subsequently retrieved and parsed by the .NET web application. Finally, by means of an embedded browser within the CAD environment, secondary development functions are executed in Siemens NX to automatically generate 3D solid models, as depicted in Figure 2.
Figure 2.
System Architecture.
3.2. Annotation Constraints in 2D Engineering Drawings
Since annotation methods vary across different types of parts in 2D engineering drawings, this study adopts 2D drawings compliant with the ASME Y14.5 [19] standard as training and validation data for the neural network model, thereby ensuring both applicability and learning efficiency. During the data preparation process, the following constraints were applied to the annotation methods:
- All dimensional annotations are standardized using the Arial font.
- The spacing between views must be appropriately adjusted, with the vertical or horizontal distance between views being no less than one-sixth of the drawing sheet width.
- Dimension extension lines should be arranged to minimize overlap.
- Dimension lines must be annotated in such a way that they do not overlap with the graphical features.
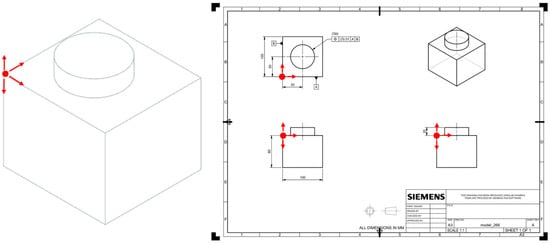
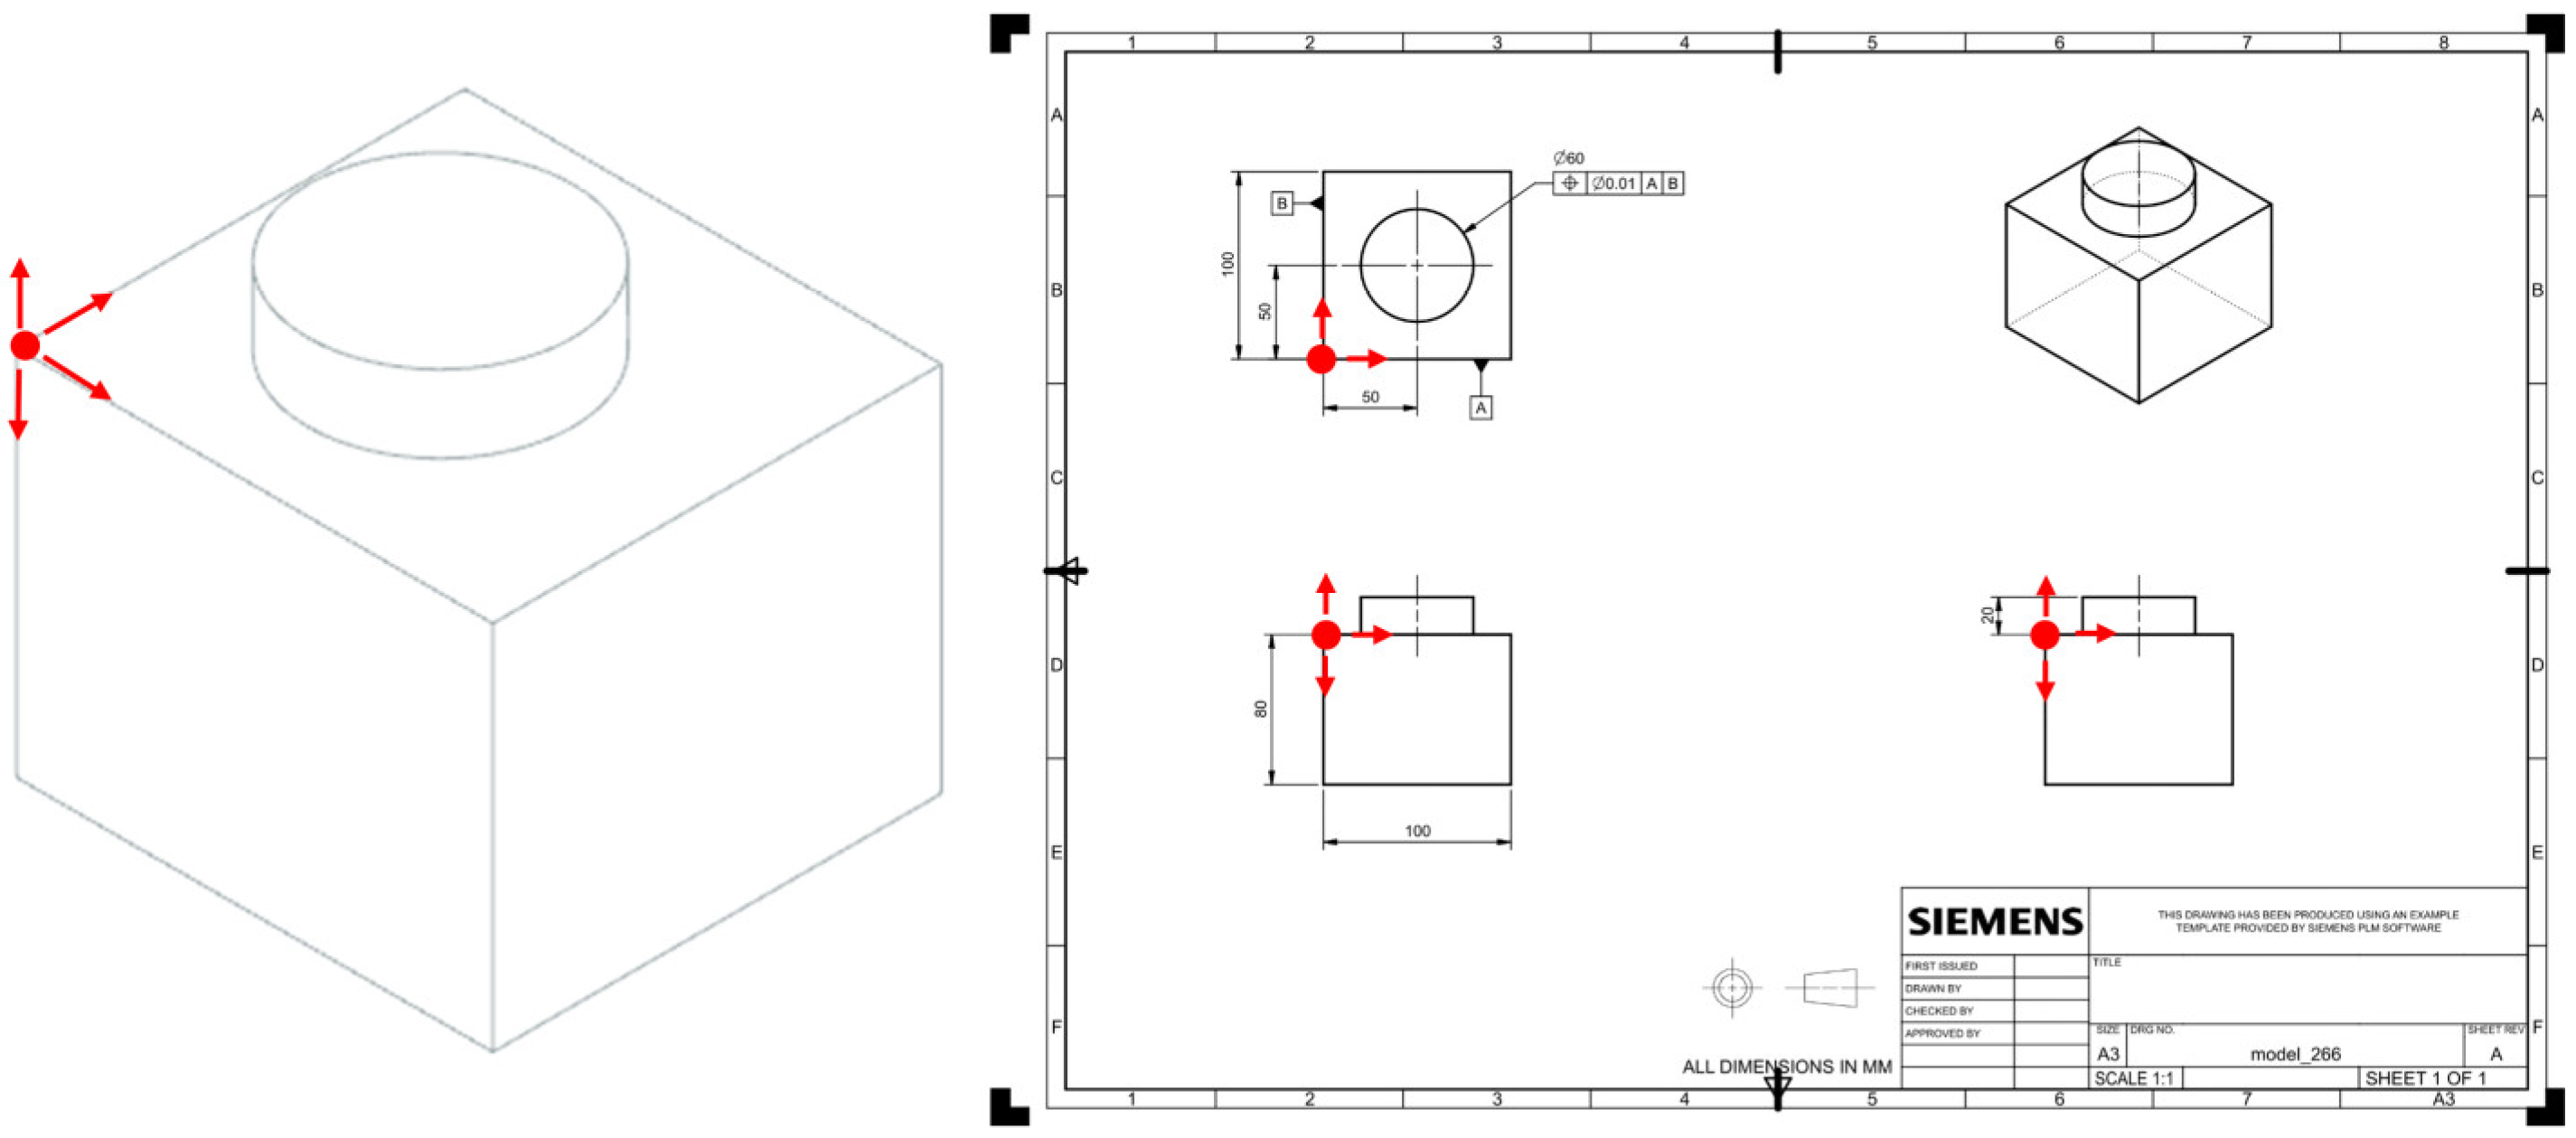
- Dimensional annotations must be referenced from specific datum points, as indicated by the red dots and arrows in Figure 3.Figure 3. Reference Points for Dimensional Annotations.
- When annotating circular dimensions, positional tolerances must also be specified.
3.3. Constraints on 3D Solid Model Features
This study aims to automatically generate corresponding 3D solid models by recognizing 2D engineering drawings and constructing a square model with extruded geometric features. To ensure consistency and feasibility in the modeling process, the following constraints are imposed on 3D solid model features:
- Extruded profiles are limited to rectangles or circles.
- Each model can contain a maximum of two features.
- Under condition 1, through-slots and step features are not supported.
- Under condition 2, overlapping features are not supported.
3.4. Recognition of 2D Engineering Drawings
Dimensional annotations and projection views in 2D engineering drawings provide information about part dimensions and feature positions. However, directly processing a complete drawing often results in misclassification of features due to interference from non-geometric information such as titles and dates. To address this issue, the recognition pipeline in this study is designed with sequential steps of detection, classification, cropping, and ordering to ensure both accuracy and consistency of feature categories and their sequence.
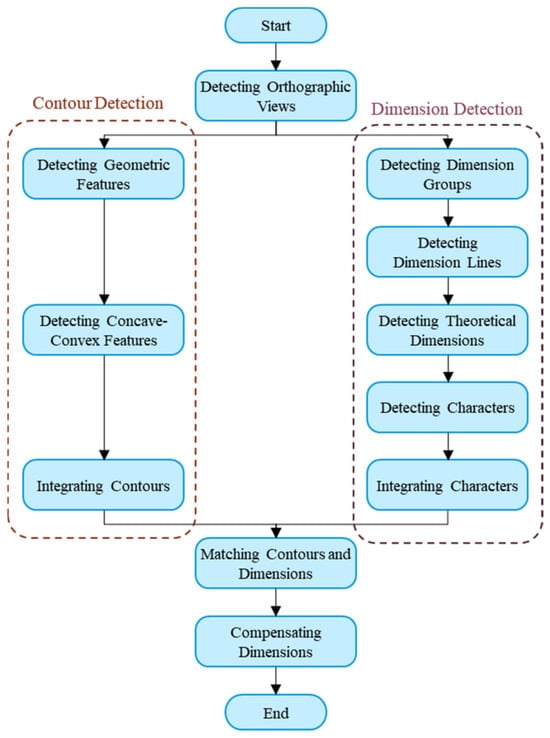
To integrate 2D engineering drawings with deep learning for automated 3D model generation, the YOLOv4 model is employed. The bounding box coordinates and dimensions are used to recognize geometric contours and dimensional features, which are further associated by adopting the method proposed by Lin et al. [20] for multi-view and character detection. The complete recognition pipeline for extracting features from 2D engineering drawings is illustrated in Figure 4, consisting of: multi-view detection; contour detection (geometric feature detection, concave–convex feature detection, and contour integration); dimension detection (dimension group detection, annotation line detection, theoretical dimension detection, character detection, and character integration); and contour-dimension matching. The training data, validation data, and number of training iterations for each stage of the detection model are shown in Table 1.
Figure 4.
Workflow of 2D Engineering Drawing Recognition.
Table 1.
Training configurations and dataset sizes for the proposed detection models.
3.4.1. Contour Feature Detection
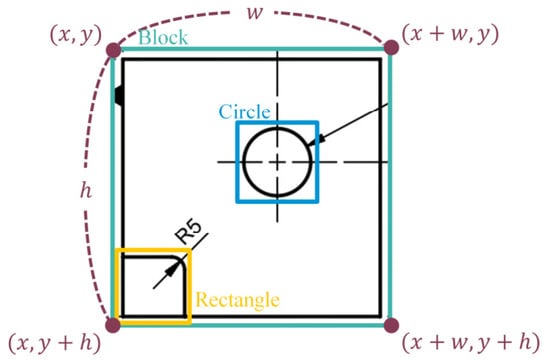
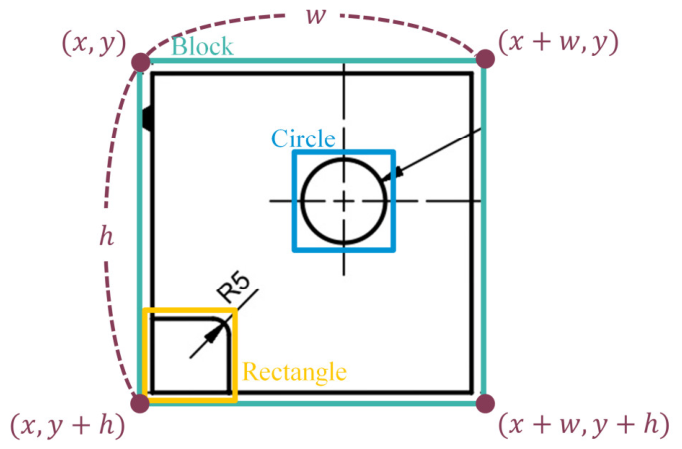
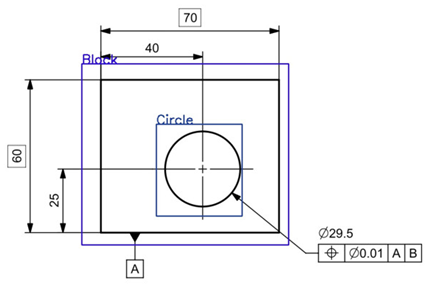
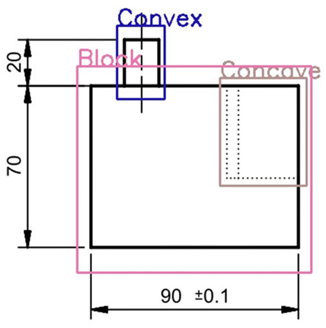
In this study, the contour detection models are divided into two categories: a pre-trained model for geometric features in the top-view, and a pre-trained model for concave and convex features in the front and right views. The training data format for YOLOv4 consists of a label index, normalized coordinates (x, y), and normalized width and height (w, h). Using an image annotation tool, target features were manually enclosed, and annotation files in plain-text format consistent with the YOLOv4 training format were automatically generated.
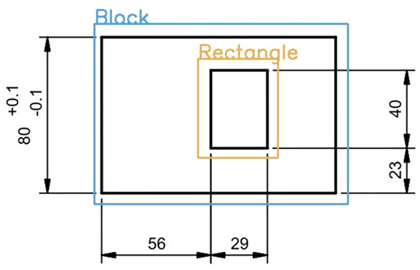
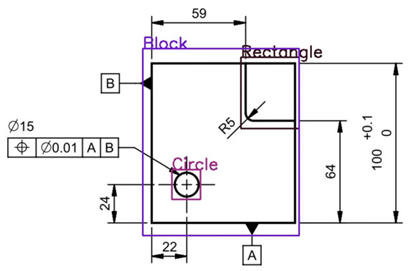
The training labels for the geometric feature detection model include block contours (Block), rectangular contours (Rectangle), and circular contours (Circle). An example of geometric feature annotation for the top-view is presented in Figure 5. Since this study focuses solely on identifying models and their associated features, the outermost contour of a shape is annotated as a block feature, while the inner rectangular and circular contours are annotated using the minimum-area bounding boxes, ensuring that the detection boxes more accurately reflect the aspect ratio of the actual contours.
Figure 5.
Top-View Geometric Feature Annotation.
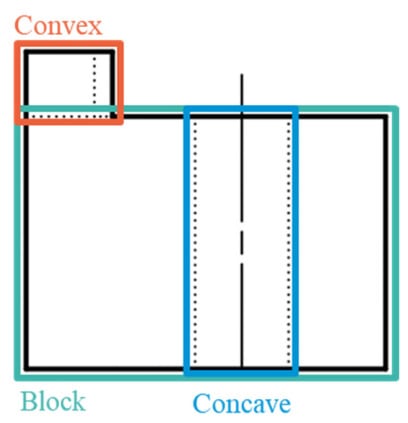
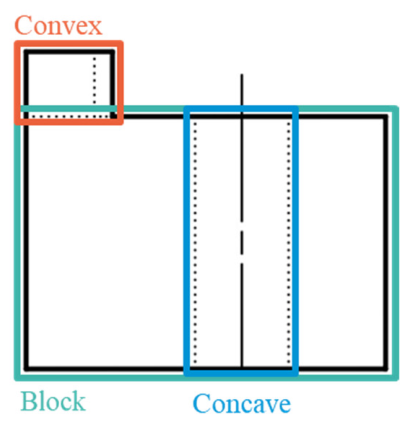
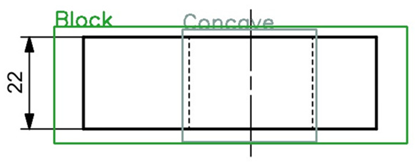
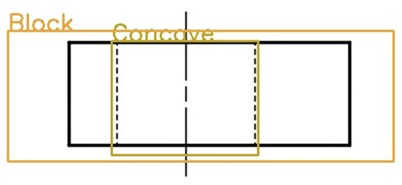
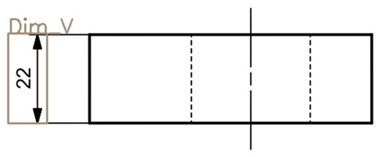
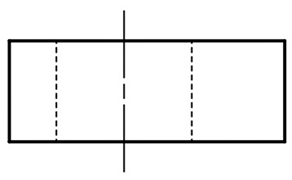
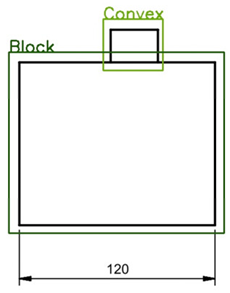
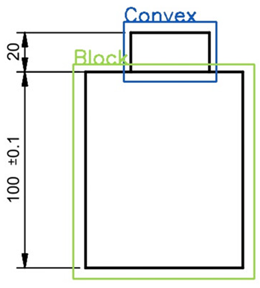
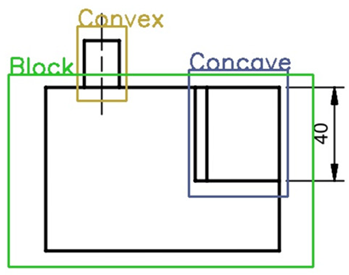
The concave-convex feature detection model is applied to annotate block (Block), concave (Concave), and convex (Convex) contours in the front and right views. An example of concave-convex contour annotation is shown in Figure 6.
Figure 6.
Front-View Concave–Convex Feature Annotation.
The front and right views provide critical information describing the extrusion direction of features. Since only features located within or above the model are considered in this study, the annotation strategy was as follows:
- Block feature: The largest contour in terms of width and area is annotated as the block.
- Concave feature: Indented contours located within the model are annotated as concave features.
- Convex feature: Extruded contours located above the model are annotated as convex features.
The detection results of geometric and concave–convex features (including view orientation, feature type, detection box coordinates, and dimensions) were uniformly stored in a contour database, which serves as the fundamental input for subsequent pairing and 3D modeling.
3.4.2. Dimension Feature Recognition
In 2D engineering drawings, dimensions and tolerances are commonly used to describe the size and geometric relationships of a part. Typical dimension types include linear, angular, radial, and diameter dimensions, while tolerances encompass dimensional tolerances, geometric tolerances, and surface roughness. However, for generating 3D models in NX, only dimensional information is required to complete the modeling process. Based on this, the present study focuses on the preprocessing and recognition of dimensional features by converting the dimensions in 2D engineering drawings into numerical data and pairing them with corresponding contour information, thereby serving as the foundation for subsequent automatic modeling.
Dimension Group Detection
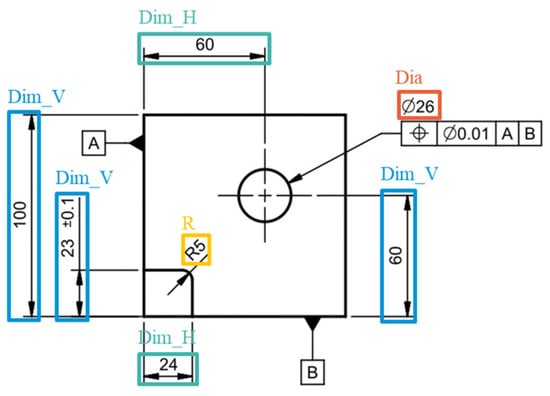
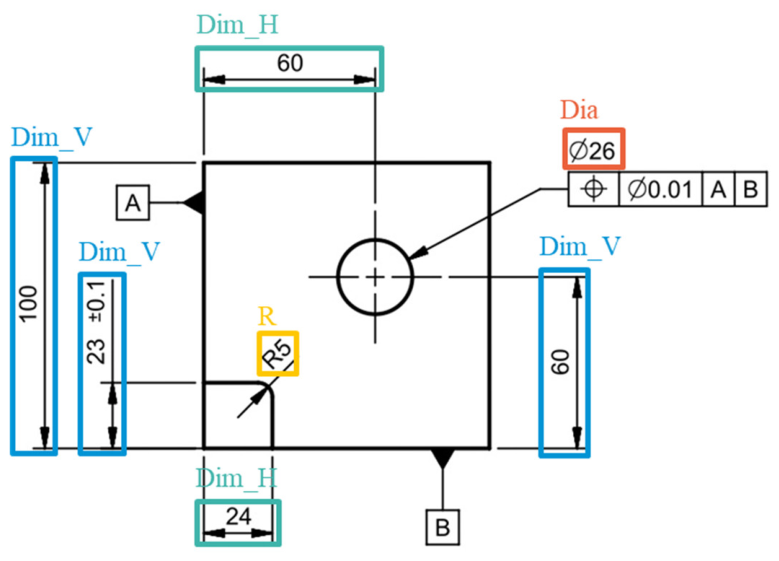
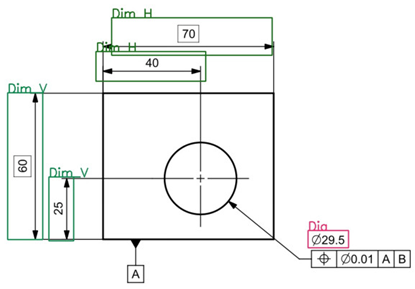
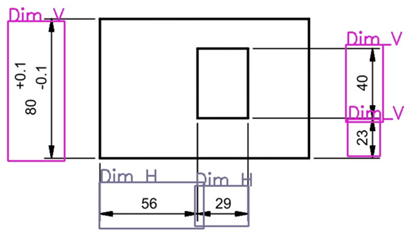
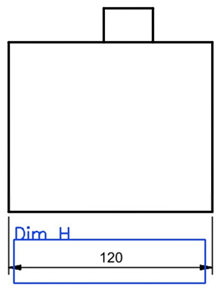
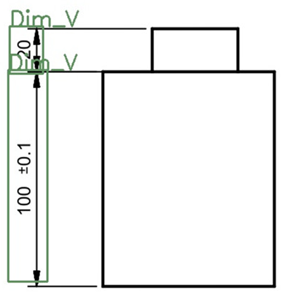
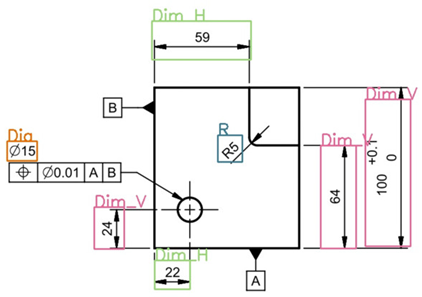
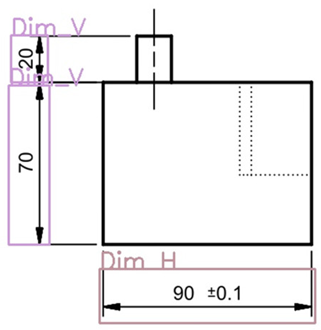
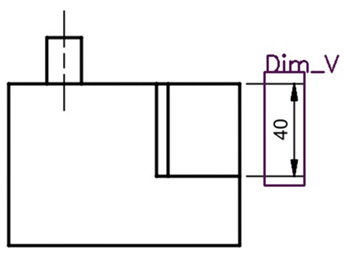
A linear dimension group consists of a dimension and its dimension line. According to the annotation type, the dimension group detection model includes the following label categories: horizontal dimension (Dim_H), vertical dimension (Dim_V), circular diameter (Dia), and fillet radius (R). An example of top-view dimension group annotation is shown in Figure 7. Horizontal distances or transverse edges between shapes were annotated as horizontal dimensions, vertical distances or longitudinal edges as vertical dimensions, dimensions containing the “Ø” symbol as diameters, and those with the character “R” as radii.
Figure 7.
Top-View Dimension Group Annotation.
Dimension Line Detection
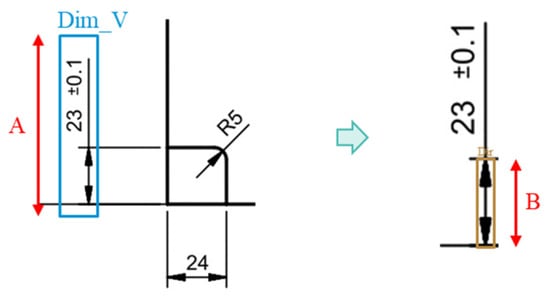
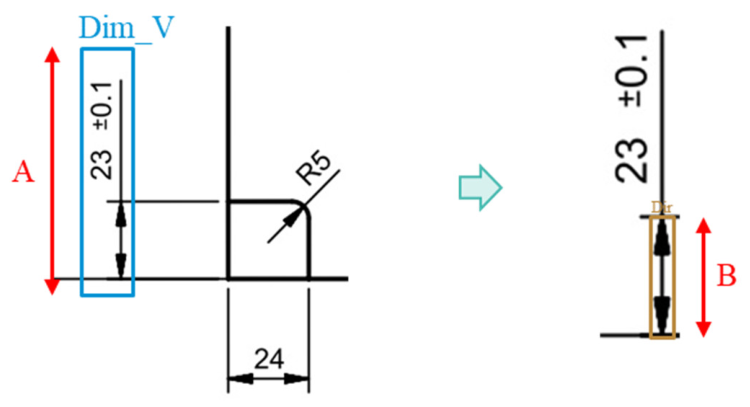
In linear dimension annotations, extension lines indicate the positions of contour boundaries, and dimension lines typically include arrowheads at both ends to specify direction and range. Since part annotations in engineering drawings often contain both dimensions and tolerances, to ensure clarity, oversized annotations are usually placed outside the dimension lines to reduce visual congestion and ambiguity in interpretation. However, in the dimension-pairing process of this study, the actual length of the dimension line was required as a reference. Thus, the detection model targeted horizontal and vertical dimension lines within the arrowheads. The model was employed to detect dimension lines in horizontal and vertical dimensions, and the detection results were refined accordingly. As shown in Figure 8, the initial bounding box height of a vertical dimension (A) was corrected to (B) by the dimension line model, providing a result closer to the actual edge length.
Figure 8.
Dimension Line Detection.
Theoretical Dimension Detection
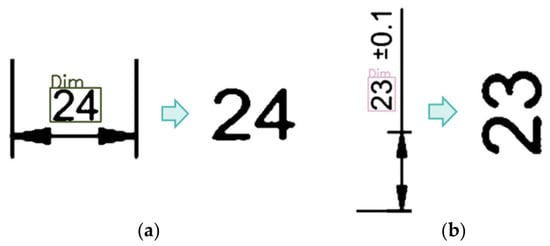
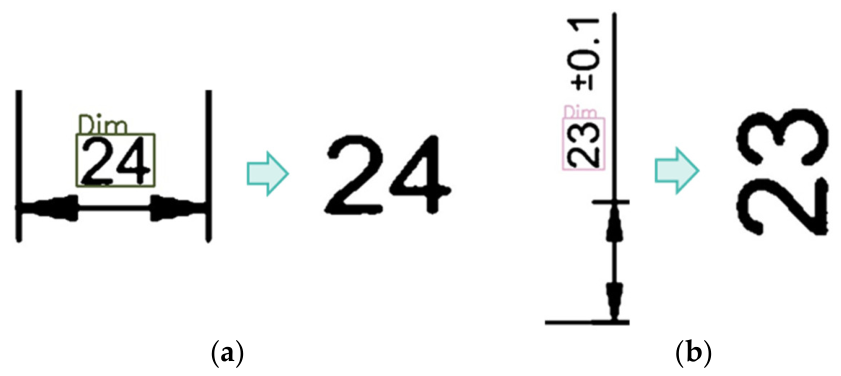
Since NX secondary development function parameters only support integer and floating-point values, a theoretical dimension detection model was developed in this study. Its purpose was to distinguish horizontal and vertical dimensions from dimension lines, and to constrain character recognition within the theoretical dimension region before tolerance symbols. This design prevents the character recognition model from misidentifying non-dimensional features. The detection results are illustrated in Figure 9a,b.
Figure 9.
Theoretical Dimension Detection.
Character Detection and Integration
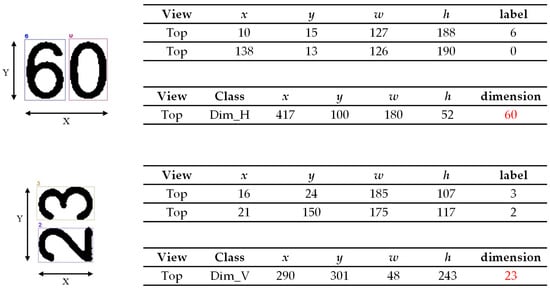
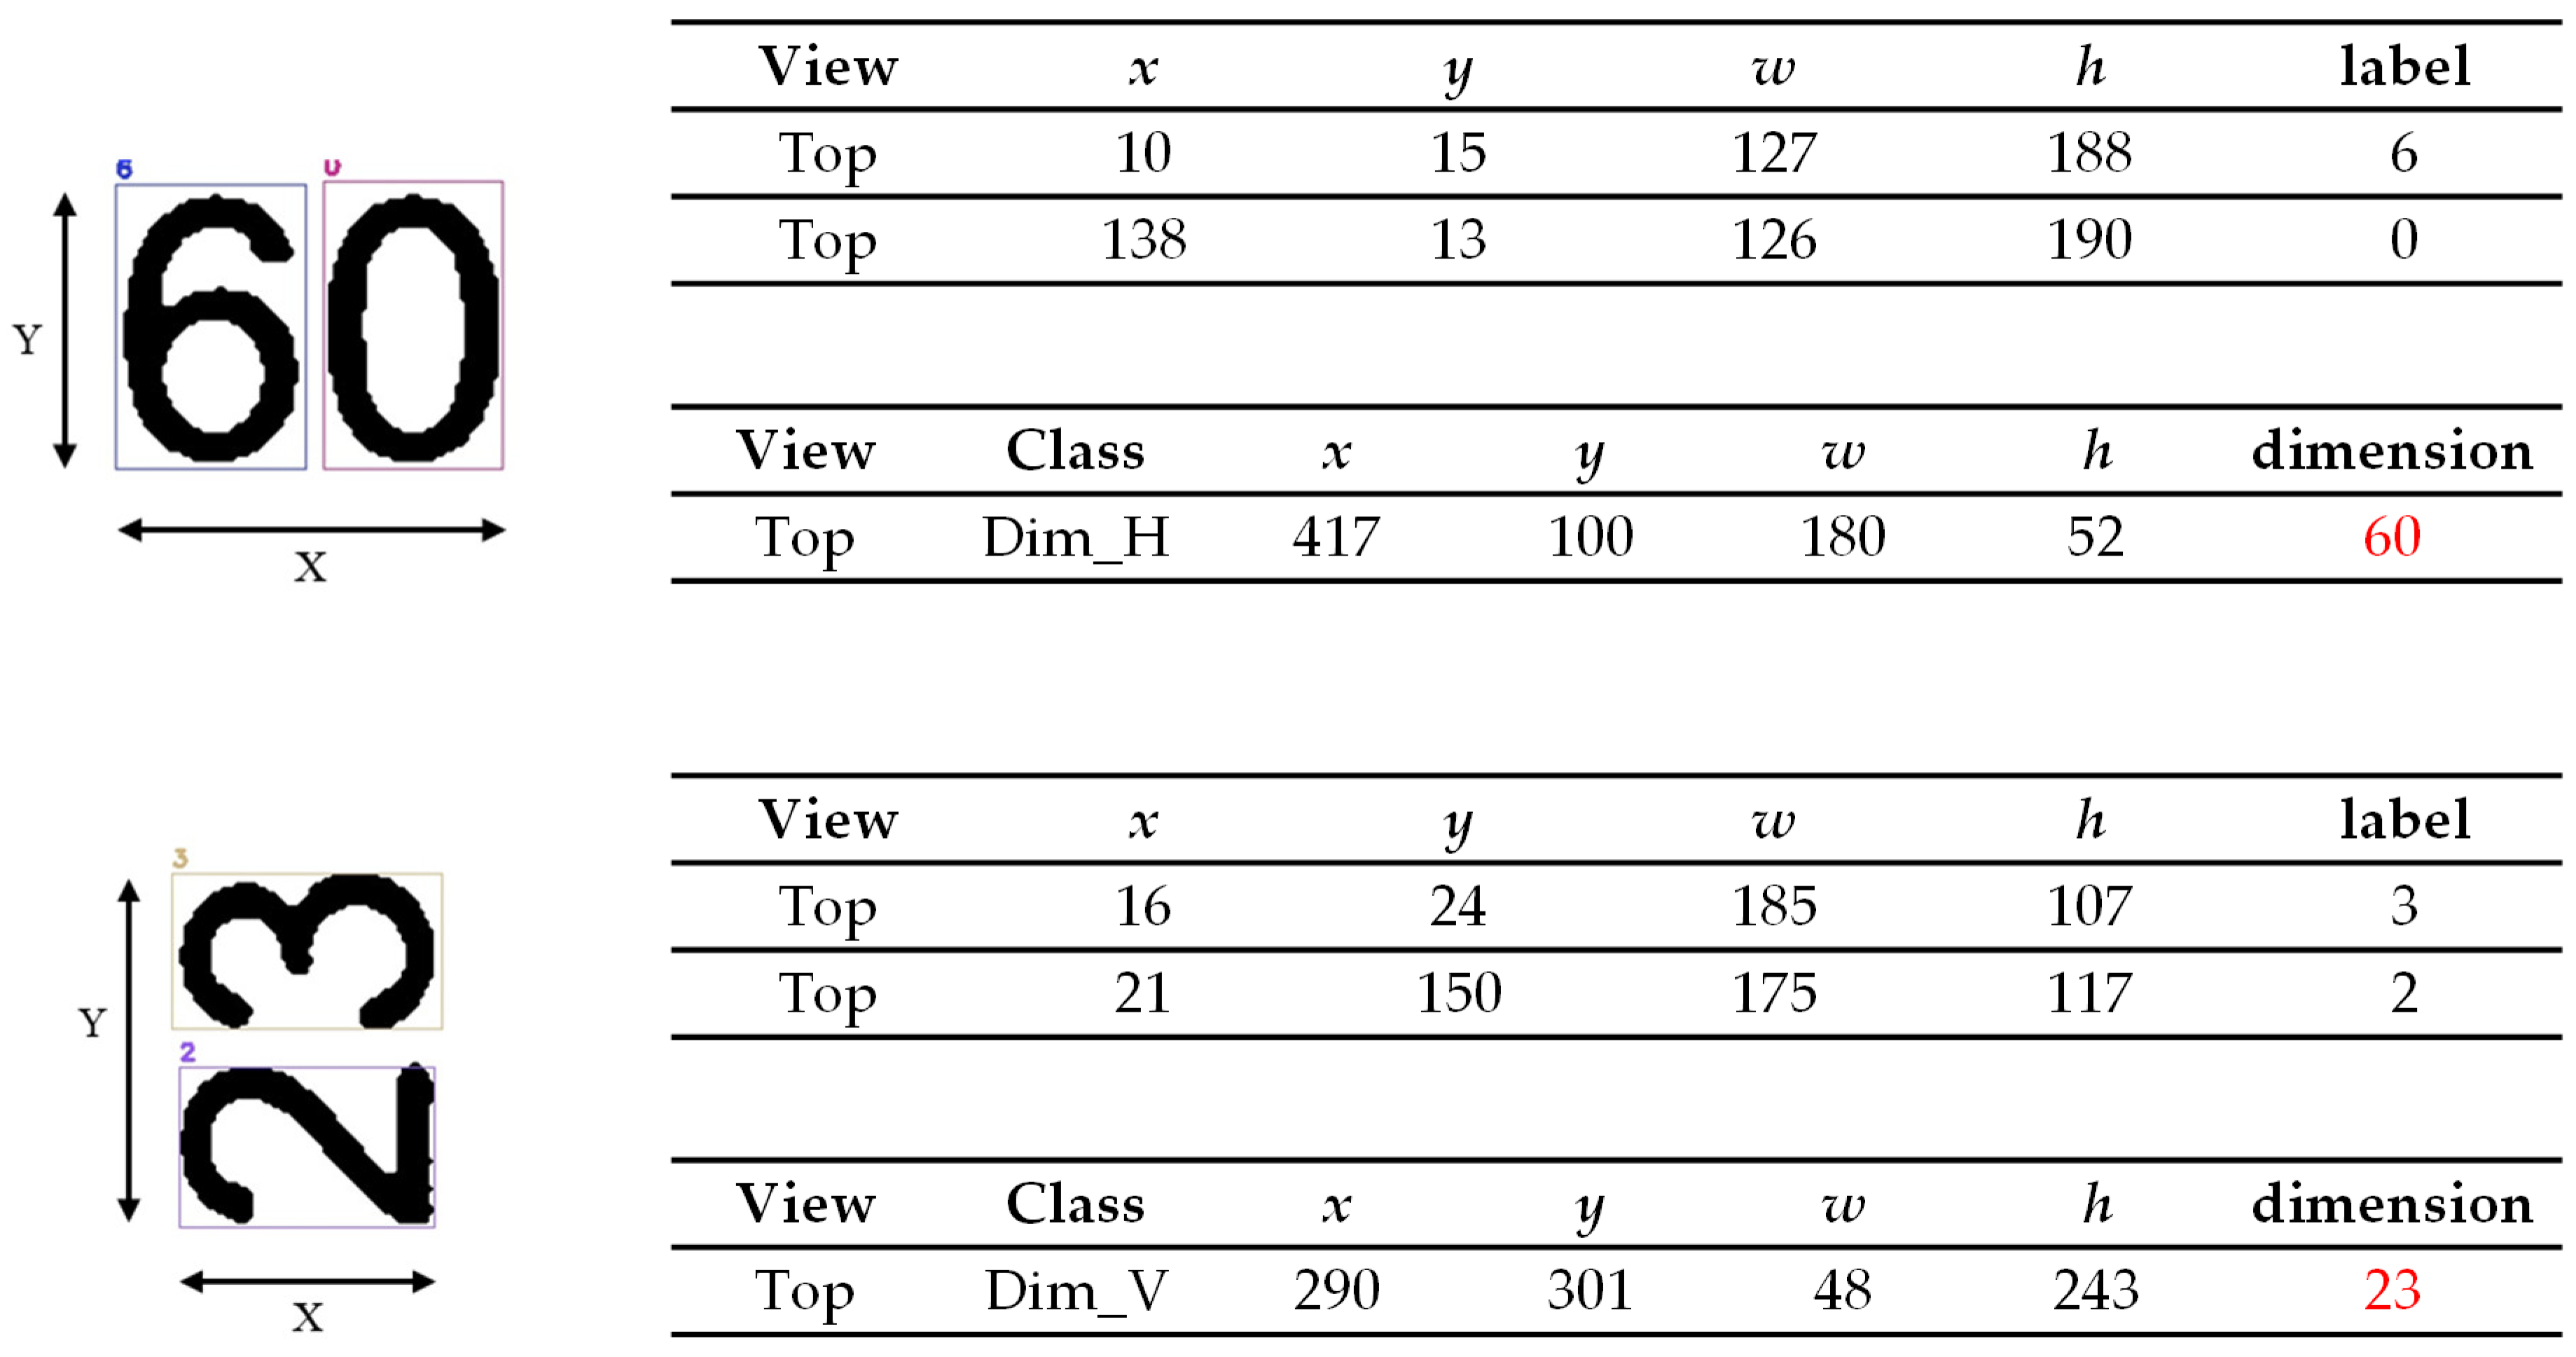
Lin et al. [15] demonstrated that variations in font style can significantly affect recognition performance in neural networks. Accordingly, this study employed the pre-trained character detection model developed by Lin et al. [15] to identify all characters in theoretical dimensions. In engineering drawing annotations, dimensional characters are typically arranged either horizontally or vertically to convey design information clearly. Based on the bounding box coordinates output by the character detection model, the sequence of characters was determined as follows: the range of x-coordinates and y-coordinates (maximum minus minimum) was calculated for each character group. If the x-range exceeded the y-range, characters were ordered from left to right according to the x-coordinate; conversely, if the y-range exceeded the x-range, they were ordered from top to bottom according to the y-coordinate. Finally, the detected characters were concatenated sequentially through an iterative process, forming dimension values with actual engineering significance, as illustrated in Figure 10.
Figure 10.
Character Integration.
3.4.3. Dimension Matching
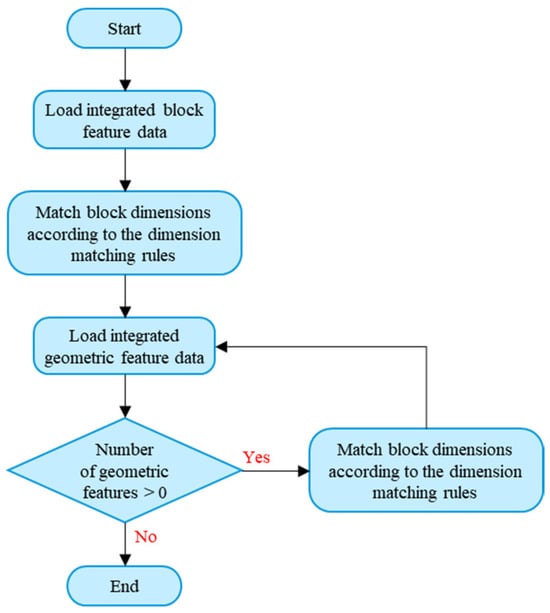
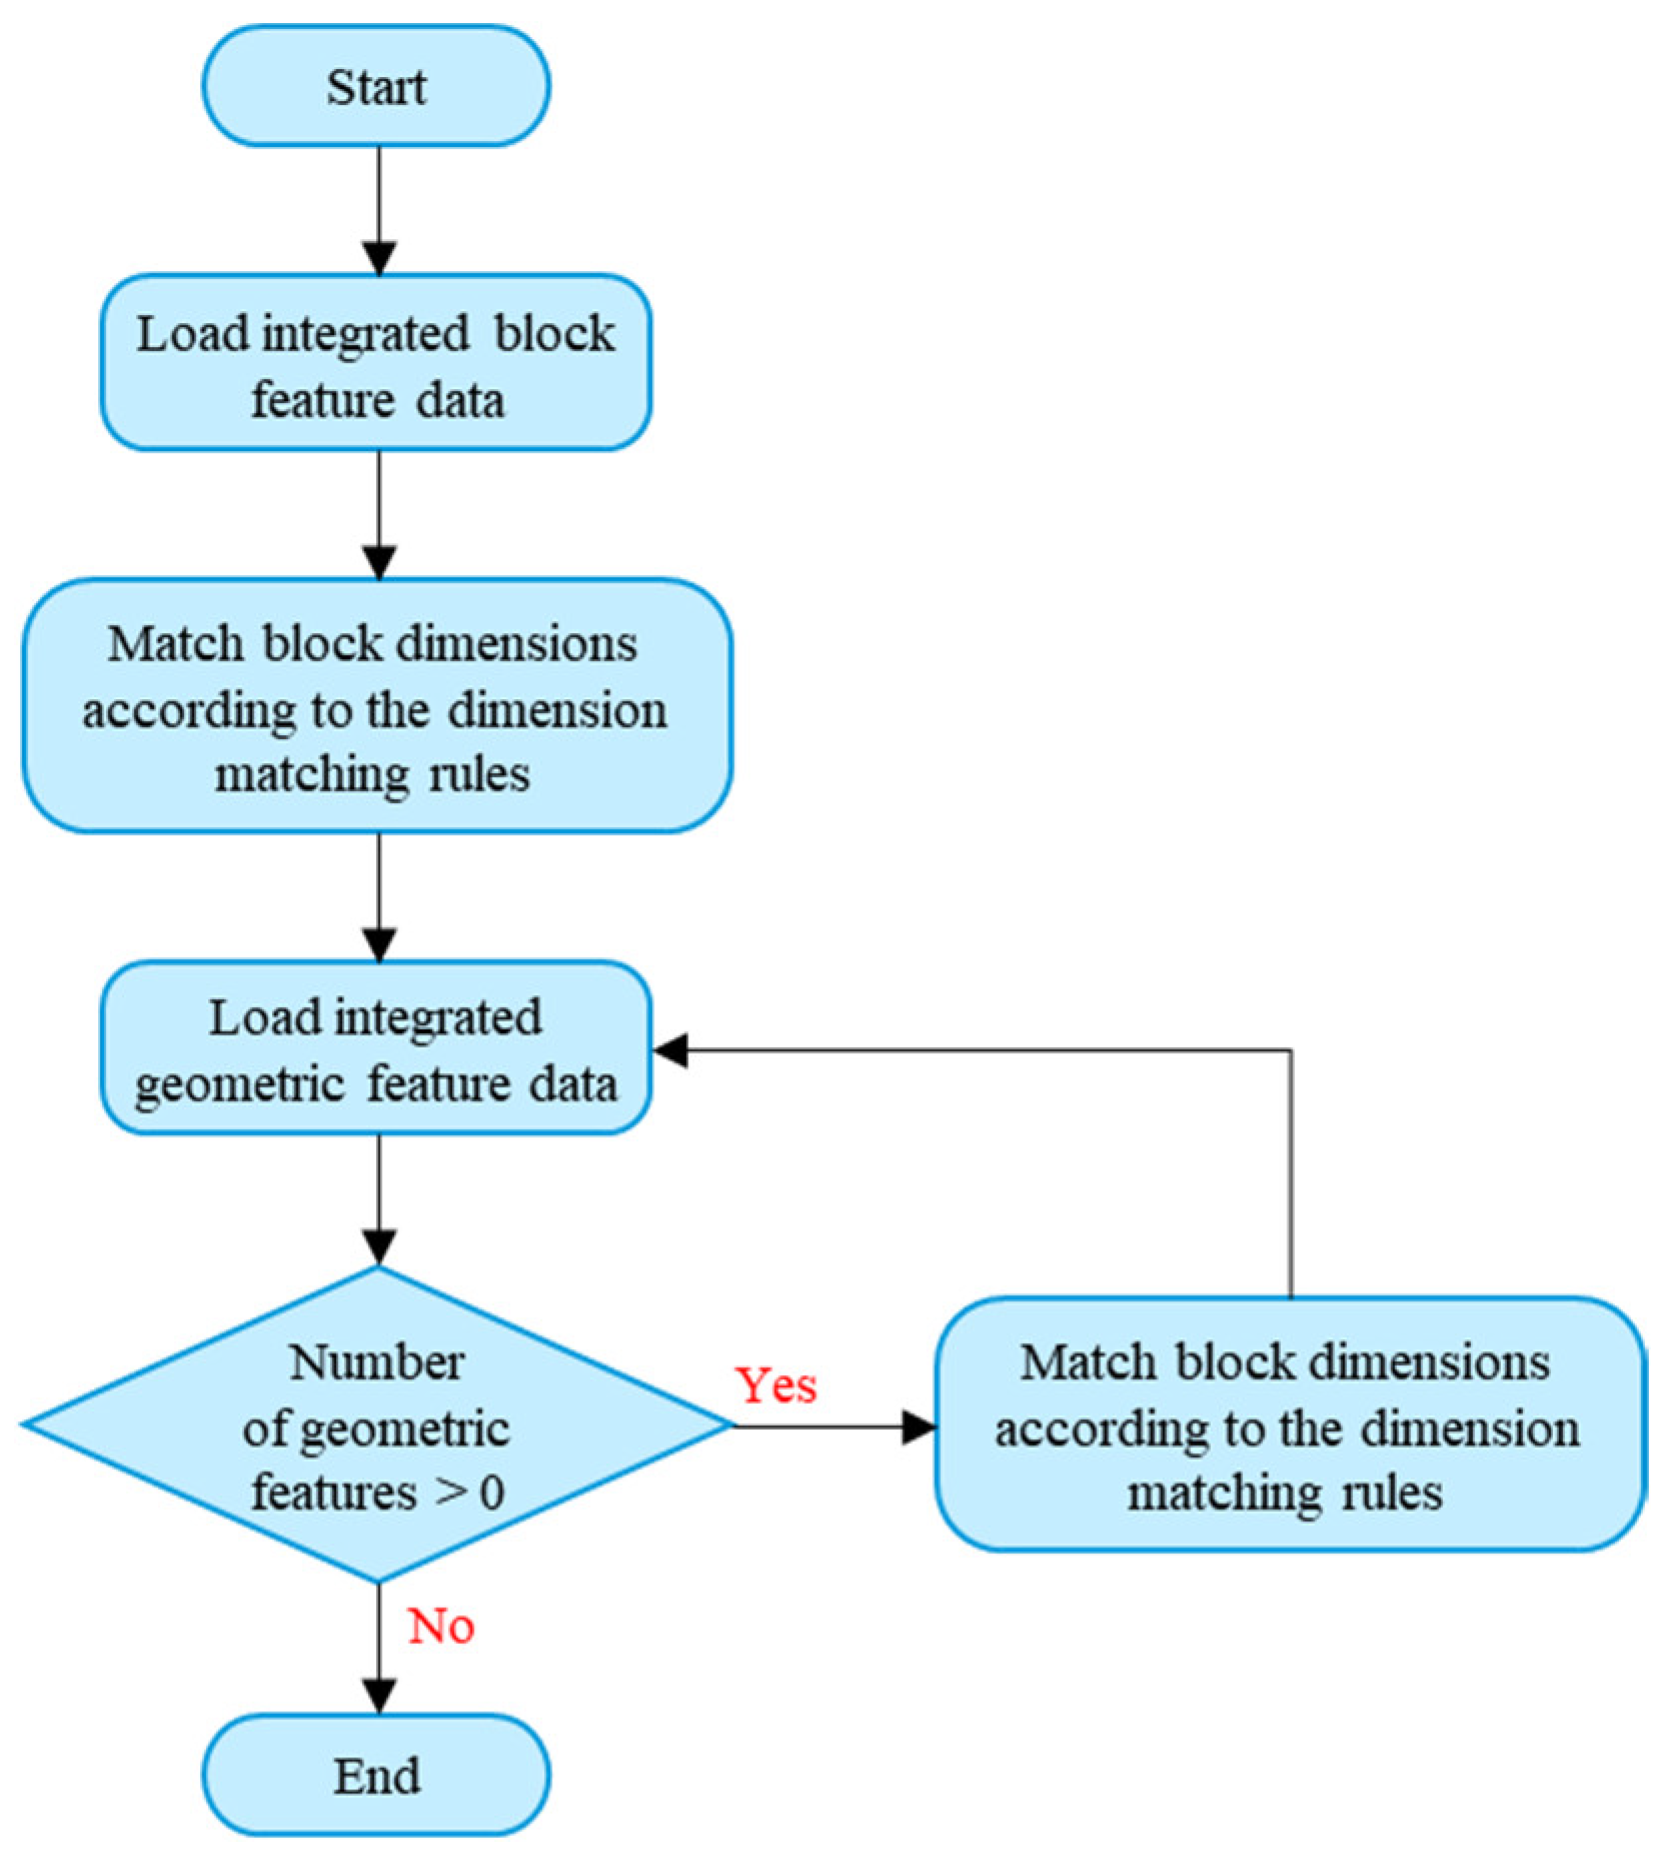
The process of dimension matching in this study is illustrated in Figure 11. The system first integrates contour data from the three-view drawings and establishes the construction sequence of features. Subsequently, the system iteratively imports contour categories and detection-box data into MSSQL. Through column-based search and conditional rules, the allowable range for dimension matching is determined. Once a successful match is identified, the system assigns the corresponding dimension parameter name, feature group, and dimension value.
Figure 11.
Workflow of Dimension Matching.
Contour Feature Matching
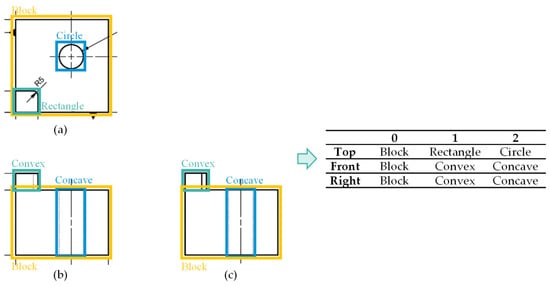
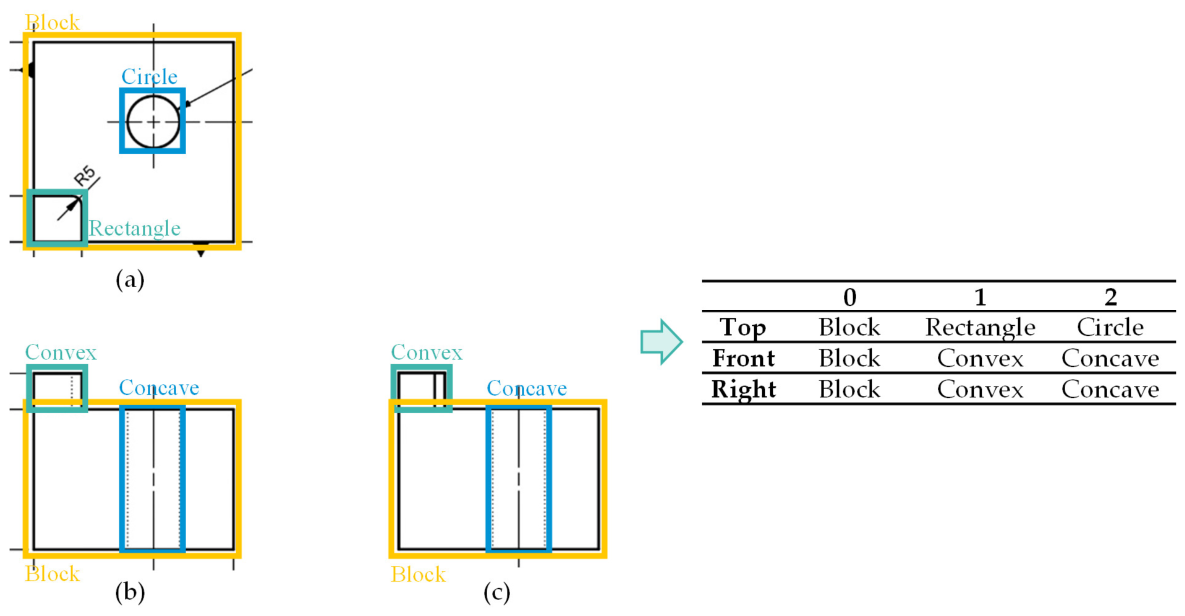
The system adopts the contour features from the top-view as the baseline to integrate the construction sequence of the 3D solid model. The block feature is regarded as the initial base, followed by the arrangement of rectangular and circular contours in the top-view. As shown in Figure 12, the block feature belongs to Group 0, the rectangular feature to Group 1, and the circular feature to Group 2. In the top-view (Figure 12a), the rectangular and circular features are ordered based on the increasing x-coordinates of their detection boxes. In the front-view (Figure 12b), concave and convex features are also ordered by increasing x-coordinate. Since the coordinate origin of image detection is located at the top-left corner, when the y-coordinate of the rectangular feature (Group 1) is greater than that of the circular feature (Group 2) in top-view, the corresponding concave and convex features in Figure 12c are ordered by their x-coordinates to establish the group relationship. In summary, the construction sequence is: first generate the block, then add the rectangular protrusion, and finally create the circular recess.
Figure 12.
Contour Integration. (a) Top view; (b) Front view; (c) Right view.
Contour and Dimension Matching
This study constructs 3D models through secondary development functions, using parameters as the basis for dimension matching. The construction parameters for each feature are as follows: the block feature includes length, width, and height; the rectangular feature includes length, width, sketch starting coordinates, and extrusion distance for protrusions and recesses; the circular feature includes diameter, sketch starting coordinates, and extrusion distance; and the fillet feature is defined by the coordinates of two endpoints and the fillet radius.
- Linear Dimensions
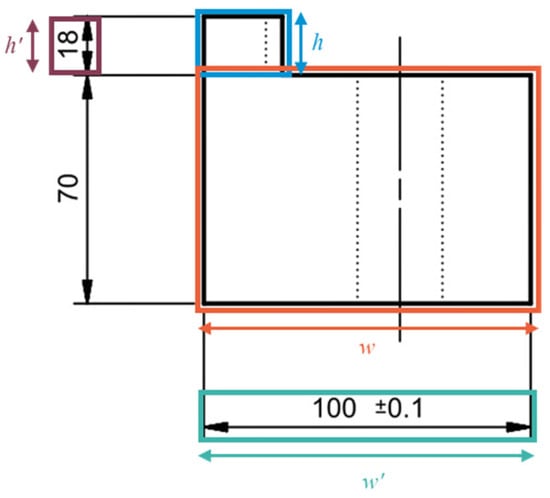
Length, width, height, and extrusion distance are categorized as linear dimensions. Since linear dimensions are typically annotated outside the dimension boundary lines, the detected bounding boxes of dimension groups cannot be directly aligned with contour features. Therefore, this study adopts the contour detection boxes as references and considers only the box size after weight adjustment for matching length, width, height, and extrusion distance. Experimental results indicate that the differences between the bounding boxes of horizontal or vertical dimensions and the contour detection boxes fall within a range of 0.7 to 1.2 times. For example, in Figure 13, if the width of the block’s contour detection box in the front view is w, and the detected bounding box width of the horizontal dimension w’ lies between 0.7 w and 1.2 w, then the horizontal dimension 100 can be matched to the block’s length. Similarly, if the contour detection box height of the rectangular protrusion is h, and the detected bounding box height of the vertical dimension h’ falls within 0.7 h to 1.2 h, the vertical dimension 18 can be matched to its extrusion distance.
Figure 13.
Linear Dimension Matching.
- 2.
- Sketch Starting Coordinates
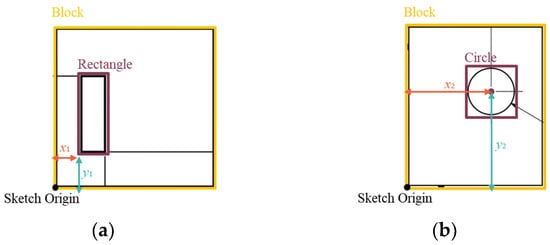
In this study, the lower-left corner of the model contour detection box in the top view is fixed as the sketch plane origin. The distance from this origin to the feature contour detection box is used as the basis for matching sketch starting coordinates, adopting the same tolerance as in linear dimensions. For rectangular features, the lower-left corner of the detection box (x1, y1) serves as the reference coordinate, as shown in Figure 14a. For circular features, the center of the detection box (x2, y2) is used as the reference coordinate, as illustrated in Figure 14b.
Figure 14.
Matching of Sketch Starting Coordinates, (a) Rectangle Sketch; (b) Circle Sketch.
- 3.
- Diameter Dimensions
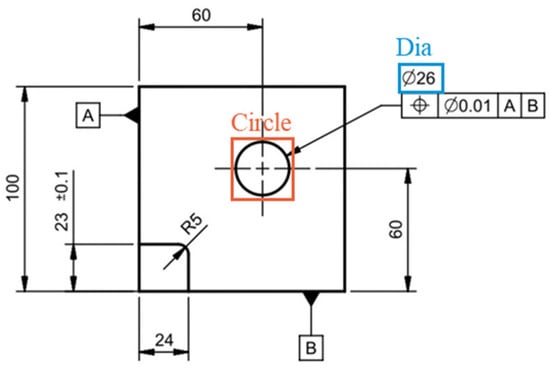
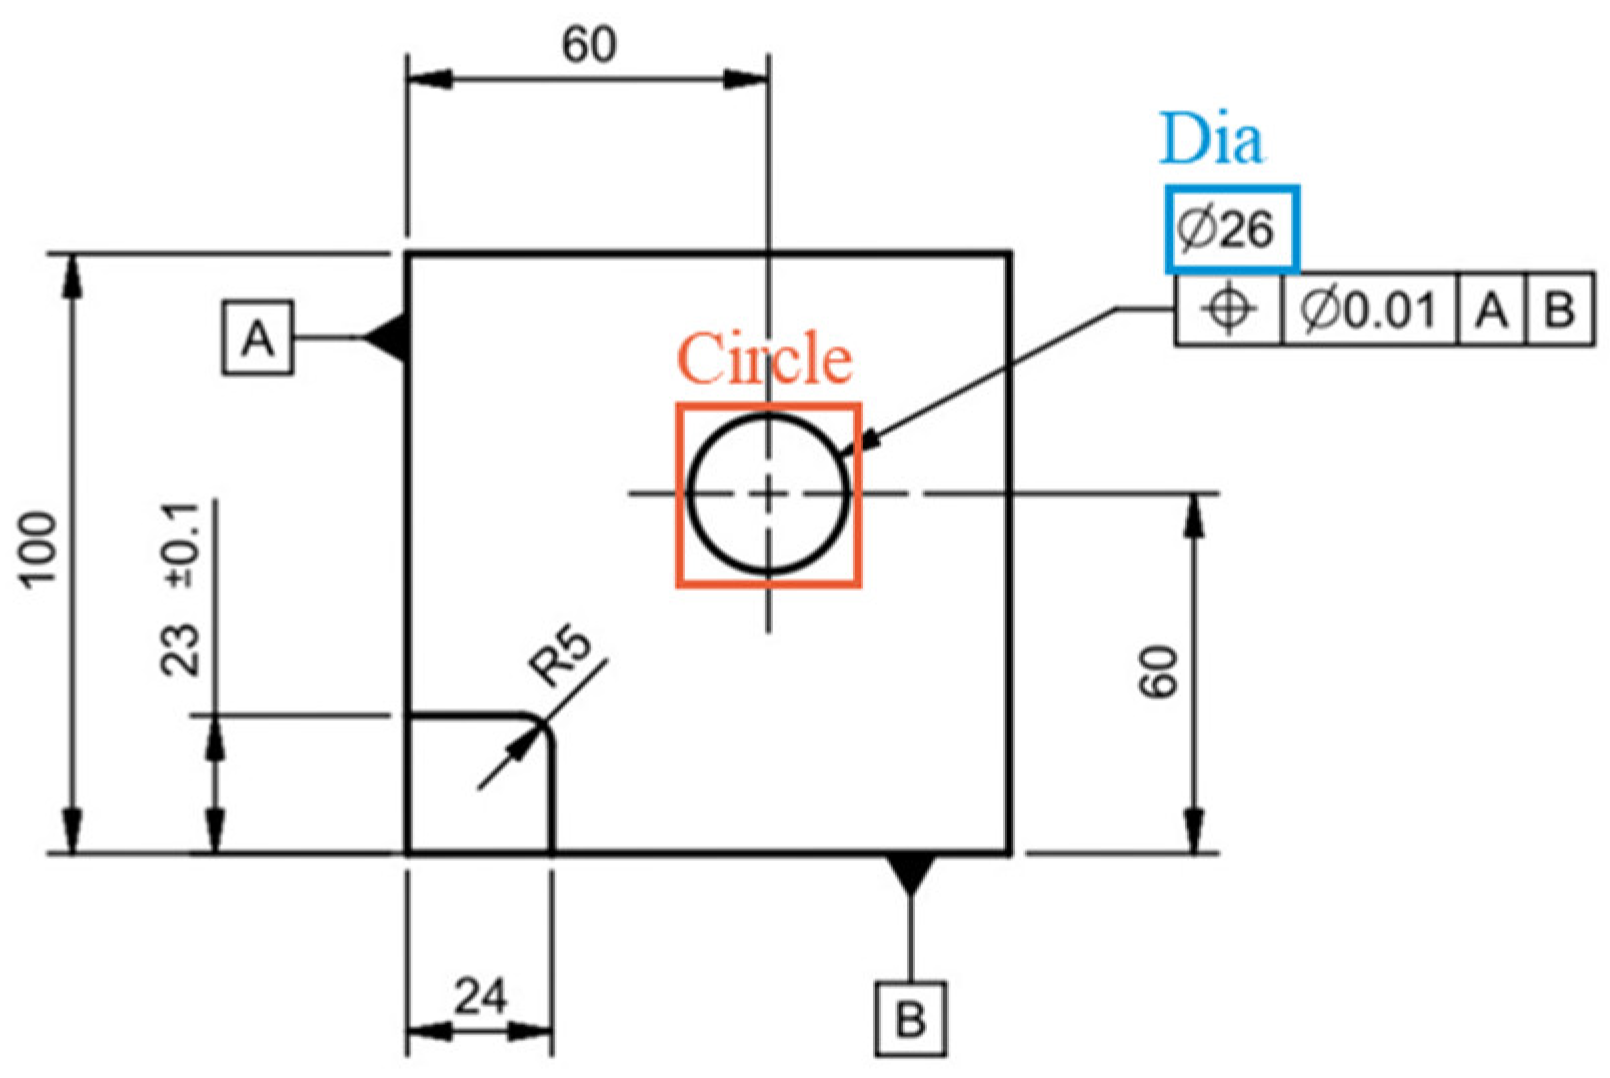
For circular features, the diameter is determined by matching the contour detection box size with the recognized diameter value obtained from character recognition. For instance, as shown in Figure 15, when the top-view contains only one circular feature and one diameter annotation, the 3D construction parameter for the diameter is assigned as 26.
Figure 15.
Diameter Dimension Matching.
- 4.
- Fillet Radius
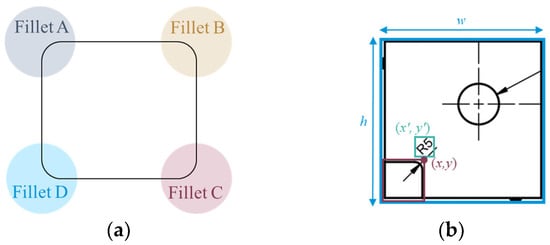
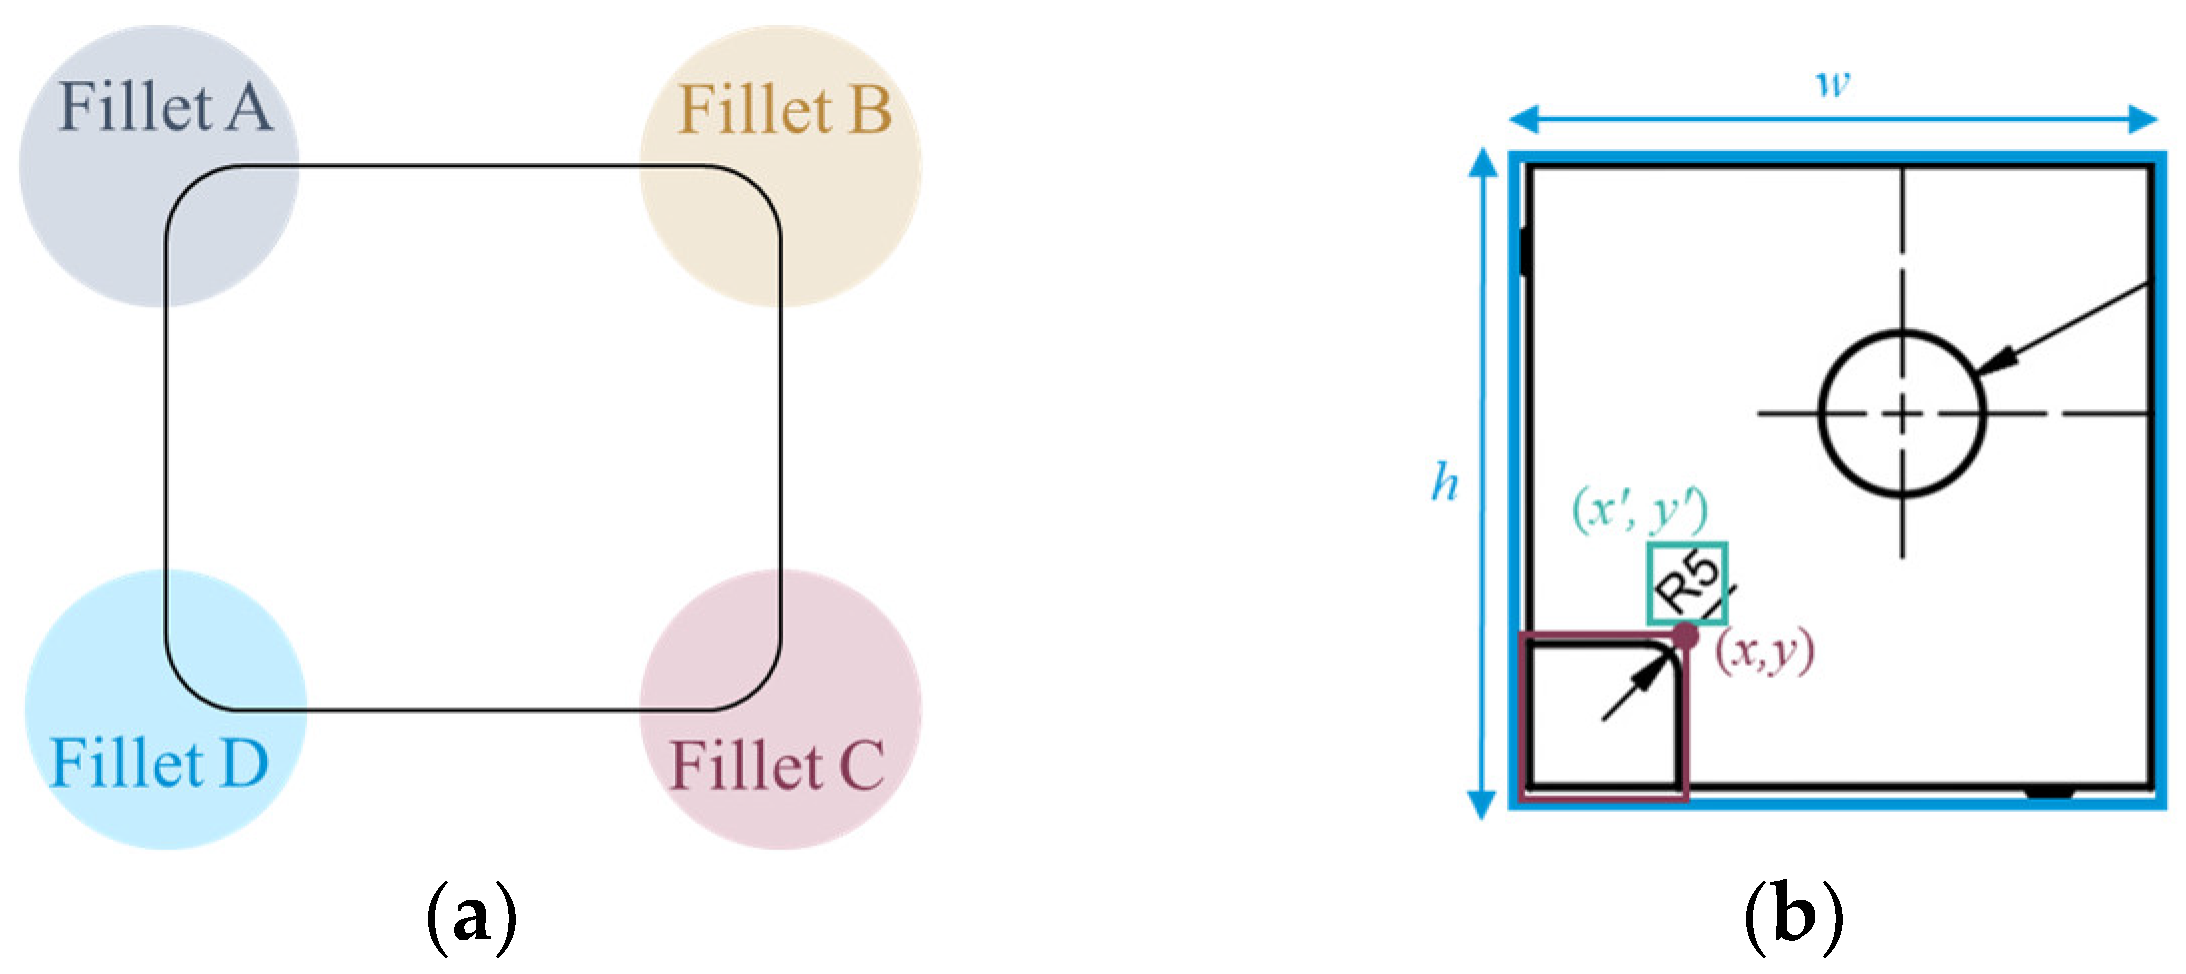
After contour integration, the system begins from the upper-left corner of the block or rectangular contour detection box in the top-view and proceeds clockwise to sequentially match fillet parameters. The four corners correspond to Fillet A, Fillet B, Fillet C, and Fillet D, respectively, as shown in Figure 16a. This study adopts the corner coordinates of the contour detection box as references, with the matching condition set within 20% of the contour size. When the bounding box of a radial dimension falls within this tolerance, it is assigned as the fillet radius at the corresponding corner. For example, in the case of Fillet B shown in Figure 16b, if the width and height of the block contour are w and h, and the coordinates of the upper-right corner are (x, y), then when the radial dimension coordinates (x′, y′) satisfy x′ ∈ (x ± 0.2 w) and y′ ∈ (y ± 0.2 h), the radial dimension value 5 is assigned as the radius of Fillet B.
Figure 16.
(a) Diameter Dimension Matching; (b) Fillet Radius Dimension Matching.
3.4.4. Dimension Compensation
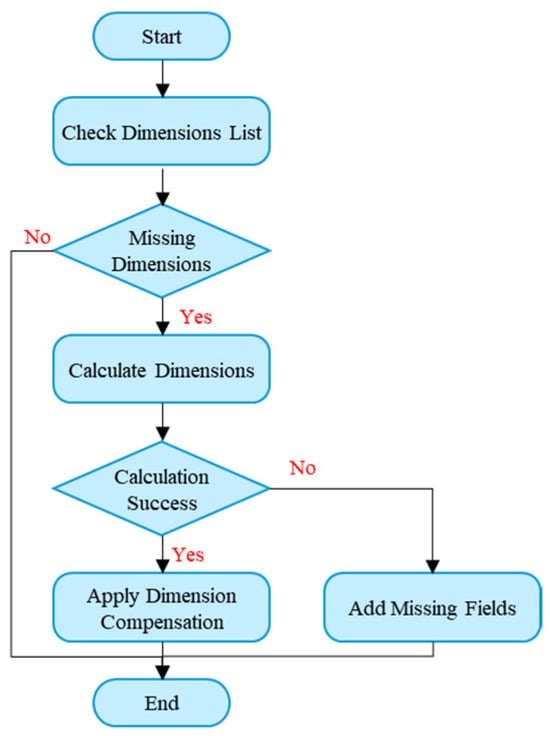
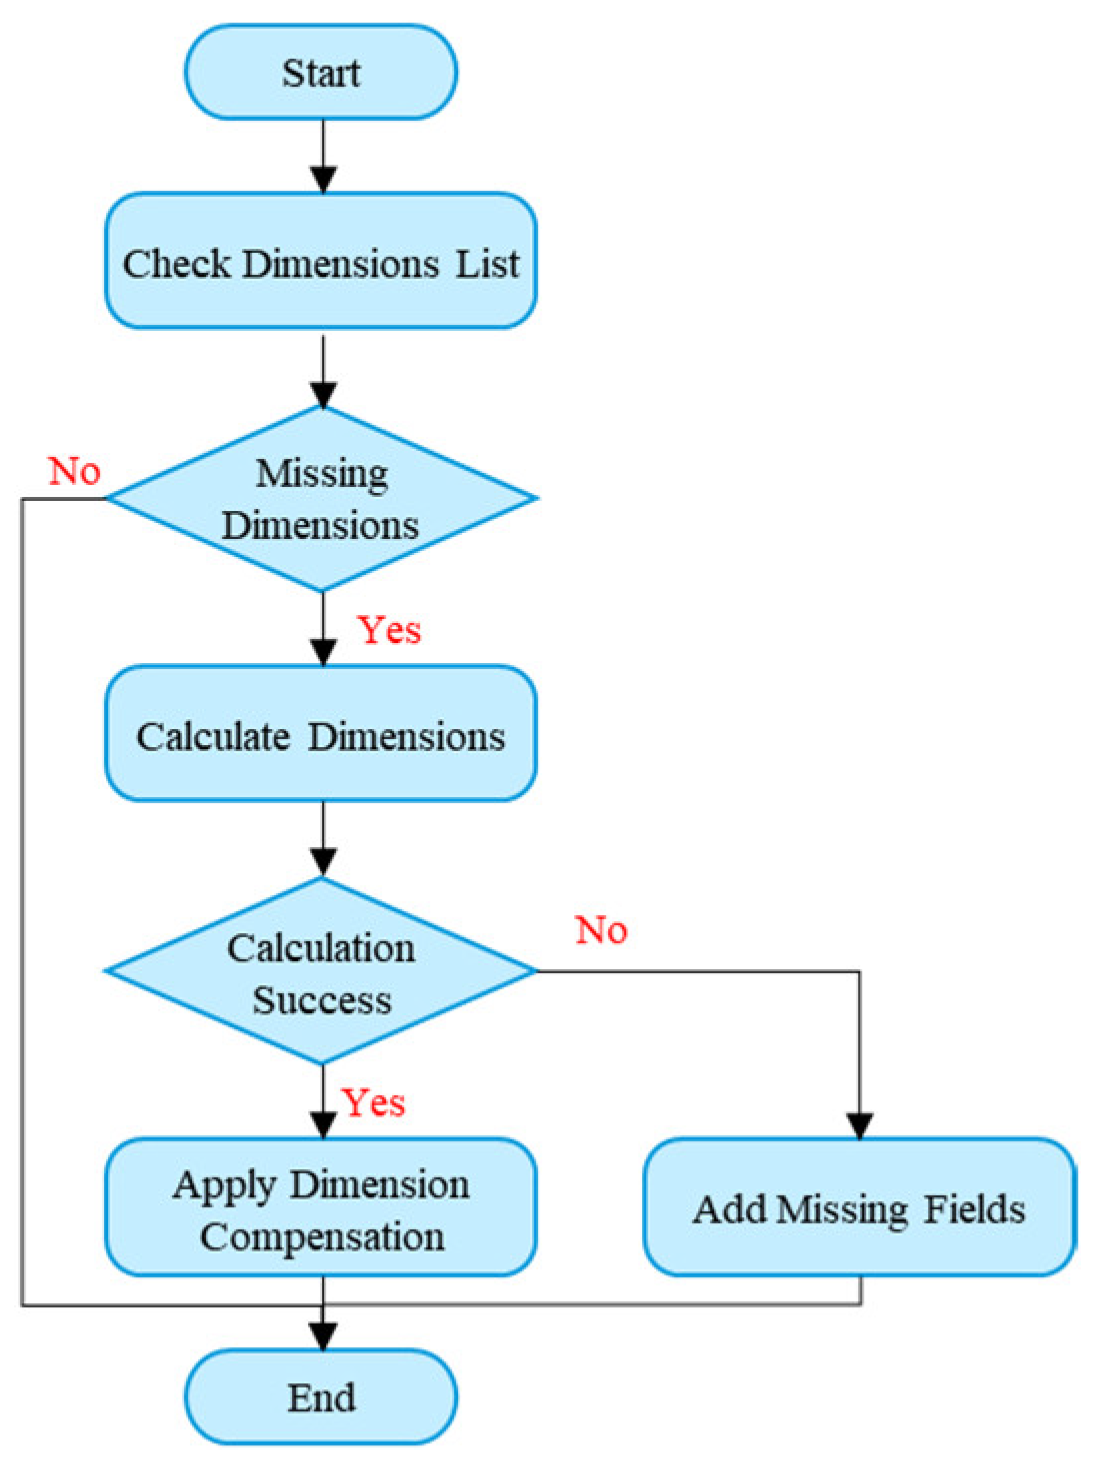
During the 3D modeling process, missing dimensions can be categorized into two types: (1) omissions due to under-annotation or unclear relationships among annotations, which result in missing parameters required for construction, and (2) omissions caused by recognition errors. To address this issue, this study designs an automated dimension compensation process, as illustrated in Figure 17. When the system detects that a construction feature lacks a required parameter, it estimates the missing value based on other known parameters. If the calculation is successful, the system automatically inserts the estimated value into the corresponding dimension field. Otherwise, the parameter remains missing, and the dimension field is marked as “matching failed.” This mechanism serves as a prompt for users to manually correct the parameters, ensuring that the dimensions of the 3D model remain consistent with those specified in the engineering drawing.
Figure 17.
Workflow of Dimension Compensation.
3.5. 3D Automatic Modeling
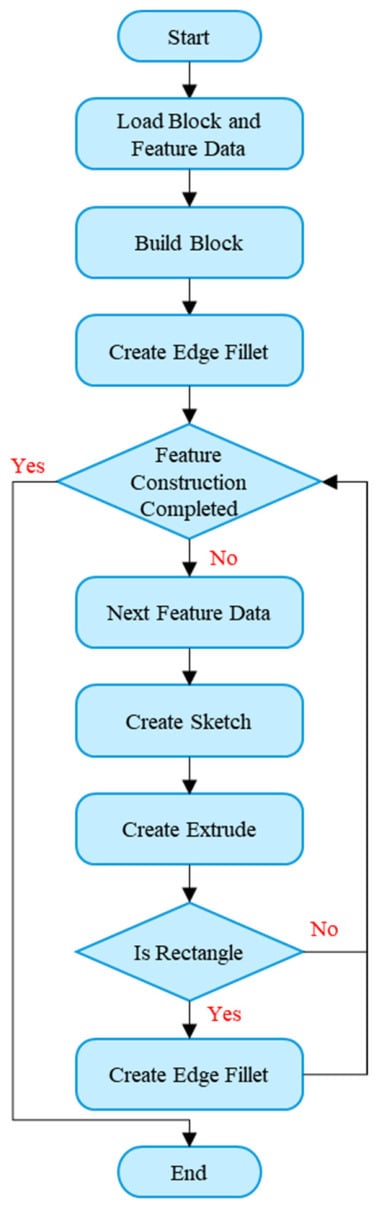
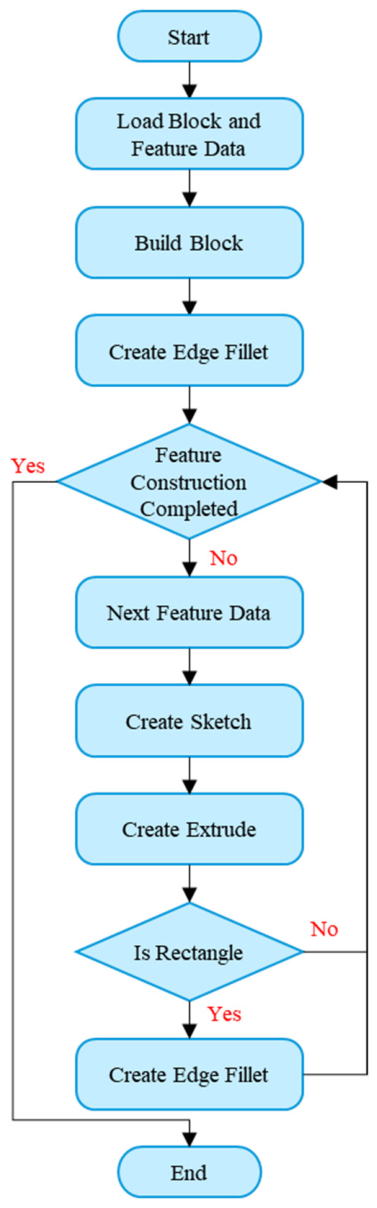
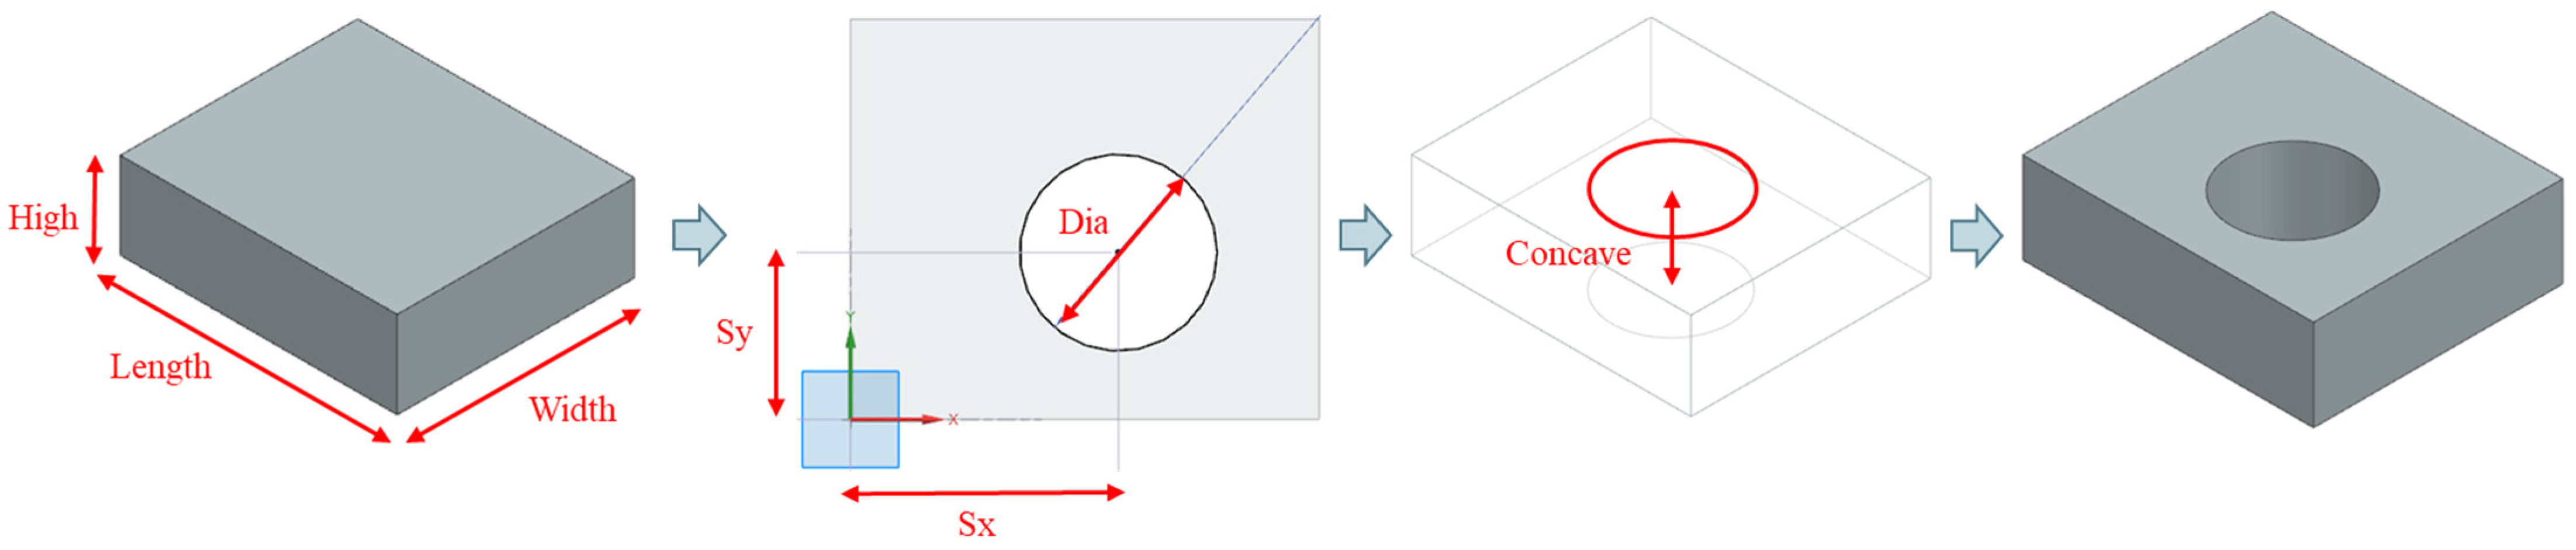
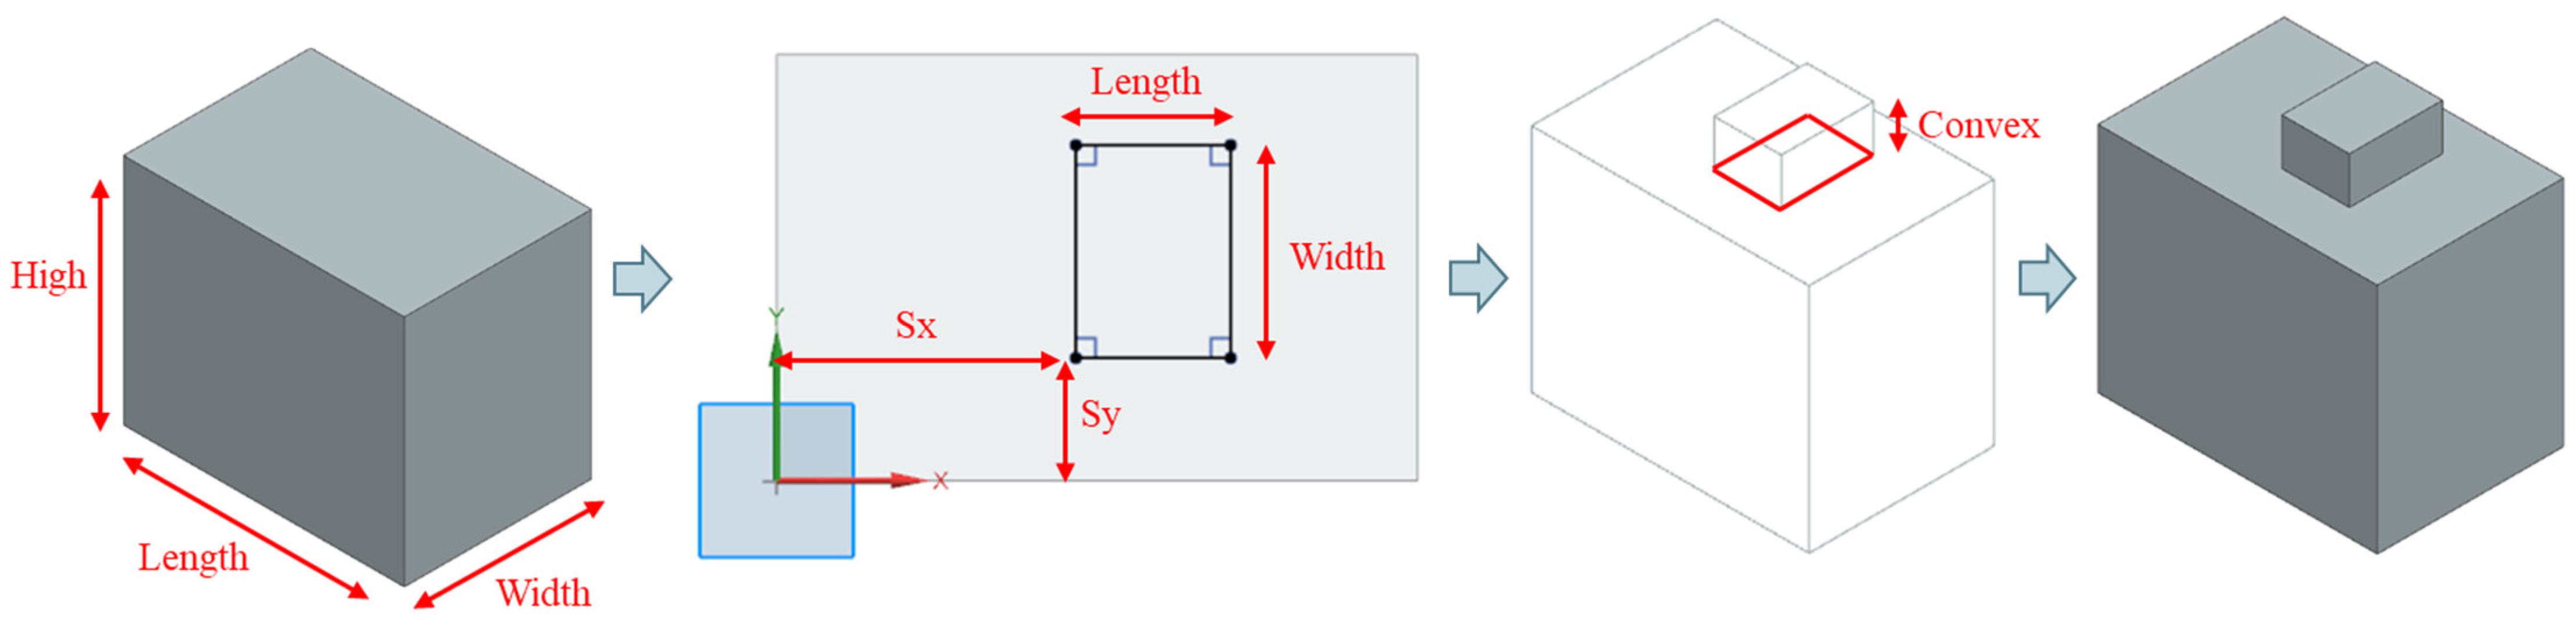
Based on the dimension data stored in the database after recognition, this study inputs dimension parameters into modeling functions in the order of feature groups. The system is developed using the .NET MVC Framework as the core architecture, combined with the secondary development capabilities of Siemens NX to automatically generate 3D solid models. The modeling process begins with constructing a square model, followed by sketching and extruding feature contours on the model. If the feature group includes fillet radius dimensions, edge fillets are subsequently applied. The overall process is illustrated in Figure 18, and the final output is a 3D model containing no more than two features.
Figure 18.
Workflow of 3D Automatic Modeling.
3.5.1. Block Construction
Various methods are available for constructing blocks. In this study, the CreateBlockFeatureBuilder() function provided by the NX Open module is adopted to establish the block feature. By specifying the origin coordinates along with the length, width, and height of the block, the block can be generated efficiently. Compared with other approaches, this method offers greater efficiency and convenience. Since the input parameters of the function include only the block dimensions and the origin is fixed at the absolute coordinate system’s origin, a new block can be generated simply by invoking the function after reading the corresponding data.
3.5.2. Extruded Feature Construction
First, depending on the contour type of the feature (rectangular or circular), the CreateSketchInPlaceBuilder2() method of the NX Open API is used to create a sketch on the surface of the block. Geometric constraints are applied to the sketch segments. Then, the CreateExtrudeBuilder() function is employed to specify the extrusion distance and direction of the sketch geometry, thereby generating an extruded feature on the block.
3.5.3. Fillet Feature Construction
Fillet features are created using the CreateEdgeBlendBuilder() function in the NX Open API. The target edges to be filleted are selected, and the fillet radius is specified. The fillet feature is then completed by executing the function with these parameters.
4. Case Study
In this section, the proposed system is evaluated using untrained 2D engineering drawings. The system performs recognition, applies dimension matching, and automatically generates the corresponding 3D solid models. The results include the detection of contour and dimensional features from the three-view drawings, followed by a detailed explanation of the matching method based on detection data. Finally, by integrating the complete CAD secondary development functions, the automated construction process of 3D solid models is demonstrated as the output of the system.
4.1. Case 1
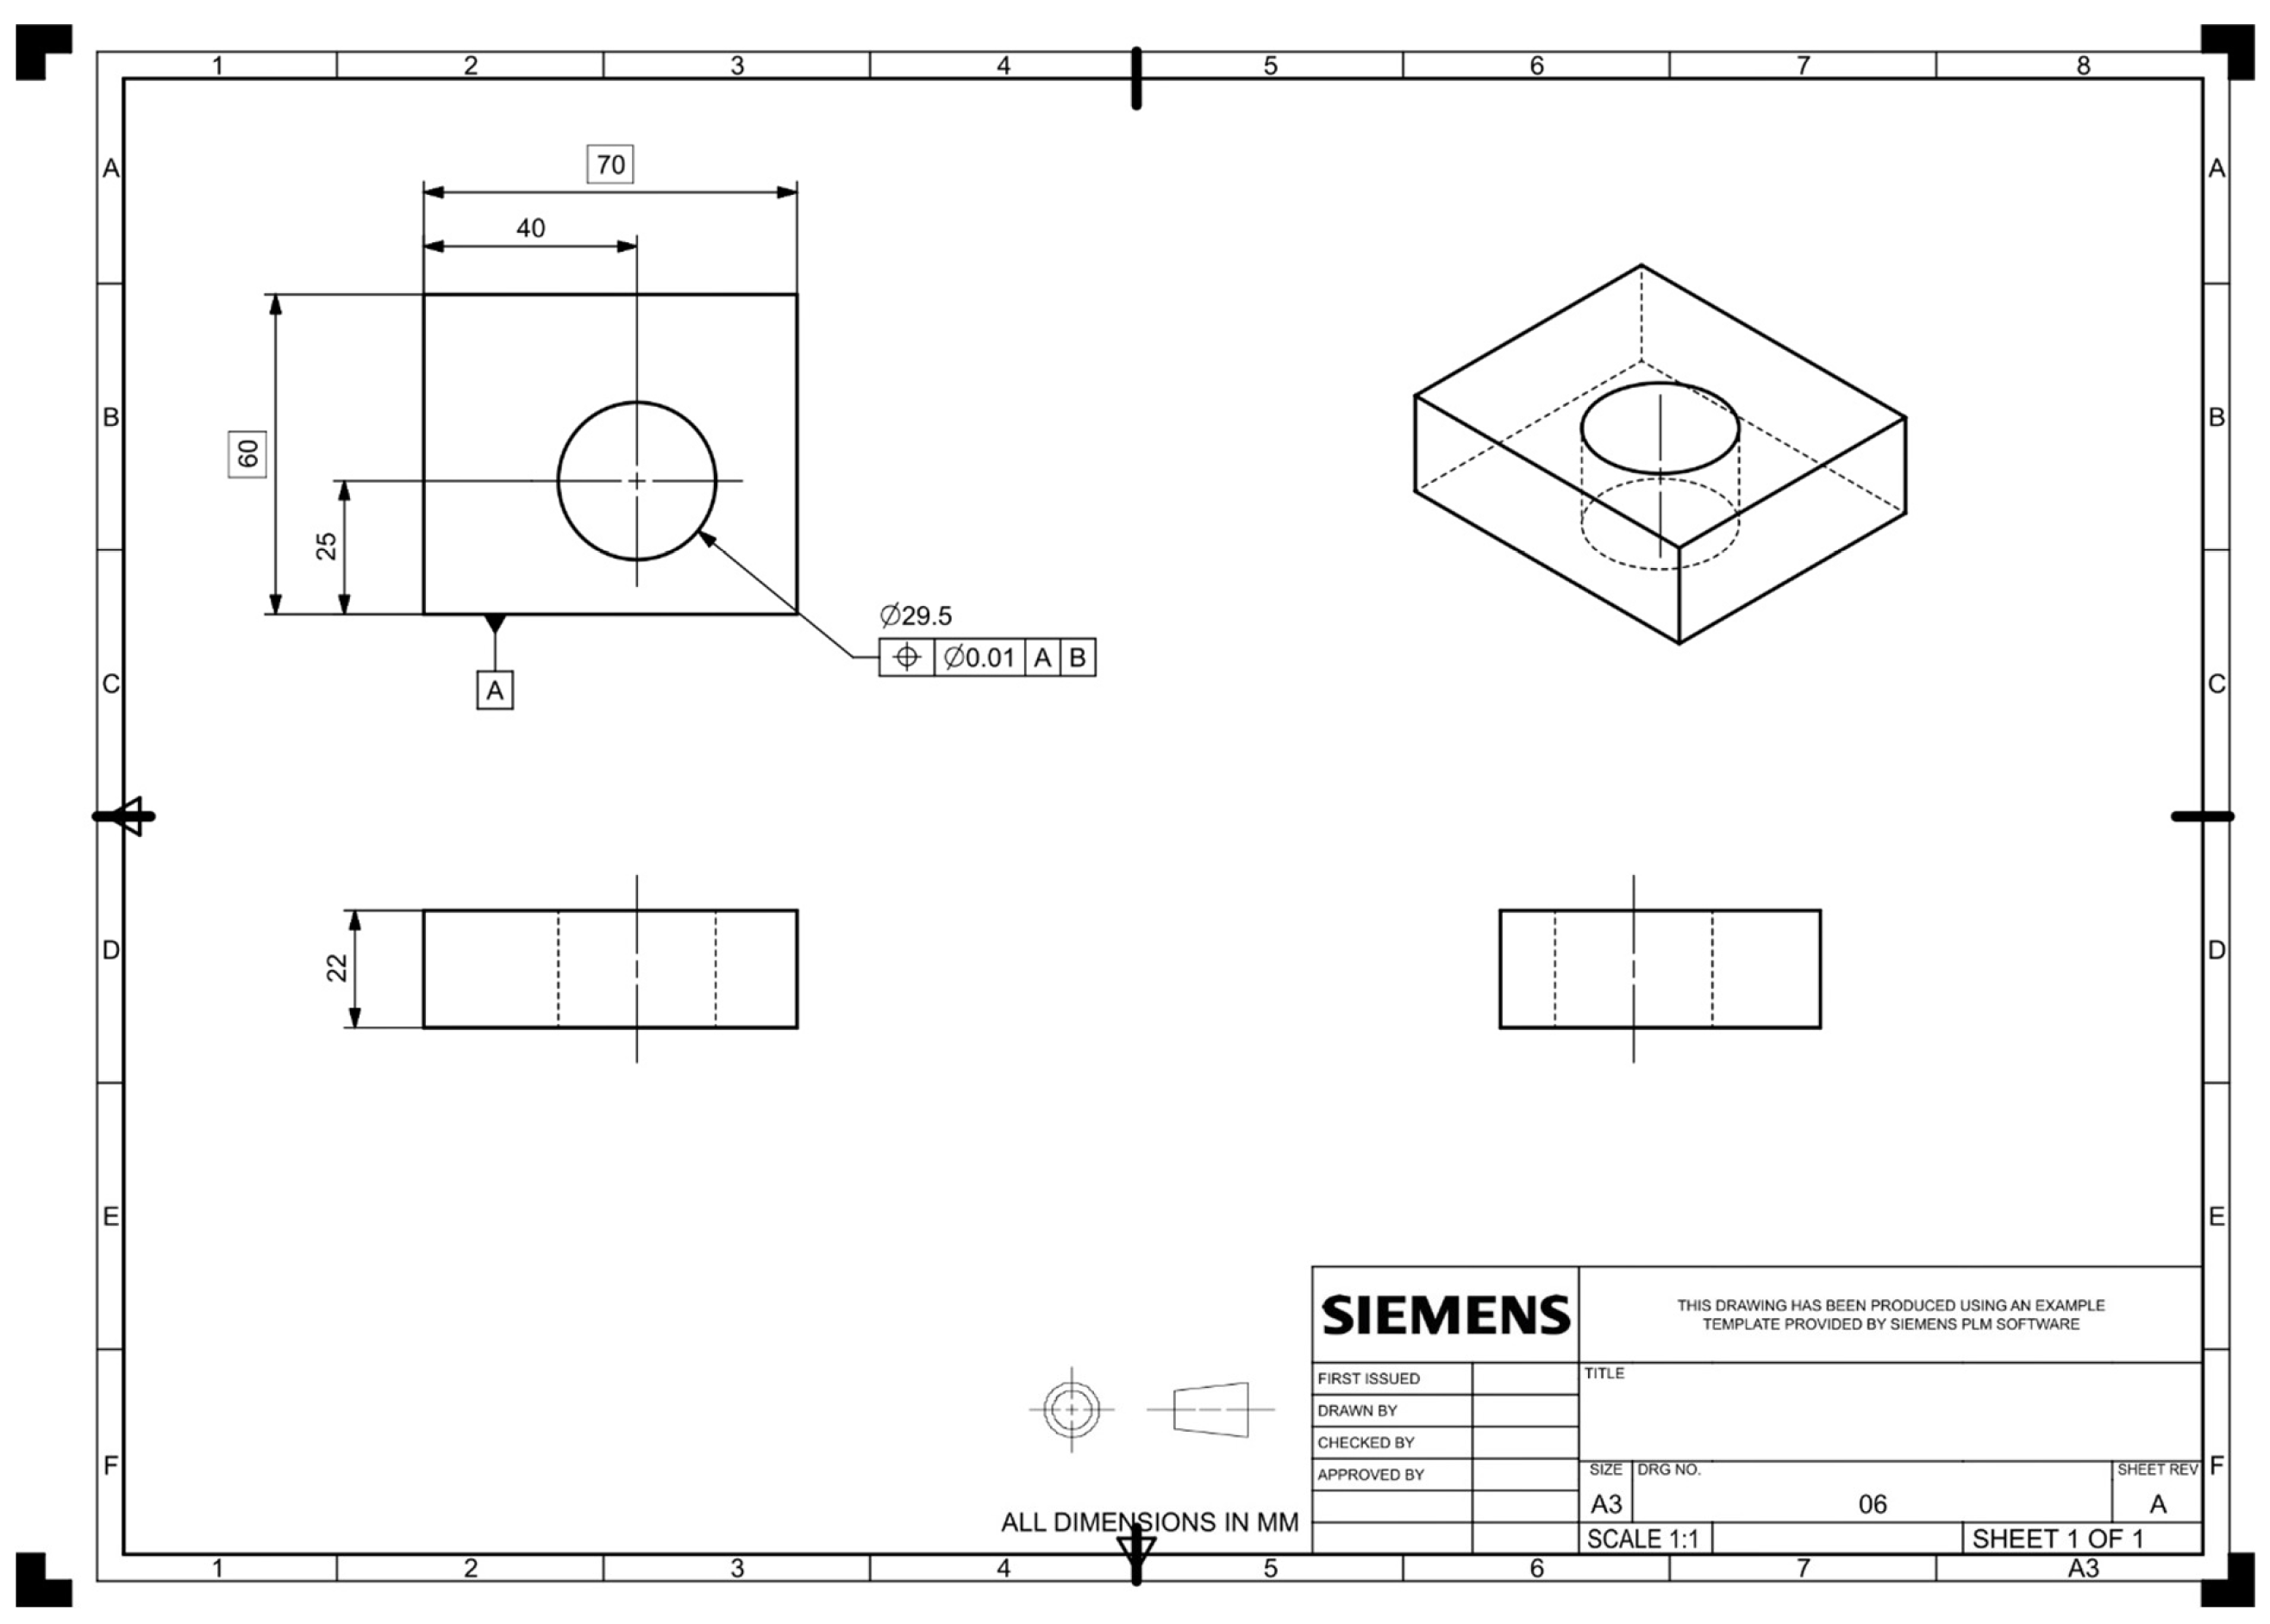
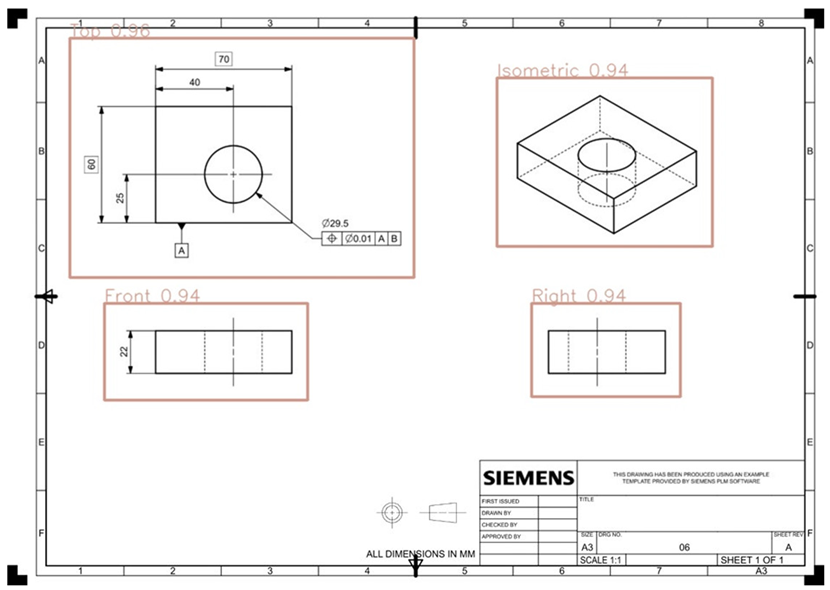
This is a single-feature case. This case demonstrates a single-feature scenario focused on the recognition of a 2D engineering drawing containing a circular hole (concave feature), as shown in Figure 19.
Figure 19.
Case 1 engineering drawing.
4.1.1. Recognition Results for Case 1
The comprehensive detection and recognition results are illustrated in Table 2. The quantitative detection results for contours and dimensions in Case 1 are detailed in Table 3 and Table 4.
Table 2.
Recognition Results for Case 1.
Table 3.
Contour Detection Results for Case 1.
Table 4.
Dimension Detection Results for Case 1.
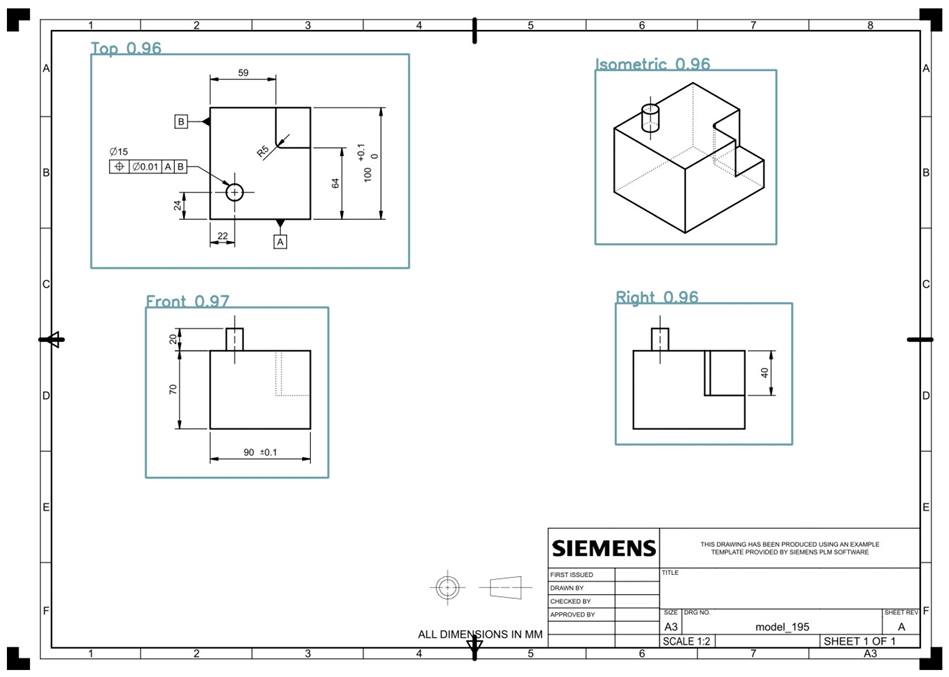
- Three-View Detection: The system successfully identifies and bounds the standard views, including the Top view, Front view, Right view, and the isometric projection.
- Contour Extraction: The outer boundary (Block) and the inner geometric feature (Circle/Concave) are accurately detected and labeled across the corresponding orthographic views (a, b, and c).
- Dimension Grouping Detection: All essential dimensional annotations such as horizontal dimensions (Dim_H), vertical dimensions (Dim_V), and diameter (Dia) are correctly detected and grouped with their respective geometric references to ensure a precise 3D model reconstruction.
4.1.2. 3D Modeling for Case 1
The bounding box sizes of the contours are matched with those of the dimensions to generate a model dimension list according to the dimension pairing rules, as shown in Table 5. Based on the data from the dimension list, the 3D modeling steps are executed as illustrated in Figure 20.
Table 5.
Dimension List for Case 1.
Figure 20.
3D Modeling for Case 1.
4.2. Case 2
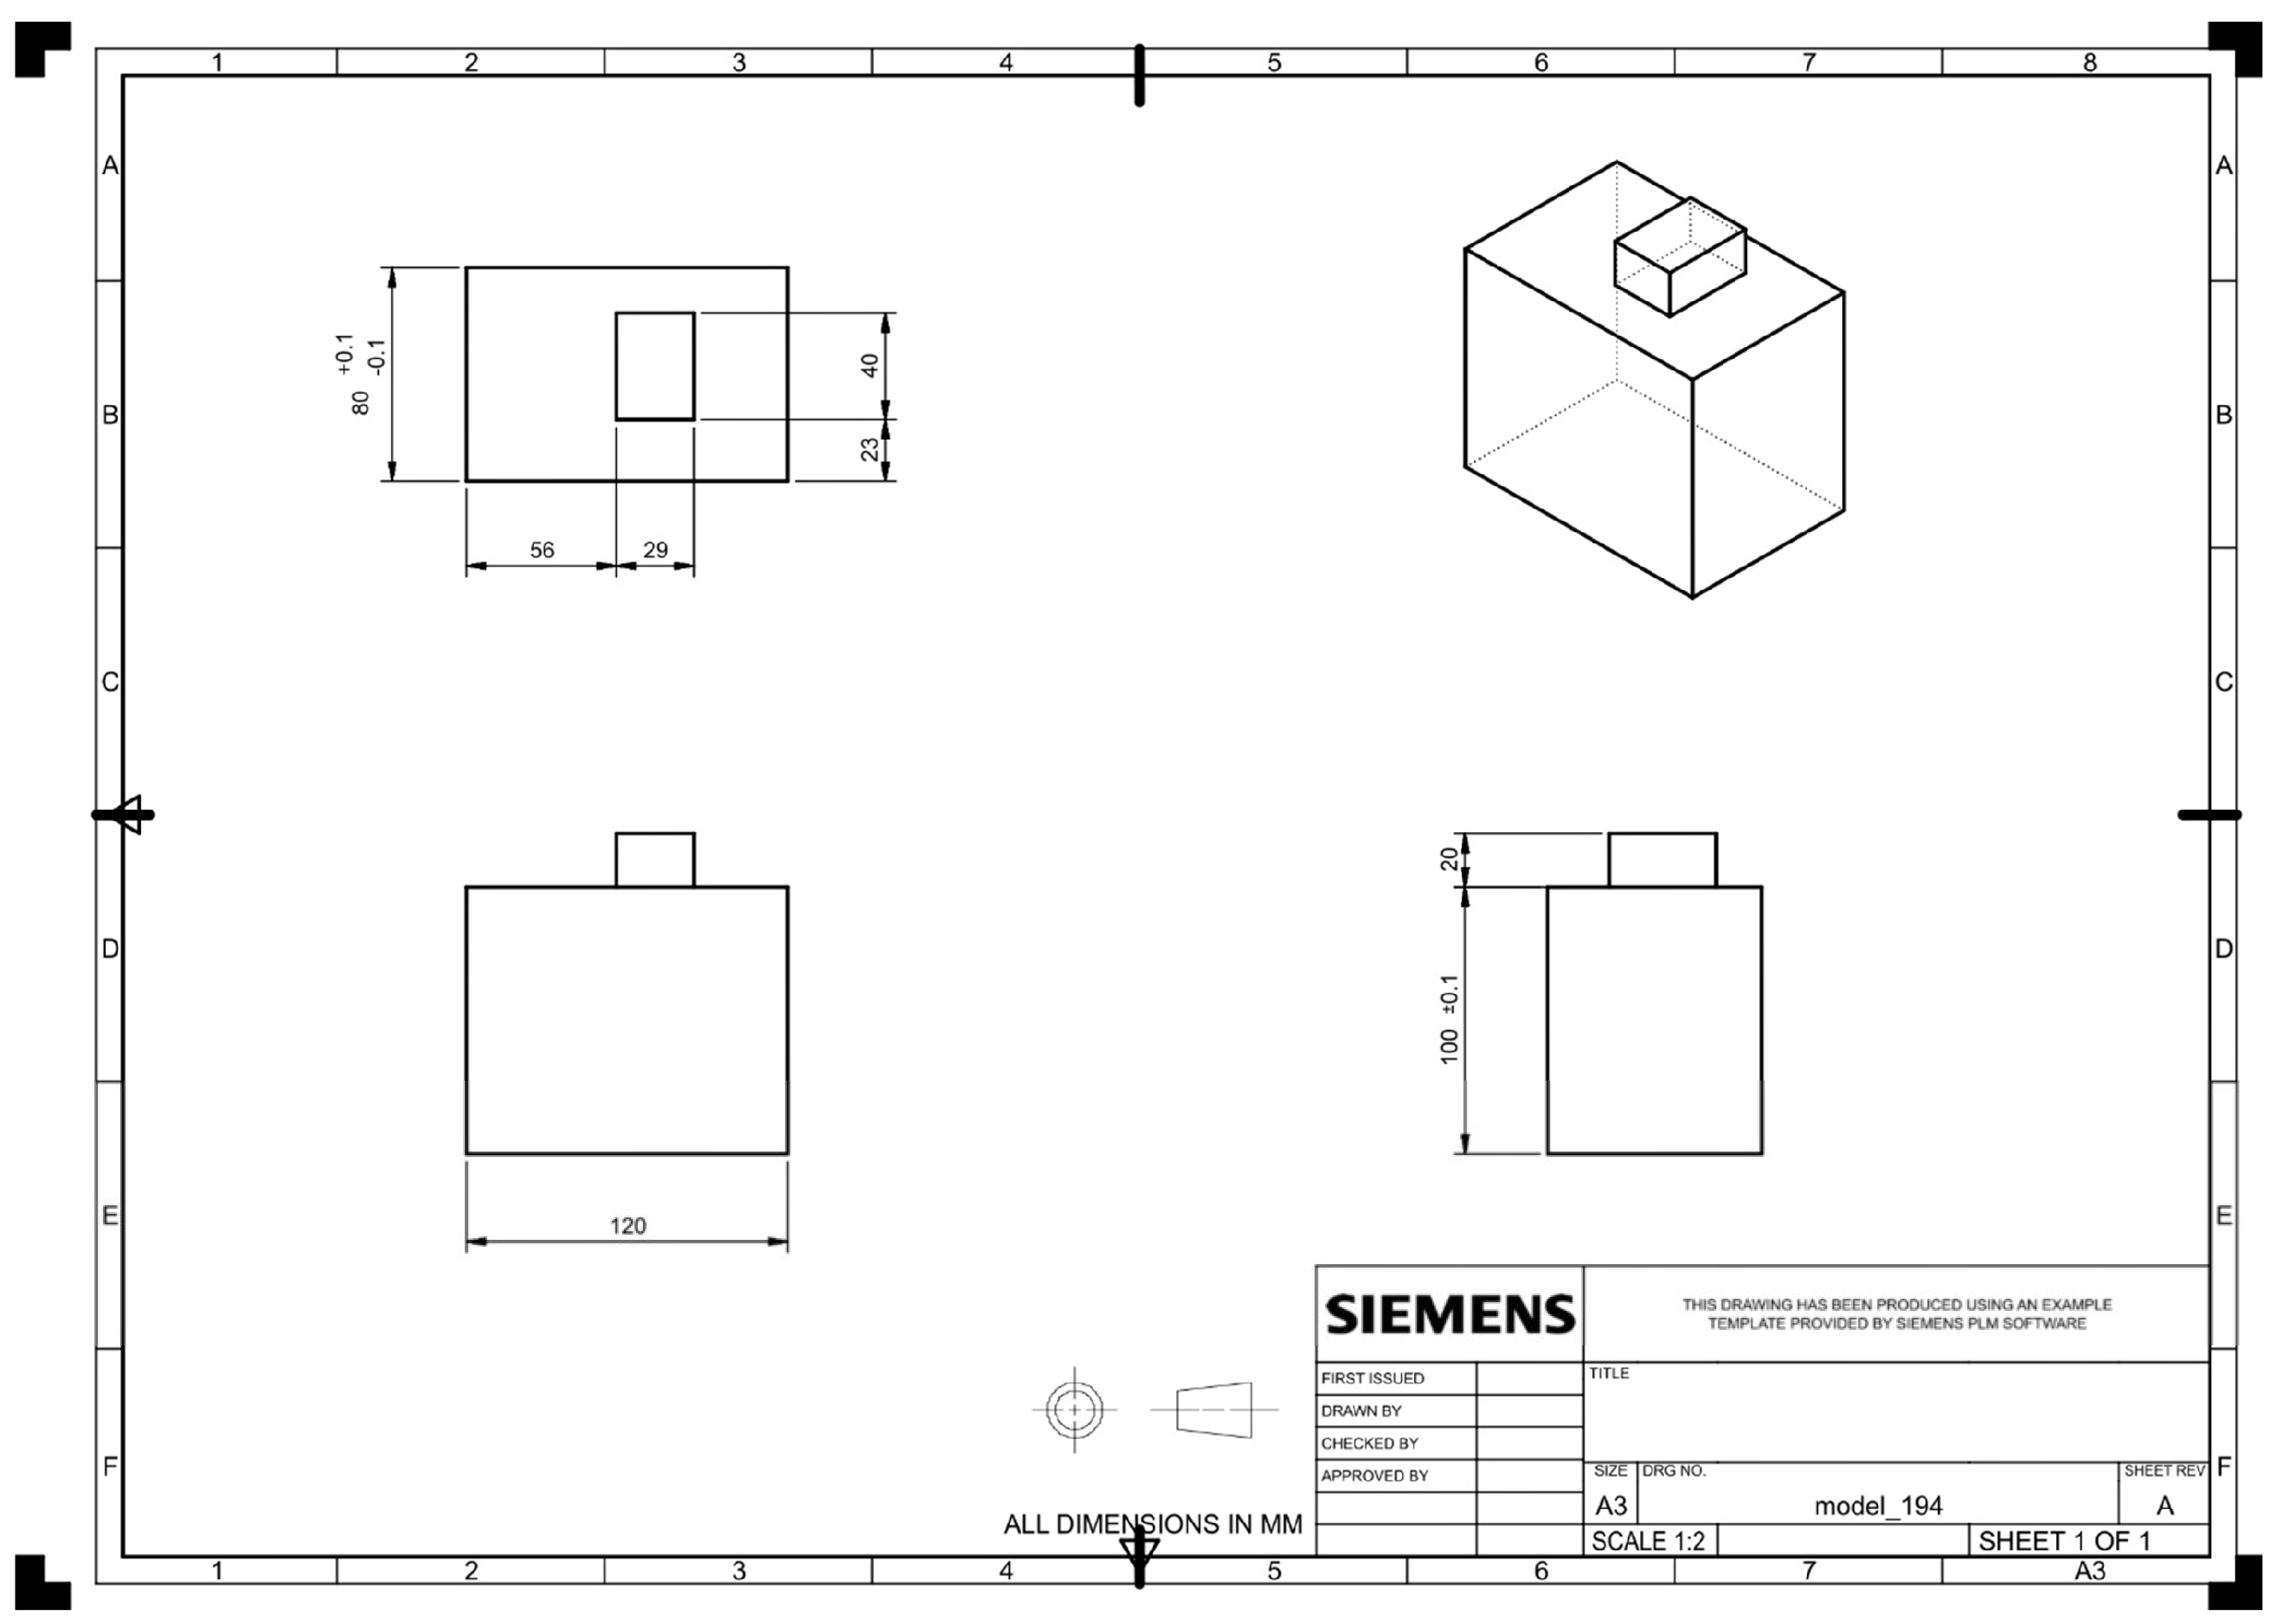
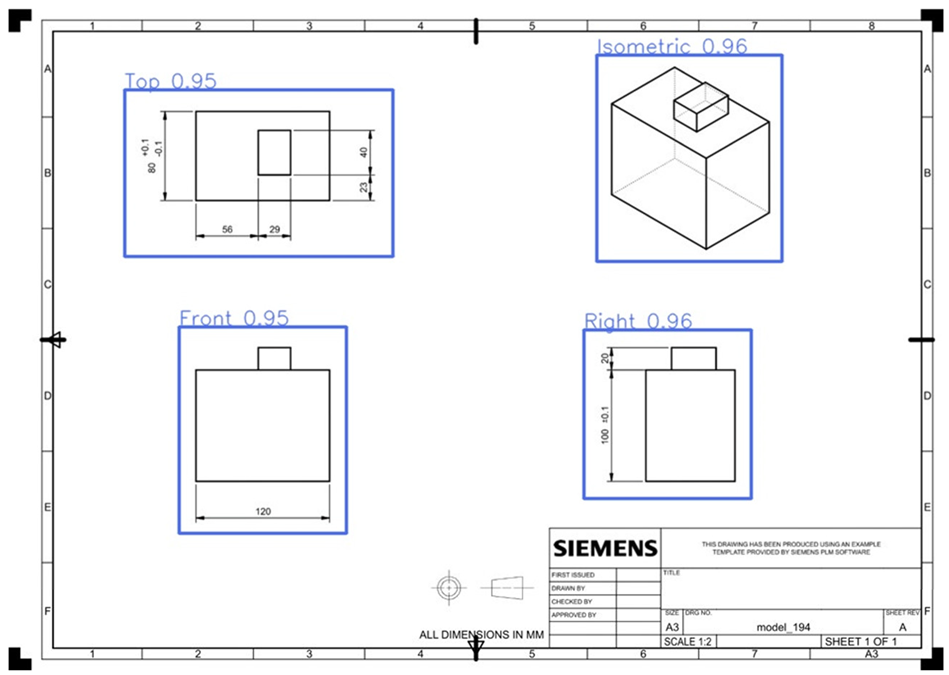
This is a single-feature case. This case presents a single-feature scenario focusing on the recognition of a 2D engineering drawing with a rectangular boss (convex feature), as shown in Figure 21.
Figure 21.
Case 2 engineering drawing.
4.2.1. Case 2 Recognition Results
The comprehensive detection and recognition results are illustrated in Table 6. The quantitative detection results for contours and dimensions in Case 2 are detailed in Table 7 and Table 8.
Table 6.
Recognition Results for Case 2.
Table 7.
Contour Detection Results for Case 2.
Table 8.
Dimension Detection Results for Case 2.
- Three-View Detection: The system successfully identifies and bounds the standard views, including the Top view, Front view, Right view, and the Isometric projection.
- Contour Extraction: The outer boundary (Block) and the protruding geometric feature (Rectangle/Convex) are accurately detected and labeled across the corresponding orthographic views (a, b, and c).
- Dimension Grouping Detection: All essential dimensional annotations such as horizontal dimensions (Dim_H) and vertical dimensions (Dim_V) are correctly detected and grouped with their respective geometric references to ensure a precise 3D model reconstruction.
4.2.2. 3D Modeling for Case 2
The bounding box sizes of the contours are matched with those of the dimensions to generate a model dimension list according to the dimension pairing rules, as shown in Table 9. Based on the data from the dimension list, the 3D modeling steps are executed as illustrated in Figure 22.
Table 9.
Dimension List for Case 2.
Figure 22.
3D Modeling for Case 2.
4.3. Case 3
This is a composite features case. This 2D engineering drawing with composite features, as shown in Figure 23. The drawing includes a circular protrusion (convex feature) and a rectangular pocket (concave feature).
Figure 23.
Case engineering drawing.
4.3.1. Case 3 Recognition Results
The comprehensive detection and recognition results are illustrated in Table 10. The quantitative detection results for contours and dimensions in Case 3 are detailed in Table 11 and Table 12.
Table 10.
Recognition Results for Case 3.
Table 11.
Contour Detection Results for Case 3.
Table 12.
Dimension Detection Results for Case 3.
- Three-View Detection: The system successfully identifies and bounds the standard views, including the Top view, Front view, Right view, and the Isometric projection.
- Contour Extraction: The outer boundary (Block) along with multiple complex features, including the circular hole (Circle), the corner cut (Rectangle), the protruding boss (Convex), and the inner slot (Concave), are accurately detected and labeled across the corresponding orthographic views (a, b, and c).
- Dimension Grouping: All essential dimensional annotations such as horizontal dimensions (Dim_H), vertical dimensions (Dim_V), radius (R), and diameter (Dia) are correctly detected and grouped with their respective geometric references to ensure a precise 3D model reconstruction.
4.3.2. 3D Modeling for Case 3
The bounding box sizes of the contours are matched with those of the dimensions to generate a model dimension list according to the dimension pairing rules, as shown in Table 13. Based on the data from the dimension list, the 3D modeling steps are executed as illustrated in Figure 24.
Table 13.
Dimension List for Case 3.
Figure 24.
3D Modeling for Case 3.
5. Conclusions
2D engineering drawings are widely used in part design and manufacturing, containing detailed specifications of parts such as dimensions, geometry, materials, and assembly methods. However, transforming the information in 2D drawings into 3D features and generating solid models through CAD software still relies heavily on manual interpretation and drafting experience. This process is not only tedious but also prone to human error.
To address these challenges, this study applies deep learning to the recognition of 2D engineering drawings and integrates Siemens NX for the automated generation of 3D solid models. The proposed system can automatically extract drawing information and generate 3D models consistent with the original design specifications, thereby enabling consistent reconstruction of CAD models from recognized drawing information. In addition, since all training drawings follow the ASME Y14.5 [19] standard, their standardized characteristics facilitate feature recognition and improve the training efficiency of the YOLOv4 neural network.
With the advancement of Industry 4.0, traditional manufacturing is gradually transitioning toward smart factories. Although the current automated system is limited to fundamental, non-intersecting geometric features, it demonstrates the potential to shift the paradigm of 2D-to-3D reconstruction. By automating baseline drawing recognition and primitive modeling tasks, the proposed framework supports a human–AI collaborative CAD reconstruction paradigm. This setup assists engineers by automating repetitive reconstruction operations while reserving complex engineering decisions for human expertise. By integrating image recognition, data processing, and CAD secondary development, this study achieves a coordinated workflow from 2D engineering drawings to 3D models, bridging the gap between 2D representation and 3D space.
However, several limitations remain to be addressed. Specifically, the standard YOLO architecture faces challenges in accurately regressing bounding boxes for highly overlapping or intersecting features. Moreover, the robustness of the deep learning model is constrained by the limited dataset size and the relatively narrow coverage of engineering feature types. Future work will focus on expanding the dataset to include a wider range of industrial geometric features and exploring advanced object detection or instance segmentation networks to replace the current model. Furthermore, enhancing CAD secondary development functions will be pursued to improve the system’s generalizability and practical applicability in complex industrial scenarios. Accordingly, the proposed framework represents an initial step toward automated 2D-to-3D CAD reconstruction rather than a universally applicable solution for all engineering drawings.
Author Contributions
Conceptualization, W.-R.J.; methodology, Y.-H.L., Y.-C.L. and W.-R.J.; software, Y.-C.L. and Y.-H.L.; validation, Y.-H.L. and W.-R.J.; writing—original draft preparation, Y.-C.L.; writing—review and editing, Y.-H.L.; visualization, Y.-H.L.; supervision, Y.-H.L. and W.-R.J. All authors have read and agreed to the published version of the manuscript.
Funding
This research received no external funding.
Data Availability Statement
The original contributions presented in this study are included in the article material. Further inquiries can be directed to the corresponding authors.
Conflicts of Interest
The authors declare no conflict of interest.
References
- Harish, A.B.; Prasad, A.R. Photo2CAD: Automated 3D Solid Reconstruction from 2D Drawings Using OpenCV. arXiv 2021, arXiv:2101.04248. [Google Scholar]
- Tyan, L.W.; Devarajan, V. Automatic Identification of Non-Intersecting Machining Features from 2D CAD Input. Comput.-Aided Des. 1998, 30, 357–366. [Google Scholar] [CrossRef] [Scilit]
- Hoang, L. Automatic Creating 3D Solid Models for Advanced Mechanical Engineering Applications. In Proceedings of the International Conference on Advanced Mechanical Engineering, Automation and Sustainable Development 2021 (AMAS2021), Ha Long, Vietnam, 4–7 November 2021. [Google Scholar]
- Cui, H.Y.; Tian, N.; Li, R.C.; Men, X.H. A Method of Parametric Design of Automobile Synchronizer Ring Based on UG Secondary Development Tools. Appl. Mech. Mater. 2014, 716–717, 635–638. [Google Scholar] [CrossRef] [Scilit]
- Krahe, C.; Iberl, M.; Jacob, A.; Lanza, G. AI-based Computer Aided Engineering for automated product design-A first approach with a Multi-View based classification. Procedia CIRP 2019, 86, 104–109. [Google Scholar] [CrossRef] [Scilit]
- Trischler, A.; Ye, Z.; Yuan, X.; Jing, H. A Parallel-Hierarchical Model for Machine Comprehension on Sparse Data. arXiv 2016, arXiv:1603.08884. [Google Scholar]
- Epshtein, B.; Ofek, E.; Wexler, Y. Detecting text in natural scenes with stroke width transform. In Proceedings of the 2010 IEEE Computer Society on Computer Vision and Pattern Recognition, San Francisco, CA, USA, 13–18 June 2010; pp. 2963–2970. [Google Scholar]
- Yu, B.; Wan, H. Chinese text localization in natural scene based on heuristic rules and SVM. Electron. Des. Eng. 2016, 24, 161–164. [Google Scholar]
- Wan, Y.; Wang, X.; Lu, D. Research on Key Techniques of Chinese Text Positioning in Natural Scenes. Comput. Appl. Softw. 2018, 35, 243–249. [Google Scholar]
- Liu, W.; Anguelov, D.; Erhan, D.; Szegedy, C.; Reed, S.; Fu, C.Y.; Berg, A.C. SSD: Single Shot MultiBox Detector. In Proceedings of the Computer Vision-ECCV 2016: 14th European Conference, Amsterdam, The Netherlands, 11–14 October 2016. [Google Scholar]
- Redmon, J.; Divvala, S.; Girshick, R.; Farhadi, A. You Only Look Once: Unified, Real-Time Object Detection. In Proceedings of the IEEE Conference on Computer Vision and Pattern Recognition (CVPR), Las Vegas, NV, USA, 27–30 June 2016; pp. 779–788. [Google Scholar]
- Han, X.; Chang, J.; Wang, K. Real-Time Object Detection Based on YOLO-v2 for Tiny Vehicle Object. Procedia Comput. Sci. 2021, 183, 104–109. [Google Scholar] [CrossRef] [Scilit]
- Xiu, H.H.; Wang, X.Q.; Wang, D.; Duan, B.G.; Rui, T. Object Detection in Crowded Scenes Via Joint Prediction. Def. Technol. 2023, 21, 103–115. [Google Scholar] [CrossRef] [Scilit]
- Bochkovskiy, A.; Wang, C.Y.; Liao, H.Y.M. YOLOv4: Optimal Speed and Accuracy of Object Detection. arXiv 2020, arXiv:2004.10934. [Google Scholar]
- Requicha, A.G. Representations for Rigid Solids: Theory, Methods, and Systems. ACM Comput. Surv. (CSUR) 1980, 12, 437–464. [Google Scholar] [CrossRef] [Scilit]
- Requicha, A.A.; Voelcker, H.B. Solid Modeling: A Historical Summary and Contemporary Assessment. IEEE Comput. Graph. Appl. 1982, 2, 9–24. [Google Scholar] [CrossRef] [Scilit]
- Shah, J.J. Assessment of Features Technology. Comput.-Aided Des. 1991, 23, 331–343. [Google Scholar] [CrossRef] [Scilit]
- Zhang, C.; Pinquié, R.; Polette, A.; Carasi, G.; De Charnace, H.; Pernot, J.P. Automatic 3D CAD Models Reconstruction from 2D Orthographic Drawings. Comput. Graph. 2023, 114, 179–189. [Google Scholar] [CrossRef] [Scilit]
- ASME Y14.5-2018; Dimensioning and Tolerancing. The American Society of Mechanical Engineers: New York, NY, USA, 2019.
- Lin, Y.H.; Ting, Y.H.; Huang, Y.C.; Cheng, K.L.; Jong, W.R. Integration of Deep Learning for Automatic Recognition of 2D Engineering Drawings. Machines 2023, 11, 802. [Google Scholar] [CrossRef] [Scilit]

Disclaimer/Publisher’s Note: The statements, opinions and data contained in all publications are solely those of the individual author(s) and contributor(s) and not of MDPI and/or the editor(s). MDPI and/or the editor(s) disclaim responsibility for any injury to people or property resulting from any ideas, methods, instructions or products referred to in the content. |
© 2026 by the authors. Licensee MDPI, Basel, Switzerland. This article is an open access article distributed under the terms and conditions of the Creative Commons Attribution (CC BY) license.