


Abstract
For radial distribution systems (RDSs) to operate efficiently, reliably, and sustainably, distributed generation (DG), capacitor banks (CBs), and network reconfiguration (NR) must be optimally allocated and sized. The main objectives considered in this research are minimizing real power losses, improving voltage profiles, enhancing energy utilization efficiency, and strengthening the operational reliability of distribution networks. To address this challenge, an Improved Frilled Lizard Optimizer (IFLO) is proposed to determine the optimal placement and sizing of DGs, CBs, and NR while satisfying system operational constraints. FLO is inspired by the adaptive survival and movement characteristics of frilled lizards in their natural ecosystem. The optimization mechanism of FLO is driven by hunting behavior for broad exploration and tree-climbing behavior for localized movement, enabling effective search and exploitation of promising regions. The IFLO introduces a defensive strategy phase, mimicking the lizard’s survival responses, and an adaptive local search phase, which models agile movement and stabilization behaviors. These enhancements improve the algorithm’s capability to reduce power losses, improve voltage regulation, increase network efficiency, and facilitate the effective integration of distributed energy resources into modern power distribution infrastructures. Comprehensive simulations on the IEEE 69-bus and the practical large-scale 141-bus RDS evaluate the impacts of DG and CB installation under practical operating constraints. This study investigates six scenarios involving different combinations of DG, CB, and NR to support efficient network planning and operation. Furthermore, recent optimization techniques, including Bezier Curve-Based Optimization (BCO), Horned Lizard Optimization Algorithm (HLOA), Whale Optimization Algorithm (WOA), Jaya Algorithm, and Particle Swarm Optimization (PSO), are implemented on the studied systems, and their results are compared with those of the proposed IFLO. The findings demonstrate that the suggested strategy outperforms existing optimization approaches in terms of convergence speed, solution quality, and network performance enhancement. The IFLO algorithm achieves an active power loss reduction of 92.69% for the large-scale system, while significantly improving voltage stability and operational efficiency. These outcomes contribute to the development of resilient, energy-efficient, and intelligent distribution infrastructures capable of supporting increased penetration of distributed energy resources under diverse operating conditions.
1. Introduction
A crucial strategy for enhancing the performance of complex distribution networks involves integrating Distributed Generation (DG), Capacitor Banks (CBs), and Network Reconfiguration (NR). This integration enhances network resilience, minimizes active and reactive power losses, and stabilizes voltage fluctuations. The primary objective of NR is to ascertain the optimal network topology by considering specific target functions. Given the various switching configurations available, the optimization challenges associated with NR are categorized as non-differentiable, combinatorial, and constrained problems. The two primary groups of methods for tackling optimal NR challenges are classical and metaheuristic algorithms. NR with classical methods include mixed integer programming [1], modified simplex method [2], and mixed integer convex programming [3]. Recently, developed algorithms have been developed for NR. The Ant Colony Optimization (ACO) has been applied to RDS for NR in [4]. Despite its strong global search capabilities, the ACO method is characterized by significant computational effort and extended convergence time. Moreover, the RDS with varying NR has been considered using a Genetic Algorithm (GA) with adaptive population size as illustrated in [5]. The GA has improved diversity and avoided premature convergence, yet it has remained computationally intensive.
To achieve lower line losses and better bus voltage profiles, a teaching–learning harmony search optimization algorithm has been demonstrated in [6] for optimum DG locations with NR of RDSs. The coyote algorithm has been employed in [7], considering two scenarios: NR alone and simultaneous NR and DG deployment, and applied on IEEE 69- and 119-bus RDSs to reduce the active power line losses. In [8], the ACO algorithm has been developed for the best locations and sizes of DGs with RN and studied on IEEE 33- and IEEE 69-bus systems, where the ACO algorithm dramatically lowers power loss, improves system reliability and increases voltage stability. In [9], a Harmony Search Algorithm (HSA) has been used to minimize power loss, where it has focused on the sensitivity of the network to switch changes and DG placement of IEEE 33-bus and 69-bus RDS systems. However, HSA often requires many iterations and can get trapped in local optima for larger, more complex systems. A Discrete Teaching-Learning-Based Optimization (DTLBO) algorithm has been introduced in [10] to improve the network topology of IEEE 33-bus, 69-bus, and 119-bus systems. However, the “teaching” and “learning” phases require careful balancing to prevent the algorithm from becoming computationally expensive. In [11], an Adaptive Cuckoo Search (ACS) was adopted to find the best DG locations and switch states of IEEE 33-bus and 69-bus systems. Nevertheless, ACS struggles to find the best solution because of the high dependency on the initial random population.
In [12], Improved Binary Particle Swarm Optimization (IBPSO) has been proposed to handle the “on/off” nature of switches and capacitor steps in IEEE 33-bus and 69-bus systems for power loss reduction. A Harmony Search Algorithm (HSA) has been presented in [13]. It treats the search for the best grid configuration of switch positions and capacitor sizes in RDS 33-bus and 12.66 kV. An improved reconfiguration method has been introduced in [14] for 33-bus, 69-bus, and a large 136-bus system. This made the simultaneous capacitor placement much faster by ignoring the irrelevant parts of the grid. However, the pre-processing step to identify loops becomes extremely difficult and mathematically messy in highly interconnected urban grids.
The influence of simultaneous optimum DG and CB sizes in RDS with NR has been explored by several researchers, who observed that the combination is more advantageous than the previously mentioned techniques. In [15], multi-criteria decision-making emerged with the non-dominated sorting genetic algorithm II (MCDM-NSGAII) to obtain the best location for DGs and CBs with NR for 33- and 69-bus RDSs. In [16], the allocation of DGs and CBs is optimized in conjunction with RDS with NR using a modified artificial ecosystem optimizer (AEO) technique and applied on the Cairo Radial Distribution System (RDS). A comparative study using the gray wolf optimizer (GWO) approach for DG and CB implantation with NR has been carried out in [17] to lower power loss and improve voltage profiles in an RDS. In [18], the NR and optimal sizing of DGs and CBs in the RDS have been demonstrated for 33-bus and 69-bus systems using a combination of bacterial foraging optimization and a fuzzy multi-objective approach to enhance voltage profiles and reduce power losses. Nevertheless, these problems are inherently high-dimensional and sensitive to load uncertainty, system constraints, and network topology, which complicates the optimization process.
According to the literature analysis, academics thoroughly examined multiple combinations of the placement of DGs and CBs in conjunction with the NR of RDS to improve performance of the entire system. Nevertheless, thorough studies on the simultaneous evaluation of ideal DG and CB sizes and placements, along with NR of RDS, are conspicuously lacking in the literature. Moreover, the use of a strong meta-heuristic algorithm is essential to obtaining precise and effective results because of the complexity and high-level computations required in the chosen technique. The Frilled Lizard Optimizer (FLO) is a nature-inspired metaheuristic developed in [19] by emulating the adaptive survival and movement characteristics of frilled lizards in their natural ecosystem. In this article, the improved version of the conventional FLO, called IFLO, is developed with optimum DG and CB Sizes and locations, accompanied by NR of RDS. The proposed IFLO enhances the original FLO by adding biologically inspired strategies that improve population diversity, convergence stability, and exploitation accuracy. It features a defensive strategy phase, which mimics lizard survival responses, and an adaptive local search phase that models agile movement and stabilization. The main contributions of this article are manifested as follows:
- ▪
- A Defensive Strategy Phase, mimicking the lizard’s survival responses, and an Adaptive Local Search Phase, which models agile movement and stabilization behaviors to facilitate better global exploration and local exploitation, improving the algorithm’s ability to escape local optima.
- ▪
- The IFLO and the conventional FLO are applied on the IEEE 69-bus and the large 141 bus RDS with six scenarios to attain the optimal allocation and sizes of DGs and CBs with a NR.
- ▪
- The recent optimization techniques, including Bezier curve-based optimization (BCO) [20], Horned Lizard Optimization Algorithm (HLOA) [21], Whale Optimization Algorithm (WOA) [22], Jaya Algorithm [23], and Particle swarm optimization [24], are implemented on the studied systems, and their results are compared with the developed IFLO.
- ▪
- A statistical evaluation of the proposed IFLO indicated that it is significantly better than the traditional FLO, BCO, HLOA, WOA, Jaya, and PSO.
Compared with the original FLO and other recently developed metaheuristic optimizers, the proposed IFLO introduces several novel mechanisms that collectively enhance the balance between exploration and exploitation. First, the proposed framework enhances the original FLO algorithm through an adaptive behavioral selection mechanism that adjusts strategies based on search states, contrasting with the static approach of FLO. Second, it introduces a diversified defensive mechanism, inspired by natural behaviors, which aids in escaping local optima and sustaining search diversity. Third, the proposed adaptive local search phase incorporates acceleration-based pursuit, tail-assisted stabilization, directional correction, and momentum-preserving movement strategies, enabling a progressive transition from exploratory movements in the early iterations to highly accurate exploitation near promising regions.
Unlike many recent metaheuristics that rely on a single exploitation operator or fixed local search procedure, IFLO employs multiple adaptive refinement variants that are activated according to the optimization progress ratio. Furthermore, the integration of cooperative learning, momentum preservation, oscillatory search patterns, and adaptive boundary maintenance enhances convergence stability without sacrificing population diversity. Consequently, IFLO provides a more flexible and biologically realistic search framework capable of improving convergence accuracy, robustness, and resistance to premature stagnation when compared with the original FLO and a wide range of contemporary population-based optimization algorithms.
The remaining sections of the paper are arranged as follows: A thorough description of the issue, including the goals and constraints of the system, is given in Section 2. An extensive description of the conventional FLO and the proposed IFLO techniques and how they can be used to solve the issue of the best way to allocate DGs, CBs and NR in order to gain technical merits is provided in Section 3. The simulation results from using the selected algorithms are shown in Section 4. A brief description of the study’s key conclusions and outcomes is given in Section 5.
2. DGs and CBs with Reconfiguration Integration in RDS
The primary goal function for the optimization approach of allocating for both DGs and CBs in RDS is often the elimination of the total technical losses along the RDS as follows:
where NLn is the aggregate number of distribution lines that exist in the network; Guv serves the mutual conductance among buses u and v; Vu and Vv are the voltage amplitudes at buses u and v; and θuv is the phase angle difference demand power between the buses u and v. Lossesm is the active power losses in each line (m) in the RDS.
In the proposed optimization framework, the fitness value represents the quantitative measure used to evaluate the quality of each candidate solution. Since the objective of the optimization problem is to minimize the total active power losses in the radial distribution system, the fitness value is computed directly from the objective function defined in Equation (1). For a given arrangement of DGs and CBs, the fitness value corresponds to the total network active power losses obtained from the load-flow analysis. Therefore, a lower fitness value indicates a better solution, as it reflects a greater reduction in power losses while satisfying all operational constraints. During the optimization process, candidate solutions are compared according to their fitness values, and the solution with the minimum fitness value is considered the best feasible solution.
2.1. Inequality Constraints Related to CBs
For this issue, there are three types of control variables. In the beginning, the reactive power sources of the capacitors must be addressed.
In this regard, the candidate buses and capacitor sizes are subject to hard operational constraints, as defined by Equations (2) and (3). These constraints ensure that the optimization process searches only within feasible installation locations and practical capacitor size limits. Specifically, Equation (2) restricts the capacitor placement variable to valid bus numbers within the distribution network, whereas Equation (3) limits the capacitor size to discrete values ranging from zero to the maximum allowable capacitor rating. Any candidate solution violating these bounds is considered infeasible and is corrected during the optimization process to satisfy the prescribed limits.
where NNodes denotes the number of distribution buses and NCB indicates the number of installed capacitors, and CBBus offers possible locations for capacitors. CBS indicates the quantity of installed capacitors, and CBmax indicates their maximum size.
Secondly, as demonstrated in Equations (4) and (5), there are restrictions on the busses and capacities which are capable of being utilized for establishing DGs. The prospective locations for the DGs are integer variables, whereas the power that the DGs will generate is represented by continuous variables.
where NDG represents the number of DGs, DGBus refers to possible locations for DG installation, and DGS and DGmax represent each DG’s rated capacity (u) and maximum limit, respectively.
Thirdly, as in Equation (6), distribution lines that need to be opened (OpenLn) are displayed in integer form as follows [25]:
where NOpen constitutes the total amount of lines that must remain open in order to maintain the radial design. The RDS’s aggregate amount of lines is indicated by NLn.
2.2. Equality Constraints
As stated in Equations (7)–(9), various inequality constraints are required to be fulfilled with regard to the nodes’ operational voltages, the current passing within the distribution lines, and the penetration threshold of incorporating DGs [26,27].
where Vm represents the voltage level at each distribution node (m); and are the minimum and maximum limits of the voltage which is considered of 0.9 and 1.05 per unit, and Im and stand for the current flow within the lines and the relevant thermal threshold. The active power demand at node (v) is represented by PDv, and the allowable penetration percentage for DG placement in the entire system, which is typically 60%, is represented by KP [28].
Equation (8) is introduced to guarantee safe ampere loading of all distribution lines throughout the optimization process. Specifically, the current flowing through each line (Im) must not exceed the corresponding thermal current rating (). This constraint ensures that the conductors operate within their permissible ampacity limits, thereby preventing thermal overloading, excessive temperature rise, accelerated insulation degradation, and potential reliability issues. During each optimization iteration, the load-flow analysis is performed, and the resulting line currents are checked against Equation (8). Any candidate solution violating the condition of Equation (8) is considered infeasible. Consequently, all reported solutions satisfy the safe ampere loading requirement and maintain secure network operation.
In addition, as stated in Equations (10) and (11), load flow balance restrictions in the context of active and reactive power must be fulfilled as inequality limits.
where the active and reactive power supplied by the substation are addressed by PSub and QSub, respectively, whereas the reactive power demand at node (v) is QDv.
While the safe ampere loading is preserved at every single branch and loading significance level, as proven by Equation (8), it is clear that the inequality boundaries of the voltage quality can be seen in Equation (7) at each loading level. Meanwhile, Equation (9) guarantees that the power produced by the DGs is not greater than the 60% “KP” barrier under any loading condition [9]. All of the network’s electrical loads are powered by the substations, and as Equations (10) and (11) demonstrate that the DGs and CBs are required to be greater than the loads in aggregate. Since there are no switching procedures under load variations, Equation (12) proves that the reconfiguration challenge is static. To demonstrate, no switching operations are provided for the used technique throughout a particular day according to this constraint. Nevertheless, this restriction might be seen as a new goal that can be applied to lower the dynamic RDS. For operational reasons, the radial design of the network is required to be maintained. Thus, Equation (12) [29] illustrates the way the branch-bus incidence matrix is formed.
3. Proposed IFLO for DGs and CBs Allocation and Size with NR Integration in RDS
3.1. Standard FLO
The FLO models the adaptive behaviors of frilled lizards within a mathematical optimization framework during the search process. In the multidimensional search space, each lizard represents a possible solution vector while the collective movements of the population emulate the evolutionary process of seeking the global optimum. The search mechanism in frilled lizards involves two main strategies: a hunting strategy for broad exploration and a tree-climbing strategy for focused exploitation near high-quality solutions. These complementary behaviors allow for a balance between diversification and intensification in the optimization process.
3.1.1. Initialization
At the initialization stage, FLO randomly generates a population of frilled lizards distributed across the feasible search space with dimension . Each lizard is represented by a multidimensional position vector () whose elements correspond to the decision variables () of the optimization problem and are bounded by predefined lower and upper limits ().
The positions are initialized using uniformly distributed random values () within the search boundaries ().
Subsequently, the fitness of each candidate solution is evaluated using the objective function (). The individual with the best fitness value is designated as the alpha lizard, serving as the leading solution of the population. The remaining lizards adapt their movements according to this elite individual, enabling collective learning and guiding the search process toward improved solutions and ultimately the global optimum.
3.1.2. Hunting Strategy
During the hunting phase, each lizard explores the search space to locate promising regions that may contain better solutions. This behavior is modeled by updating the position of a lizard (Fi) toward either the globally best solution identified so far or another neighboring individual with superior fitness. The hunting process can produce the following updated position ():
where is a behavioral integer parameter that dictates the lizard’s chase manner; denotes a randomized coefficient governing the moving strength and hunting activity; and FP indicates the prey location chosen from fitter solution candidates. Frilled lizards exhibit adaptive hunting strategies that change based on environmental conditions and prey traits. The algorithm’s position update includes stochastic elements to control movement intensity and direction, promoting search diversity and preventing early convergence. This mechanism boosts the exploration abilities of the FLO algorithm, allowing candidate solutions to explore new, potentially optimal areas in the search space.
After generating a new position, decision variables are checked against their bounds, adjusting any that exceed limits. The updated position’s fitness is evaluated using the objective function, and a greedy selection mechanism only replaces the current position if the new one improves fitness:
This approach promotes beneficial movements while maintaining high-quality solutions from earlier iterations.
3.1.3. Tree-Climbing Strategy
The tree-climbing strategy in FLO represents the exploitation phase of the process, which is inspired by the natural tendency of frilled lizards to climb trees when searching for safety, improving visibility, or identifying favorable hunting locations. The tree-climbing process can produce the following updated position ():
where the climbing orientated position and direction are controlled by a randomized factor . Within the optimization framework, this mechanism enables candidate solutions to perform a detailed search around promising regions previously identified during the exploration stage. The position of each lizard is updated using a randomized directional movement combined with an adaptive step size, allowing the search to proceed in both positive and negative directions.
After generating a new climbing position, boundary constraints are enforced to ensure that all decision variables remain within their feasible ranges. The fitness of the updated position () is then evaluated, and a greedy selection mechanism is applied:
The new position is accepted only if it yields a better fitness value than the current solution, thereby ensuring continuous improvement of the population. The hunting and tree-climbing phases are repeatedly executed throughout the optimization process until the maximum number of iterations () is reached. Through the continuous interaction between exploration-oriented hunting and exploitation-oriented tree-climbing behaviors, FLO effectively balances diversification and intensification, enabling efficient navigation of complex search spaces and improving the likelihood of locating the global optimum.
3.2. Proposed IFLO
At each iteration, every lizard selects one of four behaviors, hunting, tree-climbing, defensive action, or adaptive refinement, based on a uniformly distributed random variable . This probabilistic switching mechanism mimics the adaptive behavior of real frilled lizards under varying environmental conditions and enables different search agents to perform diverse search strategies simultaneously. Consequently, IFLO maintains a dynamic balance between exploration and exploitation, enhancing search diversity and reducing the risk of premature convergence.
3.2.1. Proposed Defensive Strategy
To enhance the search capability of IFLO, a defensive strategy inspired by the anti-predator behavior of frilled lizards is introduced. In nature, frilled lizards respond to threats through defensive actions such as intimidation or evasion. In the optimization framework, this behavior is modeled to help search agents avoid poor-quality regions and escape local optima. The strategy begins by identifying the worst-performing solution in the population (), which is treated as a hazardous or undesirable region.
The worst-performing solution in the current population, denoted by , is identified using Equation (19). This solution corresponds to the candidate with the highest objective function value in a minimization problem and is regarded as an unfavorable or hazardous region of the search space. Unlike conventional metaheuristics that guide agents solely toward the best solution, the proposed defensive strategy also utilizes information from the worst solution to provide a repulsive search direction. By identifying regions associated with poor fitness values, the algorithm can actively discourage candidate solutions from moving toward unpromising areas and reduce the likelihood of stagnation around local optima. Consequently, serves as a reference point for generating avoidance behaviors that improve population diversity and strengthen the exploration capability of IFLO.
The Euclidean distance () between each lizard and this worst solution is then calculated to estimate the level of threat as:
Based on this distance, different defensive responses are activated, enabling the algorithm to move away from unfavorable areas, improve population diversity, and enhance the ability to explore more promising regions of the search space.
(a) Frill Display Mechanism
When a lizard is located very close to a high-threat region, it activates the frill display mechanism, mimicking the defensive expansion behavior used to deter predators. In IFLO, this behavior is modeled as a large random displacement () that rapidly moves the search agent away from unfavorable areas as follows:
where is a large random displacement vector containing random numbers in the range [0, 1] following uniform distribution. Thus, the generated movement introduces significant diversification into the population, helping the algorithm escape poor local optima and explore new regions of the search space more effectively.
(b) Erratic Escape Mechanism
Under moderate threat conditions, the lizard performs an erratic escape maneuver, characterized by rapid and unpredictable movements away from the danger source as follows:
In IFLO, this behavior is modeled through a repulsive movement combined with stochastic perturbations (zc), allowing search agents to move away from unfavorable regions while maintaining search diversity. The random nature of the movement mimics the chaotic escape patterns of real frilled lizards and helps the algorithm avoid premature convergence by reducing the likelihood of becoming trapped in local optima.
(c) Camouflage Mechanism
When the threat level is low, the lizard adopts a camouflage strategy, characterized by minimal movement and small positional adjustments. In IFLO, this behavior is modeled as a slight random perturbation () around the current position, enabling fine local exploitation while maintaining solution stability as follows:
By performing delicate refinements near promising regions, the camouflage mechanism enhances convergence accuracy and supports the preservation of high-quality solutions during the later stages of the optimization process.
3.2.2. Proposed Adaptive Local Search
To further improve search efficiency, IFLO incorporates an adaptive local search mechanism inspired by the agile movements of lizards during hunting and defensive situations. The strategy dynamically adjusts its search behavior according to the optimization progress, enabling extensive exploration during the early stages and more focused exploitation as the search converges. This adaptive balance is regulated through an iteration-progress parameter that gradually shifts the algorithm from diversification to intensification. For average-performing lizards, the local refinement process combines information from the global best solution, neighboring individuals, and directional search adjustments. The position update incorporates stochastic components and adaptive control factors that regulate movement agility, search intensity, and convergence stability as follows:
where is a random lizard position, and is a random dimensional vector; η and γ indicate burst magnitude and control agility; is a random pursuit vector while and refer to the attraction gain and the tail correction factor; zd and ze symbolize random numbers; and denotes the tail inertia coefficient.
In Equation (24), is the iterative progress ratio which is defined as the proportion of the current iteration (Iter) over its maximum number (Iterm). This iterative progress ratio acts as an adaptive mechanism that regulates search behavior throughout the optimization process. Since increases gradually from 0 to 1 as the algorithm progresses, it enables a smooth transition between exploration and exploitation.
By simultaneously considering elite guidance, neighboring interactions, and adaptive correction mechanisms via Equation (24), the proposed local search enhances solution accuracy, accelerates convergence, and improves the algorithm’s ability to locate high-quality solutions while avoiding premature stagnation. Furthermore, the algorithm adaptively switches among multiple refinement variants according to the progress ratio p. During the early search stages, agility-driven movements dominate, encouraging exploration and diversification. As optimization progresses, the search gradually becomes more dependent on tail-assisted stabilization and momentum control, enabling highly accurate local exploitation near the optimum.
This formulation enables each lizard to refine its movement using both cooperative learning and directional diversity. The adaptive local search combines information from the best solution, neighboring individuals, and historical movement patterns to continuously adjust the search trajectory. As optimization progresses, the algorithm dynamically switches among several refinement strategies according to the iteration progress ratio. During the early stages, agility-driven movements promote exploration and population diversity, whereas later stages emphasize momentum preservation, stabilization, and precise local exploitation around promising solutions. This adaptive transition in frilled lizards shows an evolutionary shift from rapid, energetic motion during uncertainty to a more balanced and controlled approach when pursuing a target.
- The first condition strategy mimics the lizard’s rapid prey interception by utilizing acceleration bursts and body redirection. It considers optimal prey positioning, teammate data, and random acceleration to navigate toward the best prey, enabling agile adjustments and reflecting the lizard’s quick sprinting in unpredictable scenarios.
- The second condition strategy models the lizard’s zigzag moving during high-speed chases, utilizing sinusoidal oscillations for direction changes and momentum terms for tail-assisted balance, facilitating effective exploration and smooth convergence.
- The third mechanism enables lizards to navigate away from unfavorable areas using a tail-mediated directional correction informed by previous movements. It balances attraction to beneficial regions and repulsion from poor ones, enhancing population diversity.
- The fourth strategy improves movement continuity and stabilizes transitions during prey capture by combining momentum and attraction to neighboring lizards.
Therefore, the developed adaptive local search phase of IFLO merges agile exploration with stabilized exploitation through various biologically inspired behaviors, enhancing search adaptability and resistance to premature convergence while using tail-assisted correction and momentum preservation.
3.2.3. Justification of the Proposed Behavioral Extensions
The additional stages incorporated into IFLO were not introduced merely to increase algorithmic complexity; rather, each stage was designed to enhance the performance of the original FLO. The defensive behaviors (intimidation, camouflage, and erratic escape) were introduced to provide complementary diversification mechanisms capable of generating distinct search trajectories under different optimization conditions. Unlike conventional random perturbation operators that rely on a single exploration pattern, these strategies create structured population dispersion through threat-responsive movements inspired by biological survival behaviors.
Furthermore, by integrating acceleration-driven pursuit, tail-assisted stabilization, directional correction, and momentum-preserving movement, the proposed model enables multiple refinement dynamics that progressively improve solution precision while maintaining controlled search diversity. The adaptive behavioral selection mechanism further distinguishes IFLO from existing approaches by adaptively activating the most suitable behavioral mode according to the optimization state instead of employing fixed or sequential search operators. Consequently, the described stages work together within a hierarchical search framework, facilitating exploration, diversification, intensification, and convergence stabilization through complementary mechanisms. This approach improves the algorithm’s adaptability to various optimization landscapes and marks a significant shift from traditional FLO implementations and many recent metaheuristic variants that depend on fewer search operators.
3.2.4. Boundary Maintenance
In the proposed IFLO, each lizard’s position is dynamically updated through one of four behavioral mechanisms: hunting strategy, tree-climbing strategy, defensive mechanism, or adaptive local search phase, allowing the lizards to generate new candidate positions as follows:
Consequently, the selection is implemented as follows:
Afrom Equation (26), adaptive switching in lizard populations enables them to alternate between exploration and exploitation behaviors based on optimization states and environmental conditions. A boundary maintenance procedure ensures that generated positions remain within feasible limits by correcting any violated decision variables after updates, projecting them back into the allowable search interval as follows:
The fitness value linked to the revised lizard location is assessed using the objective function as following the creation and correction of the new candidate position. The definition of the greedy selection mechanism is:
This selection method preserves high-quality solutions found in earlier rounds while ensuring that only advantageous movements contribute to the population’s evolutionary advancement. Figure 1 shows the whole operational flowchart of the suggested IFLO algorithm.
Figure 1.
Proposed IFLO steps.
4. Simulation Results
Two distribution power networks which are IEEE 69-bus distribution feeder, and a practical large-scale 141-bus system in the area of Caracas in Venezuela, are employed to test the effectiveness of the proposed IFLO. The standard FLO, BCO, HLOA, WOA, Jaya, and PSO are compared to the proposed IFLO. These techniques are operated with settings of (30 and 50) search agents and (60 and 150) iterations The IEEE 69-Bus system [30] is used to assess medium- to large-scale optimization solutions, and the practical large-scale 141-bus system [31] is used to assess scalability and performance under increased complexity. The scenarios under study are as follows:
- ▪
- Scenario No.1: Optimal DG installation with NR for the IEEE 69-bus system
- ▪
- Scenario No.2: Optimal CB installation with NR for the IEEE 69-bus system
- ▪
- Scenario No.3: Optimal DG and CB installation with NR for the IEEE 69-bus system.
- ▪
- Scenario No.4: Optimal DG installation with NR for the IEEE 141-bus system
- ▪
- Scenario No.5: Optimal CB installation with NR for the IEEE 141-bus system
- ▪
- Scenario No.6: Optimal DG and CB installation with NR for the IEEE 141-bus system.
4.1. IEEE 69-Bus System
The IEEE 69-Bus system comprises 69 nodes and 68 branches as displayed in Figure 2, with an aggregate active power consumption of around 3.8 MW and a reactive power requirement of 2.69 MVAr. The attempt to minimize power loss and regulate voltage is more challenging. The IEEE 69-Bus system is a useful way to verify the resilience of optimization models since it includes more buses and longer feeder lengths, which results in higher voltage drops and power losses. The system is characterized by radial designs and variable load distribution, and this test environment provides a thorough setting for assessing the effectiveness of optimization approaches in DG planning, loss mitigation, and system efficiency enhancement.
Figure 2.
IEEE 69-bus distribution feeder system.
4.1.1. Scenario No.1 for the IEEE 69-Bus System
For Scenario No.1, the optimal DG allocation and size with NR is assessed using different optimization algorithms, including BCO, HLOA, Jaya, PSO, WOA, FLO, and the proposed IFLO, as illustrated in Table 1. The comparison is performed based on the optimal reconfiguration switches, installed DG buses and ratings, and the corresponding active power losses.
Table 1.
DG allocations and sizes with NR in Scenario No.1.
The initial RDS exhibits active power losses of 224.96 kW before applying any optimization technique. After applying simultaneous DG allocation and network reconfiguration, all optimization methods achieved noticeable improvements in system performance through power loss reduction. However, the proposed IFLO demonstrated the best overall performance among all compared techniques.
For the IFLO approach, the optimal reconfiguration configuration was obtained by opening switches 10, 70, 13, 55, and 63. In addition, the optimal DG units were allocated at buses 27, 46, and 61 with sizes of 466 kW, 431 kW, and 1383 kW, respectively. Hence, the active power losses were reduced to 38.4235 kW, which represents the minimum loss value 38.4235 kW among all investigated methods. Additionally, the BCO, HLOA, Jaya, PSO, WOA, and standard FLO achieved power losses of 40.93261, 58.29968, 44.68635, 43.78749, 47.28125, and 49.0715 KW, respectively.
The convergence features of the proposed IFLO, the standard FLO, BCO, HLOA, WOA, Jaya, and PSO are displayed in Figure 3 for Scenario No.1. Compared with other optimization techniques, the IFLO outperformed BCO, HLOA, Jaya, PSO, WOA, and the standard FLO in terms of solution quality and loss minimization capability. Although some methods such as BCO and PSO achieved competitive results, they were unable to attain the same level of reduction obtained by IFLO. The superior performance of IFLO can be attributed to its enhanced exploration and exploitation mechanisms introduced through the Defensive Strategy Phase and Adaptive Local Search Phase, which improve search diversity and prevent premature convergence.
Figure 3.
Convergence behavior of the IFLO, FLO, BCO, HLOA, WOA, Jaya, and PSO under Scenario No.1.
Furthermore, the proposed IFLO exhibited more stable convergence behavior and better capability in identifying the optimal combination of DG placement and network topology. This confirms that the proposed enhancements effectively improve the optimizer’s search efficiency and robustness, especially for highly nonlinear and complex RDS optimization problems. Consequently, IFLO provides a reliable and efficient framework for simultaneous DG allocation and network reconfiguration in modern RDSs.
The statistical performance of the investigated optimization techniques over 25 independent runs is summarized in terms of minimum, average, maximum, and standard deviation (SD) values of the active power losses. The obtained results clearly demonstrate the superiority and robustness of the proposed IFLO algorithm compared with BCO, HLOA, Jaya, PSO, WOA, and the standard FLO approaches. Among all compared techniques, the proposed IFLO achieved the lowest minimum active power loss value of 38.4235 kW, outperforming all other optimization methods. In contrast, the minimum losses obtained by BCO, HLOA, Jaya, PSO, WOA, and FLO were 40.93261 kW, 58.29968 kW, 44.68635 kW, 43.78749 kW, 47.28125 kW, and 49.0715 kW, respectively, as illustrated in Table 1. This confirms the strong exploitation capability of IFLO in locating high-quality optimal solutions.
As illustrated in Figure 4 and Table 2, the average loss values further highlight the stability and consistency of the proposed algorithm. IFLO achieved an average loss of 44.77033 kW, which is significantly lower than those obtained by the competing methods. Particularly, HLOA and WOA exhibited much higher average losses of 124.7882 kW and 82.39824 kW, respectively, indicating unstable search behavior and inconsistent convergence performance. Similarly, the FLO algorithm recorded an average loss of 66.59372 kW, demonstrating that the proposed enhancements substantially improved the standard optimizer performance. Regarding the maximum obtained losses, IFLO also demonstrated the best robustness with a maximum value of only 47.27975 kW. By comparison, other methods experienced considerably larger maximum losses, especially HLOA and WOA, which reached 191.6283 kW and 171.048 kW, respectively. These large deviations indicate poor stability and a higher probability of trapping in local optima. The standard deviation values provide additional evidence of the reliability of the proposed approach. IFLO achieved the smallest standard deviation value of 2.688635, indicating highly stable and repeatable performance across multiple runs. Although BCO and Jaya showed relatively acceptable deviations, their solution quality remained inferior to IFLO. On the other hand, HLOA, WOA, and FLO exhibited significantly larger deviations, reflecting unstable convergence characteristics.
Figure 4.
Boxplot for IFLO, FLO, BCO, HLOA, WOA, Jaya, and PSO under Scenario No.1.
Table 2.
Statistical performance obtained from IFLO, FLO, BCO, HLOA, WOA, Jaya, and PSO under Scenario No.1.
To evaluate the convergence characteristics of the proposed algorithm, three complementary performance indicators were employed: (i) the number of iterations required to reach the predefined target fitness value (Itertarget), (ii) the performance improvement percentage (PI%), and (iii) the convergence rate metric (CR). The target fitness value was fixed at ( = 45 kW) for all algorithms to ensure a fair comparison.
where f(1) is the initial best fitness, is the final best fitness attained at the end of the optimization process, and is the maximum number of iterations. Table 3 summarizes the convergence results and solution quality obtained for Case 1. The proposed IFLO achieved the best overall performance among all competing algorithms. It reached the target fitness value in only 15 iterations, significantly outperforming BCO, HLOA, Jaya, PSO, WOA, and the original FLO, which required 182, 200, 108, 118, 200, and 200 iterations, respectively. This result demonstrates the superior capability and accelerated convergence behavior of the proposed IFLO during the early stages of the search process.
Table 3.
Convergence and solution quality of BCO, HLOA, WOA, Jaya, FLO, IFLO, and PSO obtained for Case 1.
Regarding solution quality, IFLO produced the lowest final fitness value of 38.4235 kW, which is substantially better than the target value and lower than all competing methods. The performance improvement percentage further confirms the effectiveness of the proposed method. IFLO achieved the highest PI% value of 82.92%, indicating the largest reduction from its initial fitness value to the final optimized solution. The remaining algorithms achieved PI% values ranging from 74.08% to 81.80%, demonstrating that IFLO consistently generated greater overall improvement throughout the optimization process.
A similar trend is observed in the convergence rate metric. IFLO attained the highest CR value of 1.8984, slightly exceeding PSO (1.8739) and considerably outperforming BCO (0.4636), FLO (0.4388), WOA (0.3917), Jaya (0.3067), and HLOA (0.1624). The high CR value indicates that IFLO was able to reduce the objective function more rapidly on average during the optimization process. When considered together with the remarkably low iteration count required to reach the target solution, these results confirm that the proposed IFLO provides both faster convergence and superior solution quality.
4.1.2. Scenario No.2 for the IEEE 69-Bus System
For Scenario No.2, the optimal CB allocation and size with NR is assessed using BCO, HLOA, Jaya, PSO, WOA, FLO, and the proposed IFLO, as illustrated in Table 4. For the IFLO approach, the optimal reconfiguration configuration was obtained by opening switches 69, 18, 12, 56, and 63. In addition, the optimal DG units were allocated at buses 44, 61, and 24 with sizes of 600, 1200, and 300 kvar, respectively. Hence, the active power losses were reduced to 38.4235 kW, which represents the minimum loss value 68.24586 kW among all investigated methods. Additionally, the BCO, HLOA, Jaya, PSO, WOA, and standard FLO achieved power losses of 69.31555, 82.71444, 75.23785, 75.90174, 79.6787, and 83.20898 KW, respectively.
Table 4.
CB allocations and sizes with NR in Scenario No.2.
In addition, the convergence features of the proposed IFLO, the standard FLO, BCO, HLOA, WOA, Jaya, and PSO are displayed in Figure 5. Compared with other optimization techniques, the IFLO outperformed BCO, HLOA, Jaya, PSO, WOA, and the standard FLO in terms of solution quality and loss minimization capability. Furthermore, the proposed IFLO exhibited more stable convergence behavior and better capability in identifying the optimal combination of CB placement and network topology. This confirms that the proposed enhancements effectively improve the optimizer’s search efficiency and robustness.
Figure 5.
Convergence behavior of the IFLO, FLO, BCO, HLOA, WOA, Jaya, and PSO under Scenario No.2.
As depicted in Figure 6, the statistical performance of the proposed IFLO, BCO, HLOA, Jaya, PSO, WOA, and the standard FLO over 25 independent runs is summarized in terms of minimum, average, maximum, and SD values of the active power losses. Among all compared techniques, the proposed IFLO achieved the lowest minimum active power loss value of 68.25 kW, outperforming all other optimization methods. This confirms the strong exploitation capability of IFLO in locating high-quality optimal solutions. The obtained results clearly demonstrate the superiority and robustness of the proposed IFLO algorithm compared with BCO, HLOA, Jaya, PSO, WOA, and the standard FLO approaches. The worst-case analysis presented in Figure 6 further confirms the superiority and robustness of the proposed IFLO approach. IFLO achieved the lowest worst-case loss value of approximately 80.93 kW, indicating stable convergence behavior and a low sensitivity to random initialization. In contrast, HLOA produced the highest worst-case loss exceeding 154 kW, followed by WOA with approximately 130.21 kW, reflecting significant instability and a strong tendency to become trapped in poor local optima. Similarly, Jaya, PSO, and FLO exhibited higher worst-case losses compared with IFLO, indicating less reliable optimization performance.
Figure 6.
Statistical performance obtained from IFLO, FLO, BCO, HLOA, WOA, Jaya, and PSO under Scenario No.2.
4.1.3. Scenario No.3
The simultaneous optimal allocation and sizing of DGs, CBs, and NR for the RDS are studied in Scenario No.3, and the obtained results are presented in Table 5. For the proposed IFLO, the optimal NR was obtained by opening switches 69, 70, 12, 72, and 73. In addition, the optimal DG units were allocated at buses 61, 22, and 12 with sizes of 1659 kW, 277 kW, and 344 kW, respectively. Regarding reactive power compensation, CBs were optimally installed at buses 61 and 10 with sizes of 1200 kVAr and 300 kVAr, respectively. As a consequence, the active power losses were dramatically reduced to 6.113254 kW, representing the minimum loss value among all investigated optimization methods. The obtained results clearly indicate the superiority of the proposed IFLO compared with the competing techniques. Although WOA achieved a competitive loss value of 9.769472 kW and BCO obtained 10.47863 kW, both methods remained inferior to IFLO. Similarly, HLOA, Jaya, PSO, and FLO produced higher losses of 26.18097 kW, 20.5828 kW, 24.9819 kW, and 17.4042 kW, respectively. The substantial improvement achieved by IFLO confirms its strong optimization capability in handling the highly nonlinear and complex interactions among DGs placement, CBs, and NR.
Table 5.
DGs, CBs allocations and sizes with NR in Scenario No.3.
In addition, the convergence features of the proposed IFLO, the standard FLO, BCO, HLOA, WOA, Jaya, and PSO are displayed in Figure 7 for Scenario No.3. The IFLO outperformed BCO, HLOA, Jaya, PSO, WOA, and the standard FLO in terms of solution quality and loss minimization capability. Furthermore, the proposed IFLO exhibited more stable convergence behavior and better capability in identifying the optimal combination of DGs, CBs placement, and NR.
Figure 7.
Convergence behavior of the IFLO, FLO, BCO, HLOA, WOA, Jaya, and PSO under Scenario No.3.
Figure 8 and the corresponding statistical results summarize the performance of the investigated optimization algorithms under Scenario No.3, which considers the simultaneous allocation and sizing of DGs, capacitor banks, and network reconfiguration. Regarding the average performance, the proposed IFLO also demonstrated highly competitive results with an average loss value of 25.24331 kW, which is substantially lower than those obtained by HLOA, Jaya, WOA, and FLO. Although BCO recorded a comparable average value of 26.41734 kW and PSO achieved 28.64942 kW, IFLO still maintained superior overall optimization performance. The significantly high average losses observed for HLOA (109.9262 kW) and WOA (59.08331 kW) indicate unstable convergence characteristics and reduced optimization reliability. The maximum obtained losses further highlight the robustness of the proposed IFLO algorithm. IFLO achieved a maximum loss value of 39.60137 kW, which is considerably lower than those of HLOA, WOA, and FLO, whose maximum losses reached 199.4016 kW, 120.4337 kW, and 90.76009 kW, respectively. These large deviations demonstrate the inability of these algorithms to consistently avoid poor local solutions during repeated runs. The standard deviation values provide additional insight into the stability and consistency of the investigated methods. PSO achieved the smallest standard deviation value of 9.159276, indicating relatively stable convergence behavior. However, IFLO maintained a competitive standard deviation value of 12.7447 while simultaneously achieving significantly better minimum and average loss values. In contrast, HLOA, WOA, and FLO exhibited considerably larger deviations, confirming unstable search behavior and inconsistent optimization performance.
Figure 8.
Statistical performance obtained from IFLO, FLO, BCO, HLOA, WOA, Jaya, and PSO under Scenario No.3.
The comparative results presented in Table 6, Table 7 and Table 8 demonstrate the effectiveness and competitiveness of the proposed IFLO algorithm against several well-established optimization techniques reported in the literature. For Scenario No.1, IFLO achieved the lowest active power losses of 38.4235 kW, outperforming the Adaptive Cuckoo Search, Fireworks, Harmony Search, and Improved Sine–Cosine algorithms, while maintaining an acceptable minimum voltage profile of 0.9725 p.u. In Scenario No.2, IFLO produced the best overall performance by simultaneously achieving the lowest power losses (68.25 kW) and the highest minimum voltage (0.968 p.u.) compared with both the Gray Wolf Optimizer and the Non-dominated Sorting Genetic Algorithm. Similarly, for Scenario No.3, IFLO yielded the minimum power losses of 6.113 kW and the highest minimum voltage of 0.9939 p.u., surpassing Gray Wolf Optimizer, Bacterial Foraging Optimization, and Non-dominated Sorting Genetic Algorithm. These results confirm that the proposed IFLO algorithm consistently provides superior loss minimization while maintaining or improving voltage stability across different operating scenarios, highlighting its robustness, effectiveness, and practical suitability for RDS optimization problems.
Table 6.
Comparisons against reported results for Scenario No.1.
Table 7.
Comparisons against reported results for Scenario No.2.
Table 8.
Comparisons against reported results for Scenario No.3.
4.2. Large-Scale Radial IEEE 135-Bus Distribution Feeder
The large-scale 141 bus system is the 12.47 kV AES-Venezuela in the Caracas metropolitan region, which is modeled by 141 nodes with a total peak load of 12.19 MW and 6.2894 MVAr [35,36].
4.2.1. Scenario No.4
For Scenario No.4, simultaneous optimal allocation and sizing of DG together with NR for the studied RDS are considered. As illustrated in Table 9, the proposed IFLO algorithm is compared with BCO, HLOA, Jaya, PSO, WOA, and FLO, in terms of optimal capacitor placement, reconfiguration strategy, and active power loss minimization. The initial RDS exhibits high active power losses of 603.821 kW before applying any optimization process. After implementing DG allocation and feeder reconfiguration, all optimization techniques achieved substantial reductions in power losses due to improved reactive power compensation and enhanced feeder power flow distribution. However, the proposed IFLO algorithm achieved the best overall performance among all investigated methods. Using the IFLO algorithm, the optimal CBs were allocated at buses 95, 46, 94, 22, and 70 with capacitor sizes of 623, 2253, 944, 2305, and 118 KW, respectively. In addition, the optimal reconfiguration strategy was achieved through selecting the corresponding optimal open-switch configuration listed in Table 9. Hence, the active power losses were significantly reduced from 603.821 kW to 88.13137 kW, representing the minimum loss value among all compared optimization techniques. The obtained results clearly demonstrate the superiority of the proposed IFLO compared with the other algorithms. Although PSO achieved a competitive loss value of 99.9209 kW and HLOA reached 112.3304 kW, both methods remained inferior to IFLO. Similarly, BCO, Jaya, WOA, and FLO produced higher losses of 97.15055 kW, 138.748 kW, 113.7405 kW, and 218.3476 kW, respectively. These results confirm the strong capability of IFLO in efficiently solving the complex optimization problem associated with DG allocation and NR.
Table 9.
DGs allocations and sizes with NR in Scenario No.4.
Figure 9 illustrates the convergence behavior of seven optimization algorithms which are IFLO, FLO, BCO, HLOA, WOA, Jaya, and PSO, applied under Scenario No.4. Among all the compared algorithms, the proposed IFLO demonstrates the most superior convergence performance, achieving the lowest loss value of approximately 88 MW within just the first few iterations and maintaining that optimal level throughout the remaining 300 iterations. In contrast, BCO exhibits the poorest performance, beginning with losses close to 960 MW and converging very slowly, only reaching around 97 MW by the final iteration. HLOA also shows a sluggish convergence pattern, remaining relatively stagnant until around iteration 100 before dropping sharply to approximately 112 MW. The Jaya, PSO, and WOA algorithms converge more rapidly in the early stages but stabilize at loss values higher than IFLO, ranging between 114 and 138 MW. FLO, while initially converging well, displays an anomalous increase in losses around iterations 200–250 before eventually stabilizing, suggesting a degree of instability in its search mechanism. Hence, the figure clearly demonstrates the effectiveness and robustness of the IFLO algorithm in achieving faster convergence and lower power losses compared to its counterparts.
Figure 9.
Convergence behavior of the IFLO, FLO, BCO, HLOA, WOA, Jaya, and PSO under Scenario No.4.
Under Scenario No.4, Figure 10 and Table 10 illustrate the statistical performance of the investigated optimization algorithms, including BCO, HLOA, Jaya, PSO, WOA, FLO, and the proposed IFLO algorithm. The best overall result average performance of IFLO with an average loss value of 100.7768 kW, which is significantly lower than those obtained by the competing approaches. Although PSO achieved a relatively competitive average loss of 107.0063 kW, it still remained inferior to IFLO. On the other hand, HLOA and FLO exhibited extremely high average losses of 273.9294 kW and 349.6248 kW, respectively, indicating unstable search behavior and weak convergence performance. IFLO achieved a maximum loss value of only 114.5236 kW, which is substantially lower than the maximum losses obtained by all other optimization techniques. In particular, HLOA and FLO recorded very large maximum losses reaching 603.8209 kW and 578.3417 kW, respectively, demonstrating their inability to consistently avoid poor local solutions during repeated optimization runs. PSO achieved the lowest standard deviation value of 7.705824, indicating stable convergence behavior. However, IFLO maintained a closely competitive standard deviation value of 8.111434 while simultaneously achieving considerably better minimum and average loss values. In contrast, BCO, HLOA, WOA, and FLO exhibited significantly larger deviations, reflecting unstable convergence characteristics and inconsistent optimization performance.
Figure 10.
Boxplot for IFLO, FLO, BCO, HLOA, WOA, Jaya, and PSO under Scenario No.4.
Table 10.
Statistical performance obtained from IFLO, FLO, BCO, HLOA, WOA, Jaya, and PSO under Scenario No.4.
4.2.2. Scenario No.5
Using the IFLO algorithm, the optimal capacitor banks were allocated at buses 73, 31, 17, 55, and 92 with capacitor sizes of 600 kVAr, 900 kVAr, 600 kVAr, 2100 kVAr, and 1800 kVAr, respectively. In addition, the optimal reconfiguration strategy was achieved through selecting the corresponding optimal open-switch configuration listed in Table 11. As a result, the active power losses were significantly reduced from 603.821 kW to 177.7582 kW, representing the minimum loss value among all compared optimization techniques. The obtained results clearly demonstrate the superiority of the proposed IFLO compared with the other algorithms. Although PSO achieved a competitive loss value of 183.4135 kW and HLOA reached 189.3558 kW, both methods remained inferior to IFLO. Similarly, BCO, Jaya, WOA, and FLO produced higher losses of 204.8384 kW, 237.0411 kW, 229.2493 kW, and 197.7438 kW, respectively. These results confirm the strong capability of IFLO in efficiently solving the complex optimization problem associated with CB allocation and NR.
Table 11.
CBs allocations and sizes with NR in Scenario No.5.
Furthermore, the convergence features of the proposed IFLO, the standard FLO, BCO, HLOA, WOA, Jaya, and PSO are displayed in Figure 11 for Scenario No.5. Compared with other optimization techniques, the IFLO outperformed BCO, HLOA, Jaya, PSO, WOA, and the standard FLO in terms of solution quality and loss minimization capability. Therefore, the proposed IFLO exhibited more stable convergence behavior and better capability in identifying the optimal combination of CB placement and network topology.
Figure 11.
Convergence behavior of the IFLO, FLO, BCO, HLOA, WOA, Jaya, and PSO under Scenario No.5.
Moreover, Table 12 and Figure 12 manifest the statistical performance comparison of the proposed IFLO algorithm compared with BCO, HLOA, Jaya, PSO, WOA, and the original FLO algorithm under Scenario No.5. To illustrate, IFLO achieved an average loss value of 199.8492 kW, which is significantly lower than those obtained by BCO, HLOA, Jaya, WOA, and FLO. Although PSO achieved a slightly close average value of 200.2657 kW, IFLO still maintained superior overall performance. In contrast, HLOA and FLO exhibited very high average losses of 408.6496 kW and 369.4296 kW, respectively, indicating unstable convergence behavior and weak optimization reliability. Additionally, IFLO recorded a maximum loss value of only 213.0913 kW, which is considerably lower than the maximum losses obtained by all other methods. Particularly, HLOA and FLO reached extremely large maximum losses of 603.8209 kW, demonstrating severe instability and a high tendency to become trapped in poor local optima during repeated runs. Similarly, BCO, Jaya, and WOA showed noticeably larger maximum values compared with IFLO. For standard deviation, PSO achieved the lowest value of 9.32116, while IFLO achieved a closely competitive value of 9.523294 with significantly better minimum and average loss performance. This demonstrates that IFLO maintains excellent convergence stability while simultaneously achieving higher-quality solutions. On the other hand, HLOA and FLO exhibited very large deviations of 113.1919 and 95.34837, respectively, confirming unstable search behavior and inconsistent convergence performance.
Table 12.
Statistical performance obtained from IFLO, FLO, BCO, HLOA, WOA, Jaya, and PSO under Scenario No.5.
Figure 12.
Boxplot for IFLO, FLO, BCO, HLOA, WOA, Jaya, and PSO under Scenario No.5.
4.2.3. Scenario No.6
In this scenario, the simultaneous allocation and sizing of DGs, CBs, and NR for the practical 141 large-scale RDS. Using the IFLO algorithm, the optimal DG units were allocated at buses 5, 7, 45, 50, and 65 with capacities of 3300 kW, 2100 kW, 900 kW, 300 kW, and 1200 kW, respectively. Additionally, the capacitor banks were optimally installed at buses 27, 15, 64, 100, and 46 with ratings of 1828 kVAr, 796 kVAr, 1203 kVAr, 135 kVAr, and 3351 kVAr, respectively. The optimal NR was also achieved through the corresponding switch operations listed in Table 13. Hence, the active power losses were significantly reduced to 44.041 kW, which represents the minimum loss value among all investigated optimization methods. The obtained results clearly verify the superiority of the proposed IFLO algorithm. Although PSO achieved a competitive loss value of 50.36846 kW and BCO recorded 52.00956 kW, both methods remained inferior to IFLO. Similarly, WOA, Jaya, and HLOA resulted in higher losses of 54.58365 kW, 85.081 kW, and 88.98195 kW, respectively. Moreover, the conventional FLO exhibited the weakest performance with losses reaching 120.2839 kW, highlighting the substantial improvement achieved by the proposed enhancements incorporated into IFLO.
Table 13.
DGs, CBs allocations and sizes with NR in Scenario No.6.
The convergence features of the proposed IFLO, the standard FLO, BCO, HLOA, WOA, Jaya, and PSO are displayed in Figure 13 for Scenario No.6. In this figure, the IFLO outperformed BCO, HLOA, Jaya, PSO, WOA, and the standard FLO in terms of solution quality and loss minimization capability.
Figure 13.
Convergence behavior of the IFLO, FLO, BCO, HLOA, WOA, Jaya, and PSO under Scenario No.6.
The statistical performance for Scenario No.6 is investigated using IFLO, PSO, BCO, WOA, Jaya, HLOA, and FLO over 25 independent runs as manifested in Table 14 and Figure 14. The obtained results clearly demonstrate the superiority of the proposed IFLO algorithm compared with all competing approaches. IFLO achieved the lowest minimum active power loss value of 44.041 kW, outperforming PSO, BCO, WOA, Jaya, HLOA, and FLO, which achieved minimum losses of 50.36846 kW, 52.00956 kW, 54.58365 kW, 85.081 kW, 88.98195 kW, and 120.2839 kW, respectively. These findings confirm the strong exploitation capability of IFLO in identifying highly optimal solutions for the complex optimization problem associated with simultaneous DG allocation, capacitor placement, and feeder reconfiguration. In terms of average performance, IFLO achieved the best result with an average loss value of 49.44533 kW, which is significantly lower than those obtained by all other optimization methods. Although PSO achieved a relatively competitive average loss of 64.40598 kW, it remained noticeably inferior to IFLO. Conversely, HLOA and FLO exhibited very high average losses of 269.2756 kW and 314.1641 kW, respectively, indicating unstable convergence behavior and weak optimization reliability.
Table 14.
Statistical performance obtained from IFLO, FLO, BCO, HLOA, WOA, Jaya, and PSO under Scenario No.6.
Figure 14.
Boxplot for IFLO, FLO, BCO, HLOA, WOA, Jaya, and PSO under Scenario No.6.
Moreover, the maximum obtained losses further validate the robustness and consistency of the proposed IFLO algorithm. IFLO recorded a maximum loss value of only 58.23477 kW, which is substantially lower than the maximum losses achieved by the competing techniques. In particular, FLO and HLOA exhibited extremely high maximum losses reaching 583.2919 kW and 517.4939 kW, respectively, reflecting severe instability and a strong tendency to become trapped in poor local optima during repeated optimization runs. The standard deviation values provide additional evidence regarding the stability and repeatability of the investigated methods. IFLO achieved the lowest standard deviation value of 4.834051 among all algorithms, indicating highly stable convergence behavior and excellent consistency over multiple runs. Although PSO achieved a relatively low deviation of 6.811451, IFLO still maintained superior solution quality with significantly lower minimum and average loss values.
To further assess the convergence behavior and optimization efficiency of the proposed IFLO algorithm, a comparative analysis was conducted using the convergence and solution quality indicators presented in Table 15. The results clearly demonstrate the superior convergence capability of IFLO. Among all tested algorithms, IFLO reached the target fitness value in only 66 iterations, representing the fastest convergence performance. In comparison, WOA required 108 iterations, PSO required 175 iterations, BCO required 182 iterations, Jaya required 200 iterations, while both HLOA and FLO required 236 and 200 iterations, respectively. These results indicate that IFLO was able to identify promising search regions considerably earlier than the competing methods and rapidly refine the obtained solutions toward the optimum.
Table 15.
Convergence and solution quality of BCO, HLOA, WOA, Jaya, FLO, IFLO, and PSO obtained for Case 6.
In terms of solution quality, IFLO achieved the lowest final fitness value, outperforming all other algorithms and significantly surpassing the target fitness value of 55. The performance improvement percentage further confirms the superiority of IFLO. The proposed algorithm achieved the highest PI% value of 92.69%, indicating the largest reduction between the initial and final fitness values. This improvement exceeds those obtained by PSO (91.66%), BCO (91.39%), WOA (90.96%), Jaya (85.91%), HLOA (85.26%), and FLO (80.08%). The high PI% demonstrates that IFLO consistently extracted more useful information from the search process and generated greater overall optimization gains.
A similar observation can be made from the convergence rate metric. IFLO achieved the highest CR value of 4.7798, followed by BCO (4.7400), WOA (4.7271), Jaya (4.5746), and PSO (4.3851). In contrast, HLOA and FLO recorded significantly lower convergence rates of 2.3075 and 2.1750, respectively. The superior CR value attained by IFLO indicates a more rapid average reduction in the objective function throughout the optimization process, reflecting an improved balance between global exploration and local exploitation.
5. Conclusions
This paper presented an IFLO algorithm for the simultaneous optimization of NR, DG allocation, and CB placement in radial distribution systems. The proposed IFLO enhances the original FLO algorithm through adaptive search mechanisms and a defensive strategy inspired by the anti-predator behavior of frilled lizards, thereby improving the balance between exploration and exploitation and reducing the likelihood of premature convergence.
The effectiveness of the proposed approach was validated on the IEEE 69-bus radial distribution system under different operational scenarios. The obtained results demonstrate that IFLO consistently achieves lower power losses compared with several well-established optimization techniques, including BCO, HLOA, Jaya, PSO, WOA, and the original FLO. In Scenario No.1, involving simultaneous network reconfiguration and DG allocation, IFLO achieved the minimum active power loss of 38.4235 kW. Similarly, in Scenario No.2, involving network reconfiguration and capacitor bank placement, IFLO obtained the lowest power loss of 68.2459 kW. These results confirm the capability of IFLO to identify high-quality solutions for complex mixed-integer optimization problems encountered in distribution network planning and operation.
Beyond the final solution quality, the statistical performance analysis further demonstrates the robustness and reliability of the proposed algorithm. IFLO achieved the lowest average loss values and the smallest standard deviation among the competing methods, indicating stable convergence behavior and reduced sensitivity to stochastic variations. Moreover, the convergence characteristics reveal that the proposed improvements accelerate the search process and enhance the ability of the algorithm to escape local optima, enabling faster attainment of high-quality solutions compared with the original FLO and other benchmark algorithms.
The results also highlight the practical applicability of IFLO for modern distribution networks considering the large-scale 141-bus RDS by effectively determining optimal switching configurations and optimal locations and sizes of DG units and capacitor banks while satisfying operational constraints, including power balance, voltage limits, radiality requirements, and thermal loading restrictions.
Although the obtained results demonstrate the superior performance of IFLO for the investigated test system and operating conditions, future research can focus on extending IFLO to multi-objective optimization frameworks that simultaneously consider power loss minimization, voltage stability enhancement, reliability improvement, emission reduction, and economic objectives. Additional investigations can also include the integration of renewable energy sources, electric vehicle charging stations, demand response programs, and uncertainty modeling associated with renewable generation and load forecasting.
Author Contributions
Conceptualization, A.S.A., M.H.A., A.R.G. and A.M.S.; Methodology, A.M.S.; Software, A.M.S.; Validation, M.H.A., A.R.G. and A.M.S.; Formal analysis, A.S.A.; Investigation, A.S.A. and A.R.G.; Data curation, M.H.A. and A.R.G.; Writing—original draft, A.R.G.; Writing—review & editing, A.S.A., M.H.A., A.R.G. and A.M.S.; Visualization, A.S.A.; Supervision, M.H.A. and A.M.S. All authors have read and agreed to the published version of the manuscript.
Funding
Prince Sattam bin Abdulaziz University (PSAU/2025/01/35356).
Data Availability Statement
The original contributions presented in this study are included in the article. Further inquiries can be directed to the corresponding author.
Acknowledgments
The authors extend their appreciation to Prince Sattam bin Abdulaziz University for funding this research work through the project number (PSAU/2025/01/35356).
Conflicts of Interest
The authors declare no conflicts of interest.
References
- Taylor, J.A.; Hover, F.S. Convex models of distribution system reconfiguration. IEEE Trans. Power Syst. 2012, 27, 1407–1413. [Google Scholar] [CrossRef] [Scilit]
- Abur, A. A modified linear programming method for distribution system reconfiguration. Int. J. Electr. Power Energy Syst. 1996, 18, 474. [Google Scholar] [CrossRef] [Scilit]
- Jabr, R.A.; Singh, R.; Pal, B.C. Minimum loss network reconfiguration using mixed-integer convex programming. IEEE Trans. Power Syst. 2012, 27, 1106–1115. [Google Scholar] [CrossRef] [Scilit]
- Su, C.-T.; Chang, C.-F.; Chiou, J.-P. Distribution network reconfiguration for loss reduction by ant colony search algorithm. Electr. Power Syst. Res. 2005, 75, 190–199. [Google Scholar] [CrossRef] [Scilit]
- Abdelaziz, M. Distribution network reconfiguration using a genetic algorithm with varying population size. Electr. Power Syst. Res. 2017, 142, 9–11. [Google Scholar] [CrossRef] [Scilit]
- Quadri, I.A.; Bhowmick, S. A hybrid technique for simultaneous network reconfiguration and optimal placement of distributed generation resources. Soft Comput. 2020, 24, 11315–11336. [Google Scholar] [CrossRef] [Scilit]
- Nguyen, T.T.; Nguyen, N.A.; Duong, T.L. A novel method based on coyote algorithm for simultaneous network reconfiguration and distribution generation placement. Ain Shams Eng. J. 2020, 12, 665–676. [Google Scholar] [CrossRef] [Scilit]
- Raza, A.; Zahid, M.; Chen, J.; Qaisar, S.M.; Ilahi, T.; Waqar, A.; Alzahrani, A. A Novel Integration Technique for Optimal Location & Sizing of DG Units with Reconfiguration in Radial Distribution Networks Considering Reliability. IEEE Access 2023, 11, 123610–123624. [Google Scholar] [CrossRef] [Scilit]
- Srinivasa Rao, R.; Ravindra, K.; Satish, K.; Narasimham, S.V.L. Power loss minimization in distribution system using network reconfiguration in the presence of distributed generation. IEEE Trans. Power Syst. 2013, 28, 317–325. [Google Scholar] [CrossRef] [Scilit]
- Lotfipour, A.; Afrakhte, H. A discrete Teaching-Learning-Based Optimization algorithm to solve distribution system reconfiguration in presence of distributed generation. Int. J. Electr. Power Energy Syst. 2016, 82, 264–273. [Google Scholar] [CrossRef] [Scilit]
- Nguyen, T.T.; Truong, A.V.; Phung, T.A. A novel method based on adaptive cuckoo search for optimal network reconfiguration and distributed generation allocation in distribution network. Int. J. Electr. Power Energy Syst. 2016, 78, 801–815. [Google Scholar] [CrossRef] [Scilit]
- Sedighizadeh, M.; Dakhem, M.; Sarvi, M.; Kordkheili, H.H. Optimal reconfiguration and capacitor placement for power loss reduction of distribution system using improved binary particle swarm optimization. Int. J. Energy Environ. Eng. 2014, 5, 3. [Google Scholar] [CrossRef] [Scilit]
- Rao, R.S. An hybrid approach for loss reduction in distribution systems using Harmony Search Algorithm. World Acad. Sci. Eng. Technol. 2009, 39, 461–467. [Google Scholar]
- Farahani, V.; Vahidi, B.; Abyaneh, H.A. Reconfiguration and capacitor placement simultaneously for energy loss reduction based on an improved reconfiguration method. IEEE Trans. Power Syst. 2012, 27, 587–595. [Google Scholar] [CrossRef] [Scilit]
- Beirami, M.; Naghdalian, S.; Aliabadi, M.H. Probabilistic multiobjective reconfiguration considering the optimal location of shunt capacitors and distributed generations in distribution network. Int. Trans. Electr. Energy Syst. 2021, 31, e12979. [Google Scholar] [CrossRef] [Scilit]
- Shaheen, A.; Elsayed, A.; Ginidi, A.; El-Sehiemy, R.; Elattar, E. Reconfiguration of electrical distribution network-based DG and capacitors allocations using artificial ecosystem optimizer: Practical case study. Alex. Eng. J. 2022, 61, 6105–6118. [Google Scholar] [CrossRef] [Scilit]
- Jayabarathi, T.; Raghunathan, T.; Mithulananthan, N.; Cherukuri, S.; Sai, G.L. Enhancement of distribution system performance with reconfiguration, distributed generation and capacitor bank deployment. Heliyon 2024, 10, e26343. [Google Scholar] [CrossRef] [Scilit] [PubMed]
- Mohammadi, M.; Rozbahani, A.M.; Bahmanyar, S. Power loss reduction of distribution systems using BFO based optimal reconfiguration along with DG and shunt capacitor placement simultaneously in fuzzy framework. J. Cent. South Univ. 2017, 24, 90–103. [Google Scholar] [CrossRef] [Scilit]
- Abu Falahah, I.; Al-Baik, O.; Alomari, S.; Bektemyssova, G.; Gochhait, S.; Leonova, I.; Malik, O.P.; Werner, F.; Dehghani, M. Frilled Lizard Optimization: A Novel Bio-Inspired Optimizer for Solving Engineering Applications. Comput. Mater. Contin. 2024, 79, 3631–3678. [Google Scholar] [CrossRef] [Scilit]
- Zhao, W.; Xie, Y.; Wang, L.; Zhang, Z.; Khodadadi, N.; Mirjalili, S. An effective Bezier curve-based optimization (BCO) for large-scale numerical problems and 3D unmanned aerial vehicle path planning with efficient multiple threats evasion. Adv. Eng. Inform. 2026, 73, 104524. [Google Scholar] [CrossRef] [Scilit]
- Peraza-Vázquez, H.; Peña-Delgado, A.; Merino-Treviño, M.; Morales-Cepeda, A.; Sinha, N. A novel metaheuristic inspired by horned lizard defense tactics. Artif. Intell. Rev. 2024, 57, 59. [Google Scholar] [CrossRef] [Scilit]
- Mirjalili, S.; Lewis, A. The Whale Optimization Algorithm. Adv. Eng. Softw. 2016, 95, 51–67. [Google Scholar] [CrossRef] [Scilit]
- Rao, R.V. Jaya: An Advanced Optimization Algorithm and Its Engineering Applications; Springer Nature: Cham, Switzerland, 2018. [Google Scholar] [CrossRef] [Scilit]
- Kumar, M.; Raman, J.; Priya, P. Particle swarm optimization. In Proceedings of the IEEE International Conference on Neural Networks-Conference Proceedings, Perth, Australia, 27 November–1 December 1995. [Google Scholar] [CrossRef] [Scilit]
- Shaheen, A.; El-Sehiemy, R.; Kamel, S.; Selim, A. Optimal Operational Reliability and Reconfiguration of Electrical Distribution Network Based on Jellyfish Search Algorithm. Energies 2022, 15, 6994. [Google Scholar] [CrossRef] [Scilit]
- Ali, S.A.; Mohammed, H.A.; Ahmed, R.G.; Abdullah, M.S. Improved Artificial Hummingbird Algorithm for Optimal Allocation of SVCs in Distribution Networks to Maximize Energy Efficiency. J. Mod. Power Syst. Clean Energy 2026, 14, 261–272. [Google Scholar] [CrossRef] [Scilit]
- Moustafa, G.; Elshahed, M.; Ginidi, A.R.; Shaheen, A.M.; Mansour, H.S.E. A Gradient-Based Optimizer with a Crossover Operator for Distribution Static VAR Compensator (D-SVC) Sizing and Placement in Electrical Systems. Mathematics 2023, 11, 1077. [Google Scholar] [CrossRef] [Scilit]
- Shaheen, A.M.; Elsayed, A.M.; El-Sehiemy, R.A.; Ginidi, A.R.; Elattar, E. Optimal management of static volt-ampere-reactive devices and distributed generations with reconfiguration capability in active distribution networks. Int. Trans. Electr. Energy Syst. 2021, 31, e13126. [Google Scholar] [CrossRef] [Scilit]
- Shaheen, A.M.; El-Sehiemy, R.A. Enhanced feeder reconfiguration in primary distribution networks using backtracking search technique. Aust. J. Electr. Electron. Eng. 2020, 17, 196–202. [Google Scholar] [CrossRef] [Scilit]
- Bharath, S.; Vasuki, A. Adaptive energy loss optimization in distributed networks using reinforcement learning-enhanced crow search algorithm. Sci. Rep. 2025, 15, 12165. [Google Scholar] [CrossRef] [Scilit] [PubMed]
- El-Ela, A.A.A.; El-Sehiemy, R.A.; Allam, S.M.; Shaheen, A.M.; Nagem, N.A.; Sharaf, A.M. Renewable Energy Micro-Grid Interfacing: Economic and Environmental Issues. Electronics 2022, 11, 815. [Google Scholar] [CrossRef] [Scilit]
- Imran, A.M.; Kowsalya, M.; Kothari, D. A novel integration technique for optimal network reconfiguration and distributed generation placement in power distribution networks. Int. J. Electr. Power Energy Syst. 2014, 63, 461–472. [Google Scholar] [CrossRef] [Scilit]
- Raut, U.; Mishra, S. An improved sine–cosine algorithm for simultaneous network reconfiguration and DG allocation in power distribution systems. Appl. Soft Comput. J. 2020, 92, 106293. [Google Scholar] [CrossRef] [Scilit]
- Gallano, R.J.C.; Nerves, A.C. Multi-objective optimization of distribution network reconfiguration with capacitor and distributed generator placement. In Proceedings of the IEEE Region 10 Annual International Conference, Proceedings/TENCON, Bangkok, Thailand, 22–25 October 2014. [Google Scholar] [CrossRef] [Scilit]
- Khodr, H.; Olsina, F.; Jesus, P.D.O.-D.; Yusta, J. Maximum savings approach for location and sizing of capacitors in distribution systems. Electr. Power Syst. Res. 2008, 78, 1192–1203. [Google Scholar] [CrossRef] [Scilit]
- Nasef, A.; Shaheen, A.; Khattab, H. Local and remote control of automatic voltage regulators in distribution networks with different variations and uncertainties: Practical cases study. Electr. Power Syst. Res. 2022, 205, 107773. [Google Scholar] [CrossRef] [Scilit]
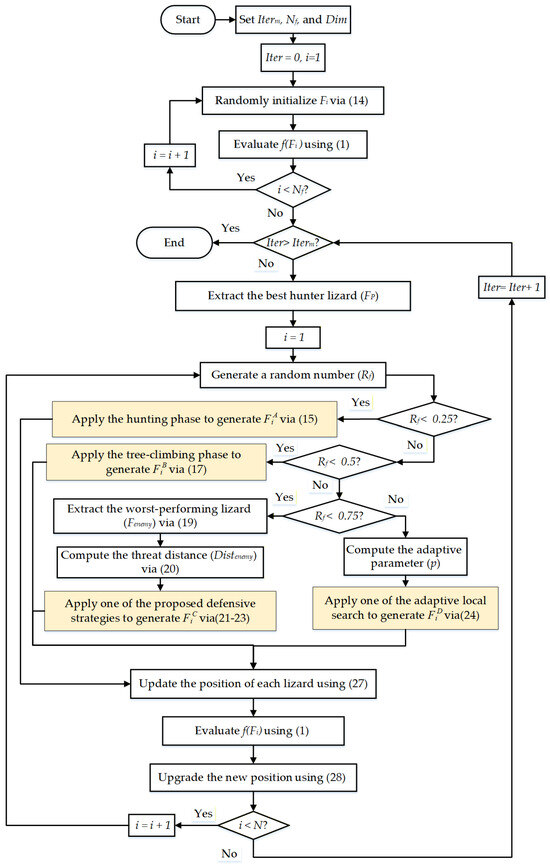
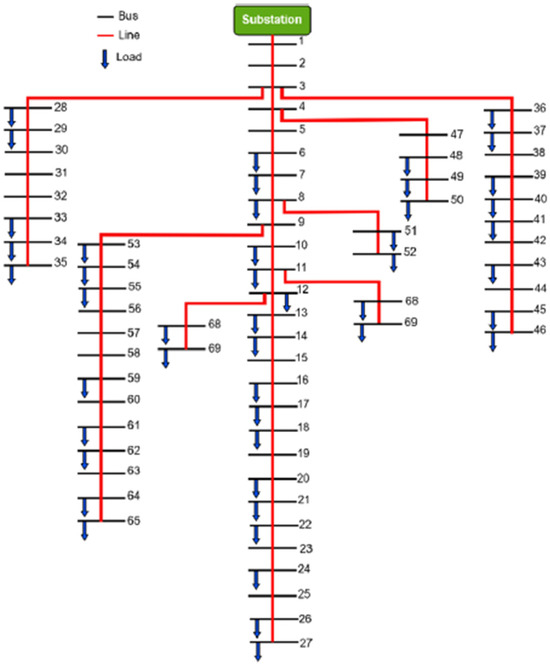
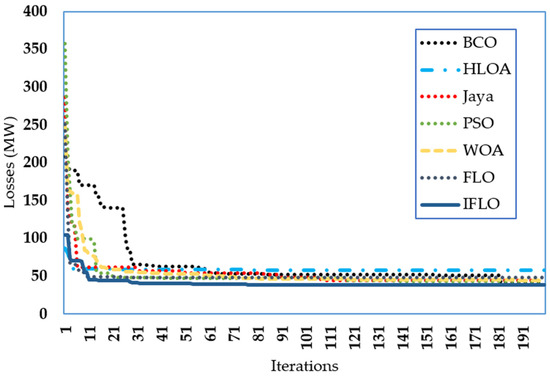
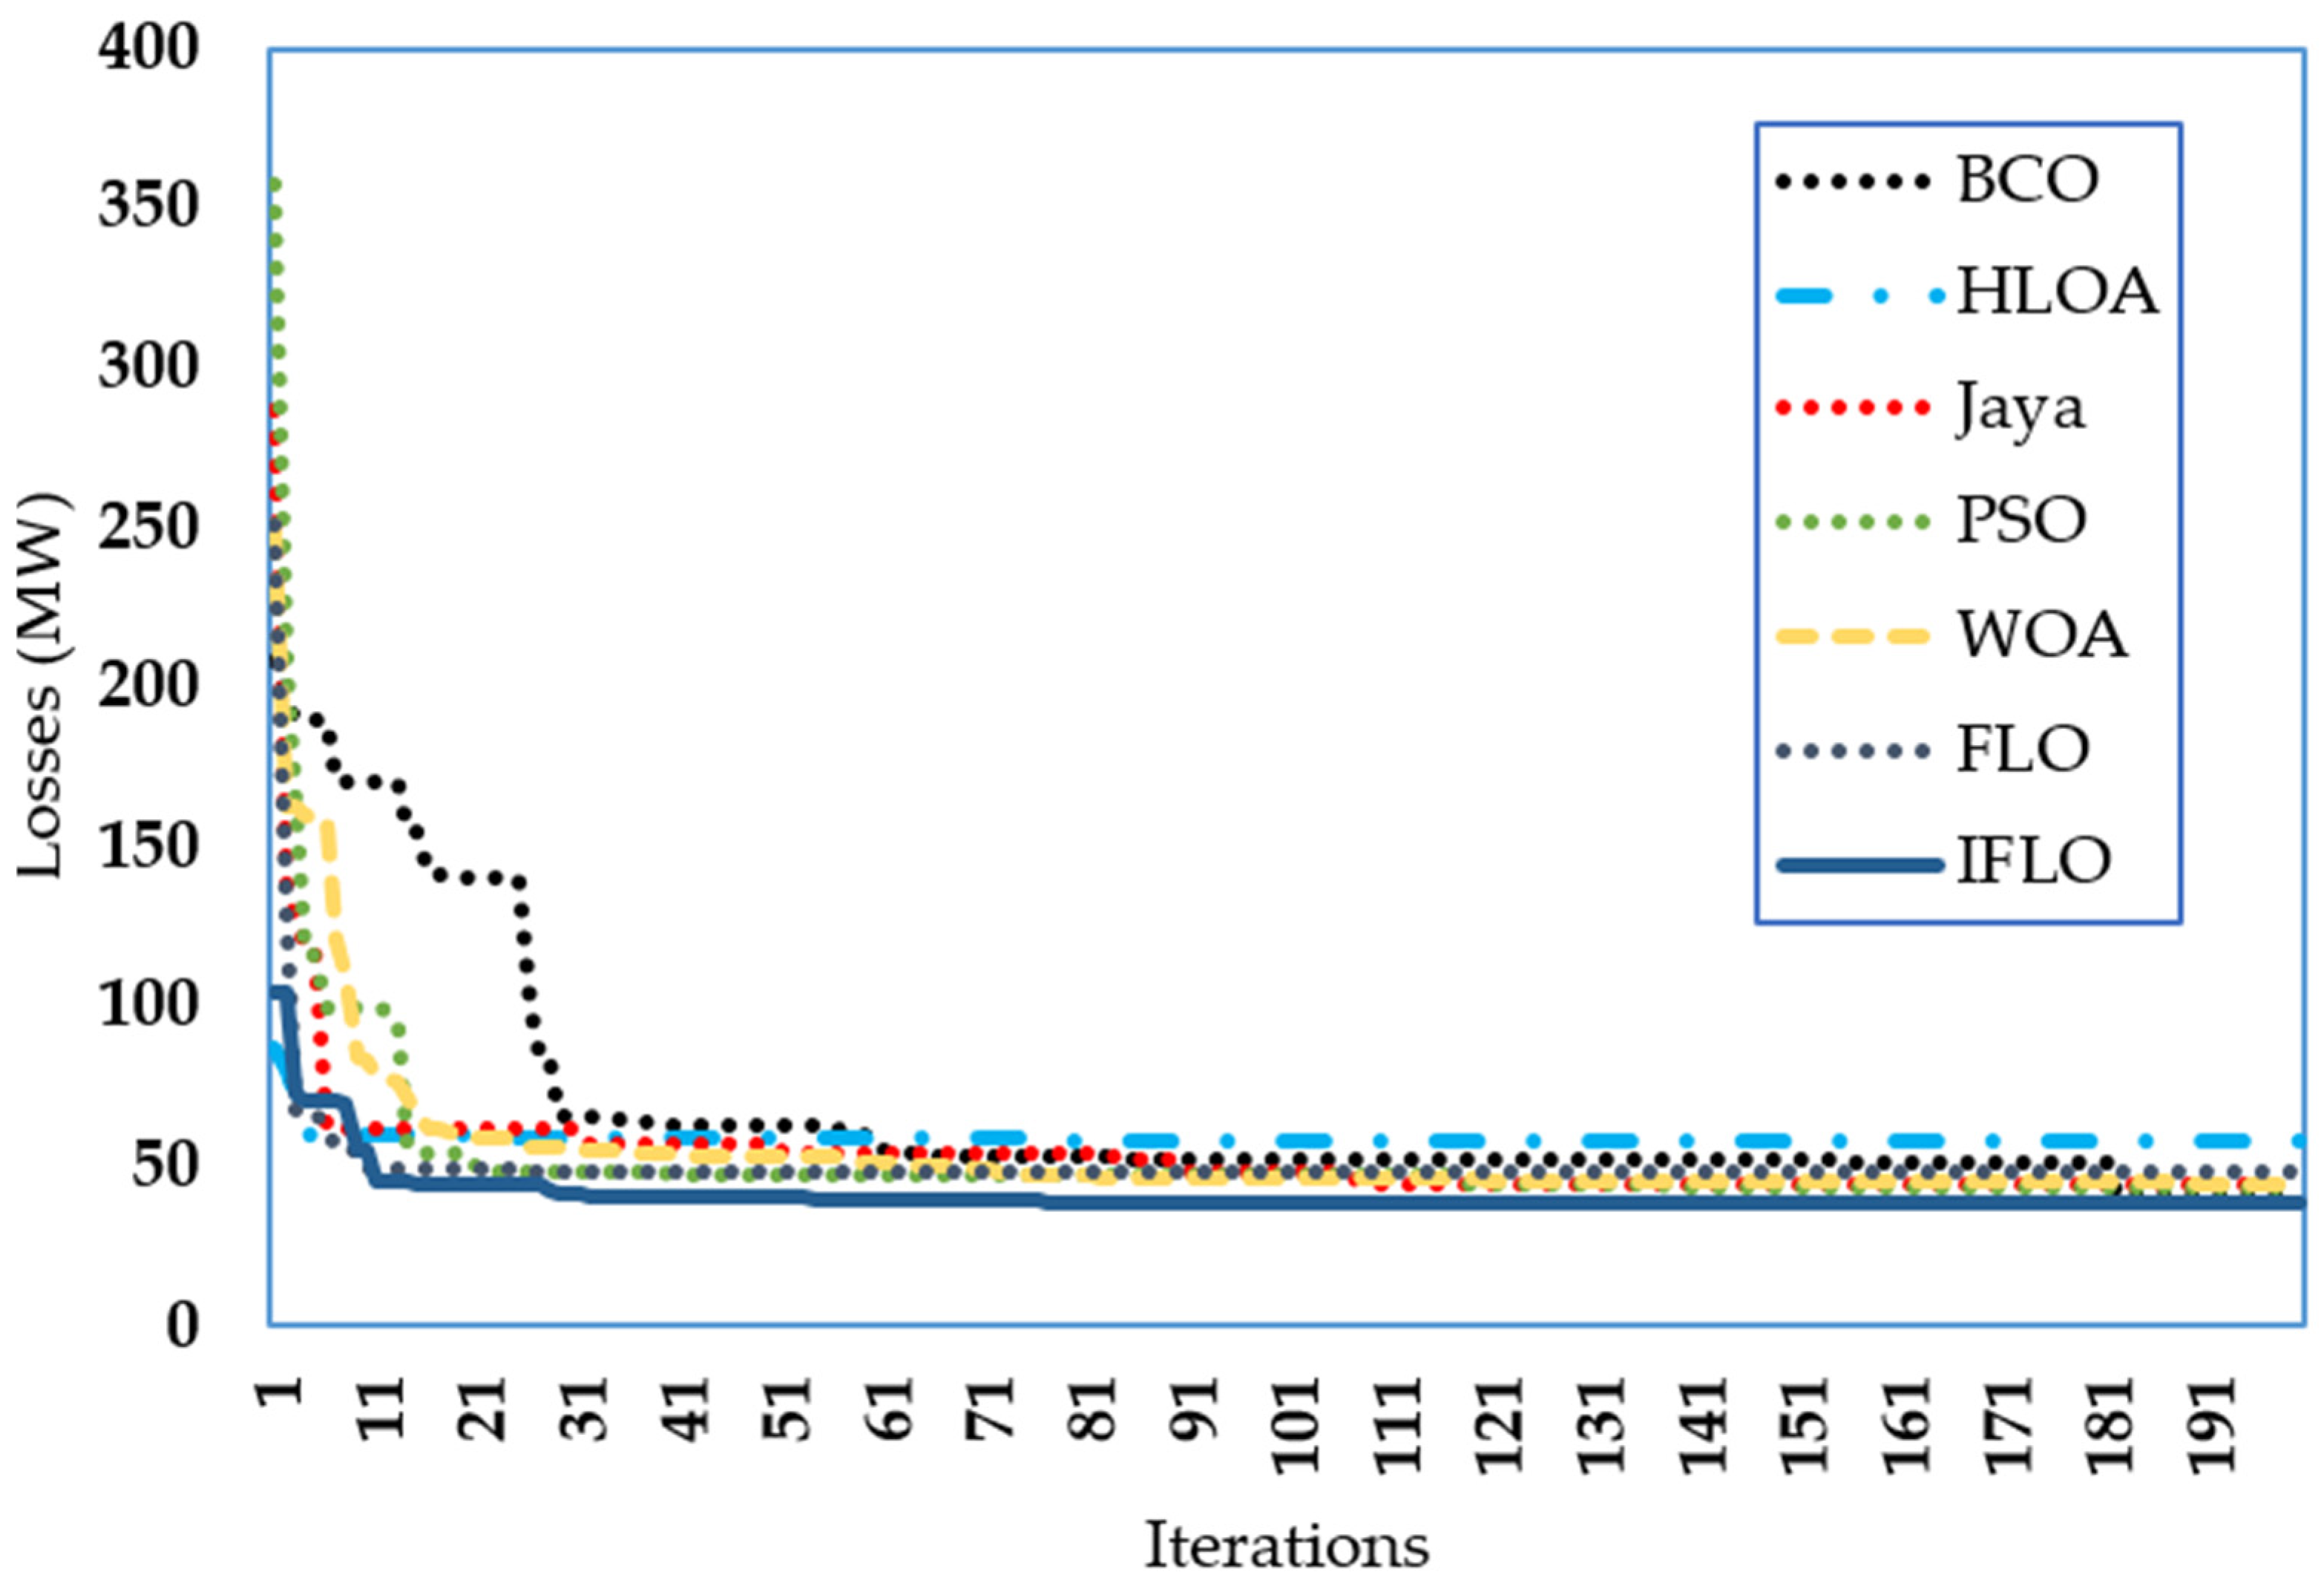
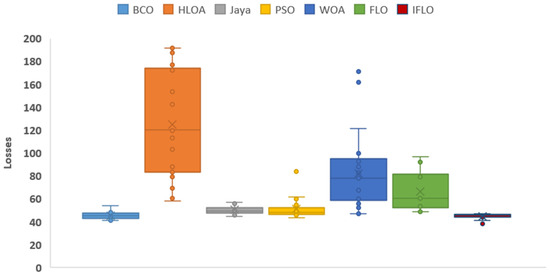
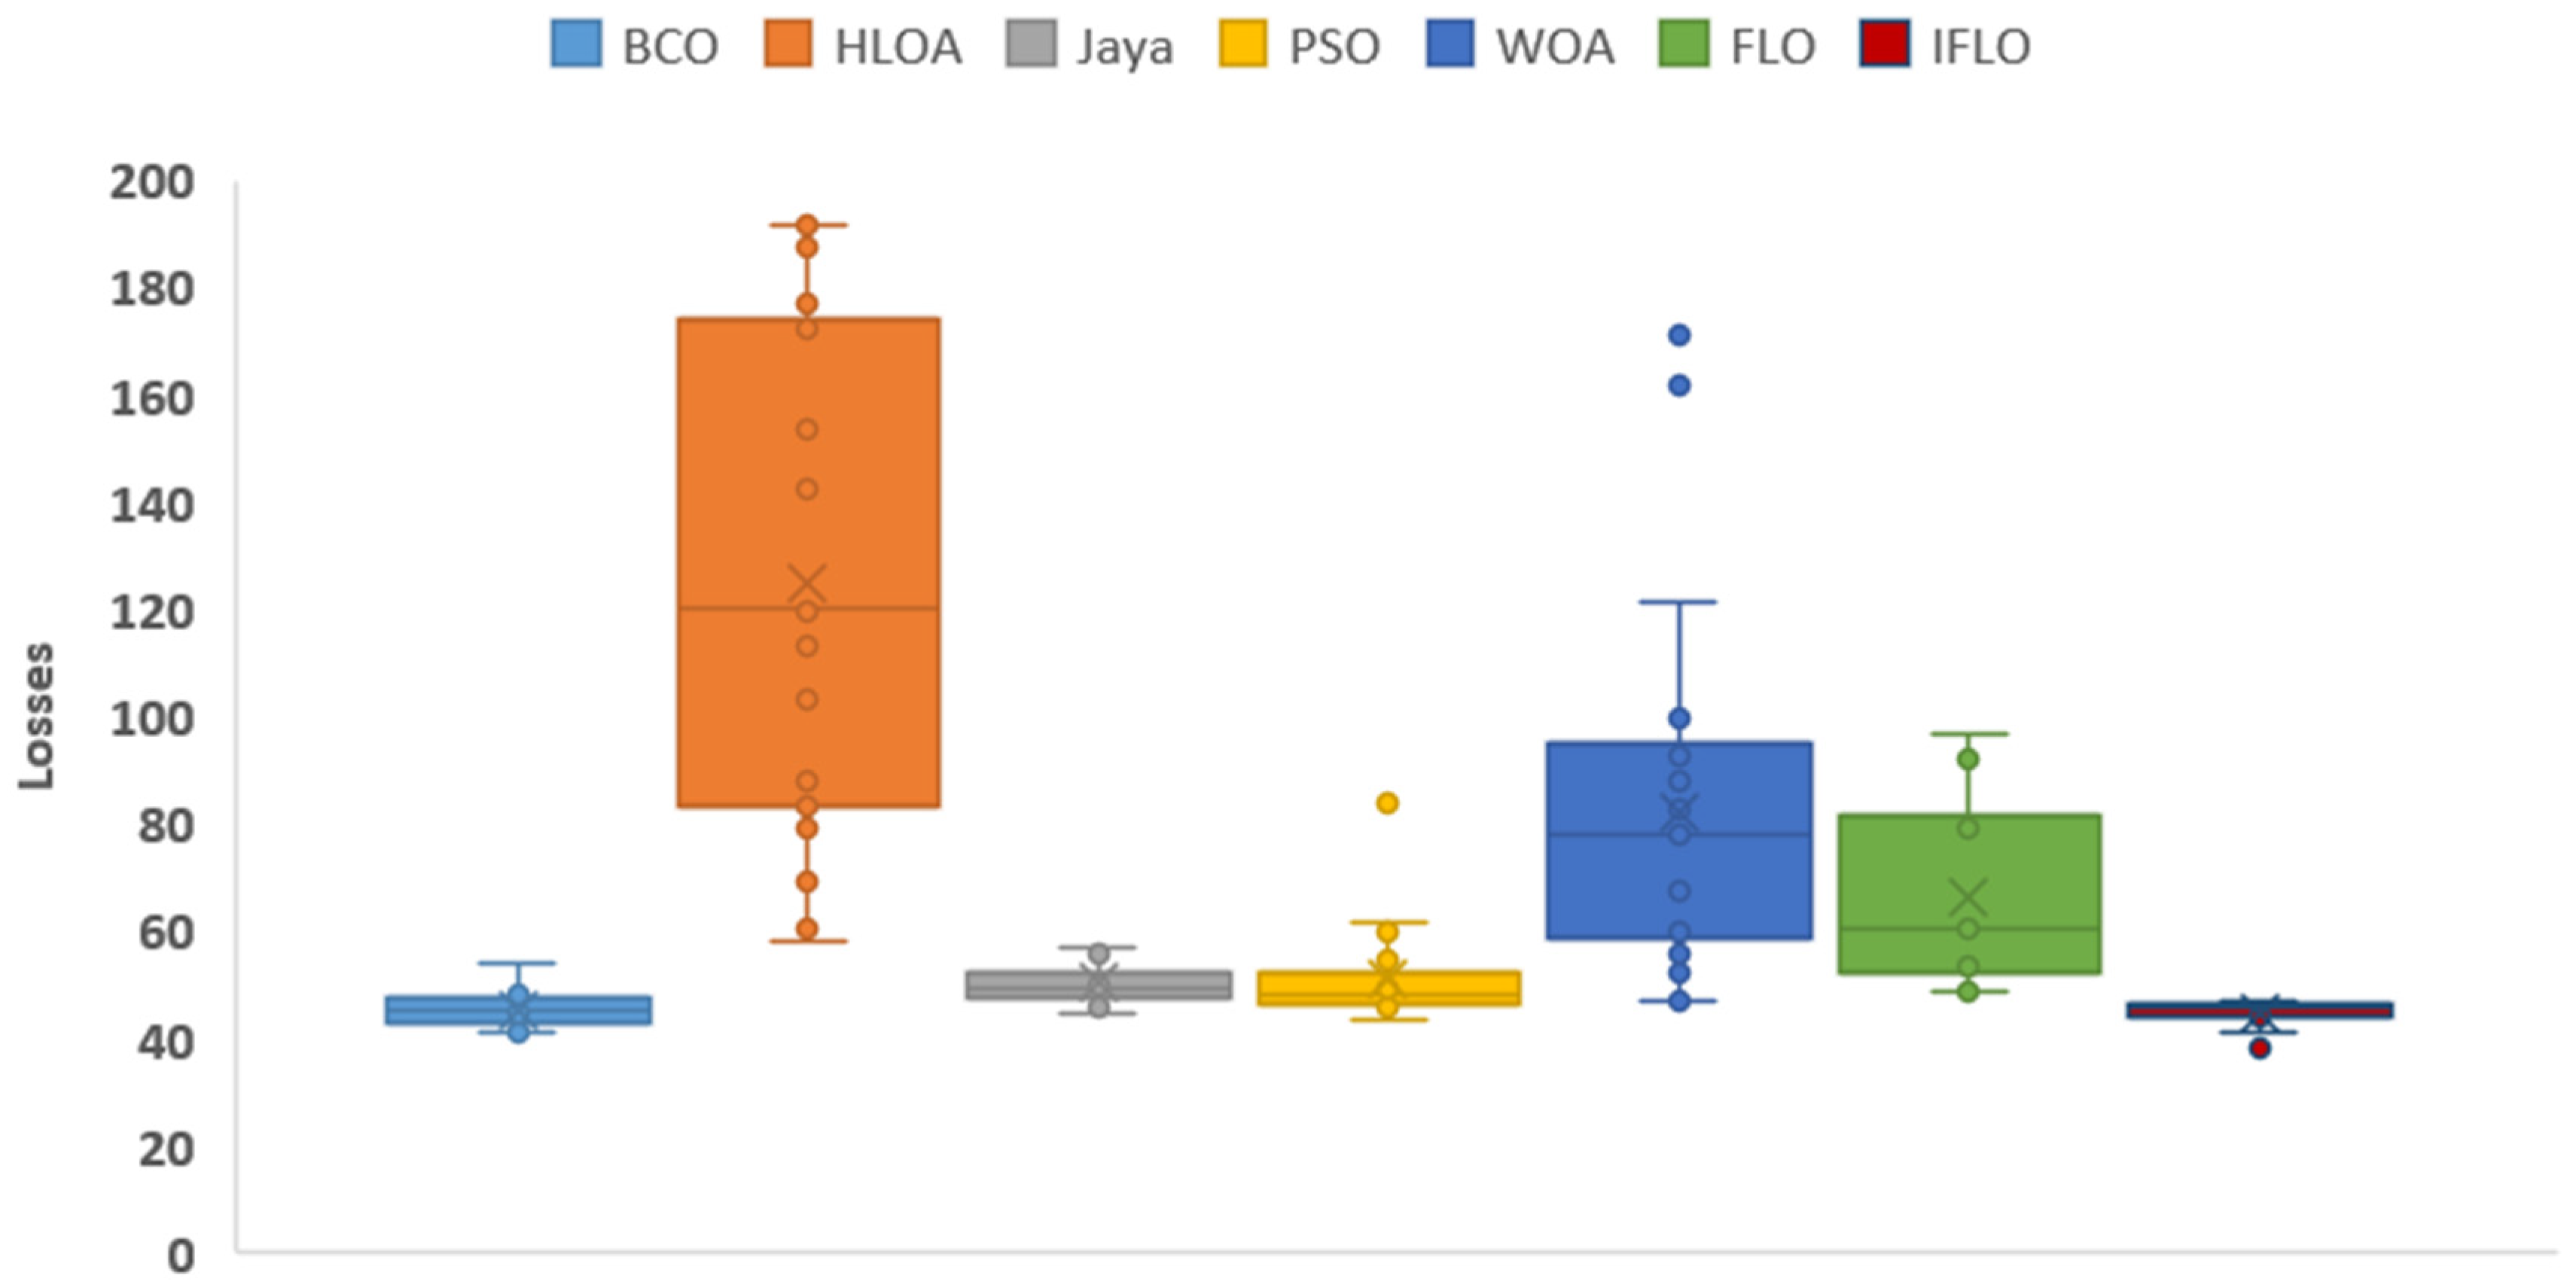
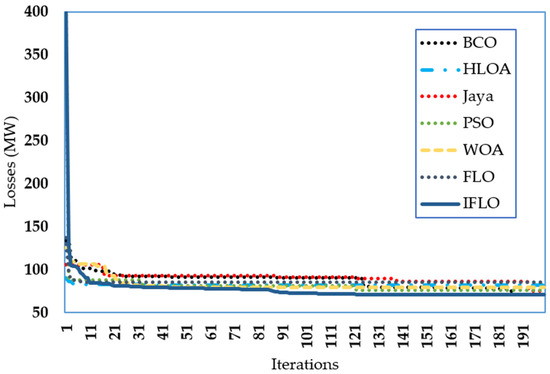
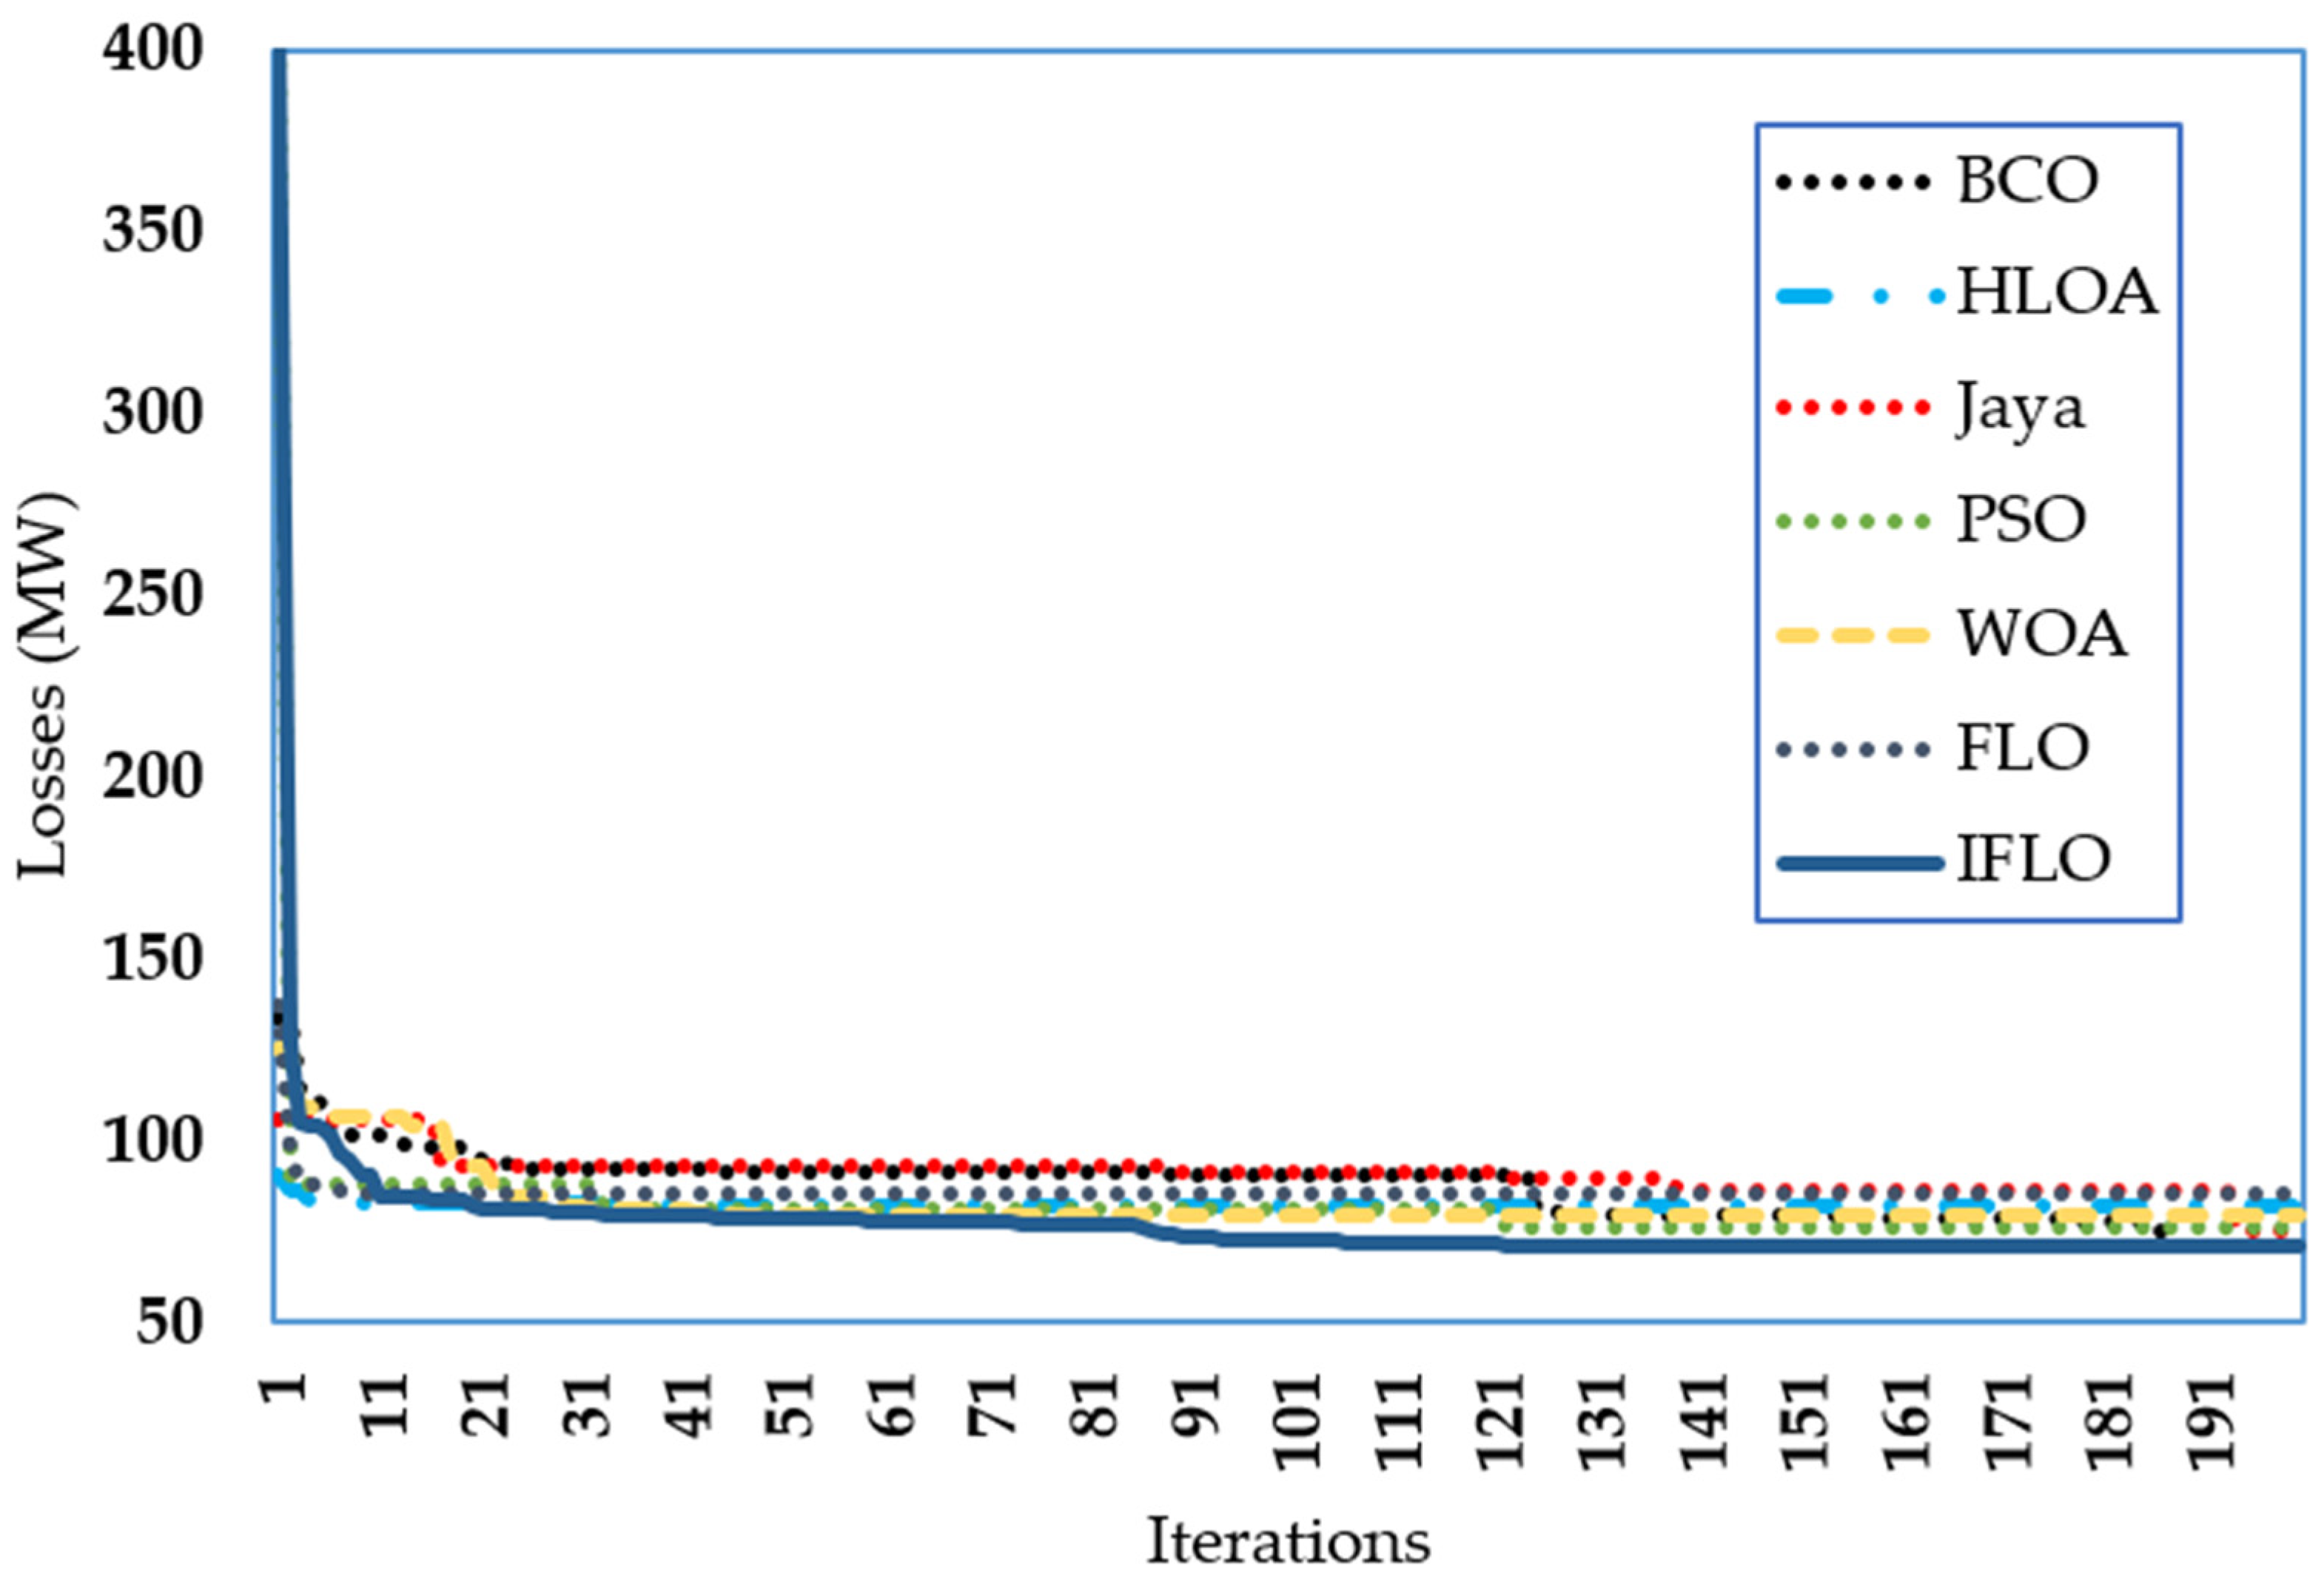
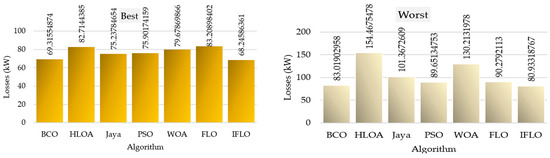
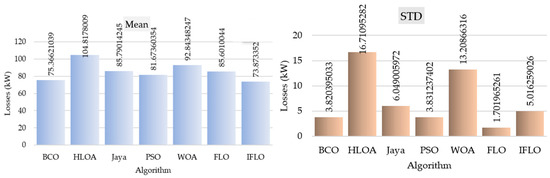
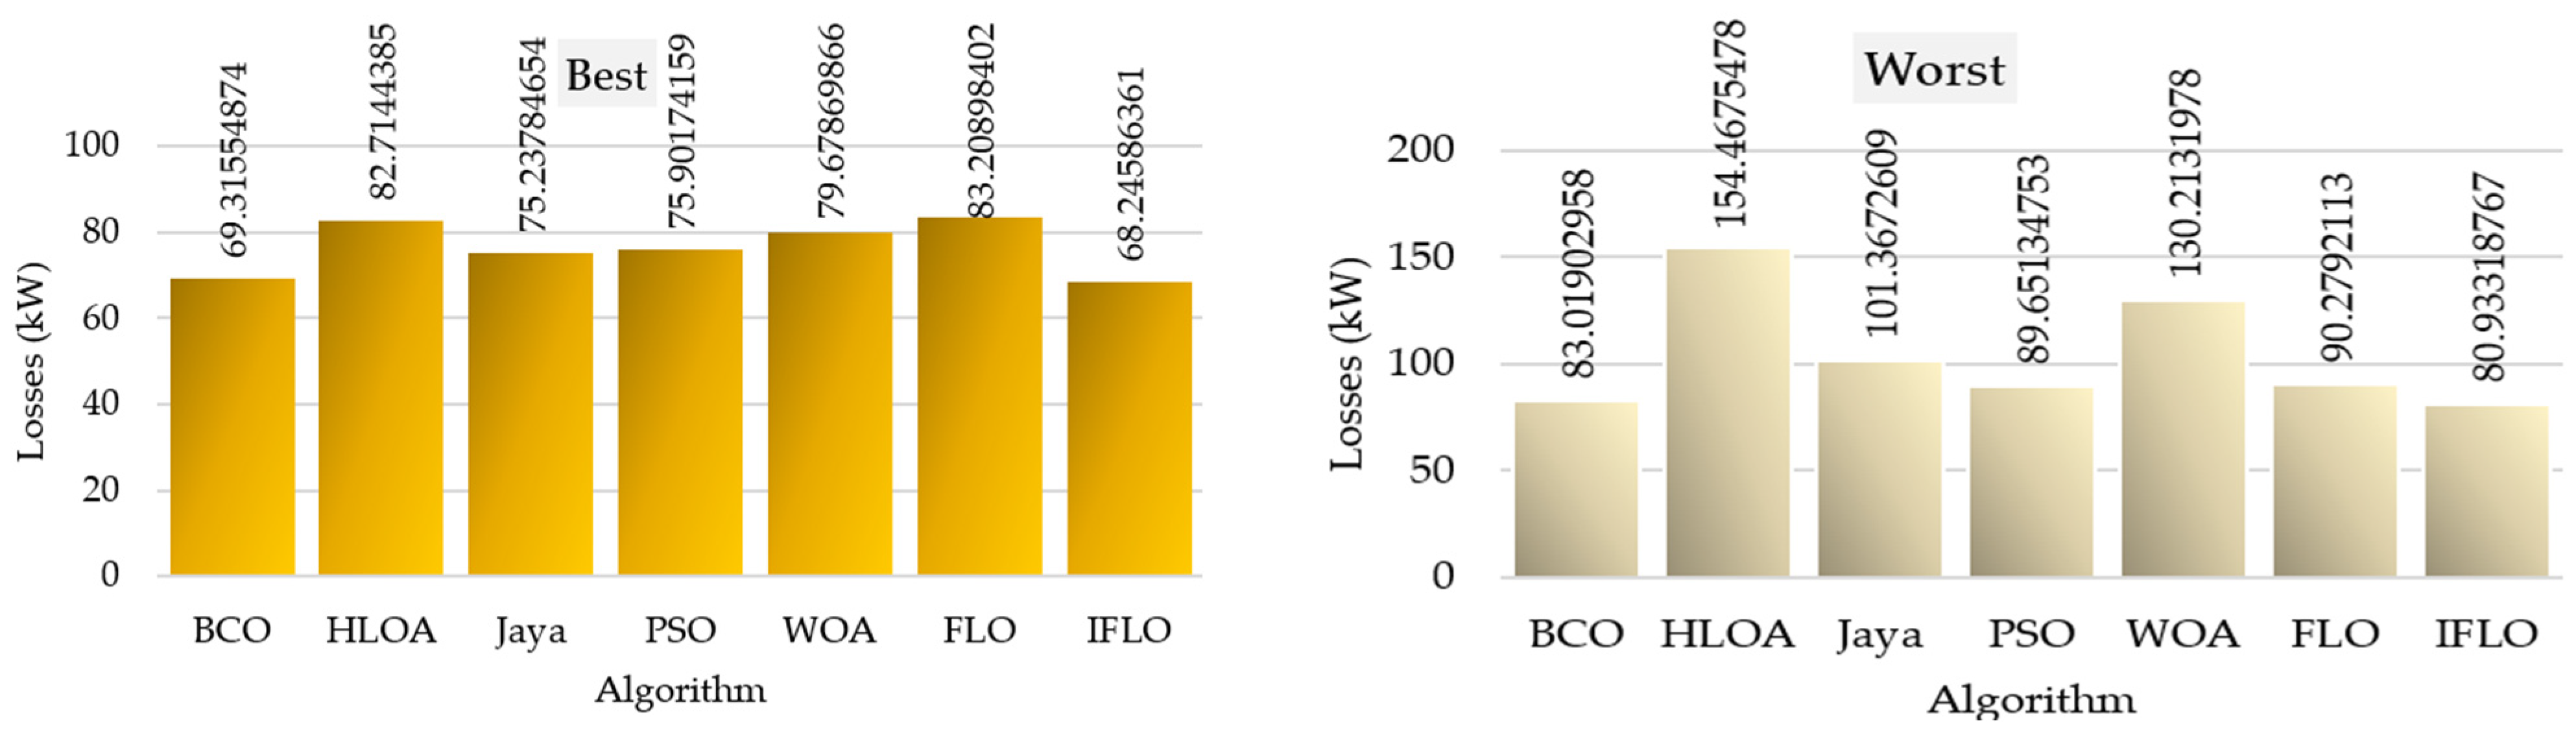
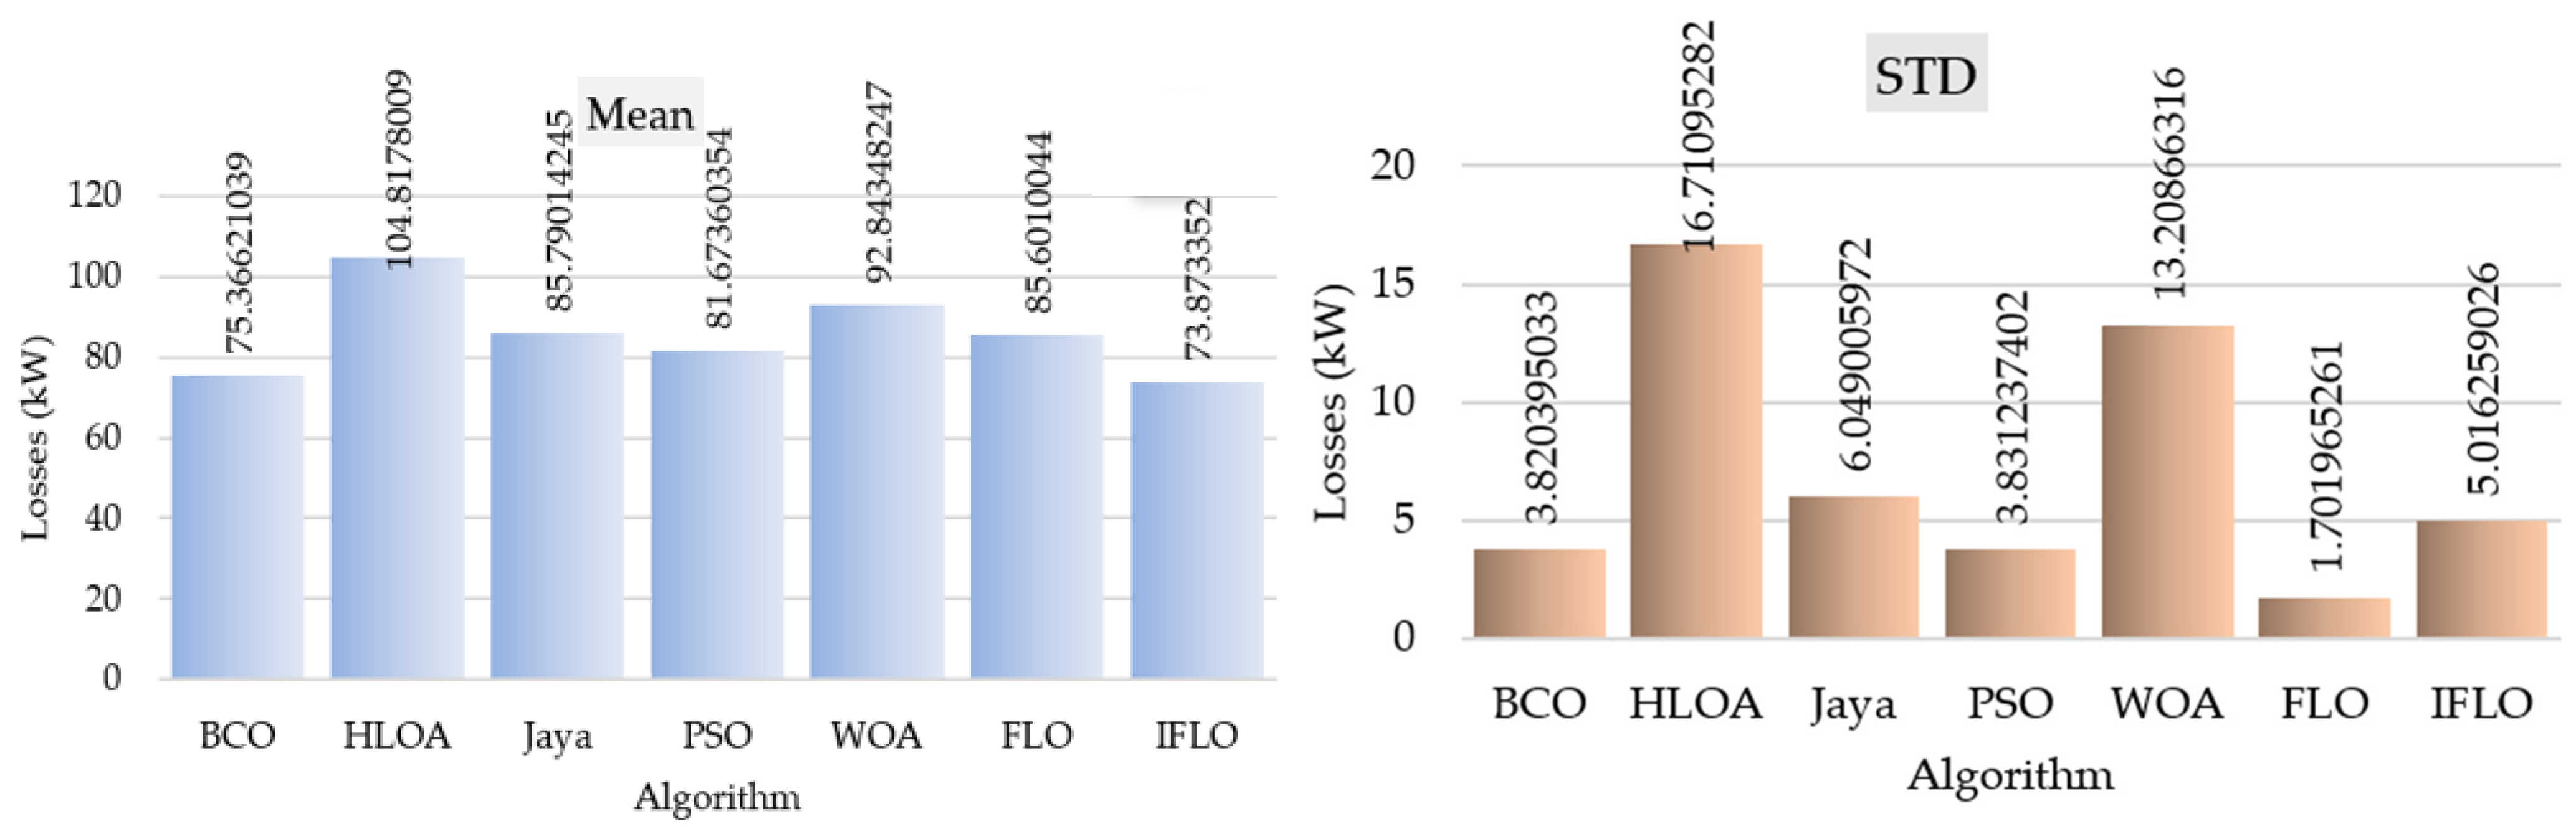
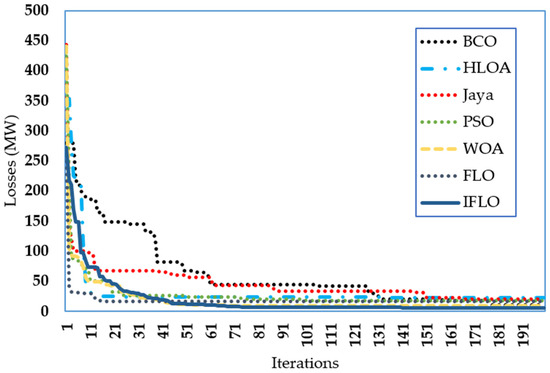
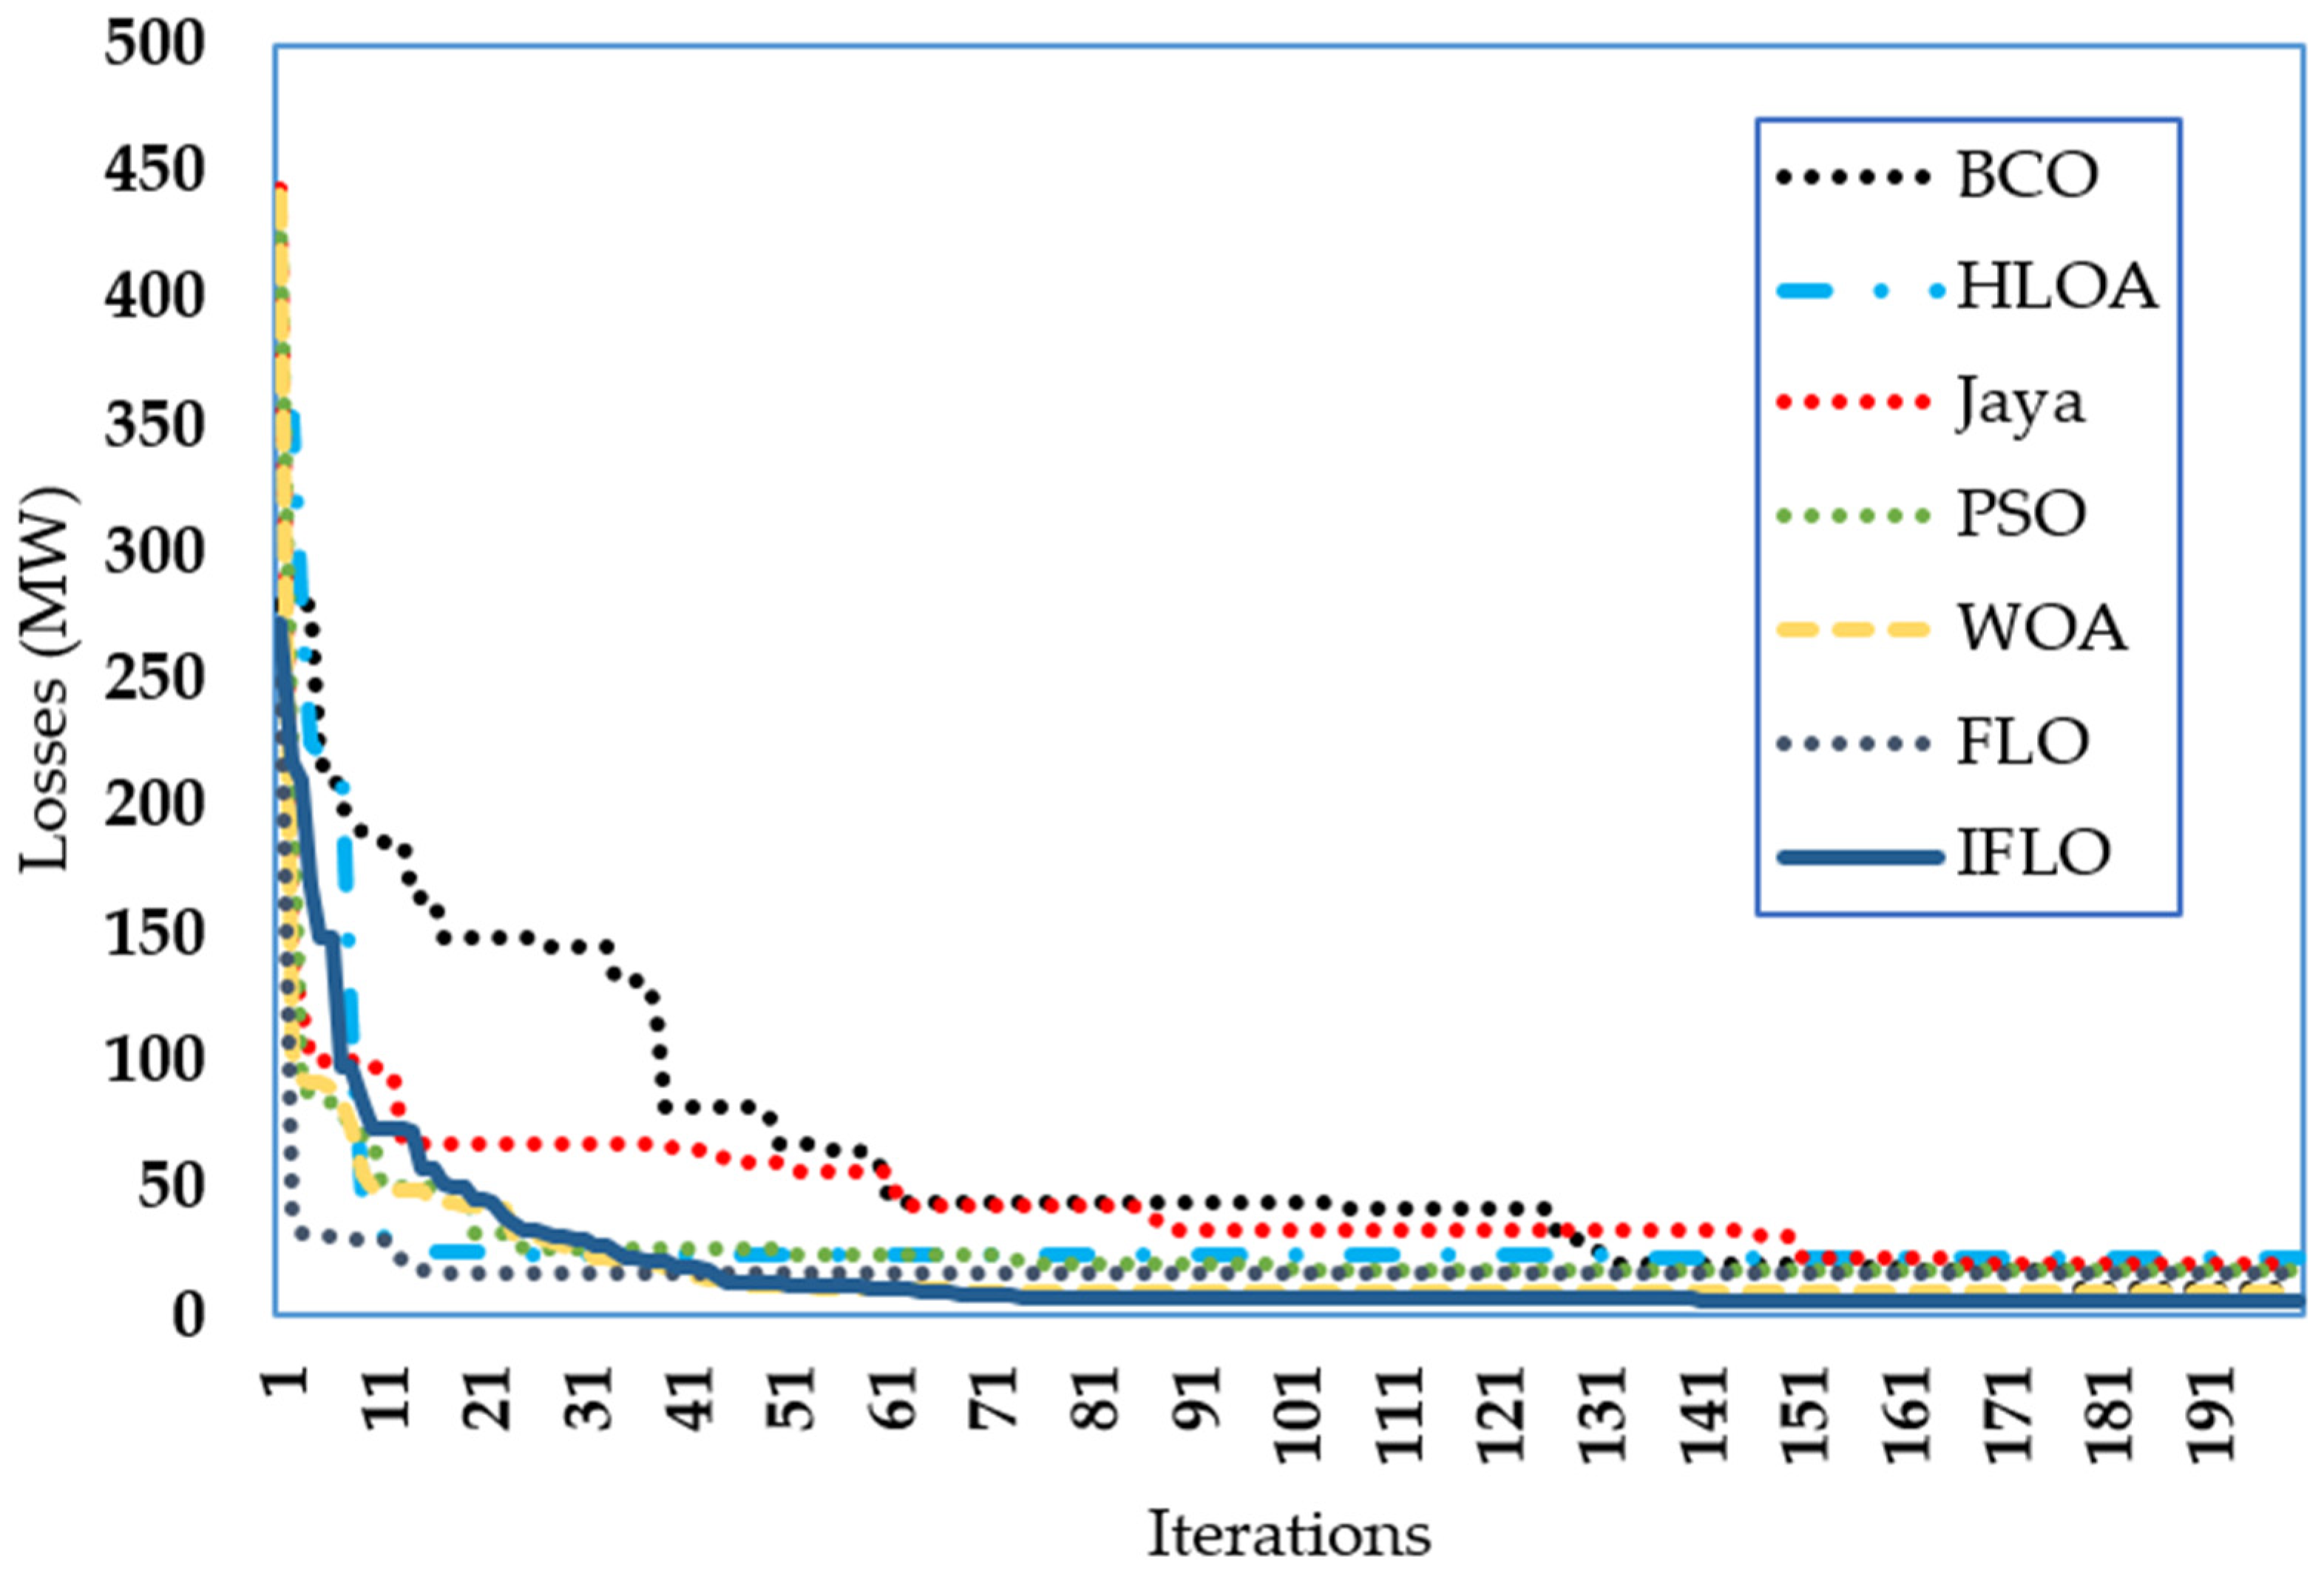
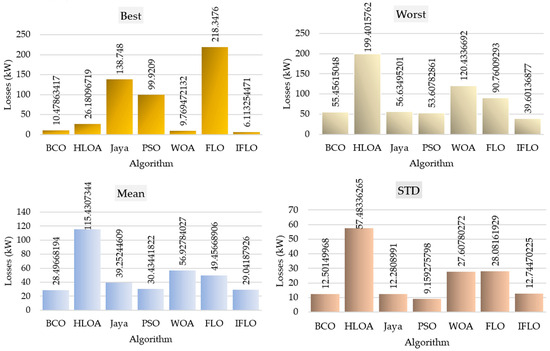
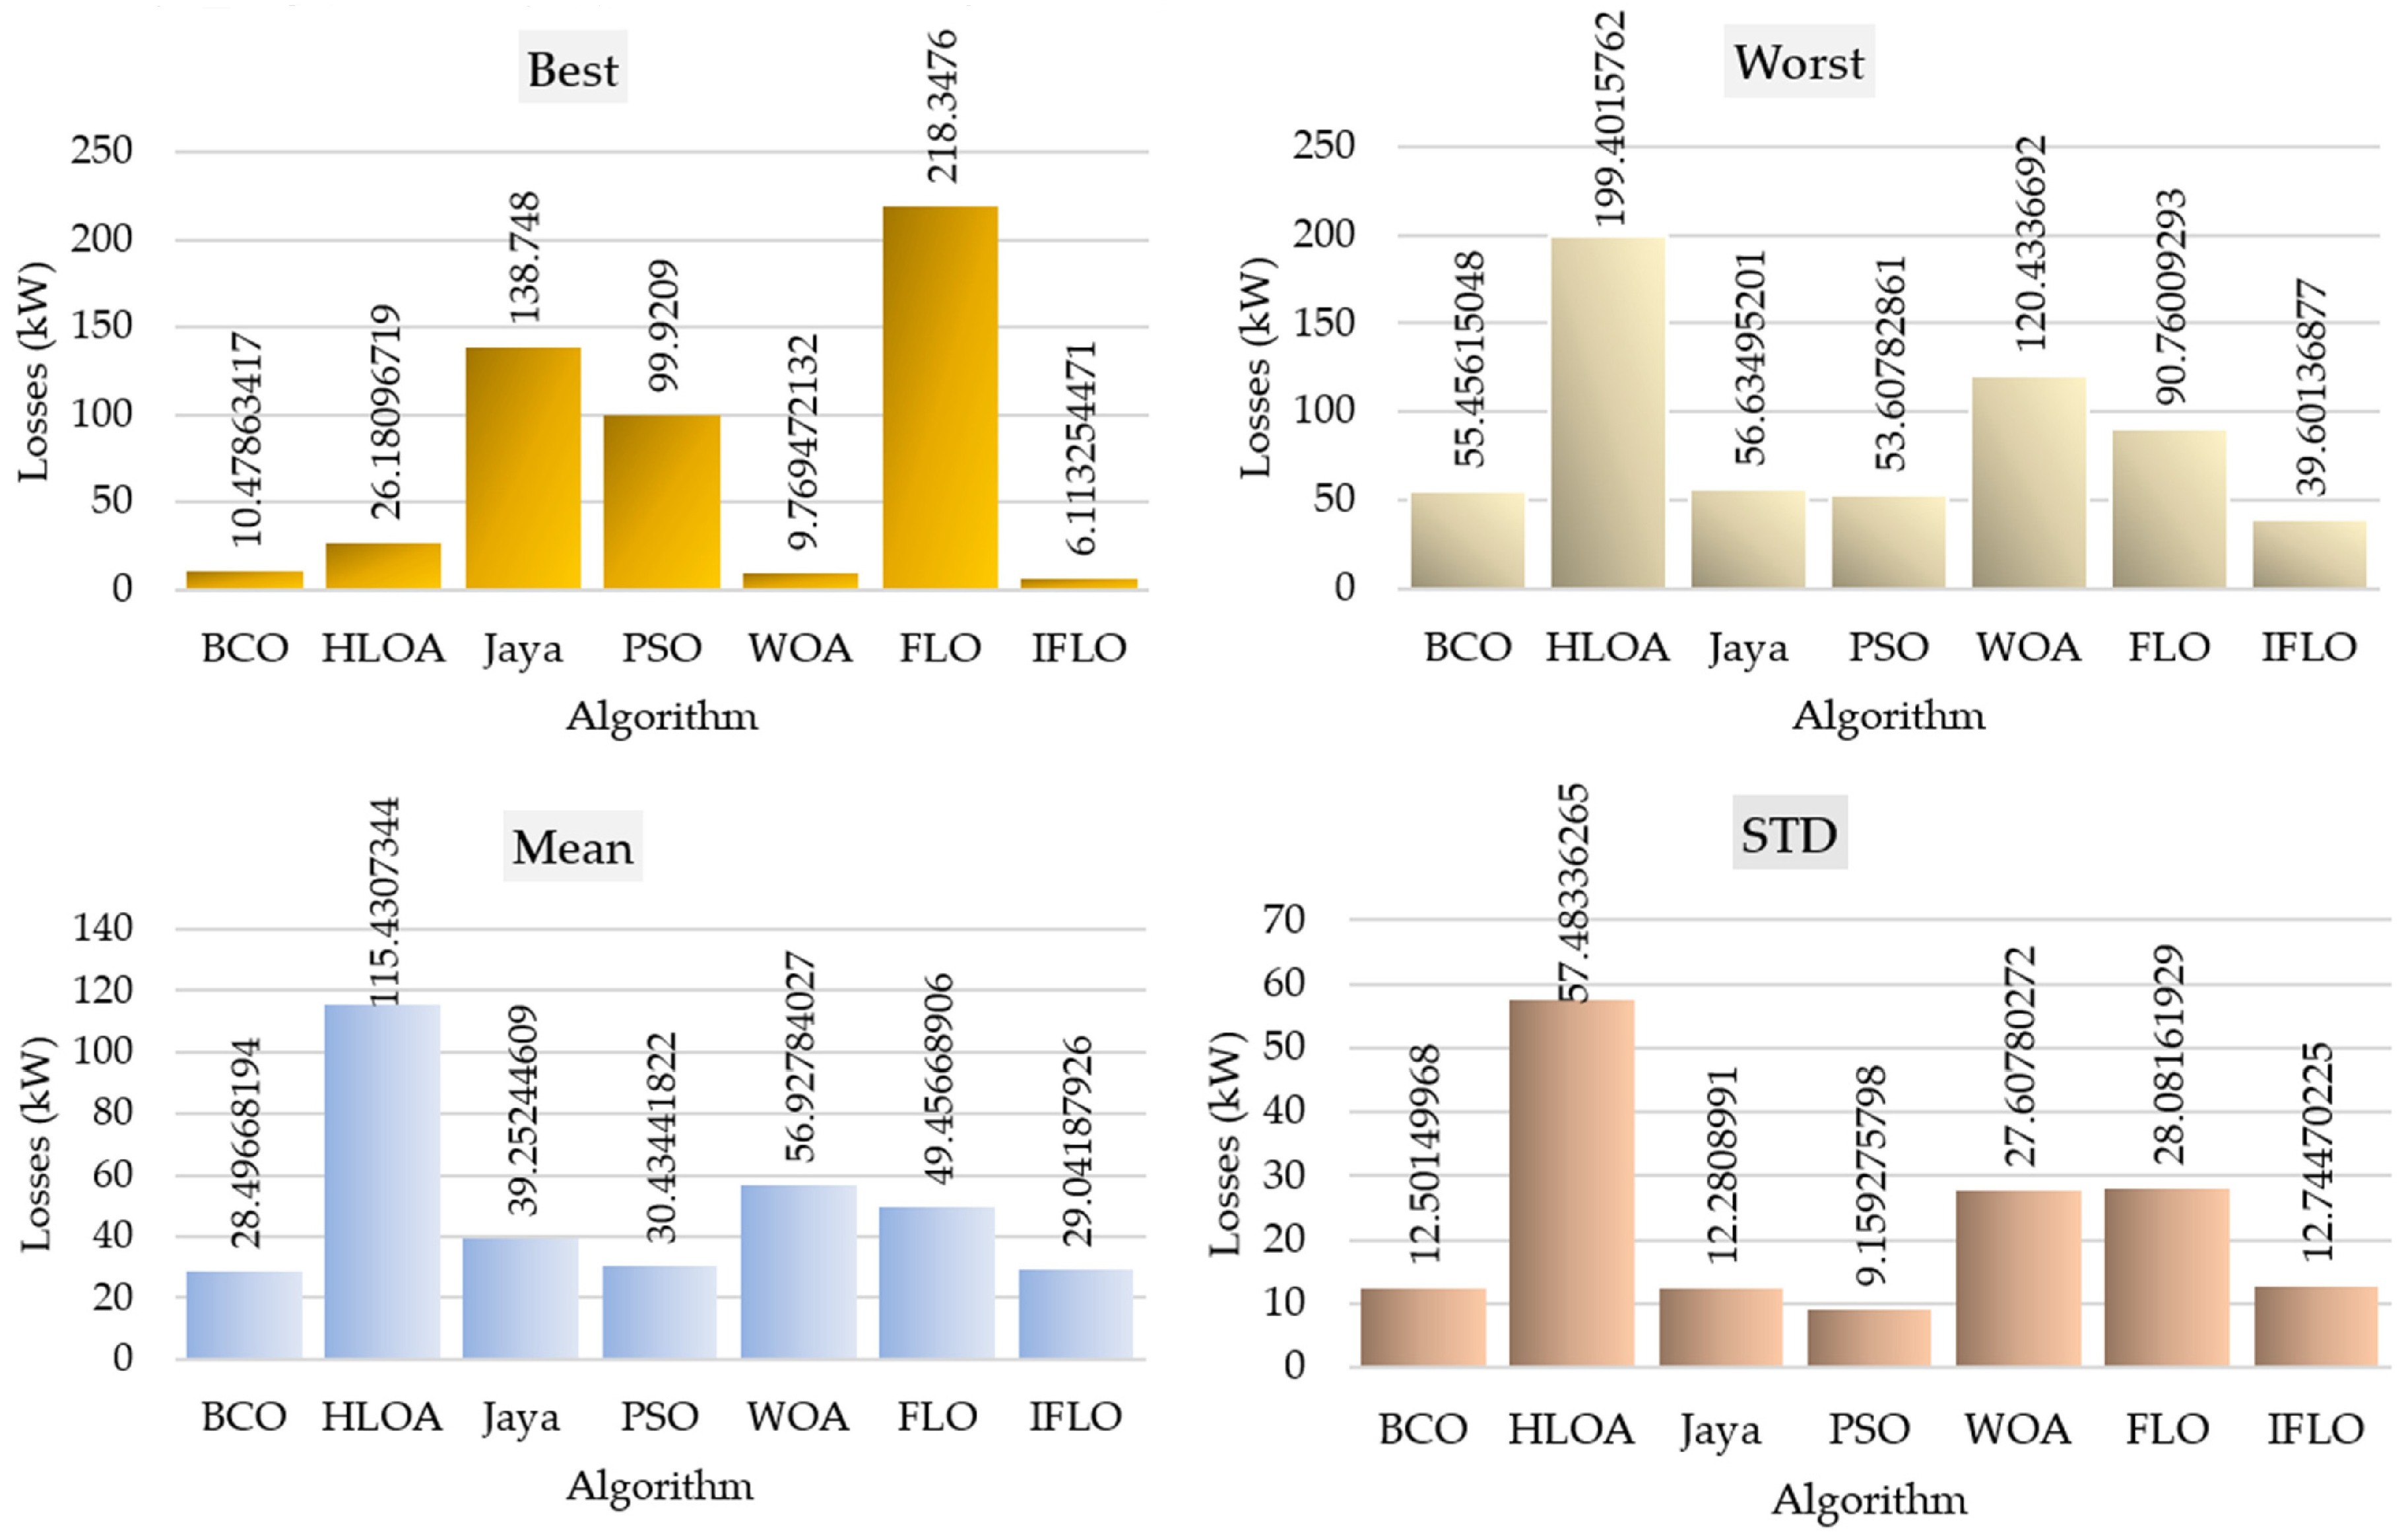
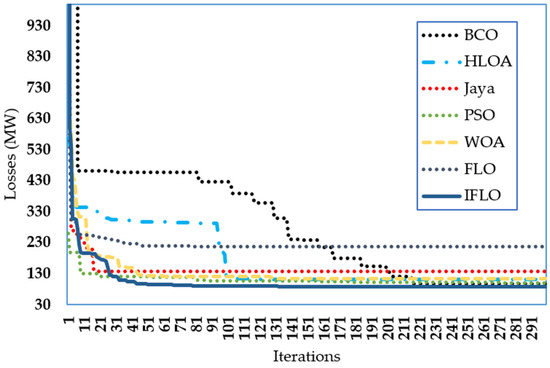
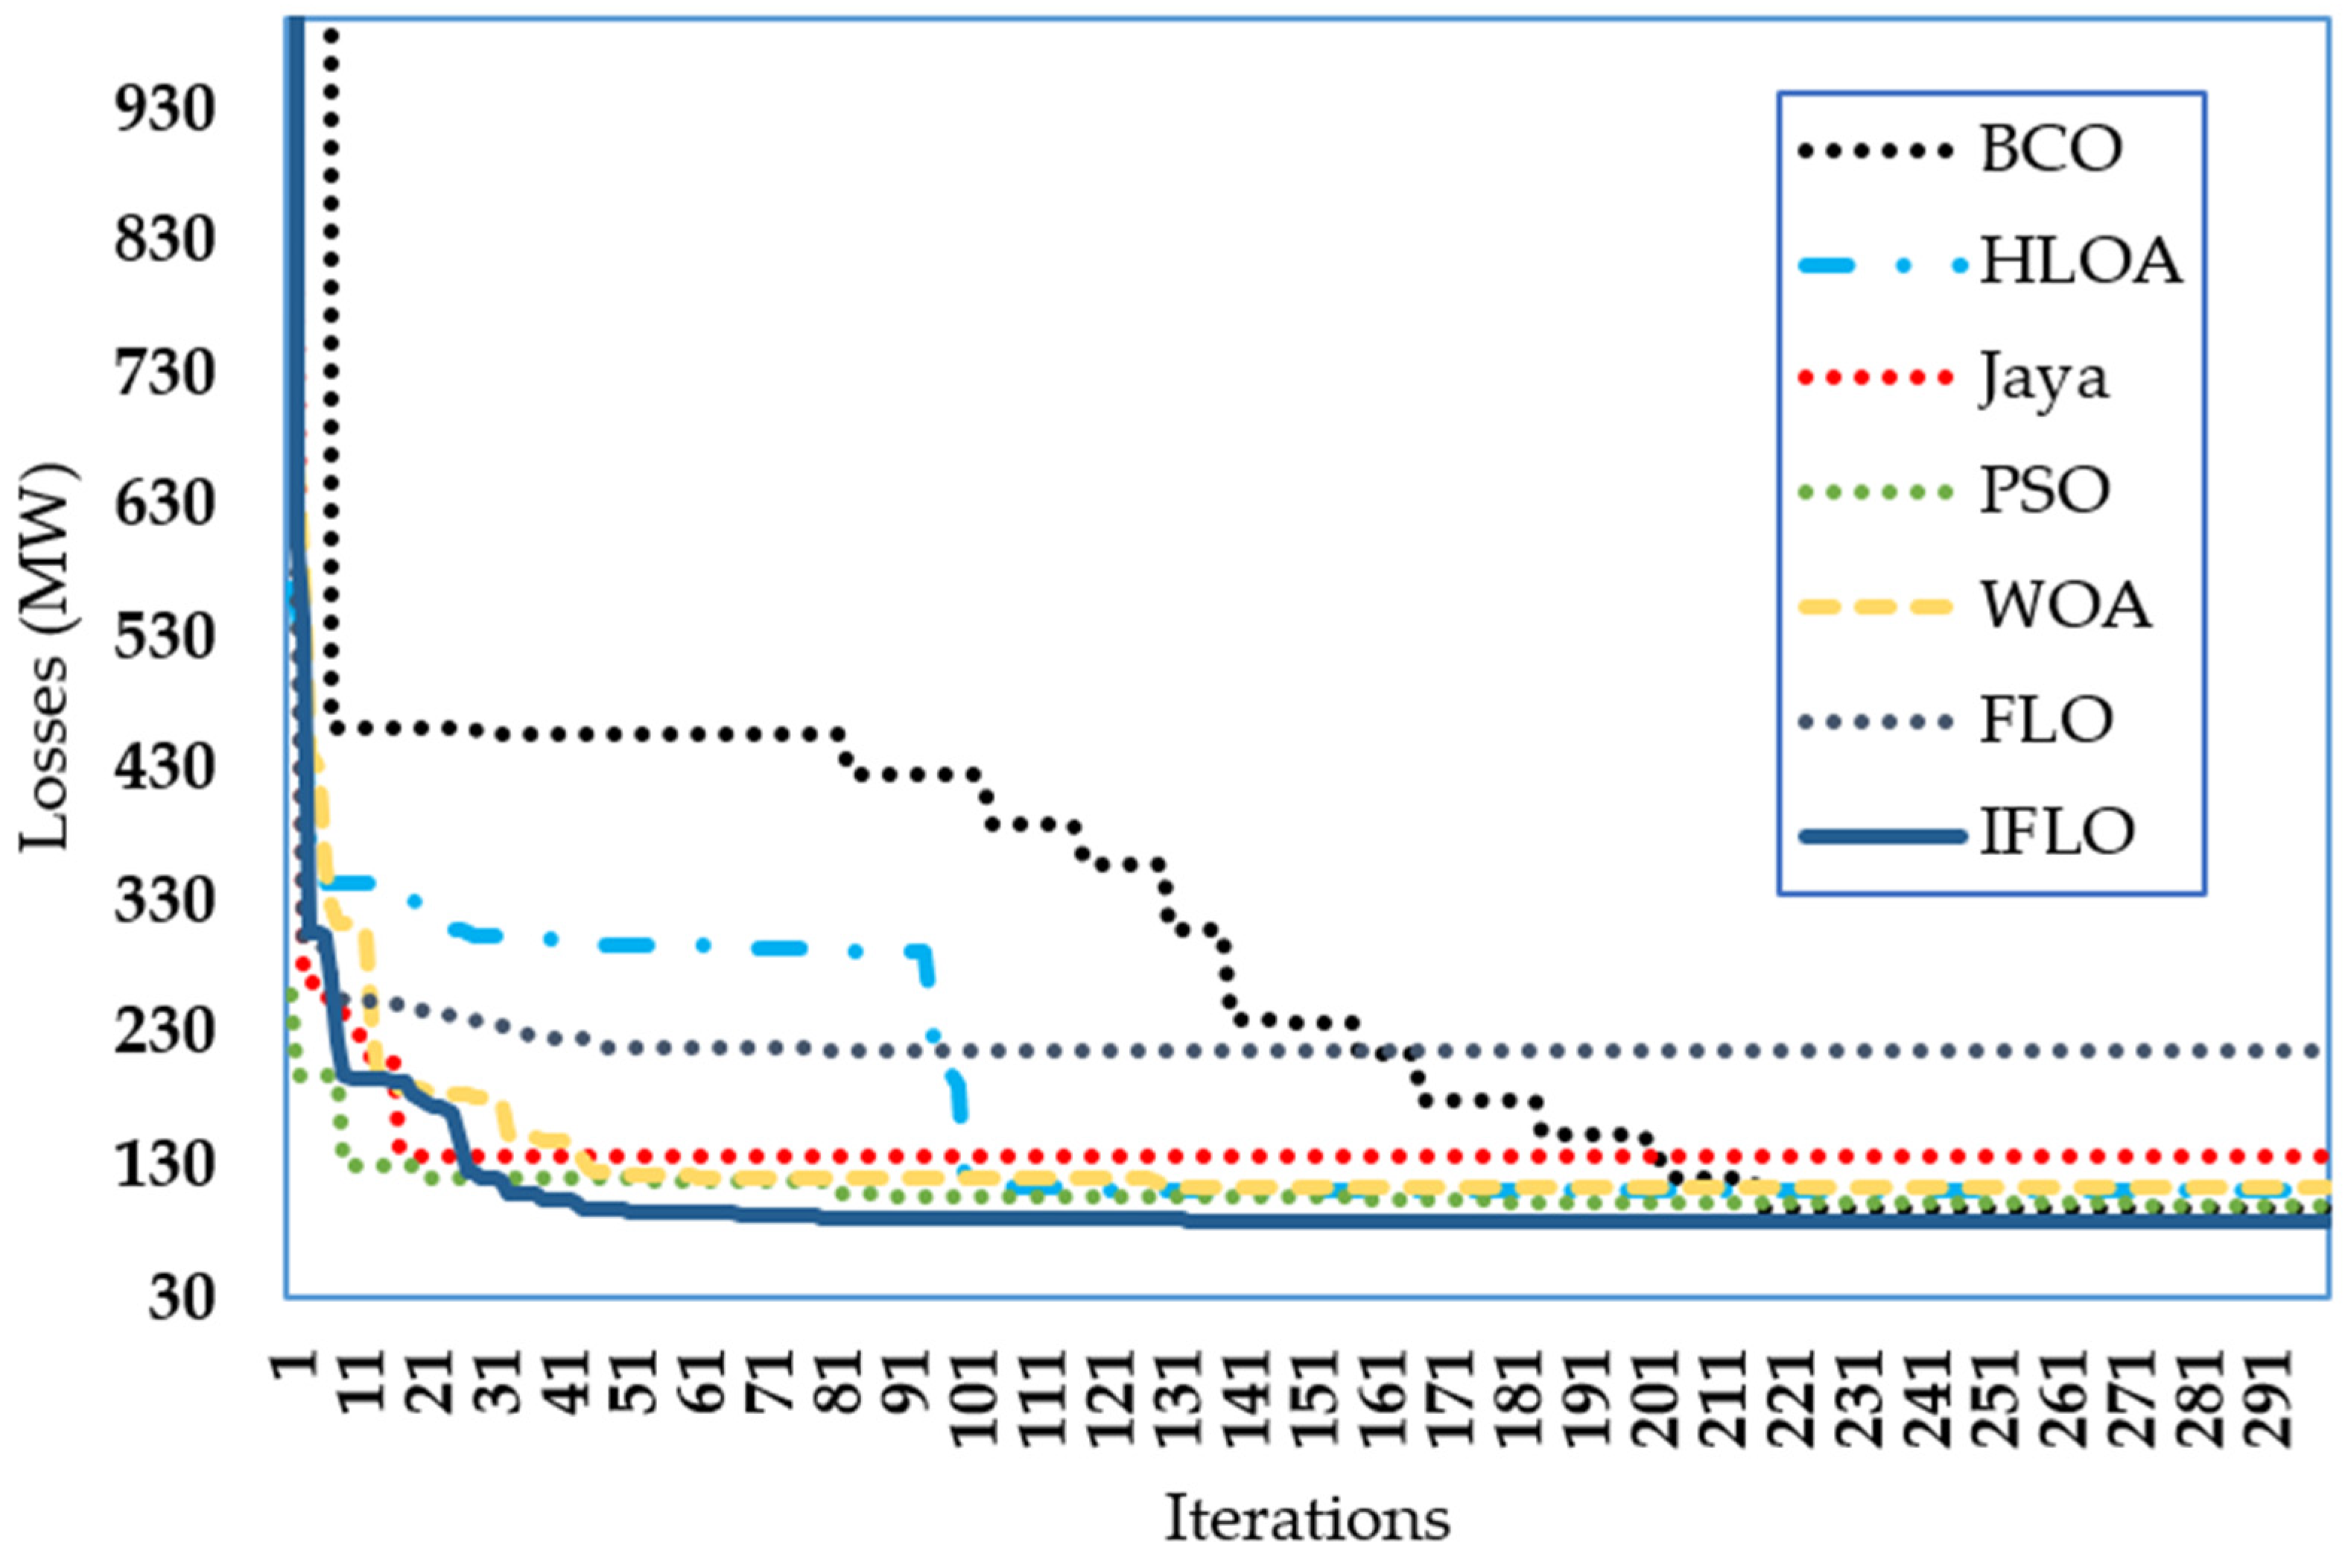
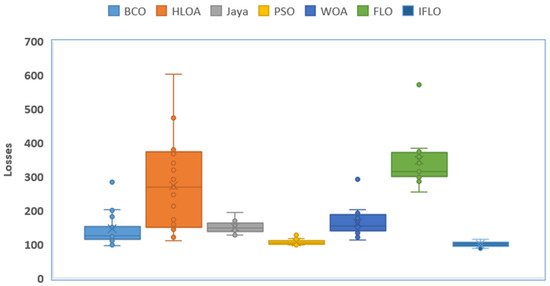
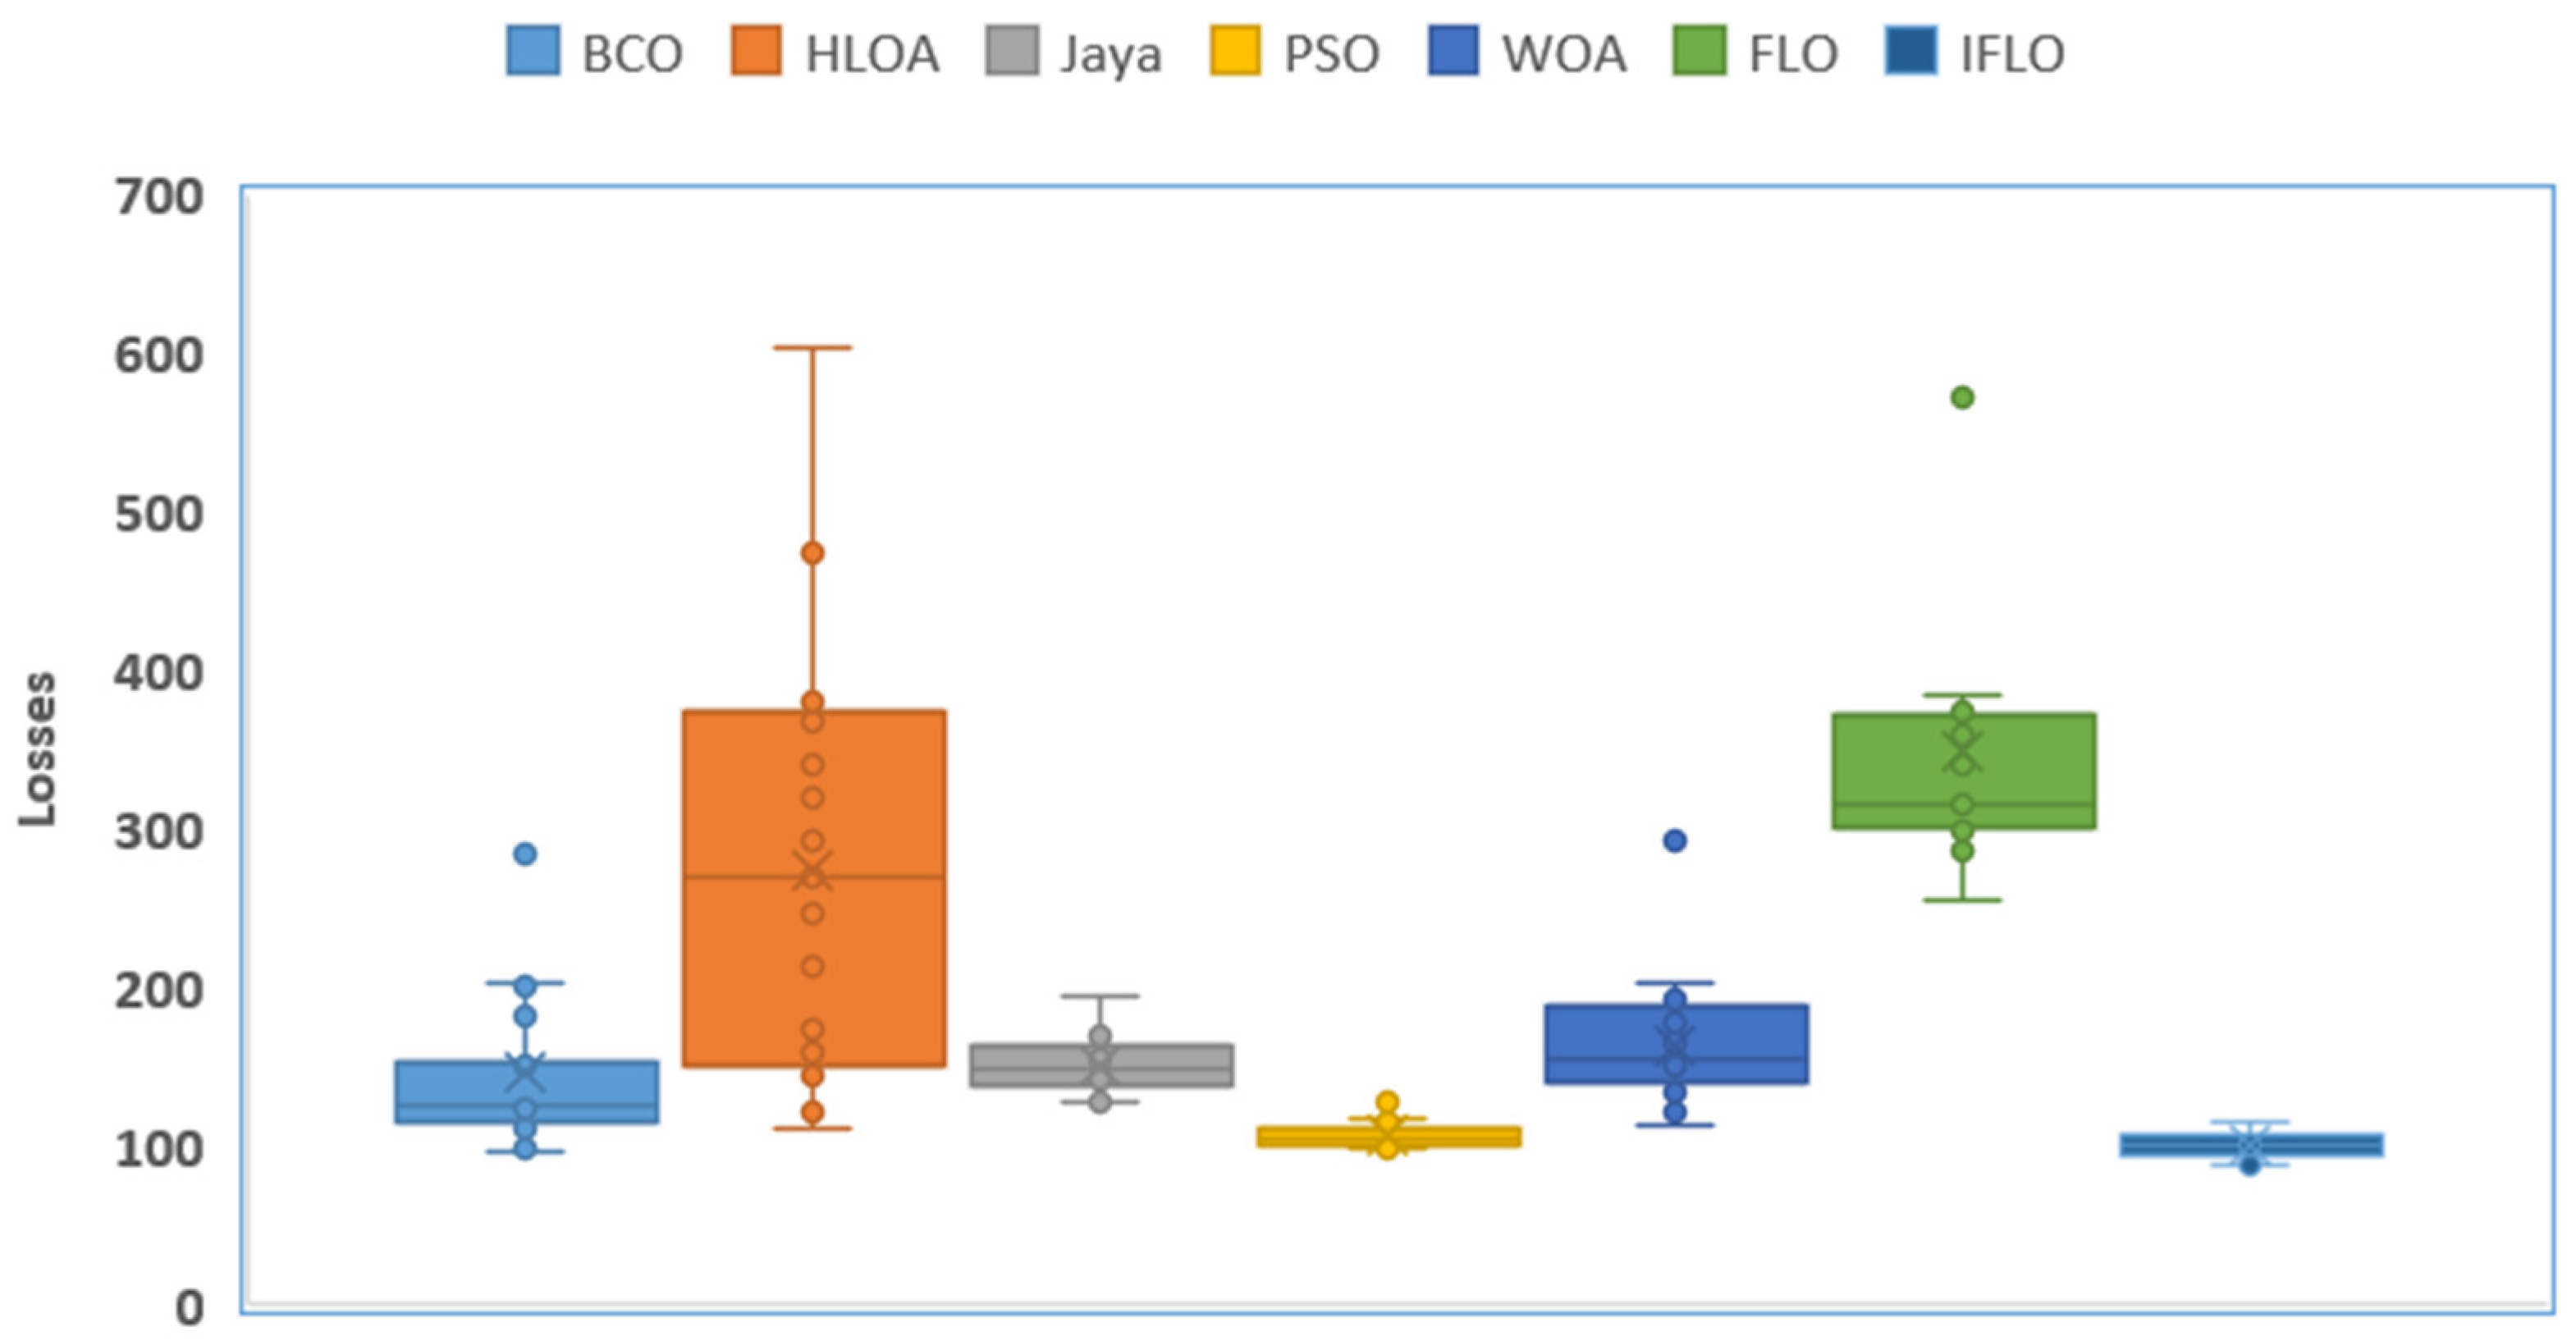
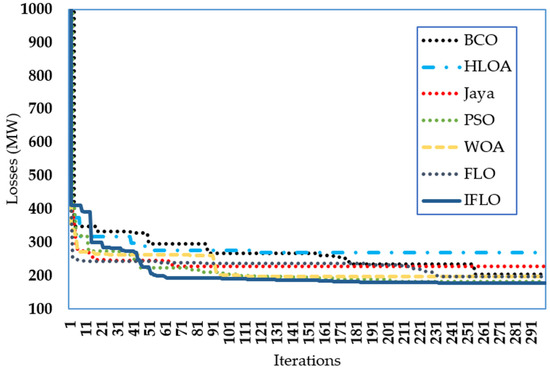
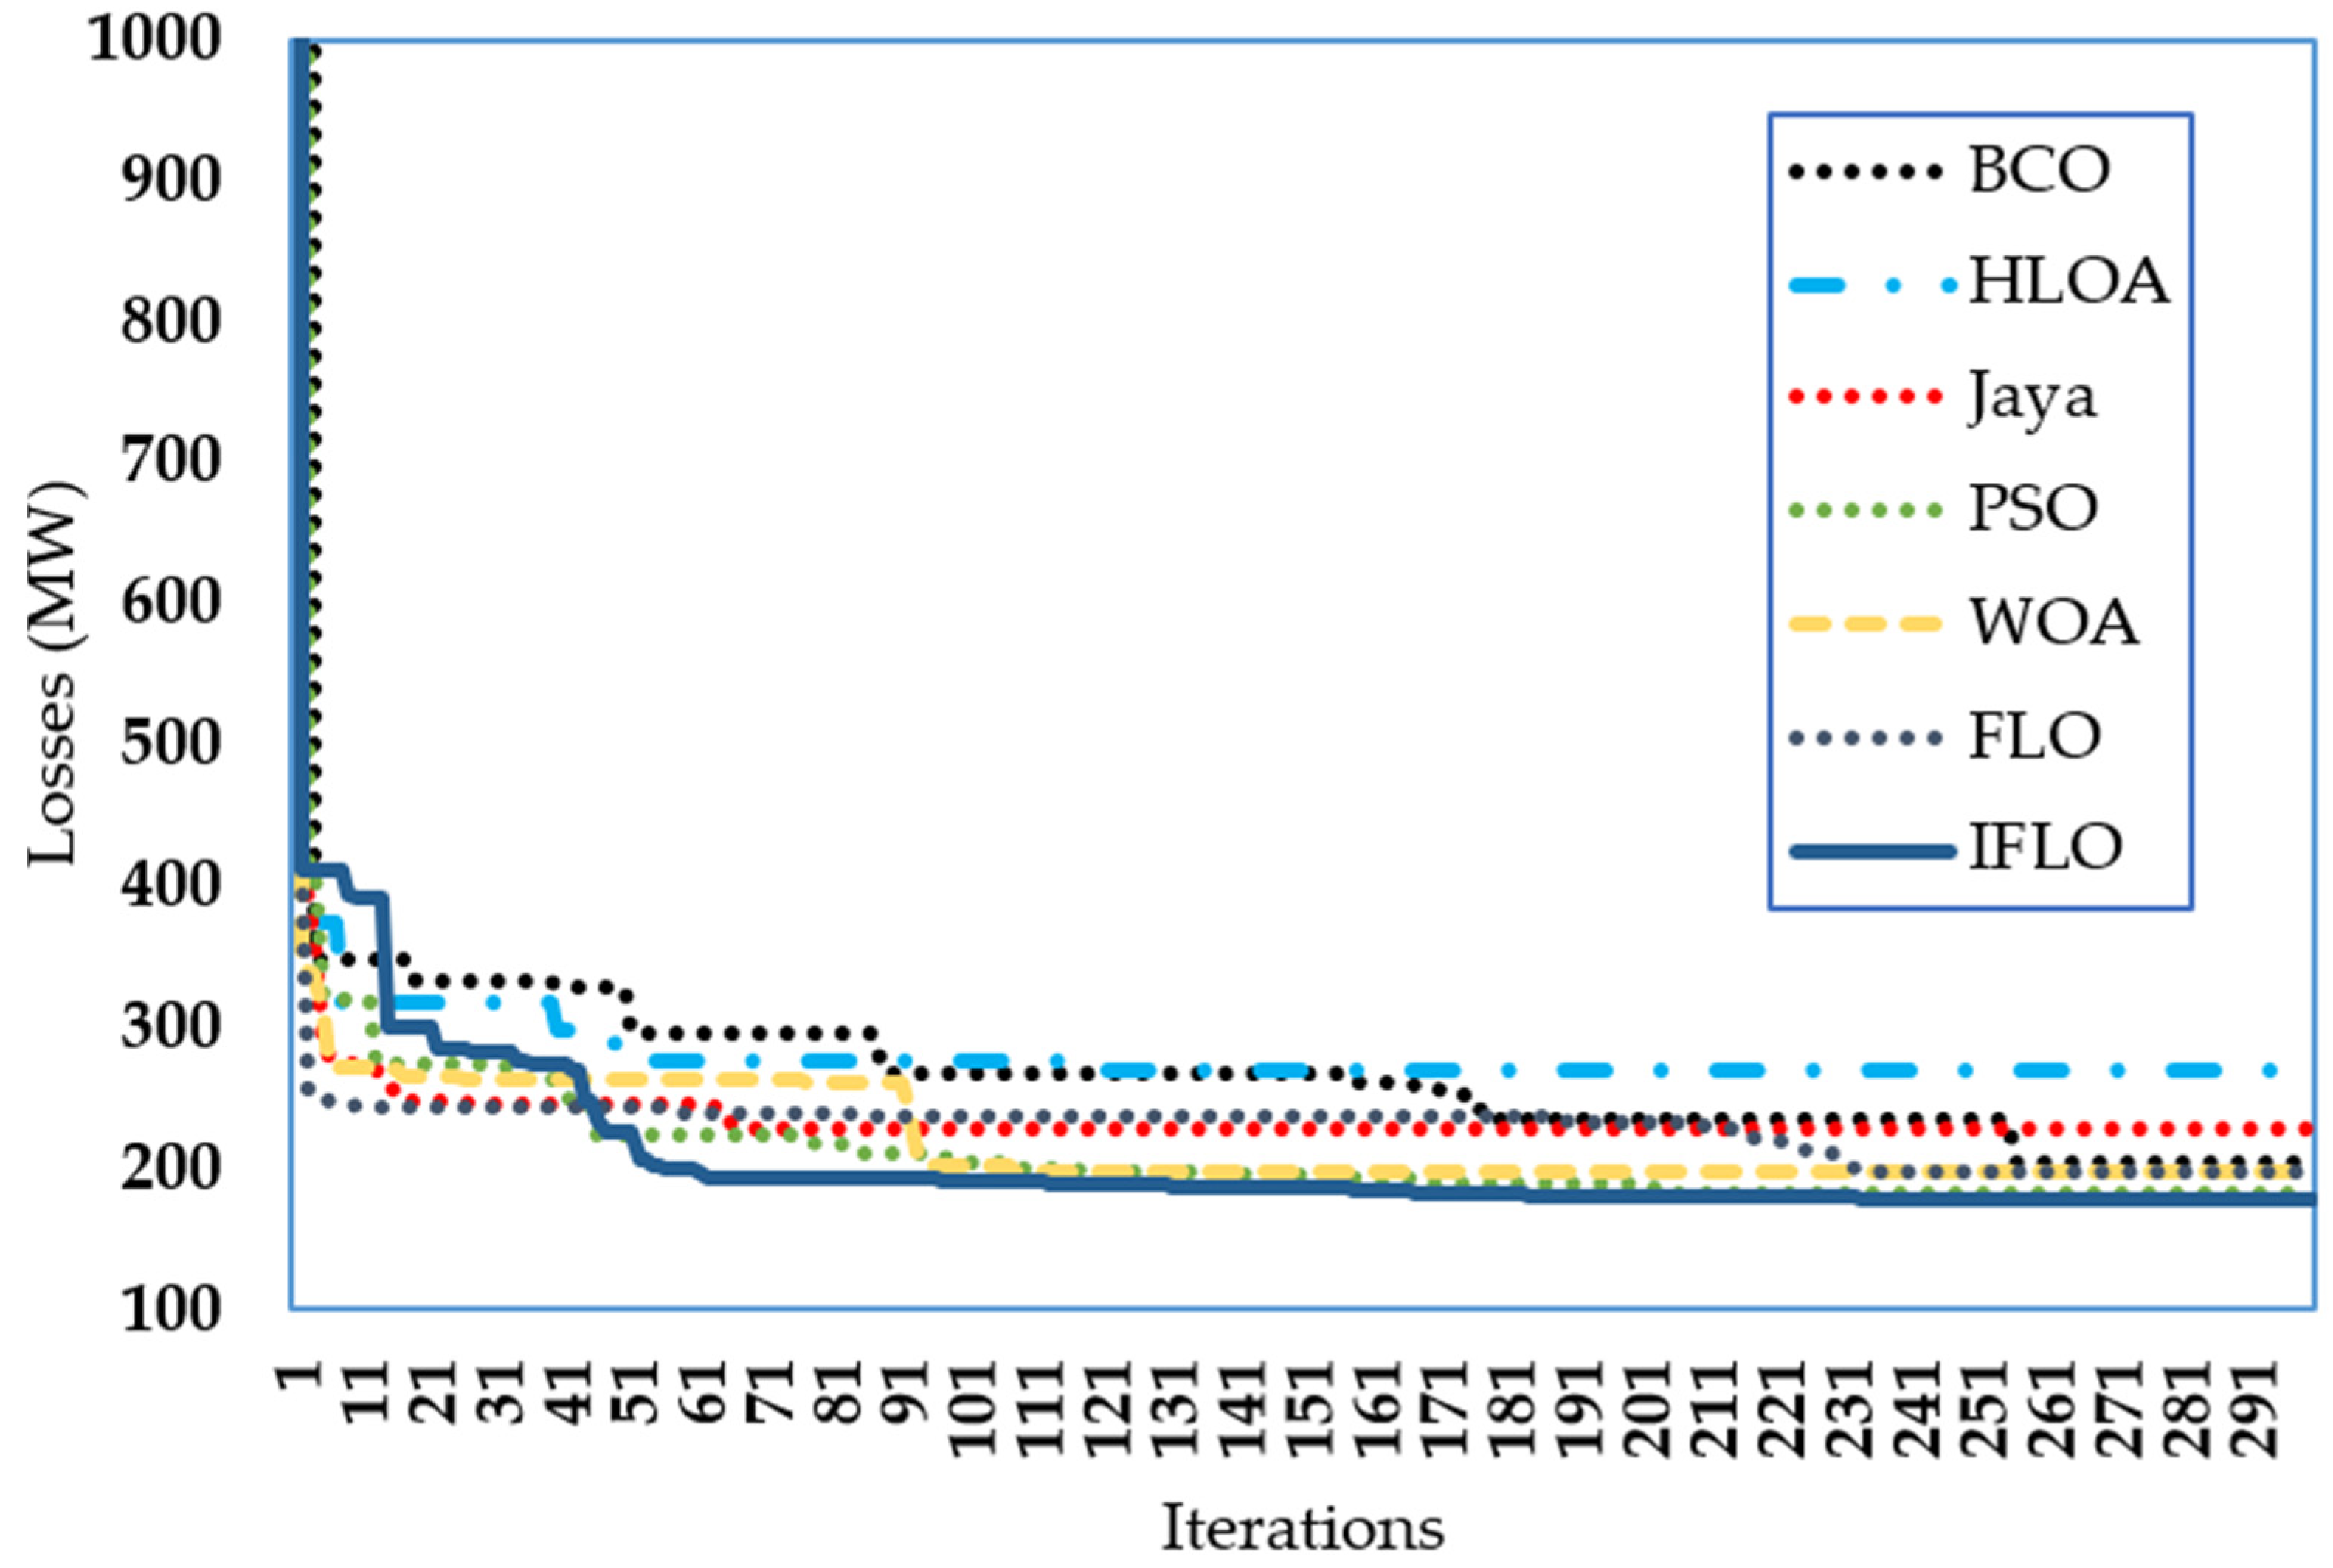
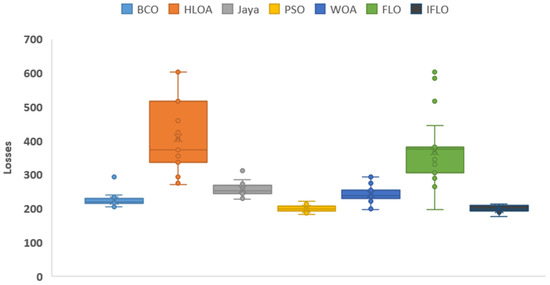
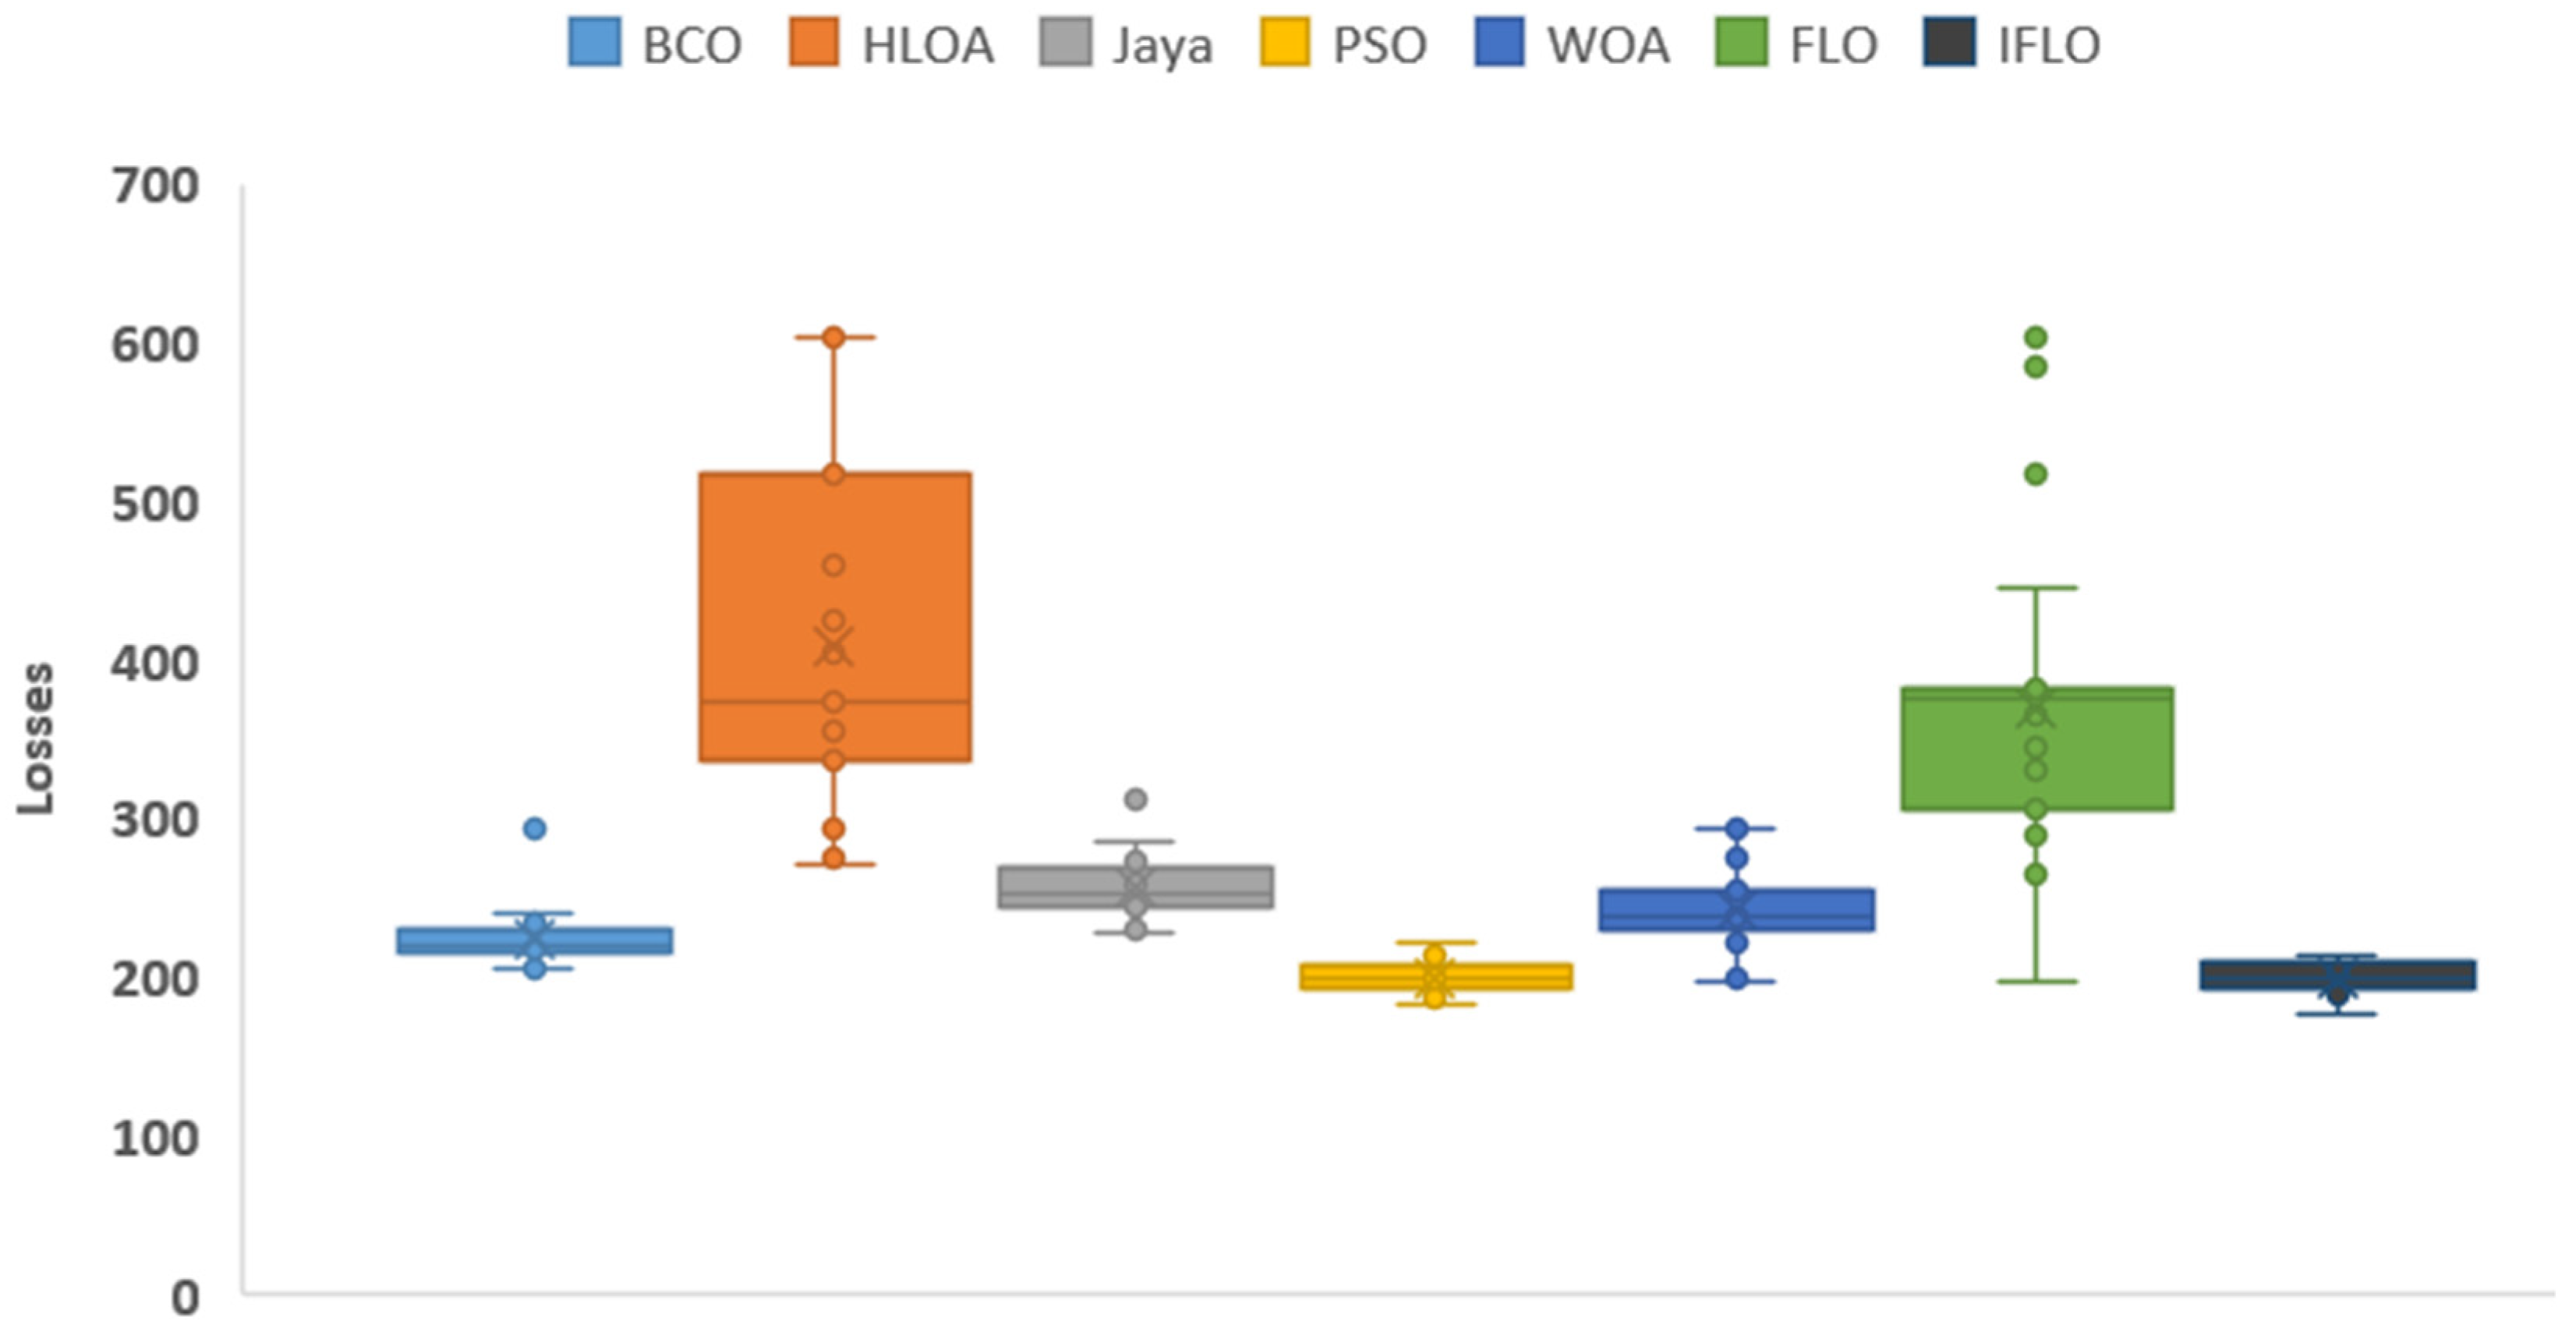
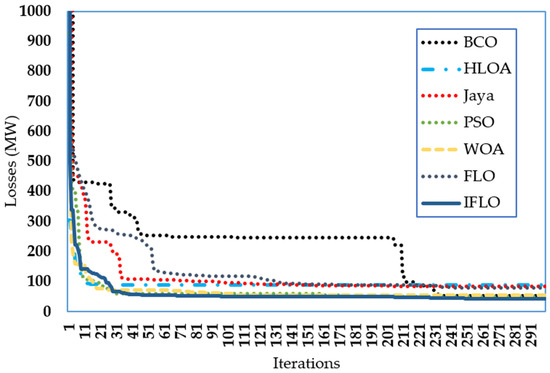
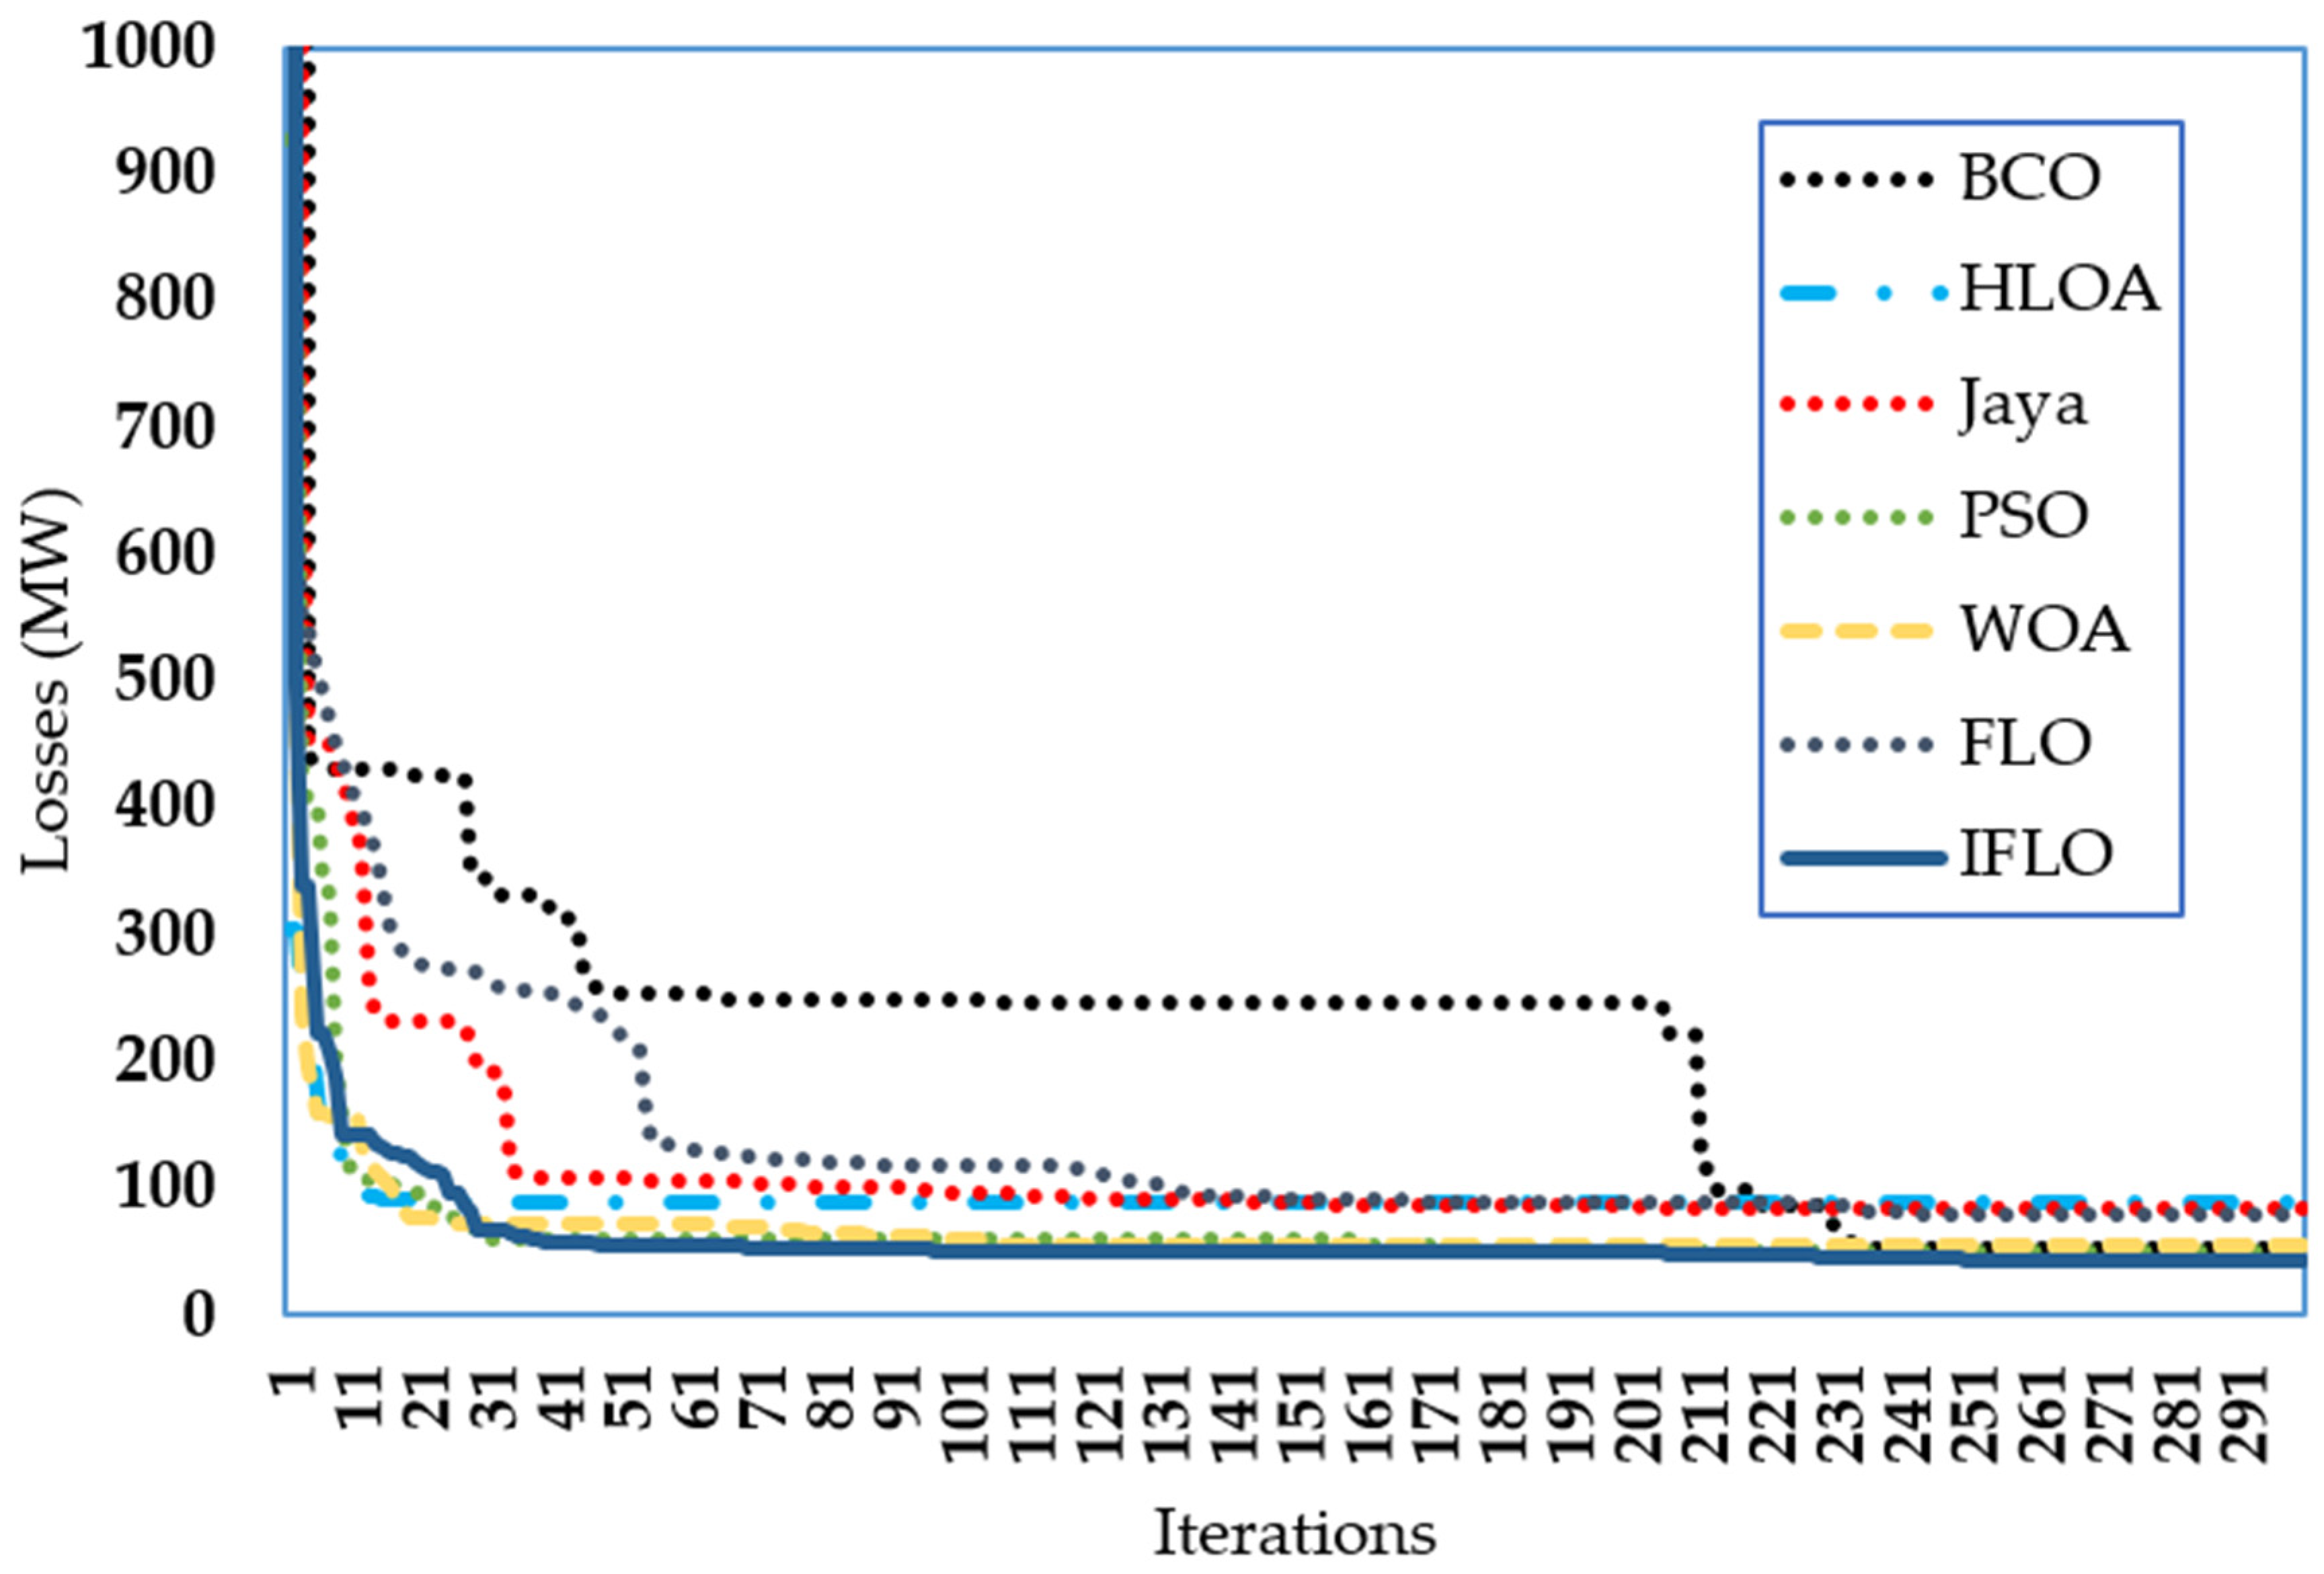
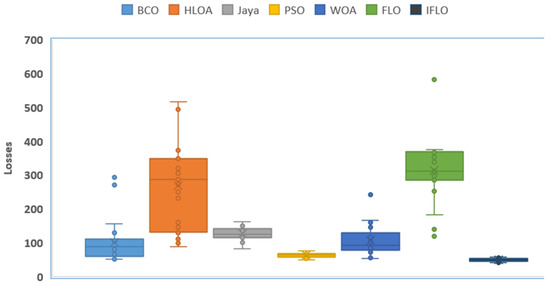
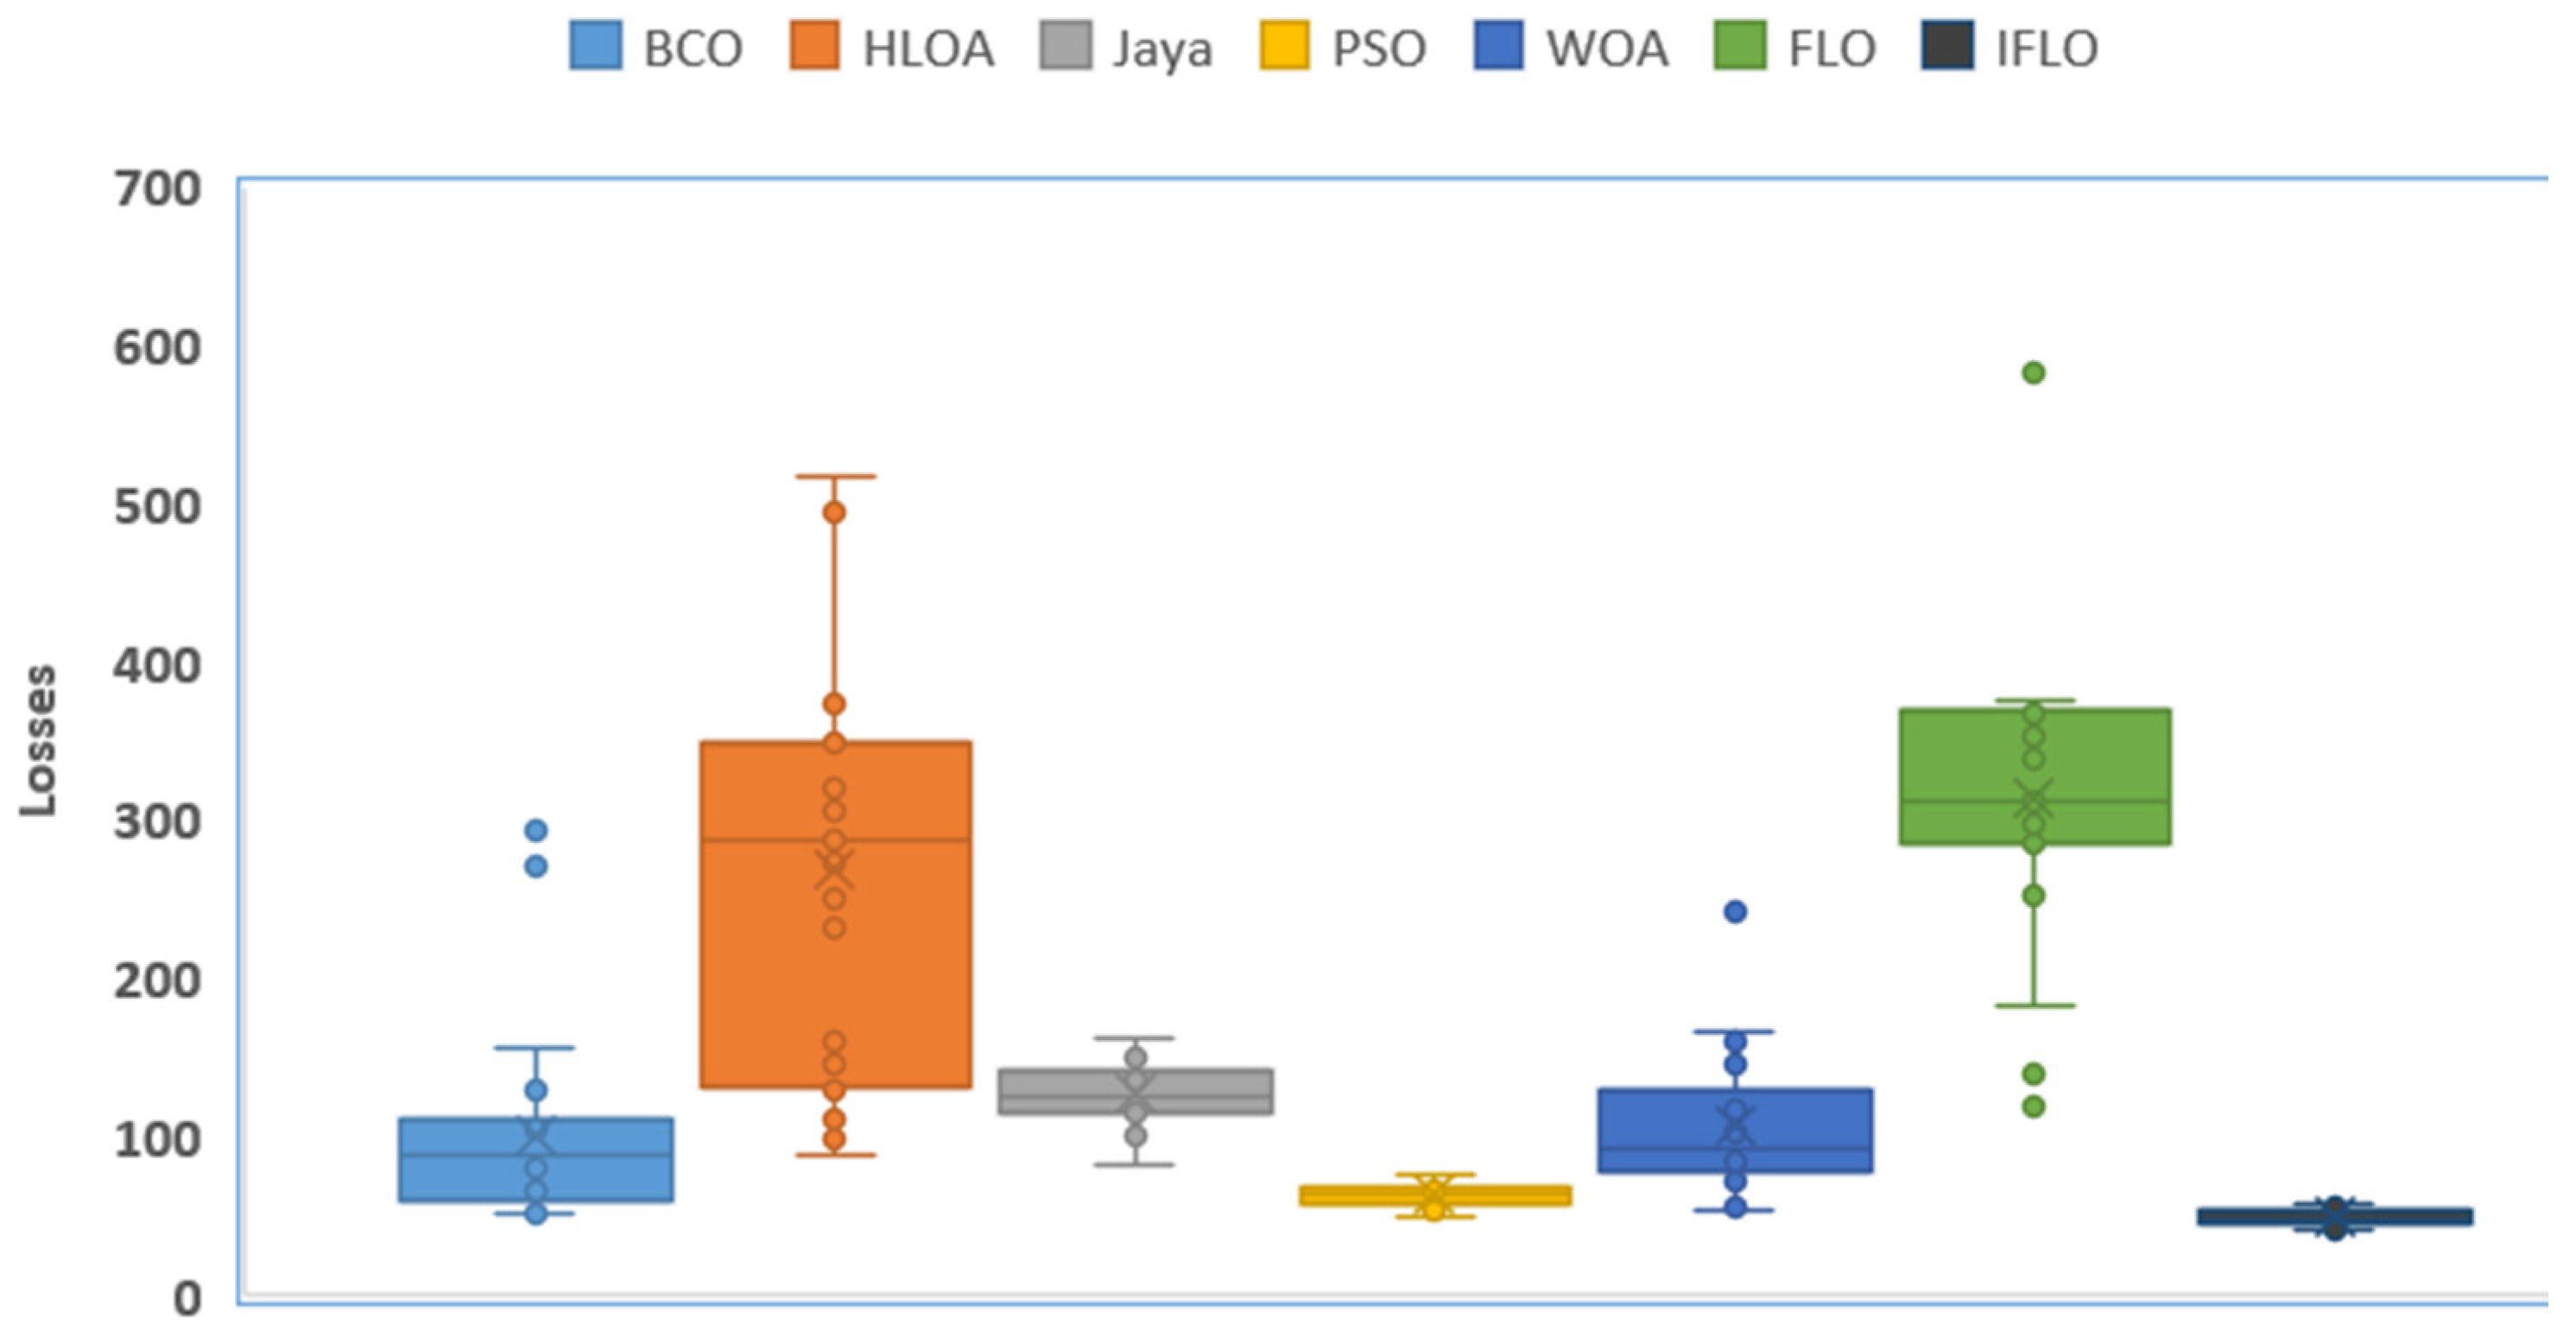

Disclaimer/Publisher’s Note: The statements, opinions and data contained in all publications are solely those of the individual author(s) and contributor(s) and not of MDPI and/or the editor(s). MDPI and/or the editor(s) disclaim responsibility for any injury to people or property resulting from any ideas, methods, instructions or products referred to in the content. |
© 2026 by the authors. Licensee MDPI, Basel, Switzerland. This article is an open access article distributed under the terms and conditions of the Creative Commons Attribution (CC BY) license.