


Abstract
Deep learning-based methods have achieved promising results in planetary gearbox fault diagnosis. However, complex vibration signals often contain redundant information and disturbance-related responses, and varying operating conditions can cause distribution discrepancy between training and testing data, leading to degraded diagnostic performance. To address this coupled challenge, a diagnostic method termed DART18 (Domain Adaptation diagnosis of ResNet18 embedded with a Time–frequency enhanced attention mechanism) is proposed. DART18 is designed to improve both the discriminability and transferability of fault features by combining input-level time–frequency refinement with feature-level distribution alignment. Specifically, vibration signals are first transformed by the optimal generalized S-Transform (OGST) into time–frequency representations to characterize their joint time–frequency information. Then, TFEAM is designed to refine the input time–frequency representations before deep feature extraction. By aggregating features from different receptive fields and adaptively emphasizing fault-related time–frequency structures, TFEAM provides more informative inputs for subsequent feature learning. On this basis, ResNet18 is employed to extract fault features, and multi-kernel maximum mean discrepancy (MK-MMD) is introduced to statistically align the feature distributions of the source and target domains by jointly using labeled source-domain data and unlabeled target-domain data. Experimental results on two planetary gearbox datasets under multiple domain adaptation tasks show that DART18 consistently outperforms five comparative methods in terms of accuracy and F1-score, demonstrating its effectiveness and robustness for fault diagnosis under varying operating conditions.
1. Introduction
Planetary gearboxes are critical transmission components in modern mechanical systems and are widely used in petrochemical engineering, aerospace, wind power generation, and many other industrial fields [1,2,3]. Owing to the complex multi-gear meshing structure, planetary gearboxes are susceptible to various faults during operation. Once faults occur and are not diagnosed promptly, performance degradation, unexpected shutdowns, and even catastrophic accidents may occur [4]. Therefore, fault diagnosis of planetary gearboxes is of great significance for ensuring the safety, reliability, and efficient operation of mechanical equipment.
With the rapid development of artificial intelligence, deep learning (DL) has attracted increasing attention in intelligent fault diagnosis because of its capability of automatic feature extraction and high diagnostic accuracy [5]. For example, Han et al. [6] developed Convformer-NSE, which combines CNN and transformer to jointly model local and global information for gearbox fault diagnosis under heavy noise. Kumar et al. [7] proposed a multi-size wide-kernel convolutional neural network to enhance feature learning from vibration signals and improve bearing fault diagnosis performance. Zhang et al. [8] introduced a circular pitch cyclic vector and a bidirectional gated recurrent unit to capture cyclic energy variation for wind turbine planetary gearbox fault diagnosis.
Despite the remarkable progress of deep learning in intelligent fault diagnosis, its practical application is still restricted by two main issues. First, planetary gearboxes usually operate in harsh environments, and the collected vibration signals are often corrupted by heavy noise and contain complex frequency components, such as rotational frequencies, meshing frequencies, and modulation-induced sidebands [9]. Under such conditions, directly using time-domain vibration signals as input makes it difficult for the model to extract sufficiently informative fault features, thus affecting the diagnostic performance. Second, operating conditions often vary in practical applications, so the data encountered during deployment generally do not follow the same distribution as the training data. This discrepancy, commonly termed domain shift, often degrades the performance of the trained model [10,11]. Therefore, the coexistence of these two issues can significantly affect the practical effectiveness of fault diagnosis methods.
To address this coupled challenge, many studies have transformed vibration signals into time–frequency representations to better characterize the joint information in the time and frequency domains [12,13]. With the widespread application of DL, ResNet has become an effective backbone for time–frequency feature extraction because its shortcut connections can alleviate network degradation and facilitate deep feature learning [14]. However, even in the time–frequency domain, redundant information and disturbance-related responses may remain, which can weaken the extraction of fault-related features. In recent years, various attention mechanisms have achieved promising results in computer vision and natural language processing tasks by enhancing informative structures or modeling broader dependencies. For example, Selective Kernel Network (SKNet) [15] adaptively aggregates multi-scale receptive-field information, non-local networks (Non-local) [16] capture long-range dependencies, and transformer-based methods [17] further strengthen global relationship modeling through multi-head self-attention (MHSA). Encouraged by these advances, attention-related ideas have also been introduced into fault diagnosis and have shown good performance in improving feature representation [18,19]. Nevertheless, under varying operating conditions, enhancing feature extraction alone is still insufficient, because the learned features may still be affected by operating-condition-induced distribution discrepancy.
To reduce this discrepancy, unsupervised domain adaptation (UDA) has been introduced into fault diagnosis. By jointly using labeled source-domain data and unlabeled target-domain data for training, UDA aims to transfer diagnostic knowledge from the source domain to the target domain and improve the diagnosis performance on target-domain samples [20]. Existing UDA methods in fault diagnosis mainly include adversarial learning methods and statistical alignment. Adversarial learning methods introduce a domain discriminator to promote feature alignment across domains [21,22], whereas statistical alignment methods reduce domain discrepancy by explicitly matching feature distributions between domains. Since time–frequency representations provide a more informative basis for cross-domain alignment, statistical alignment offers an effective way to reduce feature discrepancy under varying operating conditions. Among such methods, maximum mean discrepancy (MMD) is a widely used criterion for distribution alignment [23,24]. However, conventional MMD is sensitive to the choice of a single kernel and its parameters. Therefore, multi-kernel maximum mean discrepancy (MK-MMD) is adopted to provide a more effective estimation of distribution discrepancy in a multi-kernel space [25].
Based on the above analysis, a domain adaptation method for planetary gearbox fault diagnosis, termed DART18 (Domain Adaptation diagnosis of ResNet18 embedded with a Time–frequency enhanced attention mechanism), is proposed. Specifically, a time–frequency enhanced attention mechanism (TFEAM) is introduced before ResNet18 to refine the input time–frequency representations, while MK-MMD is employed to align the feature distributions of the source and target domains under varying operating conditions. In this way, the proposed method combines input-level time–frequency refinement with cross-domain feature alignment. The main contributions of this study are summarized as follows:
- (1)
- A fault diagnosis method termed DART18 is proposed for planetary gearbox diagnosis under the coexistence of complex signal interference and varying operating conditions.
- (2)
- TFEAM is designed to refine the input time–frequency representations before deep feature extraction, thereby emphasizing fault-sensitive structures and improving the representation capability of the network for fault-related features.
- (3)
- MK-MMD is incorporated into DART18 to reduce the distribution discrepancy between source-domain and target-domain features under varying operating conditions, thereby enhancing cross-domain feature alignment and improving fault diagnosis performance on the target domain.
- (4)
- Extensive domain adaptation experiments are conducted on two planetary gearbox datasets under multiple tasks to validate the effectiveness and robustness of the proposed method.
2. Preliminary
2.1. Problem Definition
To clearly describe the fault diagnosis problem considered in this study, the related definitions are given as follows.
Definition 1
(Domain). Let denote the feature space and denote the common label space with fault categories. A domain is defined as , where denotes the marginal probability distribution over . In the UDA setting, the source domain and target domain are denoted as and , respectively. Although and share the same feature space and label space, their marginal distributions are different, that is, .
Definition 2
(Task). A fault diagnosis task aims to learn a prediction function . In this study, the datasets are sampled from the corresponding source and target domains. The labeled source-domain training set is denoted as , which can be regarded as the labeled historical data collected under a known operating condition. The unlabeled target-domain training set is denoted as , which represents the historical data collected under another operating condition without label information. The target-domain test set is denoted as , which represents the target-domain samples fed into the trained diagnosis model during application.
Definition 3
(Unsupervised Domain Adaptation). Given and , UDA aims to learn a diagnosis model by transferring discriminative fault knowledge from the source domain to the target domain. After training, the samples in are fed into the learned model to evaluate the diagnostic performance. The objective is to reduce the distribution discrepancy between and while preserving discriminative fault-related information.
2.2. Optimal Generalized S-Transform
To better characterize the joint information in the time and frequency domains of planetary gearbox vibration signals, the optimal generalized S-Transform (OGST) is adopted in this study [26,27]. OGST is developed from the S-Transform by introducing a generalized frequency-dependent window, and its basic formulation is briefly described as follows.
The S-Transform is expressed as follows:
where represents the S-Transform result, is the input time-series signal, is the time-shift factor, is the frequency, and is a Gaussian window. The window function is defined as follows:
where , which makes the window wider at low frequencies and narrower at high frequencies.
To better adapt to signals containing both impulsive and narrowband components, the window width is generalized by introducing an exponent .
By substituting into the kernel, the generalized S-Transform can be expressed as follows:
where denotes the generalized S-Transform result.
To obtain a more concentrated time–frequency representation, an appropriate value of should be selected. To quantify the concentration degree of the time–frequency distribution, the corresponding measure is defined as follows:
where is a constant, and denotes the normalized energy of the generalized S-Transform at . The normalized energy satisfies:
A smaller value of indicates a higher concentration of the time–frequency representation. Therefore, the value of that minimizes is selected as the optimal parameter, and the resulting transform is referred to as OGST.
3. Methodology
3.1. Overview
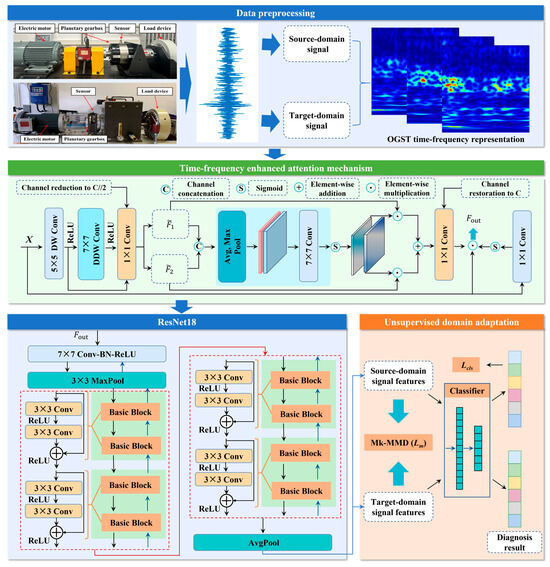
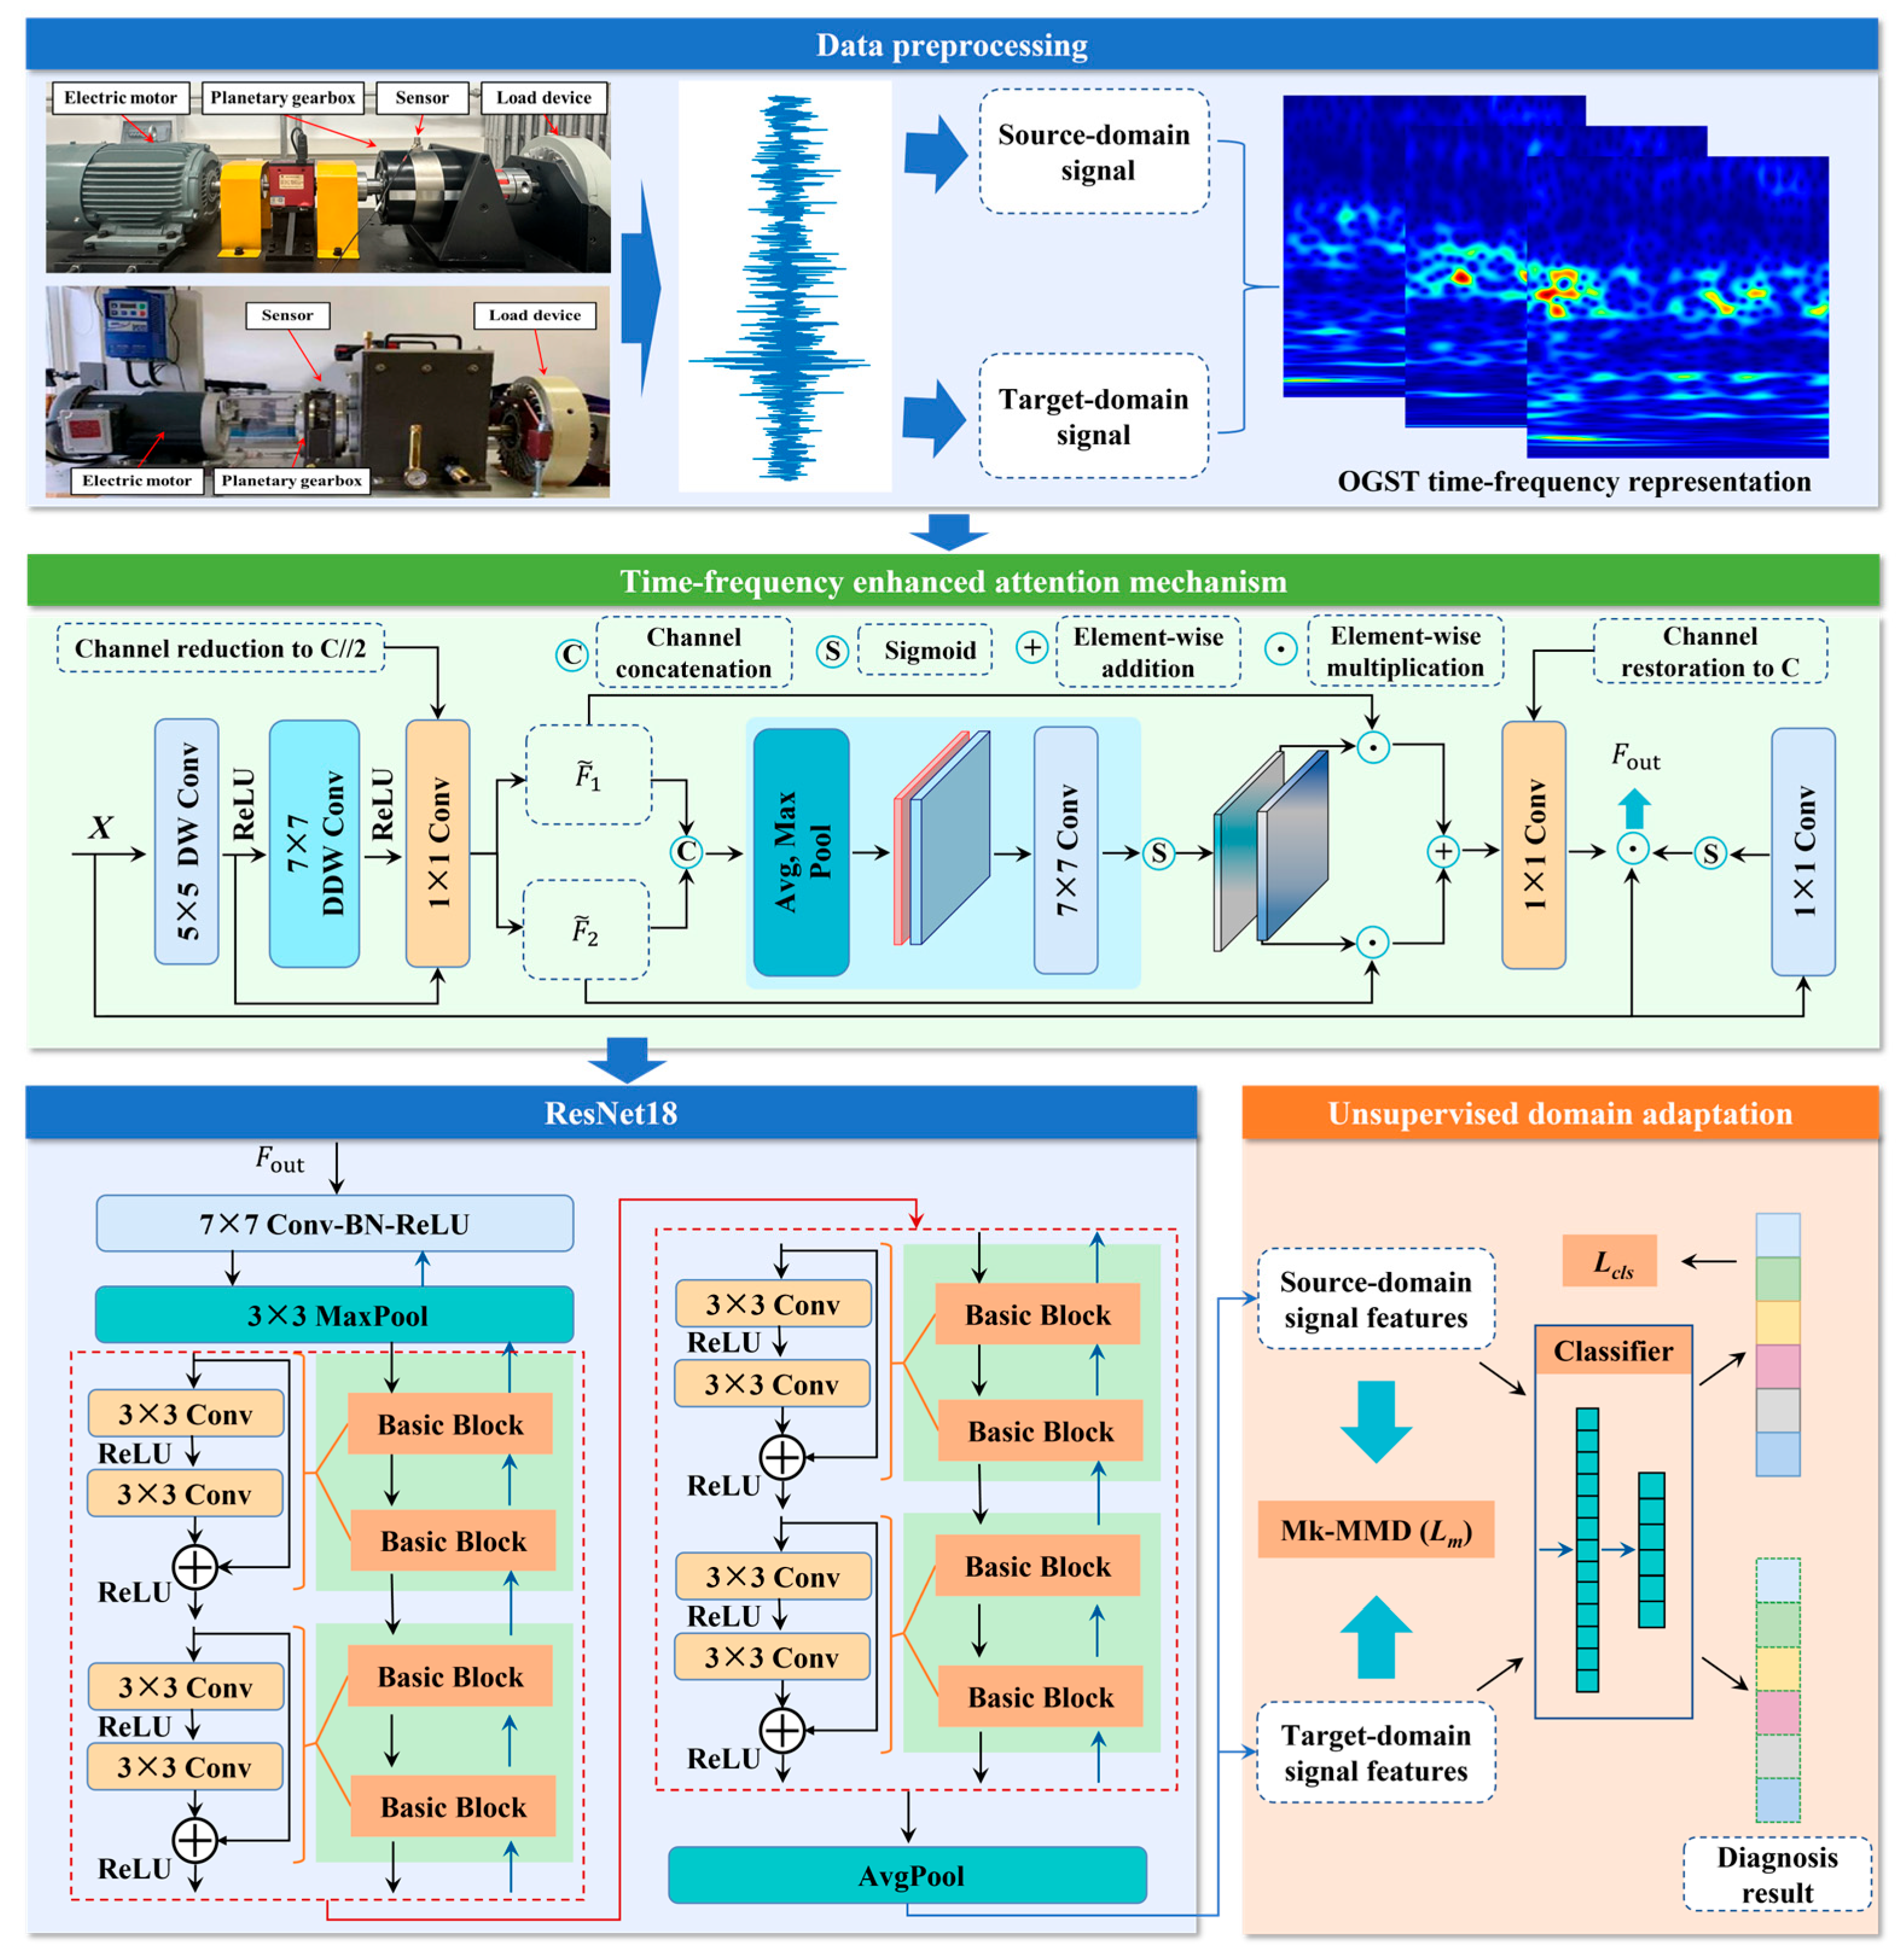
This section presents the overall framework of the proposed DART18 method for planetary gearbox fault diagnosis, as shown in Figure 1. The framework consists of four parts: OGST-based preprocessing, TFEAM, feature extraction, and the UDA stage. First, the raw vibration signals from the source-domain training set and the target-domain training set are transformed into time–frequency representations by OGST. Then, TFEAM is introduced to refine the generated time–frequency representations and enhance fault-related information. The refined representations are subsequently fed into ResNet18 to extract features for model training. In the UDA stage, MK-MMD is employed to align the feature distributions of the source and target domains, producing the alignment loss . Meanwhile, the source-domain features are input into a classifier to compute the supervised classification loss . By jointly optimizing these two losses, the model learns discriminative and transferable features. After training, the samples in are fed into the trained model, and the classifier outputs are used to obtain the diagnosis results.
Figure 1.
Overall framework of the proposed DART18 method for planetary gearbox fault diagnosis. The arrows indicate the workflow, and different colors are used for visual clarity.
3.2. Time–Frequency Enhanced Attention Mechanism
Inspired by the large selective kernel design [28], TFEAM is introduced to refine the OGST-based time–frequency representations before deep feature extraction. Although OGST-based time–frequency representations can characterize signal information from both the time and frequency domains, they may still contain redundant information and disturbance-related responses. Therefore, TFEAM is designed as a front-end refinement module to improve the quality of the input time–frequency representations. By acting directly on the input representations, where the time–frequency structure is still explicitly preserved, TFEAM can emphasize fault-sensitive time–frequency structures and provide more informative inputs for subsequent feature extraction.
Although TFEAM is inspired by the large selective kernel design, the motivations of the two designs are different. The large selective kernel design focuses on remote sensing object detection, where different objects rely on different ranges of spatial context. In contrast, TFEAM is designed for OGST time–frequency representations of vibration signals, aiming to enhance fault-related time–frequency responses before backbone feature extraction. Besides multi-receptive-field feature aggregation, TFEAM further introduces a frequency-aware weighting branch to emphasize informative frequency-related patterns in the input time–frequency representation. Compared with typical visual attention mechanisms such as SKNet, Non-local, and MHSA, TFEAM focuses more on the characteristics of vibration time–frequency representations. It enhances fault-related responses from both receptive-field and frequency-aware perspectives, instead of mainly modeling generic spatial context or global dependencies.
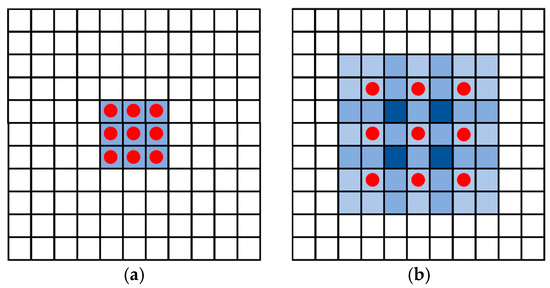
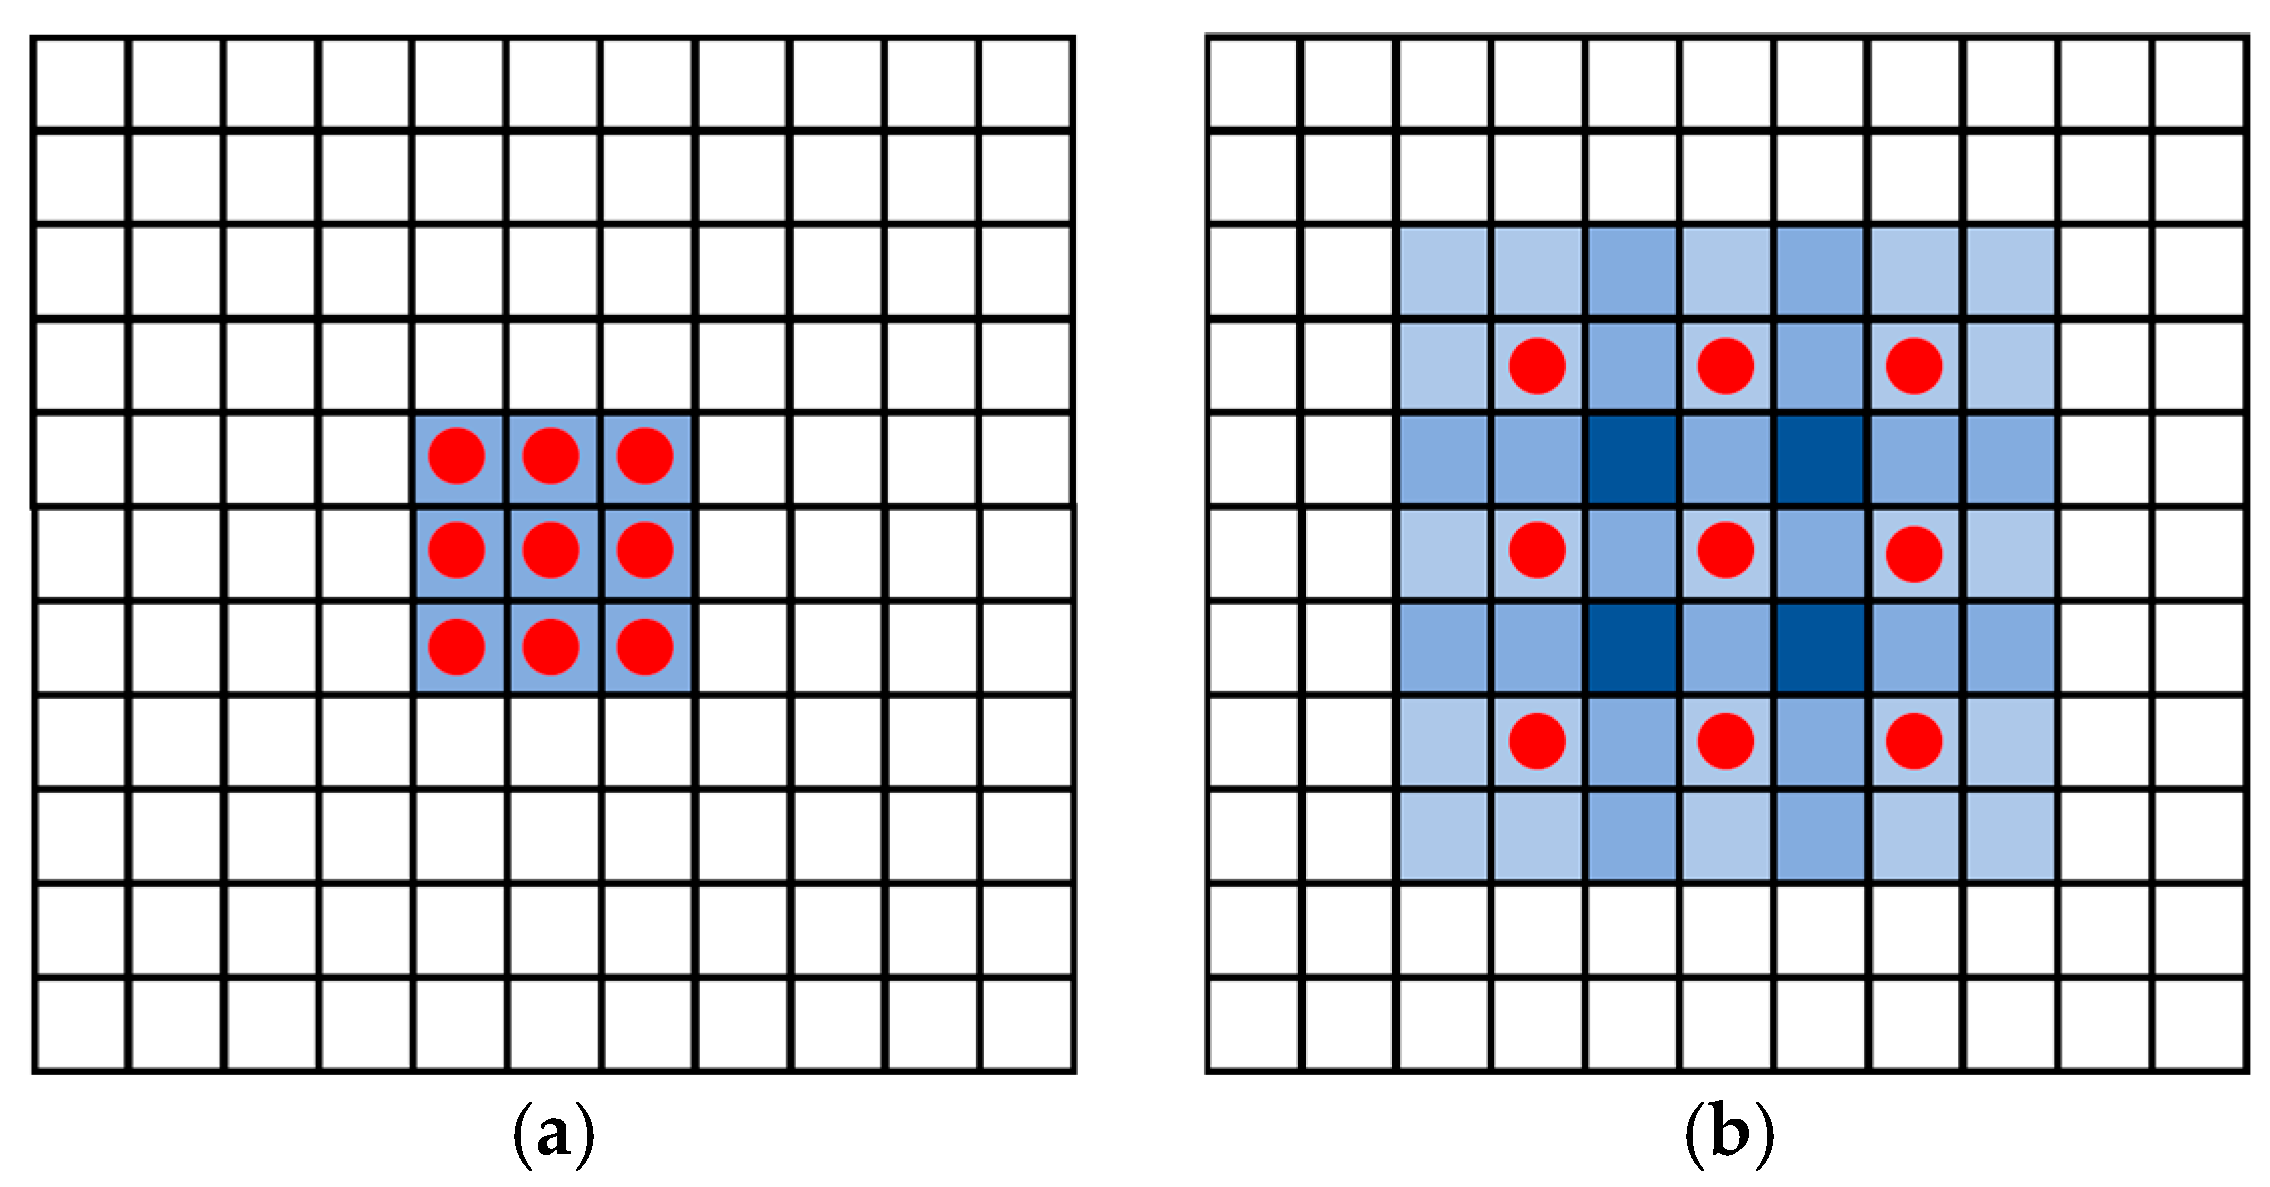
Let the input time–frequency representation be denoted by . To progressively capture informative features, a serial structure consisting of a depthwise convolution and a dilated depthwise convolution with dilation rate is adopted. The former captures local details, whereas the latter enlarges the receptive field without substantially increasing the number of parameters [29], thereby enabling a broader contextual perception. Figure 2 illustrates the difference between standard convolution and dilated convolution. Using a kernel as an example, Figure 2a shows the receptive field of standard convolution, while Figure 2b shows that of dilated convolution with dilation rate . The red dots indicate the actual sampling positions of the kernel. The feature extraction process is given by:
where and denote depthwise convolution and dilated depthwise convolution, respectively, denotes batch normalization, and denotes the activation function.
Figure 2.
Illustration of the receptive fields of standard convolution and dilated convolution with a kernel: (a) standard convolution; (b) dilated convolution (). Red dots indicate the actual sampling positions of the kernel.
To fuse the features extracted from different receptive fields, and are first compressed along the channel dimension by two convolutions, yielding and , respectively. This process is expressed as follows:
where and denote channel-reduction operations.
After channel reduction, the two features are concatenated, and average pooling and max pooling are employed to capture complementary statistical information for spatial attention generation. Based on the pooled descriptors, which are concatenated along the channel dimension, the attention weights for the two branches are obtained as follows:
where denotes channel concatenation, denotes the convolution operation used to generate attention weights, and denotes the sigmoid activation.
Guided by and , the two reduced features are adaptively fused, and the fused feature is expressed as follows:
where denotes element-wise multiplication and denotes the channel-restoration operation.
Furthermore, a frequency-aware weighting branch is introduced to refine the original input representation. The corresponding attention weight is expressed as follows:
where denotes a convolution and is the frequency-aware attention weight.
Finally, the output of TFEAM is obtained by combining the original input, the frequency-aware attention weight, and the fused feature, which can be expressed as follows:
where denotes the output of TFEAM. In (12), is restored to the same channel number as by the channel-restoration operation in (10), and is generated from by the convolution in (11) with the spatial size preserved. Therefore, and have the same dimension as , and the multiplication is performed element by element. Through the above process, TFEAM can enhance fault-related time–frequency structures and provide more informative representations for subsequent feature extraction and domain adaptation.
3.3. Feature Extraction Based on ResNet18
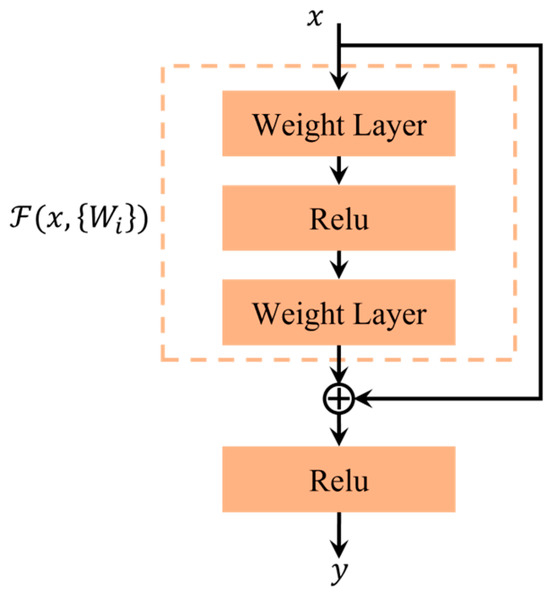
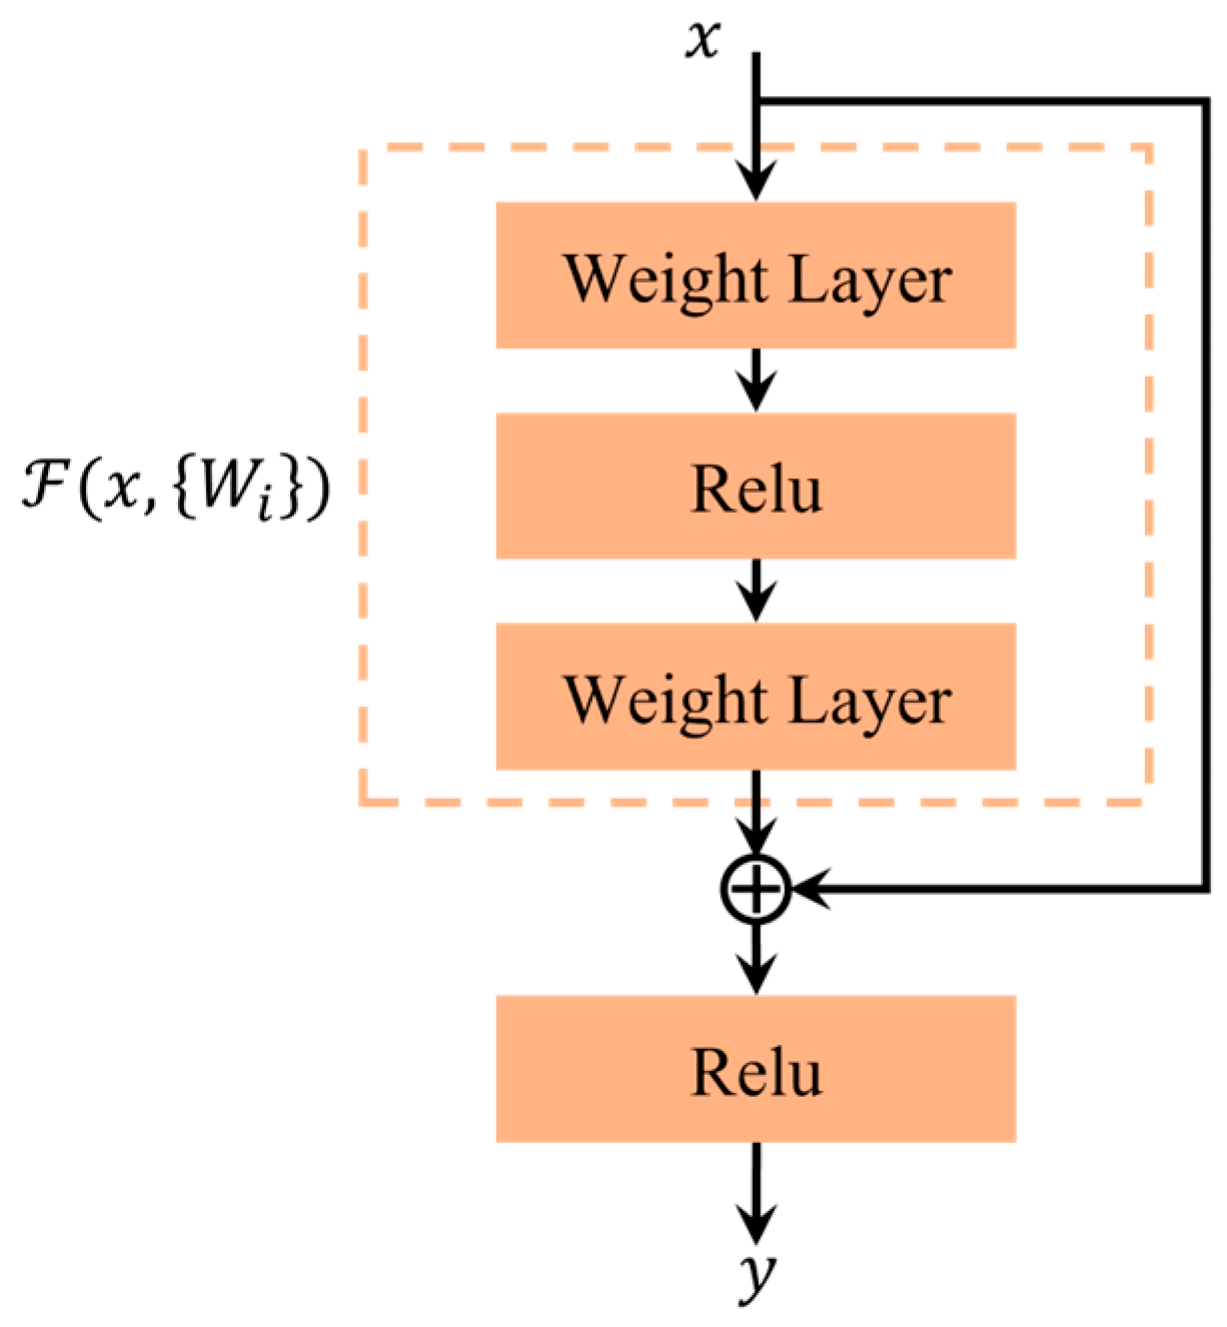
ResNet was proposed to alleviate the degradation problem in deep networks through residual learning [30], and a schematic illustration of the residual learning module is shown in Figure 3. Instead of directly learning the desired mapping, a residual block introduces a shortcut connection to preserve the input information and learn the residual function, which can be expressed as:
where and denote the input and output features of the residual block, respectively, and represents the residual mapping learned by the stacked convolutional layers. In ResNet18, the basic residual unit mainly consists of two convolutional layers together with a shortcut branch, which helps maintain stable information propagation during feature learning.
Figure 3.
Schematic illustration of the residual learning module.
In this study, ResNet18 is employed as the feature extractor to learn deep representations from the enhanced time–frequency representations. Structurally, ResNet18 adopts a relatively lightweight residual architecture, in which residual blocks are stacked to progressively extract hierarchical features from low-level patterns to high-level semantic representations. In fault diagnosis tasks, labeled fault samples are usually not as abundant as those in large-scale natural image datasets, and ResNet18 has been used as an effective backbone in related diagnostic studies [31]. Although deeper variants such as ResNet34 may further improve representation capacity, they also introduce more parameters and computational cost. Therefore, ResNet18 offers a suitable balance between feature extraction ability and model complexity for the present fault diagnosis task. The extracted source-domain and target-domain features are then used for subsequent domain alignment and classification.
3.4. Unsupervised Domain Adaptation Based on MK-MMD
In the UDA setting, only the source-domain samples are labeled, whereas the target-domain samples are unlabeled. Although ResNet18 can extract discriminative fault features from the enhanced time–frequency representations, the feature distributions of the source and target domains may still differ under varying operating conditions, which may degrade the diagnostic performance. To address this issue, MK-MMD is introduced to reduce the domain shift by aligning the deep features of the two domains. Compared with single-kernel MMD, MK-MMD employs a weighted combination of multiple kernels to characterize distribution discrepancy more flexibly.
Let and denote the features extracted from the -th source-domain sample and the -th target-domain sample, respectively. Since the source domain is labeled, the supervised classification loss is defined as:
where denotes the number of source-domain samples, denotes the classifier, is the number of fault categories, and is the one-hot label of the -th source-domain sample.
To align the feature distributions of the source and target domains, the MK-MMD loss is introduced as:
where denotes the number of target-domain samples, denotes the feature mapping to the reproducing kernel Hilbert space, and denotes the Hilbert space induced by kernel . In MK-MMD, the kernel is constructed as a weighted combination of multiple kernels:
where denotes the -th kernel function, is its corresponding weight, and is the number of kernels.
In this study, the number of kernels is set to . Gaussian kernels are used as the base kernels, and uniform weights () are assigned to the three kernels. For bandwidth selection, inspired by the distance-based multi-kernel bandwidth setting in [32], the base bandwidth is computed as the average pairwise squared distance of the combined source-domain and target-domain features. Three adjacent bandwidth scales, , and , are then used to construct the Gaussian kernels. These settings are kept the same in all experiments.
Accordingly, the overall training objective is defined as:
where is the trade-off coefficient. By minimizing , the model learns discriminative fault features from the labeled source domain, while minimizing reduces the feature distribution discrepancy between the source and target domains. In this way, the extracted features are encouraged to be both discriminative and domain-invariant, which is beneficial for improving fault diagnosis performance on unlabeled target-domain samples.
3.5. General Implementation
For each operating condition, the dataset is divided into a training set and a test set. During training, the source-domain training set and the target-domain training set are used for model optimization, while during testing, the target-domain test set is used for diagnosis evaluation. Given the batch size , each epoch contains mini-batch update steps. In each update step, one mini-batch from and one mini-batch from are simultaneously sampled and fed into the network.
For the -th update step, the source-domain features are used to compute the classification loss, and the source-domain and target-domain features are further used to compute the MK-MMD loss. The total loss is then calculated according to (17), where the trade-off coefficient balances the supervised classification loss and the MK-MMD-based domain alignment loss. The model parameters are updated using the AdamW optimizer as:
where denotes the learning rate, and denotes the total loss at the -th update step. After training, the samples in are input into the trained model, and the classifier outputs are taken as the final fault diagnosis results.
The general implementation procedure of the proposed method is summarized in Algorithm 1.
| Algorithm 1: Training procedure of the proposed DART18 |
| . . |
| . . do do Transform the sampled vibration signals into OGST-based time–frequency representations with (4)–(6). Refine the obtained representations through TFEAM and extract source-domain and target-domain features using ResNet18. with (14). with (15). with (17). with (18). end end . |
4. Experimental Validation
4.1. Evaluation Metrics
To evaluate the diagnostic performance of the proposed method, two commonly used metrics, namely Accuracy and macro-averaged F1-score, are adopted. Accuracy reflects the overall proportion of correctly classified samples, while the macro-averaged F1-score treats all categories equally by averaging the F1-score of each class.
- (1)
- Accuracy (Acc). Accuracy is defined as the ratio of correctly classified samples to the total number of test samples, which is given by:where denotes the total number of test samples, and represent the ground-truth label and predicted label of the -th sample, respectively, and is the indicator function.
- (2)
- Macro-averaged F1-score (F1). To further assess the classification performance for each fault category, Precision and Recall are first calculated for each class in a one-vs-rest manner:where , , and denote the numbers of true positives, false positives, and false negatives for class , respectively. Based on Precision and Recall, the F1-score of class is computed as:
Finally, the macro-averaged F1-score is obtained by averaging the class-wise F1-scores over all categories:
4.2. Planetary Gearbox Dataset
4.2.1. Description of Planetary Gearbox Dataset
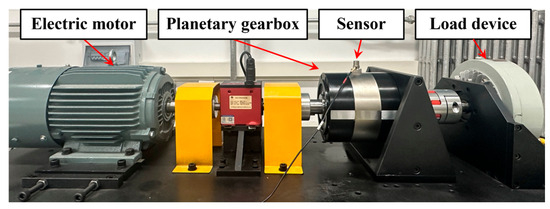
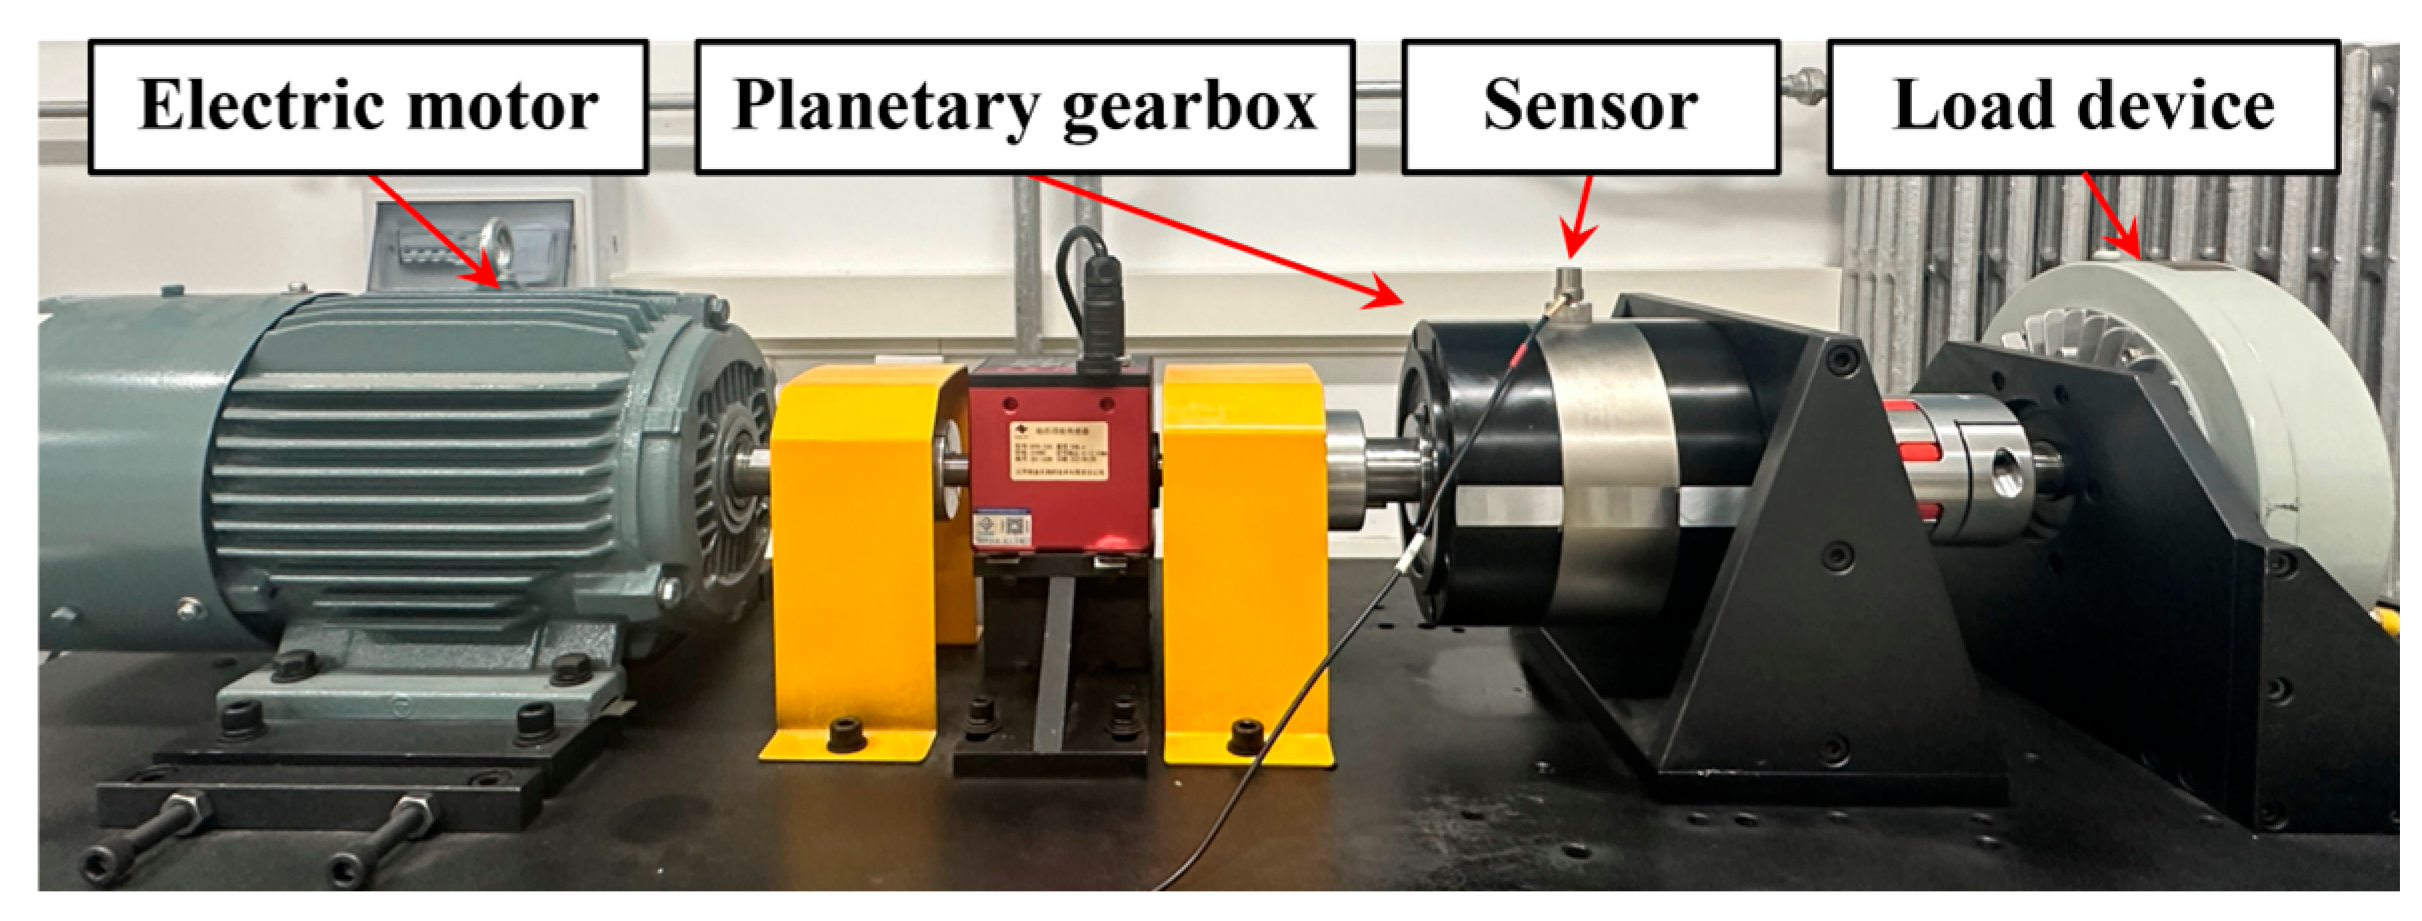
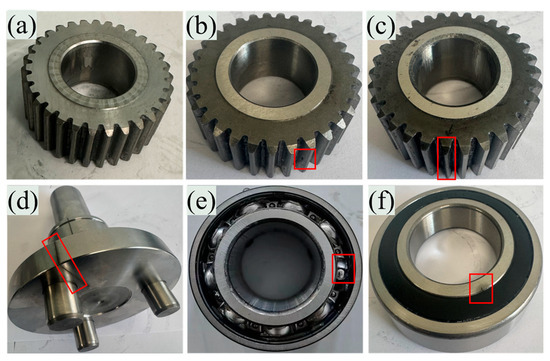
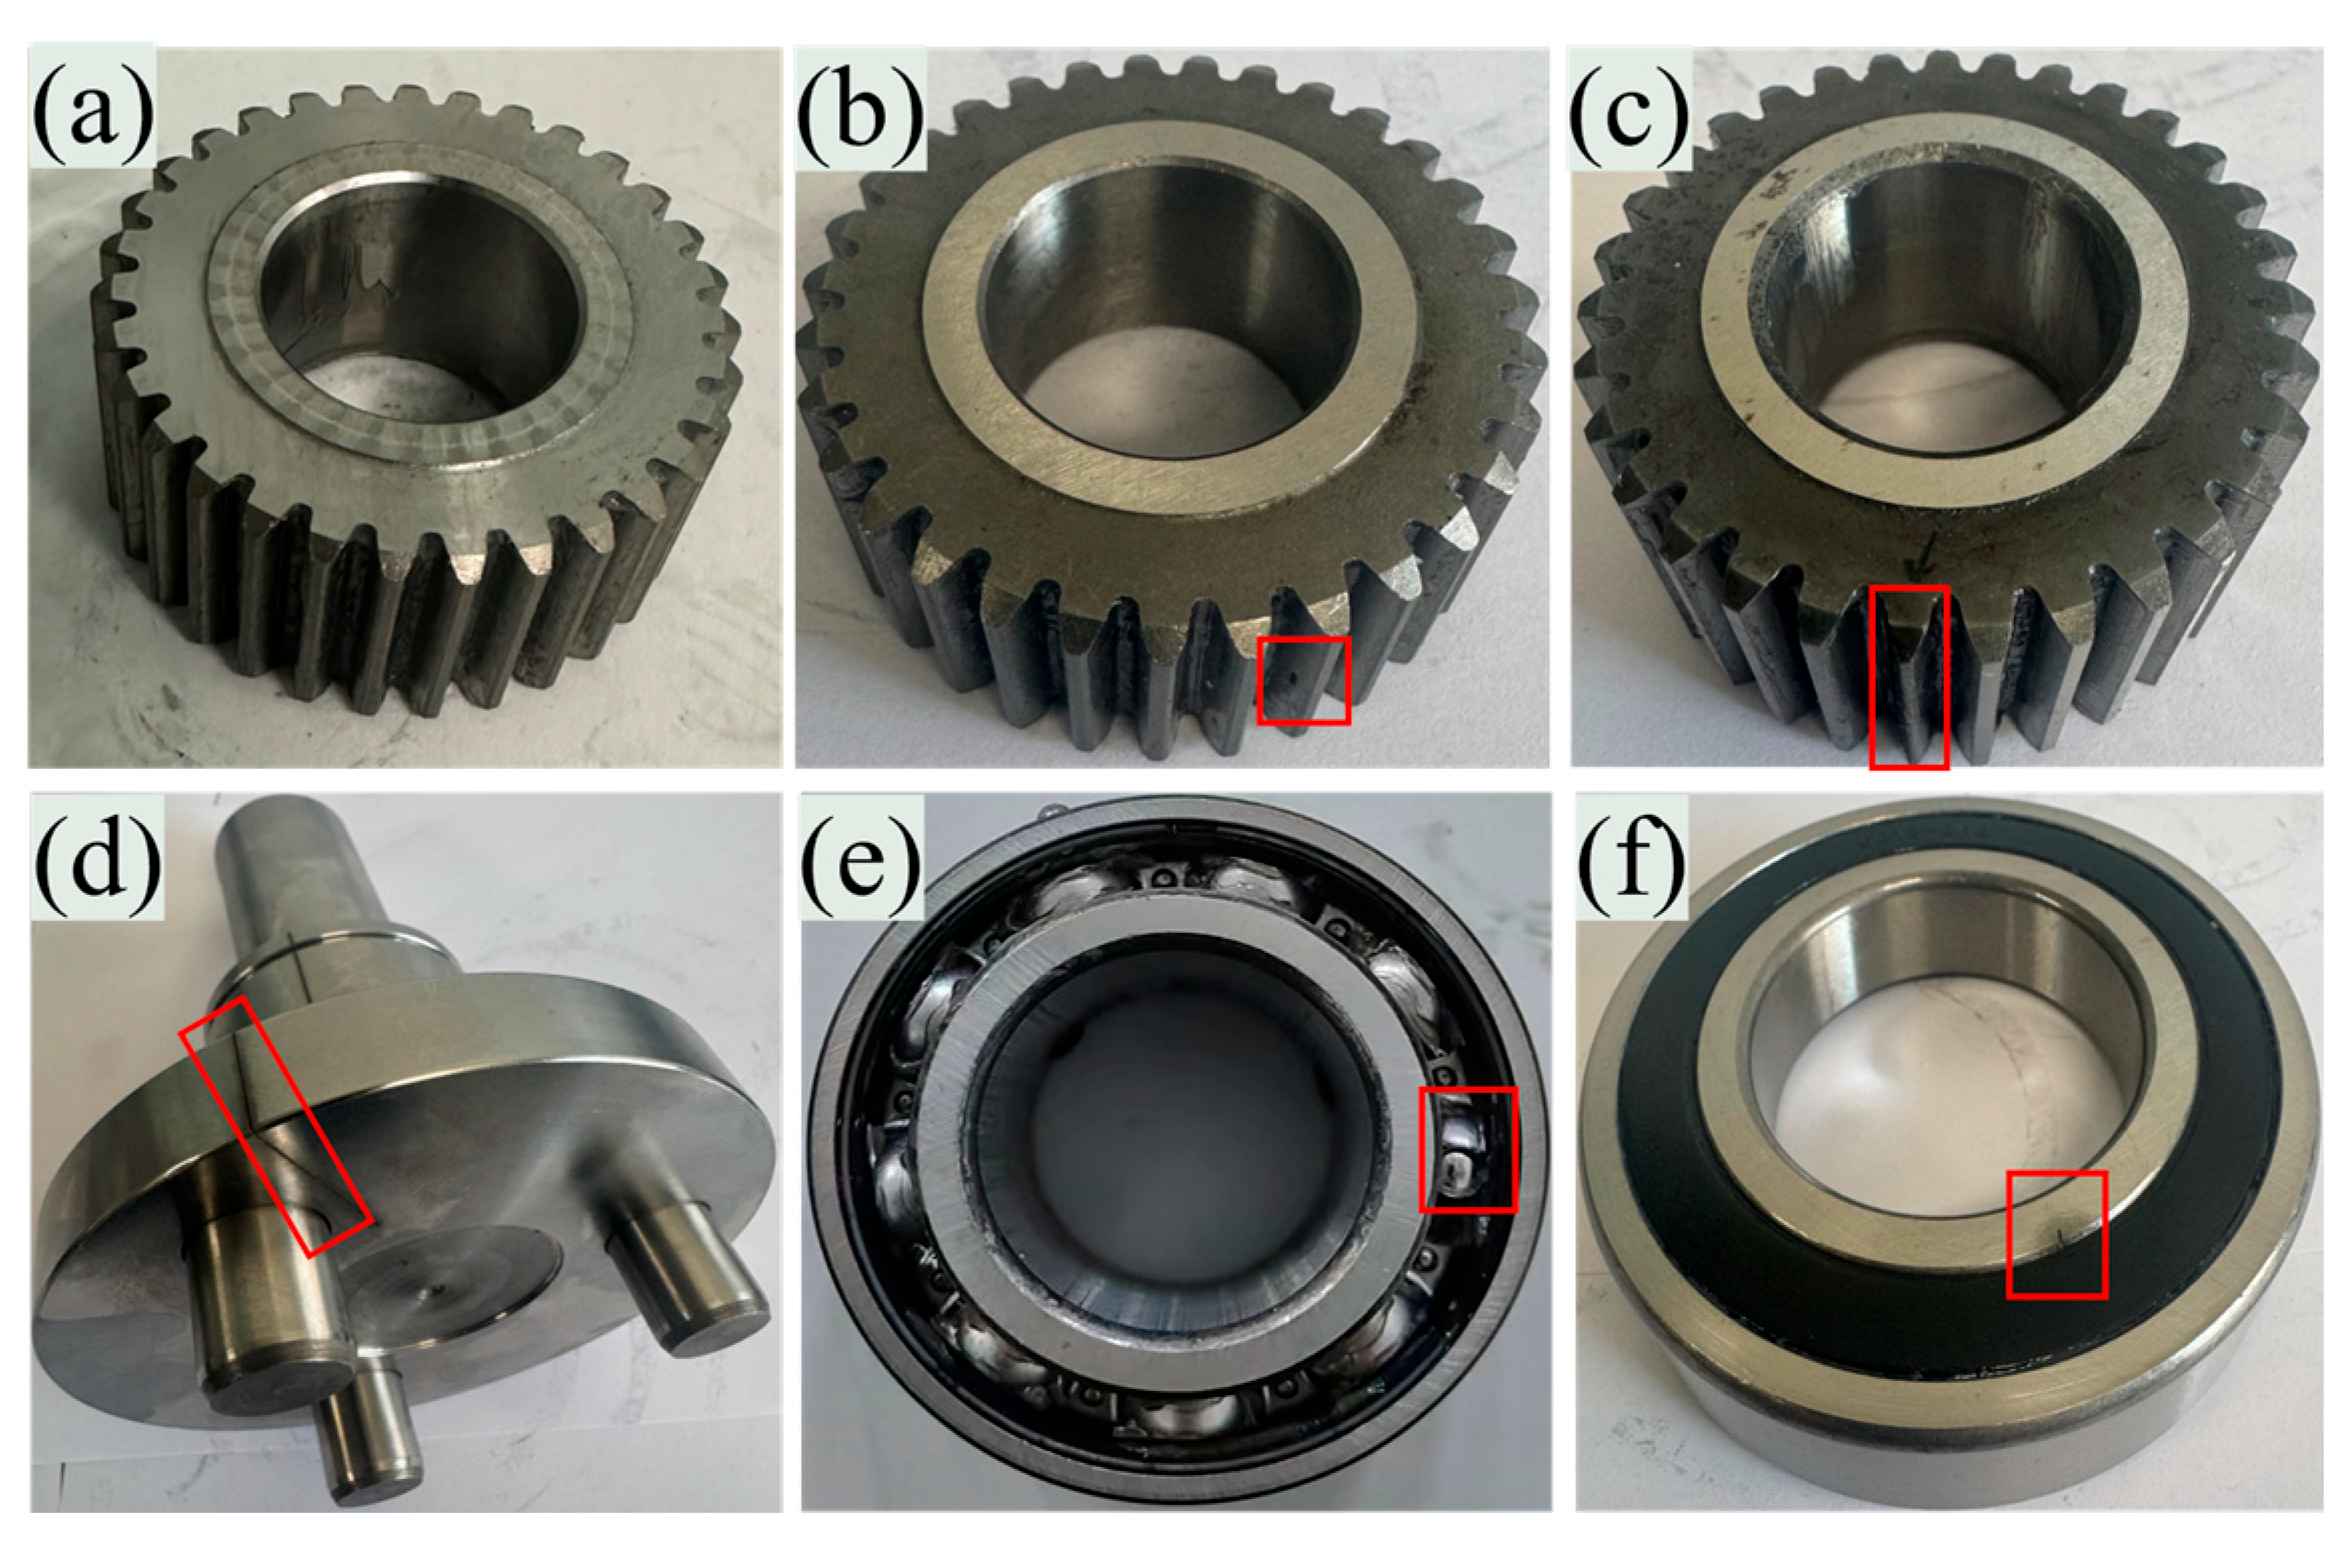
The proposed method is validated using a laboratory dataset collected from a planetary gearbox fault simulation test bench, as shown in Figure 4. Six health states are considered, including normal condition (N), planetary gear pitting (PGP), planetary gear wear (PGW), planet carrier crack (PCC), rolling element pitting of the sun gear bearing (SRP), and inner-race crack of the sun gear bearing (SIC). The normal and faulty conditions are illustrated in Figure 5. Vibration signals are acquired using an accelerometer with a sampling frequency of 12 kHz, and each sample contains 1024 sampling points.
Figure 4.
Experimental setup of planetary gearbox experiments.
Figure 5.
(a) Normal condition, (b) planetary gear pitting, (c) planetary gear wear, (d) planet carrier crack, (e) rolling element pitting of the sun gear bearing, and (f) inner-race crack of the sun gear bearing. The red frames indicate the fault locations.
To construct domain shifts caused by operating condition variations, vibration data are collected under three rotational speeds, namely 1200 rpm, 1500 rpm, and 1800 rpm, which are denoted as D1, D2, and D3, respectively. Each speed is treated as one domain. For each domain, 200 samples are collected in sequence for each health state and then randomly shuffled, with 160 samples randomly selected for training and the remaining 40 samples used for testing.
Accordingly, six cross-domain diagnosis tasks are designed: T1 (D1 → D2), T2 (D1 → D3), T3 (D2 → D1), T4 (D2 → D3), T5 (D3 → D1), and T6 (D3 → D2). In each task, one domain is selected as the source domain and another as the target domain. For example, in T1 (D1 → D2), the source-domain data are collected at 1200 rpm, and the target-domain data are collected at 1500 rpm. Detailed information on the dataset and task settings is summarized in Table 1.
Table 1.
Detailed information on the planetary gearbox dataset and UDA tasks.
4.2.2. Parameter Settings
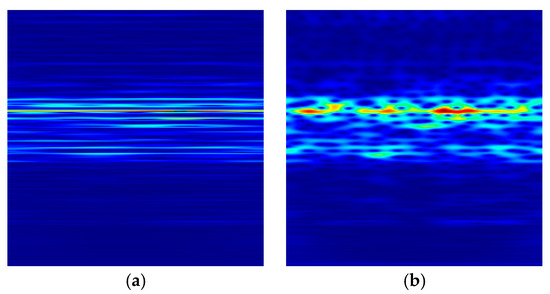
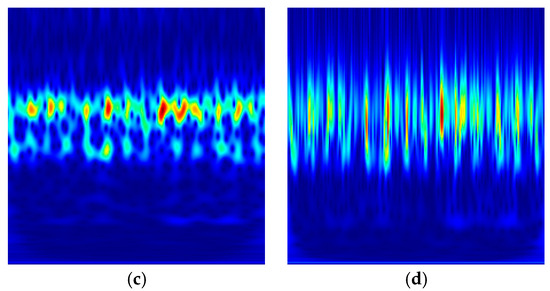
Before the OGST transformation, each vibration sample is normalized using the Z-score method. In the OGST, the parameter is selected according to the time–frequency concentration measure , where a smaller indicates a more concentrated time–frequency representation. Under the 1200 rpm condition, five samples are selected from each health state, and the average is calculated for candidate values from 0.1 to 1.0 with a step of 0.1. The results show that gives the minimum average . Therefore, is set to 0.8 in this study. It should be noted that the 1200 rpm condition is used as a reference condition to determine a fixed OGST parameter before the experiments, and the same is then applied to all source-domain and target-domain samples to keep the time–frequency representations structurally consistent across domains. In practical applications with larger distribution shifts, this parameter may need to be re-estimated using available labeled data from the source domain before model training.
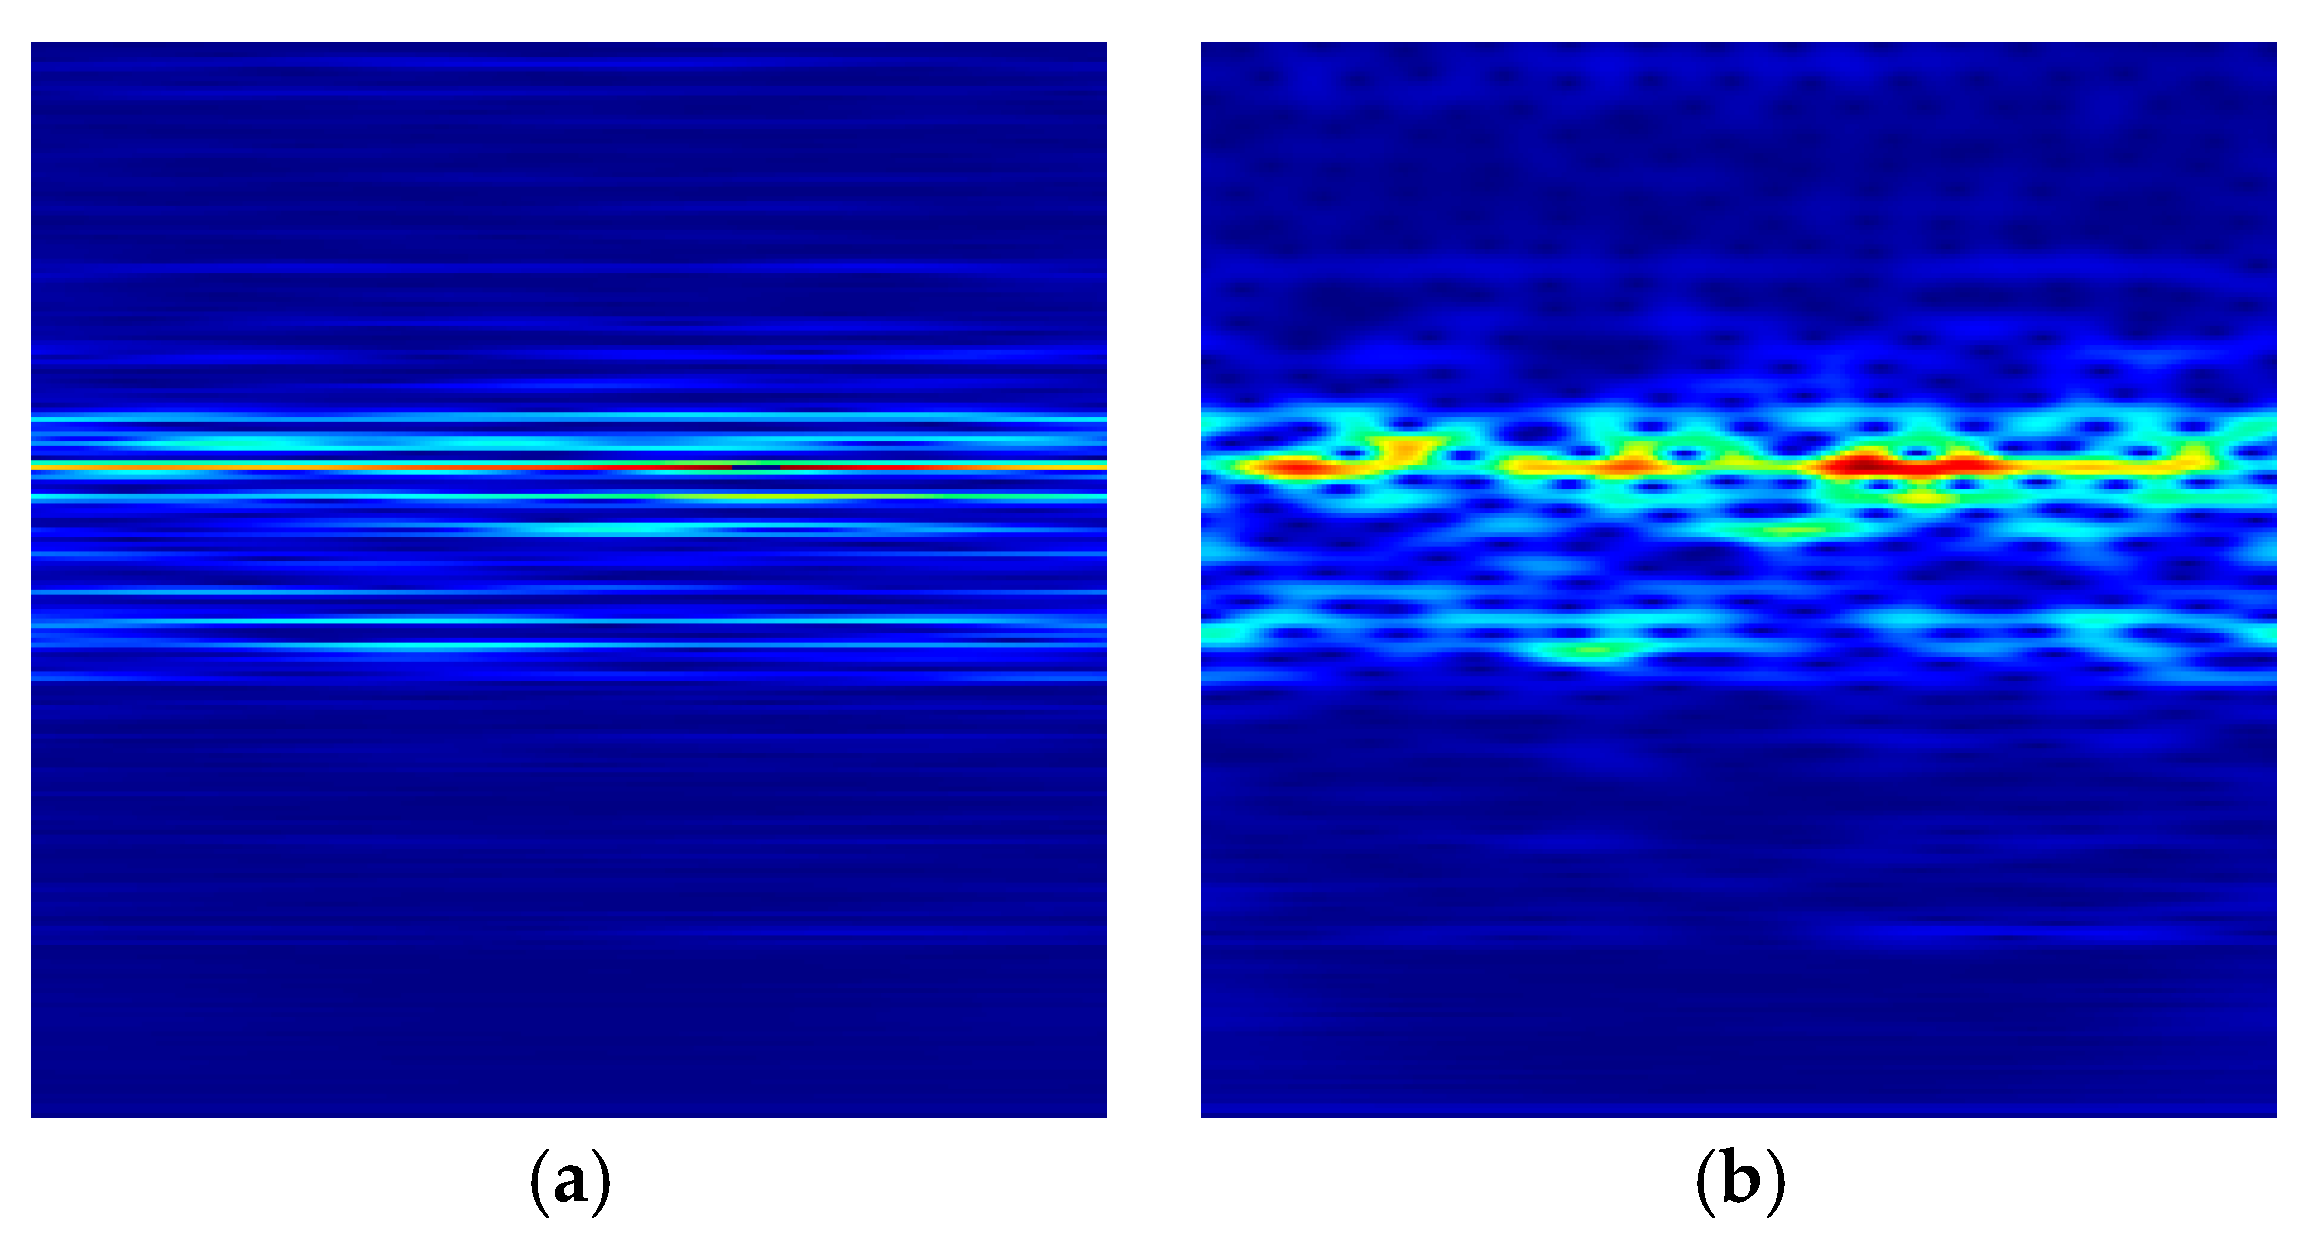
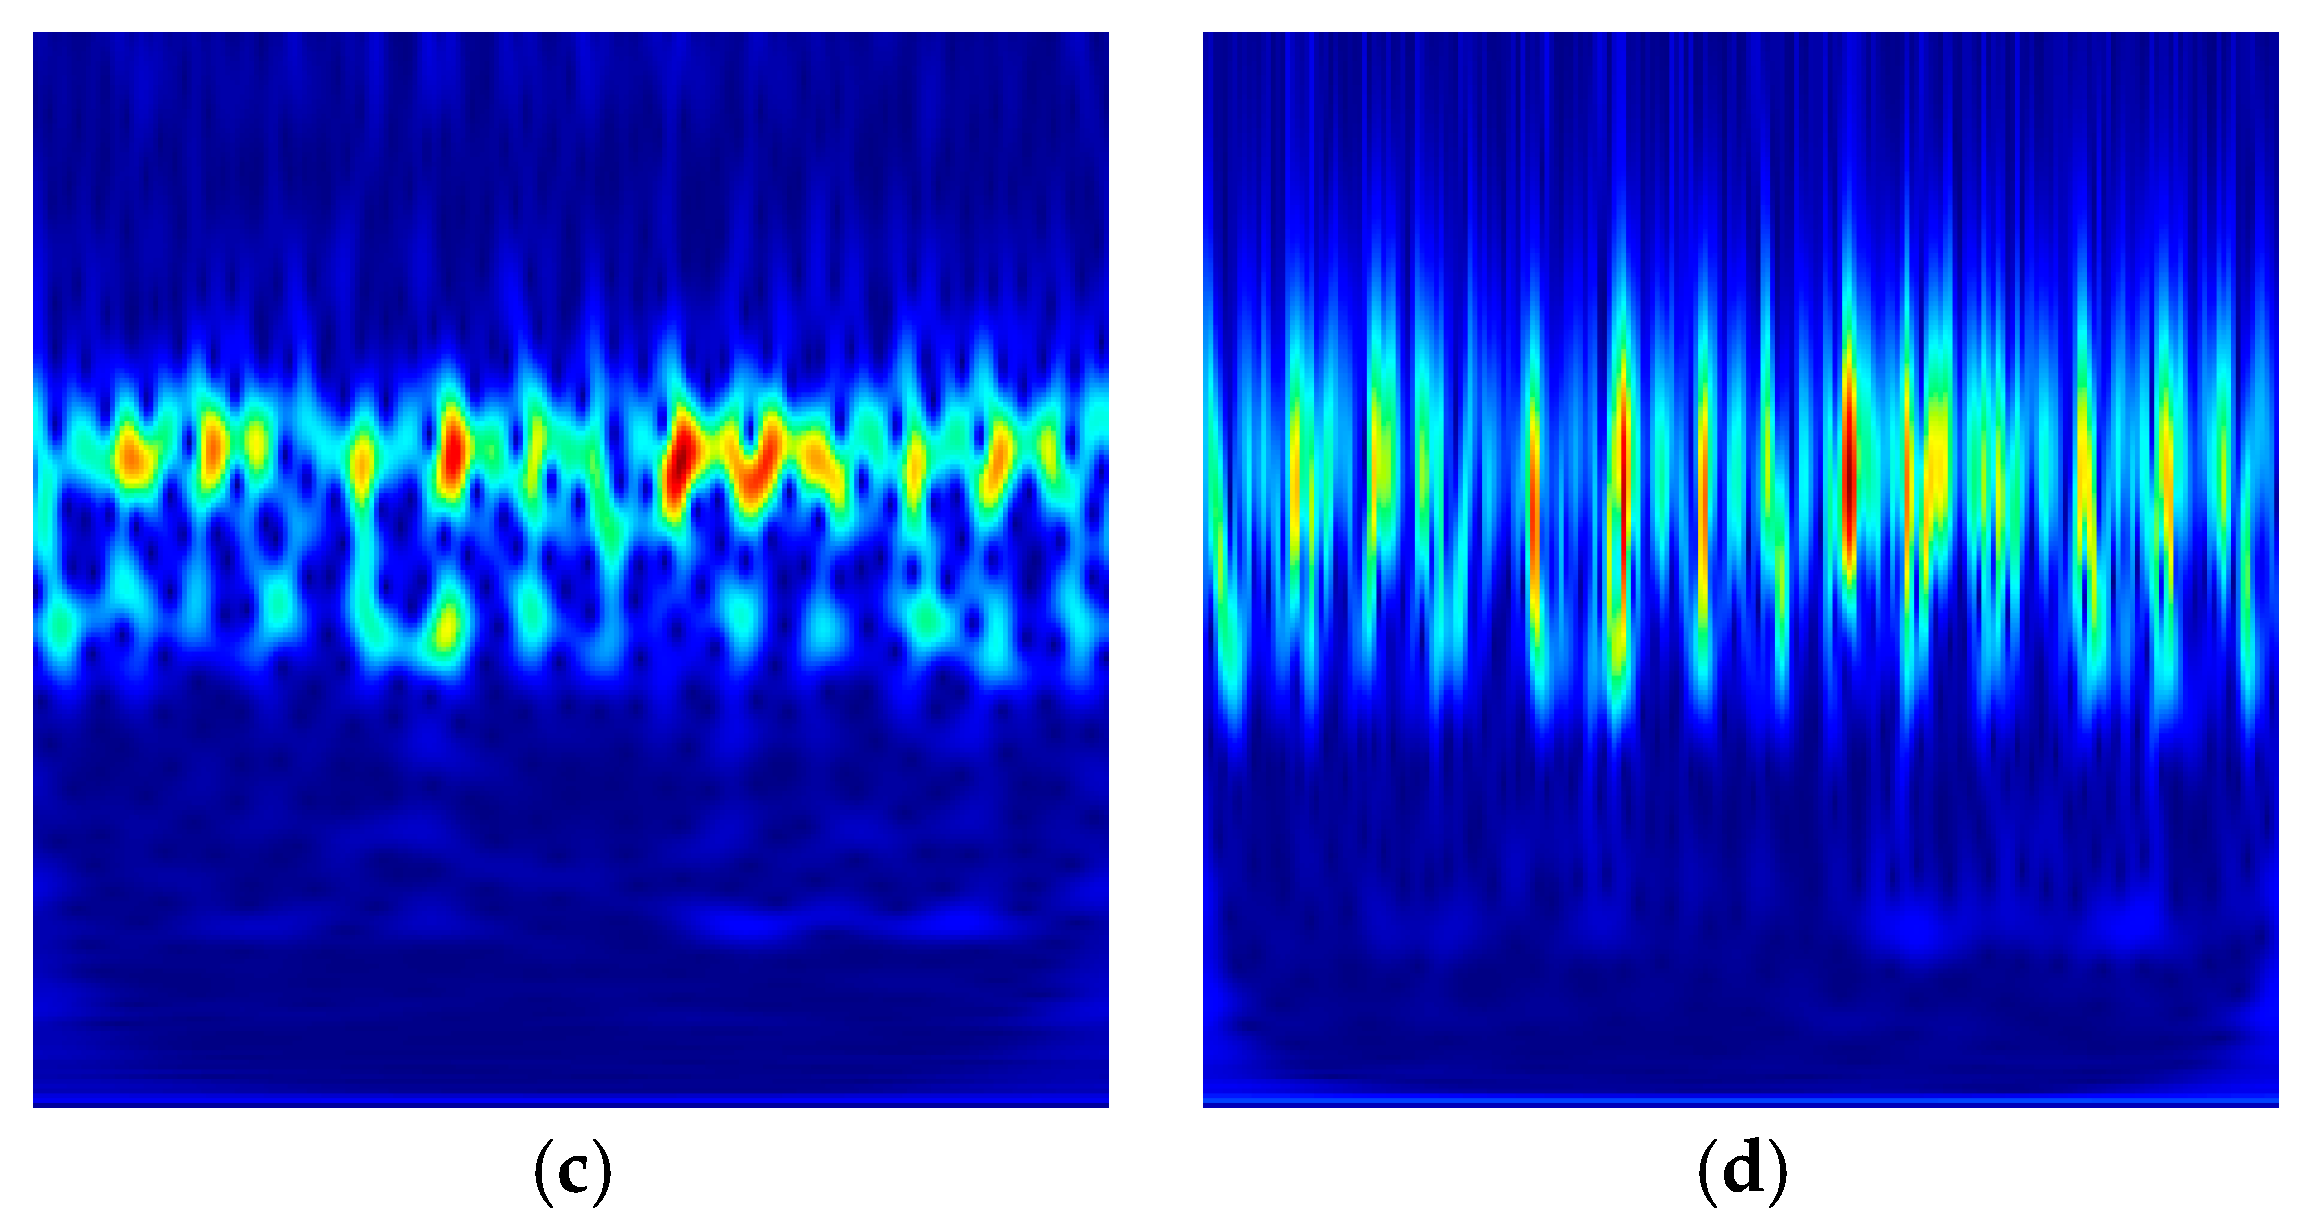
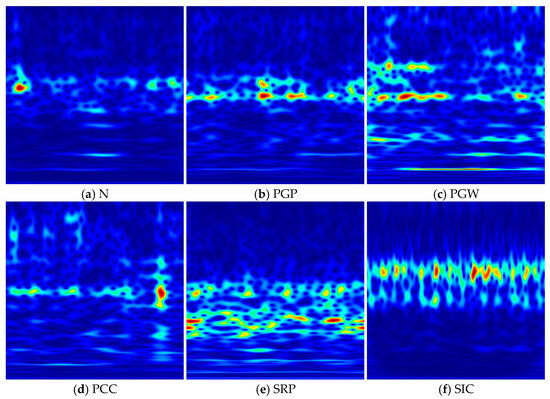
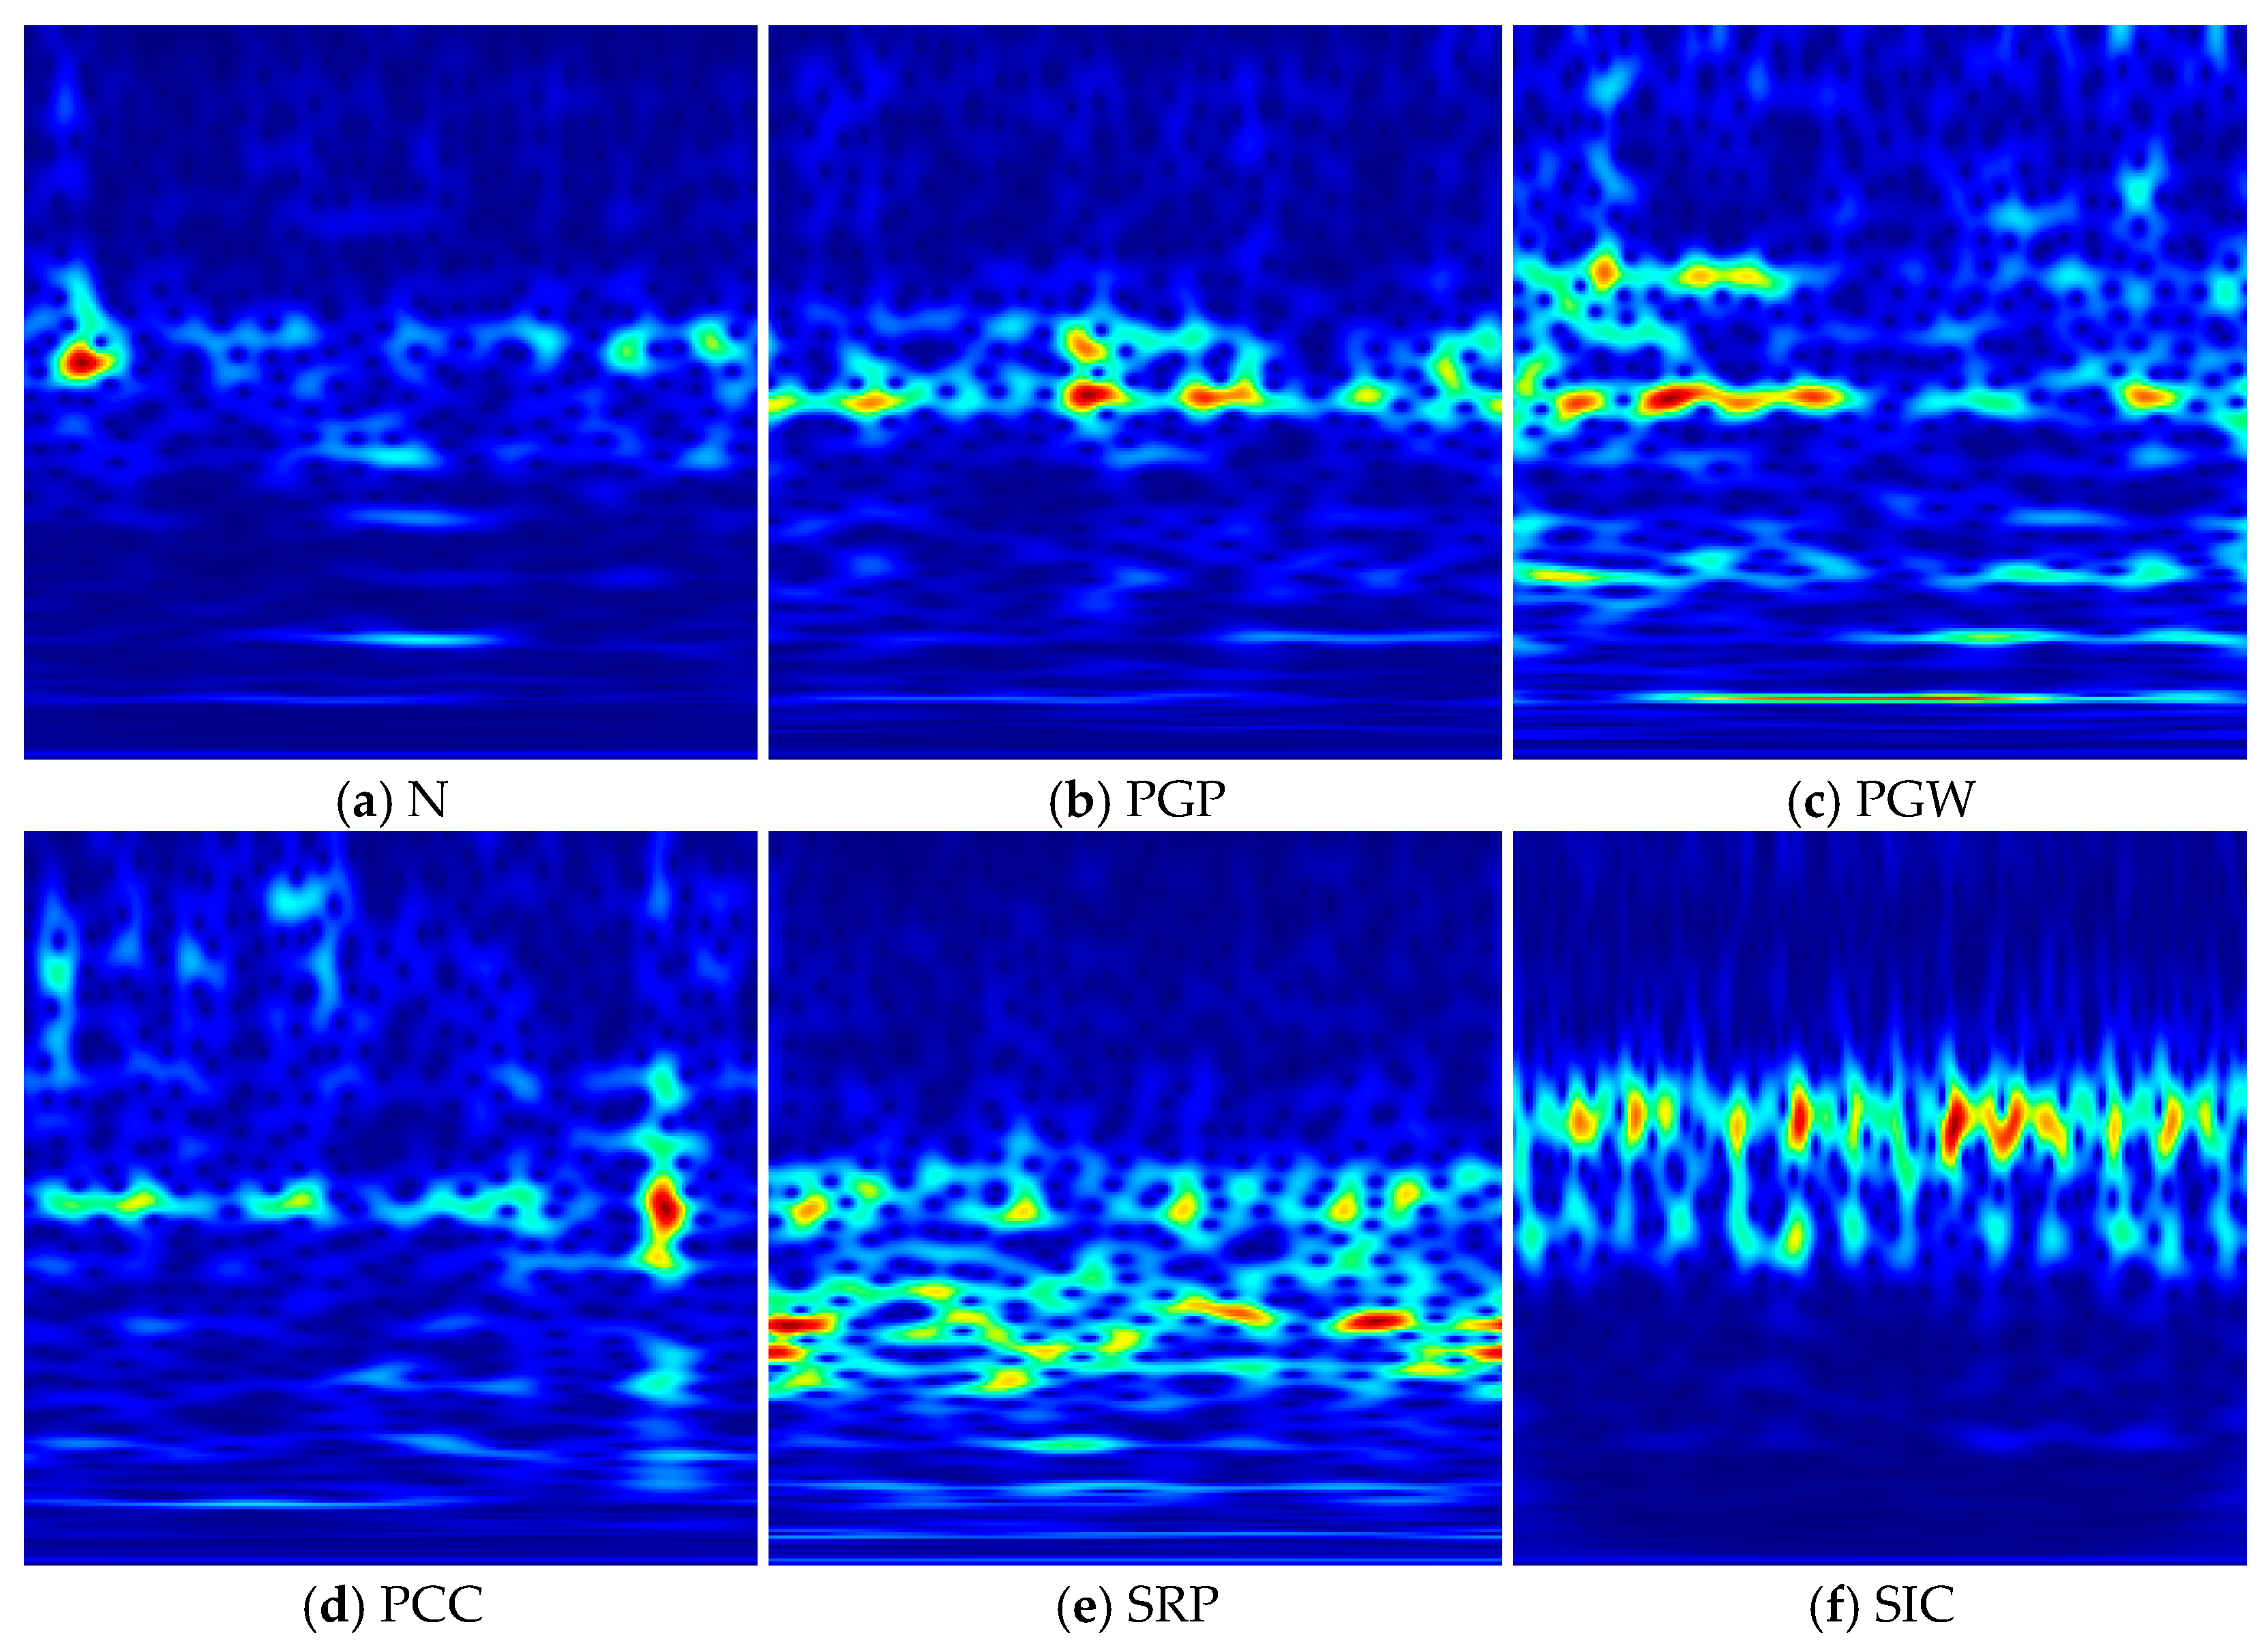
To illustrate the influence of , Figure 6 compares the OGST time–frequency representations of SIC under 1200 rpm when is set to 0.4, 0.6, 0.8, and 1.0. It can be observed that the result obtained with 0.8 exhibits better concentration, which is consistent with the corresponding value. In addition, the frequency analysis range is set to 0–6 kHz to retain sufficient fault-related information [33]. Based on the selected parameter, Figure 7 shows the time–frequency representations of the six health states under 1200 rpm.
Figure 6.
Comparison of OGST time–frequency representations of SIC under 1200 rpm with different values: (a) 0.4, (b) 0.6, (c) 0.8, and (d) 1.0. The color represents the relative energy intensity of the time–frequency representation, with warmer colors indicating higher energy and cooler colors indicating lower energy.
Figure 7.
OGST time–frequency representations of six health states under 1200 rpm with 0.8: (a) N, (b) PGP, (c) PGW, (d) PCC, (e) SRP, and (f) SIC. The color represents the relative energy intensity of the time–frequency representation, with warmer colors indicating higher energy and cooler colors indicating lower energy.
The model is trained using the AdamW optimizer. The main hyperparameter values used in model training are summarized in Table 2. All experiments are conducted on a Windows 10 operating system. The algorithms are implemented using Python 3.9 and PyTorch 2.5.1 with CUDA 12.1. The computational platform consists of an Intel Core i5-13400F CPU and a GeForce RTX 4060 GPU.
Table 2.
Hyperparameter values.
4.2.3. Comparison Methods
To validate the effectiveness of the proposed method, five representative UDA methods are selected for comparison. For a fair comparison, all methods use the same OGST-based inputs, data splits, basic training hyperparameters, and ResNet18-based feature extraction stage, while each method retains its own domain adaptation strategy.
- (1)
- DANN [34]: Domain-Adversarial Neural Networks introduces a domain classifier and employs adversarial training to learn domain-invariant features, so that the extracted representations are discriminative for fault classification while being less sensitive to domain differences.
- (2)
- DSAN [35]: Deep Subdomain Adaptation Network aligns the relevant subdomains of source and target data based on local maximum mean discrepancy (LMMD), which helps reduce class-wise distribution discrepancy across domains without using adversarial training.
- (3)
- CORAL [36]: Deep CORAL reduces domain shift by aligning the second-order statistics of source and target feature representations, thereby encouraging the learned features to have similar correlation structures in different domains.
- (4)
- BNM [37]: Batch Nuclear-norm Maximization improves target prediction discriminability and diversity by maximizing the nuclear norm of the batch prediction matrix, which has been shown to be effective in label-insufficient settings such as UDA.
- (5)
- MCD [38]: Maximum Classifier Discrepancy employs two task classifiers to measure the discrepancy between their predictions on target samples, and then reduces this discrepancy through feature adaptation so that target features are aligned with the support of source classes.
4.2.4. Analysis of Experimental Results on the Planetary Gearbox Dataset
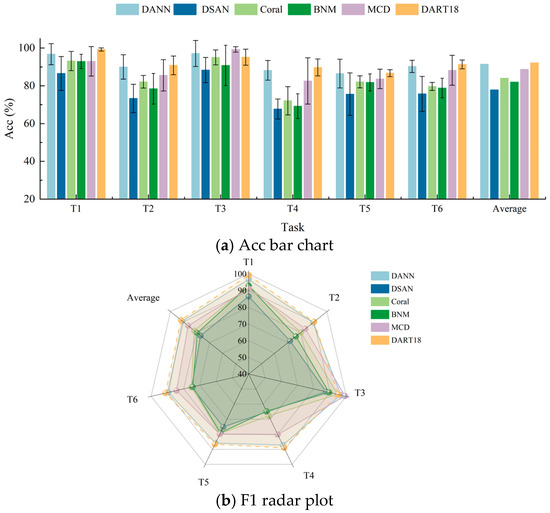
Table 3 reports the diagnostic results of different methods on the six UDA tasks of the planetary gearbox dataset, together with the average results over all tasks. For each task, the diagnostic performance is evaluated using Acc and F1, and all results are presented as mean ± standard deviation over ten runs. In addition, Figure 8 provides a visual comparison of the two metrics, where Figure 8a shows the Acc bar chart and Figure 8b presents the F1 radar plot.
Table 3.
Comparison results of different methods on six UDA tasks of the planetary gearbox dataset.
Figure 8.
Visual comparison of Acc and F1 results of different methods on the planetary gearbox dataset.
Both Table 3 and Figure 8 show that the proposed DART18 achieves the best overall performance among all compared methods. Specifically, it obtains an average Acc of 92.17% and an average F1 of 91.90%, which are higher than those of the best comparison method, DANN, by 0.71 and 1.03 percentage points, respectively. These results indicate that the proposed method achieves the highest average diagnostic performance under different tasks.
To further examine the statistical reliability of the overall performance differences, a two-sided 95% confidence interval (CI) is calculated for each paired comparison based on the paired task-run results from the six UDA tasks and ten runs, as reported in Table 4. The mean difference is defined as DART18 Avg minus Comparison Avg. A difference is considered statistically significant when the two-sided 95% CI does not include zero. DART18 achieves positive mean differences over all comparison methods in both Acc and F1. The improvements over DSAN, CORAL, BNM, and MCD are statistically significant, while the differences between DART18 and DANN are not significant.
Table 4.
95% CI analysis of paired performance differences between DART18 and comparison methods on the planetary gearbox dataset.
From the task-wise results, T4 is the most challenging task, since most methods achieve relatively limited performance on this task. Even in this case, DART18 still obtains 89.71 ± 4.50% Acc and 89.05 ± 5.18% F1, which are the best results among all methods. This further demonstrates the effectiveness of the proposed method under challenging domain adaptation conditions.
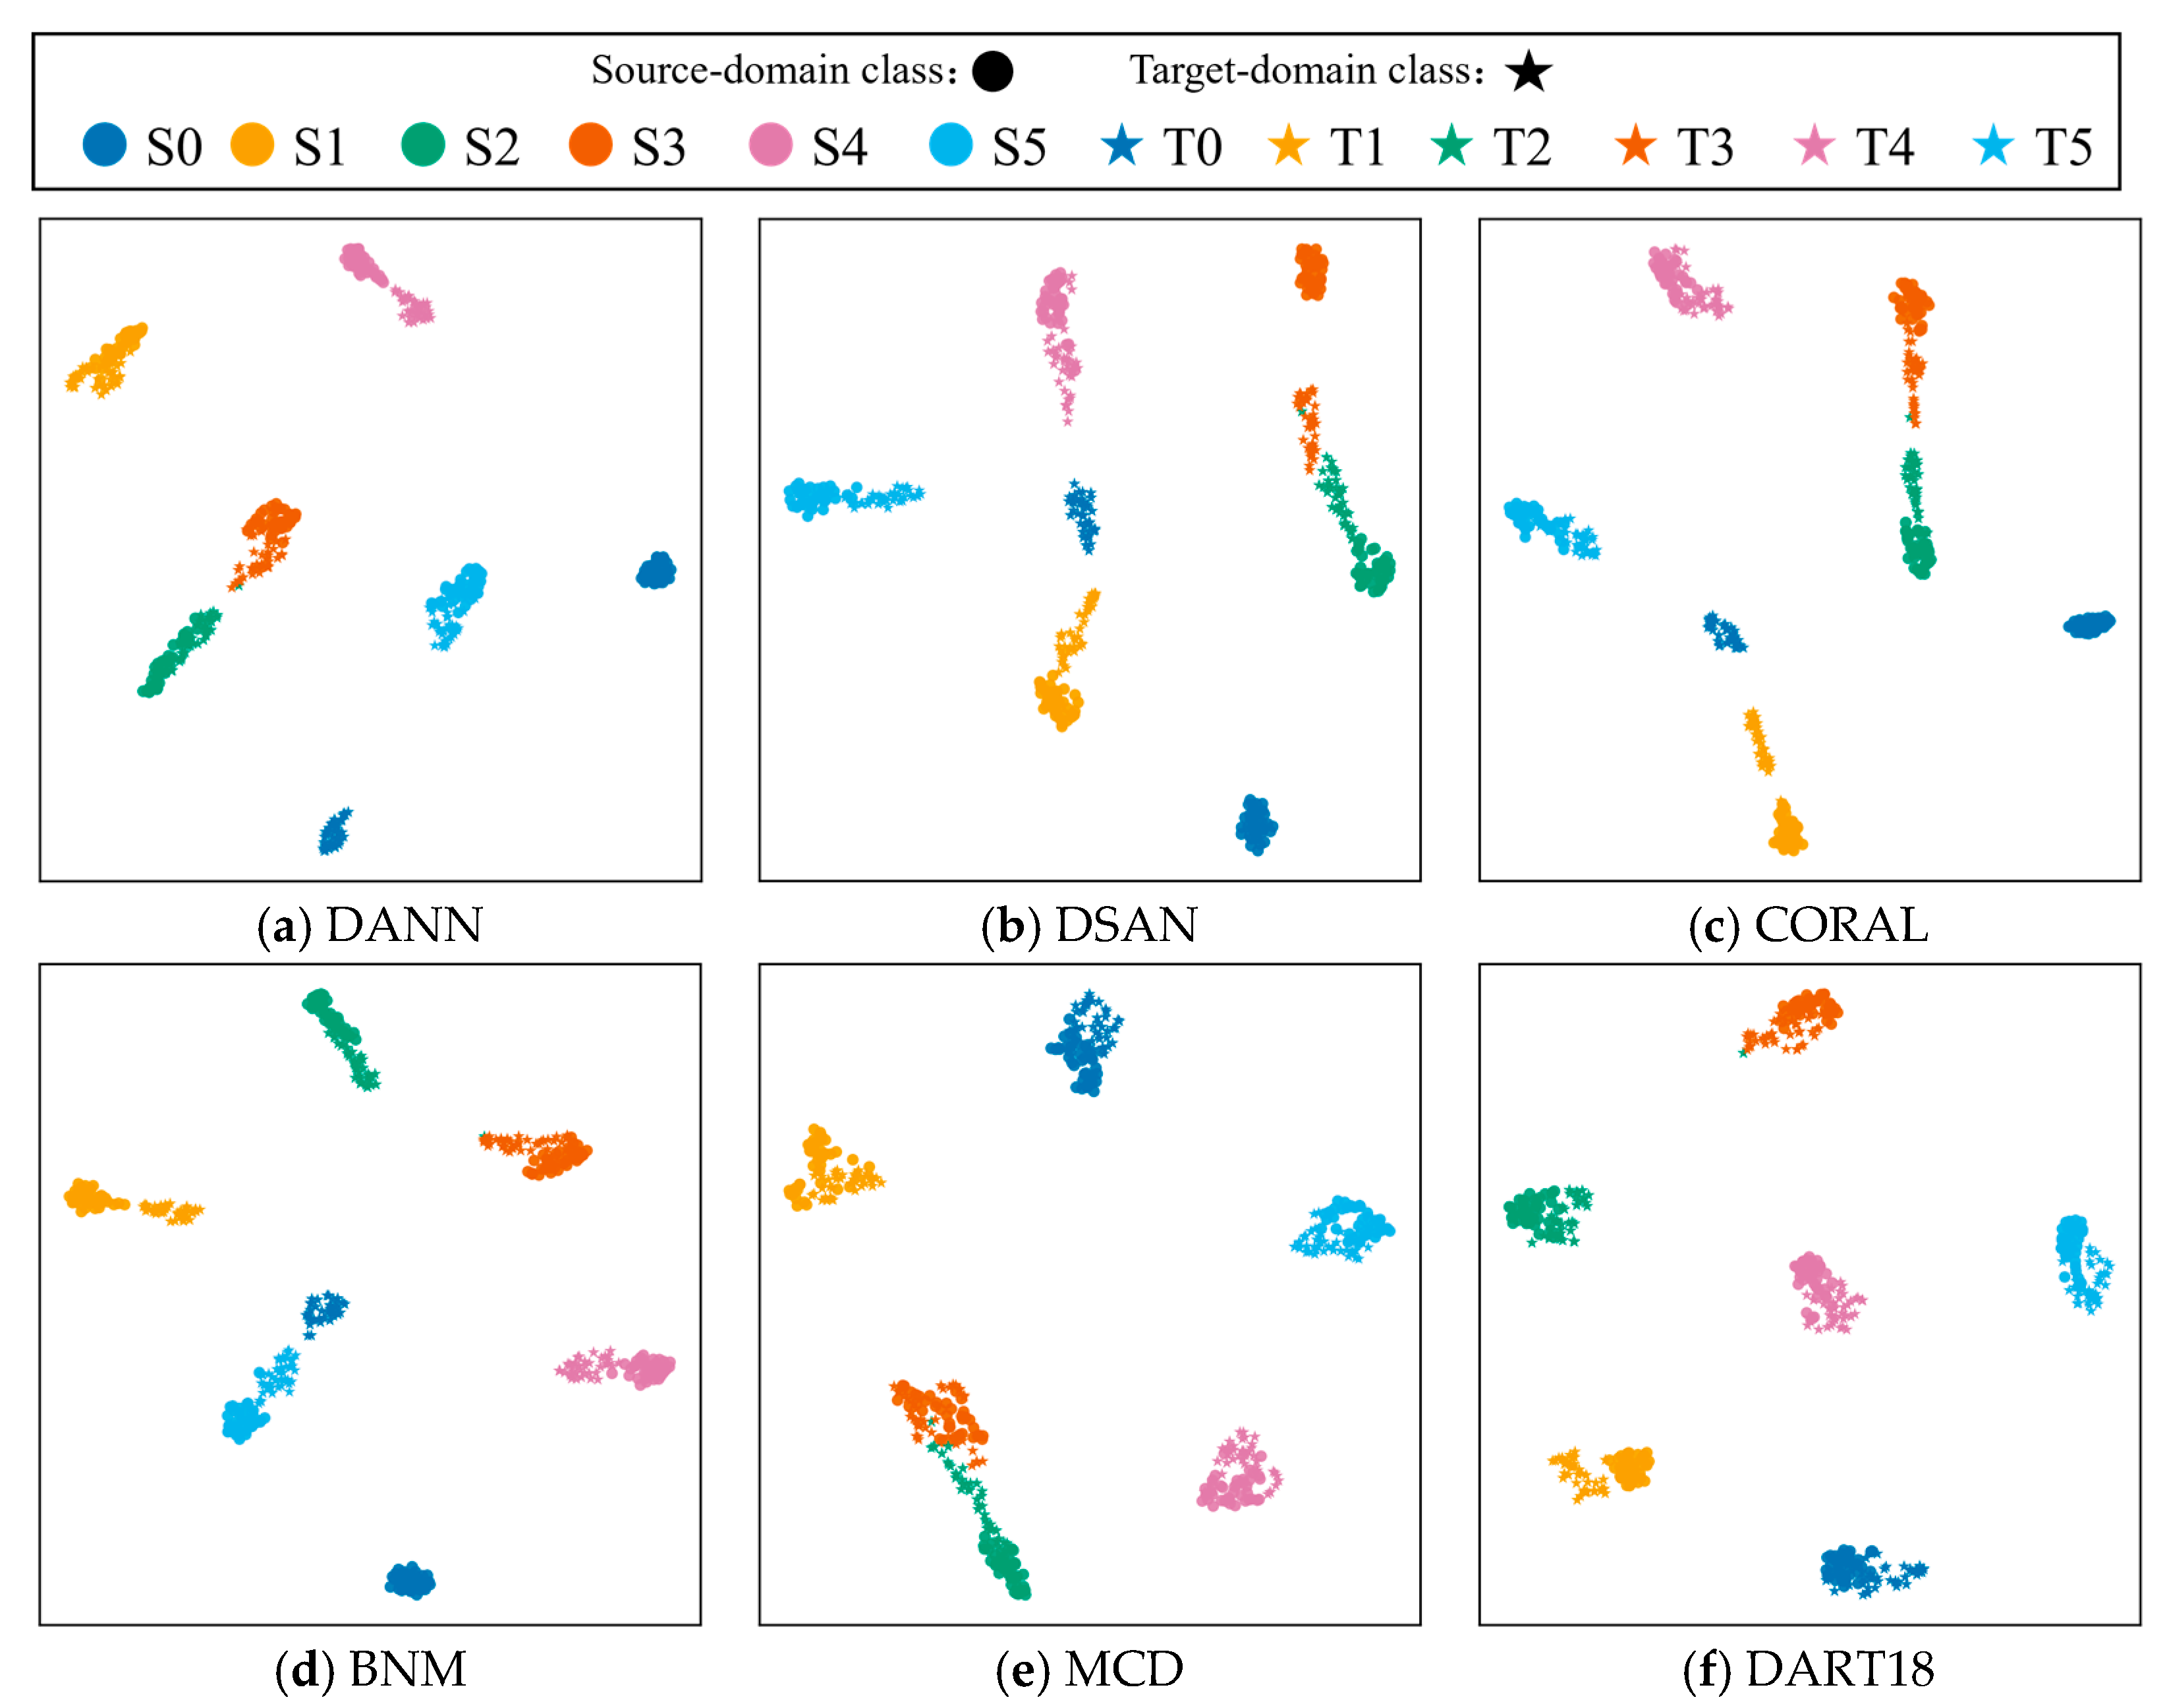
To further illustrate the learned feature distributions, t-distributed Stochastic Neighbor Embedding (t-SNE) [39] is employed to visualize the features extracted before the final classifier of each method for Task T1 on the planetary gearbox dataset, as shown in Figure 9. The visualization is generated using the run whose diagnostic result is closest to the 10-run mean. During testing, the target-domain test samples and the source-domain test samples not involved in training are processed by the same trained model, and their extracted features are visualized in the same space. The analysis focuses on whether source- and target-domain samples from the same class are well aligned and whether different classes can be clearly separated.
Figure 9.
t-SNE visualization of all compared methods on Task T1 of the planetary gearbox dataset.
Overall, the compared methods still exhibit varying degrees of source–target mismatch. DSAN shows the most scattered feature distributions, and the source- and target-domain samples are not well aligned. DANN and CORAL form more recognizable class structures, but visible source–target offsets remain in several classes, indicating that good classification performance does not necessarily mean sufficient domain alignment. BNM shows more balanced distributions with improved alignment in some classes, while MCD further enhances source–target aggregation but still retains slight residual separation.
In contrast, DART18 produces more compact intra-class distributions and clearer inter-class boundaries. The source- and target-domain samples of the same class are also more consistently aligned, indicating that DART18 can better reduce domain discrepancy while preserving class discriminability. This visualization complements the quantitative results in Table 3 from the perspective of feature distribution and domain alignment.
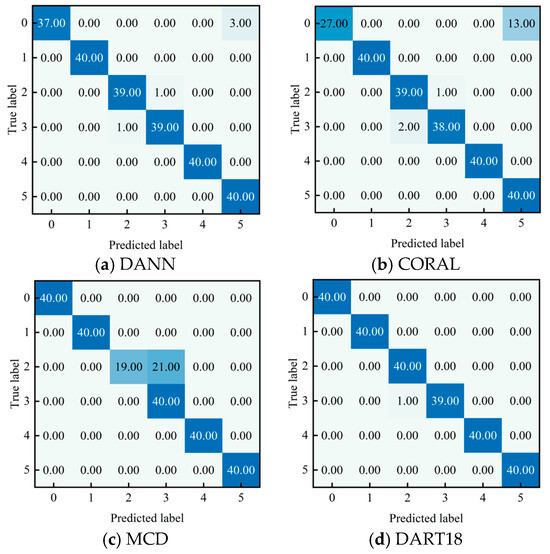
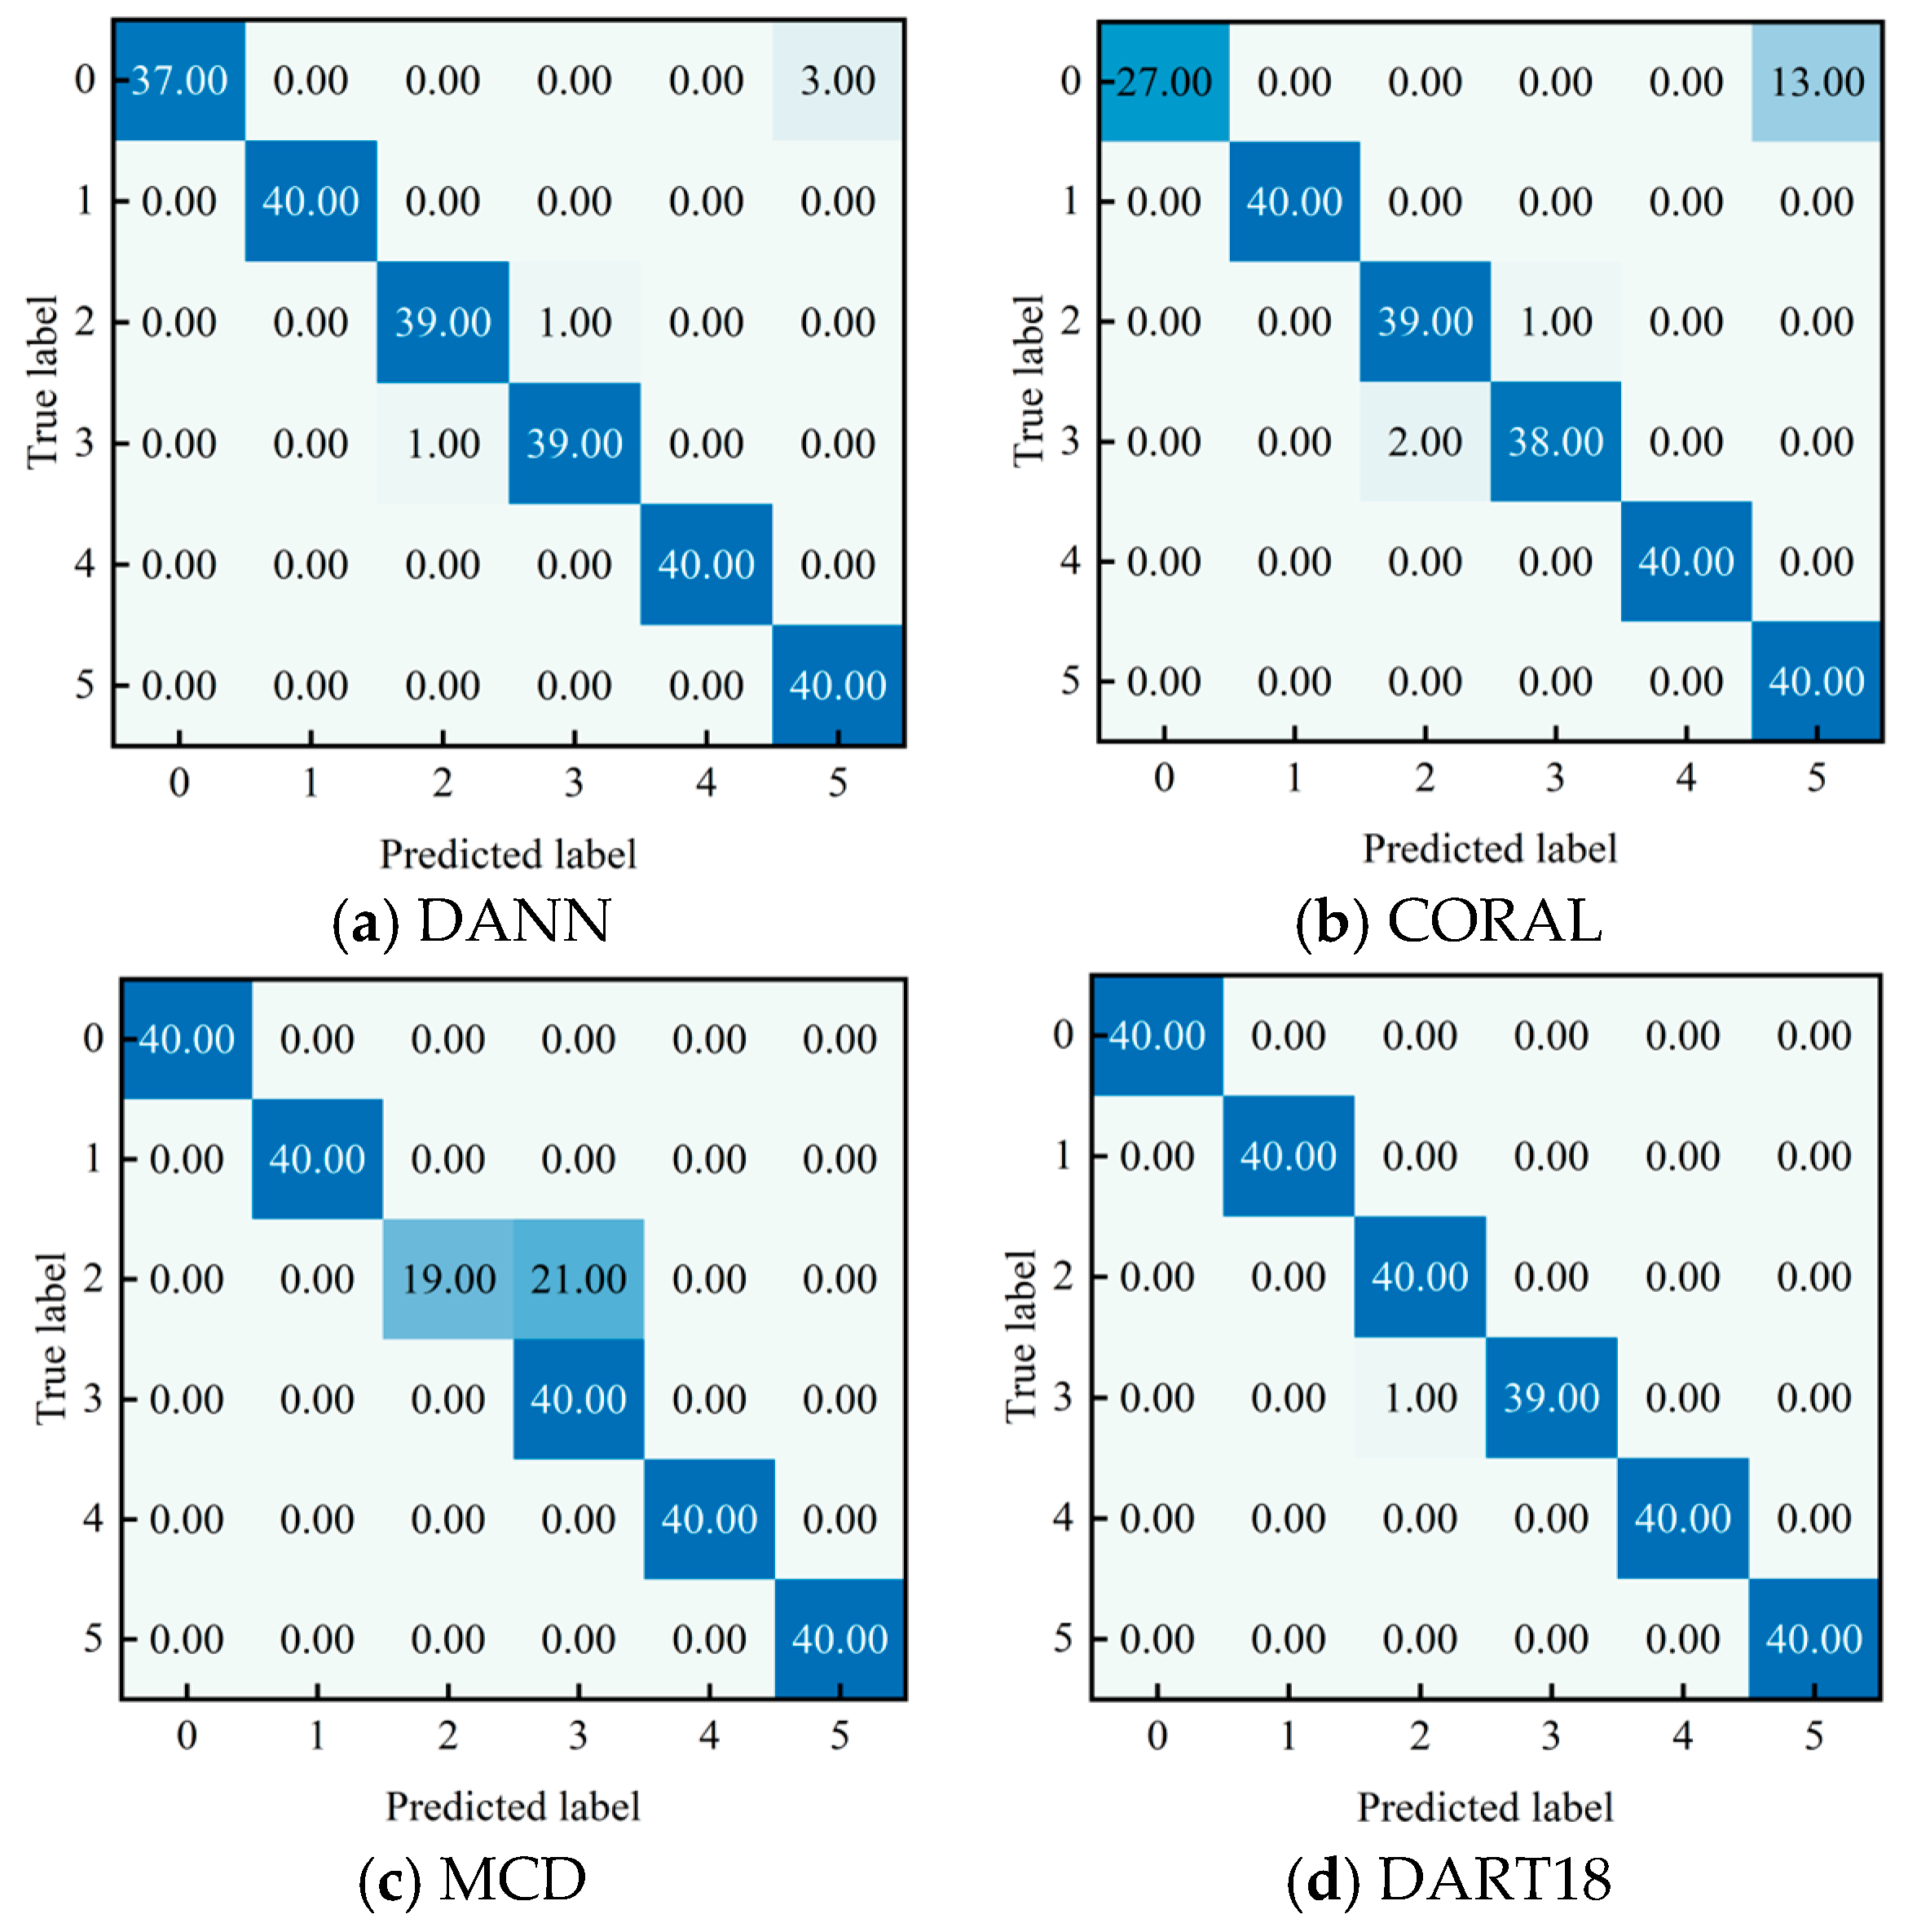
Based on the above t-SNE visualization, confusion matrices are further reported to verify the target-domain diagnosis behaviors under the same T1 task setting. Figure 10 presents the results of DANN, CORAL, MCD, and DART18. Overall, DANN and CORAL both show generally clear diagonal patterns, but some samples of label 0 are misclassified as label 5, especially in CORAL. MCD correctly recognizes most classes, but obvious confusion between labels 2 and 3 can still be observed. In contrast, DART18 yields the clearest diagonal-dominant pattern among the compared results, with fewer misclassified samples. This class-wise result is generally consistent with the t-SNE observation.
Figure 10.
Confusion matrices of different methods. The color intensity indicates the number of samples in each cell, with darker blue indicating a larger value.
Overall, the quantitative comparison in Table 3 and Figure 8 confirms that DART18 achieves the best overall diagnostic performance across the six UDA tasks, and the 95% CI analysis in Table 4 further supports the reliability of its improvements over most comparison methods. The t-SNE visualization further shows that DART18 learns more domain-consistent and class-separable feature representations. The confusion matrices support this conclusion from a class-wise perspective. Taken together, these results demonstrate the effectiveness of DART18 for UDA fault diagnosis under varying operating conditions.
4.2.5. Practicality Evaluation
Table 5 summarizes the model size and computational efficiency of different methods, including the number of parameters, FLOPs, training time, and per-sample inference latency. The reported training time and inference latency are averaged over the six UDA tasks. As shown in Table 5, DANN, DSAN, CORAL, and BNM have similar model sizes and computational costs, with about 11.31 M–11.34 M parameters and 3674.31 M FLOPs. MCD has a larger model size and the lowest FLOPs, but requires the longest training time and the highest inference latency among all methods. In comparison, DART18 has 24.29 M parameters and 3715.82 M FLOPs, which are higher than those of most comparison methods.
Table 5.
Comparison of model complexity and computational efficiency of different methods.
Although DART18 introduces a relatively higher computational cost, its inference latency remains at 3.80 ms/sample, which is still acceptable for fault diagnosis applications. Meanwhile, its training time is 699.79 s, much lower than that of MCD, and DART18 still achieves the best diagnostic performance in the previous experiments. Taken together, these results show that DART18 maintains practical inference efficiency while achieving strong diagnostic performance, thereby providing a reasonable trade-off between diagnostic accuracy and computational cost for planetary gearbox fault diagnosis under varying operating conditions.
4.2.6. Ablation Experiments
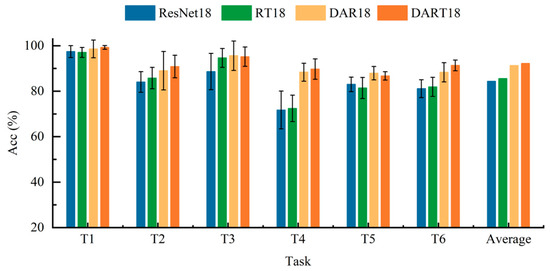
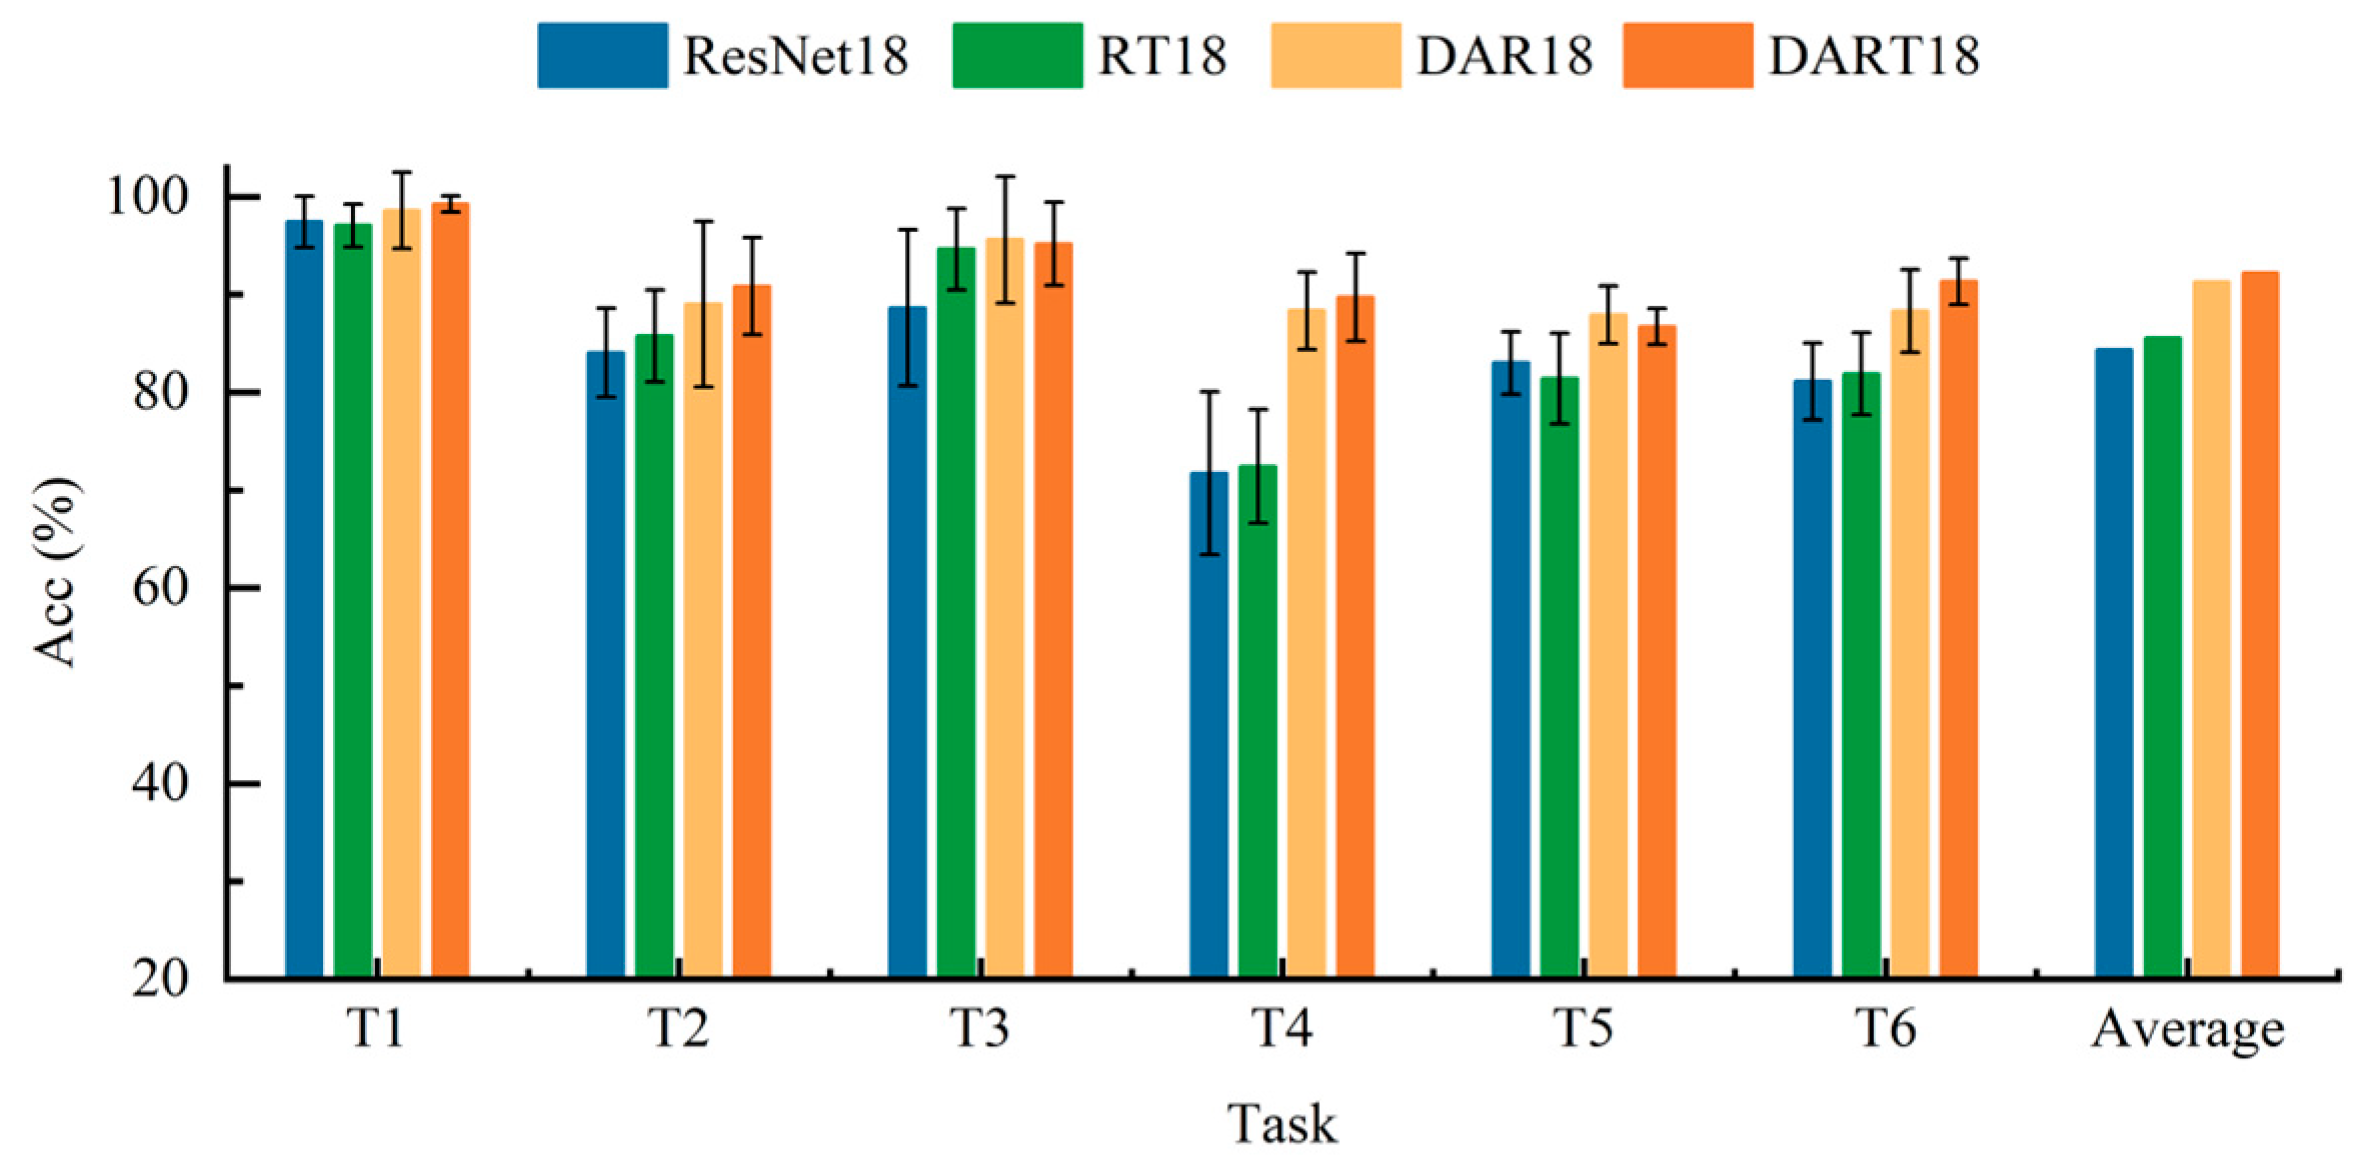
To evaluate the contribution of different modules in DART18, an ablation study is conducted using four variants, namely ResNet18, RT18, DAR18, and the full DART18. Among them, ResNet18 removes both TFEAM and MK-MMD, RT18 removes MK-MMD, whereas DAR18 removes TFEAM. ResNet18 and RT18 are trained using source-domain data only and do not use the UDA strategy. Table 6 reports the results of different variants on the six UDA tasks in terms of Acc and F1, while Figure 11 provides a visual comparison of the Acc results.
Table 6.
Diagnostic results of ablation experiments on the planetary gearbox dataset.
Figure 11.
Visual comparison of Acc results of different ablation variants on the planetary gearbox dataset.
The results in Table 6 and Figure 11 show that the complete DART18 achieves the best overall performance, with an average Acc of 92.17% and an average F1 of 91.90%. When both TFEAM and MK-MMD are removed, the average performance drops to 84.32% Acc and 82.77% F1, indicating that these two components are both important for target-domain fault diagnosis. When only the MK-MMD method is removed, RT18 achieves an average Acc of 85.52% and an average F1 of 84.05%, which are 6.65 and 7.85 percentage points lower than those of DART18, respectively. This result confirms the important role of the MK-MMD-based UDA strategy in reducing the distribution discrepancy between source and target domains. When only TFEAM is removed, DAR18 reaches an average Acc of 91.28% and an average F1 of 90.86%, which are still lower than the full model by 0.89 and 1.04 percentage points, respectively, showing that TFEAM further improves the fault feature representation.
To further examine whether the improvement of DART18 comes from the specific design of TFEAM rather than simply from adding an attention module, attention replacement experiments were conducted. The Convolutional Block Attention Module (CBAM) [40] was introduced as a commonly used attention module. Then, CBAM, Non-local, MHSA, and an SKNet-style module were selected for comparison.
For a controlled comparison, TFEAM was replaced by each attention module, while the remaining ResNet18 + MK-MMD framework and training settings were kept unchanged. All replacement modules were inserted at the same front-end position before ResNet18. In the implementation, CBAM sequentially applies channel attention and spatial attention to the input representation. The Non-local module computes global responses using a pooled support map after 1 × 1 convolutional projection. MHSA forms a pooled token representation from the input, projects it into a 32-dimensional embedding space, and then applies four-head self-attention. The SKNet-style module uses four convolutional branches with kernel sizes of 1 × 1, 3 × 3, 5 × 5, and 7 × 7, and fuses the branch responses using softmax-normalized weights.
As shown in Table 7, TFEAM achieves the best overall performance among the compared attention modules. Compared with DAR18 in Table 6, the SKNet-style module only slightly improves the average Acc and F1 by 0.20 and 0.14 percentage points, respectively. In contrast, CBAM, Non-local, and MHSA show lower average performance than DAR18. These results further verify the effectiveness of TFEAM and indicate that the improvement of DART18 is not simply caused by adding a general attention module.
Table 7.
Attention replacement results under the same ResNet18 + MK-MMD framework.
To further clarify the extra computational cost introduced by DART18, the standard ResNet18 with a six-class output layer is used as a computational reference under the same input setting. It contains 11.18 M parameters and 3647.05 M FLOPs. Compared with this reference, DART18 increases the number of parameters to 24.29 M, while the FLOPs increase from 3647.05 M to 3715.82 M. For runtime comparison, the measured ResNet18-based source-only variant under the same experimental protocol requires 266.67 s for training and 2.77 ms/sample for inference, whereas DART18 requires 699.79 s and 3.80 ms/sample, respectively. These results show that the additional runtime cost of DART18 is more pronounced during training, while the increase in inference latency remains moderate.
4.2.7. Sensitivity Analysis
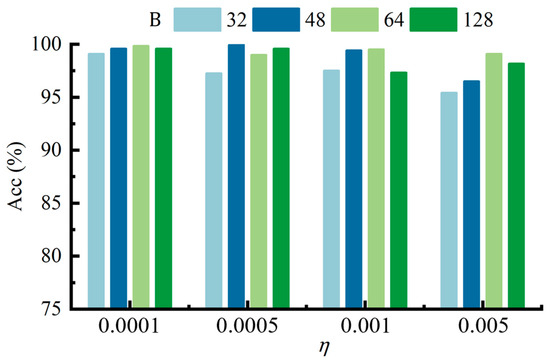
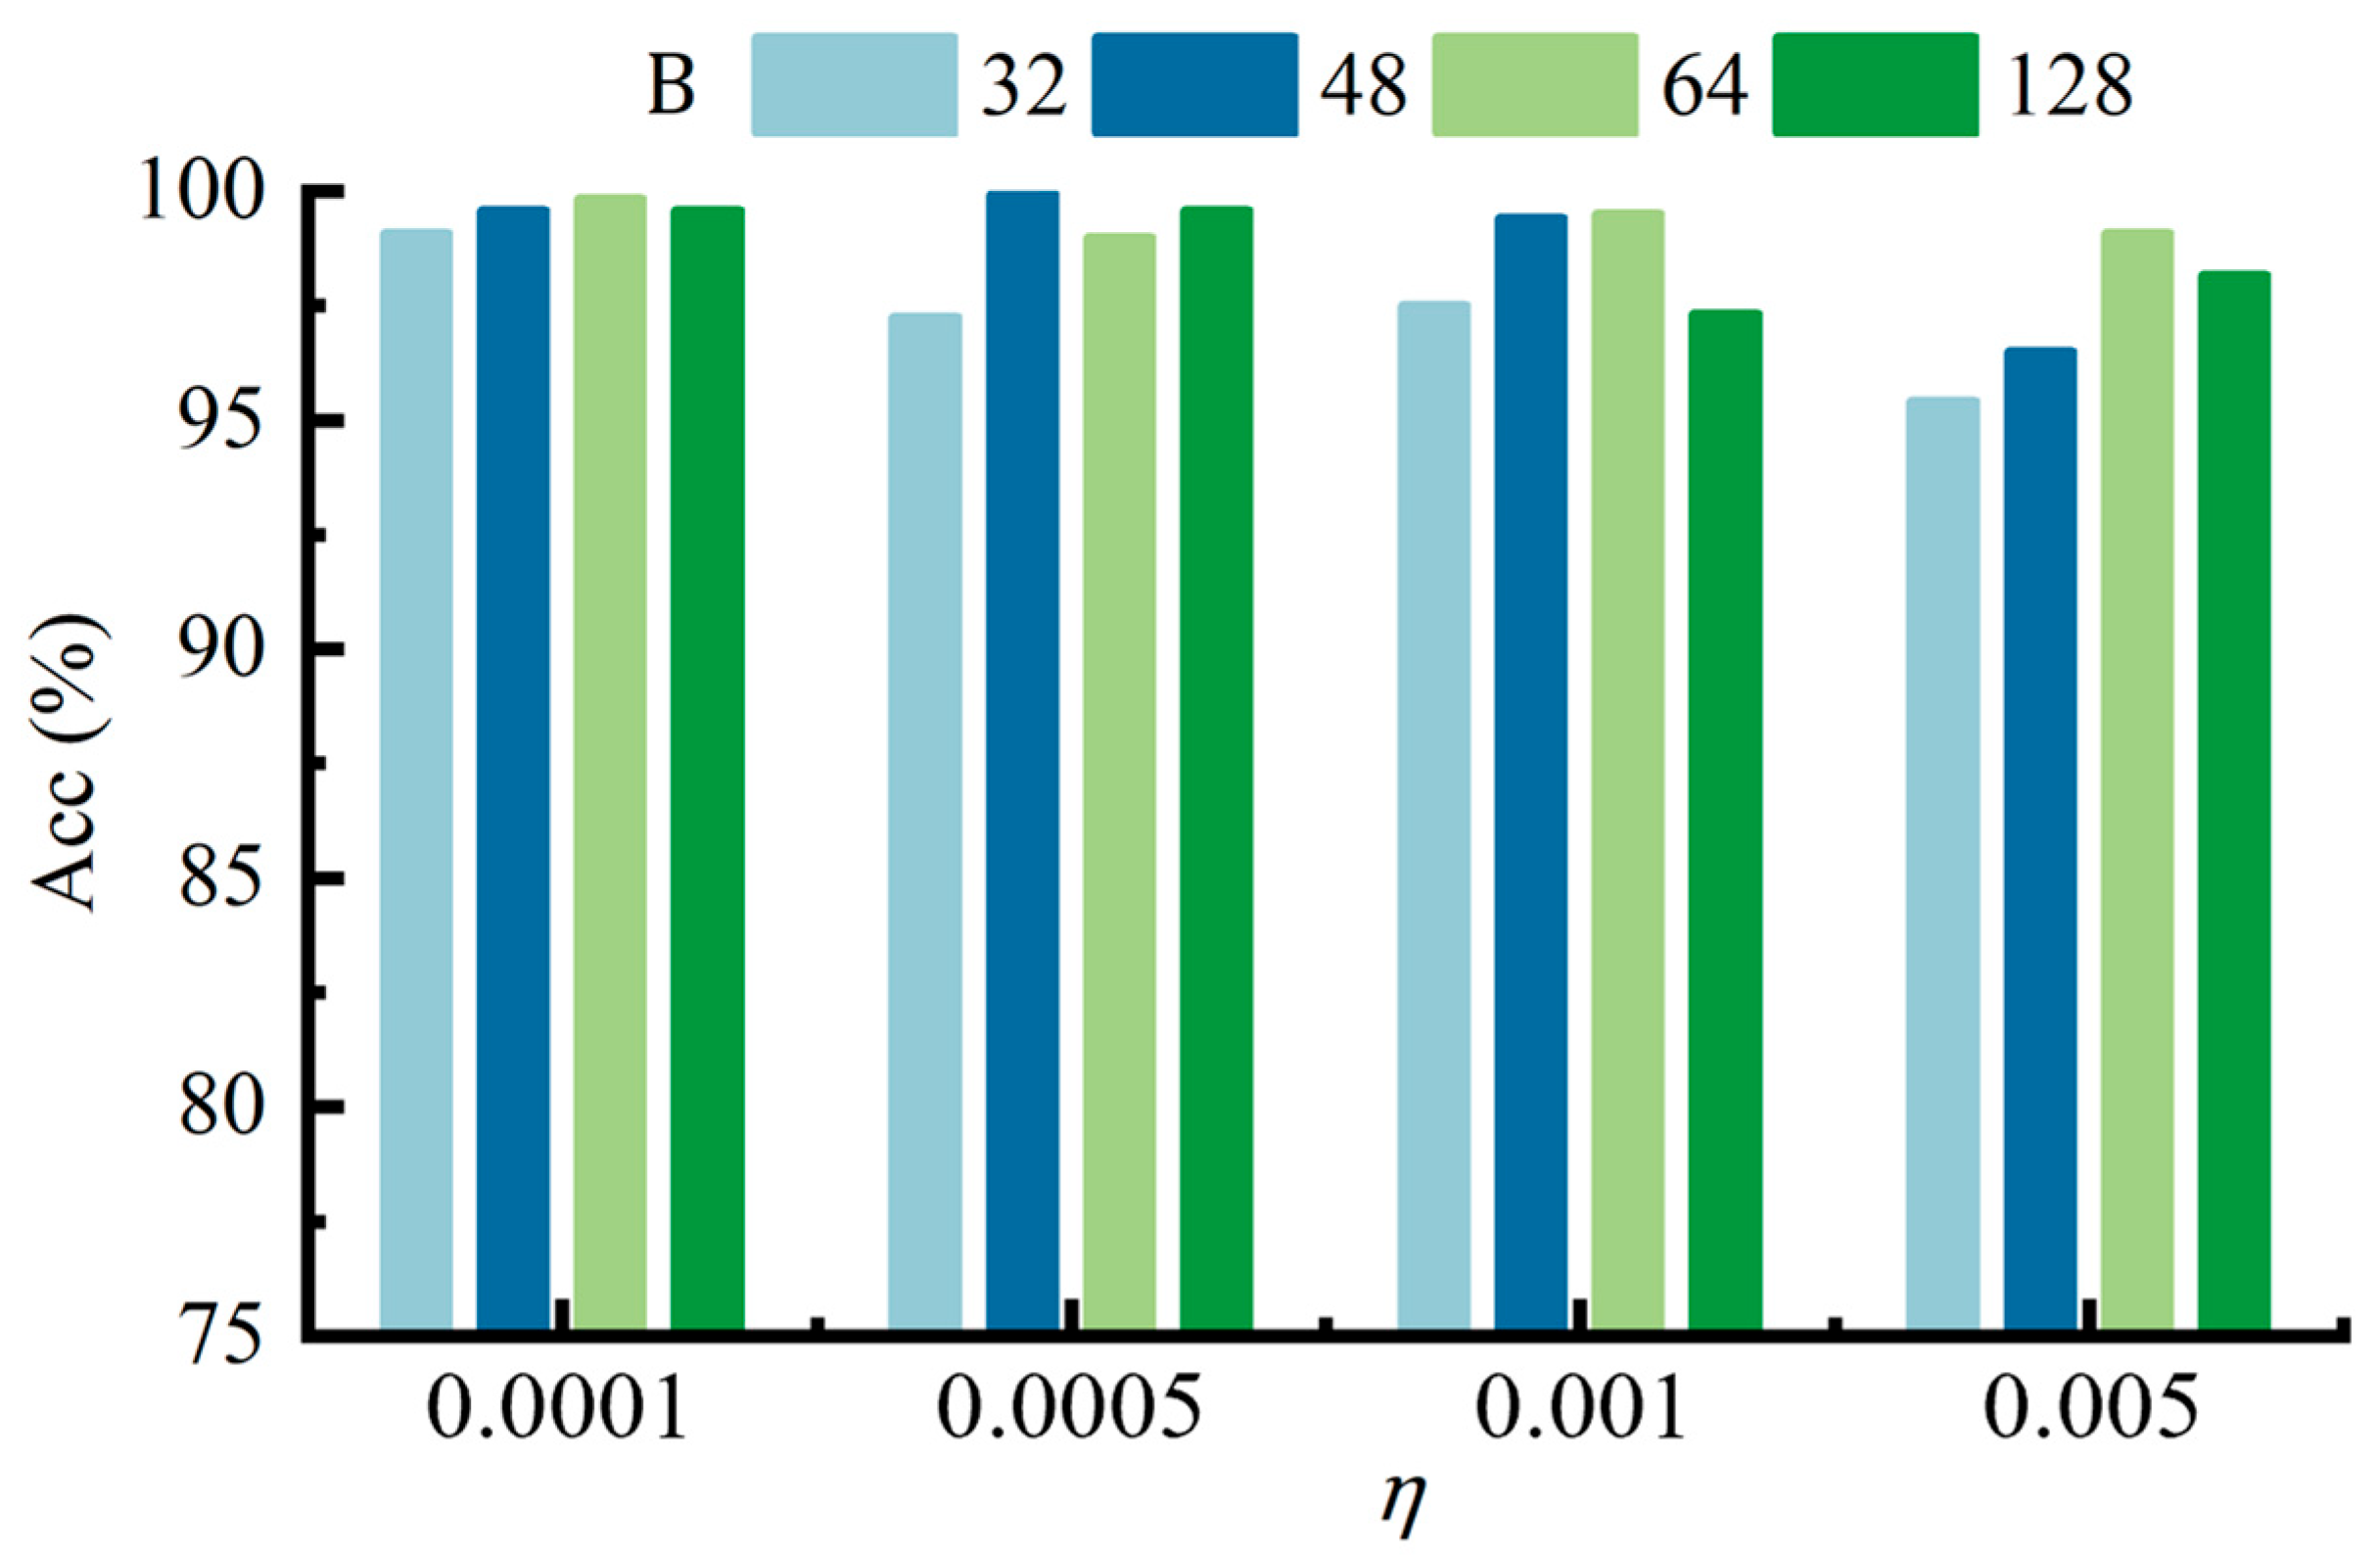
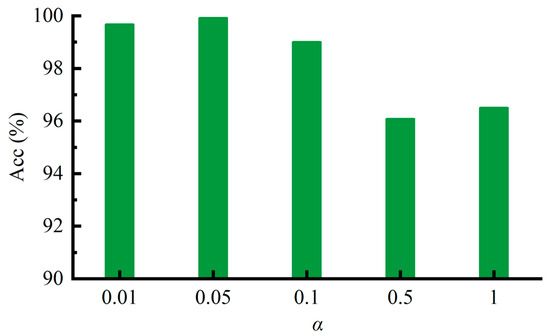
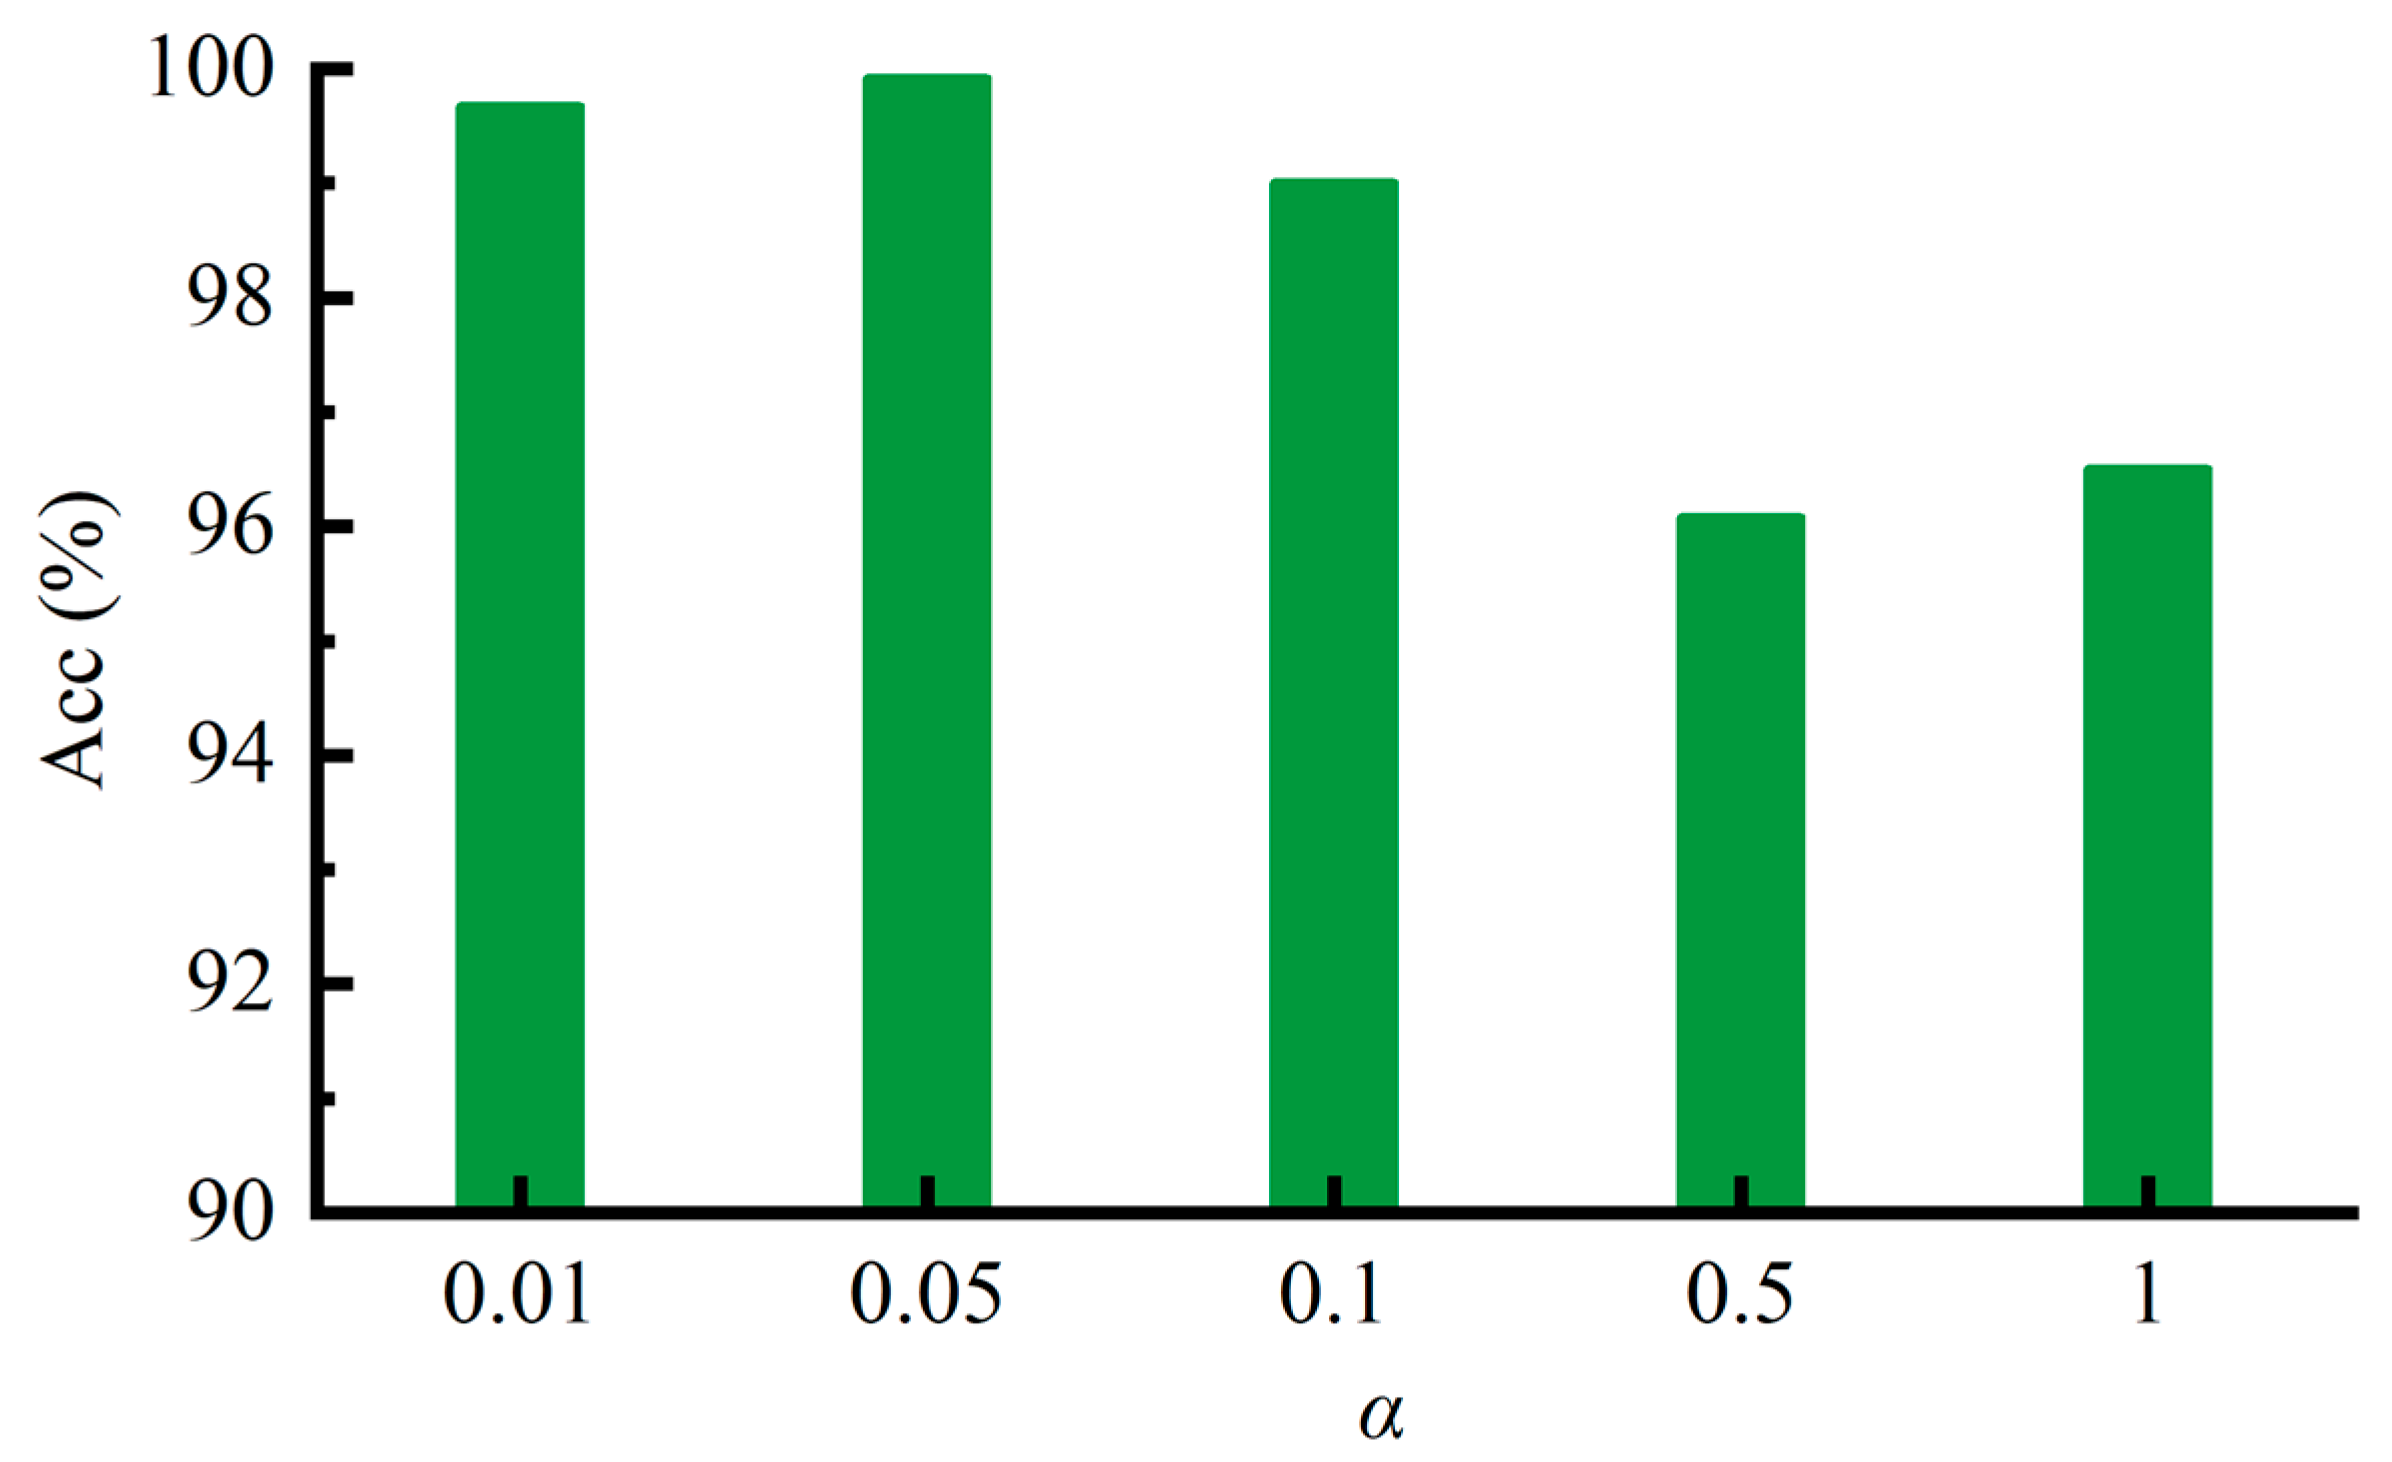
In this section, sensitivity analysis is conducted on three key hyperparameters using Task T1 as an example, including the batch size , learning rate , and trade-off coefficient . Since and jointly affect the optimization process, their effects are analyzed jointly through grid search. Specifically, is selected from {32, 48, 64, 128}, and is selected from {10−4, 5 × 10⁻⁴, 10−3, 5 × 10⁻³}. By contrast, is analyzed by varying only this parameter while keeping the others fixed, with selected from {0.01, 0.05, 0.1, 0.5, 1}.
- (1)
- Batch size and learning rate: Figure 12 shows the Acc results under different combinations of and . Overall, the model achieves relatively high accuracy under a wide range of settings, indicating a certain degree of robustness. However, the results still vary with different parameter combinations, suggesting that and interact with each other during training. Among all settings, the highest accuracy of 99.92% is achieved when 0.0005 and 48. Therefore, this combination is selected as the default setting in this study.Figure 12. Acc results with different values of batch size and learning rate on Task T1.
- (2)
- Trade-off coefficient: Figure 13 presents the sensitivity analysis of . When is set to 0.01, 0.05, and 0.1, the model maintains high accuracy, indicating that the proposed method remains relatively stable within this range. Among them, the best result of 99.92% is obtained at 0.05. When increases further, the accuracy decreases noticeably, indicating that an excessively large may weaken the balance between classification and domain alignment. Based on these results, is set to 0.05.Figure 13. Acc results with different values of the trade-off coefficient on Task T1.
4.3. WT-Planetary Gearbox Dataset
4.3.1. Description of WT-Planetary Gearbox Dataset
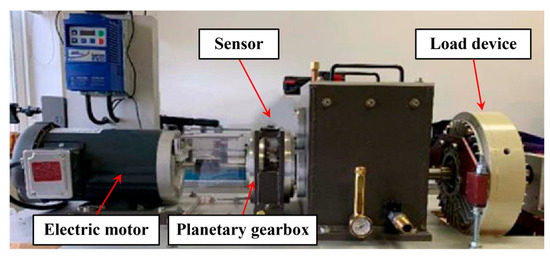
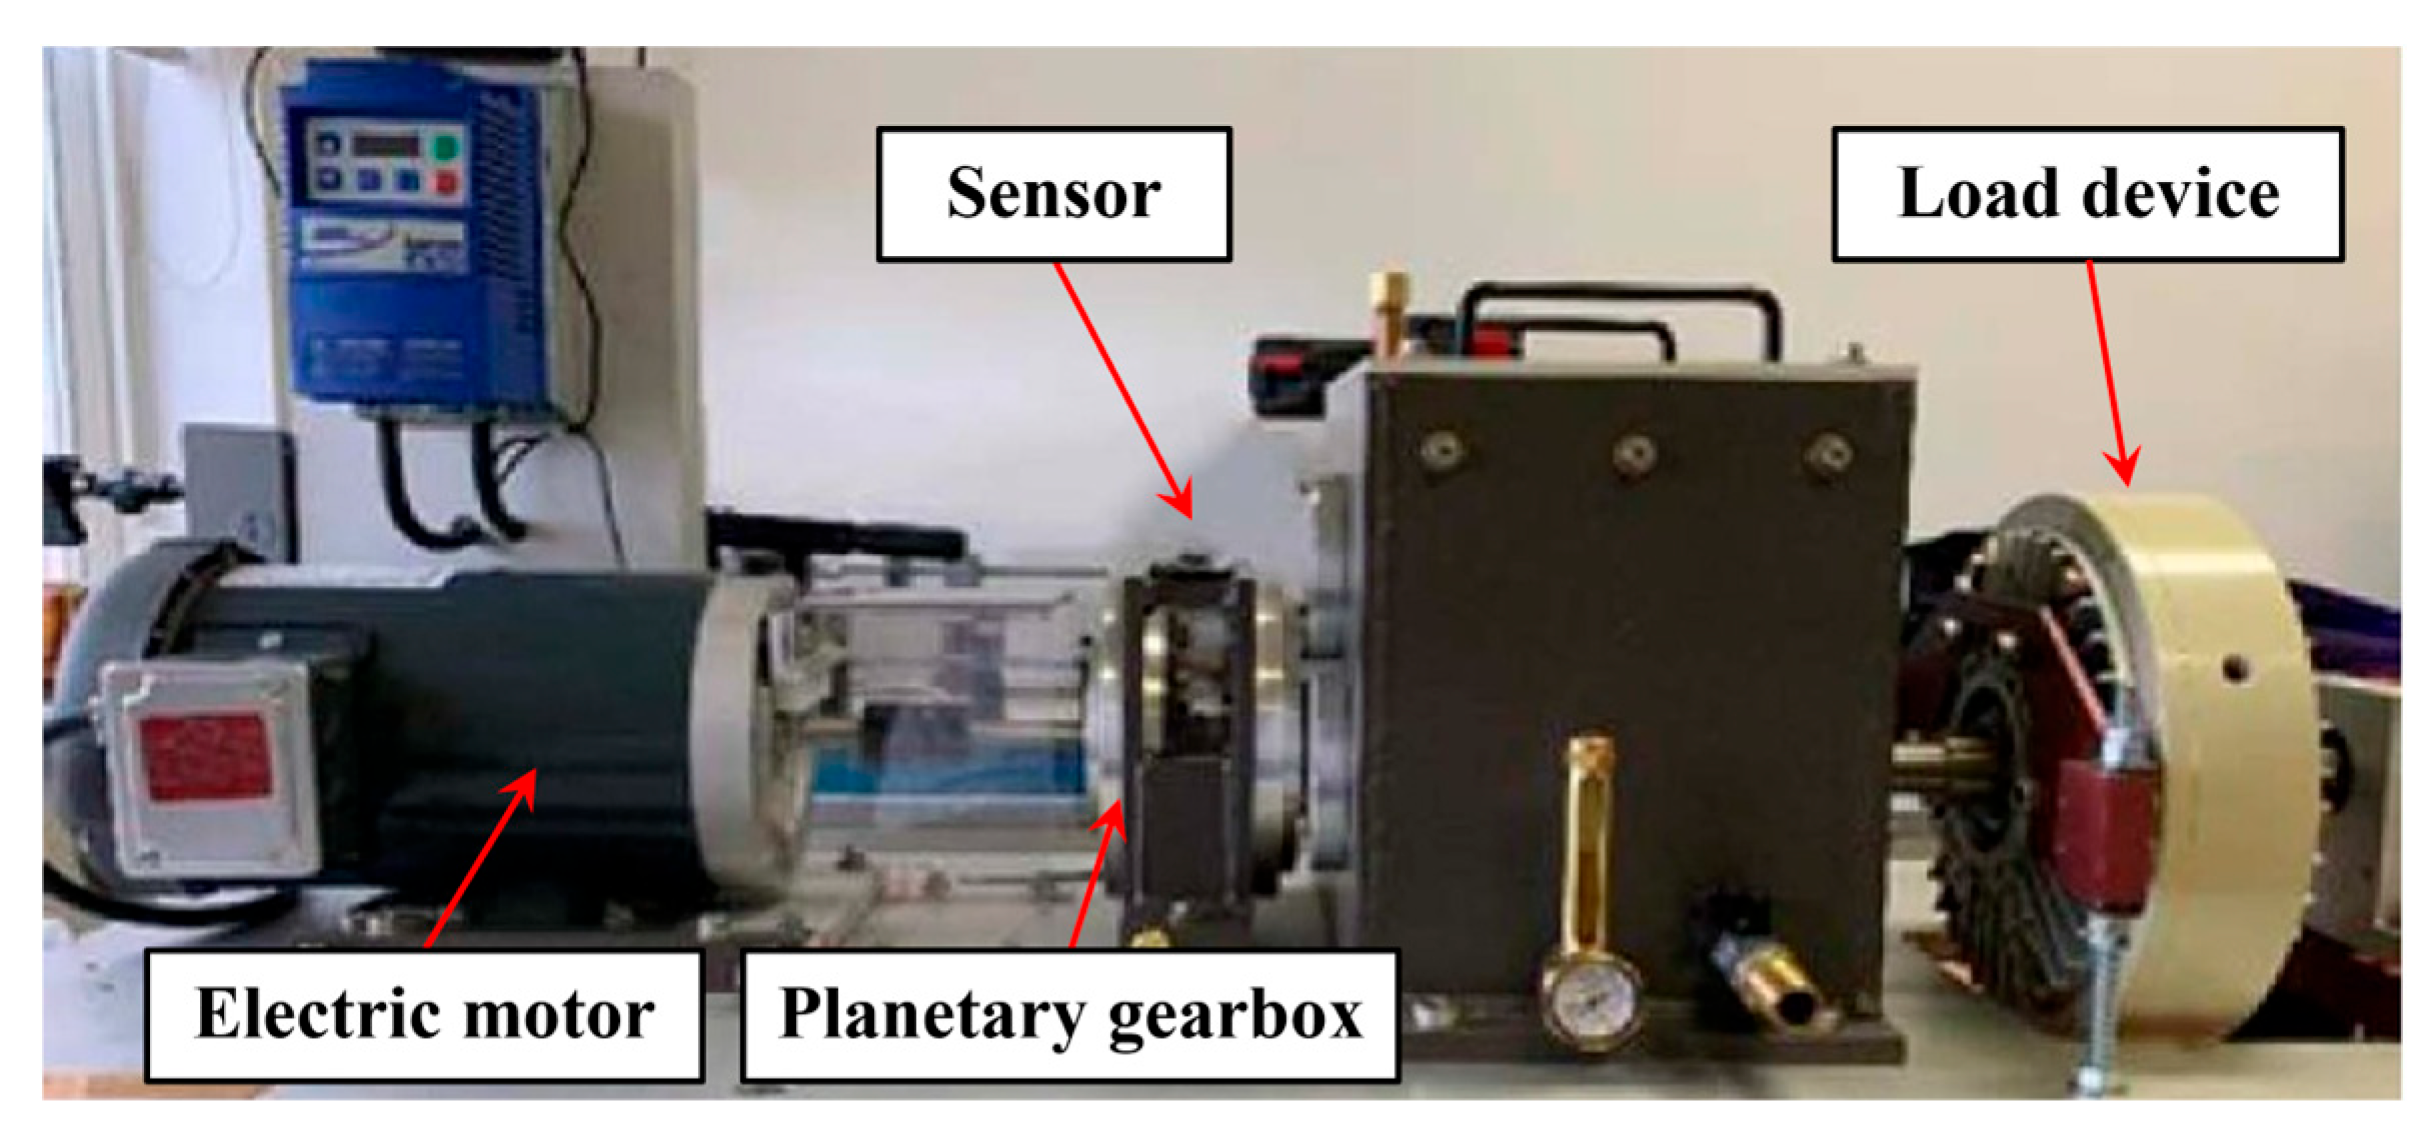
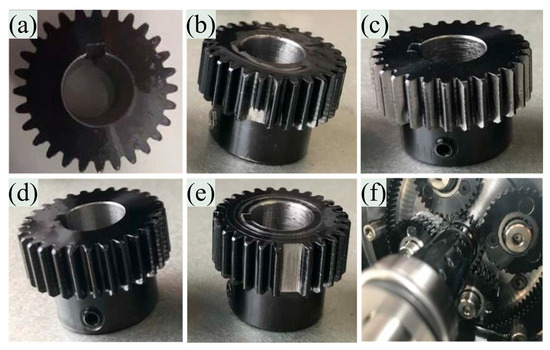
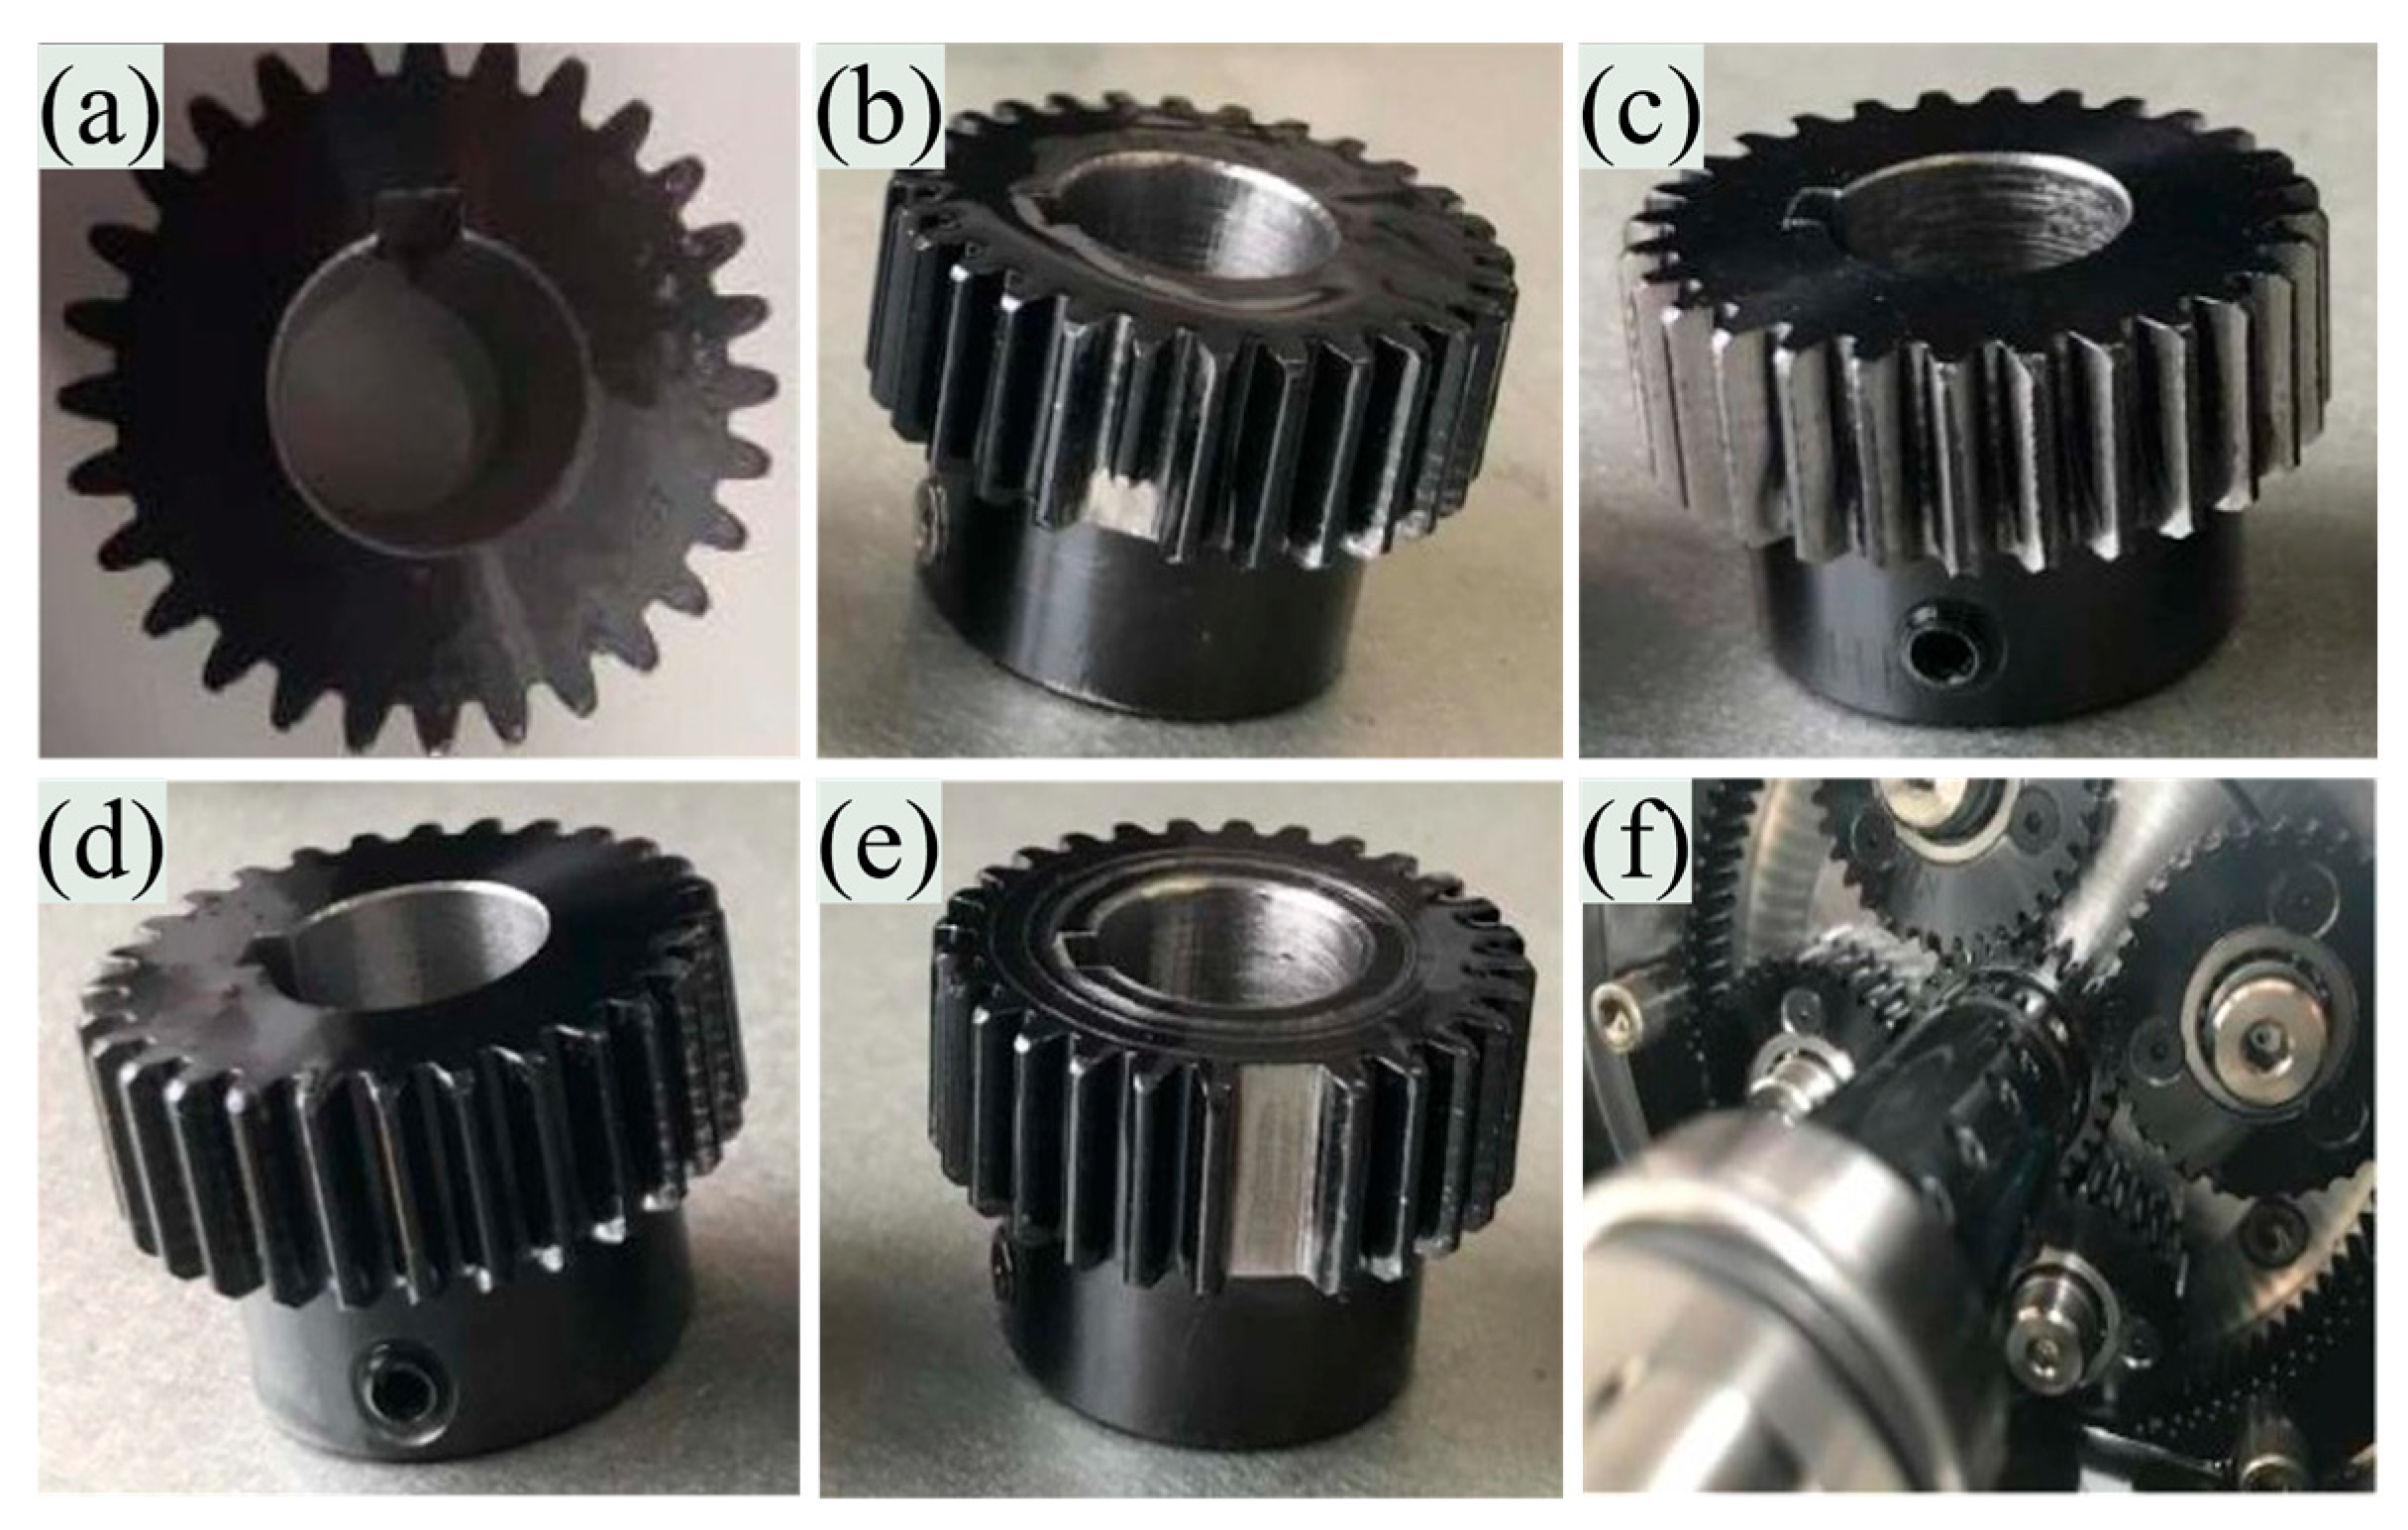
To further verify the effectiveness of the proposed method, experiments are also conducted on the publicly available WT-planetary gearbox dataset [41]. The experimental setup is shown in Figure 14. This dataset includes five health states, namely normal condition, gear with a broken tooth, wear gear, crack occurs in the root, and missing one tooth. The corresponding normal and faulty components, together with the internal structure of the planetary gearbox, are illustrated in Figure 15.
Figure 14.
Experimental setup of the WT-planetary gearbox dataset.
Figure 15.
(a) Normal condition, (b) gear with a broken tooth, (c) wear gear, (d) crack occurs in the root, (e) missing one tooth, and (f) internal structure of the planetary gearbox.
To simulate a more pronounced domain-shift scenario, three rotational-speed conditions, namely 1200 rpm, 1800 rpm, and 2400 rpm, are selected to construct the UDA fault diagnosis tasks. The vibration signals are collected with a sampling frequency of 48 kHz, and each sample contains 4096 sampling points. During OGST preprocessing, the frequency analysis range is set to 0–6 kHz.
Based on the three domains, six UDA tasks are constructed, namely M1 (1200 rpm → 1800 rpm), M2 (1200 rpm → 2400 rpm), M3 (1800 rpm → 1200 rpm), M4 (1800 rpm → 2400 rpm), M5 (2400 rpm → 1200 rpm), and M6 (2400 rpm → 1800 rpm). For each domain, 200 samples are collected for each class. The samples of each class are randomly shuffled before splitting, with 160 samples used for training and the remaining 40 samples used for testing.
4.3.2. Analysis of Experimental Results on the WT-Planetary Gearbox Dataset
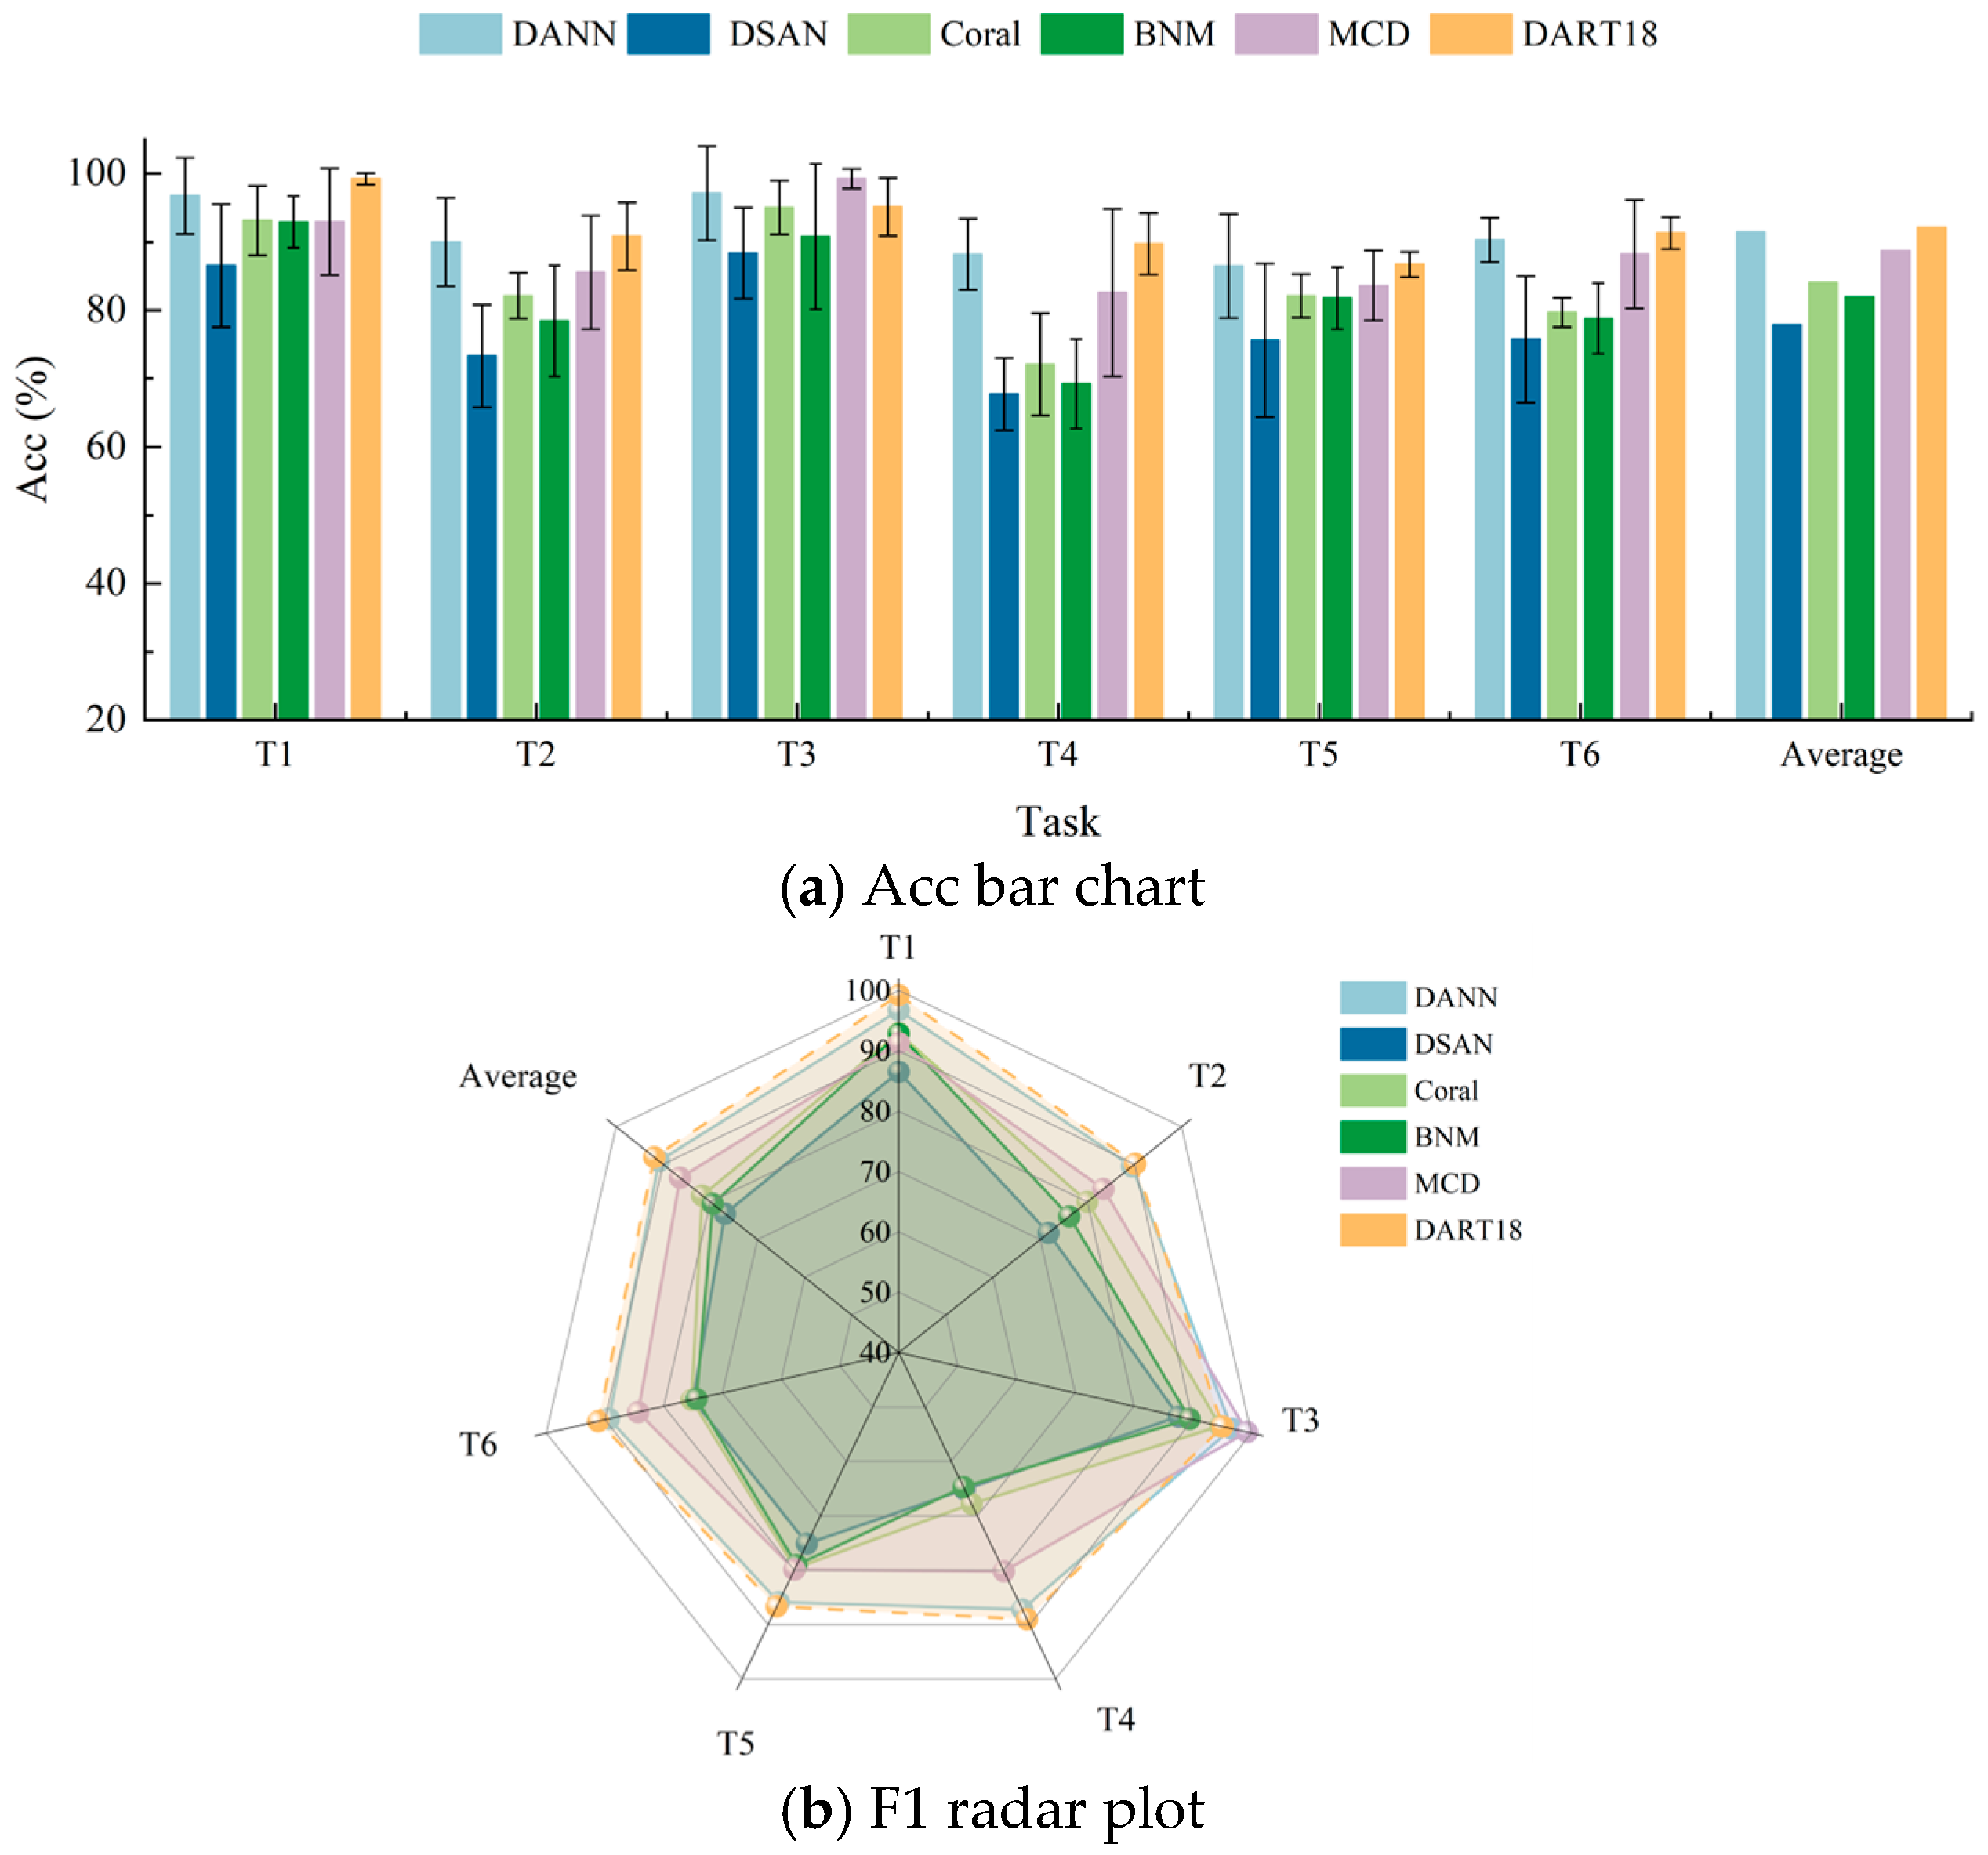
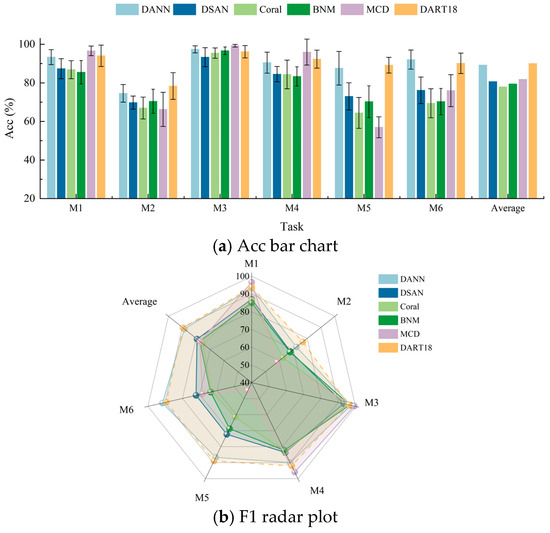
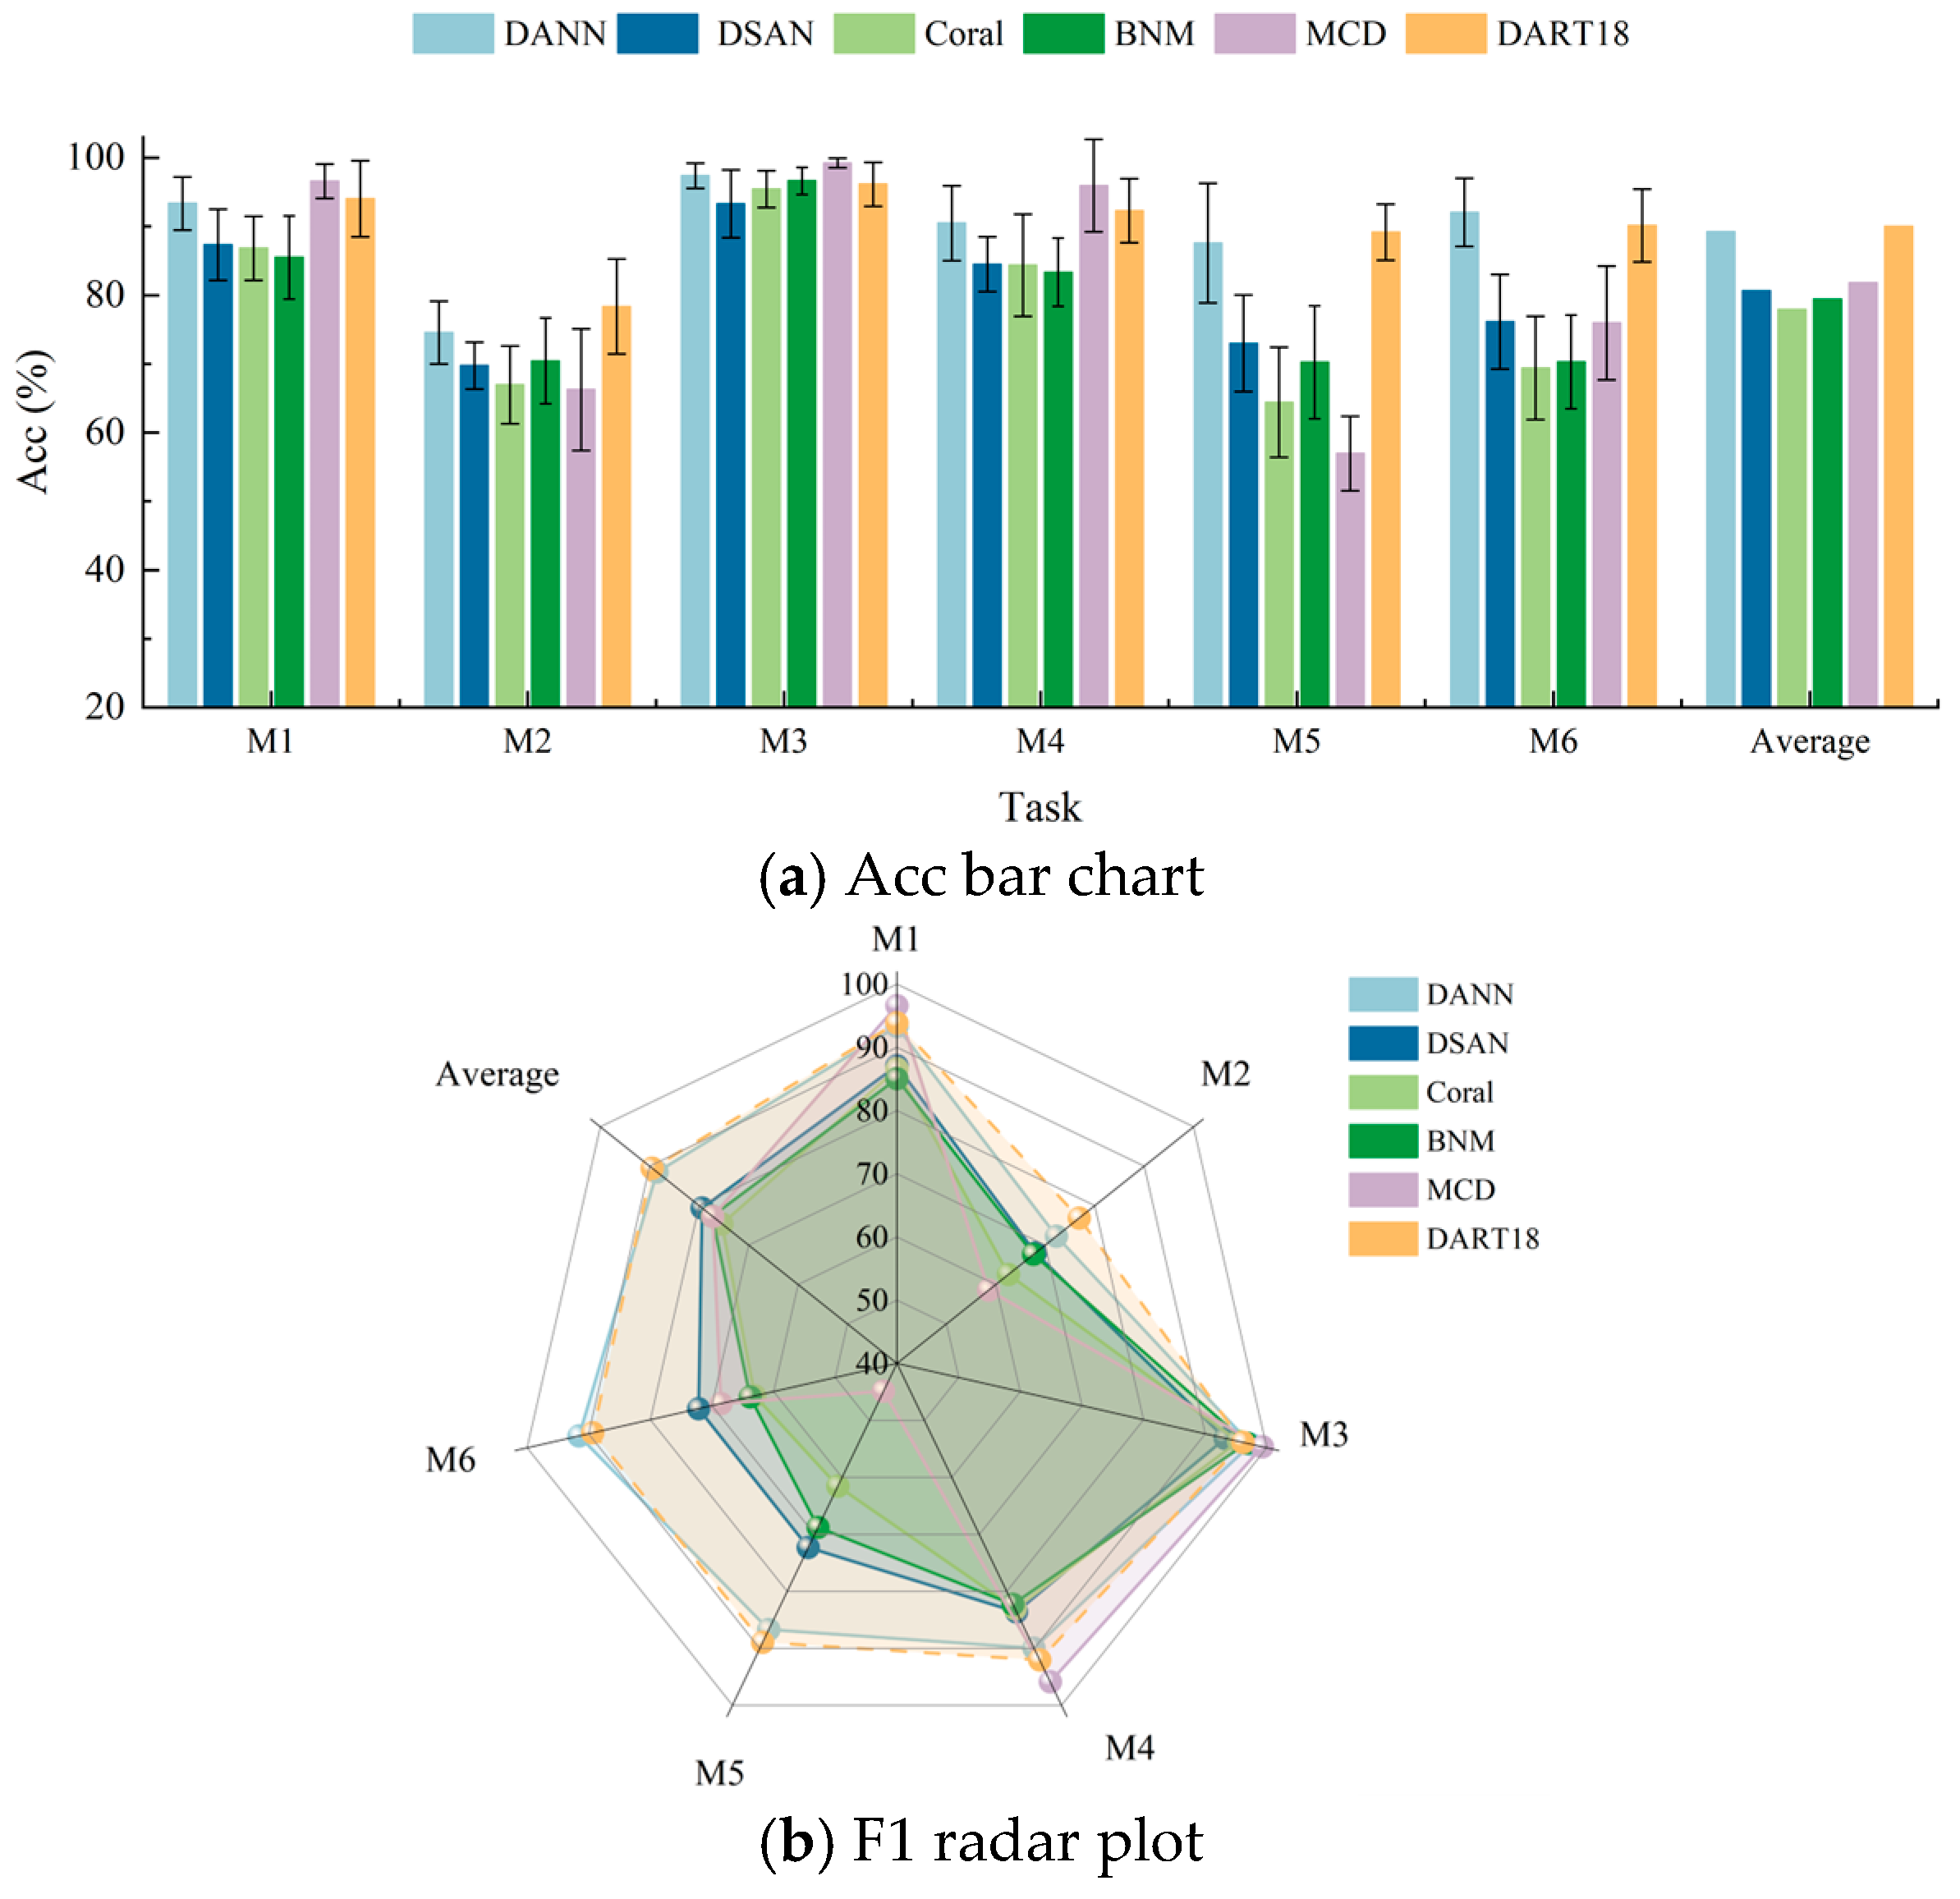
Table 8 reports the diagnostic results of different methods on six UDA tasks of the WT-planetary gearbox dataset. For each task, the results are presented as mean ± standard deviation over ten runs, and the average value is obtained by averaging the results of M1 to M6. Figure 16 provides a visual comparison of the results, where subfigure (a) shows the Acc bar chart and subfigure (b) presents the F1 radar plot.
Table 8.
Comparison results of different methods on six UDA tasks of the WT-planetary gearbox dataset.
Figure 16.
Visual comparison of Acc and F1 results of different methods on the WT-planetary gearbox dataset.
The results in Table 8 and Figure 16 show that DART18 achieves the best average diagnostic performance on this dataset, reaching an average Acc of 90.02% and an average F1 of 89.53%. Compared with the best comparison method, DANN, DART18 improves the average Acc and average F1 by 0.78 and 1.00 percentage points, respectively. Meanwhile, M2 and M5 are relatively more difficult tasks for most methods, which also reflects the stronger domain shift in this dataset. Even in this case, DART18 still achieves the best performance on M2 and M5 among all methods, further showing its effectiveness under difficult UDA tasks.
To further examine the statistical reliability of the overall performance differences, a 95% CI analysis is conducted, as shown in Table 9. DART18 achieves positive mean differences over all comparison methods in both Acc and F1. The improvements over DSAN, CORAL, BNM, and MCD are statistically significant, while the differences between DART18 and DANN are not significant. This result indicates that DART18 maintains comparable performance to the strongest baseline and shows significant advantages over the other comparison methods. Together with the analyses in Section 4.2.4, these results further support the effectiveness of DART18 in improving feature alignment and target-domain diagnosis under varying operating conditions.
Table 9.
95% CI analysis of paired performance differences between DART18 and comparison methods on the WT-planetary gearbox dataset.
5. Conclusions
To address planetary gearbox fault diagnosis under the coexistence of complex signal interference and varying operating conditions, DART18 is proposed by integrating TFEAM with domain adaptation. The main conclusions are summarized as follows:
- (1)
- The designed TFEAM can enhance the representation of fault-related features in time–frequency representations, thereby enabling the network to extract more discriminative features for fault diagnosis.
- (2)
- The proposed DART18 method introduces MK-MMD to align the feature distributions of the source and target domains, thereby effectively alleviating the data discrepancy caused by varying operating conditions.
- (3)
- Experimental validation is conducted on multiple fault diagnosis tasks under varying operating conditions across two planetary gearbox datasets. The results demonstrate that DART18 maintains a consistent advantage over five comparative methods, confirming its effectiveness for fault diagnosis.
However, the current validation mainly focuses on different operating conditions of planetary gearboxes from the same device, and its applicability to similar but different planetary gearboxes still requires further validation. Future work will focus on domain generalization by learning more robust fault representations for planetary gearbox fault diagnosis under unseen operating conditions and across different devices.
Author Contributions
Writing—Review and Editing, L.D., S.D. and J.Z.; Writing—Original Draft Preparation, M.S. and J.Z.; Methodology, M.S.; Software, M.S. and J.Z.; Validation, M.S.; Visualization, J.Z. and S.C.; Supervision, L.D. and S.D.; Funding Acquisition, L.D. and S.C. All authors have read and agreed to the published version of the manuscript.
Funding
This research was funded by the National Key Research and Development Program of China, grant number 2024YFB3409300; the Scientific Research and Technology Development Project of China National Petroleum Corporation (CNPC) Safety and Environmental Protection Technology Research Institute, grant number 2023DJ6508; and the Natural Science Foundation of Inner Mongolia Autonomous Region of China, grant number 2024LHMS05006.
Data Availability Statement
The raw data supporting the conclusions of this article will be made available by the authors on request.
Conflicts of Interest
The authors declare no conflicts of interest.
References
- Duan, L.; Wang, M.; Zhang, N.; Fan, X.; Shen, M. Fault diagnosis of planetary gearboxes under class-incremental scenarios based on hybrid knowledge distillation. Meas. Sci. Technol. 2026, 37, 125103. [Google Scholar] [CrossRef] [Scilit]
- Su, H.; Wang, Z.; Cai, Y.; Ding, J.; Wang, X.; Yao, L. Refined Composite Multiscale Fluctuation Dispersion Entropy and Supervised Manifold Mapping for Planetary Gearbox Fault Diagnosis. Machines 2023, 11, 47. [Google Scholar] [CrossRef] [Scilit]
- Zhang, B.; Teng, W.; Tang, S.; Peng, D.; Fang, Q.; Ma, Z. Sparsity-assisted energy decoupling model for fault detection of planetary ring gear in wind turbines. Mech. Syst. Signal Process. 2025, 238, 113235. [Google Scholar] [CrossRef] [Scilit]
- Yang, X.; He, G.; Du, C.; Xu, L.; Yu, J.; Zeng, H.; Li, Y. Superiority of Fault-Caused-Speed-Fluctuation-Based Dynamics Modeling: An Example on Planetary Gearbox with Cracked Sun Gear. Machines 2025, 13, 500. [Google Scholar] [CrossRef] [Scilit]
- Tang, J.; Zhou, Q.; Yin, K. A complex attention transformer for bearing fault diagnosis based on motor current signals. IEEE Trans. Instrum. Meas. 2025, 74, 3539911. [Google Scholar] [CrossRef] [Scilit]
- Han, S.; Shao, H.; Cheng, J.; Yang, X.; Cai, B. Convformer-NSE: A novel end-to-end gearbox fault diagnosis framework under heavy noise using joint global and local information. IEEE/ASME Trans. Mechatron. 2023, 28, 340–349. [Google Scholar] [CrossRef] [Scilit]
- Kumar, P.; Raouf, I.; Song, J.; Kim, H.S. Multi-size wide kernel convolutional neural network for bearing fault diagnosis. Adv. Eng. Softw. 2024, 198, 103799. [Google Scholar] [CrossRef] [Scilit]
- Zhang, P.; Chen, C. Wind turbine planetary gearbox fault diagnosis using circular pitch cyclic vector and a bidirectional gated recurrent unit. Meas. Sci. Technol. 2023, 34, 015105. [Google Scholar]
- Kim, J.; Kim, Y.C.; Baek, J.; Lee, J.; Jung, J.H.; Youn, B.D. ARDiff: An adaptive reverse-step diffusion framework for unsupervised vibration signal denoising with frequency attention. Mech. Syst. Signal Process. 2026, 244, 113726. [Google Scholar] [CrossRef] [Scilit]
- Xing, Z.; Yi, C.; Lin, J.; Zhou, Q. A novel periodic cyclic sparse network with entire domain adaptation for deep transfer fault diagnosis of rolling bearing. IEEE Sens. J. 2023, 23, 13452–13468. [Google Scholar]
- Fan, X.; Duan, L.; Zhang, N.; Shen, M. A collaborative adversarial framework: Distribution characteristics-guided alignment mechanism for fault diagnosis of machines considering domain shift. Adv. Eng. Inform. 2025, 65, 103159. [Google Scholar] [CrossRef] [Scilit]
- Chen, L.; He, Y.; Tan, A.; Bai, X.; Li, Z.; Wang, X. Fault Diagnosis of Gearbox Bearings Based on Multi-Feature Fusion Dual-Channel CNN-Transformer-CAM. Machines 2026, 14, 92. [Google Scholar] [CrossRef] [Scilit]
- Fan, H.; Zhang, T.; Cao, X.; Zhang, X. A time-frequency images driven multi-component intelligent fault diagnosis method of mechanical transmission system. Meas. Sci. Technol. 2025, 36, 056121. [Google Scholar] [CrossRef] [Scilit]
- Wei, H.; Zhang, Q.; Shang, M.; Gu, Y. Extreme learning Machine-based classifier for fault diagnosis of rotating Machinery using a residual network and continuous wavelet transform. Measurement 2021, 183, 109864. [Google Scholar] [CrossRef] [Scilit]
- Li, X.; Wang, W.; Hu, X.; Yang, J. Selective kernel networks. In Proceedings of the IEEE/CVF Conference on Computer Vision and Pattern Recognition (CVPR); IEEE: New York, NY, USA, 2019; pp. 510–519. [Google Scholar]
- Wang, X.; Girshick, R.; Gupta, A.; He, K. Non-local neural networks. In Proceedings of the IEEE/CVF Conference on Computer Vision and Pattern Recognition (CVPR); IEEE: New York, NY, USA, 2018; pp. 7794–7803. [Google Scholar]
- Vaswani, A.; Shazeer, N.; Parmar, N.; Uszkoreit, J.; Jones, L.; Gomez, A.N.; Kaiser, Ł.; Polosukhin, I. Attention is all you need. In Advances in Neural Information Processing Systems 30; Curran Associates, Inc.: Red Hook, NY, USA, 2017. [Google Scholar]
- Yasenjiang, J.; Xiao, Y.; He, C.; Lv, L.; Wang, W. Fault Diagnosis of Bearings with Small Sample Size Using Improved Capsule Network and Siamese Neural Network. Sensors 2025, 25, 92. [Google Scholar] [CrossRef] [Scilit]
- Wan, L.; Huang, L.; Ning, J.; Li, C.; Li, K. A novel meta-transfer learning approach via convolutional multi-head self-attention network for few-shot fault diagnosis. Knowl.-Based Syst. 2024, 299, 112113. [Google Scholar]
- Xie, M.; Liu, J.; Li, Y.; Yi, C. An unsupervised domain adaptation method for intelligent fault diagnosis based on target feature enhancement and feature-boundary alignment. J. Intell. Manuf. 2026, 37, 1109–1123. [Google Scholar]
- Liu, Z.H.; Lu, B.L.; Wei, H.L.; Chen, L.; Li, X.H.; Rätsch, M. Deep adversarial domain adaptation model for bearing fault diagnosis. IEEE Trans. Syst. Man Cybern. Syst. 2021, 51, 4217–4226. [Google Scholar]
- Li, Y.; Xu, X.; Hu, L.; Sun, K.; Han, M. Double-level discriminative domain adaptation network for cross-domain fault diagnosis. Appl. Intell. 2025, 55, 333. [Google Scholar] [CrossRef] [Scilit]
- Pan, Y.; Hong, R.; Chen, J.; Feng, J.; Wu, W. Performance degradation assessment of wind turbine gearbox based on maximum mean discrepancy and multi-sensor transfer learning. Struct. Health Monit. 2021, 20, 118–138. [Google Scholar] [CrossRef] [Scilit]
- Huang, G.; Wu, S.; Zhang, Y.; Wei, W.; Fu, W.; Zhang, J.; Yang, Y.; Fu, J. AttenResNet18: A Novel Cross-Domain Fault Diagnosis Model for Rolling Bearings. Sensors 2025, 25, 5958. [Google Scholar] [CrossRef] [Scilit] [PubMed]
- Yu, X.; Liang, Z.; Wang, Y.; Yin, H.; Liu, X.; Yu, W.; Huang, Y. A wavelet packet transform-based deep feature transfer learning method for bearing fault diagnosis under different working conditions. Measurement 2022, 201, 111597. [Google Scholar] [CrossRef] [Scilit]
- Stockwell, R.G.; Mansinha, L.; Lowe, R.P. Localization of the complex spectrum: The S transform. IEEE Trans. Signal Process. 1996, 44, 998–1001. [Google Scholar] [CrossRef] [Scilit]
- Sejdić, E.; Djurović, I.; Jiang, J. A window width optimized S-transform. EURASIP J. Adv. Signal Process. 2007, 2008, 672941. [Google Scholar] [CrossRef] [Scilit]
- Li, Y.; Hou, Q.; Zheng, Z.; Cheng, M.-M.; Yang, J.; Li, X. Large selective kernel network for remote sensing object detection. In Proceedings of the IEEE/CVF International Conference on Computer Vision (ICCV); IEEE: New York, NY, USA, 2023; pp. 16794–16805. [Google Scholar]
- Wang, P.; Chen, P.; Yuan, Y.; Liu, D.; Huang, Z.; Hou, X.; Cottrell, G. Understanding convolution for semantic segmentation. In Proceedings of the IEEE Winter Conference on Applications of Computer Vision (WACV); IEEE: New York, NY, USA, 2018; pp. 1451–1460. [Google Scholar]
- He, K.; Zhang, X.; Ren, S.; Sun, J. Deep residual learning for image recognition. In Proceedings of the IEEE Conference on Computer Vision and Pattern Recognition (CVPR); IEEE: New York, NY, USA, 2016; pp. 770–778. [Google Scholar]
- Niu, J.; Pan, J.; Qin, Z.; Huang, F.; Qin, H. Small-Sample Bearings Fault Diagnosis Based on ResNet18 with Pre-Trained and Fine-Tuned Method. Appl. Sci. 2024, 14, 5360. [Google Scholar]
- Long, M.; Cao, Y.; Wang, J.; Jordan, M.I. Learning transferable features with deep adaptation networks. In Proceedings of the 32nd International Conference on Machine Learning, Lille, France, 6–11 July 2015; pp. 97–105. [Google Scholar]
- Yu, X.; Feng, Z.; Liang, M. Analytical vibration signal model and signature analysis in resonance region for planetary gearbox fault diagnosis. J. Sound Vib. 2021, 498, 115962. [Google Scholar]
- Ganin, Y.; Ustinova, E.; Ajakan, H.; Germain, P.; Larochelle, H.; Laviolette, F.; Marchand, M.; Lempitsky, V. Domain-adversarial training of neural networks. J. Mach. Learn. Res. 2016, 17, 1–35. [Google Scholar]
- Zhu, Y.; Zhuang, F.; Wang, J.; Ke, G.; Chen, J.; Bian, J.; Xiong, H.; He, Q. Deep subdomain adaptation network for image classification. IEEE Trans. Neural Netw. Learn. Syst. 2021, 32, 1713–1722. [Google Scholar]
- Sun, B.; Saenko, K. Deep CORAL: Correlation alignment for deep domain adaptation. In Computer Vision—ECCV 2016 Workshops; Springer: Berlin/Heidelberg, Germany, 2016; pp. 443–450. [Google Scholar]
- Cui, S.; Wang, S.; Zhuo, J.; Li, L.; Huang, Q.; Tian, Q. Towards Discriminability and Diversity: Batch Nuclear-Norm Maximization Under Label Insufficient Situations. In Proceedings of the IEEE/CVF Conference on Computer Vision and Pattern Recognition (CVPR); IEEE: New York, NY, USA, 2020; pp. 3940–3949. [Google Scholar]
- Saito, K.; Watanabe, K.; Ushiku, Y.; Harada, T. Maximum classifier discrepancy for unsupervised domain adaptation. In Proceedings of the IEEE/CVF Conference on Computer Vision and Pattern Recognition (CVPR); IEEE: New York, NY, USA, 2018; pp. 3723–3732. [Google Scholar]
- Van der Maaten, L.; Hinton, G. Visualizing data using t-SNE. J. Mach. Learn. Res. 2008, 9, 2579–2605. [Google Scholar]
- Woo, S.; Park, J.; Lee, J.-Y.; Kweon, I.S. CBAM: Convolutional block attention module. In Proceedings of the European Conference on Computer Vision (ECCV); Springer: Berlin/Heidelberg, Germany, 2018; pp. 3–19. [Google Scholar]
- Liu, D.; Cui, L.; Cheng, W. A review on deep learning in planetary gearbox health state recognition: Methods, applications, and dataset publication. Meas. Sci. Technol. 2024, 35, 012002. [Google Scholar]

Disclaimer/Publisher’s Note: The statements, opinions and data contained in all publications are solely those of the individual author(s) and contributor(s) and not of MDPI and/or the editor(s). MDPI and/or the editor(s) disclaim responsibility for any injury to people or property resulting from any ideas, methods, instructions or products referred to in the content. |
© 2026 by the authors. Licensee MDPI, Basel, Switzerland. This article is an open access article distributed under the terms and conditions of the Creative Commons Attribution (CC BY) license.