


Abstract
In recent years, strong emphasis has been put on decarbonising the transport and mining sectors in an economically viable manner. To this end, ammonia is presented as a fuel, combining a high energy density (when compared to hydrogen) and zero carbon emissions. In this work, conversion of a mining haul truck engine is simulated for its use with an ammonia/diesel dual-fuel system at up to 70% Ammonia Energy Replacement (AER). The numerical setup is partially validated against engine performance data. The simulations suggest a reduction in emissions but an increase in N2O, which increases the carbon-equivalent emissions of the engine. Nevertheless, emissions appear to be reduced, suggesting the use of post-treatment is required to deal with the issue of N2O. Cylinder temperature control is recommended for its reduction, as temperatures are lower when burning ammonia. On the other hand, the simulations suggest that ammonia slip increases with AER if diesel injection phasing is not optimised. Performance-wise, the engine develops a higher indicated mean effective pressure (IMEP) as AER increases, with a maximum at 40% AER, while combustion is delayed progressively into the engine cycle, as CAD50 values increase from −0.6 CAD ATDC at 0% AER to 20.1 CAD ATDC at 70% AER. Opportunities for further research are discussed, including more extensive experimental work to support or reject what is suggested by the simulations.
1. Introduction
The worldwide push towards addressing climate change and its challenges sheds an unfavourable light on technologies that utilise fossil fuels, such as internal combustion engines (ICEs). For example, the European Union (EU) intends to prohibit the sale of diesel- and gasoline-fuelled vehicles from 2035 onwards [1]. In this context, green hydrogen is often cited as an alternative to replace fossil fuels in ICEs, as its combustion produces no greenhouse gases (GHGs) in theory [2]. Nevertheless, its low content of energy per unit volume makes it unfeasible for practical use without cryogenics or compression [3].
Due to these difficulties, ammonia emerges as another alternative to fossil fuels. As shown in Table 1, it has a higher energy content per unit volume than hydrogen, and its storage pressure is only 0.99 MPa compared to compressed hydrogen’s 69 MPa, which makes its handling and logistics much easier. Furthermore, ammonia has a higher volumetric energy density than both compressed and liquefied hydrogen, meaning that it uses less space for the same amount of energy.
Table 1.
Combustion characteristics for compressed hydrogen (C-H2), liquid hydrogen (L-H2) and liquid ammonia (L-NH3). Sourced from Aziz et al. [3].
These characteristics make ammonia a practical form of fuel. Furthermore, ammonia already has infrastructure related to agriculture and explosives. Nevertheless, its combustion characteristics are different from those of commonly used fuels. Its low flame speed, high activation energy and general resistance to ignition means it struggles to perform similarly to diesel or gasoline [4]. The dual-fuel engine mode is used to mitigate these disadvantages, where ammonia is mixed into the intake charge, and then diesel injection is used to ignite the ammonia. Specifically, the diesel spray ignites and causes the combustion of the air–diesel–ammonia mixture inside the cylinder. This engine mode is attractive due to the ease of adapting existing engines, as you only have to add an ammonia delivery system into the intake.
This study is focused on heavy-duty, off-road engines, such as those used in mining haul trucks (MHTs). These engines have large displacements and power ratings, with generally poor emission control, emitting up to 0.9 tons of per hour of operation [5]. Diesel engines are also the main source of in underground mines [6].
The literature regarding ammonia engines is becoming more and more populated, but it mainly focuses on engines smaller than 1.5 L per cylinder (referred to as “light-duty engines” hereinafter). It is not well established whether the results obtained in such engines scale accordingly with size, so there is still a need for specific research in larger engines. Nevertheless, the high cost and low commercial availability are impediments to experimental research in laboratories for MHT engines.
Early studies refer to positive results obtained in light-duty diesel engines [7]. Specifically, 60% Ammonia Energy Replacement (AER) is identified as an optimum for emission reductions, noting that ignition is delayed and hydrocarbon (and ammonia) emissions increase due to the lower combustion temperature of ammonia. On the other hand, ref. [8] observes an increase in NO emissions, and attributes it to the presence of the nitrogen atom in the ammonia molecule, which at the same time delays the start of combustion for increased amounts of ammonia. While these two studies use biodiesel– mixtures, the former uses a larger displacement engine, which could explain the differing results.
Many studies on these engines focus on unburnt amounts of ammonia that are exhausted (slip ammonia), due to its high toxicity. In fact, many studies note similar results; ref. [9] notes that while emissions increase linearly with AER, they can be managed with pre- and post-injection of diesel fuel. Furthermore, ref. [10] reports that, even though specific ammonia emissions increase with AER, a diesel pre-injection ratio of more than 40% can reduce both ammonia and emissions, while increasing N2O.
Studies performed on larger engines incorporate numerical simulations to supplement the less-available experimental research. Many studies validate a base case with physical experiments and then extrapolate the results using ammonia, while exclusively numerical studies have also had success [11]. The present study will partially validate the results of the base case against performance data of the engine.
These studies identify the specific effects of increasing AER within a diesel engine. Firstly, there is a decrease in that is consistent with the decrease in the carbon-based fuel load. Secondly, there is a decrease in that is dependent on the specific AER utilized. Thirdly, there is an increase in N2O that is dependent on certain conditions, which, due to its global warming potential (GWP) of 273, could offset the decrease in [12]. Finally, unburnt increases in the exhaust as AER increases, unless specific precautions are taken (pre/post-injection, among others).
Specifically, ref. [13] uses a 2.44 L one-cylinder engine and performs experiments for 0%, 20% and 40% AER, which are used to validate numerical simulations via pressure traces. This way, emissions are measured from simulations, which reveal reductions in and , but it is an increase in that actually drives the total GHG emissions upwards. is also increased with AER, and the start of combustion is delayed. Ref. [14] uses the same engine and a diesel–ammonia mixture to validate the pressures and emissions of a numerical model, and then includes hydrogen to numerically evaluate its effects on the original mixture. Ref. [15] uses a larger, 5.36 L/cyl engine and notes that the ammonia engine needs additional modifications in order to effectively reduce GHG emissions and that an LNG engine actually increases them. Ref. [11] provides a succinct summary of a number of experiments and simulations along with their specific emission levels.
However, the amount of research on larger engines like these is still limited. Considering all this, it is established that there are only a few studies on the emissions of MHT engines that use ammonia as a fuel. The novelty of this work is that it aims to contribute to the literature by estimating the emissions of such an engine for an extended range of AER in order to compare the emissions with those observed in other studies. Furthermore, the results can be compared with what has been observed in smaller engines, as no comparison is available in the literature. To this end, the results will be compared using specific emissions, normalising the concentration values by the work produced in the engine cycle.
2. Materials and Methods
This study follows the general objective of simulating the effects of ammonia addition to a diesel engine in dual-fuel mode. The engine selected for this is detailed in Table 2, which corresponds to a Caterpillar C32 engine, which can be found in typical MHTs. This engine data was provided by PowerTrain Technologies in Santiago, Chile.
Table 2.
Engine specifications from the performance sheet.
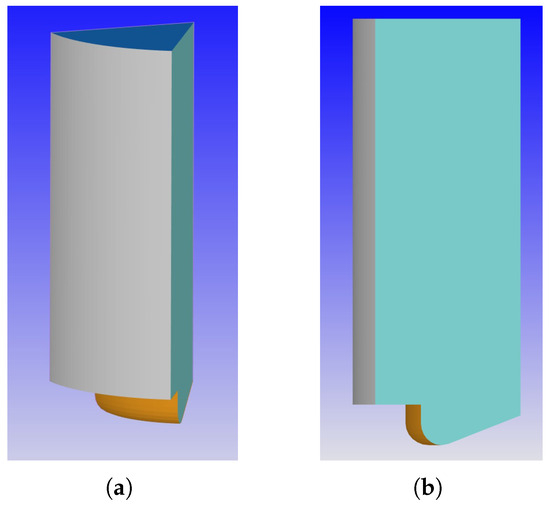
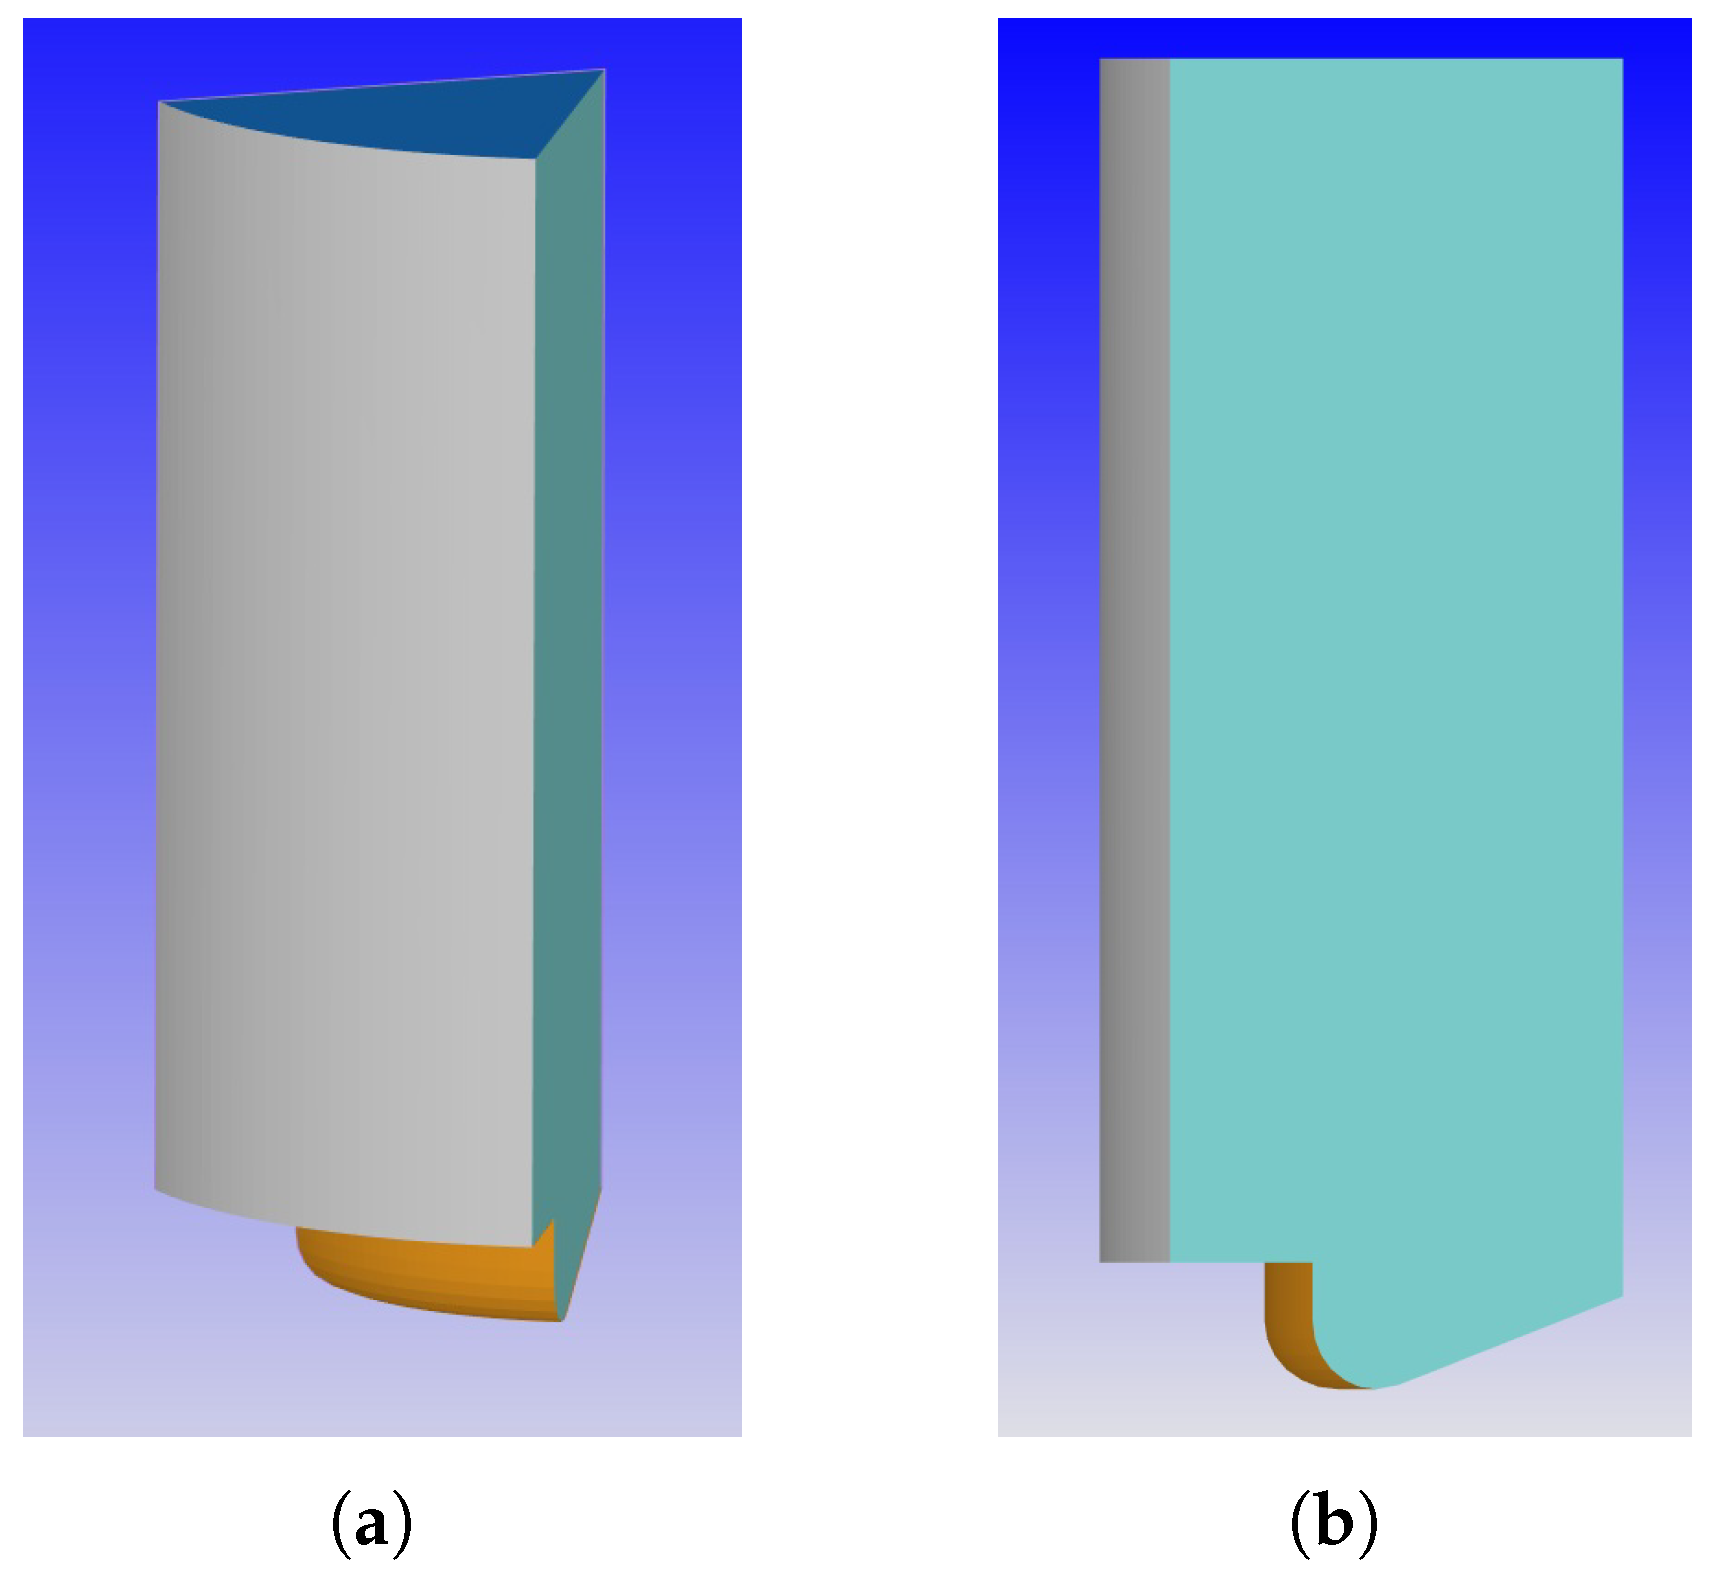
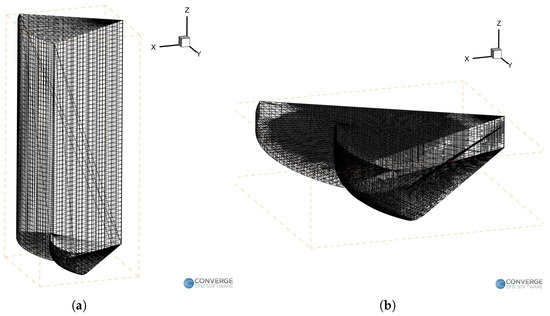
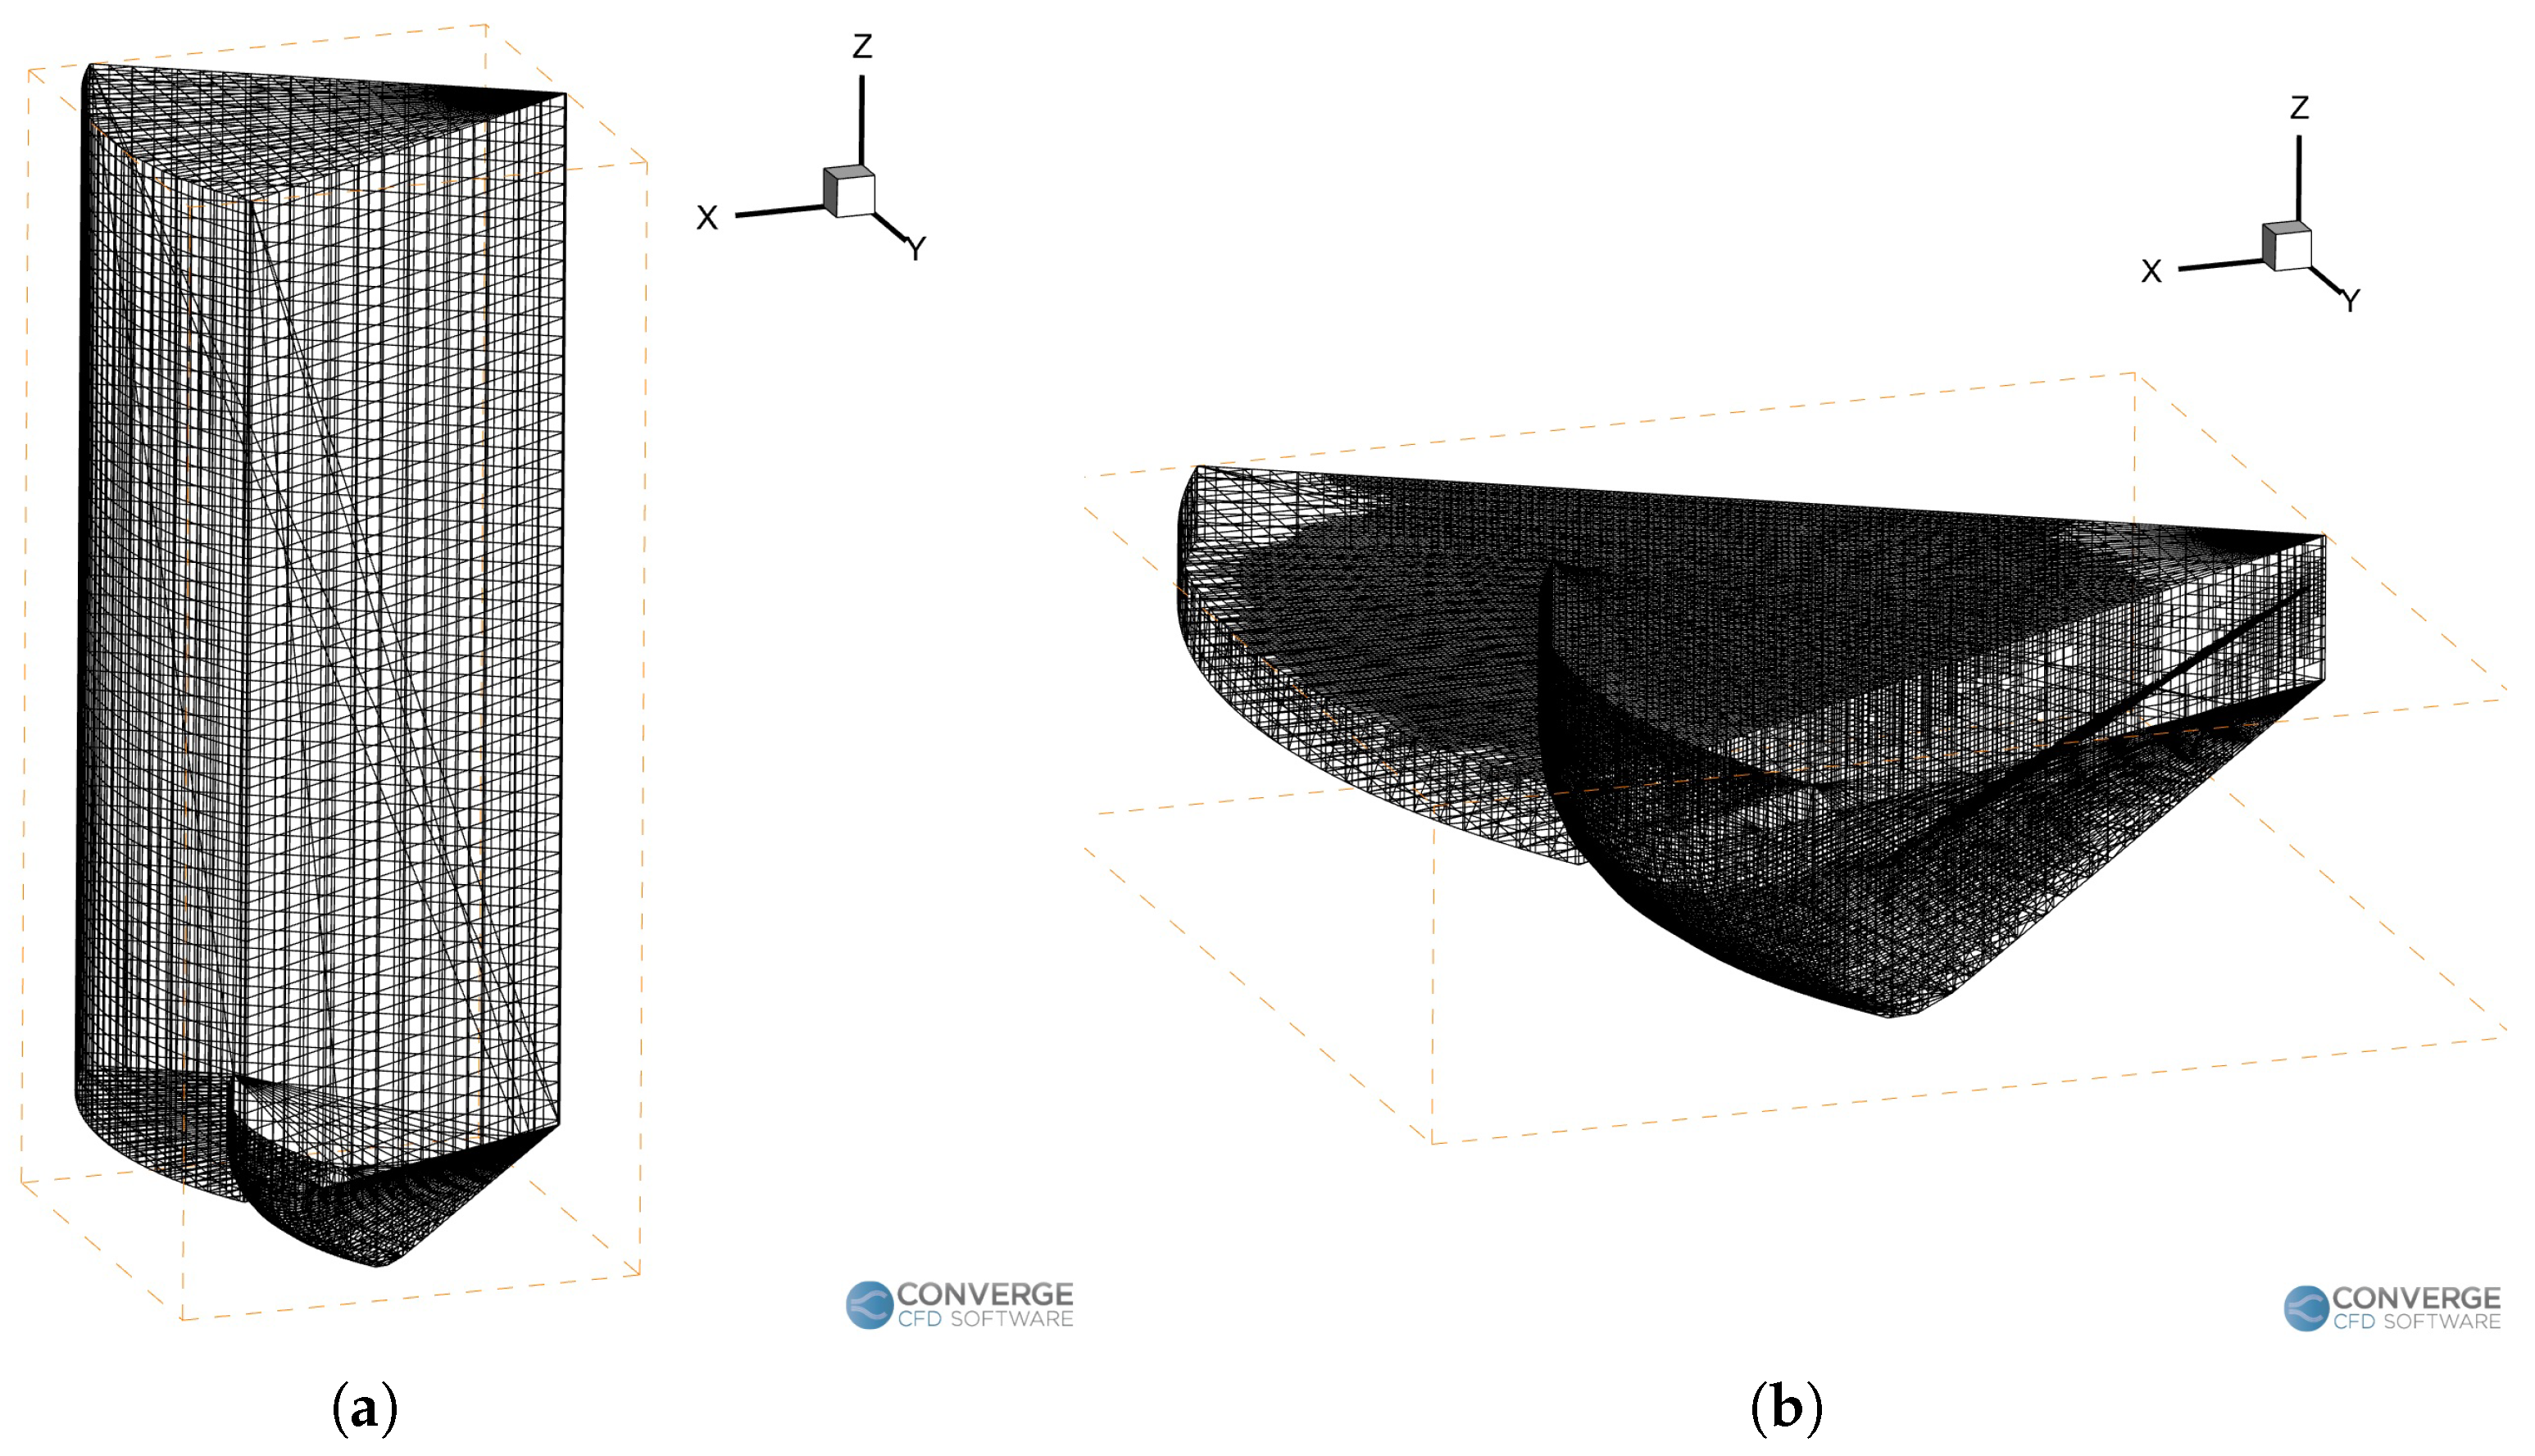
The 3D simulation is done with CONVERGE CFD, version 3.0.28. Only a sixth of the cylinder is simulated with a single-hole injector (the real engine uses a six-hole injector over its 360 degrees), which allows for reducing computational cost without sacrificing accuracy due to CONVERGE’s proprietary autonomous, run-time meshing algorithm and its combustion solver, as exemplified in other studies, such as [14,15], as well as [16,17], which performed a 45- and 60-degree sector simulation, respectively. In this study, periodic behaviour is also assumed over the axis-symmetry of the cylinder. The computational domain at bottom dead centre (BDC) can be seen in Figure 1. Furthermore, the simulation was run from Intake Valve Closing (IVC) to Exhaust Valve Opening (EVO), which means only the compression and power strokes are simulated.
Figure 1.
Geometry of the cylinder. (a) Perspective view. (b) Side view.
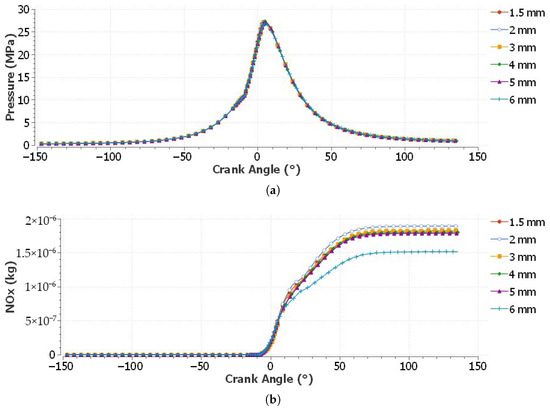
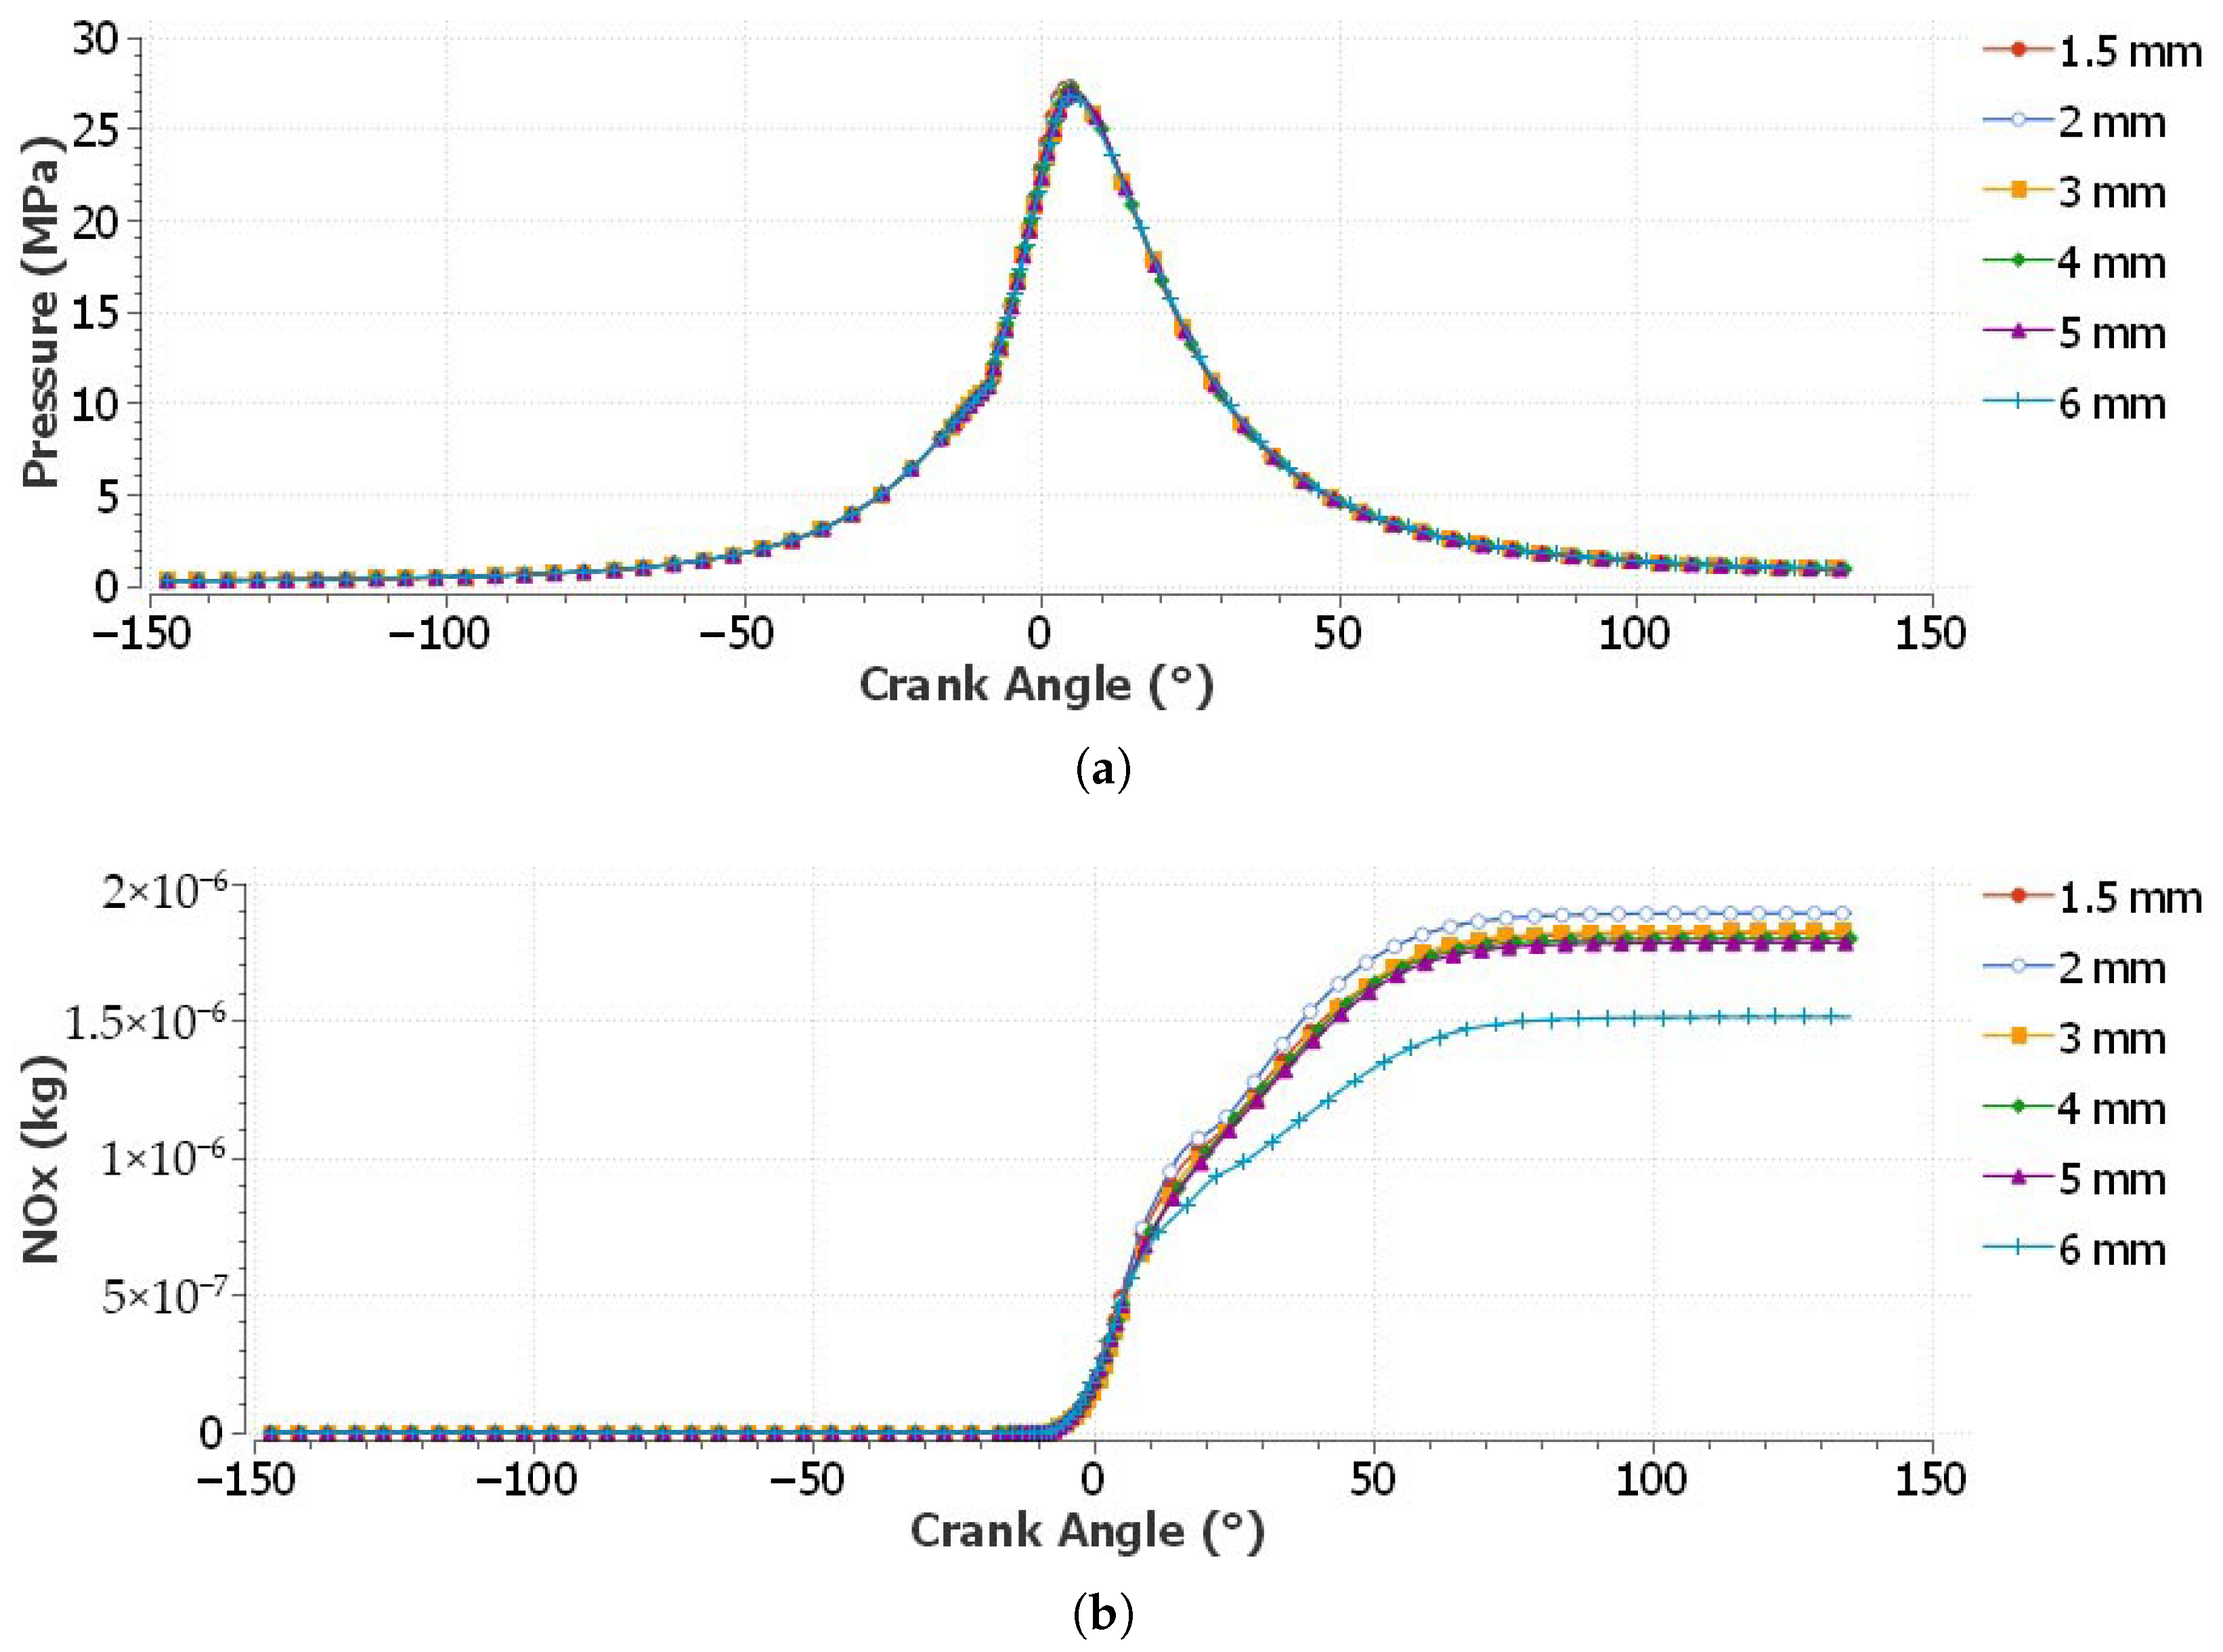
Adaptive Mesh Refinement is set at a maximum of three levels, with a level 2 fixed embedding in the near-injector space. Figure 2 shows that in-cylinder pressures and predictions are independent of mesh size in the case of the 0% AER simulation when a base grid of 1.5 mm is selected.
Figure 2.
Mesh independence study for 0% AER. (a) Pressure trace. (b) emissions.
With these settings, the mesh is shown in Figure 3, at both top dead centre (TDC) on the left, and at IVC on the right, which is the time at which the simulation is started.
Figure 3.
Computational mesh used. (a) Mesh at start time. (b) Mesh at TDC.
The selected physical sub-models are found in Table 3, and they were chosen based on the aforementioned studies, alongside others which use a full geometry, such as [18] or [19].
Table 3.
Physical sub-models selected.
The ammonia mass is derived from AER while maintaining the energy content constant from the base case (0% AER). An unintuitive consequence of this is the change in the overall equivalence ratio () of the mixture. Since the stoichiometric air/fuel ratio () from ammonia is 6.06 [20] compared to diesel’s 14.5 [21], the overall is lowered as AER increases. This would suggest that decreases as the energy content is kept equal across all AER values, but in reality the gaseous ammonia displaces a quantity of air from the cylinder which overcomes this and results in the overall observation that adding ammonia increases , as the displaced air has a bigger effect on than the decrease in , as can be observed in Table 4.
Table 4.
Initial conditions for all AER ratios.
Following this dual-fuel mode of operation, the cylinder domain must be initialised as a mixture of ammonia and air, inputting the conditions and mass fractions. To calculate the fuel mass of ammonia , Equation (1) is used, dividing the total energy by ammonia’s lower heating value (LHV, 18.8 MJ/kg) [20] and multiplying by AER.
where the total energy is calculated using the base case diesel mass flow , its LHV (43.51 MJ/kg) [21] and engine speed f.
Air mass is calculated from the remaining volume in the cylinder, as per Equation (3).
where air density is calculated at the turbocharged intake pressure and density as , and the density of ammonia is [22]. Mass fractions of both air and ammonia ( and , respectively) are presented in Table 4.
The amount of diesel injected is calculated by the mass that complements ammonia to achieve the aggregated . The injected diesel mass is found in Table 4. The simulated injector has a nozzle diameter of 0.26 mm with a spray cone angle of 9 degrees, which follows the design of the C32 engine.
The kinetics mechanism used was developed by Xu et al. [23] and has 69 species and 389 reactions. This mechanism has been experimentally validated for use in heavy-duty engines [18,19], and includes ammonia and n-heptane as fuels, while also including reactions for the creation of species.
Fuel injection is extracted from the real C32 engine data, and is fixed at −12 Crank Angle Degrees (CAD) before TDC with a duration of 15 CAD, and is maintained for all AER settings to maintain uniformity. Injection is modelled with liquid parcels, using the DIESEL2 compound from CONVERGE’s library, which has the physical properties of liquid diesel. Upon evaporation of the droplets, the fuel is handled as n-heptane for combustion.
The results will be categorised as related to performance or emissions. For the former, the pressure trace and heat release rate (HHR) will be plotted for analysis of the timing and peak of the combustion event, while the indicated mean effective pressure (IMEP) is presented in Table 5 alongside CAD10, CAD50 and CAD90 data, which are the crank angles at which 10%, 50%, and 90% of the energy is released, respectively.
Table 5.
Indicated mean effective pressure and combustion phasing.
Regarding emissions, exhaust concentrations will be presented at EVO, and are assumed to be exhaust emissions. Nevertheless, the differences in equivalence ratio presented in Table 4 mean that some concentrations will be more diluted than others. For this, all exhaust concentrations will be normalised to 5% oxygen, following Equation (4), which also follows industry practices and ensures direct comparability with the engine performance data that is available for validation.
where is the obtained concentration of species x, and is its concentration normalised to 5% oxygen. This normalisation will allow for conclusions to be drawn on the effects of increasing AER on the release of species of interest regardless of the changing equivalence ratio, specifically slip , CO, , NO, and N2O. The choice of presented species is due to their effects on either climate change and/or toxicity. To further analyse the effects of ammonia on the carbon footprint of the engine, the total carbon equivalent emissions will also be calculated, considering and N2O and its global warming potential of 273 [12].
Finally, for the purpose of comparing the results with those present in the literature, the exhaust gas masses will be normalised by the indicated work developed in the cycle, which is calculated from engine IMEP following Equation (5).
where is the displacement of the engine cylinder. Thus, the comparison between light-duty engines and heavy-duty engines will use work-specific mass emissions , obtained by dividing mass emissions by the indicated work, following Equation (6).
3. Results
Simulations were performed for all AER values, with a maximum of about 1 million cells. It is worth noting that both the computation time and number of cells increase exponentially from 40% AER onwards, highlighting the complexity of high-ammonia simulations.
Validation of the simulations is achieved by comparing the technical data from the engine, which was provided by the manufacturer and presented in Table 2. In terms of performance, as seen in Table 5, IMEP at 0% AER is 16.7% higher than the BMEP that is reported in the datasheet. This conforms to the definitions of both measurements, as BMEP is measured after friction losses take effect and thus should be lower than IMEP. Because of this, the simulations are assumed to be overall congruent with reality with regards to engine performance.
In terms of emissions, the manufacturer only states that the concentration in exhaust is 397 ppm (at 5% ), while the simulation at 0% AER is 183 ppm (also at 5% ), as shown in Table 6. Although this is less than half of the reported amount, the orders of magnitude are the same and thus the trends observed are assumed to be realistic, even if the specific values are not.
Table 6.
Exhaust composition concentrations, normalised at 5% .
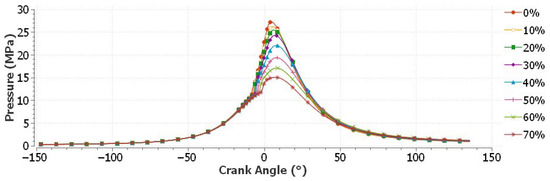
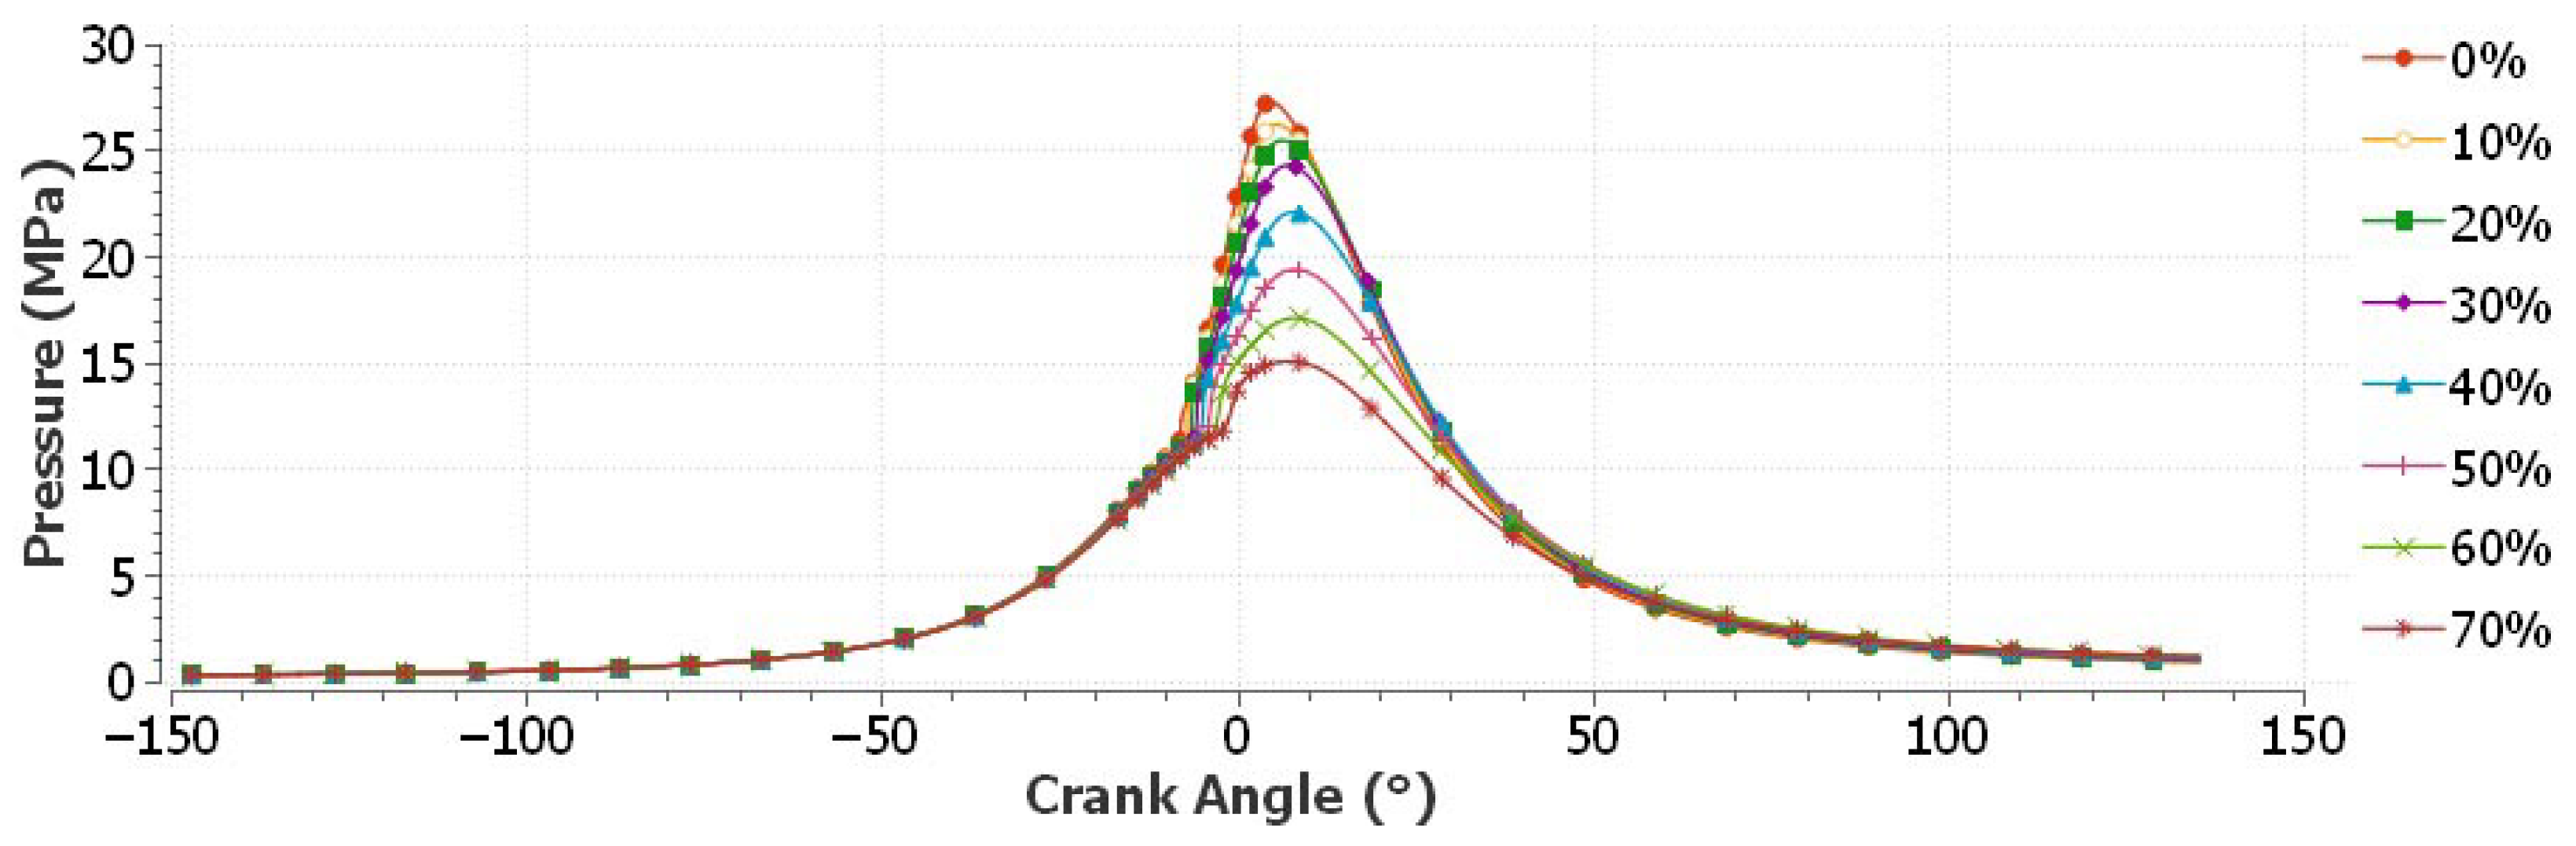
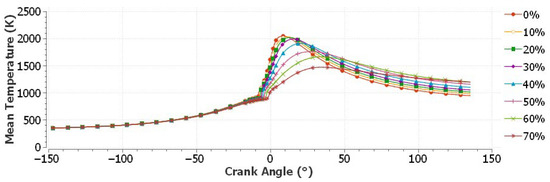
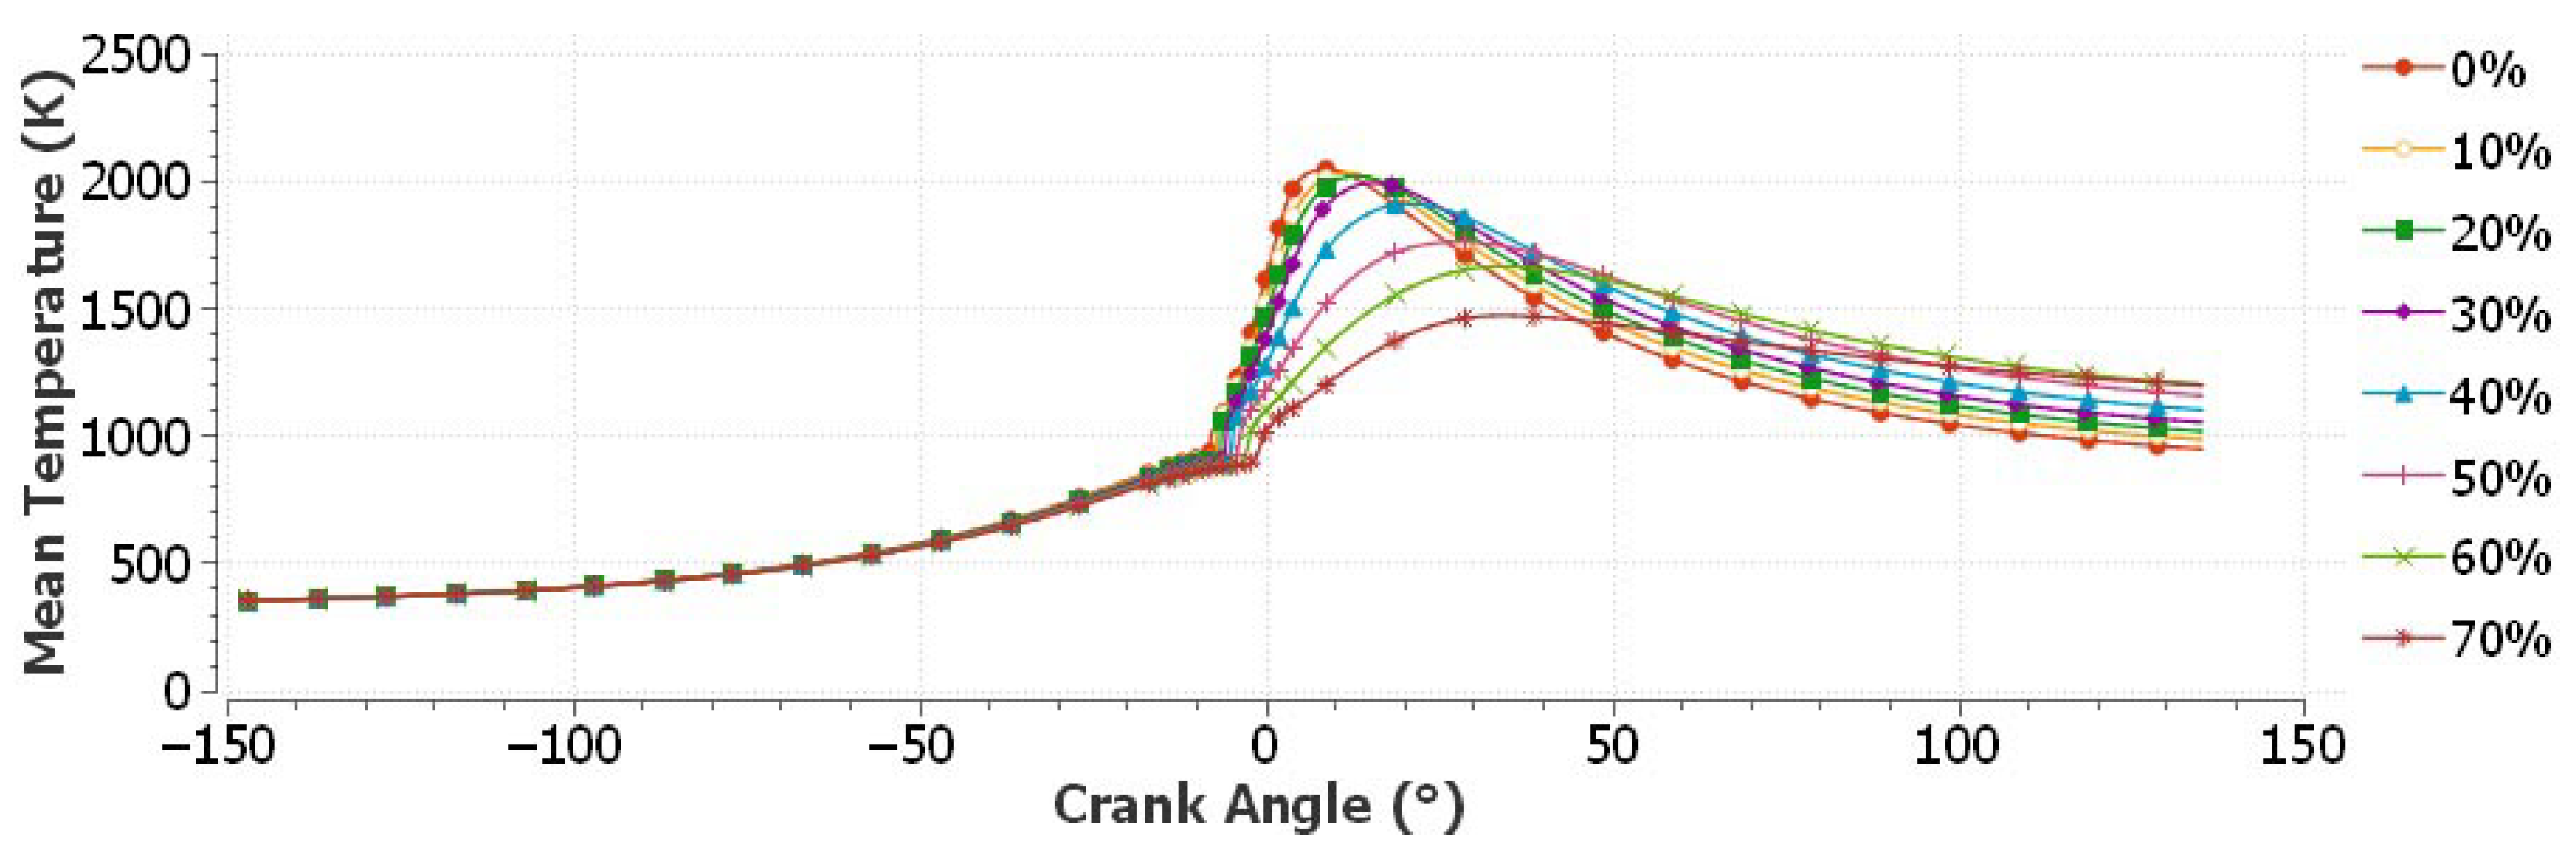
Figure 4 illustrates the decrease in pressure as AER is increased. While the base case has a maximum pressure of 27 MPa, for the 70% AER case it is barely over 15 MPa as the combustion starts after TDC. Nevertheless, the pressure is more spread out near its peak at higher AER. The peak is also retarded slightly. Figure 5 shows the in-cylinder mean temperatures for all AER values. Peak temperatures decrease, but the tail end gets progressively higher.
Figure 4.
Pressure traces for all AER values.
Figure 5.
Mean temperatures for all AER values.
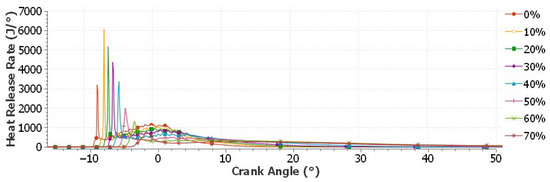
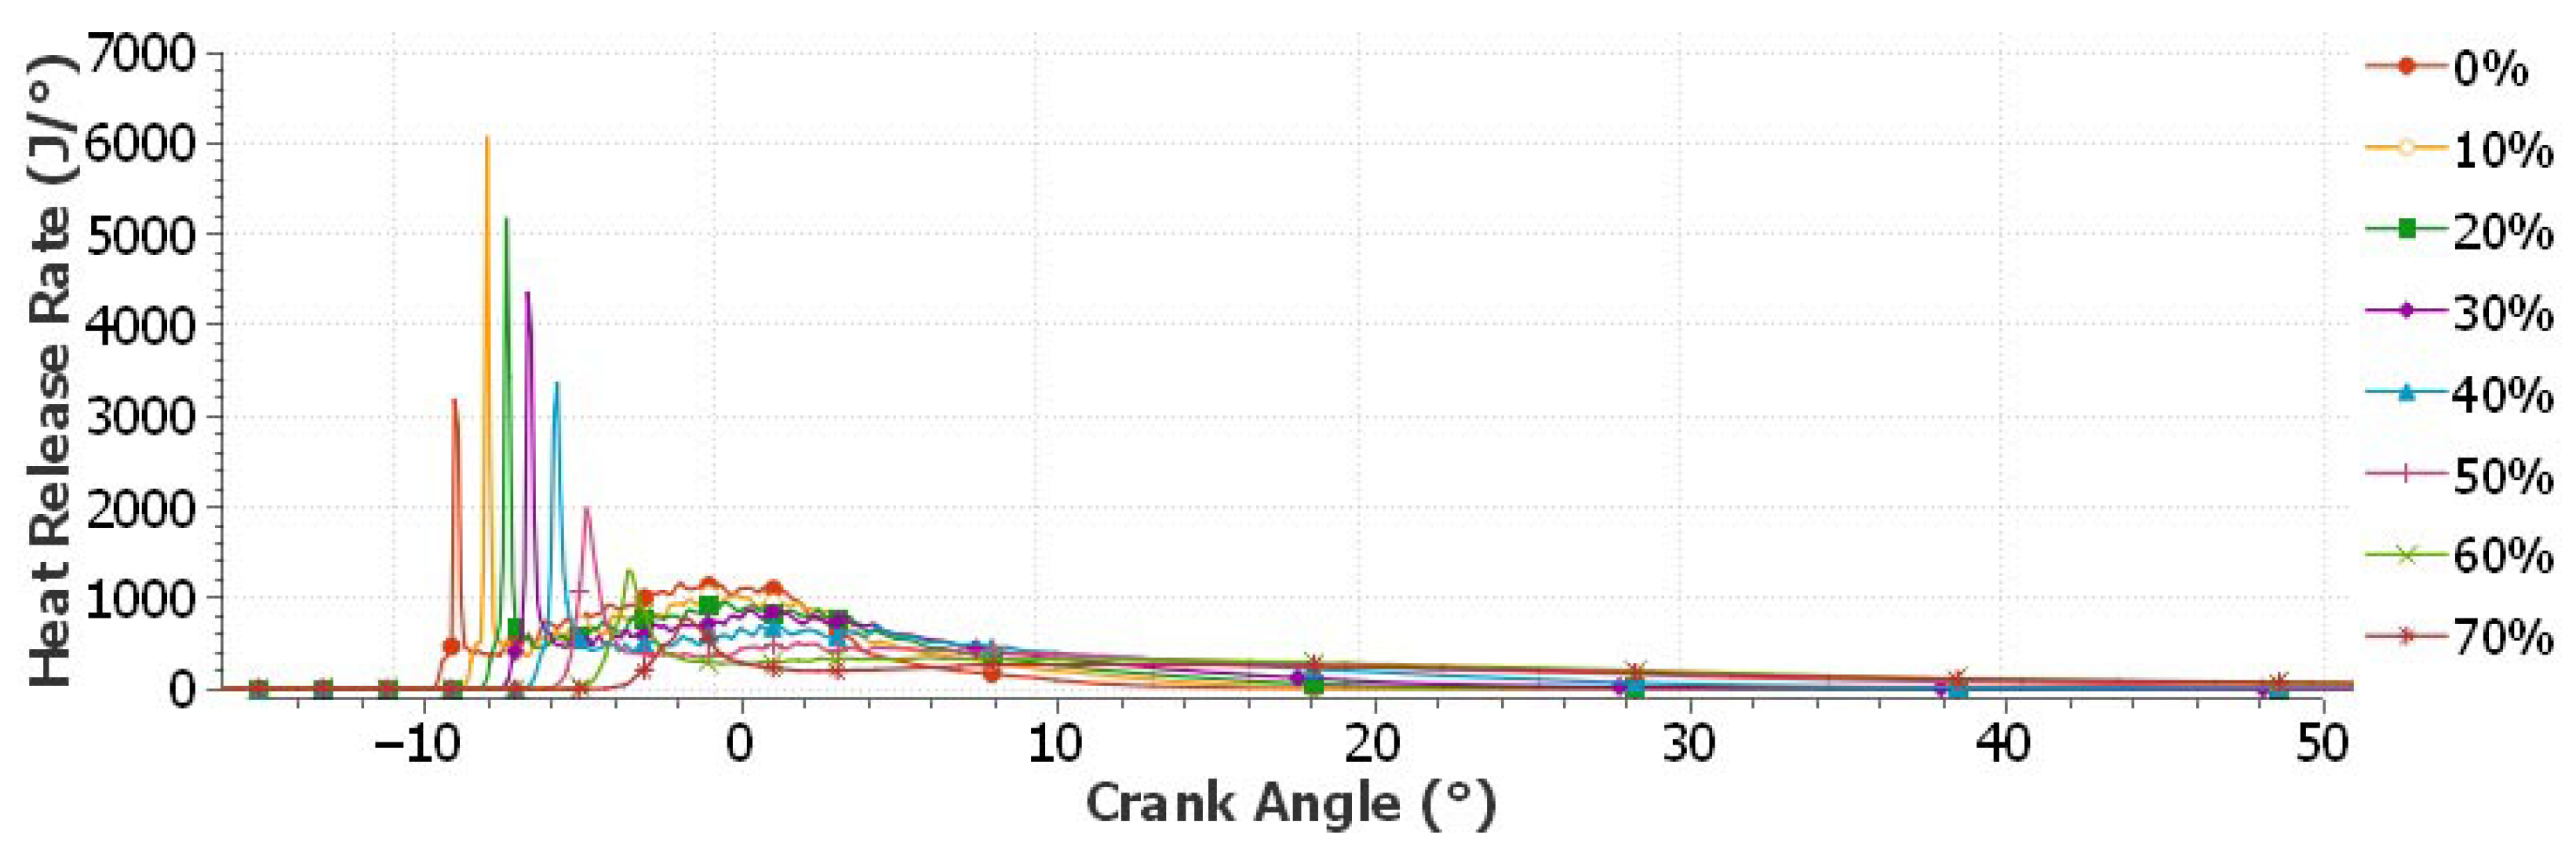
In terms of HRR, Figure 6 shows that all simulations present a similar behaviour, having one initial peak after which heat is released in a more sustained manner. It is notable how up to 50% AER, the peak HRR is higher than in the base case. Conversely, the sustained release phase is of a progressively lower order, which can be explained by ammonia’s slow burning speed. The first peak is evidence of a premixed flame, while the latter part is a diffusion one.
Figure 6.
Heat release rates for all AER values.
The results from Table 5 suggest that there is an increase in IMEP until AER reaches 40%, reaching a maximum of 2.48 MPa. Such a behaviour in pressure is consistent with what is observed in the literature [24]. The increase in IMEP can be explained by the fact that when diesel ignites, ammonia and air are already well mixed, thus leading to more efficient combustion. On the other hand, the higher equivalence ratio could also affect the combustion efficiency. Combustion phasing is observed to increase as AER increases, with fuel being burned progressively later in the cylinder cycle and for longer, as all CADXX values shift further in the positive direction. Specifically, CAD10 shifts slightly from −6.8 CAD ATDC to almost TDC, while the CAD50 values move from near TDC to 20.1 CAD ATDC and the CAD90 values are further shifted from 5.6 CAD ATDC to 64.1 CAD ATDC. The combustion duration is represented in the last column of Table 5 by the difference between CAD90 and CAD10, and it shows that the combustion is lengthened as it changes from 12.4 CAD ATDC to 64.2 CAD ATDC.
In terms of combustion timing, there is a delay in ignition as AER increases, as observed in Figure 4 and Figure 6 and in Table 5. This can also be explained by the burning characteristics of ammonia, namely its high auto-ignition temperature. It is also interesting how diesel’s own ignition is delayed by the presence of ammonia, as the initial peak in HRR happens later in the combustion cycle. This suggests that conditions of pure diesel and pure ammonia cannot be studied separately to understand their use as a fuel blend, as one affects the other. This has been observed previously by [25]. These characteristics of ignition delay are also observed in the literature, such as by [26] for diesel–ammonia injection or by [27] for dimethyl ether.
The characteristics of ammonia also explain the lengthening of the combustion event, as seen in Table 5, where all fuel burn CAD values increase as AER increases. At the highest AER steps, though, energy is released too far into the expansion of the combustion chamber, and thus IMEP is impacted negatively. As fuel burn CAD values change significantly, there could be an argument for recreating these experiments with varying injection timings, aiming to maintain a constant CAD50 value over all simulations. This would ensure that the energy release is centred around the same CAD, which would help maintain a constant energy conversion efficiency.
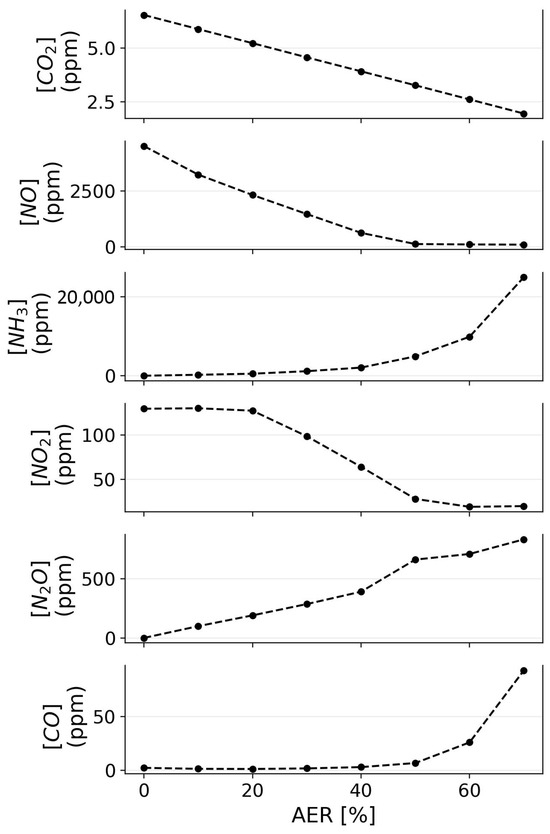
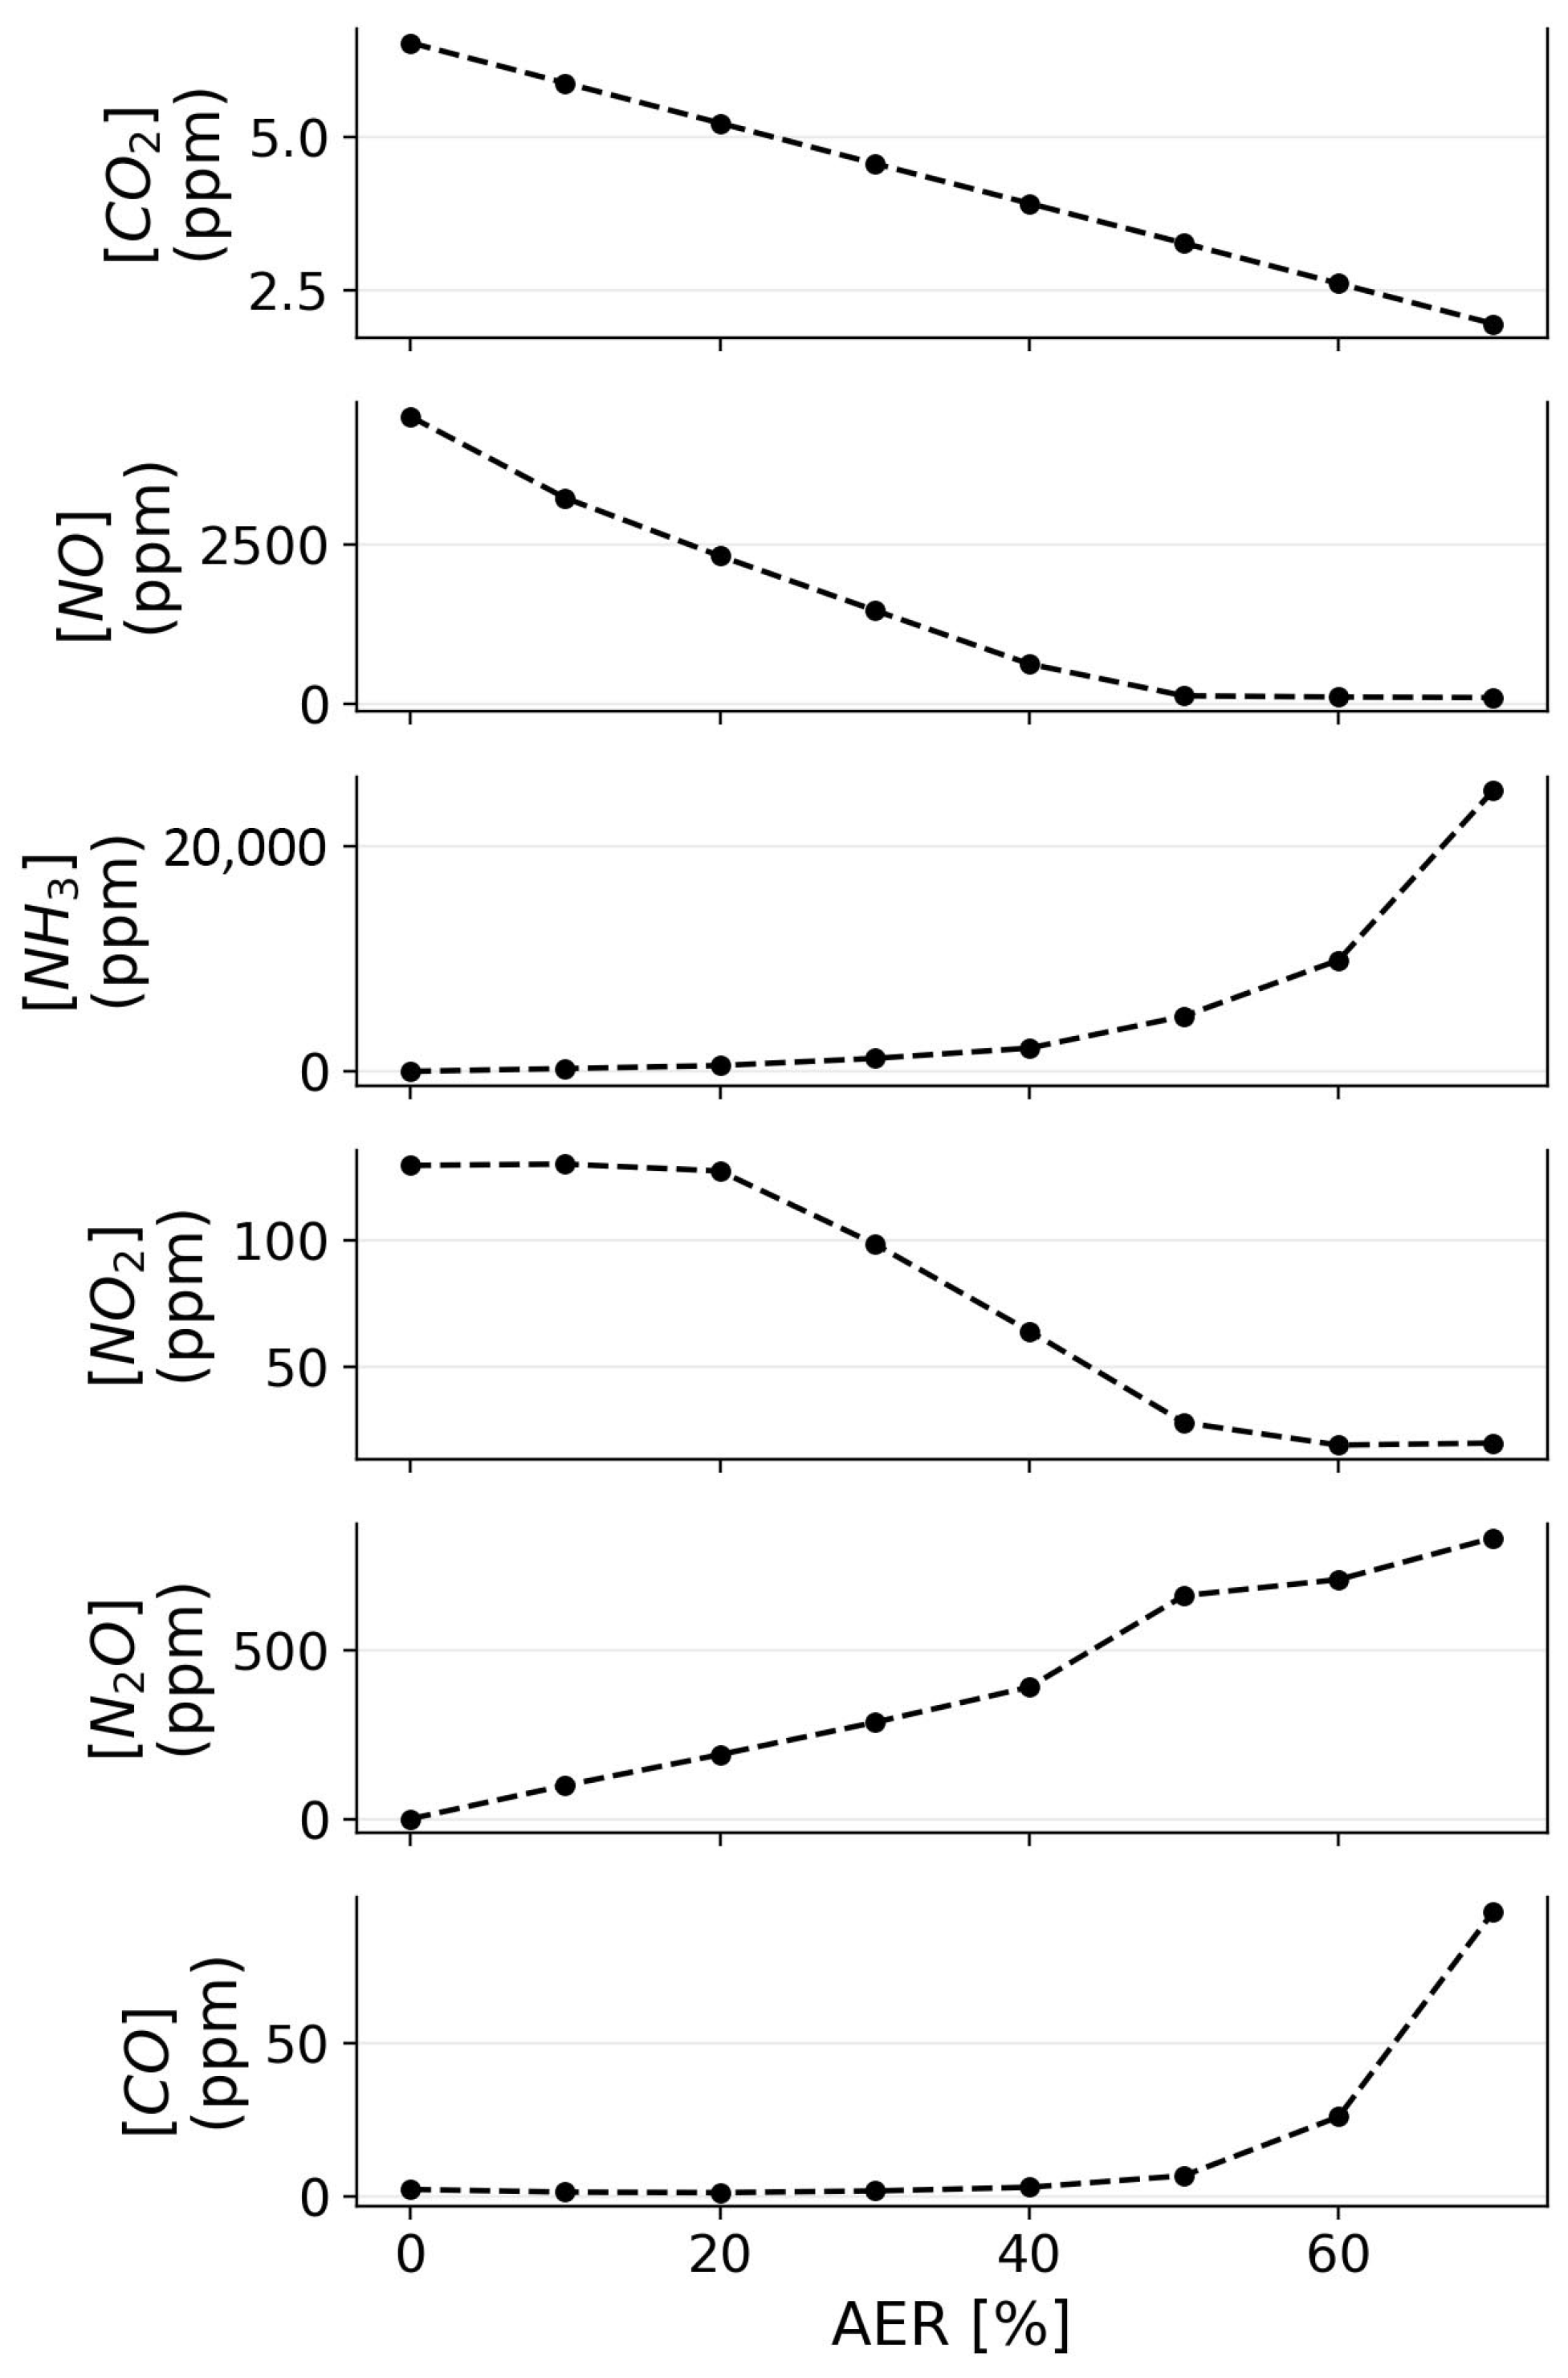
Table 7 presents the predicted exhaust-specific emissions as a function of AER, while Table 6 presents these emissions in the form of concentrations, which can be also observed in Figure 7. It is noted that and decrease steadily as AER increases, which could be categorised as a positive effect if the objective of this engine mode is to reduce contaminant emissions. Nevertheless, Table 7 also reveals that carbon-equivalent emissions actually increase as AER increases, which is explained by the increment in N2O and its GWP of 273, which more than compensates for the decrease in . Considering the purpose of ammonia as a “carbon-free” alternative to diesel, the simulations suggest that N2O cannot be ignored when evaluating the effects of adding such a fuel. The results from the simulations are somewhat different from what is observed in the literature for experiments on light-duty engines, as N2O emissions are higher in this case for all AER values [28]. Nevertheless, the overall effect of an increase in GHGs seems to be a usual occurrence in engines of this size, as it also was observed in other studies [16], which could suggest that the high release of N2O is a non-scalable factor when compared to light-duty engines. The increase in this species can be explained by the lower peak combustion temperatures observed in Figure 5, as its dissociation occurs mainly at higher temperatures [29,30].
Table 7.
Exhaust-specific emissions.
Figure 7.
Engine emissions as a function of AER.
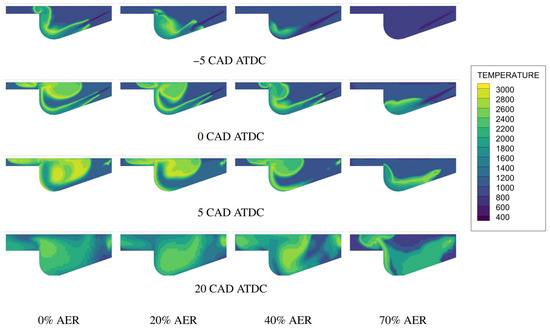
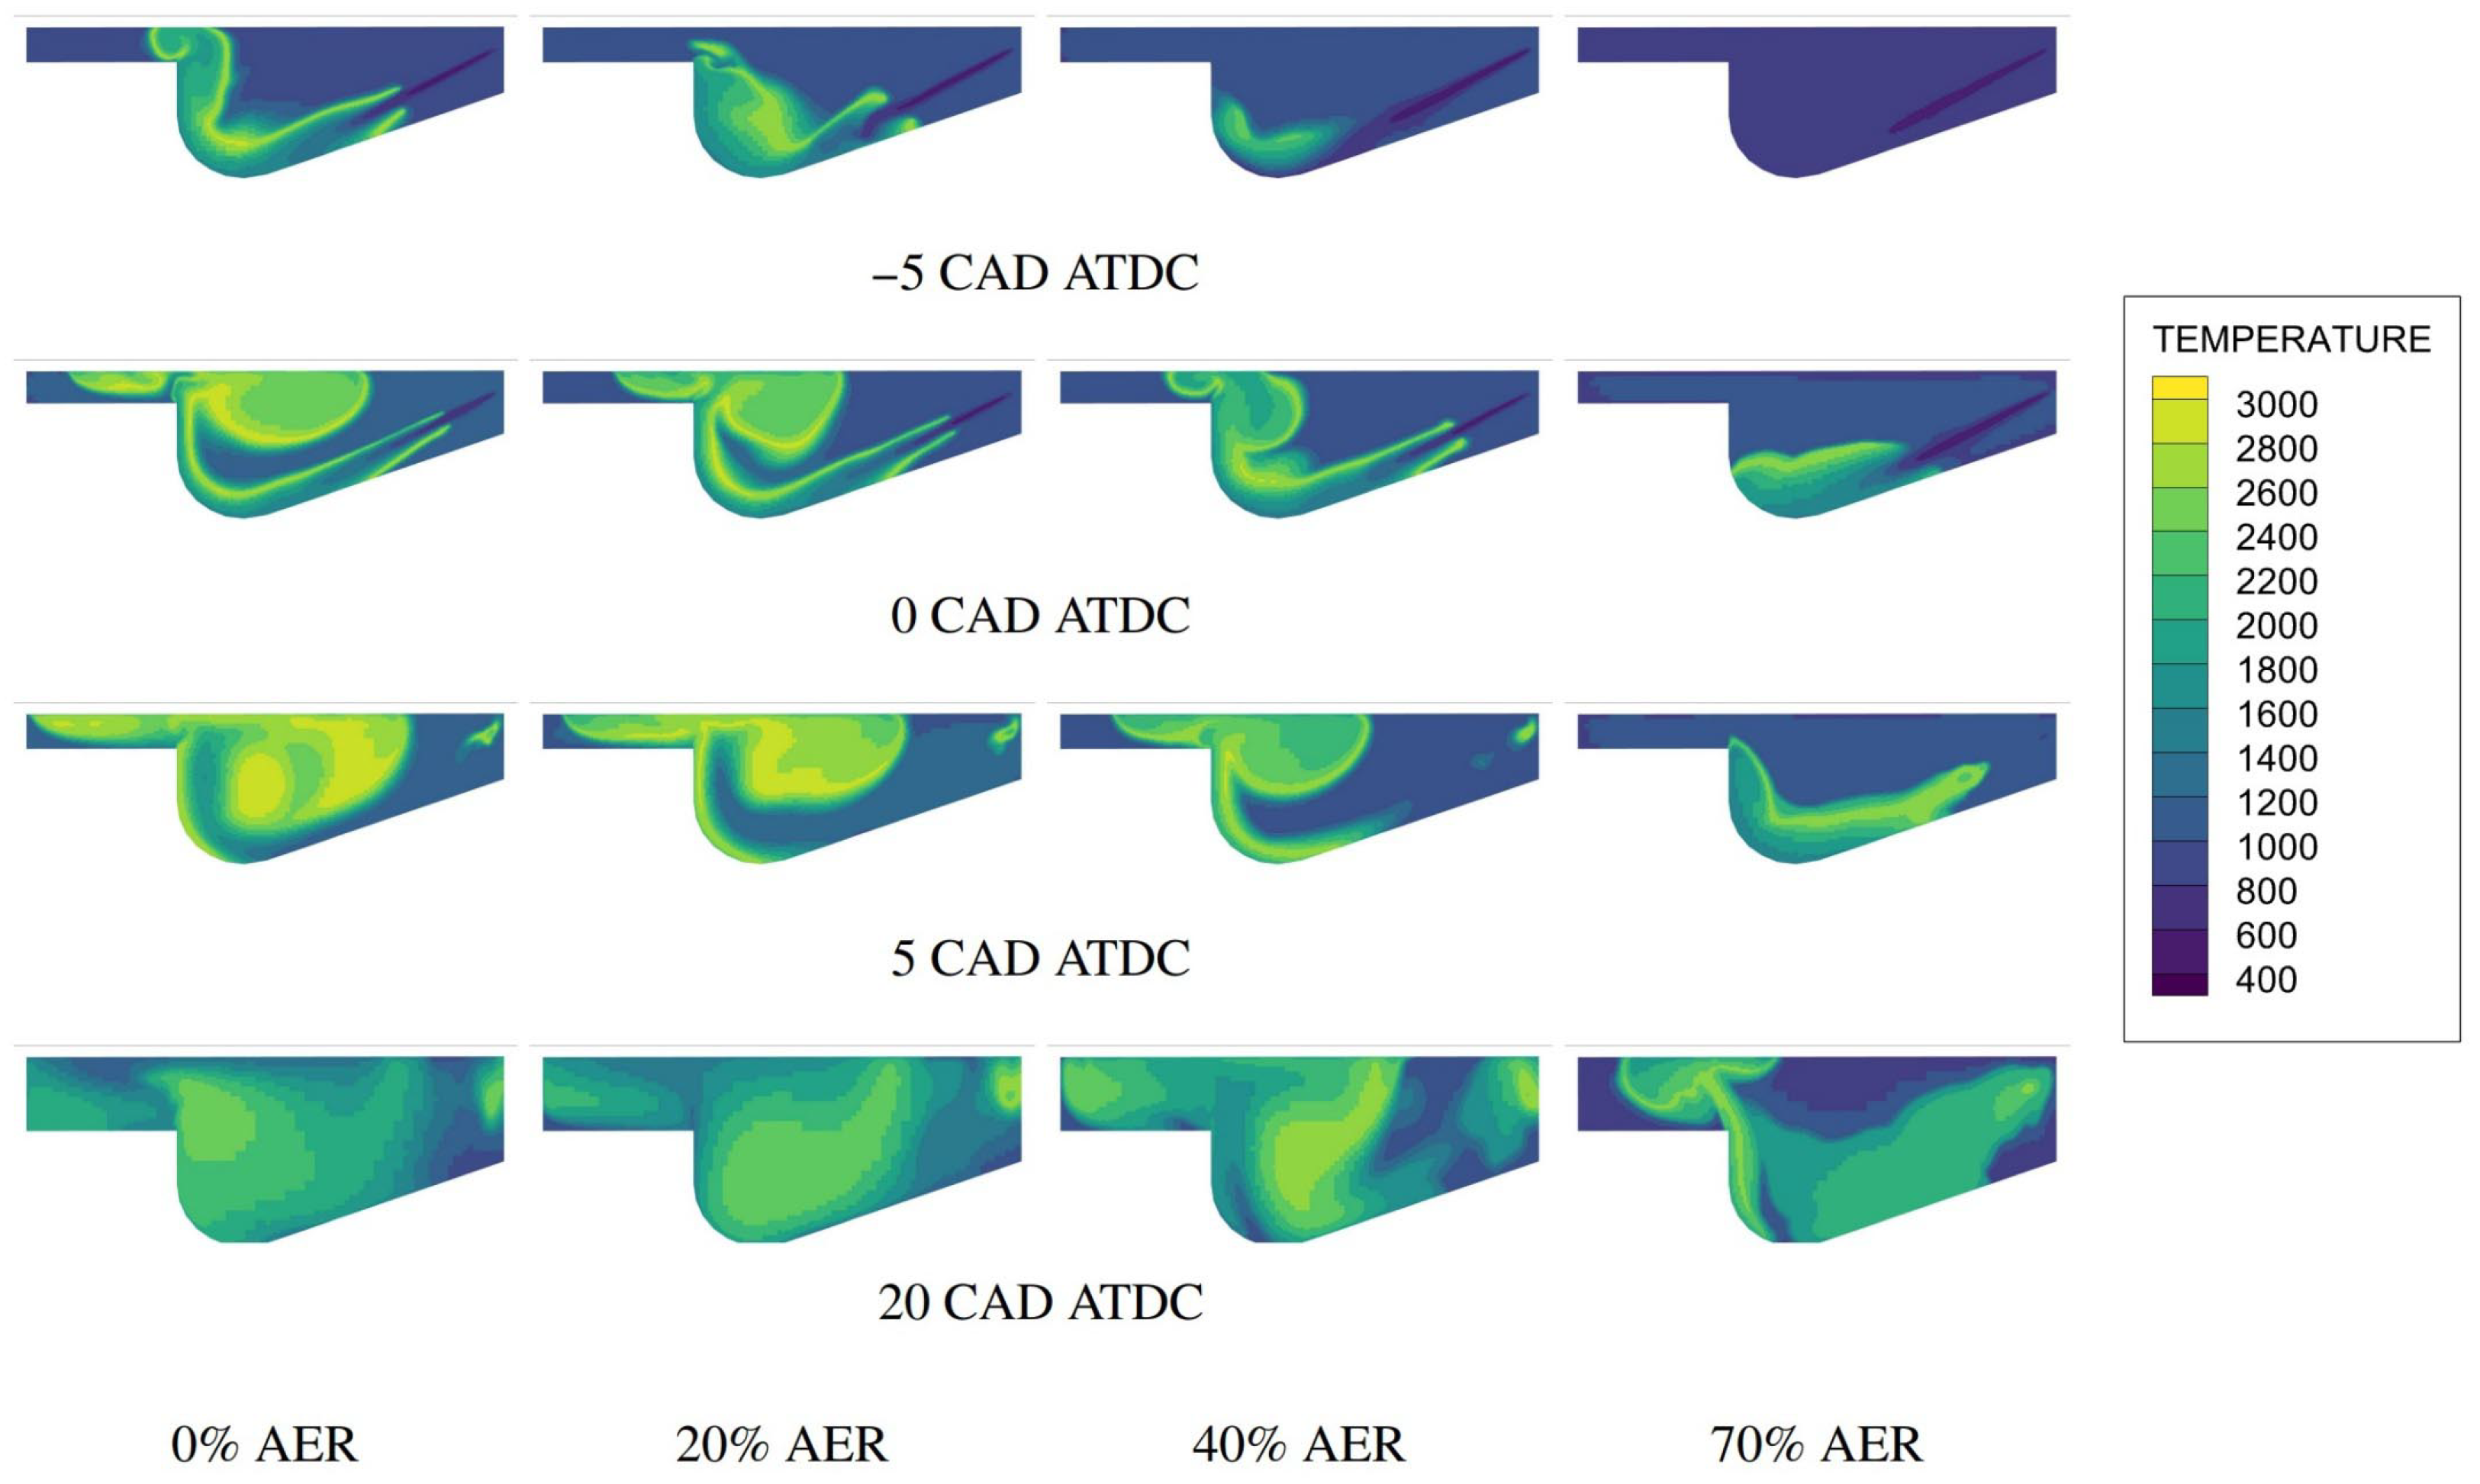
Figure 8 presents temperature slices for 0%, 20%, 40% and 70% AER, illustrating the different combustion events.
Figure 8.
In-cylinder temperature progression for different AER values.
Interestingly, the increase in N2O could be curtailed by somehow increasing the cylinder temperature (or wall heat losses), for example, by downsizing the cooling system of the engine. This would have the added benefit of requiring less energy and space to function, increasing the total thermal efficiency of the truck. If emissions of this species are successfully decreased, the environmental impact of the engine would be reduced massively, as emissions are already lowered by increasing AER. Nevertheless, increasing the cylinder temperature too much can cause these emissions to rise.
As mentioned, emissions appear to be reduced drastically with increasing AER. Total values are 27.03 g/kWh for 0% AER, and are reduced to 8.27 g/kWh at 30% AER and to 0.8 g/kWh at 70% AER. These reductions are driven by NO, as the quantity is minor in comparison. This reduction could be contradictory considering the addition of fuel-bound nitrogen as AER increases, which would suggest an increase in fuel-; nevertheless, the lower peak temperatures observed in Figure 5 appear to be limiting the amount of thermal NO.
As seen in Table 6, more unburnt ammonia is predicted as AER increases. Reasons for this include the aforementioned slower burning of ammonia, and also its entrapment in squish zones near the piston–cylinder wall interface. This could have negative consequences on the engine, as ammonia has high toxicity. Systems such as Selective Catalytic Reduction (SCR) systems are recommended to mitigate this. Overall, it seems to double at each AER step. On the other hand, CO is increased drastically from 50% AER onwards, staying pretty much constant before this. This indicates that the presence of high amounts of ammonia can lead to incomplete combustion of the remaining diesel. The lower combustion temperatures and pressures obtained could explain the presence of this intermediate combustion product. Nevertheless, 10% and 20% AER exhibit less CO emissions than the base case.
Finally, Figure 8 illustrates the progression of temperatures near TDC. Here it is also observed that higher AER values retard combustion, as seen for −5 CAD, where the increase in temperature is smaller for larger AER values. Thus, the combustion development inside the cylinder is also retarded, which is evidenced by the fact that at 5 CAD the high-temperature area encompasses the whole sector for 0% AER, but for 40% AER it is limited to the squish zone and piston bowl and for 70% it is only showing high temperature at the diesel jet. Figure 8 visually represents the fact that the mixture ignites first in the zones near the diesel jet. Furthermore, the fact that the diesel ignition is retarded for larger AER values is an indication that the presence of ammonia affects the reaction of the diesel ignition, which is attributed to the change in air–fuel ratio when ammonia is increased.
Considering the methods utilised and results observed, it must be stated that this study is limited to presenting the predicted effects of the addition of ammonia into a current commercial diesel engine, which is utilised commonly in MHTs.
4. Conclusions
This work presents the analysis of a heavy-duty ammonia–diesel internal combustion engine through CFD results. Simulations were performed for AER ratios from 0% to 70% in the setup of a CAT C32 engine, numerically obtaining performance and emissions results. The numerical set-up was validated against the engine’s performance data sheet, with similarity observed in the mean effective pressure (IMEP vs. BMEP) values, whilst identical orders of magnitude were obtained for emissions.
The simulations suggest an increase in IMEP up to a maximum at 40% AER, where it is 2.479 MPa, and a decrease at higher AER values. The simulated HRRs are similar in shape for all experiments, but their peaks differ in size.
Combustion start and duration are strongly related to the amount of ammonia in the mixture. As AER is increased, CAD10 is increased slightly while CAD50 and CAD90 increase more dramatically. This can be explained by ammonia’s combustion characteristics that favour slower combustion. It is suggested that further studies with optimised injection timing be performed.
shows a decrease that matches the increase in AER. This is counterbalanced by the fact that N2O actually increases, so the total carbon-equivalent emissions increase as AER increases. Higher N2O emissions are attributed to the higher nitrogen content in the fuel, as well as to lower in-cylinder temperatures. Systems such as cylinder temperature control are suggested to reduce the emissions of N2O.
emissions consistently decrease with increasing ammonia content, as its concentration is reduced by 97% when comparing 0% AER to 70% AER. Lower in-cylinder temperatures are the main cause for the lower levels of these species.
Ammonia slip is predicted to increase significantly, which is a direct result of the higher ammonia fuel input, but also due to the fact that injection timing was not optimised. Furthermore, this increase does not scale linearly with AER, showing negative effects on combustion efficiency as AER is higher. High ammonia emissions can be important due to its toxicity and corrosiveness; thus, additional measures might be necessary at high AER levels.
Carbon monoxide emissions are also influenced by the increase in AER. While the initial increments up tp 20% AER decrease CO levels in the exhaust, concentrations begin to rise beyond this point. Notably, from 60% AER onwards, CO levels increase sharply, indicating a degree of incomplete diesel combustion likely caused by the presence of ammonia in the intake mixture.
Lastly, the simulations suggest a key difference between light-duty engines (such as those used in road vehicles) and larger engines (MHT engines, such as the one studied herein), in the form of an increase in GHG emissions when AER increases, which does not occur in smaller engines. This would markedly differentiate the use cases for ammonia depending on engine size, and suggests further research to make it appropriate across all engine sizes. Nevertheless, it is important to mention that there is a need for further studies to validate and support or reject the conclusions that these simulations suggest, as could be done by experimental work in a diesel/ammonia dual-fuel engine of the same characteristics.
Author Contributions
J.A.: Writing—Original Draft, Conceptualisation, Investigation, Validation, and Visualisation; C.R.: Writing—Review and Editing and Methodology; I.C.: Writing—Review and Editing and Visualisation; M.W.: Writing—Review and Editing, Funding Acquisition, and Project Administration; W.J.: Writing—Review and Editing, Project Administration, Funding Acquisition, and Supervision. All authors have read and agreed to the published version of the manuscript.
Funding
The Agencia Nacional de Investigación y Desarrollo (ANID), through the Millenium Institute on Green Ammonia as Energy Vector (ICN2021_023), the Innovation Center for Sustainable Energy Transition (SET-Chile) (CTI 250019) and through grant ECOS240041 (jointly with ECOS-Sud Chili C24E08), has provided funding for this research, not directly related to the contents of this publication.
Data Availability Statement
The raw (simulation) data supporting the conclusions of this article will be made available by the authors on request.
Acknowledgments
Special thanks are extended to the PRISME Laboratory, Orléans, for the help provided in the development of this study.
Conflicts of Interest
The authors declare no conflicts of interest. The funders had no role in the design of the study; in the collection, analyses, or interpretation of data; in the writing of the manuscript; or in the decision to publish the results.
Abbreviations
The following abbreviations are used in this manuscript:
| ICE | Internal Combustion Engine |
| EU | European Union |
| GHGs | Greenhouse Gases |
| MHT | Mining Haul Truck |
| AER | Ammonia Energy Replacement |
| Nitrogen Oxides | |
| GWP | Global Warming Potential |
| BMEP | Brake Mean Effective Pressure |
| BDC | Bottom Dead Centre |
| IVC | Intake Valve Closing |
| EVO | Exhaust Valve Opening |
| TDC | Top Dead Centre |
| AFR | Air/Fuel Ratio |
| LHV | Lower Heating Value |
| CAD | Crank Angle Degrees |
| HRR | Heat Release Rate |
| IMEP | Indicated Mean Effective Pressure |
References
- Council of European Union. Council Regulation (EU) No 2023/851. 2023. Available online: https://eur-lex.europa.eu/legal-content/EN/TXT/?uri=celex:32023R0851 (accessed on 4 April 2025).
- Yan, F.; Xu, L.; Wang, Y. Application of hydrogen enriched natural gas in spark ignition IC engines: From fundamental fuel properties to engine performances and emissions. Renew. Sustain. Energy Rev. 2018, 82, 1457–1488. [Google Scholar] [CrossRef] [Scilit]
- Aziz, M.; Wijayanta, A.T.; Nandiyanto, A.B.D. Ammonia as effective hydrogen storage: A review on production, storage and utilization. Energies 2020, 13, 3062. [Google Scholar] [CrossRef] [Scilit]
- Mounaïm-Rousselle, C.; Bréquigny, P.; Dumand, C.; Houillé, S. Operating limits for ammonia fuel spark-ignition engine. Energies 2021, 14, 4141. [Google Scholar] [CrossRef] [Scilit]
- Kecojevic, V.; Komljenovic, D. Haul truck fuel consumption and CO2 emission under various engine load conditions. Min. Eng. 2010, 62, 44–48. [Google Scholar]
- Banasiewicz, A.; Janicka, A.; Michalak, A.; Włostowski, R. Photocatalysis as a method for reduction of ambient NOx in deep underground mines. Measurement 2022, 200, 111453. [Google Scholar] [CrossRef] [Scilit]
- Reiter, A.J.; Kong, S.C. Demonstration of compression-ignition engine combustion using ammonia in reducing greenhouse gas emissions. Energy Fuels 2008, 22, 2963–2971. [Google Scholar] [CrossRef] [Scilit]
- Nadimi, E.; Przybyła, G.; Emberson, D.; Løvås, T.; Ziółkowski, Ł.; Adamczyk, W. Effects of using ammonia as a primary fuel on engine performance and emissions in an ammonia/biodiesel dual-fuel CI engine. Int. J. Energy Res. 2022, 46, 15347–15361. [Google Scholar] [CrossRef] [Scilit]
- Niki, Y.; Nitta, Y.; Sekiguchi, H.; Hirata, K. Diesel fuel multiple injection effects on emission characteristics of diesel engine mixed ammonia gas into intake air. J. Eng. Gas Turbines Power 2019, 141, 061020. [Google Scholar] [CrossRef] [Scilit]
- Jin, S.; Wu, B.; Zi, Z.; Yang, P.; Shi, T.; Zhang, J. Effects of fuel injection strategy and ammonia energy ratio on combustion and emissions of ammonia-diesel dual-fuel engine. Fuel 2023, 341, 127668. [Google Scholar] [CrossRef] [Scilit]
- Qu, Y.; Qiu, Y.; Zhang, Y.; Zhang, Y.; Mounaïm-Rousselle, C.; Han, D.; Huang, Z. Review of Combustion Technologies for Ammonia-Diesel Compression Ignition Engines: Approaches to Achieving High Ammonia Substitution. Front. Energy 2025, 19, 907–924. [Google Scholar] [CrossRef] [Scilit]
- Masson-Delmotte, V.; Zhai, P.; Pirani, A.; Connors, S.; Péan, C.; Berger, S.; Caud, N.; Chen, Y.; Goldfarb, L.; Gomis, M.; et al. (Eds.) Climate Change 2021: The Physical Science Basis. Contribution of Working Group I to the Sixth Assessment Report of the Intergovernmental Panel on Climate Change; Cambridge University Press: Cambridge, UK, 2021. [Google Scholar] [CrossRef] [Scilit]
- Yousefi, A.; Guo, H.; Dev, S.; Liko, B.; Lafrance, S. Effects of ammonia energy fraction and diesel injection timing on combustion and emissions of an ammonia/diesel dual-fuel engine. Fuel 2022, 314, 122723. [Google Scholar] [CrossRef] [Scilit]
- Fakhari, A.H.; Gharehghani, A.; Salahi, M.M.; Andwari, A.M. Numerical investigation of the hydrogen-enriched ammonia-diesel RCCI combustion engine. Fuel 2024, 375, 132579. [Google Scholar] [CrossRef] [Scilit]
- Xu, L.; Xu, S.; Bai, X.S.; Repo, J.A.; Hautala, S.; Hyvönen, J. Performance and emission characteristics of an ammonia/diesel dual-fuel marine engine. Renew. Sustain. Energy Rev. 2023, 185, 113631. [Google Scholar] [CrossRef] [Scilit]
- Deng, X.; Zhao, W.; Ye, L.; Gong, S.; Zhao, F.; Li, J. Combustion and emissions characteristics of ammonia/diesel dual-fuel engine with high premixed fractions in different injection modes. Int. J. Hydrogen Energy 2024, 49, 1232–1244. [Google Scholar] [CrossRef] [Scilit]
- Lu, Y.; Wei, M.; Wang, X.; Ji, Q.; Ao, C.; Wang, X.; Liu, J. Numerical study on influences of intake temperature and swirl ratio on in-cylinder combustion and pollutant formation characteristics of ammonia/diesel dual-fuel engine. J. Energy Inst. 2024, 117, 101860. [Google Scholar] [CrossRef] [Scilit]
- Kishore, K.; Kurien, C.; Mittal, M. Experimental and numerical analysis of engine characteristics of an ammonia-substituted dual-fuel CRDI diesel engine. Fuel 2024, 366, 131354. [Google Scholar] [CrossRef] [Scilit]
- Lewandowski, M.T.; Pasternak, M.; Haugsvær, M.; Løvås, T. Simulations of ammonia spray evaporation, cooling, mixture formation and combustion in a direct injection compression ignition engine. Int. J. Hydrogen Energy 2024, 52, 916–935. [Google Scholar] [CrossRef] [Scilit]
- Valera-Medina, A.; Xiao, H.; Owen-Jones, M.; David, W.I.; Bowen, P.J. Ammonia for power. Prog. Energy Combust. Sci. 2018, 69, 63–102. [Google Scholar] [CrossRef] [Scilit]
- Parravicini, M.; Barro, C.; Boulouchos, K. Experimental characterization of GTL, HVO, and OME based alternative fuels for diesel engines. Fuel 2021, 292, 120177. [Google Scholar] [CrossRef] [Scilit]
- Yan, C.Y. Introduction to Engineering Thermodynamics; British Columbia/Yukon Pressbooks: Online, 2022; pp. 349–362. Available online: https://pressbooks.bccampus.ca/thermo1/ (accessed on 6 April 2025).
- Xu, L.; Chang, Y.; Treacy, M.; Zhou, Y.; Jia, M.; Bai, X.S. A skeletal chemical kinetic mechanism for ammonia/n-heptane combustion. Fuel 2023, 331, 125830. [Google Scholar] [CrossRef] [Scilit]
- Xiao, H.; Ying, W.; Chen, A.; Chen, G.; Liu, Y.; Lyu, Z.; Qiao, Z.; Li, J.; Zhou, Z.; Deng, X. Study on the Impact of Ammonia–Diesel Dual-Fuel Combustion on Performance of a Medium-Speed Diesel Engine. J. Mar. Sci. Eng. 2024, 12, 806. [Google Scholar] [CrossRef] [Scilit]
- Yu, L.; Zhou, W.; Feng, Y.; Wang, W.; Zhu, J.; Qian, Y.; Lu, X. The Effect of Ammonia Addition on the Low-Temperature Autoignition of n-Heptane: An Experimental and Modeling Study. Combust. Flame 2020, 217, 4–11. [Google Scholar] [CrossRef] [Scilit]
- Scharl, V.; Sattelmayer, T. Ignition and combustion characteristics of diesel piloted ammonia injections. Fuel Commun. 2022, 11, 100068. [Google Scholar] [CrossRef] [Scilit]
- Issayev, G.; Giri, B.R.; Elbaz, A.M.; Shrestha, K.P.; Mauss, F.; Roberts, W.L.; Farooq, A. Ignition delay time and laminar flame speed measurements of ammonia blended with dimethyl ether: A promising low carbon fuel blend. Renew. Energy 2022, 181, 1353–1370. [Google Scholar] [CrossRef] [Scilit]
- Hiraoka, K.; Matsunaga, D.; Kamino, T.; Honda, Y.; Toshinaga, K.; Murakami, Y.; Nakamura, H. Experimental and Numerical Analysis on Combustion Characteristics of Ammonia and Diesel Dual Fuel Engine. Sae Int. J. Adv. Curr. Pract. Mobil. 2023, 6, 1441–1458. [Google Scholar] [CrossRef] [Scilit]
- Dai, G.; Zhang, S.; Zhang, Y.; Liao, Y.; Zhang, J.; Tan, H.; Mikulčić, H.; Wang, X. Experimental and kinetic study of N2O thermal decomposition in pressurized oxy-combustion. Fuel 2023, 346, 128323. [Google Scholar] [CrossRef] [Scilit]
- Johnsson, J.E.; Glarborg, P.; Dam-Johansen, K. Thermal dissociation of nitrous oxide at medium temperatures. Symp. (Int.) Combust. 1992, 24, 917–923. [Google Scholar] [CrossRef] [Scilit]

Disclaimer/Publisher’s Note: The statements, opinions and data contained in all publications are solely those of the individual author(s) and contributor(s) and not of MDPI and/or the editor(s). MDPI and/or the editor(s) disclaim responsibility for any injury to people or property resulting from any ideas, methods, instructions or products referred to in the content. |
© 2026 by the authors. Licensee MDPI, Basel, Switzerland. This article is an open access article distributed under the terms and conditions of the Creative Commons Attribution (CC BY) license.