


Abstract
Abrasive air jet (AAJ) machining is a non-traditional technology used to pattern microstructures on a wide variety of engineering materials. Understanding the material removal mechanisms and the formation of micro-channels produced by AAJ is essential for optimizing process parameters and enhancing machining quality. Therefore, this study develops and validates a discrete element model to simulate abrasive air jet machining of micro-channels on quartz crystals. It shows that the crack network, which consists of opening mode cracks and shearing mode cracks, contributes to the removal of target particles. Opening mode cracks dominate the material removal process. The histories of the number of newly generated cracks and newly removed target particles can be divided into three stages: an incubation stage, a transitional stage, and a stable stage. Both the number of newly generated cracks and the number of newly removed target particles first increase and then decrease as the machining process progresses. An indicator called the “contribution rate” is proposed, showing that damage accumulates in the target substrate during abrasive air jet machining. During the machining of micro-channels, erosion impression appears at first. As the width and depth of the erosion impressions increase, micro-channels gradually form.
1. Introduction
Recently, there has been a high demand for the fabrication of microstructures on brittle materials. However, traditional machining methods often cause the breakage of the workpiece. Chemical etching has low machining efficiency and involves a complex process. Therefore, the development of manufacturing methods for patterning microstructures has become a topic of great interest. The laser-assisted slow tool servo diamond turning method was proposed and successfully used to machine micro-lens arrays on single-crystal silicon with high surface quality [1]. Additionally, elliptical vibration diamond cutting technology was employed to fabricate micro-channels on single-crystal silicon [2]. It was found that the amplitude-controlled ductile mode sculpturing method can be applied to achieve high-quality micro-channels.
Abrasive air jet (AAJ) machining is a non-traditional method used to pattern microstructures on a wide range of engineering materials [3,4]. In this process, micro-abrasives are mixed with high-pressure air, and then injected through a small nozzle. The abrasive–air mixture accelerates to a high velocity due to the release of air pressure energy, forming a high-velocity abrasive air jet. When this jet impinges on the target surface, the target material is removed by the high-frequency impact of the abrasives [5,6]. AAJ machining offers distinct advantages, including low cutting forces, minimal thermal effects, low equipment costs, and a high material removal rate [7]. It is particularly suitable for fabricating microstructures on hard and brittle materials, such as quartz crystals [4], silicon [8], and glass [9].
Extensive research has been conducted to investigate material removal mechanisms and processing technologies. The analysis of material removal mechanisms forms the foundation for developing machining performance models, optimizing process parameters, and enhancing machining quality The interaction time between abrasives and target substrate is brief, making it difficult to directly observe the impact process during AAJ machining. Moreover, numerous high-velocity micro-abrasives participate simultaneously in the machining process, complicating the identification and tracking of individual abrasives through direct measurement. Therefore, computer simulation of AAJ machining serves as a superior alternative for analyzing the impact process. Significant efforts have been made in simulating AAJ machining. Qi et al. [10] proposed a discrete element (DE) model to investigate the impact of individual high-velocity micro-abrasive during AAJ machining of quartz crystals. Their findings revealed that shear stress contributes to crack initiation near the abrasive–target contact zone, while tensile stress promotes crack initiation and propagation into the substrate of the target. The number of accumulated cracks increases with an increase in abrasive velocity and impact angle. Furthermore, Qi et al. [11] developed a DE model to study the impact process involving multiple abrasives during AAJ machining of quartz crystals. They found that cracks formed by previous abrasive impacts weaken the target substrate, causing the subsequent impacts to result in increased material removal. Li et al. [3] investigated the dynamic behavior of abrasives in AAJ machining using a coupled computational fluid dynamics–discrete element method (CFD-DEM). Their results demonstrated that the abrasive sphericity significantly affects abrasive velocities, with spherical abrasives achieving higher velocities than non-spherical ones. Zhu et al. [12] investigated jet dynamic characteristics in AAJ micromachining using a semi-resolved CFD-DEM approach. They found that the abrasives continue to accelerate after exiting the nozzle, and that abrasive velocity and concentration are non-uniform across the jet’s cross-section. Nekahi et al. [13] analyzed AAJ machining of alumina particulate reinforced epoxy-matrix composites using a coupled finite element/smoothed particle hydrodynamics (FE/SPH) decomposition method. The erosion rates and material removal mechanisms in AAJ machining with both perpendicular and oblique jet incidence were investigated. It was found that the erosion rate of the composite material is higher than that of neat epoxy. This is attributed to the fracture and chip removal of the unsupported edges of the reinforcements. Kowsari et al. [14] employed computational fluid dynamics (CFD) to predict the AAJ footprint. Their results indicated that incident abrasives primarily influence the formation of the footprint, while rebound abrasives have a secondary effect. Nouhi et al. [15] used CFD to simulate the airflow field and abrasive trajectories in AAJ machining. The abrasive trajectories revealed that rebound abrasives retain sufficient energy to strike the workpiece again. Consequently, the erosion footprint results from the combined action of the first and second strikes of abrasives. Zhang et al. [16] developed a CFD model to simulate the airflow field and abrasive trajectories during AAJ machining of micro-channels on polydimethylsiloxane (PDMS). Their findings showed that rebound abrasives may possess enough kinetic energy to cause material removal on the micro-channel sidewalls.
Many studies have been conducted to investigate simulation methods for modeling the material removal process, jet dynamic characteristics, and abrasive particle trajectories during impact. Under the impact of abrasives, numerous microcracks are generated and propagate within brittle targets. Some microcracks lead to material removal, while others only cause damage to the target substrate. The finite element method, which is based on continuum damage mechanics, struggles to simulate the propagation of numerous microcracks, material removal process, and damage accumulation. In contrast, the DE method can simulate crack initiation and propagation by modeling the material as bonded discrete particles [17,18]. However, studies on damage generation and accumulation in the target substrate under continuous abrasive impacts, the history of material removal, and the formation of micro-channels in hard and brittle materials using the DE method have received little attention.
In this study, a DE model is developed to better understand the material removal process and the formation of micro-channels in AAJ machining. To validate the DE model, two sets of single-factor experiments are conducted. Then this model is used to analyze the history of damage generation and accumulation in the target substrate, material removal process, and the formation of micro-channels. The findings will provide valuable insights into the erosion process during short interaction times.
2. Simulation Model for Micro-Channel Machining
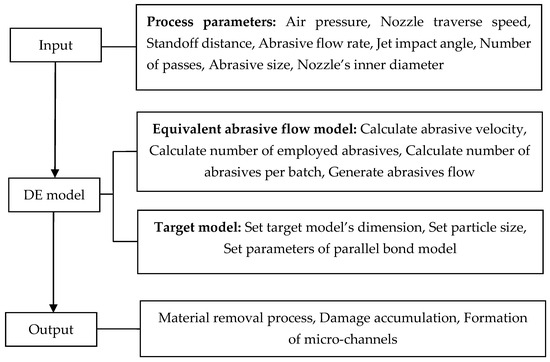
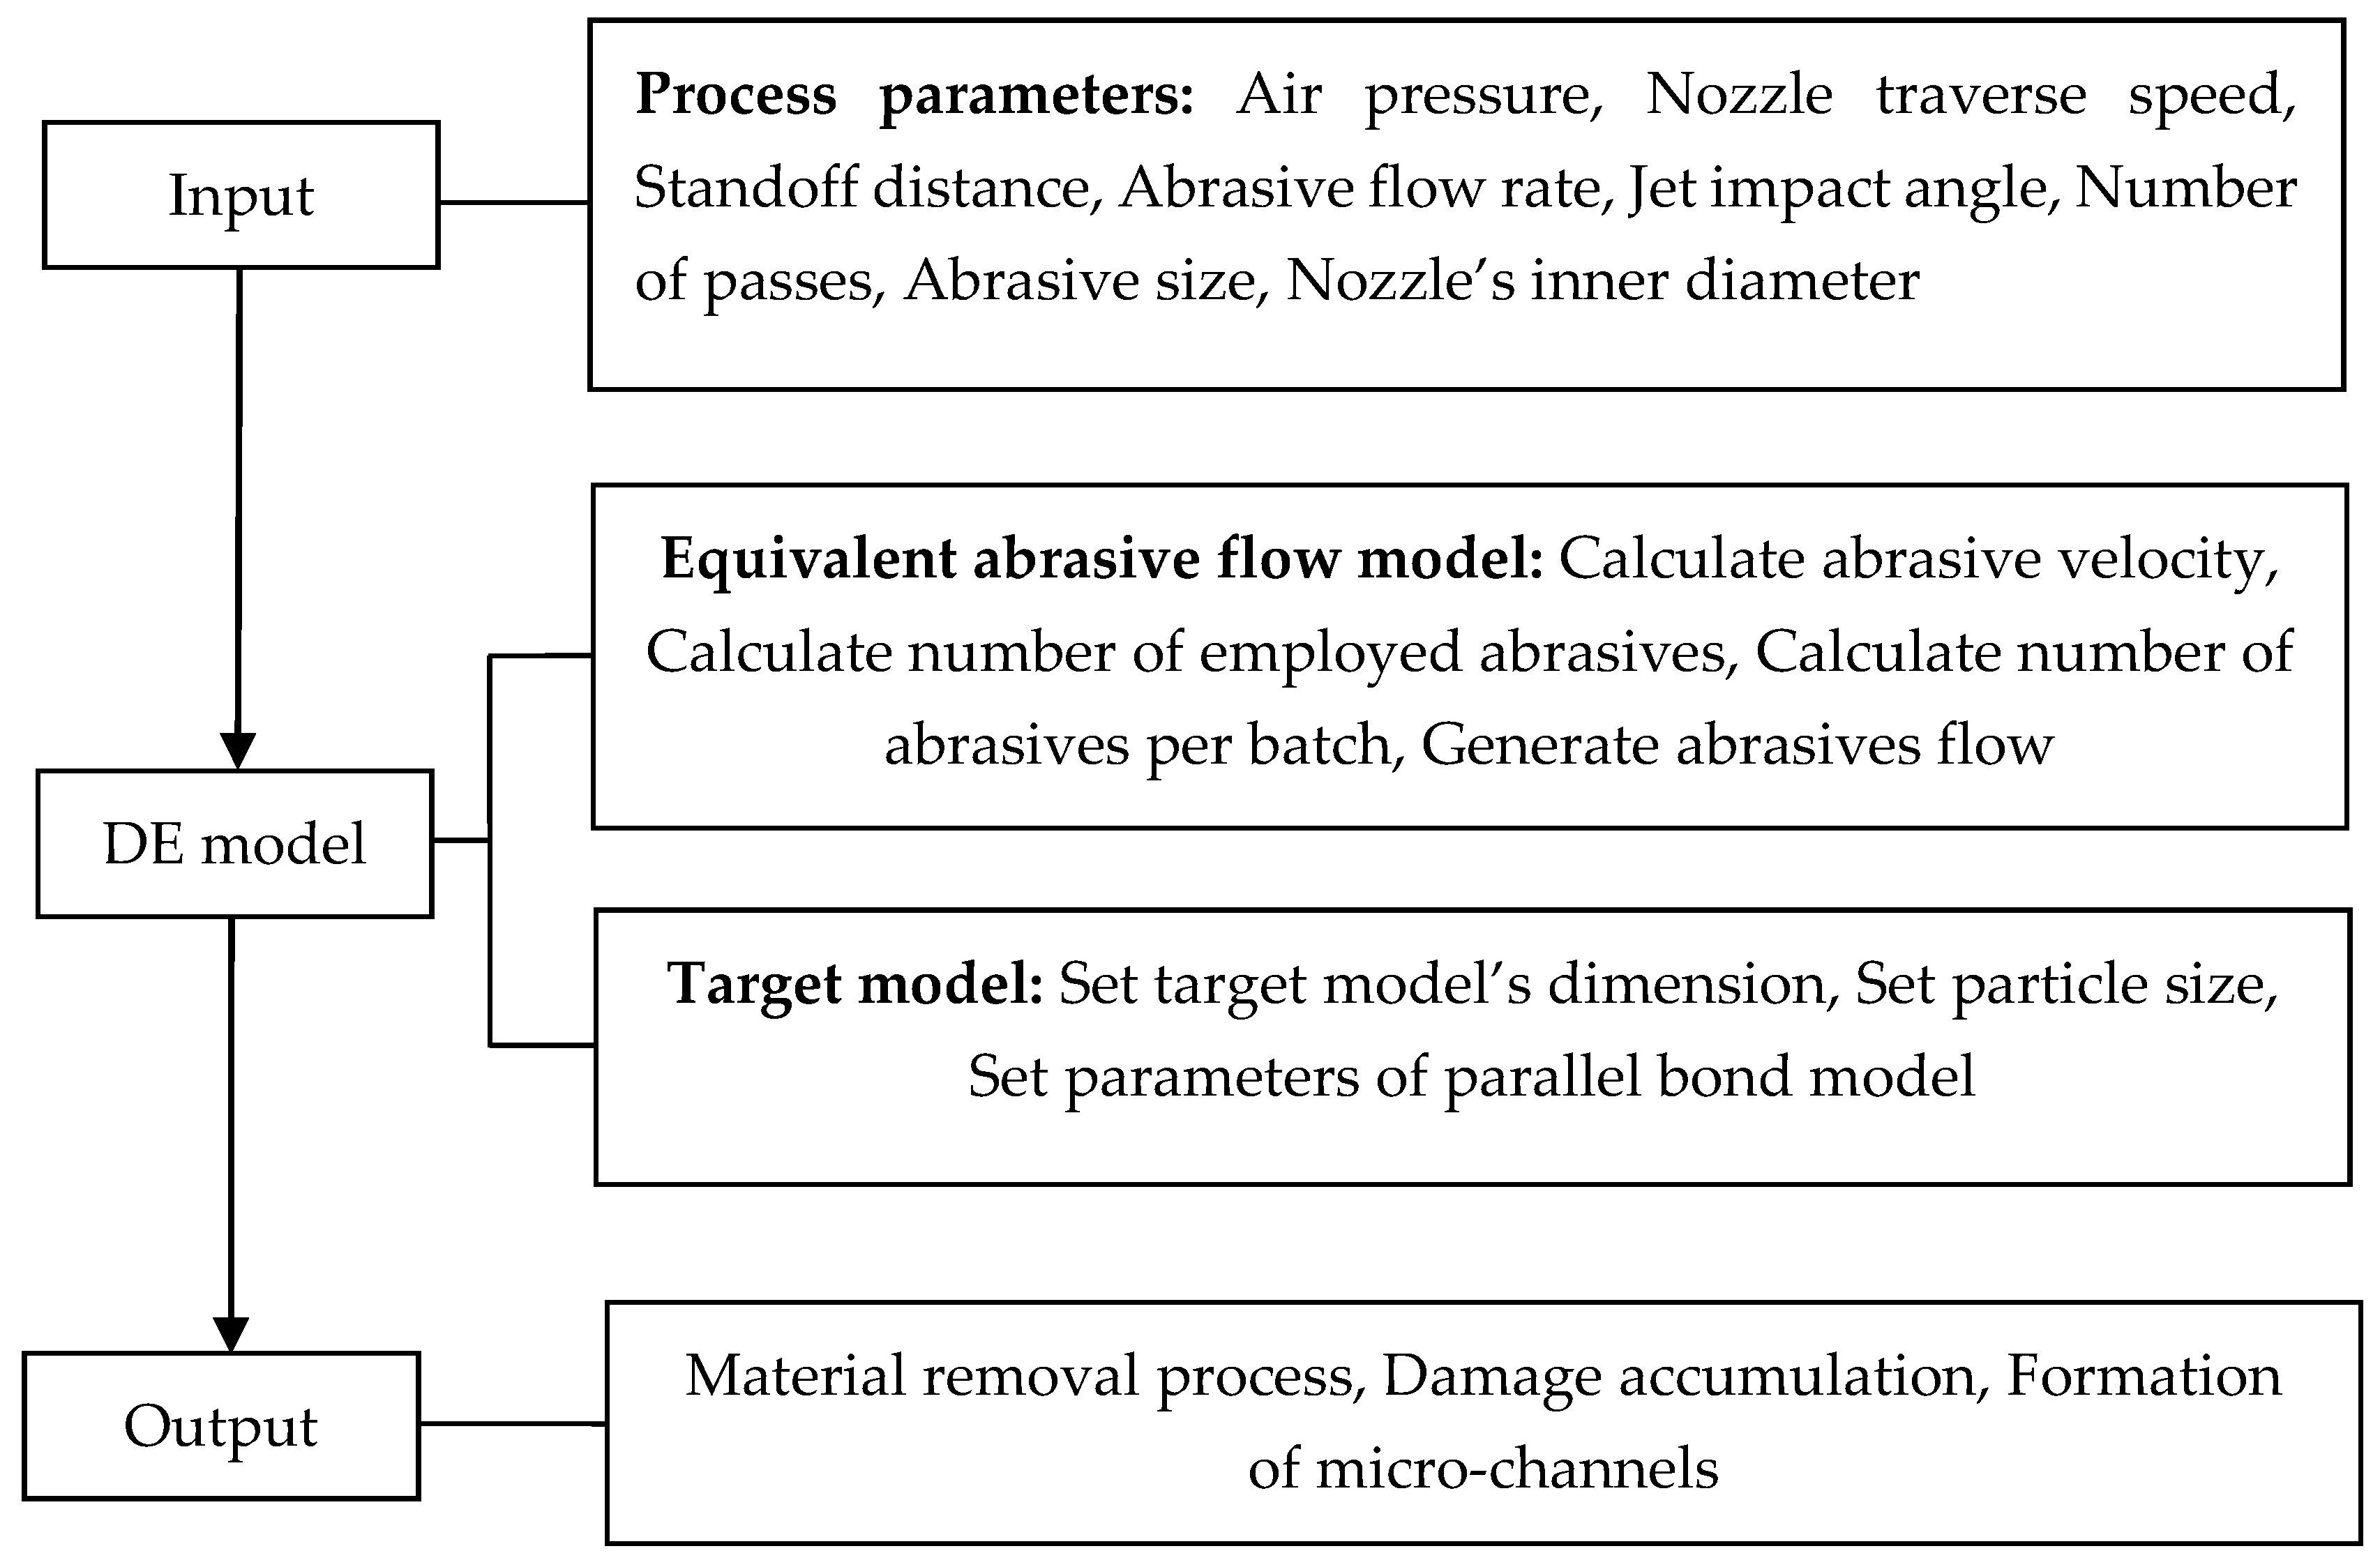
To simulate the complex interactions between abrasives and the target material during AAJ machining of micro-channels, a simulation model consisting of an abrasive flow model and a target model was developed. An equivalent abrasive flow was used to represent the abrasive air jet in reality. The target was simulated using a linear parallel bond model. This simulation model enables the capture of the instantaneous impact process during AAJ machining of micro-channels, providing a basis for analyzing the material removal mechanism and the formation process of micro-channels. The flowchart of DEM simulation is shown in Figure 1.
Figure 1.
Flowchart of DEM simulation.
2.1. Model of Abrasive Flow
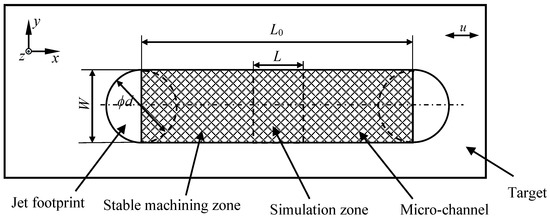
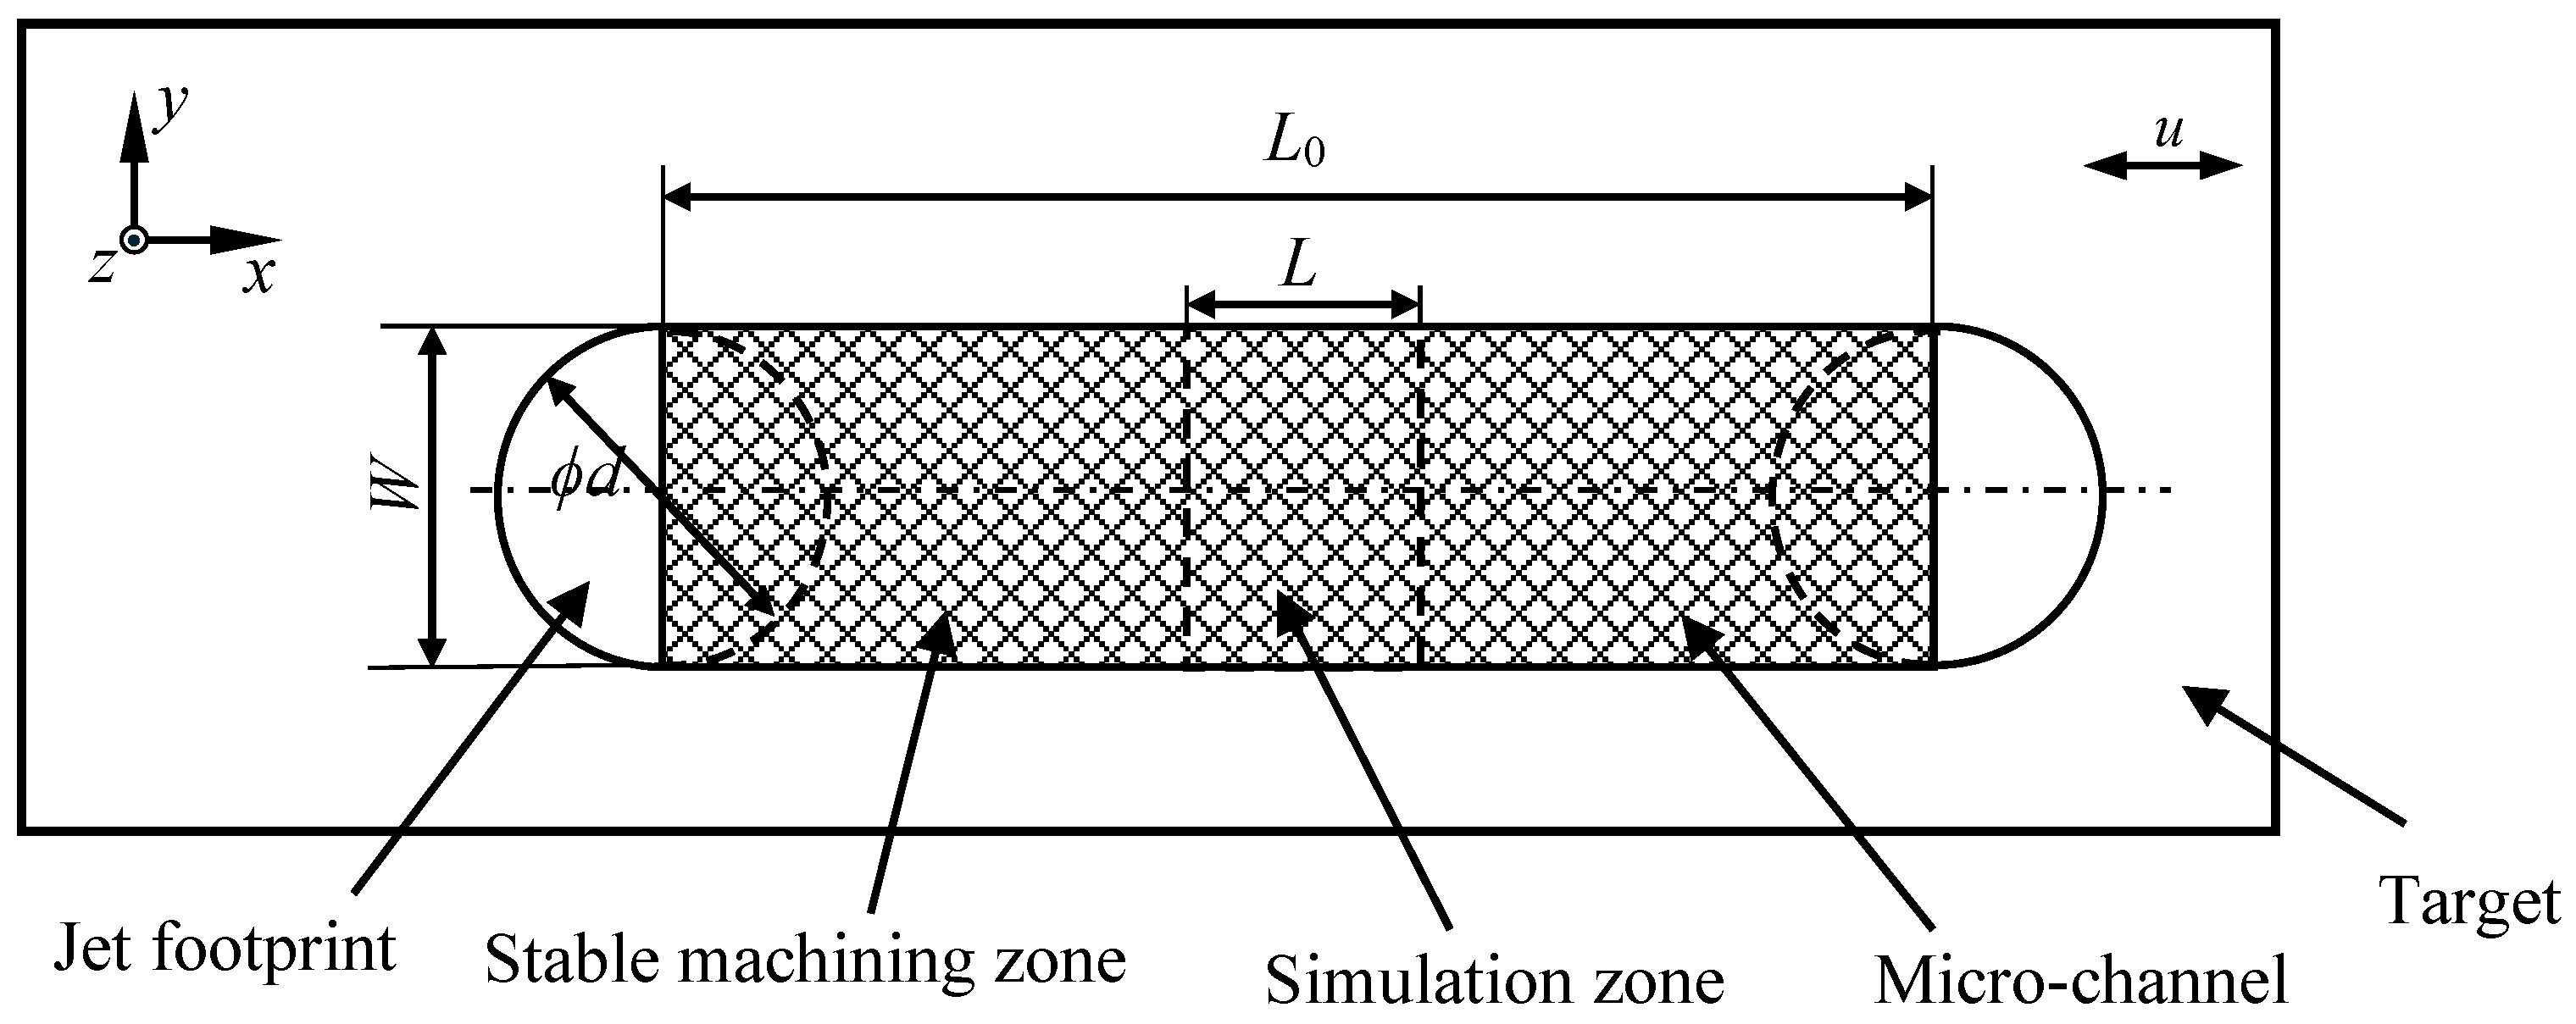
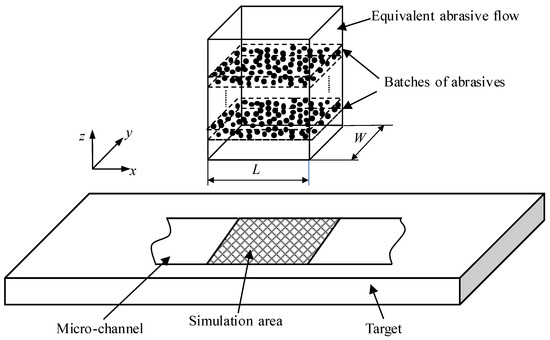
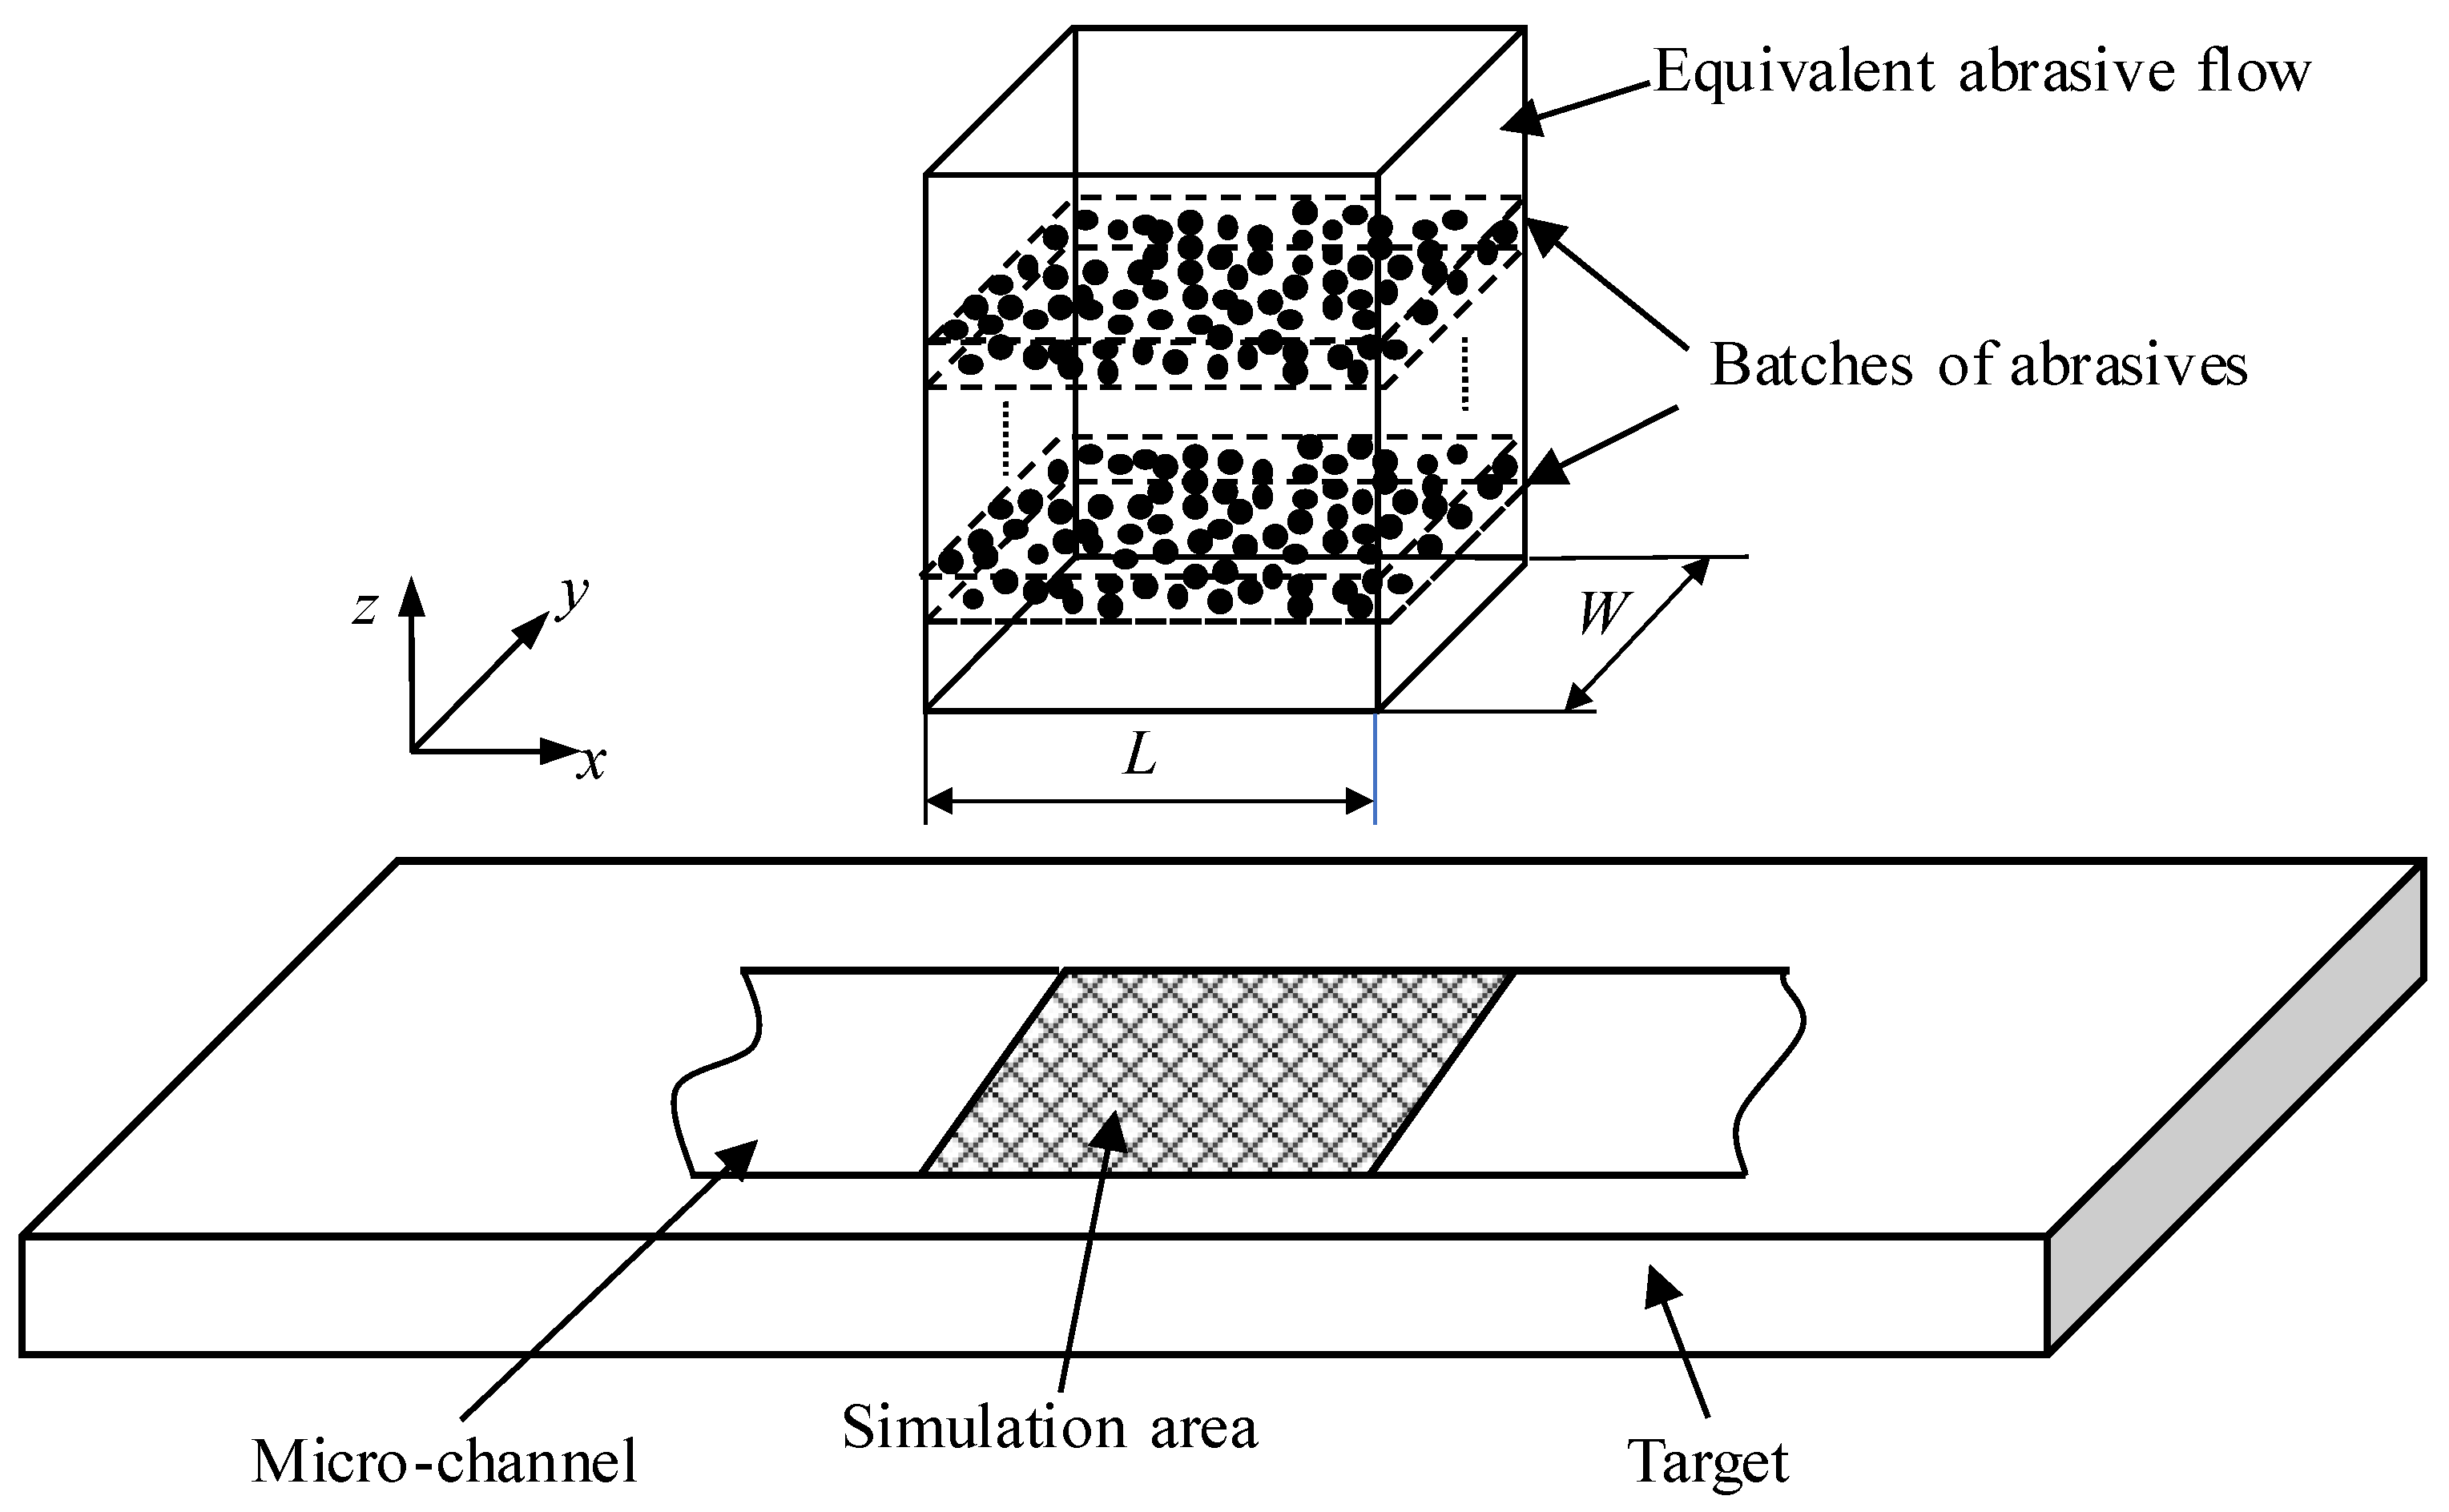
Figure 2 shows a schematic of the AAJ micro-channel machining process. The shaded area represents the stable machining zone of the AAJ. The simulation zone is a portion of this stable machining zone. Corresponding to the simulation zone, it is assumed that the incident abrasives are confined within a cuboid region, as shown in Figure 3. The length and width of the cuboid correspond to the length of the simulation zone (L) and the micro-channel width (W), respectively. The equivalent abrasive flow, defined as the abrasive air jet within the cuboid region, is used for the simulation.
Figure 2.
Schematic diagram of the micro-channel machining process using abrasive air jet.
Figure 3.
Schematic diagram illustrating the batch-by-batch generation of abrasives in simulation.
Abrasives were modeled as rigid spherical particles [10,11] with a diameter of 50 μm, consistent with the average diameter of the abrasives used in the experiment. The density of the abrasive was 3970 kg/m3. The mass of a single abrasive, MS, can be expressed as
where ds is the diameter of the abrasive, and ρ is the density of the abrasive.
For machining a micro-channel of length L, the processing time, T, is related to the nozzle traverse speed, u, and number of passes, C, by
After the processing time, T, the total mass of abrasives used, M, can be expressed as
where ma is the abrasive flow rate.
Hence, during the processing time of T, the number of abrasives used, N, can be expressed as
It can be seen from Equation (4) that the number of employed abrasives is related to the nozzle traverse speed, abrasive flow rate, and machining length.
When AAJ ejects from the nozzle, the jet stream diverges. The divergence angle of the jet, θ, is assumed to be 7–10° [19,20]. Therefore, the diameter of the abrasive air jet footprint, d, is larger than the nozzle’s inner diameter, d0. It can be calculated by
where sd is the standoff distance.
Melentiev et al. [20] reported that the cutting width is 1.1 d0 when the standoff distance is 1 d0, corresponding to the diameter of the jet footprint. Therefore, the diameter of the jet footprint is assumed to be equal to the width of the micro-channel. It should be noted that assuming the cutting width is equal to the jet footprint and that abrasives are generated only within a domain of width W will result in the micro-channel width being insensitive to variations in processing parameters.
The mass of abrasives across the jet’s cross-section is distributed non-uniformly. In the AAJ micro-channel machining, a greater concentration of abrasives impacts on the central area of the channel compared to the channel rim [21]. Considering the cross-section of the equivalent abrasive flow parallel to the y–z plane, the total number and mass distribution of abrasives remain consistent at different x-coordinate values. It is assumed that the mass distribution of abrasives at this cross-section, parallel to the y–z plane, follows a standard normal distribution [22].
An equivalent abrasive flow containing a large number of abrasives results in prolonged computation time during each calculation cycle. To reduce computation time, a practical approach is to generate abrasive particles in batches at fixed time intervals [10,11], as illustrated in Figure 3. Once abrasive particles rebound from the target surface, they are removed from the equivalent abrasive flow model. This reduces the number of abrasives considered during each calculation cycle. The total number of abrasives in the equivalent abrasive flow corresponds to the actual number of abrasives used in micro-channel machining. Collisions between incident abrasive particles are not considered in the simulation [10,11].
The velocities of abrasives at the rim of the jet are approximately 5% lower than those near the centerline of the jet [19]. Therefore, the abrasive velocity distribution across the jet’s cross-section is assumed to be uniform in the simulation. The velocity of abrasive particles is expected to be uniformly distributed in the equivalent abrasive flow.
2.2. Model of Target
Quartz crystal is a typical hard, brittle, and transparent material. It exhibits excellent chemical stability, optical transparency, and biocompatibility. Currently, it is widely used in medical devices, consumer electronics, and aerospace applications. However, it is characterized by high hardness and brittleness. AAJ machining offers advantages, including low cutting forces, negligible thermal effects, and a high material removal rate. It is an effective technique for fabricating micro-channels on quartz crystals. Therefore, quartz crystals were selected as the target material in this study. To simulate the dynamic response of quartz crystals under abrasive impact, a target model composed of microparticles with contact bonds was developed based on the DE method. The model is based on two assumptions: (1) particles are homogeneous, isotropic, and rigid spherical solids; and (2) the effect of the air stream on the target is neglected.
The linear parallel bond model (LPBM) was employed as the contact model. The interaction between particles is established by a finite-sized “cementation”, which is a set of fictitious springs and dashpots [23,24]. Forces and moments can be transmitted between particles through the parallel bond. Using the linear parallel bond model, both the translational and rotational motions of particles can be calculated [23,25]. When the tensile stress between contacted particles exceeds the specified tensile strength threshold, the parallel bond fails, causing the bonded particles to separate. Similarly, when the shear stress between contacted particles exceeds the specified shear strength threshold, the bond also fails. The failure of these bonds represents the formation of microcracks [18]. These microcracks interact and coalesce, leading to the removal of particles, which corresponds to material removal from the target. This method has been proven effective for simulating brittle fracture in hard and brittle materials during AAJ machining, such as quartz crystal [10,11] and glass [22].
In AAJ machining, the material properties significantly affect the impact process. These properties are listed in Table 1. To effectively simulate the macro-mechanical behavior of targets, the micro parameters of LPBM should be selected appropriately. The key modeling parameters are presented in Table 2. Since quartz crystal is anisotropic, its mechanical properties (such as elastic modulus, compressive strength, and fracture toughness) vary with direction. However, in the DE model, the values of tensile strength and shear strength of the parallel bond, the ratio of normal to shear stiffness, and Young’s modulus are assumed to be isotropic. To obtain reasonable mechanical property parameters, the approximate range of micro parameters is first determined based on experience and the reports by Zhu et al. [22] and Qi et al. [10,11]. These parameters are then adjusted according to the results of AAJ micro-channel machining experiments. After repeated adjustment, when the simulation results of the micro-channel closely match the experimental data, the resulting micro parameters are adopted for the target material model.
Table 1.
Material properties of quartz crystals.
Table 2.
Parameters of the linear parallel bond model.
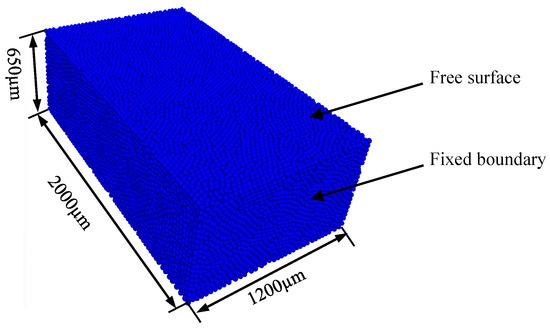
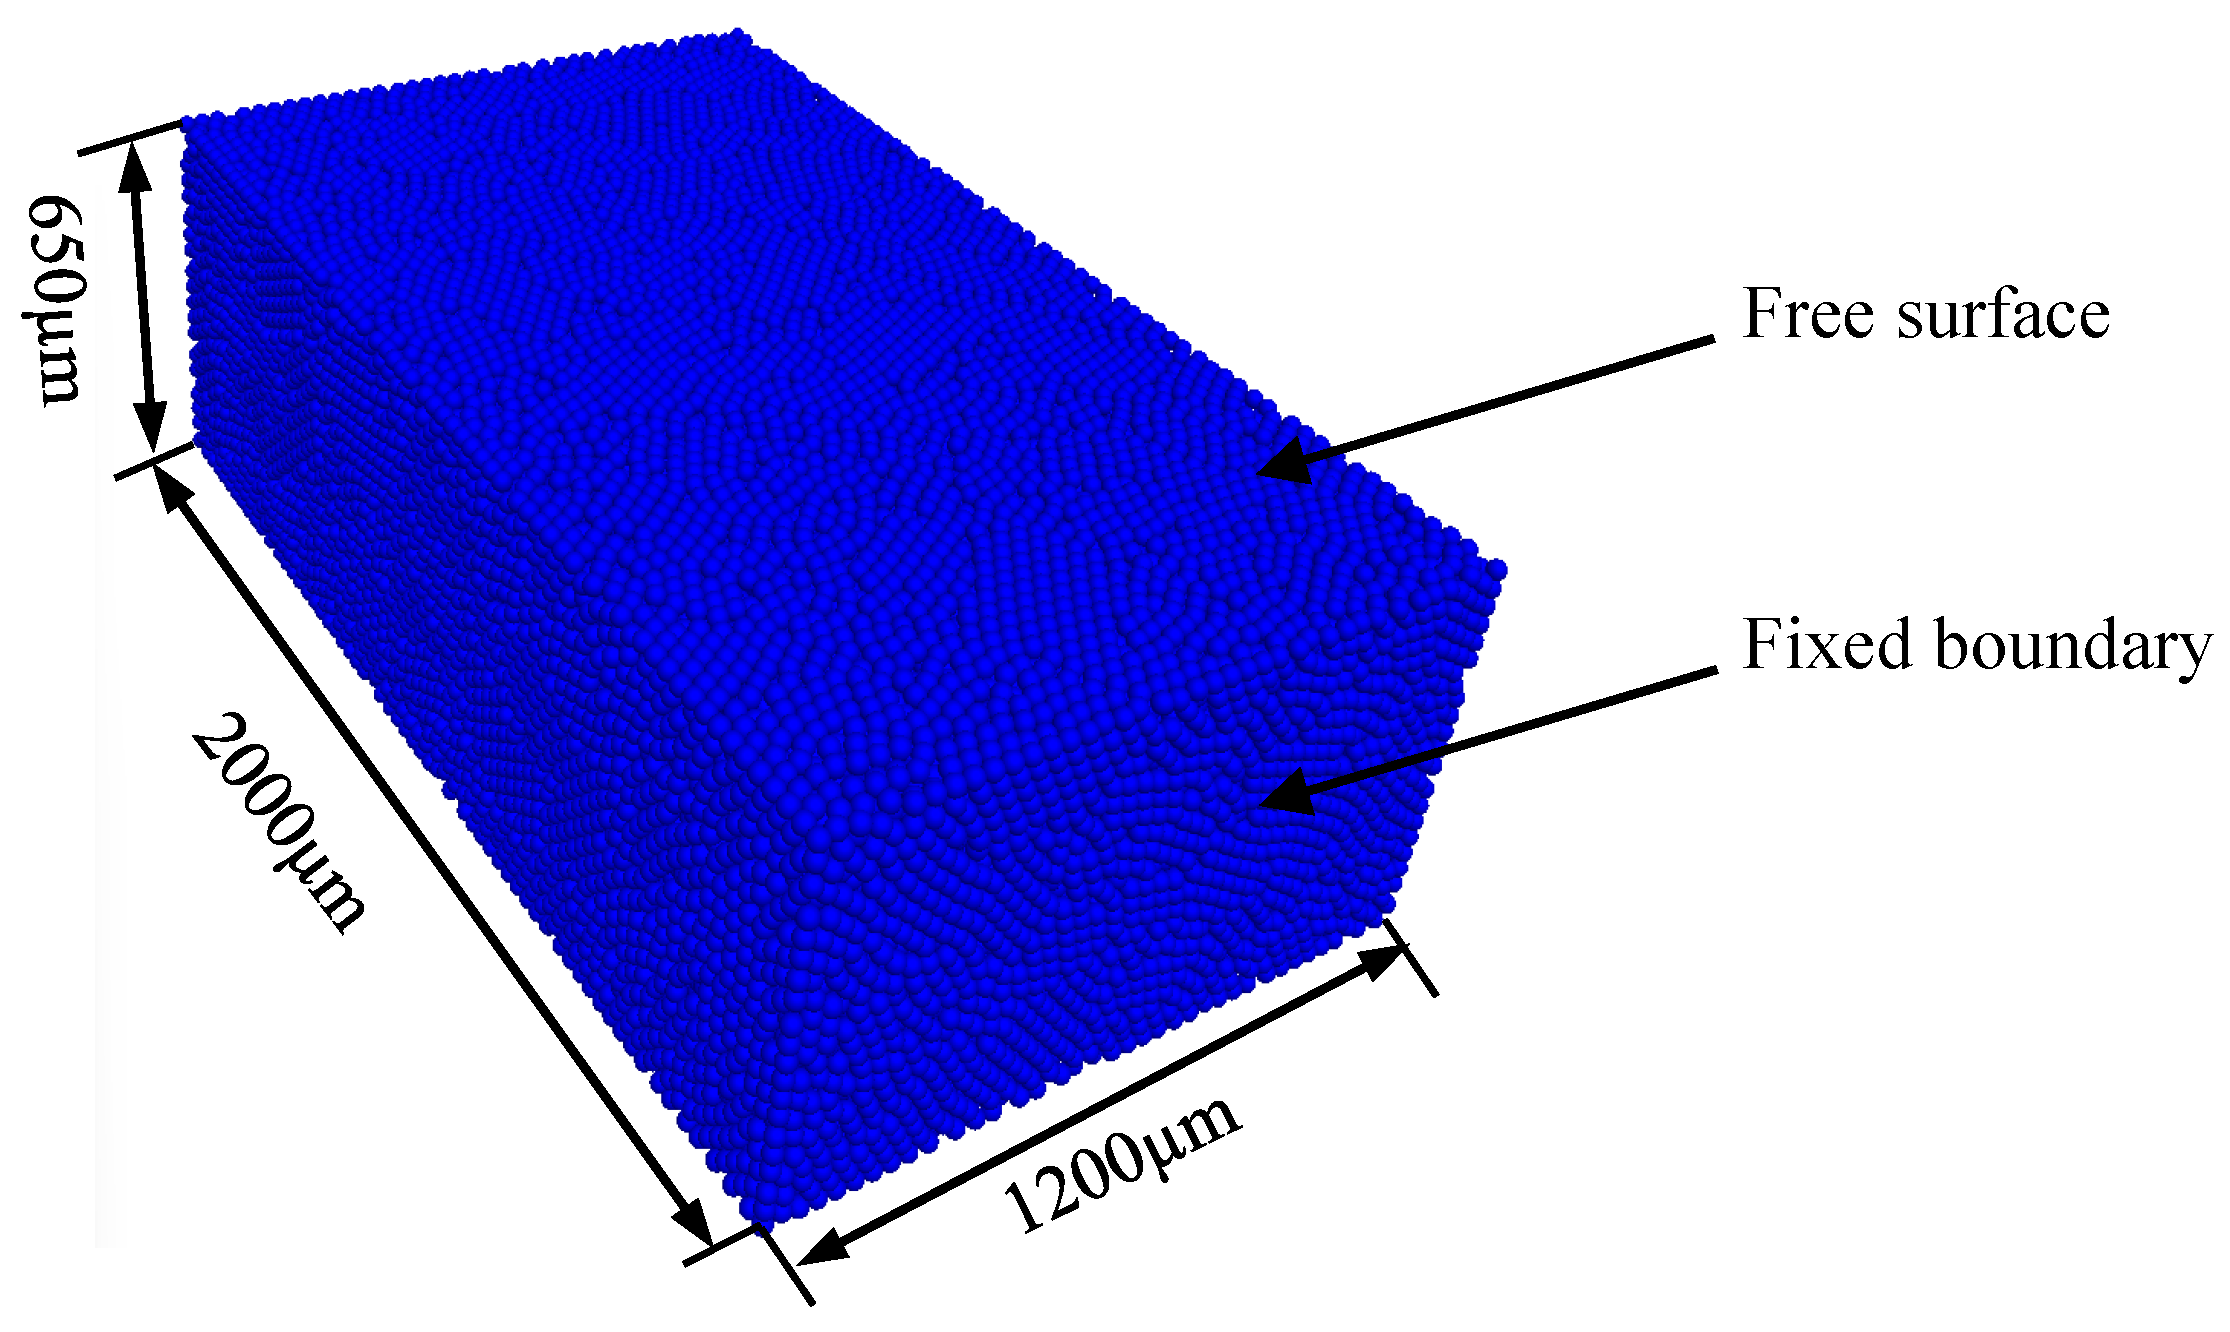
The particles should be small enough to accurately represent the target while being large enough to reduce computational time during simulation. Based on pre-simulation results, the particle size was set to 15 μm. In PFC3D 6.0, the target model consisted of 75,036 particles within a volume measuring 2000 × 1200 × 650 μm3, as shown in Figure 4. Regarding the boundary conditions, the top face of the target model is free, while the other five faces are fixed walls. The coefficient of restitution between the particles and the fixed walls is set to zero, meaning that the particles will stop both translating and rotating upon contact with the fixed walls.
Figure 4.
Simulation model of the target.
3. Model Verification
The micro-channel machining experiments using AAJ were conducted to validate the developed simulation model.
3.1. Experimental Procedure
3.1.1. Experimental Setup
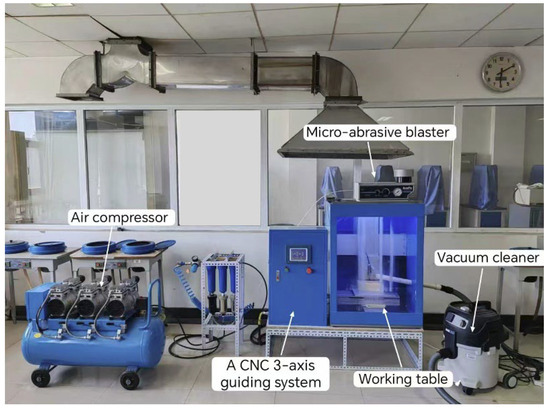
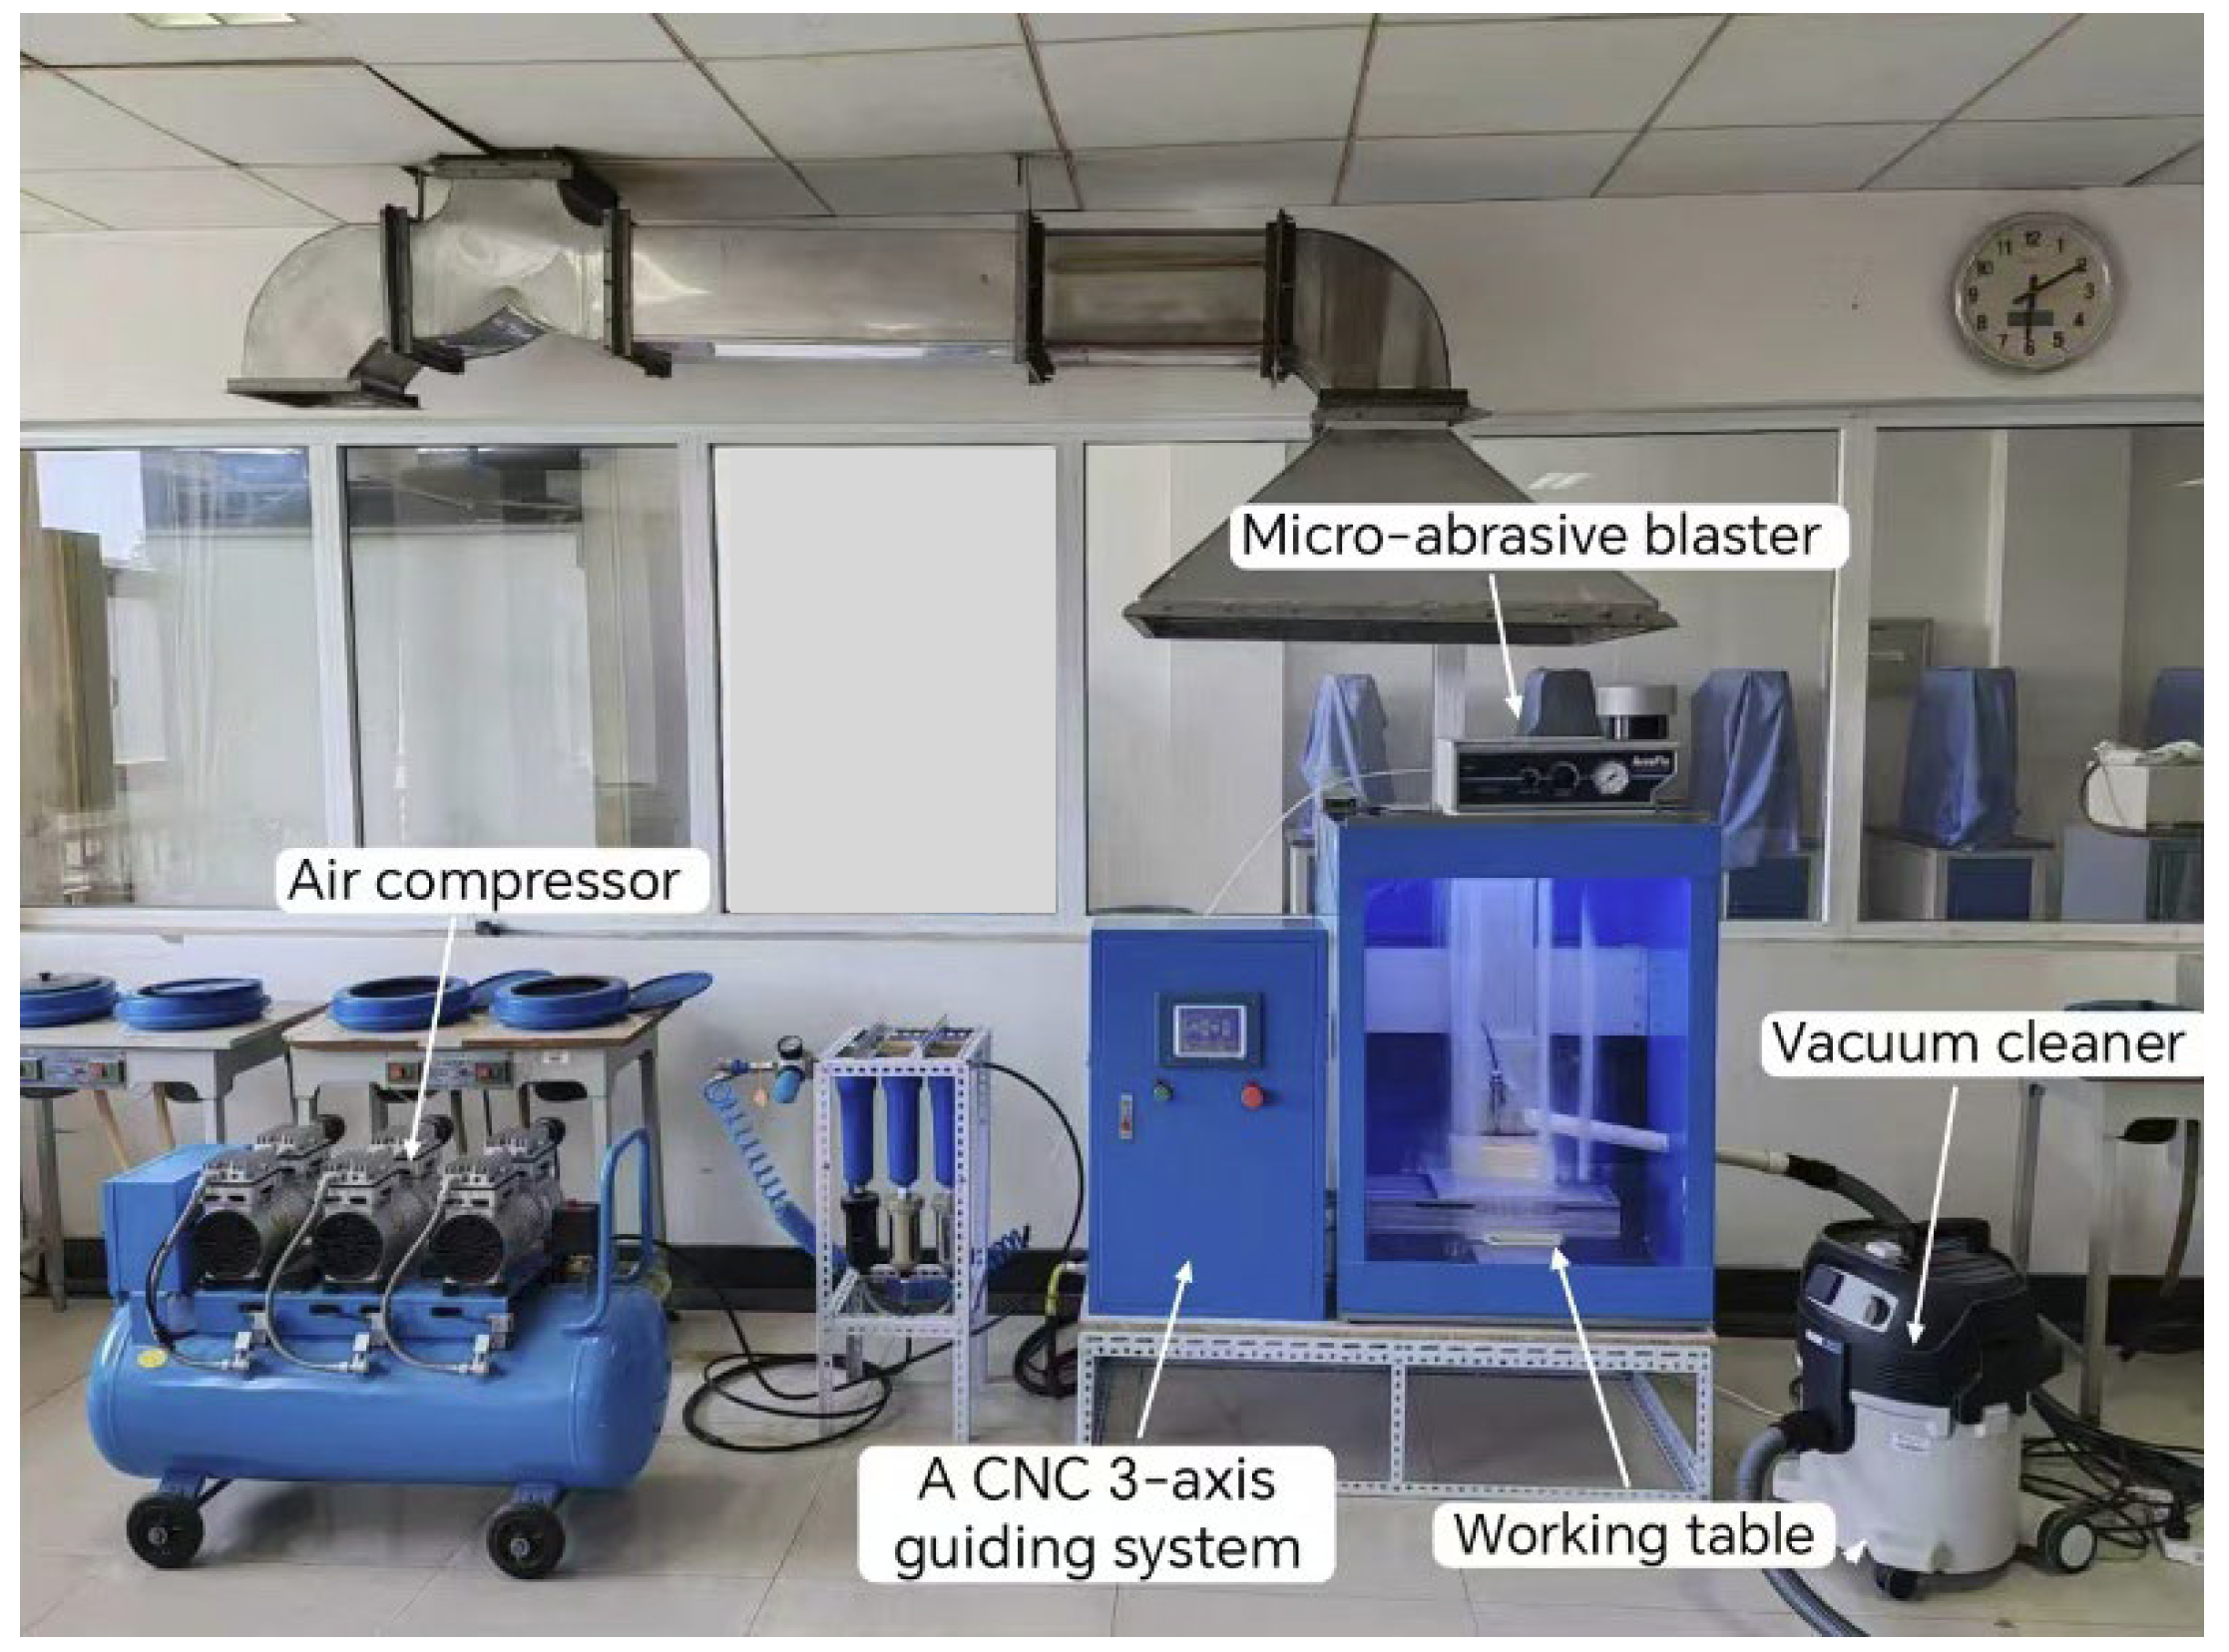
The setup used for AAJ micro-channel machining included an AccuFlo AF10 micro-abrasive blaster (Comco Inc., Burbank, CA, USA), an air compressor (Unical Air Compressor (Beijing) Co., Ltd., Beijing, China), a CNC three-axis guiding system, and a vacuum cleaner, as shown in Figure 5. The air compressor has a rated pressure of 1.0 MPa and provides dehumidified compressed air for the micro-abrasive blaster. The micro-abrasive blaster mixes pressurized air and abrasive, then ejects the mixture through a small nozzle. The operating pressure of the AccuFlo AF10 micro-abrasive blaster ranges from 0.07 to 0.86 MPa. To fabricate micro-channels, the movements of the nozzle and target are controlled by a CNC three-axis guiding system. Processing debris and used abrasive particles are evacuated by a vacuum cleaner.
Figure 5.
Abrasive air jet setup.
3.1.2. Process Parameters
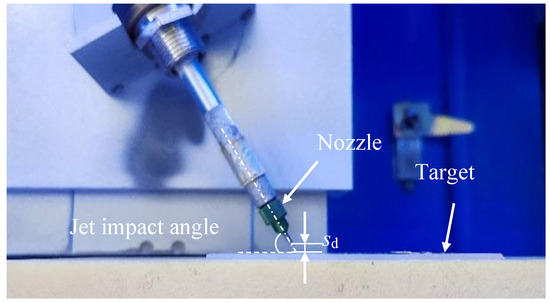
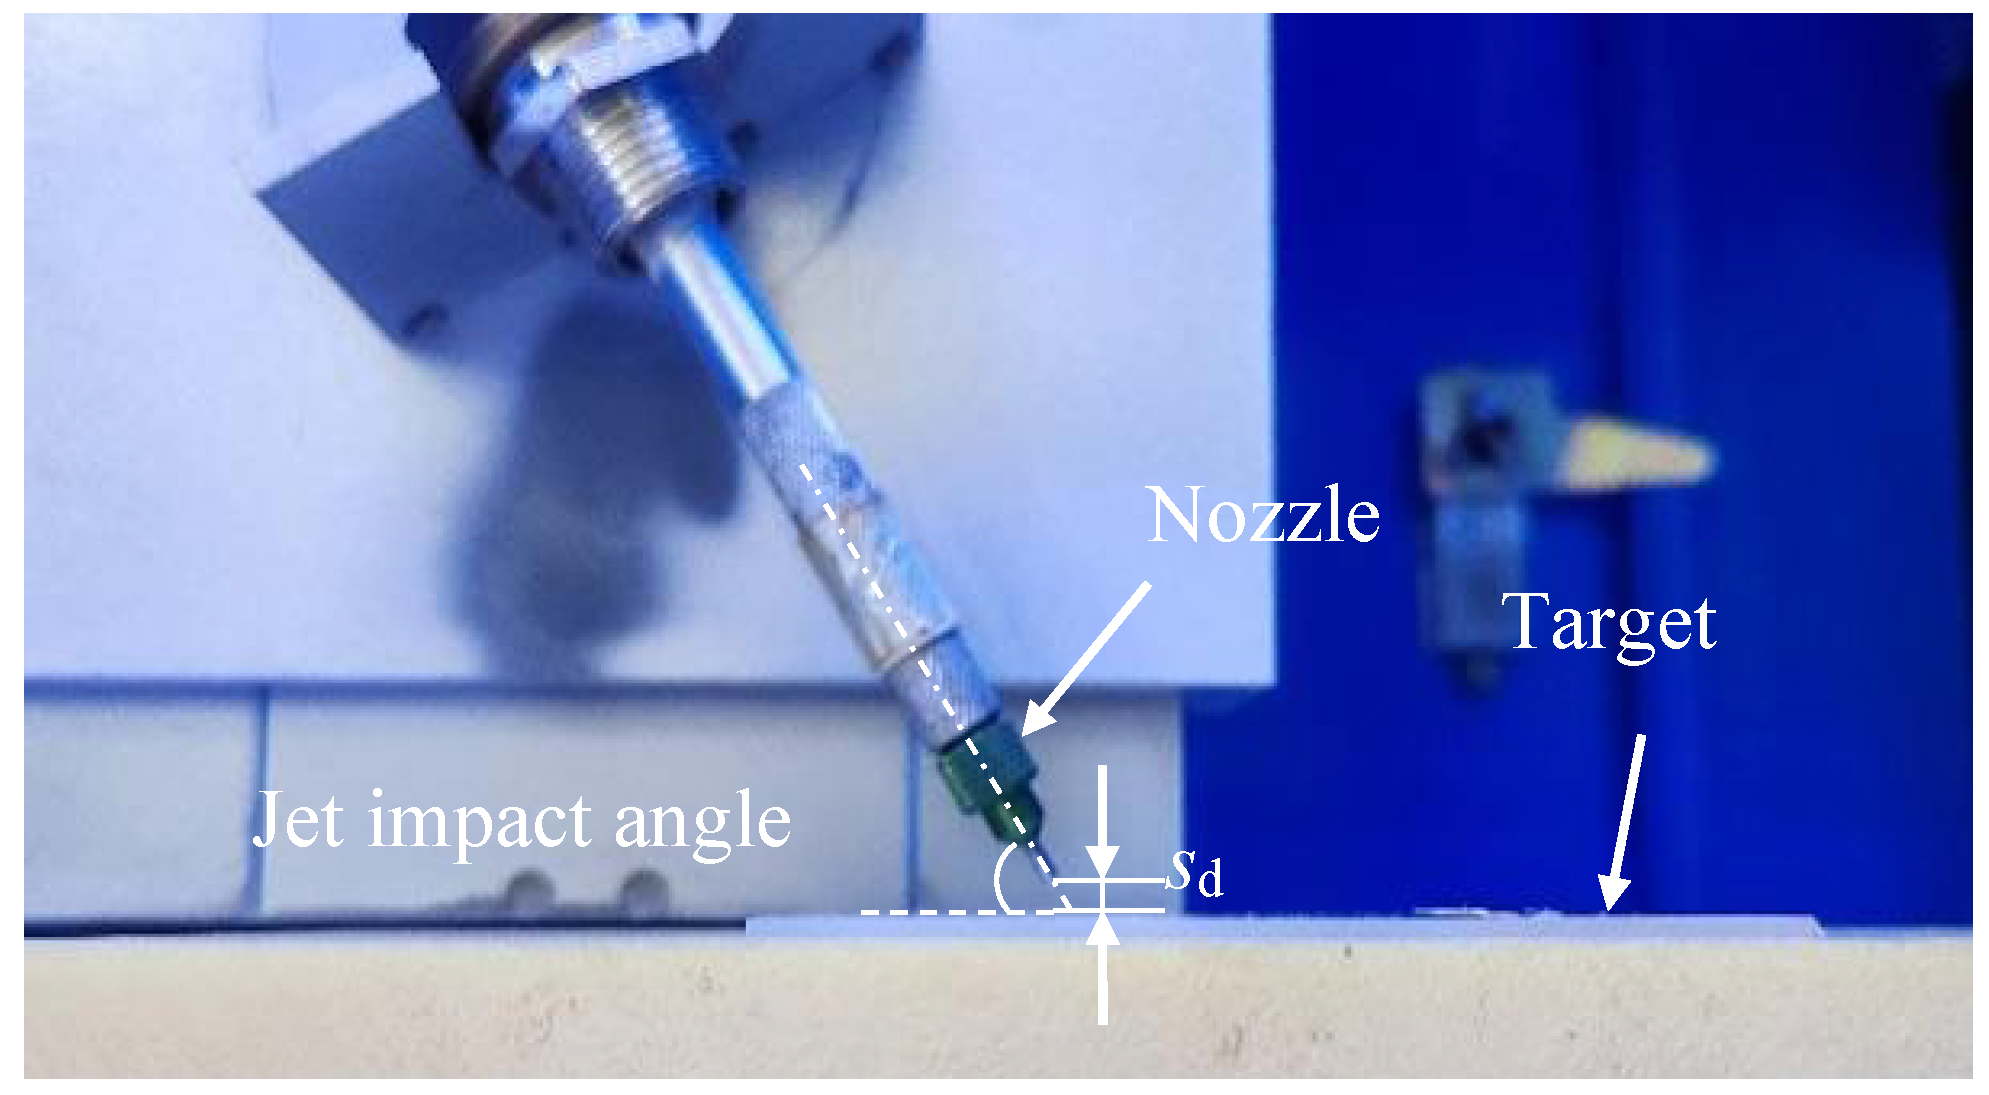
The experiment on micro-channel machining using AAJ is shown in Figure 6. The process parameters used in this study are listed in Table 3. These parameters were selected within the common range of applications and based on the machining capabilities of the equipment. For a jet impact angle of 90°, a single-factor experiment was conducted with air pressures of 0.2, 0.3, 0.4, 0.5, and 0.6 MPa. For an air pressure, P, of 0.4 MPa, a single-factor experiment was conducted with jet impact angles, α, of 30°, 45°, 60°, 75°, and 90°.
Figure 6.
Experiment on micro-channel machining using abrasive air jet.
Table 3.
Process parameters used in the experiment.
Regarding the analysis of the effect of air pressure on micro-channel machining, the air pressure was chosen within the typical range of applications. For brittle materials, when the jet impact angle is 90°, the erosion rate reaches its maximum, resulting in high machining efficiency. Therefore, a jet impact angle of 90° was selected for this study. Regarding the analysis of the effect of jet impact angle on micro-channel machining, the jet impact angle was selected within the commonly used range. The medium air pressure value commonly employed for use is 0.4 MPa. Thus, 0.4 MPa was selected.
Melentiev et al. [26] found that the velocity of abrasive particles increased with an increase in nozzle’s inner diameter. However, the characteristic width of the micro-channel increases with an increase in nozzle’s inner diameter. In this study, a commonly used nozzle with an inner diameter of 0.76 mm [26,27,28] was employed.
Other parameters were selected to ensure that the combinations would not cause through cuts, considering the common range of applications and the machining capabilities of the equipment. This resulted in a total of nine tests. The experiment was repeated three times for each combination of process parameters.
3.1.3. Measurement of Micro-Channels
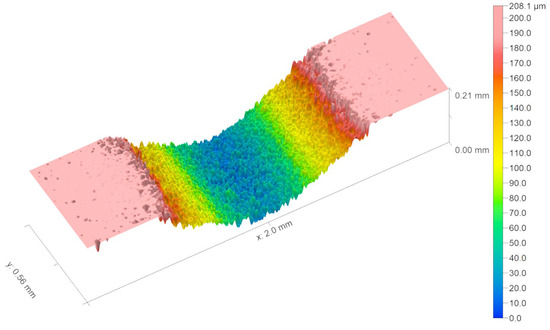
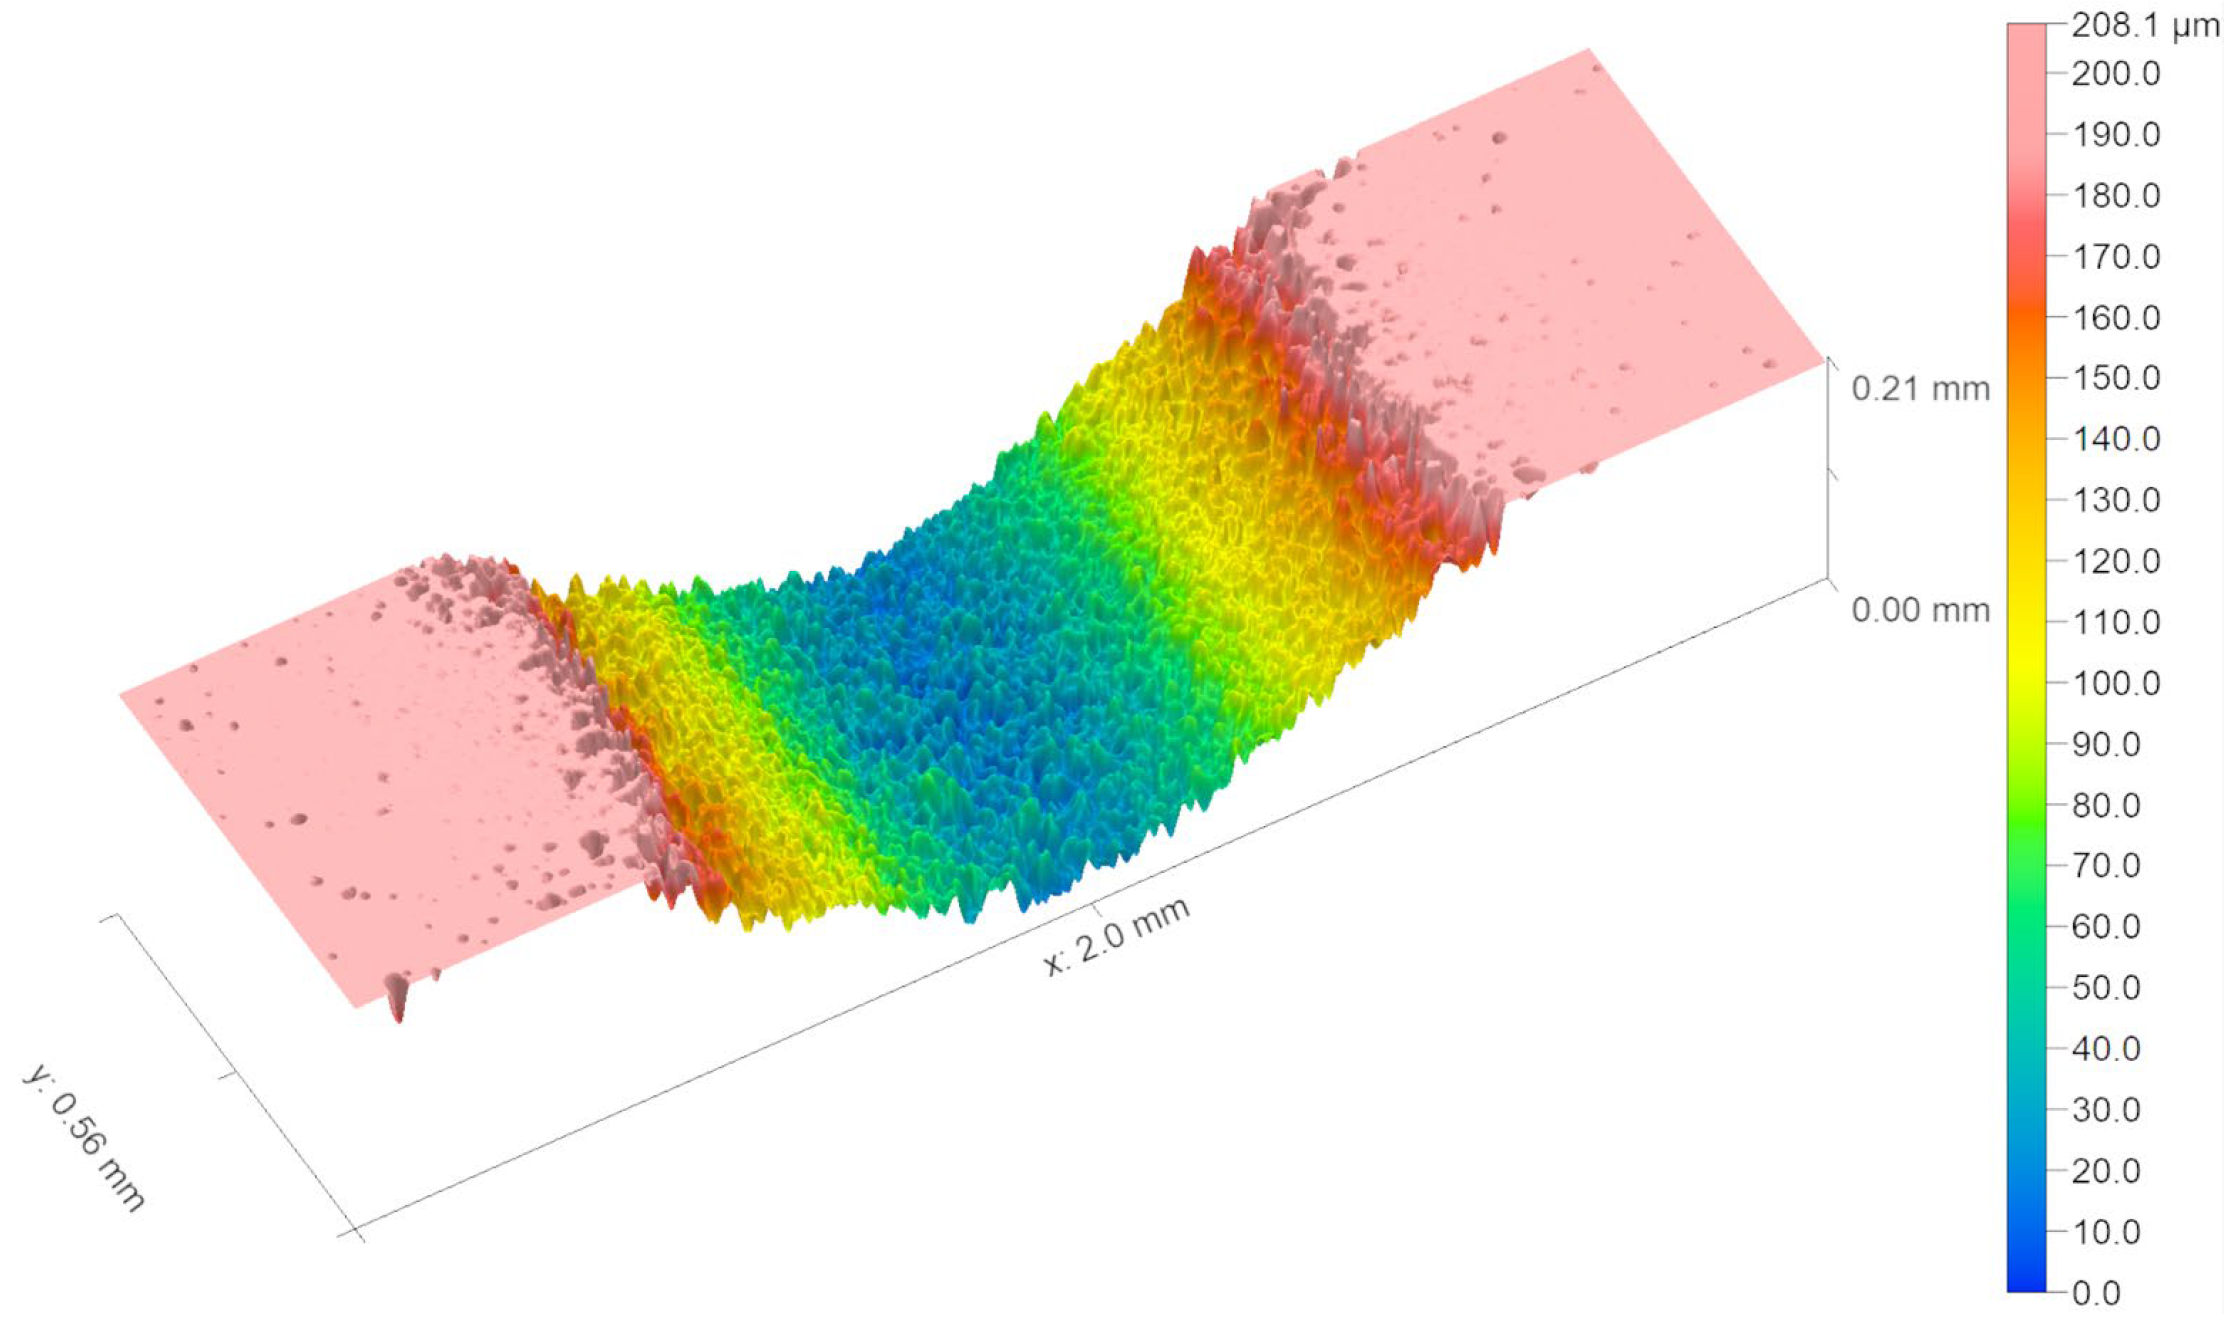
A confocal laser scanning microscope (LSM900, Carl Zeiss SMT GmbH, Oberkochen, Germany) was employed to measure the machined micro-channel. The machining width, depth, and material removal volume were measured. Typical measurement results are shown in Figure 7.
Figure 7.
A typical measured plot of the micro-channel (P = 0.3 MPa, sd = 1 mm, u = 1.5 mm/s, N = 4, α = 90°).
3.2. Model Setup for Micro-Channel Machining
Melentiev et al. [26] indicated that the velocities of abrasive particles are primarily influenced by nozzle’s inner diameter, nozzle length, air pressure, abrasive particle size, and density. According to their regression model [26], the velocities of abrasive particles may range from 104 to 147 m/s under the experimental conditions of this study. Moreover, Stevenson et al. [29] demonstrated that the square of the abrasive particle velocity is proportional to the air pressure. Hence, the velocities of abrasive particles were set at 110, 118, 126, 133, and 140 m/s, corresponding to air pressure of 0.2, 0.3, 0.4, 0.5, and 0.6 MPa, respectively.
In this study, the simulated machining length was set to 1.6 mm. According to Equation (2), the machining time was 4.3 s, with a nozzle traverse speed of 1.5 mm/s and four passes. According to Equation (4), the total number of abrasives used was approximately 98,588 based on an abrasive flow rate of 6 mg/s. Therefore, the total number of abrasives generated in the simulation was set to 98,000. The abrasives were divided into 500 batches, with 196 abrasives in each batch. The fixed time interval for generating abrasive particles was 8.6 × 10⁻³ s. To achieve an acceptable computational efficiency, a shorter simulated physical time and a higher simulated abrasive flow rate were used to replace the experimental machining time and abrasive flow rate [22]. The simulated physical time was set to 6 × 10⁻⁴ s, and the simulated abrasive flow rate was 4.3 × 10⁴ mg/s. The number of abrasives used in simulation matched that of the experiment. Since collisions and rebounds between abrasive particles were not considered in the simulation, variations in abrasive flow rate had a negligible effect on the simulation model. The fixed time interval generating abrasive particles in the simulation was 1.2 × 10⁻⁶ s. For the lowest abrasive particle velocity of 110 m/s in this study, the distance between two adjacent batches was 132 µm. There was no interference between two adjacent batches for abrasives with a diameter of 50 µm.
According to Equation (5), the jet diameter of the jet footprint ranged from 0.88 to 0.93 mm at a standoff distance of 1 mm. The width of the equivalent abrasive flow was set to 0.9 mm. Therefore, the generated abrasive particles occupied a domain with a length (L) of 1.6 mm, a width (W) of 0.9 mm, and a height of 0.05 mm, as illustrated in Figure 3. The domain is located 0.9 mm above the target surface. The abrasive particles were generated within the same domain for each batch.
3.3. Verification of the Simulation Model
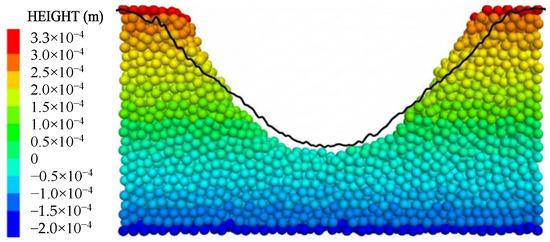
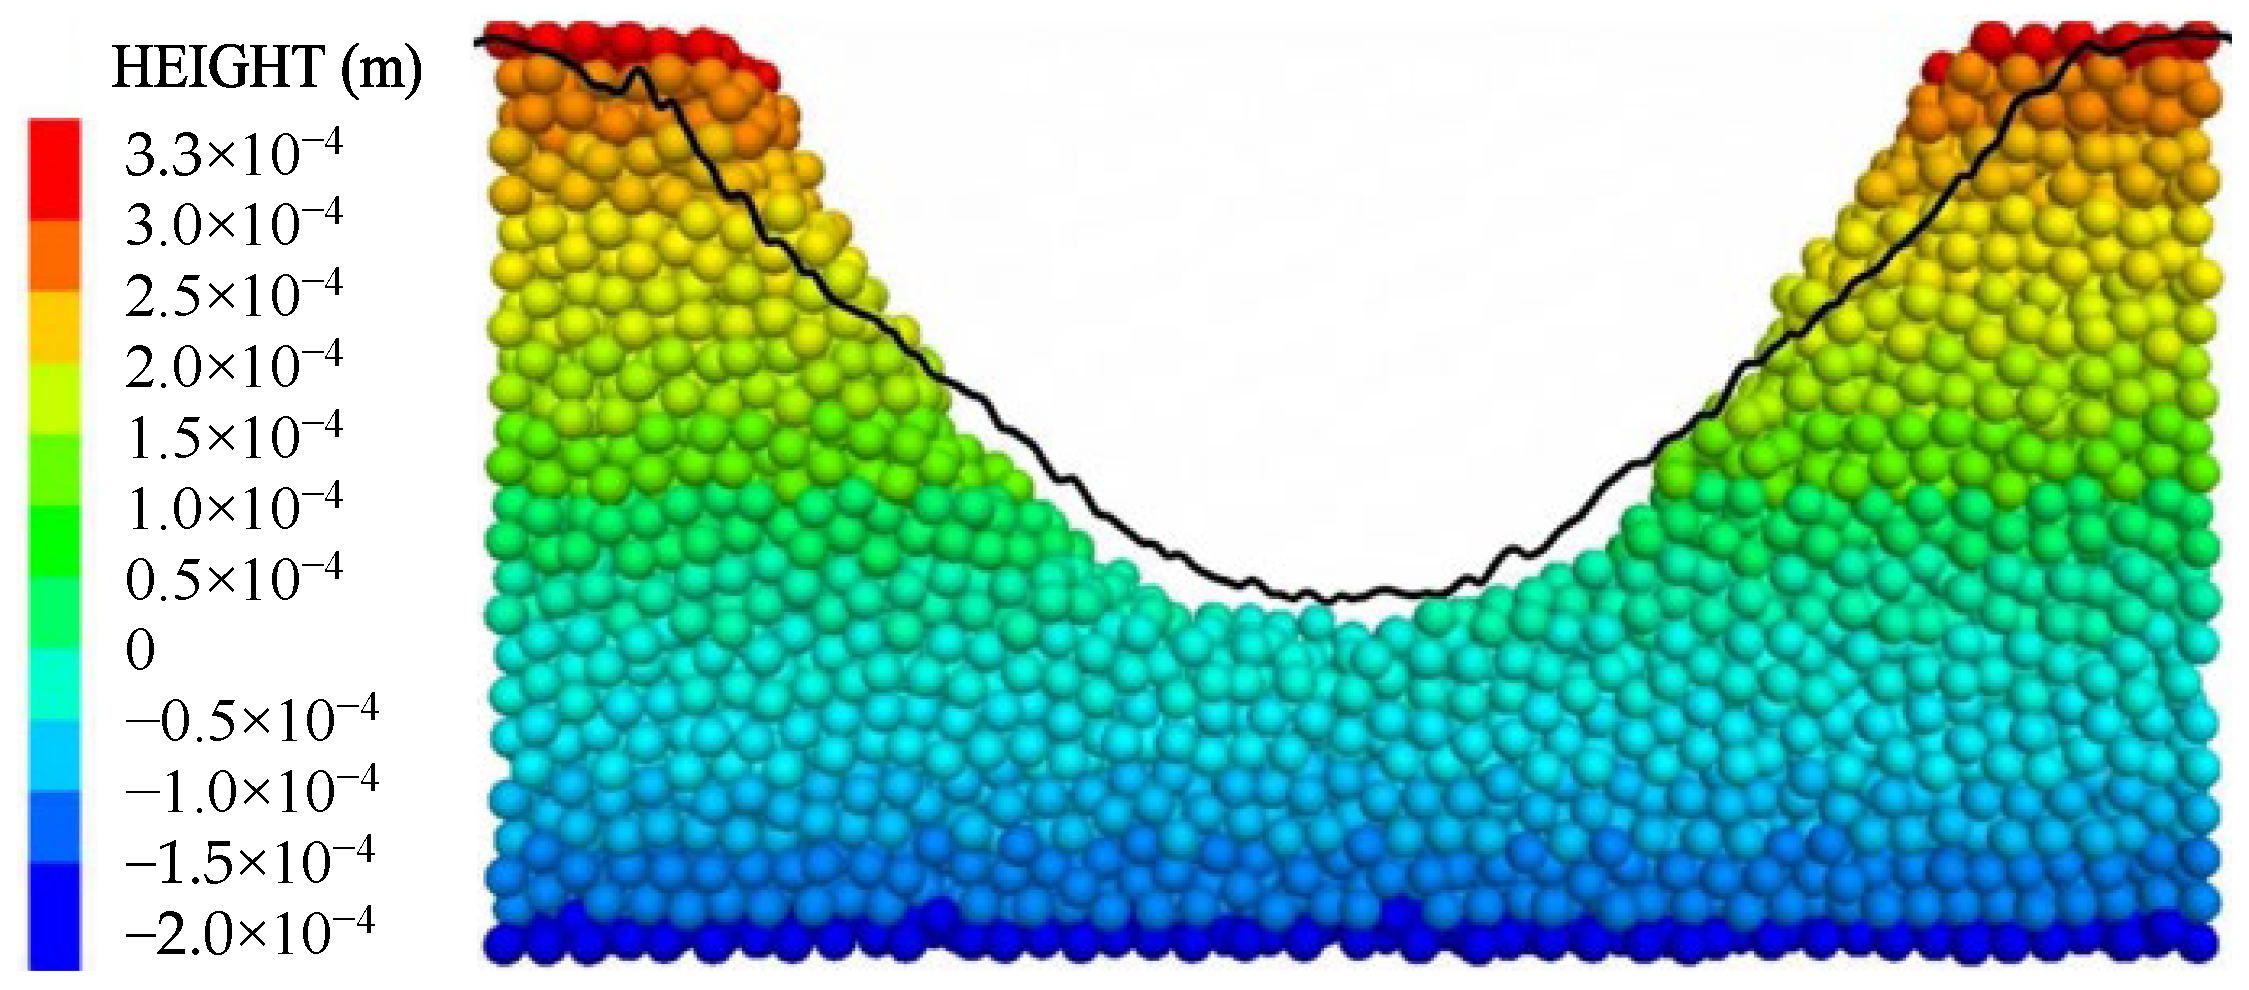
A typical cross-sectional profile of a micro-channel, simulated using the developed DE model, is shown in Figure 8. The simulated cross-sectional profile exhibits an inverted bell shape, featuring two inclined sidewalls and a bowl-shaped bottom. A comparison between the simulation and corresponding experimental results indicates that the simulated profile agrees well with the experimental data from a qualitative perspective.
Figure 8.
Comparison of simulation results and experimental data (P = 0.6 MPa, sd = 1 mm, u = 1.5 mm/s, N = 4, α = 90°, black line represents the experimental cross-sectional profile).
Erosion rate is an important indicator in industrial applications [26]. It is defined as the ratio of the weight of material removed to the weight of abrasives used. For experimental data, the erosion rate, Eexp, can be expressed as
where A is the cross-sectional area of the micro-channel, and ρt is the density of the target.
For the simulation results, the erosion rate, Esim, can be calculated by
where Nt is the number of removed target particles.
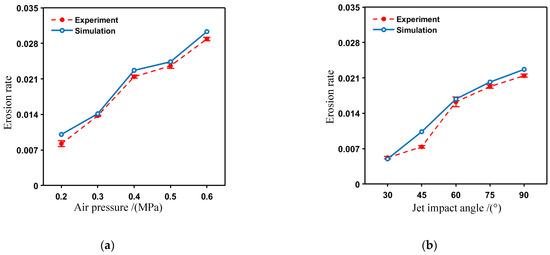
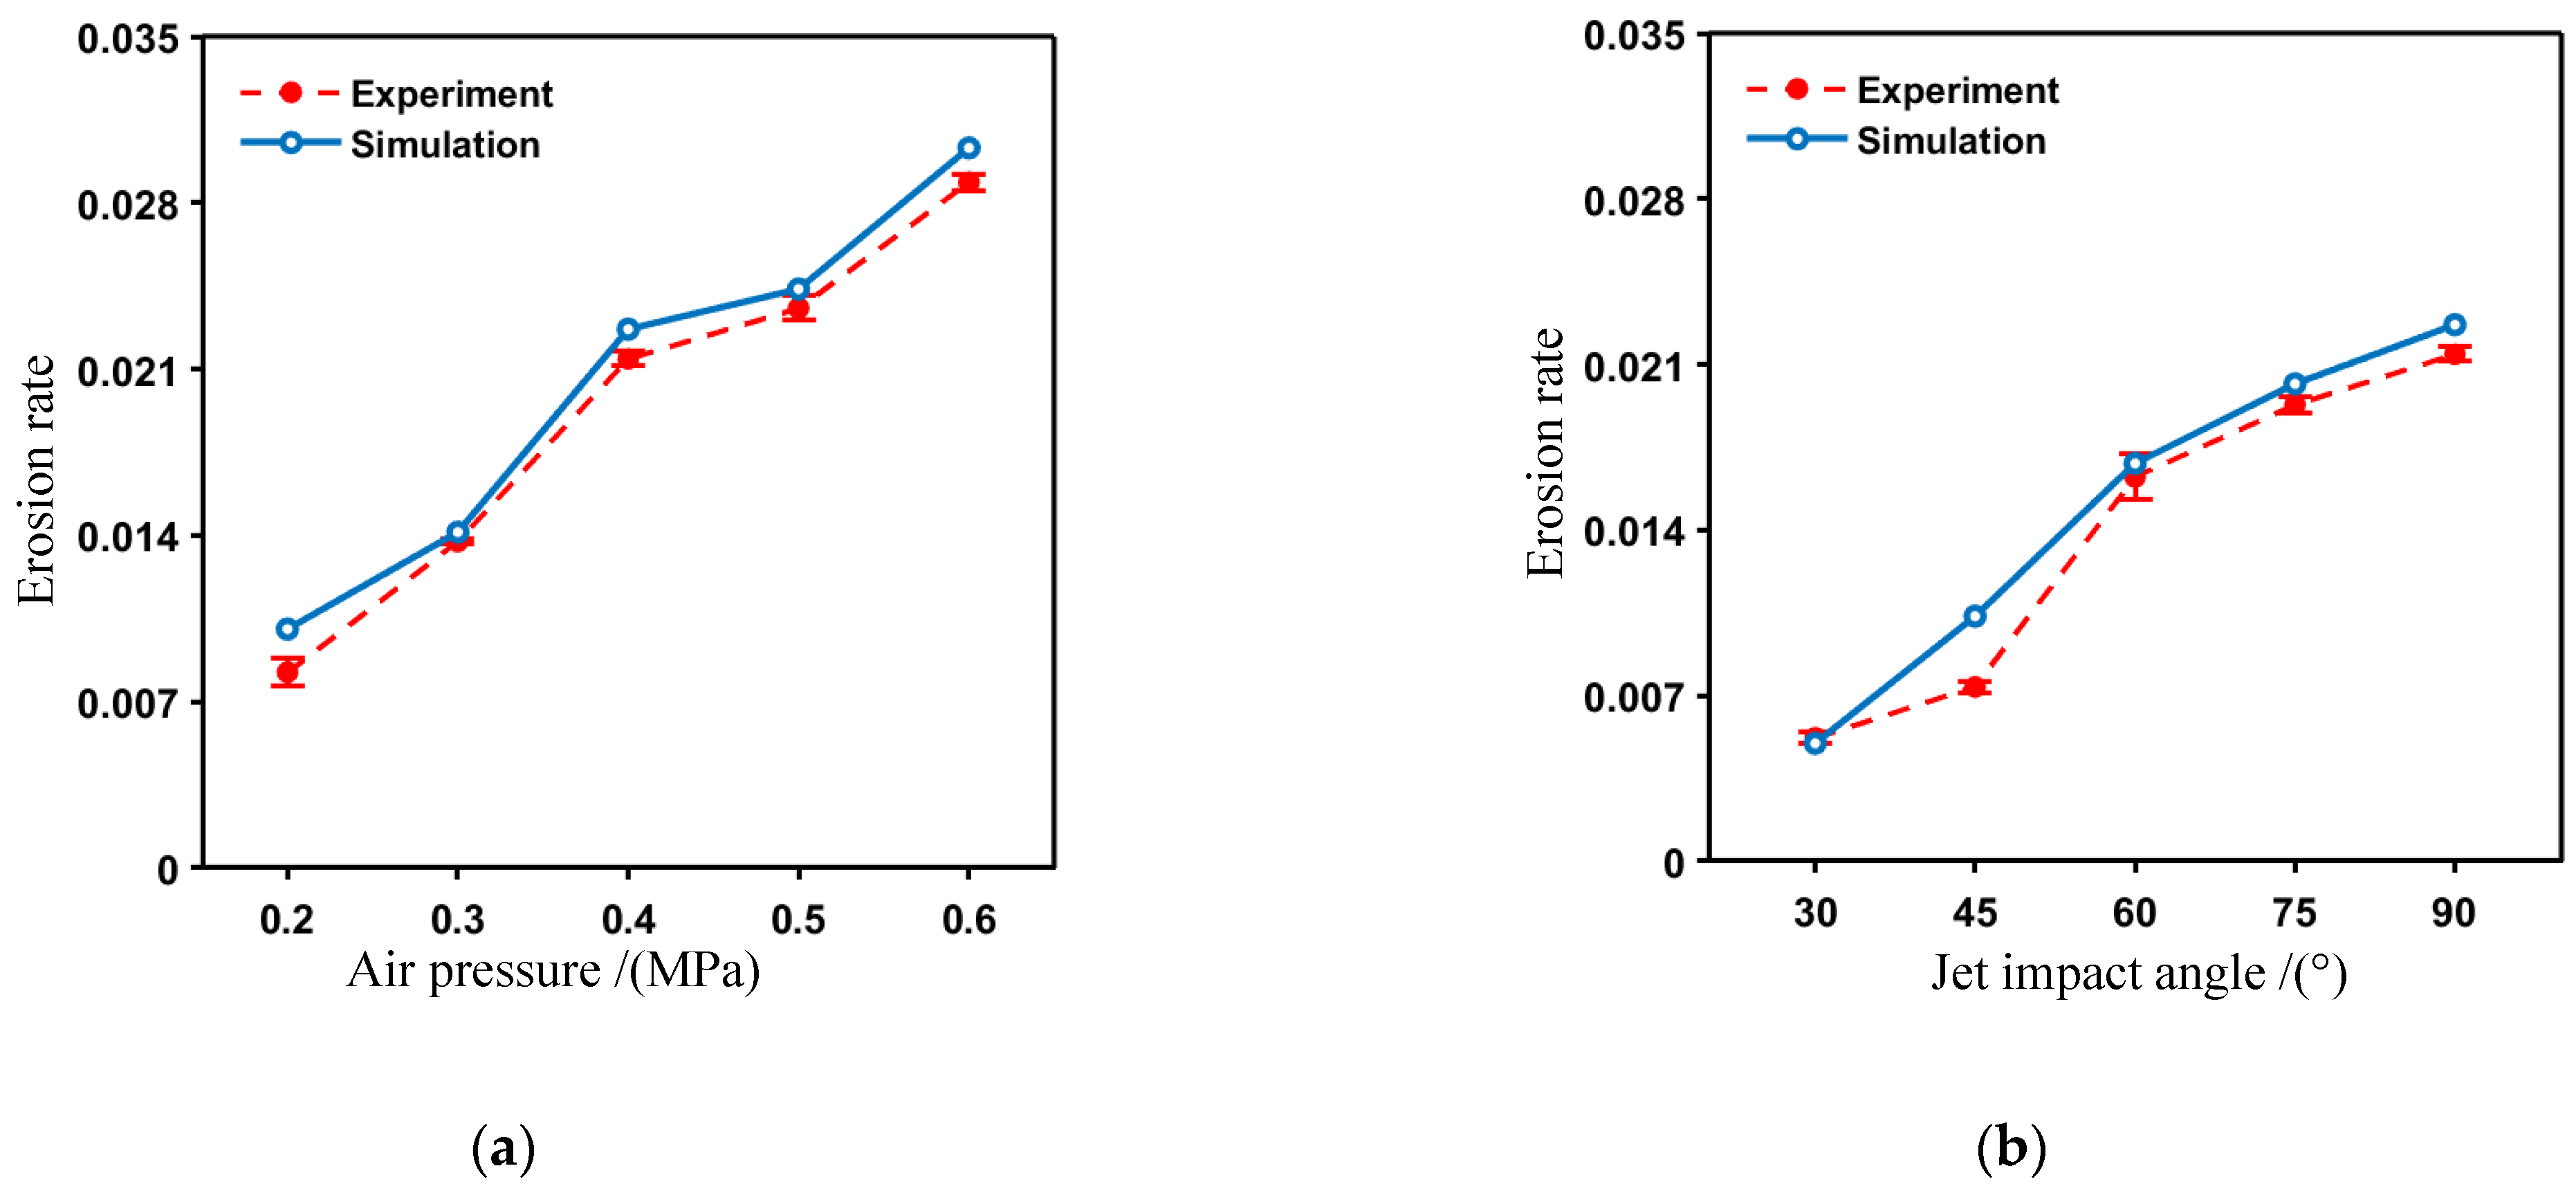
The erosion rates obtained from simulation and experimental results were compared and are presented in Figure 9. Figure 9a shows that the simulated erosion rate increases with an increase in air pressure. The trend of the simulated erosion rate versus air pressure aligns with the experimental results. However, the simulated erosion rates are higher than the experimental values. The percentage deviation of the simulated erosion rate results from the corresponding experimental data is 7.83% on average, with a standard deviation of 7.18%. This discrepancy is attributed to three factors. Firstly, during AAJ machining in practice, incoming abrasives may collide with other incoming or rebounding abrasives, resulting in some abrasives contributing little or nothing to material removal. It is known as “flux effect” [30]. The flux effect will prevent the impact of incoming abrasives and thus decreases the erosion rate. Andrews et al. [31] developed a frequency model describing collisions between incoming abrasives and rebounding abrasives as a function of abrasive flux. However, the influence of abrasive flux on the erosion rate has not been thoroughly investigated. In’t Veld et al. [30] derived an erosion rate model based on abrasive flux, but this model assumes that abrasive rebound occurs on a flat target surface. Currently, no model exists to analyze the effect of abrasive flux on erosion rate during micro-channel machining. Wang et al. [4] found that the effect of abrasive flux on the depth and width of the micro-channel is not expected to be significant. To balance computational efficiency and accuracy, the flux effect was neglected in the simulation. Hence, the impact effect of abrasives is overestimated. Secondly, debris from the target and some used abrasives may accumulate at the bottom of the micro-channel, leading to a “shielding effect” [21]. The shielding effect prevents the impact of incoming abrasives and decreases the erosion rate. Kowsari et al. [14] found that the stagnation zone and lateral airflow during AAJ machining influenced the rebound of incident abrasives. Shafagh et al. [21] analyzed the shielding effect of mask openings on the depth of micro-channels. Melentiev et al. [20] reported that the effect of the stagnation zone on cutting width was negligible. To our knowledge, the shielding effect of debris and used abrasives on the erosion rate has not been previously reported. Furthermore, this shielding effect was not considered in the study by Shafagh et al. [21]. Therefore, the shielding effect is neglected in the simulation to balance moderate computation time with relatively high accuracy. Therefore, the impact effect of abrasives is overestimated. Thirdly, in the DE model used in this study, a target particle is removed from the model when all its contact bonds are broken, corresponding to small-scale fragmentation of the target in practice. However, during AAJ machining in practice, target material may be removed in the form of large-scale peeling, caused by the coalescence of microcracks. Since generating new surfaces for small-scale fragmentation requires more energy than that large-scale peeling, the abrasive kinetic energy consumed during small-scale fragmentation is greater. Consequently, under the same abrasive kinetic energy conditions, less target material is removed in the simulation. This phenomenon can be termed as the “small-scale fragmentation effect”. It leads to an underestimation of the erosion rate. The results in Figure 9a indicate that the combined effect of these three factors results in an overestimation of the simulated erosion rate.
Figure 9.
Effect of air pressure and jet impact angle on erosion rate: (a) effect of air pressure on the erosion rate (sd = 1.0 mm, u = 1.5 mm/s, N = 4, α = 90°), (b) effect of jet impact angle on the erosion rate (P = 0.4 MPa, sd = 1.0 mm, u = 1.5 mm/s, N = 4).
Figure 9b shows that the erosion rate increases with an increase in the jet impact angle. The trend of the simulated erosion rate variation versus jet impact angle is consistent with the experimental results. The percentage deviation of the simulated erosion rate results from the corresponding experimental data is 10.01% on average, with a standard deviation of 15.7%. This is attributed to the increasing flux effect and shielding effect as the jet impact angle increases. At small jet impact angles, rebounding abrasives are likely to be carried away from the incident jet [21,30]. Moreover, debris from the target and used abrasives are blown away by the high-velocity air jet, which is part of the abrasive air jet stream, with high probability. Conversely, at large jet impact angles, the opposite case occurs. The increase in flux effect and shielding effect leads to the increase in overestimation of the erosion rate in the simulation.
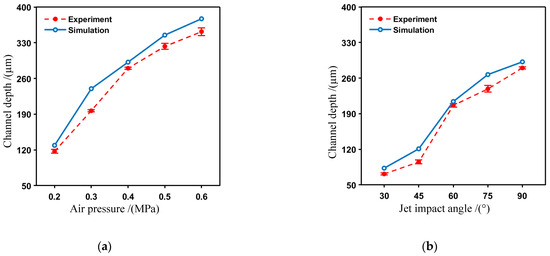
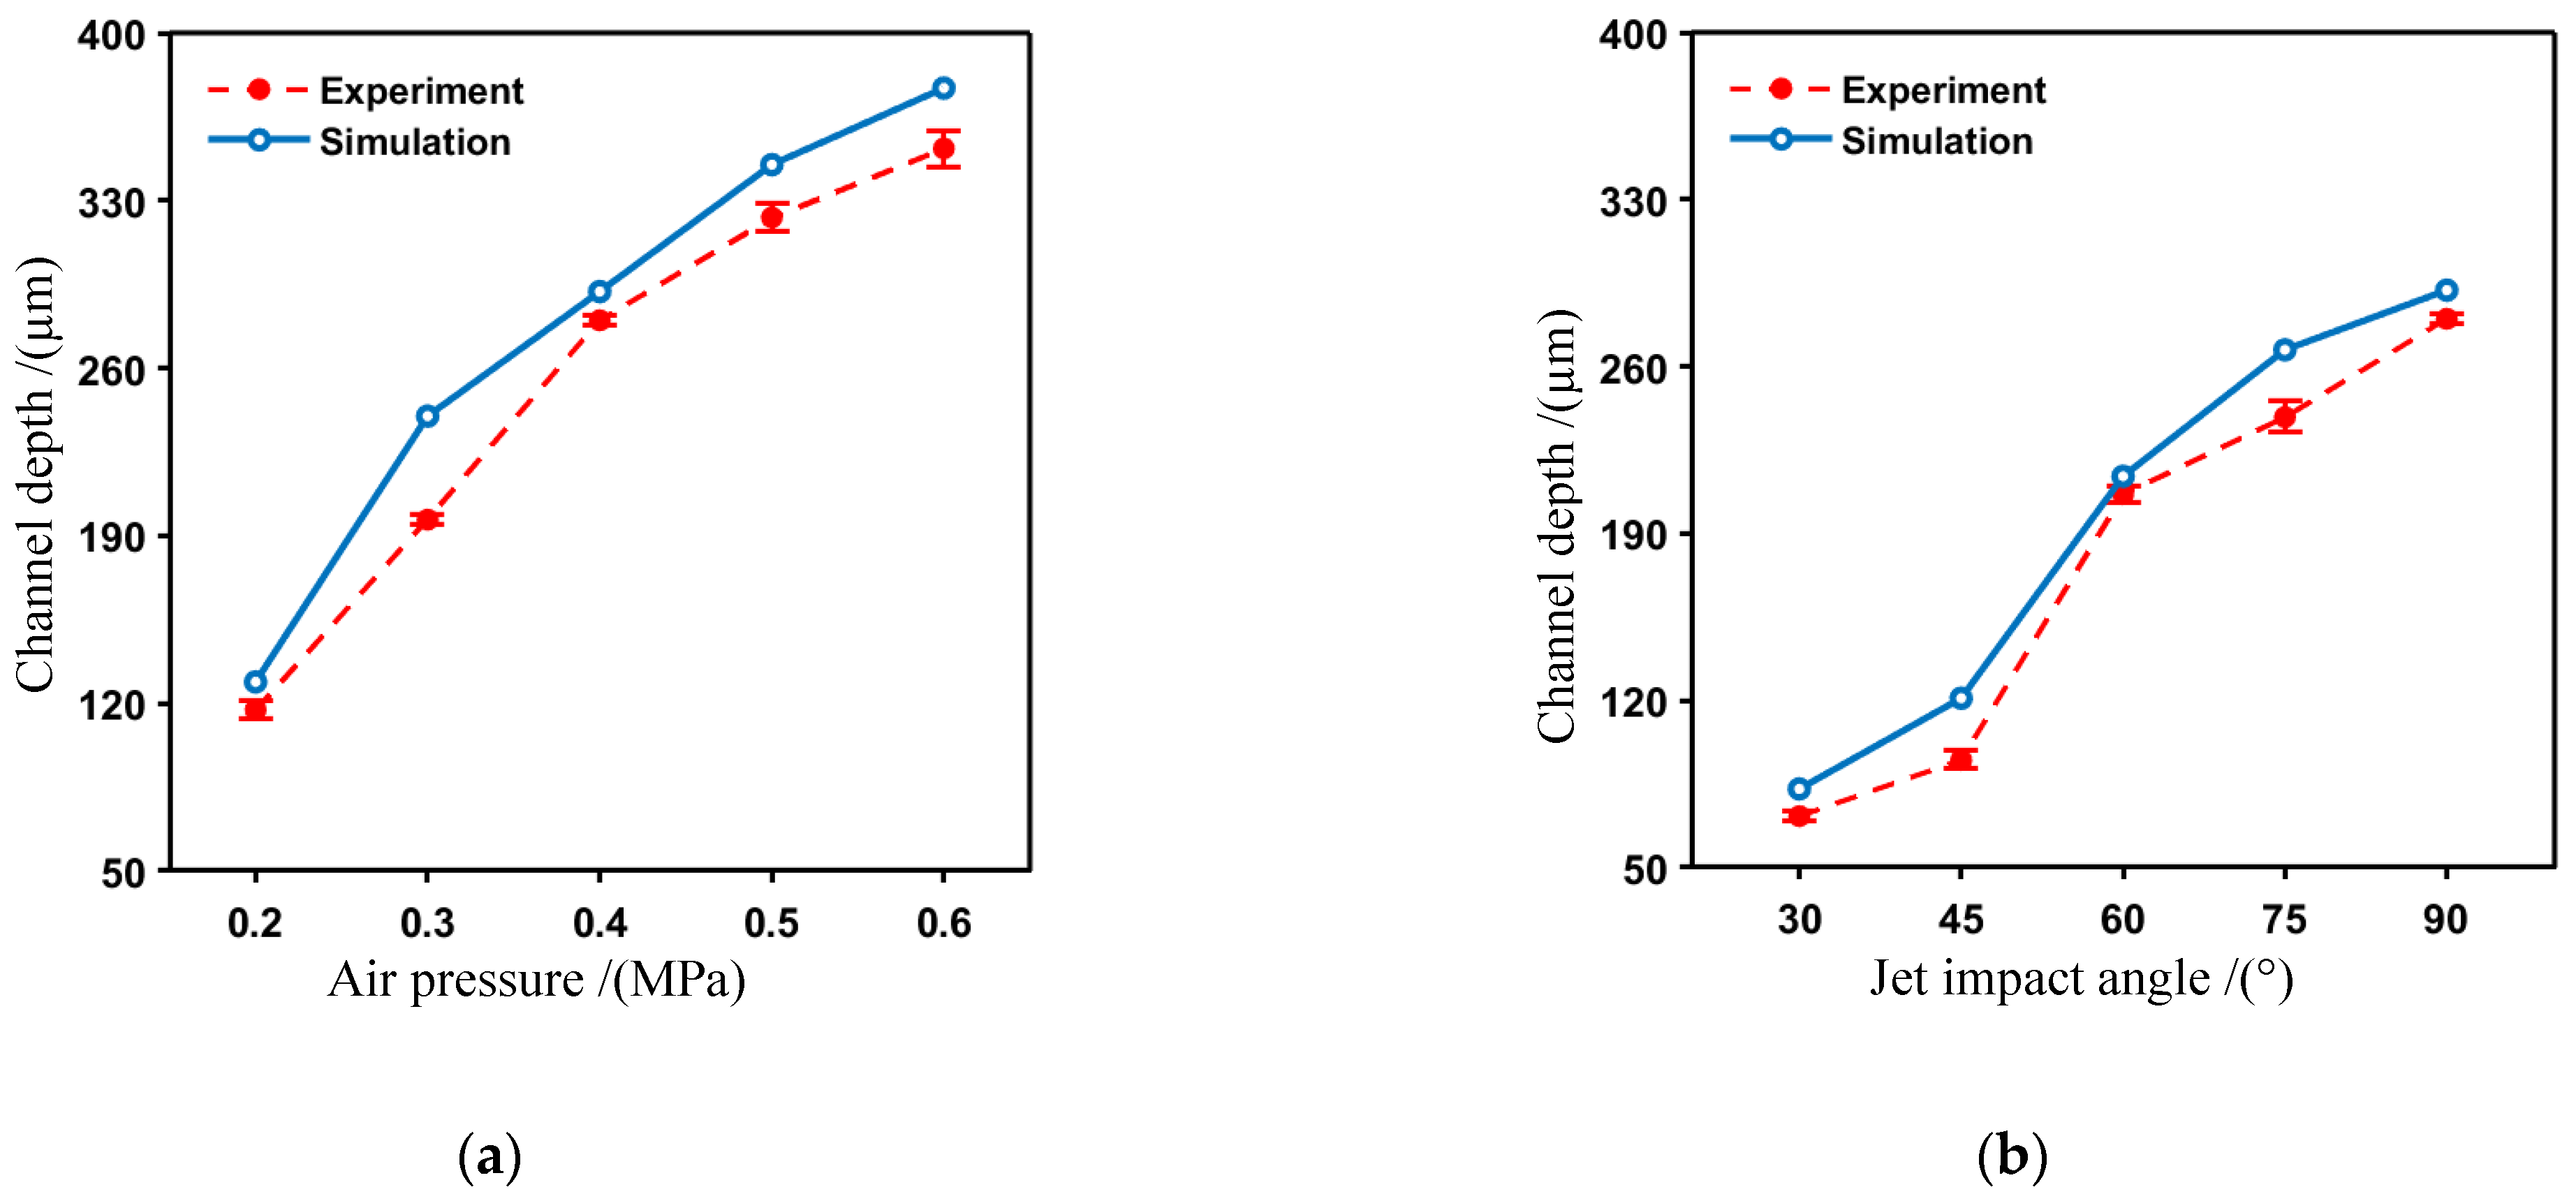
The channel depth obtained from simulation and experimental results was compared and is presented in Figure 10. Figure 10a shows that the simulated channel depth increases with increasing air pressure. The trend of simulated channel depth versus air pressure aligns with the experimental results. The percentage deviation of the simulated channel depth results from the corresponding experimental data is 10.03% on average, with a standard deviation of 6.23%. Figure 10b shows that the simulated channel depth increases with increasing jet impact angle. The trend of simulated channel depth versus jet impact angle also aligns with the experimental results. The percentage deviation of the simulated channel depth results from the corresponding experimental data is 12.57% on average, with a standard deviation of 8.67%.
Figure 10.
Effect of air pressure and jet impact angle on channel depth: (a) effect of air pressure on the channel depth (sd = 1.0 mm, u = 1.5 mm/s, N = 4, α = 90°), (b) effect of jet impact angle on the channel depth (P = 0.4 MPa, sd = 1.0 mm, u = 1.5 mm/s, N = 4).
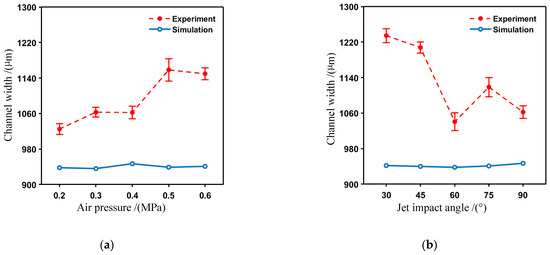
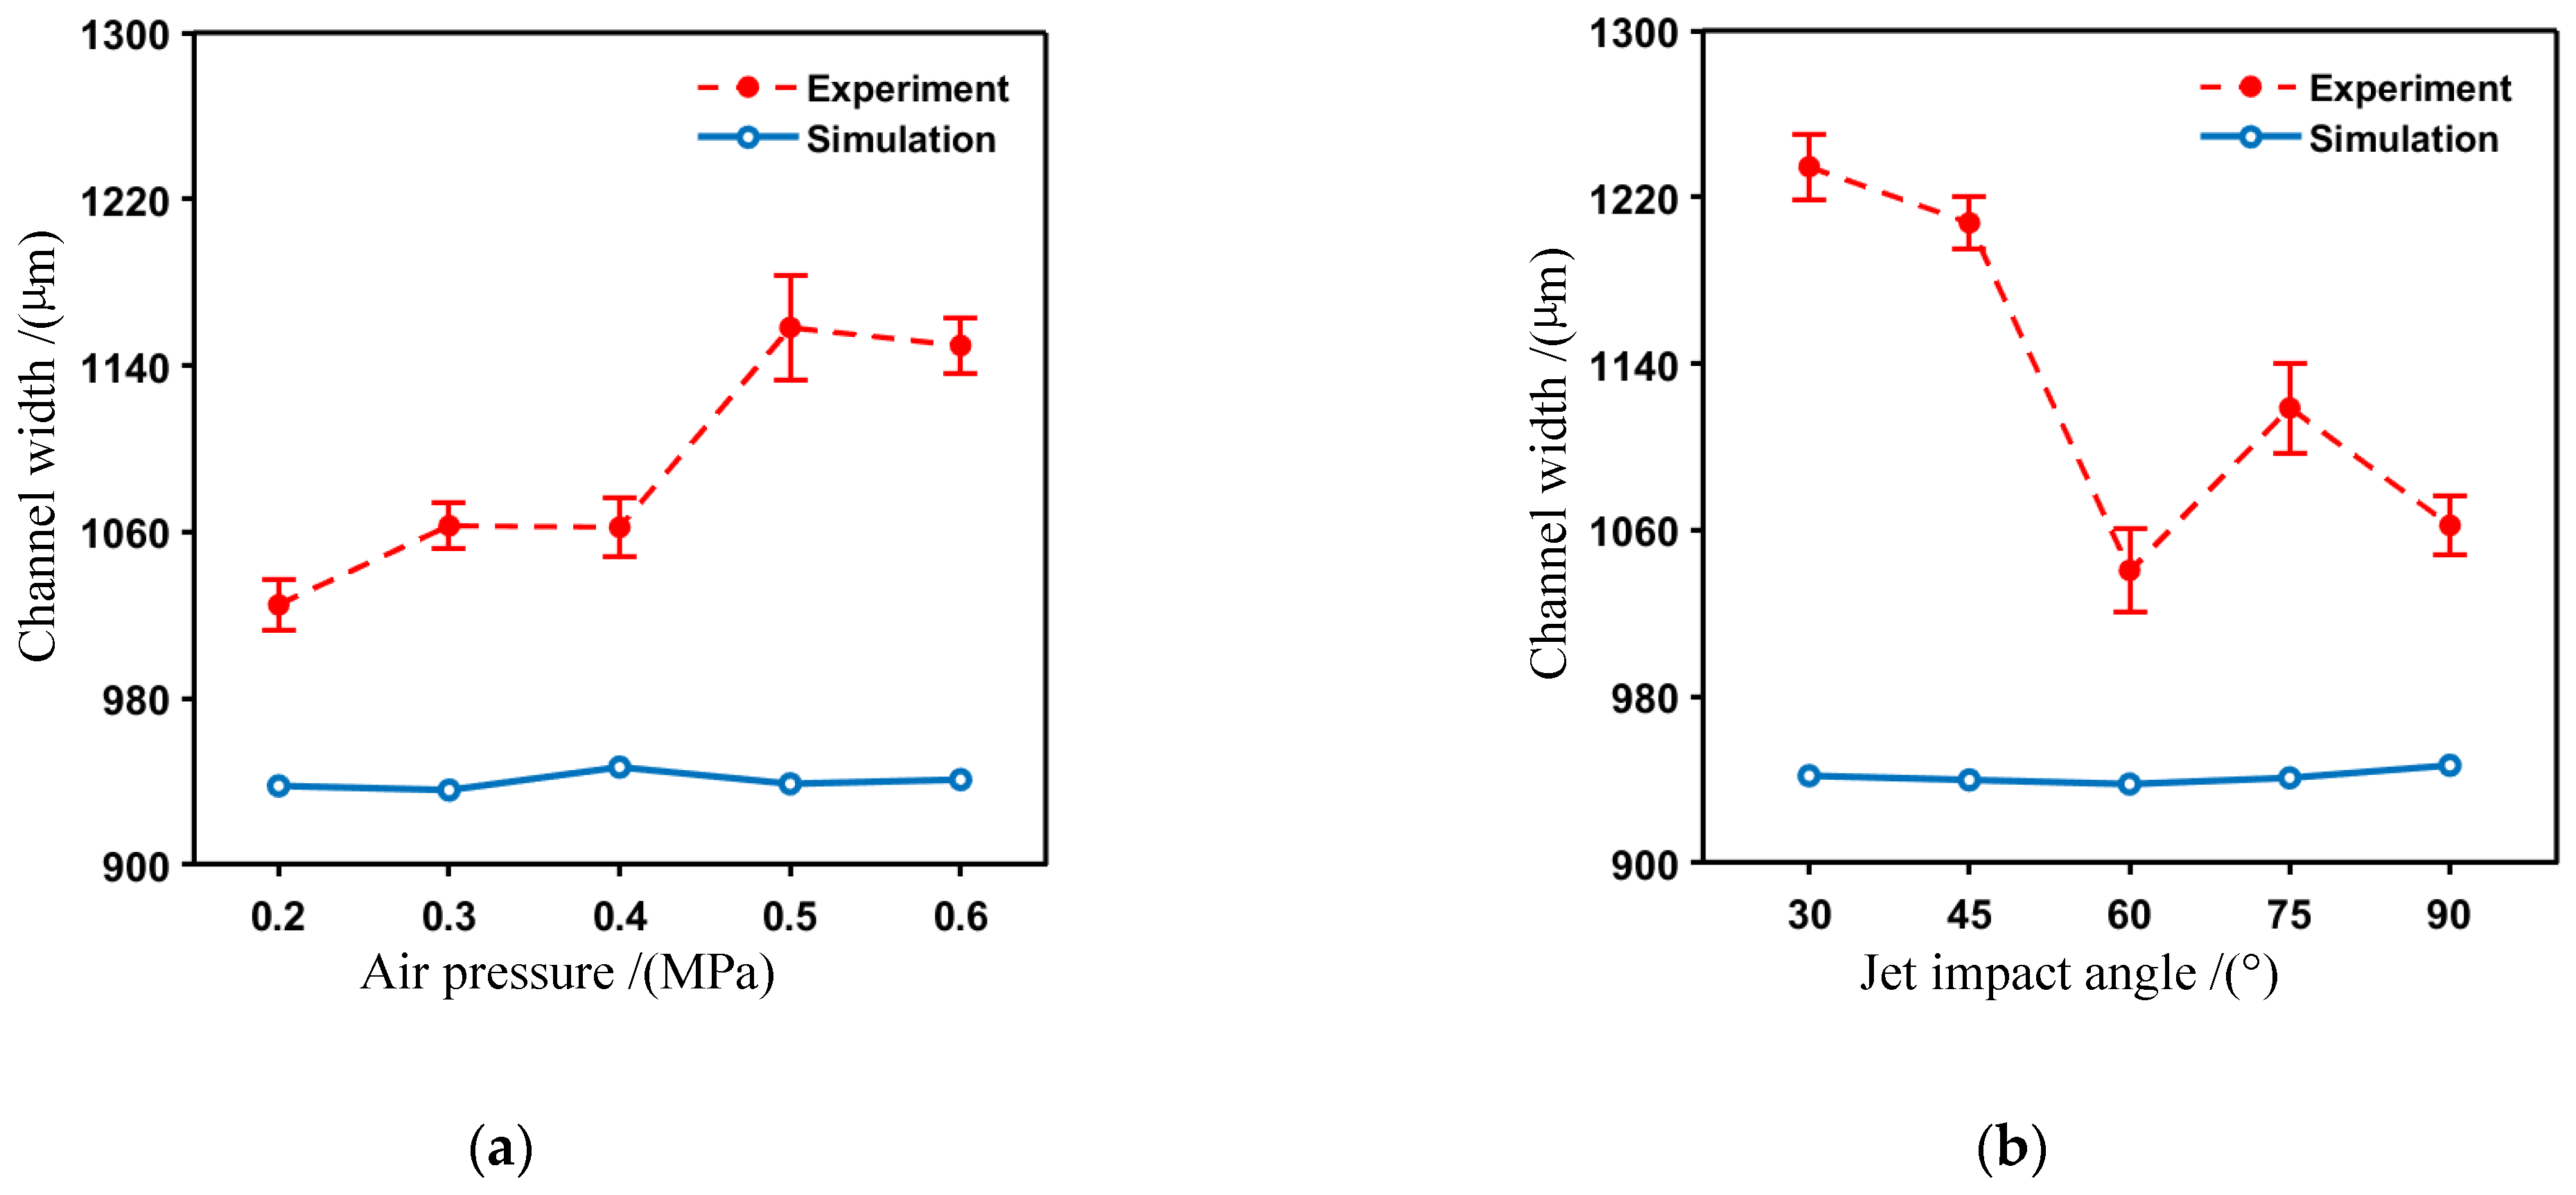
The channel widths obtained from simulation and experimental results were compared and are presented in Figure 11. In Figure 11a, the percentage deviation of the simulated channel width results from the corresponding experimental data is −13.68% on average, with a standard deviation of 4.14%. In Figure 11b, the percentage deviation of the simulated channel width results from the corresponding experimental data is −16.49% on average, with a standard deviation of 5.66%. Figure 11 shows that the simulated channel widths remain nearly constant, ranging from 936 to 947 µm. In contrast, the experimentally measured channel widths range from 1025 to 1235 µm. In the simulation, abrasives are generated within a domain with a width (W) of 900 µm. Since abrasive collisions and rebounds were not considered, the impacting area of the abrasives corresponds to this width W. The simulated micro-channel width is slightly larger than W because target particles at the edge of the direct impact area are removed due to microcrack propagation. Experimental data indicate that micro-channel width increases with increasing air pressure and decreases as the jet impact angle increases. The kinetic energy of the abrasives increases with air pressure, enabling abrasives at the jet rim to remove target material effectively, which results in a wider micro-channel. The percentage deviation between the simulated channel widths and the corresponding experimental data is comparable to the findings reported by Qi et al. [11].
Figure 11.
Effect of air pressure and jet impact angle on channel width: (a) effect of air pressure on the channel width (sd = 1.0 mm, u = 1.5 mm/s, N = 4, α = 90°), (b) effect of jet impact angle on the channel width (P = 0.4 MPa, sd = 1.0 mm, u = 1.5 mm/s, N = 4).
Compared with the DE simulation model of AAJ micro-machining of quartz crystals [11], the percentage deviations of the simulated erosion rate, micro-channel depth, and micro-channel width from the corresponding experimental data are close to those reported by Qi et al. [11]. This suggests that the DE model provides adequate simulation accuracy for AAJ micro-channel machining within the range of experimental conditions examined in this study.
4. Simulation Results and Discussion
4.1. Analysis of Micro Material Removal Mechanisms
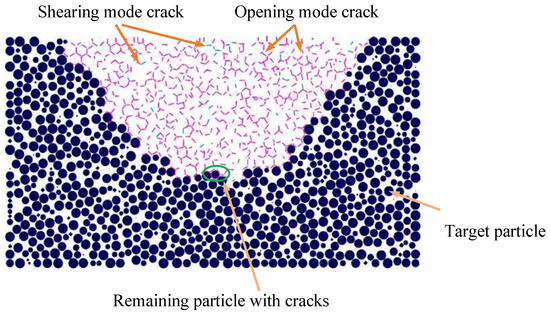
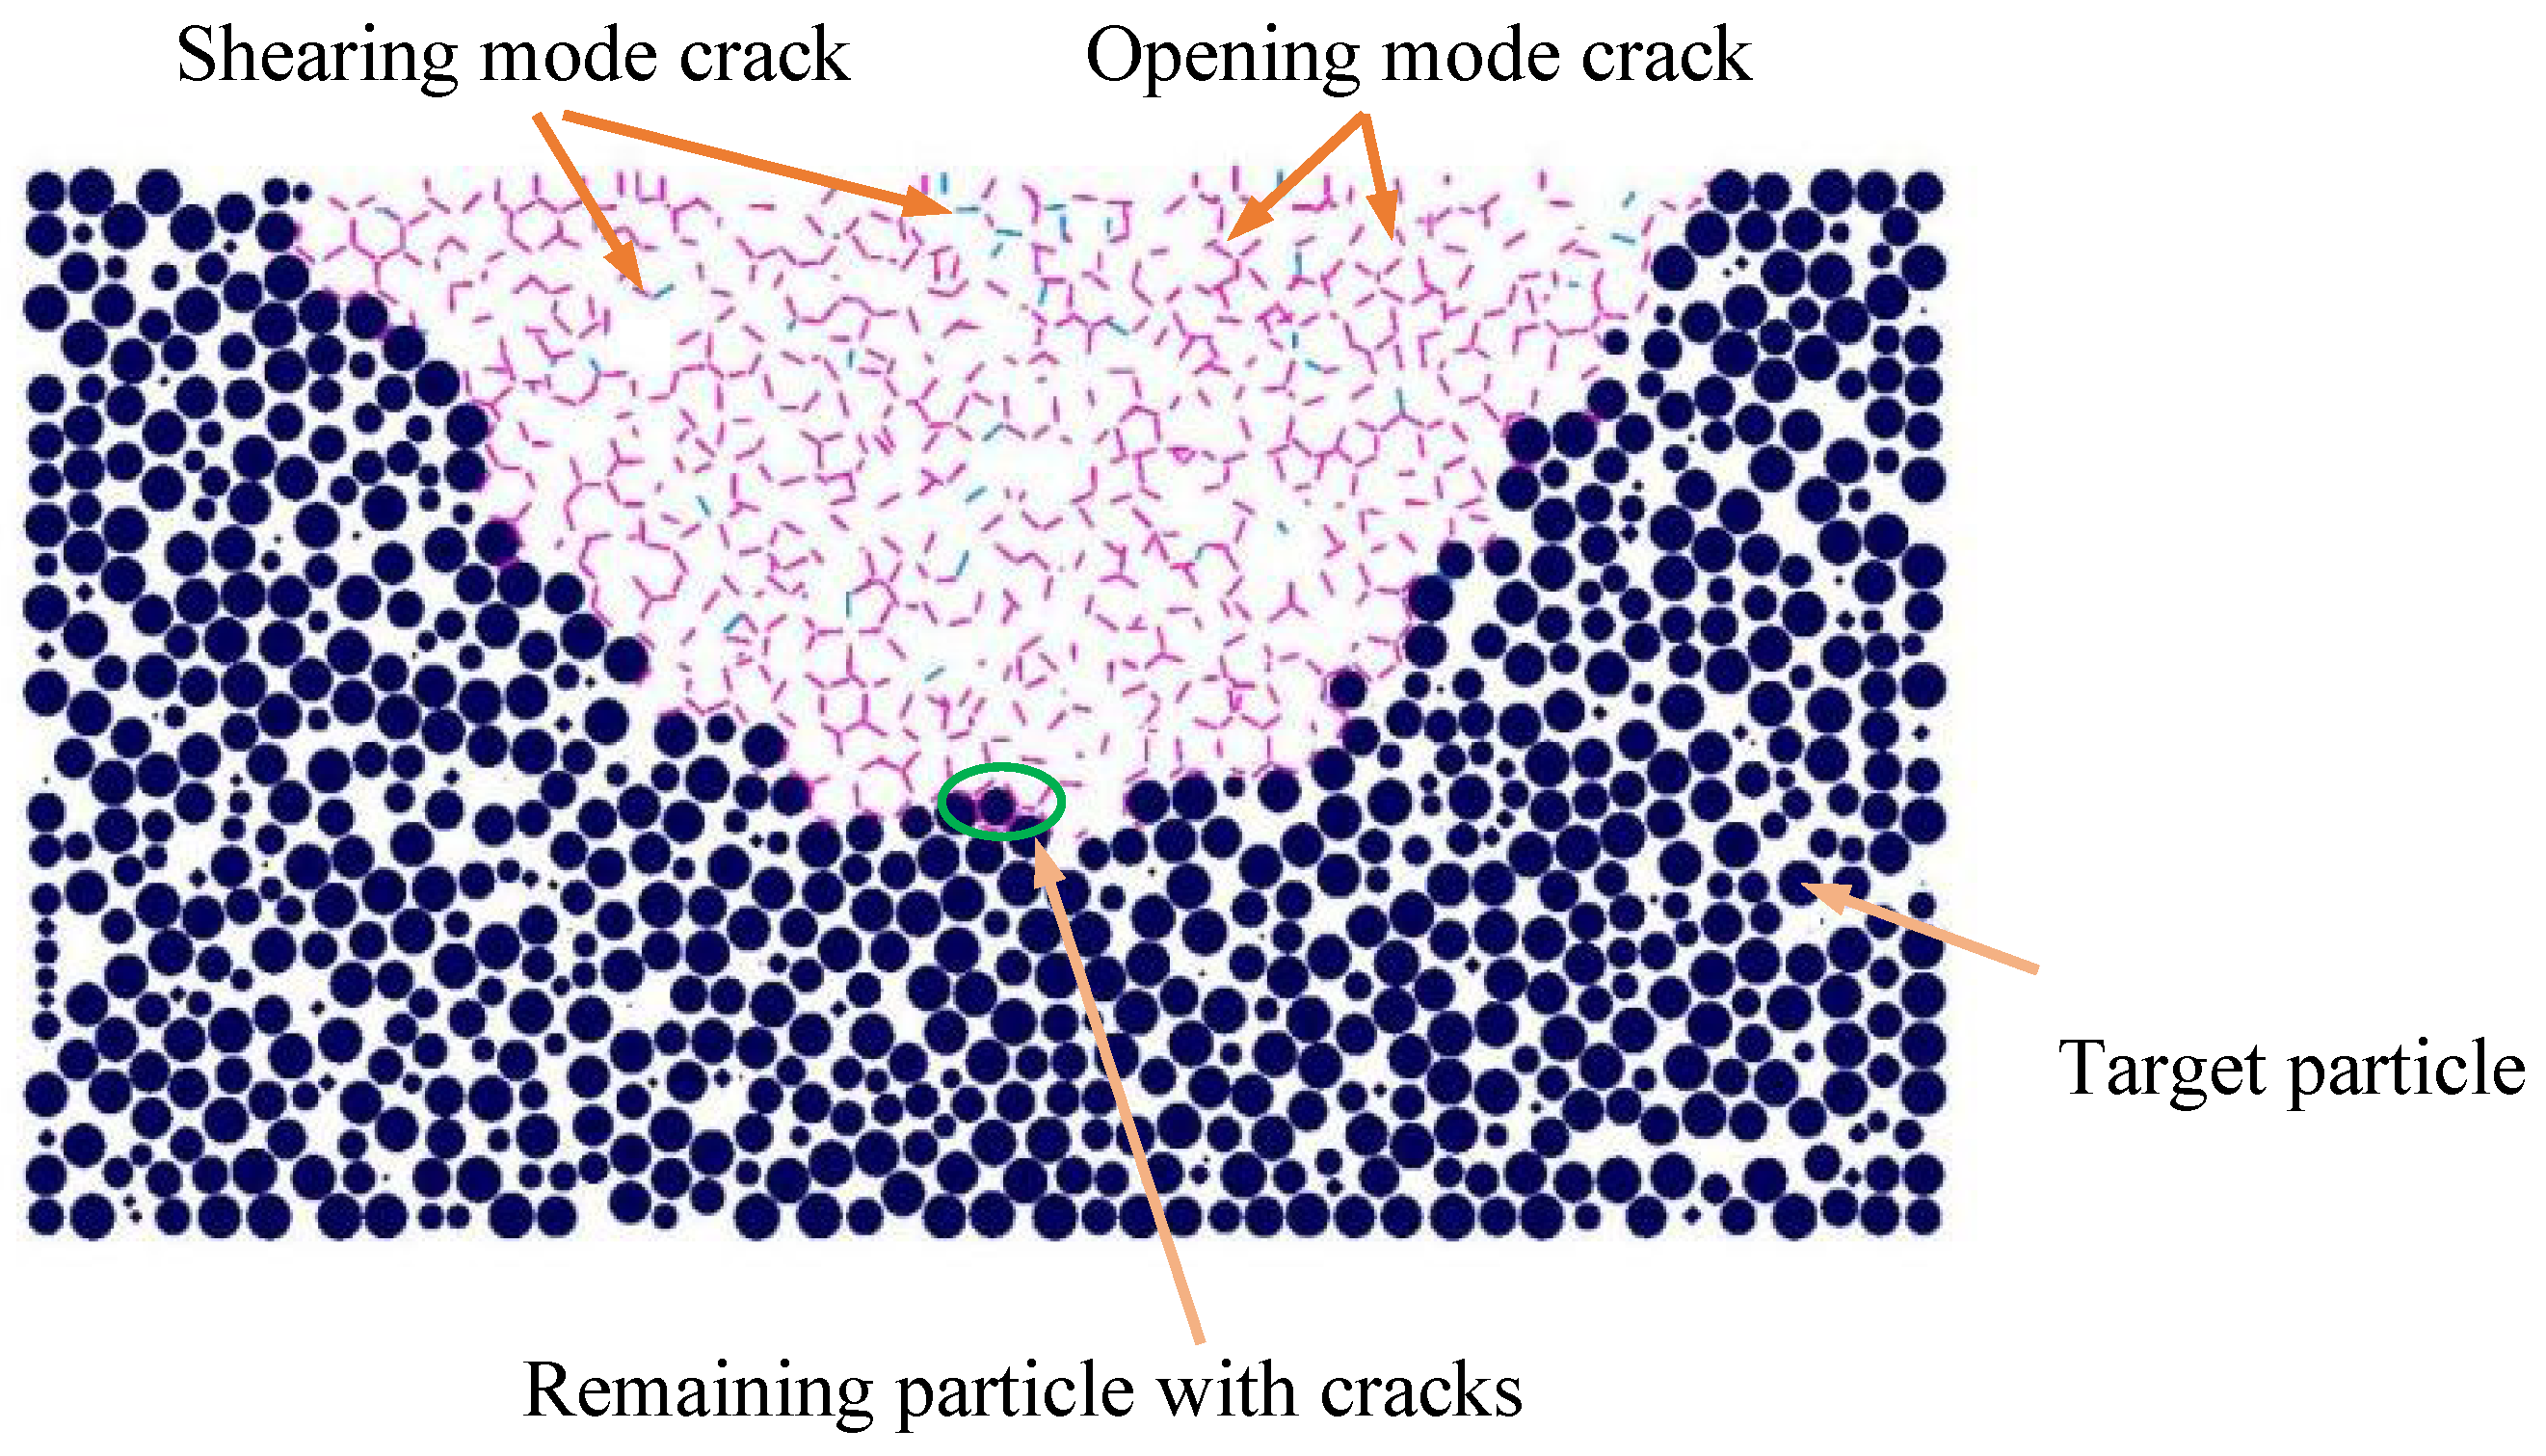
A typical morphology of the crack network is shown in Figure 12. The target particles within the crack network region are removed. There are two types of microcracks that form the crack network: opening mode cracks and shearing mode cracks. When the tensile stress exceeds the tensile strength of the parallel bond, the bond breaks, generating and an opening mode crack. Similarly, when shear stress exceeds the shear strength of the parallel bond, the bond breaks, generating a shearing mode crack. As shown in the figure, the number of opening mode cracks is much greater than that of shearing mode cracks, indicating that material removal is primarily dominated by opening mode cracks. Quartz crystals are typically hard and brittle materials with low tensile strength and high shear strength. Therefore, under the impact of abrasives, opening mode cracks are more likely to generate.
Figure 12.
Morphology of the crack network generated by the impact of AAJ (P = 0.4 MPa, u = 1.5 mm/s, sd = 1 mm, α = 90°; pink lines represent opening mode cracks, and blue lines represent shearing mode cracks).
Furthermore, it was found that microcracks are generated surrounding a target particle, but the particle itself has not been removed, as shown in Figure 12. During AAJ machining, abrasives impact the surface of the target, causing the removal of target particles at the surface. Thus, the total number of parallel bonds for a target particle at the surface is no more than five. The criterion for the removal of a target particle removal is that all the parallel bonds surrounding the particle have been broken. If any parallel bond remains connected, the target particle will not be removed. Hence, the particle remained in the target substrate, even though microcracks have formed surrounding it, as shown in Figure 12. Since subsequent incoming abrasive impacts only need to break the remaining parallel bonds of a target particle, particle removal becomes easier. These microcracks can be considered as damage introduced into the target, which benefits the increase of the subsequent material removal rate.
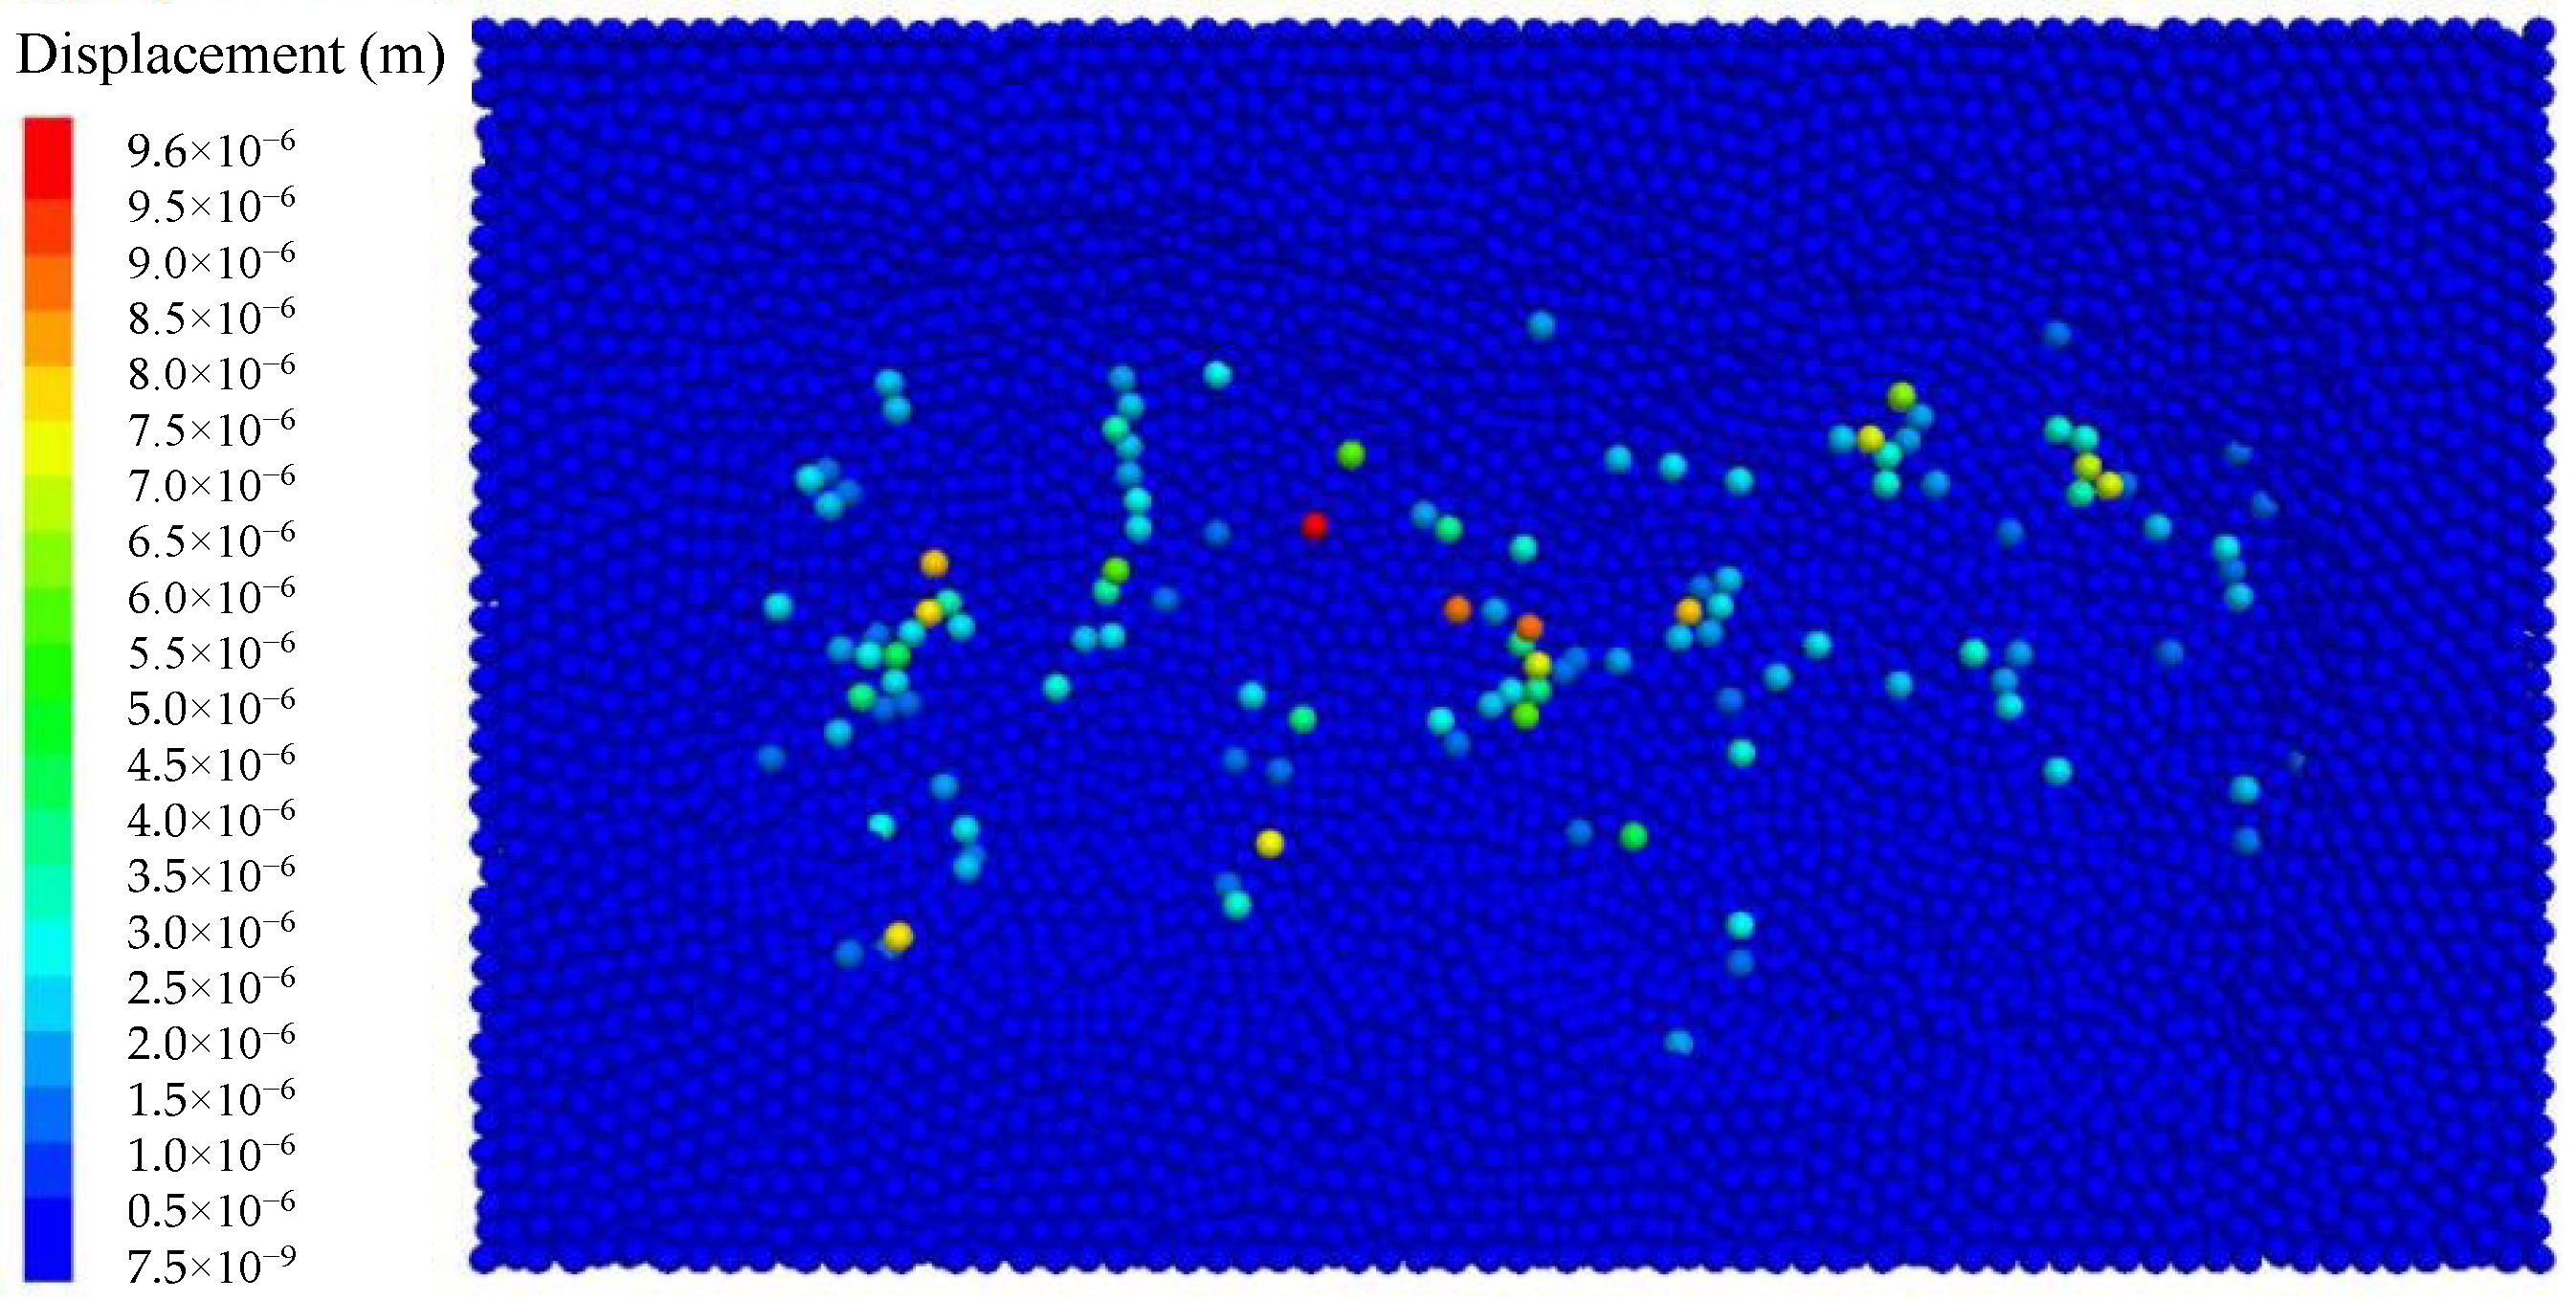
Figure 13 shows the displacement of the target particles. It can be seen from the figure that the positions of the target particles have changed without being removed. This occurs because not all parallel bonds surrounding the particles are broken. It can be considered as the plastic deformation of the target. The kinetic energy of abrasives is consumed to generate plastic deformation during AAJ machining.
Figure 13.
Remaining particles with position variation (P = 0.4 MPa, u = 1.5 mm/s, sd = 1 mm, α = 90°).
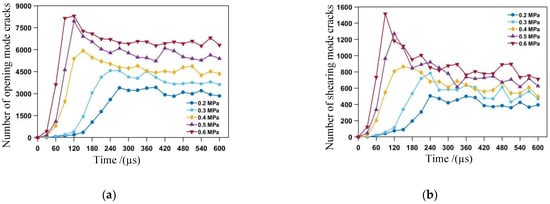
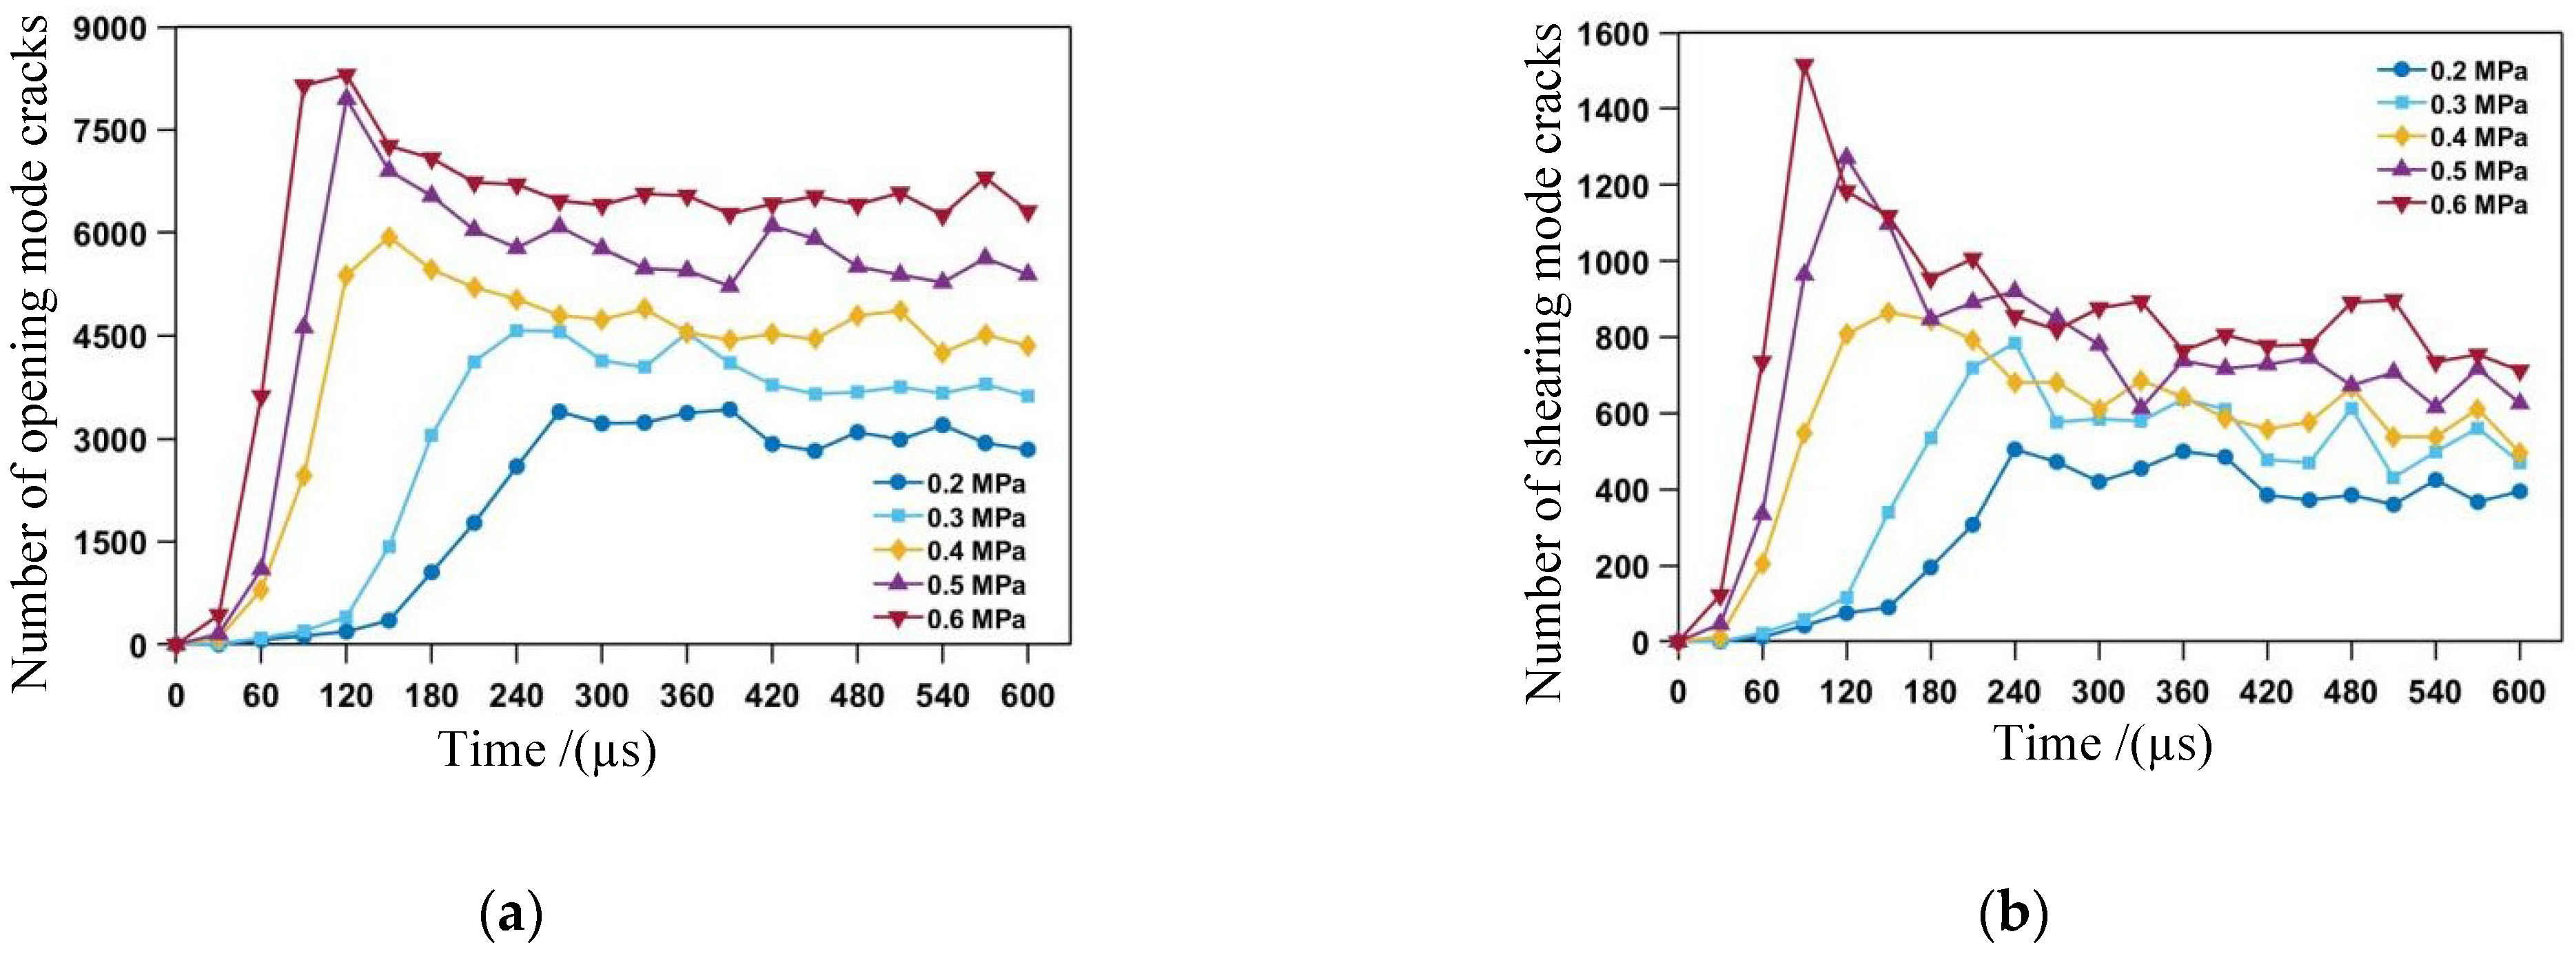
The histories of the number of newly generated cracks are shown in Figure 14. The number of newly generated cracks was measured at time intervals of 30 µs. The total simulated machining time was 600 µs. It was found that, under the impact of abrasives, opening mode cracks and shearing mode cracks are generated simultaneously. The number of newly generated opening mode cracks and shearing mode cracks first increases and then decreases. Both types of cracks increase in number with increasing air pressure. The average percentages of opening mode cracks relative to the total number of cracks over the entire simulation time are 81.1%, 86.3%, 87.3%, 86.8%, and 89.9%, for air pressures of 0.2, 0.3, 0.4, 0.5, and 0.6 MPa, respectively. This indicates that significantly more opening mode cracks are generated than shearing mode cracks; it can be considered that opening mode cracks dominate the material removal process once again. Additionally, the average percentage of opening mode cracks relative to the total number of cracks increases with an increase in air pressure.
Figure 14.
Histories of the number of newly generated cracks: (a) the history of the number of newly generated opening mode cracks, and (b) the history of the number of newly generated shearing mode cracks.
4.2. History of Material Removal
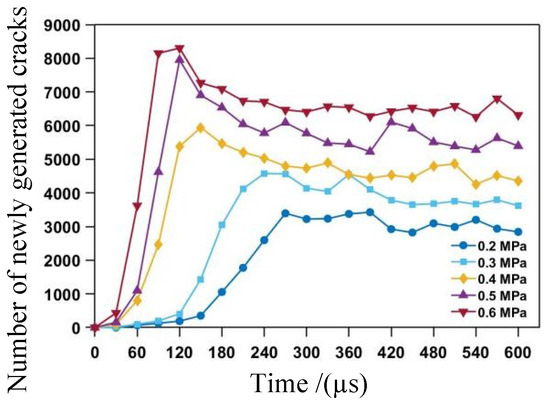
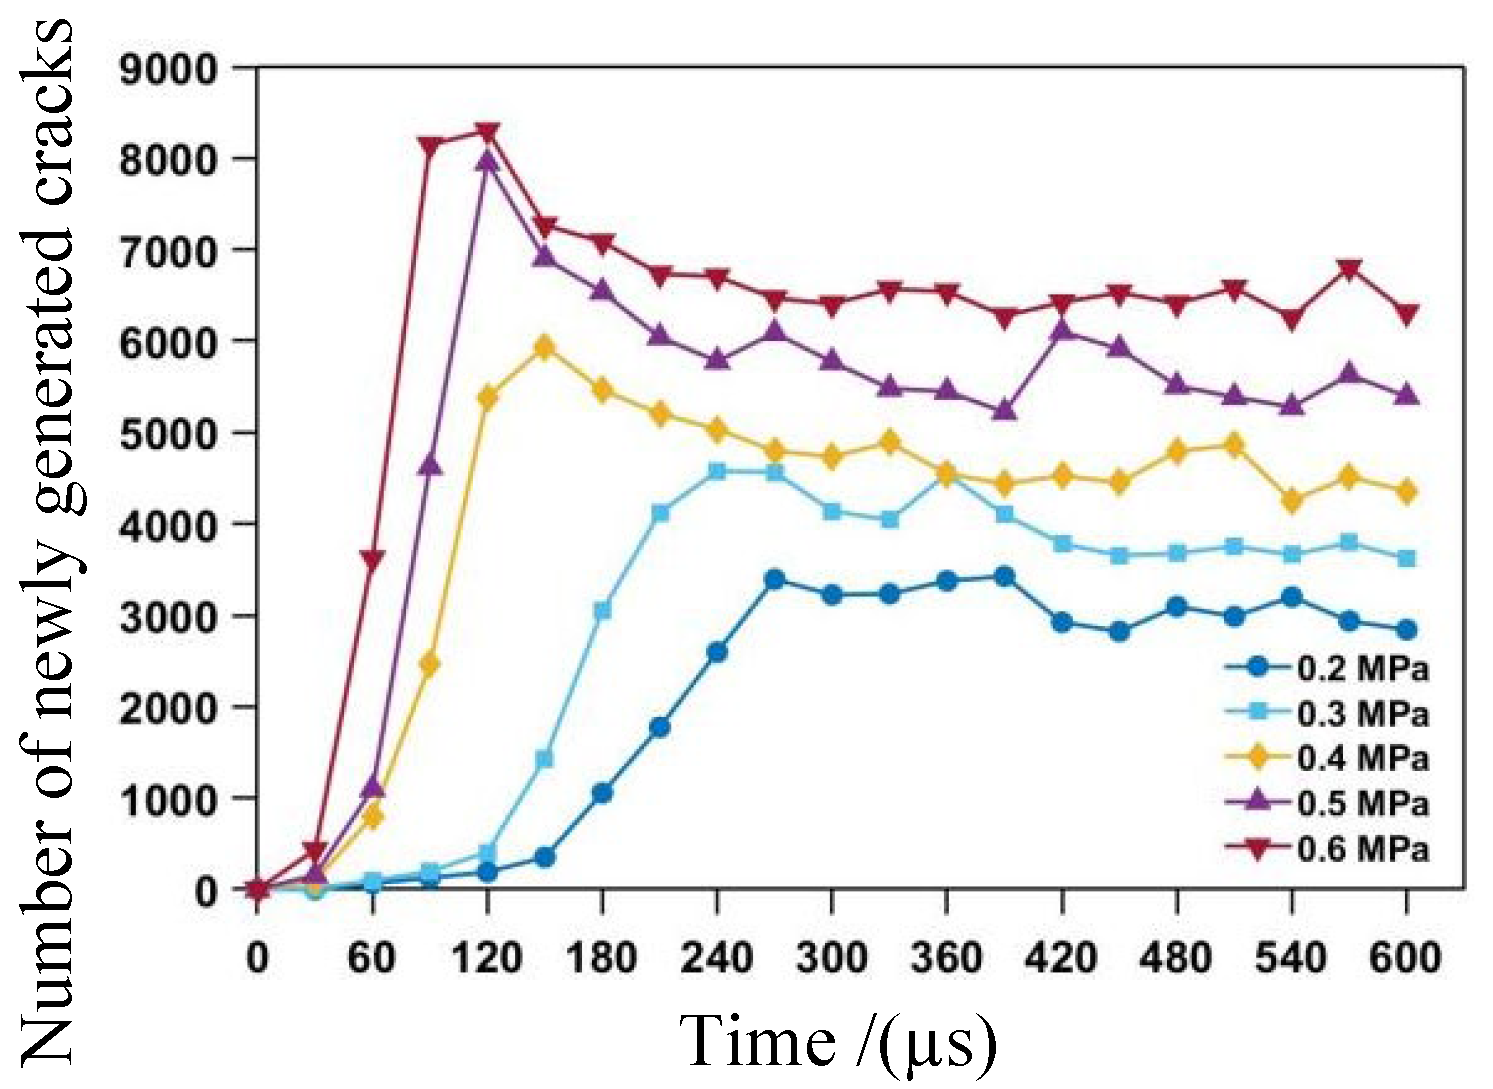
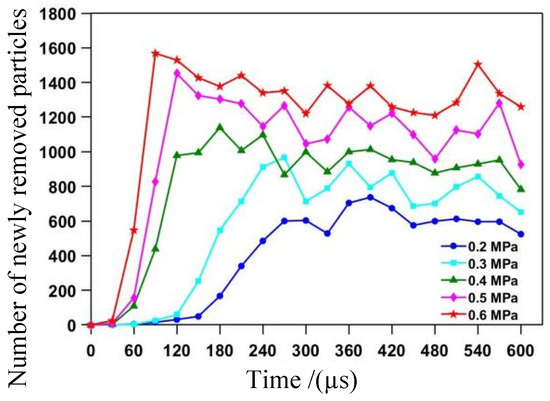
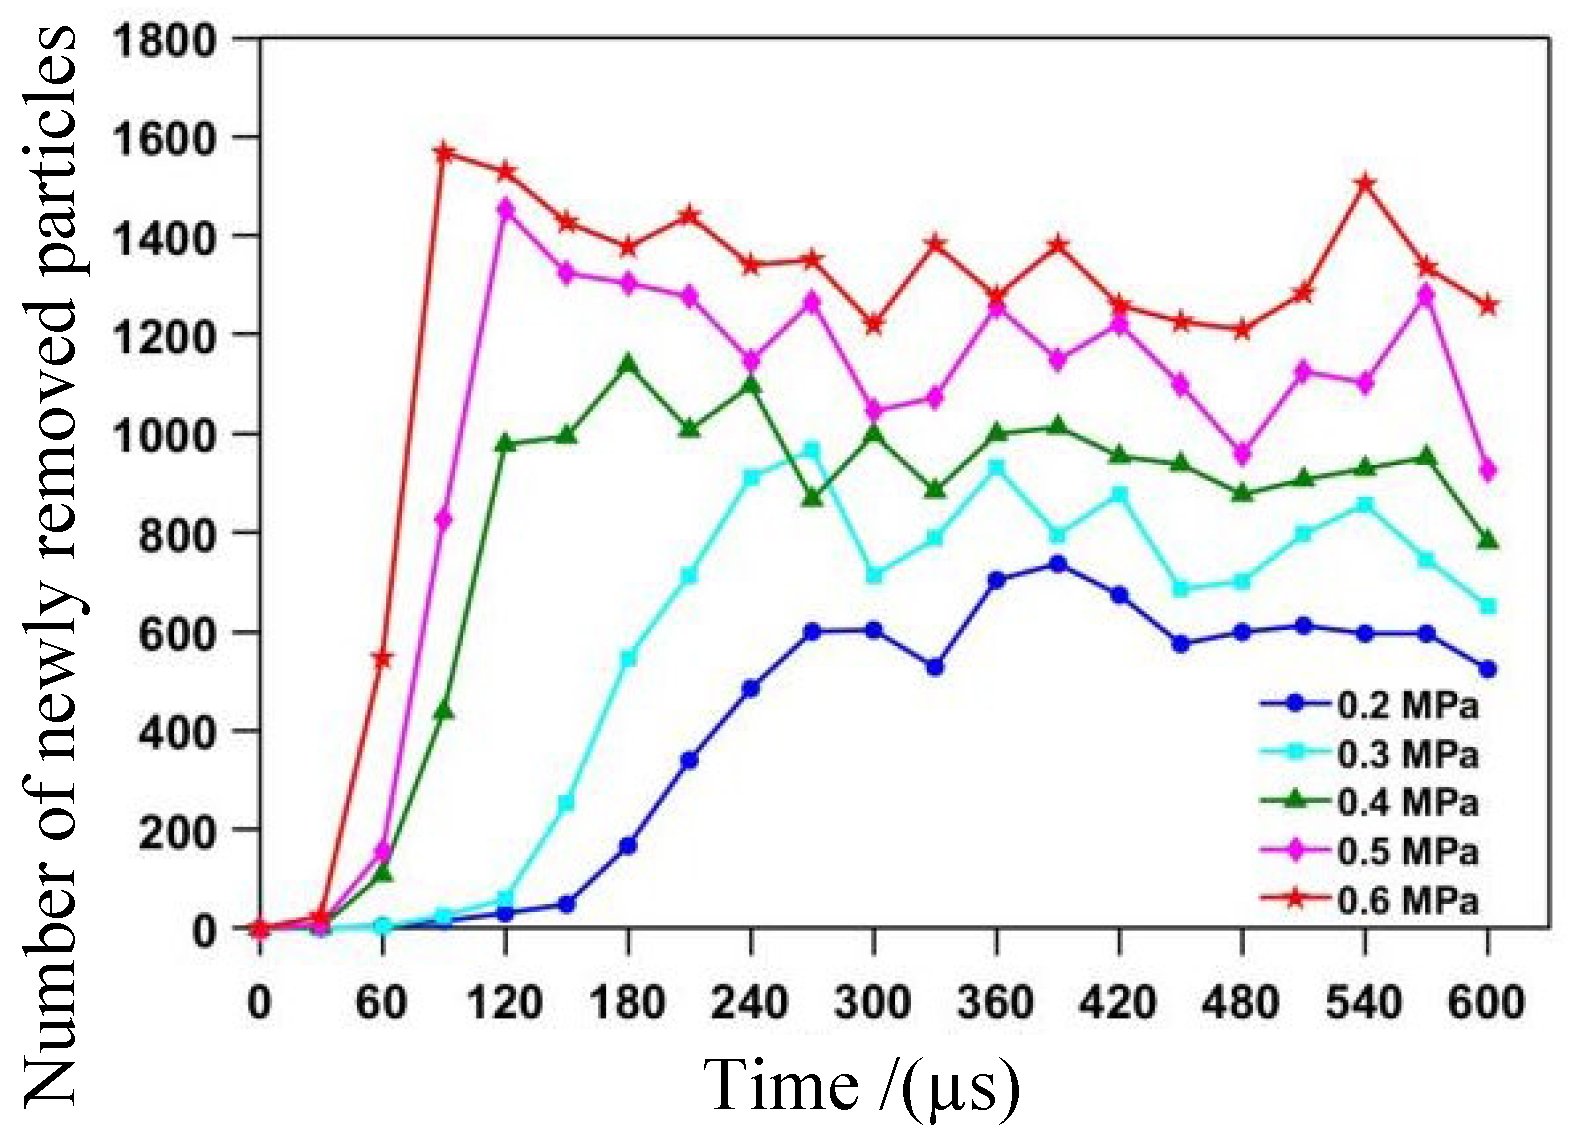
The number of newly generated cracks and newly removed target particles was measured at time intervals of 30 µs. The histories of the number of newly generated cracks and removed particles are shown in Figure 15 and Figure 16. As seen in Figure 15, the history of number of newly generated cracks can be divided into three stages: an incubation stage, a transitional stage, and a stable stage. The stages in the history of the number of removed particles correspond to those of newly generated cracks.
Figure 15.
History of the total number of newly generated cracks.
Figure 16.
History of the number of newly removed target particles.
4.2.1. Incubation Stage
The incubation stage is the initial phase after the processing begins. Its characteristics are as follows: the number of newly generated cracks and the number newly removed particles are small, the increasing rates for both are low, and the duration of the incubation stage decreases as air pressure increases.
Figure 15 shows that, at low air pressures (P = 0.2 and 0.3 MPa), the incubation stage for newly generated cracks and newly removed target particles lasts from the beginning up to 120 µs. At an air pressure of 0.2 MPa, the numbers of newly generated cracks are 0, 78, 169, and 265 at time intervals of 30 µs. With an air pressure of 0.3 MPa, the numbers of newly generated cracks are 13, 120, 255 and 525 at time intervals of 30 µs. The average increasing rates of the number of newly generated cracks are 4.3 and 7.6 cracks per microsecond at air pressures of 0.2 MPa and 0.3 MPa, respectively. The increasing rates of the number of newly generated cracks are relatively small. At low air pressure, the average kinetic energy of abrasives is less than the critical energy required to break the parallel bonds immediately. Consequently, the number of newly generated cracks remains low. However, repeated impacts from the abrasives damage the target substrate, reducing the critical energy needed to break the parallel bonds. After several impacts, the average kinetic energy of abrasives exceeds the degraded critical energy, resulting in the breaking of the parallel bonds.
Figure 16 shows that the number of newly removed particles is also small at this stage. At an air pressure of 0.2 MPa, the numbers of newly removed particles are 0, 5, 15, and 31 at time intervals of 30 µs. At an air pressure of 0.3 MPa, the numbers are 0, 3, 26, and 59 at the same time intervals. The average increasing rates of the number of newly removed particles are 0.43 and 0.73 particles per microsecond for air pressures of 0.2 MPa and 0.3 MPa, respectively. These increasing rates of newly removed particle quantities are relatively small. Additionally, the number of newly removed particles is much lower than the number of newly generated cracks. As discussed in Section 4.1, particles are removed only when all five parallel bonds are broken. Since the number of broken parallel bonds is small, the probability that all bonds surrounding a particle are broken is low. Therefore, the number of newly removed particles remains small.
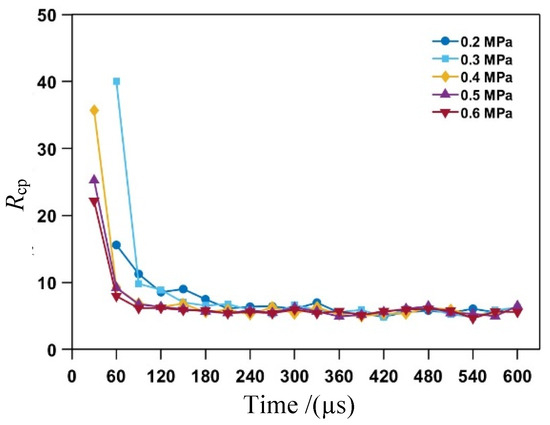
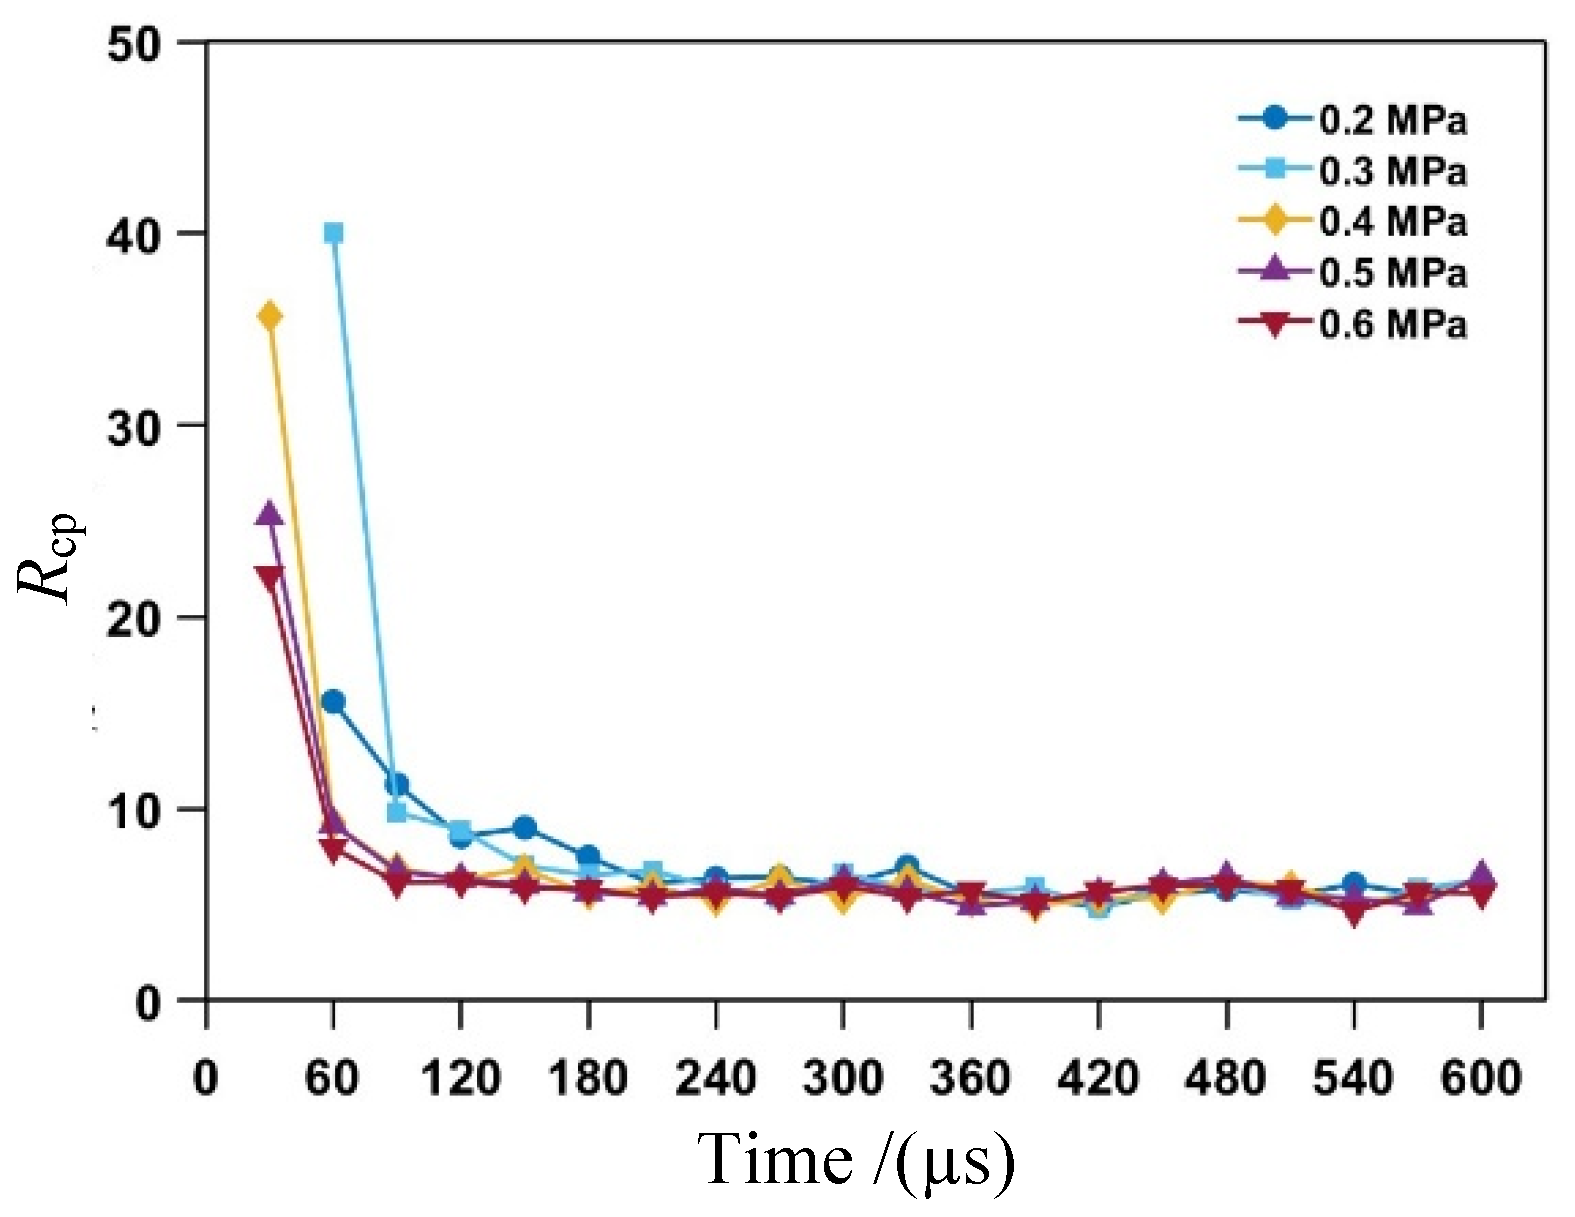
To analyze the contribution of newly generated cracks to the removal of target particles, an indicator called contribution rate (Rcp) is proposed. It is defined as the ratio of the number of newly removed particles to the number of newly generated cracks. This indicator represents the number of newly generated cracks required to remove a single target particle. The histories of Rcp are shown in Figure 17.
Figure 17.
History of the contribution rate of cracks.
At this stage, the values of Rcp are 0, 15.6, 11.27, and 8.55 at an air pressure of 0.2 MPa. At an air pressure of 0.3 MPa, the values of Rcp are 0, 40, 9.81, and 8.9. All of these values are greater than 5, indicating that the kinetic energy of the abrasives is insufficient to remove particles immediately. Instead, the kinetic energy is expended on degrading the strength of parallel bonds and accumulating of microcracks.
For high air pressures (P = 0.4 and 0.5 MPa), the incubation stage lasts from the beginning up to 60 us. At an air pressure of 0.4 MPa, the numbers of newly generated cracks are 107 and 1006. At an air pressure of 0.5 MPa, the numbers of newly generated cracks are 202 and 1434. The average increasing rates of number of newly generated cracks are 18.6 and 27.3 cracks per microsecond at air pressures of 0.4 MPa and 0.5 MPa, respectively. The increasing rate at higher air pressure is greater than that at low air pressure. This can be attributed to the fact that the kinetic energy of the abrasives increases with an increase in air pressure. Higher kinetic energy of the abrasives may cause bond breakage to occur more rapidly during machining, resulting in a greater number of newly generated cracks.
Figure 16 shows that at high air pressures (P = 0.4 and 0.5 MPa), the number of newly removed particles is small. At an air pressure of 0.4 MPa, the number of removed particles is three and 109, while at 0.5 MPa, the number of newly removed particles is eight and 156. The average increasing rates of removed particles are 1.9 and 2.7 particles per microsecond at an air pressure of 0.4 and 0.5 MPa, respectively. The increasing rates of the number of newly removed particles are relatively small. An increase in the number of newly generated cracks leads to a corresponding increase in the number of removed particles. At this stage, the values of Rcp are 35.67 and 9.23 at an air pressure of 0.4 MPa, and 25.25 and 9.19 at an air pressure of 0.5 MPa. All values exceed 5, indicating that although the average kinetic energy of the abrasives increases with air pressures of 0.4 and 0.5 MPa, they remain below the critical kinetic energy required to break all bonds surrounding a target particle. Consequently, the kinetic energy of the abrasives is primarily consumed in degrading the strength of parallel bonds and accumulating cracks, resulting in more damage to the substrate.
For the highest air pressure (P = 0.6 MPa) used in this study, the incubation stage lasts from the beginning up to 30 µs. The number of newly generated cracks is 554. The increasing rate of the number of newly generated cracks is 18.5 cracks per microsecond. The value of Rcp is 22.16, indicating that it remains difficult to break all parallel bonds surrounding a single particle simultaneously when an abrasive impacts the target.
Therefore, it can be concluded that the material is removed by the accumulation of opening mode microcracks, which are generated by multiple abrasives during the incubation stage.
4.2.2. Transitional Stage
The transitional stage is the second phase, following the incubation stage. The duration of the transitional stage of the number of newly generated cracks spans from the end of the incubation stage to the point when the maximum number of newly generated cracks appears. For example, as shown in Figure 15, at an air pressure of 0.4 MPa, the transitional stage for the number of newly generated cracks occurs between 60 µs and 150 µs. Similarly, Figure 16 shows that the transitional stage for the number of newly removed particles ranges from 60 µs to 180 µs. It is observed that the time at which the maximum number of newly generated cracks appears differs from that of the newly removed targets. For the number of newly removed targets to increase, two conditions should be met simultaneously: the number of newly generated cracks increase and all remaining bonds surrounding a target particle are broken. Therefore, the time at which the maximum number of newly generated cracks appears differs from that of the newly removed targets.
In this stage, the increasing rates of the number of newly generated cracks and newly removed targets increase significantly compared to the incubation stage. The maximum number of both newly generated cracks and newly removed targets is reached during this phase. The duration time of the transitional stage decreases as air pressure increases. Since the strength of parallel bonds is degraded by the impact of abrasives during the incubation stage, the parallel bonds become more susceptible to breaking from subsequent particle impacts. Consequently, the increasing rate of newly generated cracks is high. With a large number of newly generated cracks, the probability that all bonds surrounding a target particle will break also increases. Therefore, the number of newly removed targets increases.
Figure 17 shows the values of Rcp at this stage. The average values of Rcp are 7.1, 6.6, 6.7, 6.6 and 6.8, corresponding to air pressures of 0.2, 0.3, 0.4, 0.5 and 0.6 MPa, respectively. The values of Rcp are smaller than those observed during incubation stage. The contribution of number newly generated cracks to the particle removal increases. However, the values of the Rcp remain above 5, indicating that the damage continues to occur in the target substrate.
4.2.3. Stable Stage
The stable stage represents the remaining duration of the simulation, and follows the transitional stage. During this phase, the number of newly generated cracks and newly removed targets decreases significantly at first, and then gradually declines as the machining process continues, as shown in Figure 15 and Figure 16.
The degraded strength bonds have been broken during the transitional stage, as discussed in Section 4.2.2. Therefore, at the beginning of the stable stage, the parallel bonds that needed to be broken retain their original target strength. They are difficult to all break immediately when abrasives impact the target surface. Therefore, the number of newly generated cracks decreases significantly. Consequently, the number of removed target particles also decreases significantly.
As the machining process progresses, the number of newly generated cracks decreases gradually. This reduction is caused by a decrease in the abrasive impact angle. The micro-channel fabricated by AAJ machining has two inclined sidewalls, as shown in Figure 7. As the machining process progresses, the sidewalls of the micro-channel become steeper. Consequently, the abrasive impact angle decreases, leading to a reduction in tensile stress and an increase in shear stress. The number of newly generated cracks decreases accordingly, which reduces the probability of all bonds surrounding a target particle being broken. Therefore, the number of newly removed target particles decreases.
Figure 17 shows that the average values of Rcp are 5.8, 5.7, 5.6, 5.7, and 5.6 for air pressures of 0.2, 0.3, 0.4, 0.5, and 0.6 MPa, respectively, during this stage. This indicates that the contribution of newly generated cracks to particle removal is the greatest among the three stages discussed above. The values of Rcp are all greater than 5, which indicates that damage continues to occur in the target substrate, and the microcracks are accumulated.
4.3. History of Micro-Channel Formation
During the actual machining process, the interaction time between abrasives and the target is very short, making it difficult to observe the formation history of micro-channels. Additionally, the impact of numerous abrasives on the target generates a “dust cloud” formation at the machining area. This will obstruct the line of sight for observation. However, the history of micro-channel formation can be studied using the DE simulation method.
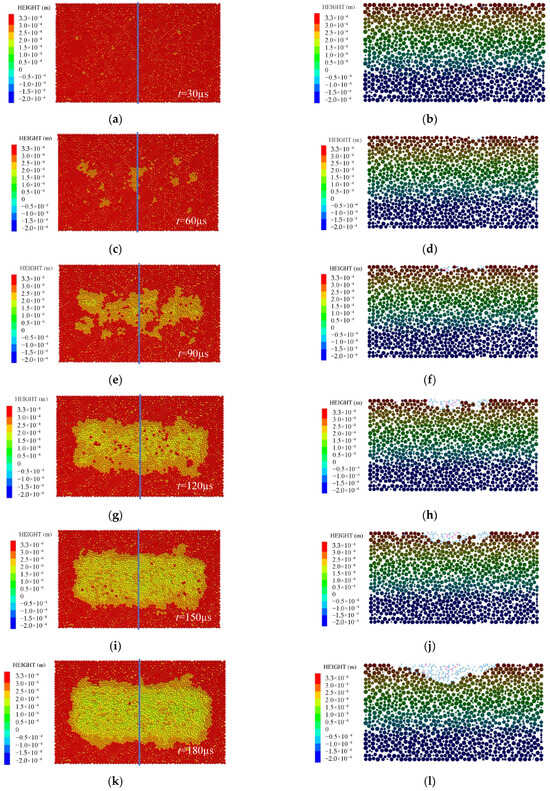
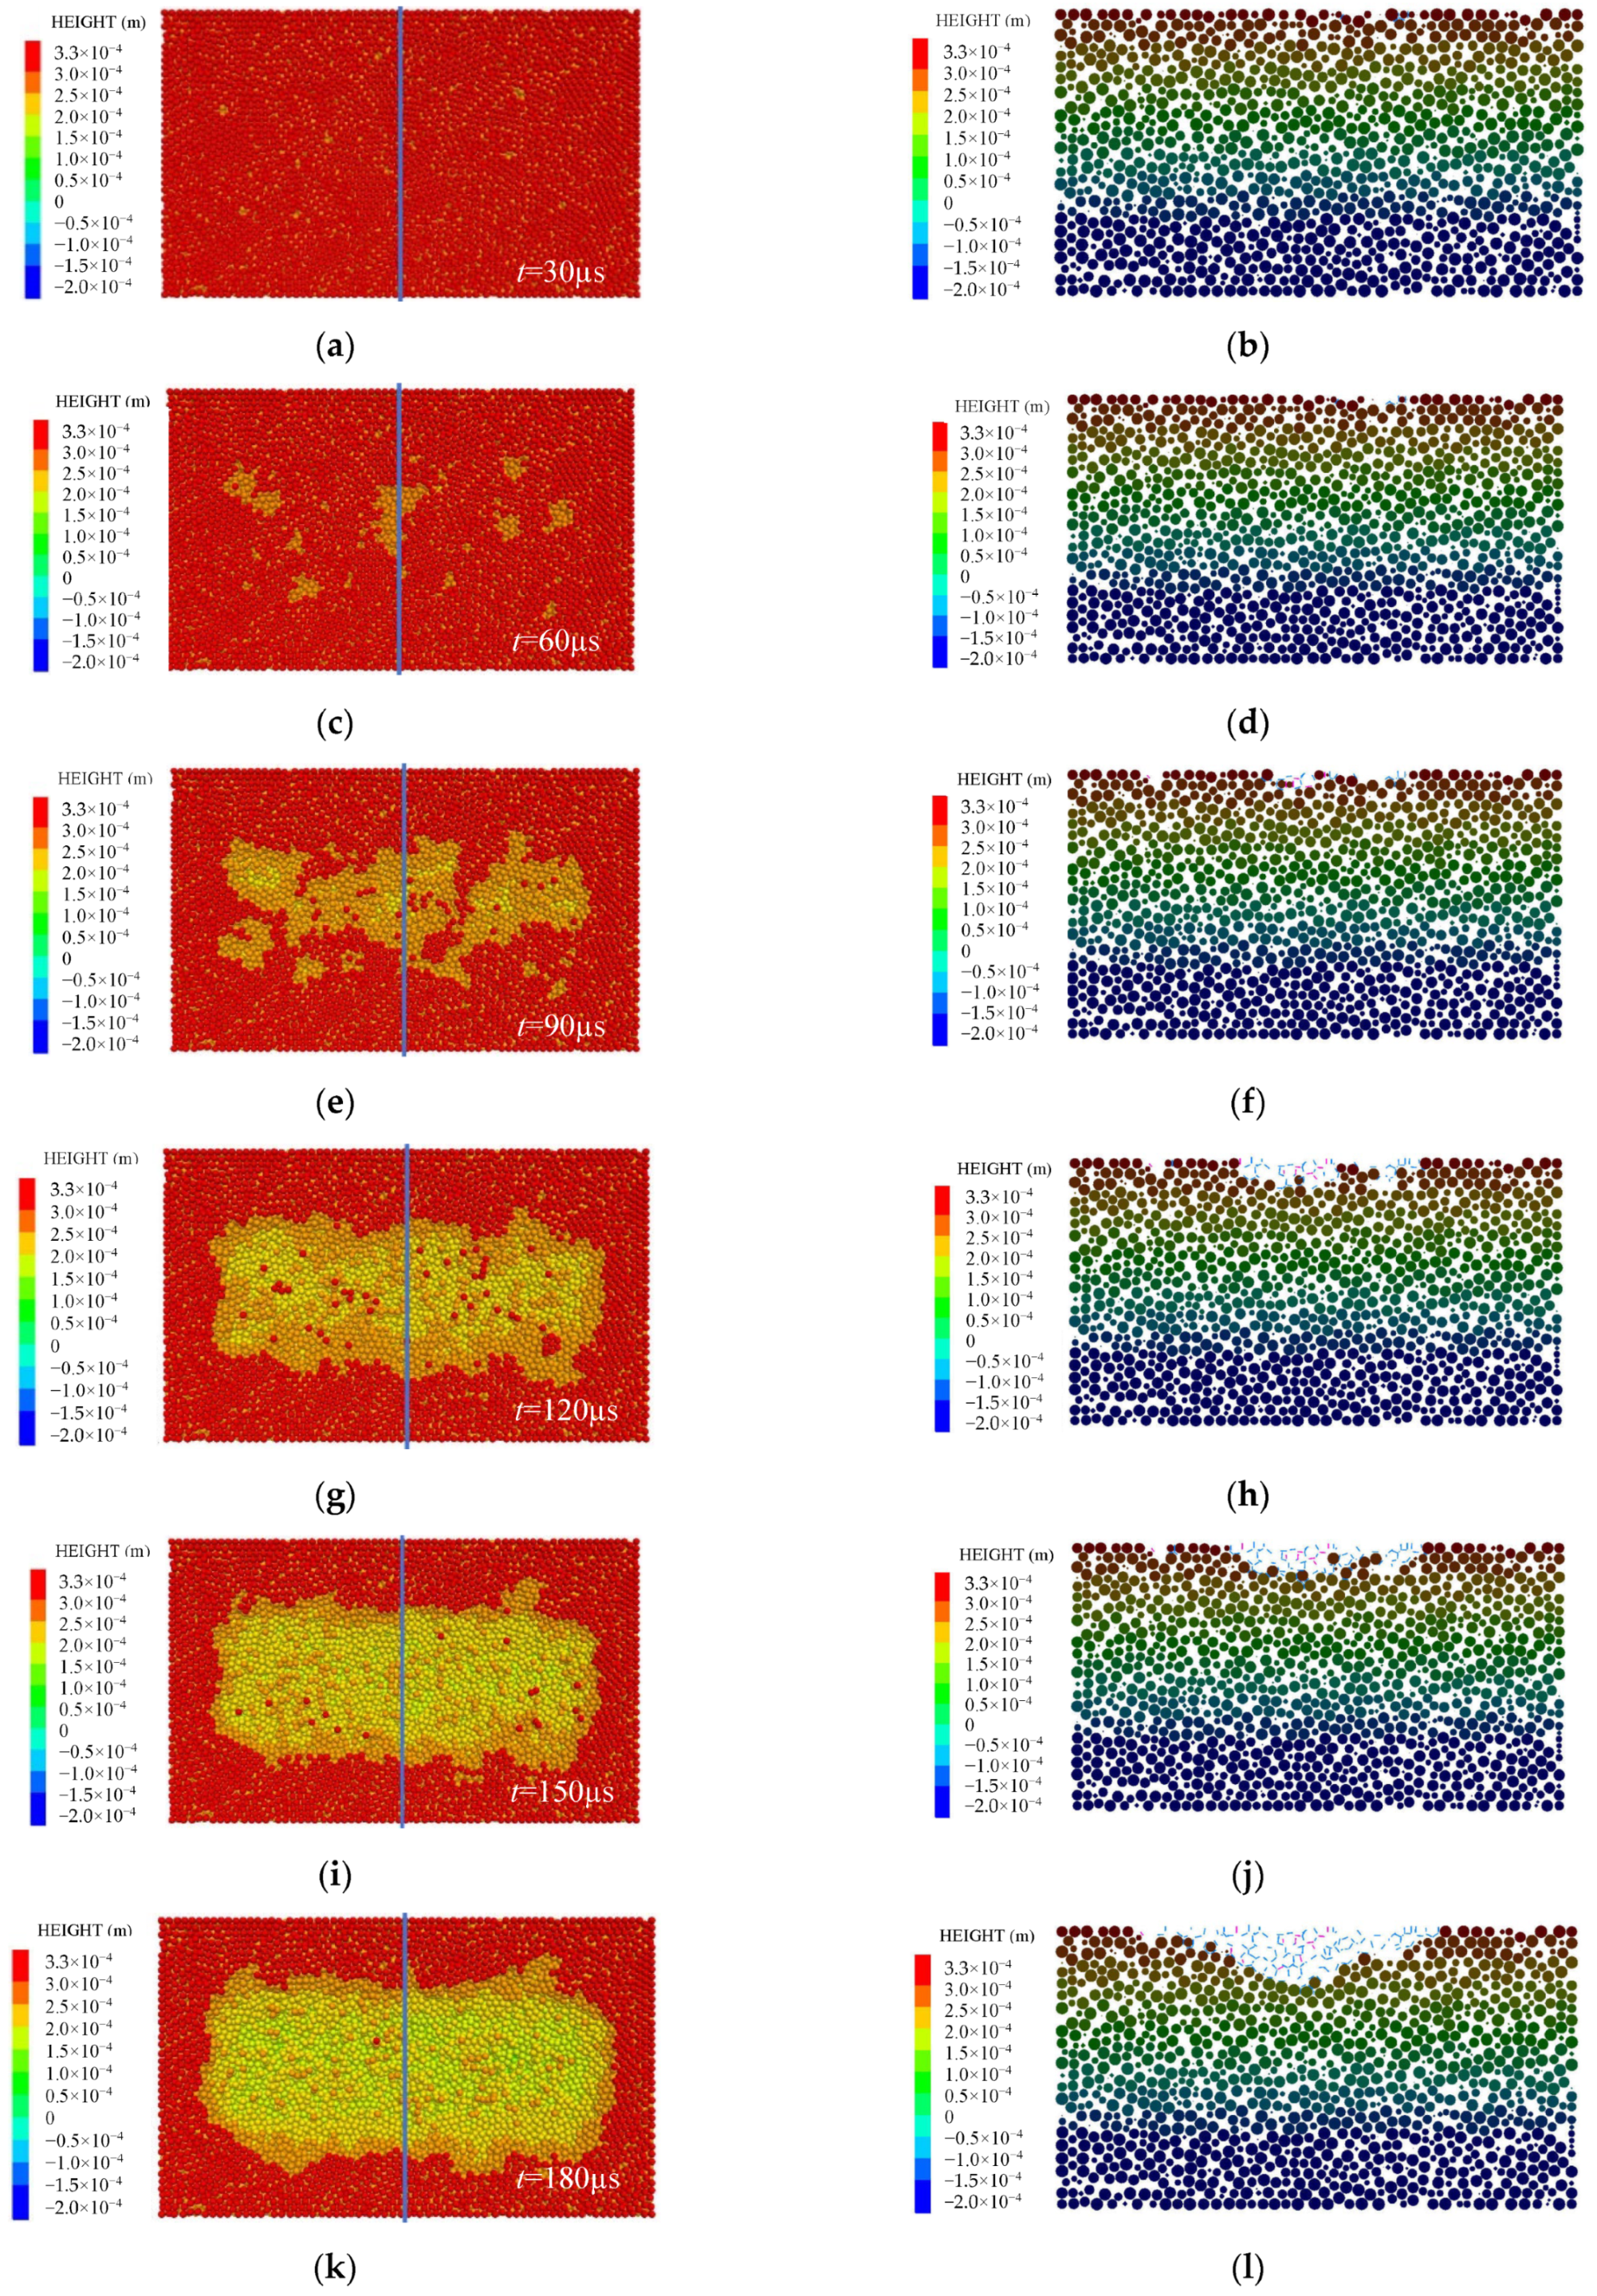
At 30 µs, the top view and cross-sectional view of the machined surface are shown in Figure 18a,b. It can be seen that there is no obvious erosion impression on the target surface. Since the number of newly generated cracks and the number of newly removed target particles are small, as discussed in Section 4.2.1, the erosion impression is not obvious.
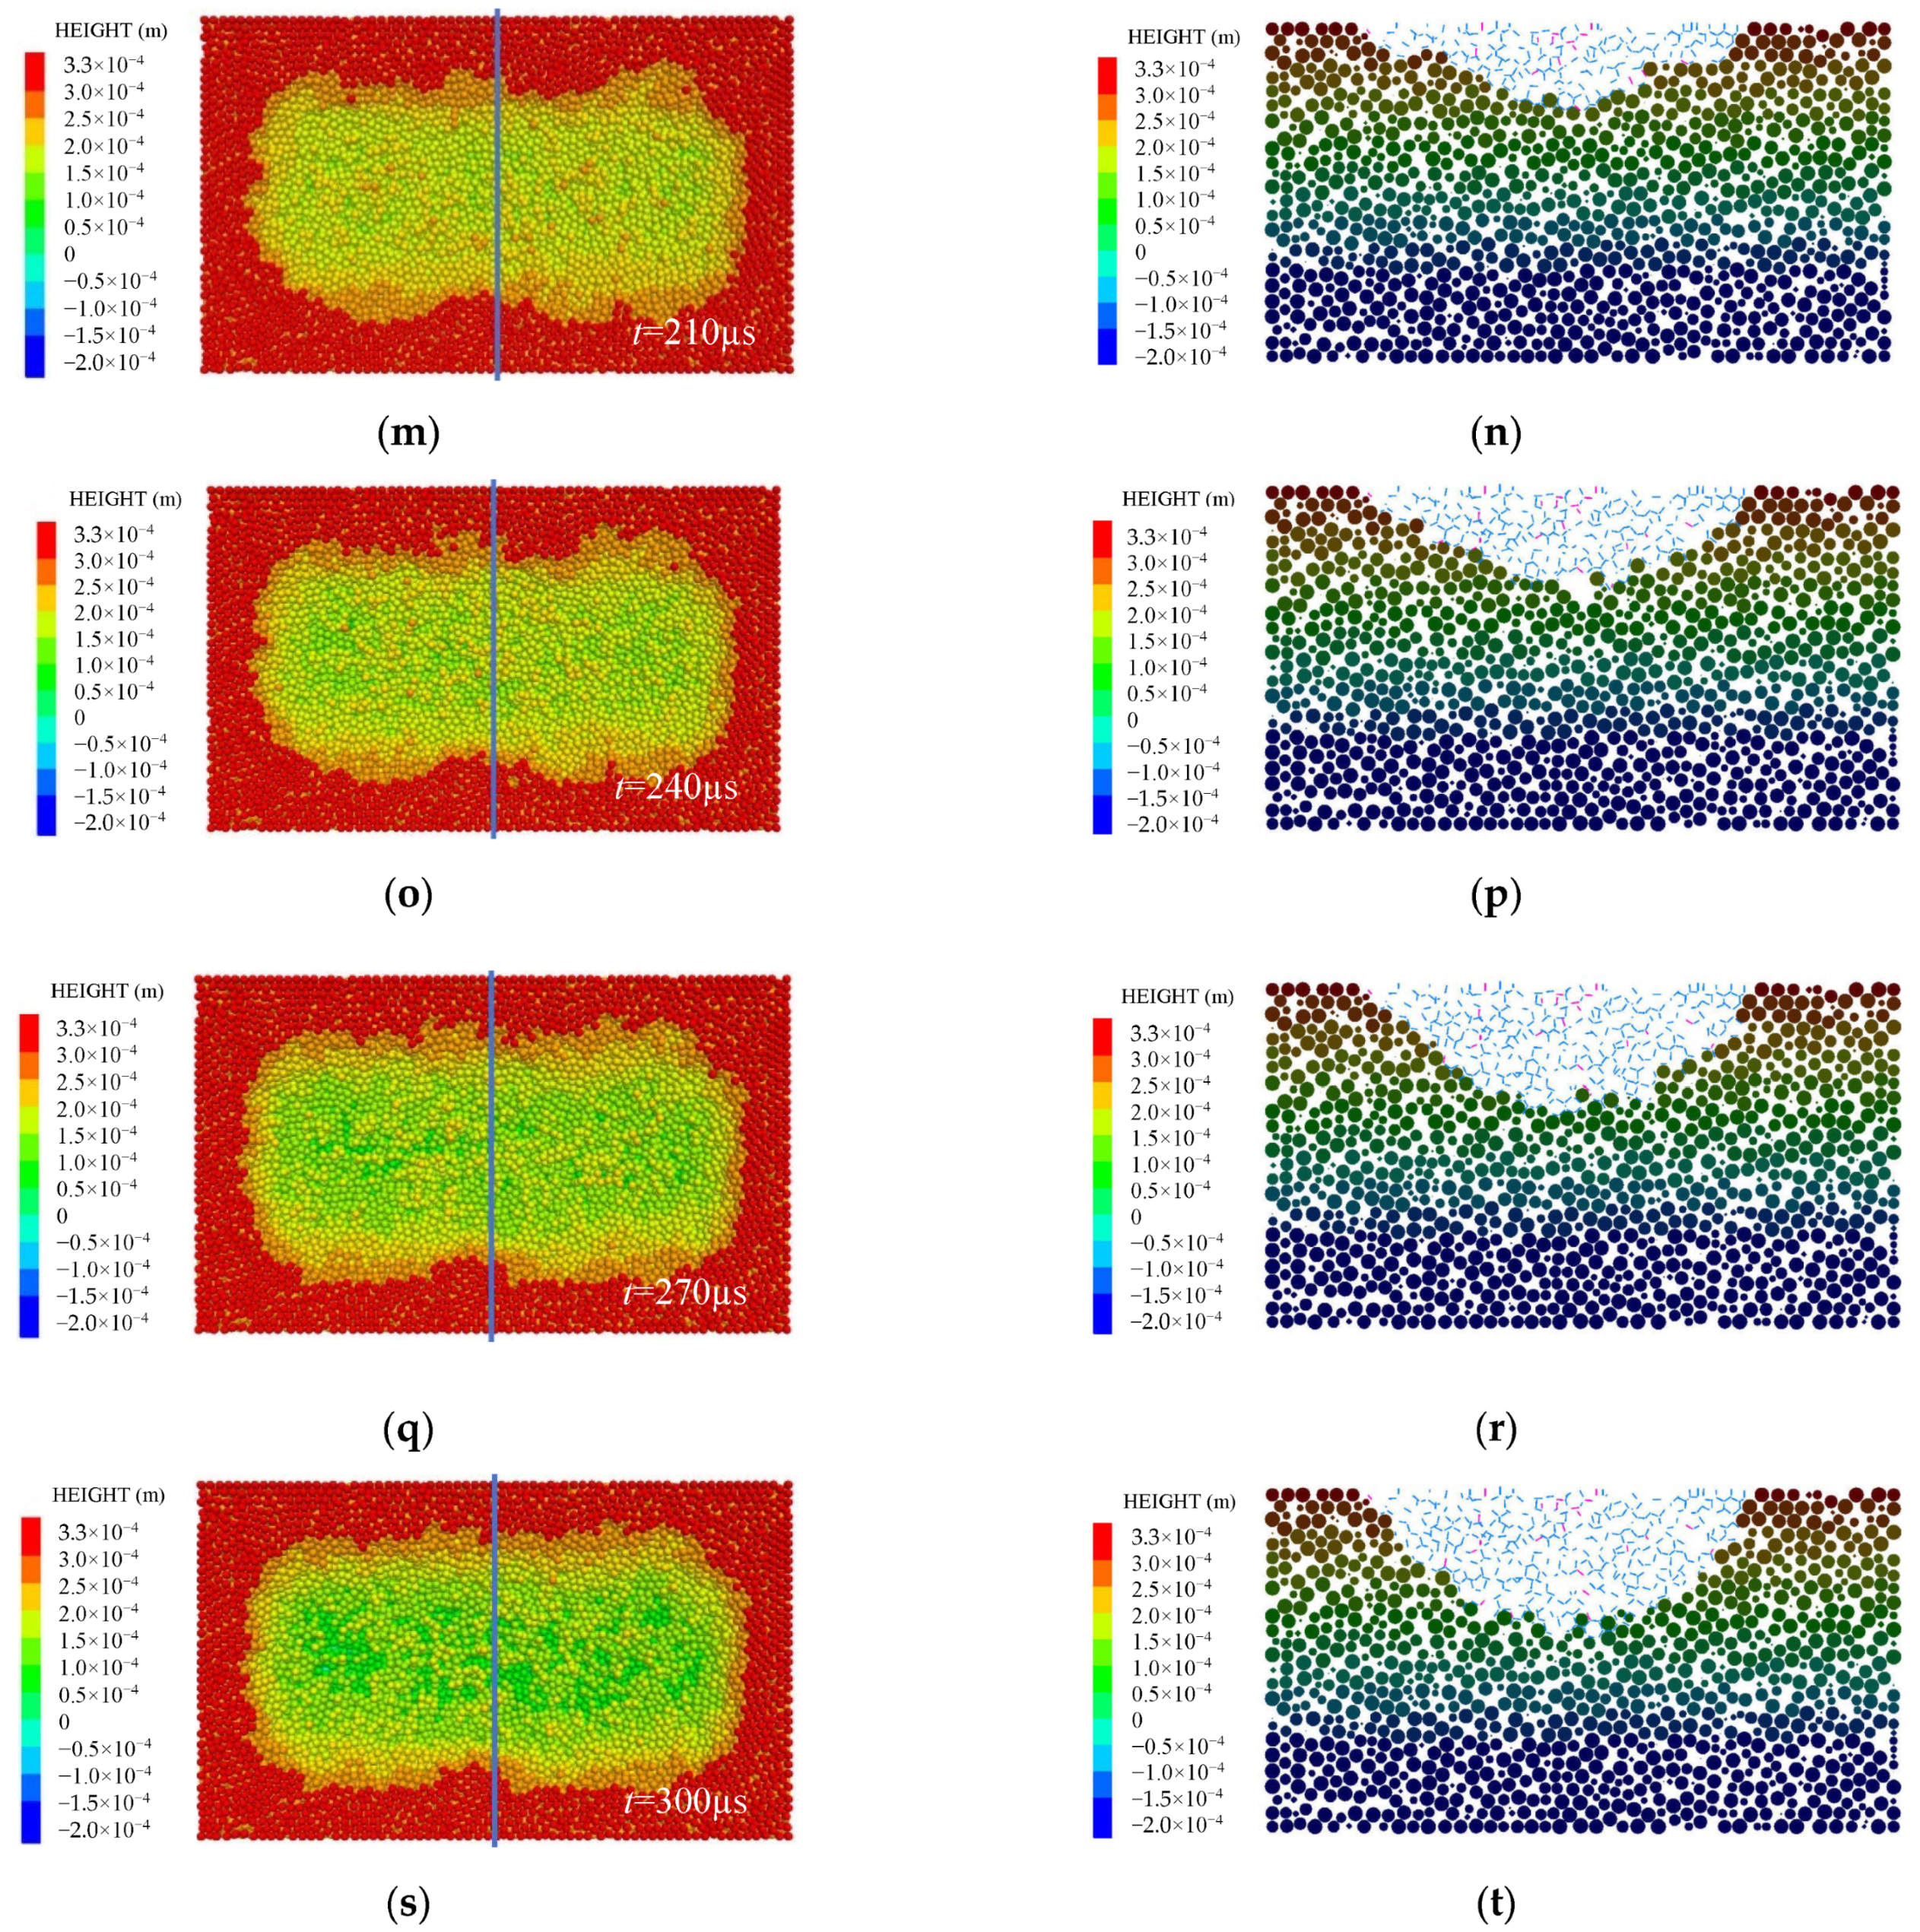
Figure 18.
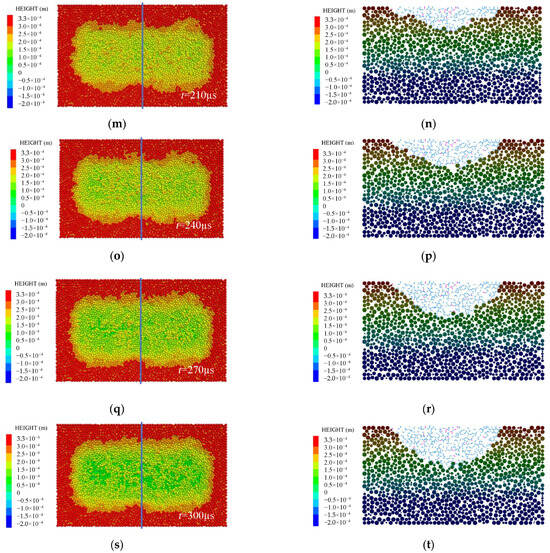
History of micro-channel formation (P = 0.4 MPa, sd = 1 mm, u = 1.5 mm/s, N = 4, α = 90°; (a,c,e,g,i,k,m,o,q,s) show top views of the machined surface at 30, 60, 90, 120, 150, 180, 210, 240, 270, and 300 µs, respectively; (b,d,f,h,j,l,n,p,r,t) show cross-sectional views of the machined surface at the same respective times).
At 60 µs, the top view and cross-sectional view of the machined surface are shown in Figure 18c,d. It can be seen that the erosion impression is shallow and discontinuous. As discussed in Section 4.2.1, the kinetic energy of abrasives is insufficient to break all the bonds simultaneously. When a target particle is impacted by more than one abrasive, it may be removed if all the surrounding bonds are broken. Otherwise, it remains in the substrate. Therefore, the erosion impression appears shallow and discontinuous.
At 90 µs, the top view and cross-sectional view of the machined surface are shown in Figure 18e,f. It can be seen that as the machining process progresses, the area and depth of the erosion impression increase.
At 120 µs, the top view and cross-sectional view of the machined surface are shown in Figure 18g,h. It can be seen that the erosion impression is continuous and a preliminary micro-channel has formed. The rim of the micro-channel is shallow and uneven, which is attributed to the higher concentration of abrasives at the center compared to the rim. More microcracks form in the central region, resulting in the removal of more target particles. At the rim of the jet, fewer abrasives are present, leading to fewer microcracks formed and less target particle removal. Therefore, the rim of the micro-channel is shallow and uneven.
At 150 µs, the top view and cross-sectional view of the machined surface are shown in Figure 18i,g. The rim of the micro-channel is deeper and more uniform than at 120 µs.
From 180 µs to 300 µs, the depth of the micro-channel continues to increase, while its width remains nearly constant. As discussed in Section 4.2.3, during the stable stage of the number of newly removed particles, the number of newly removed particles is relatively high in AAJ machining, resulting in a significant increase in the micro-channel depth. Since the width of the micro-channel depends on the diameter of the jet footprint, it cannot increase further, and remains almost unchanged during this stage.
5. Conclusions
A discrete element model has been developed and validated to simulate abrasive air jet machining of micro-channels on quartz crystals. The material removal mechanism, histories of newly generated cracks and removed targets, and the formation history of micro-channels are analyzed. A few findings are presented as follows:
- Opening mode cracks and shearing mode cracks are generated simultaneously by the impact of abrasives. The crack network, consisting of opening mode and shearing mode cracks, causes the removal of target particles. Opening mode cracks dominate the material removal process.
- The history of the number of newly generated cracks and the number of newly removed target particles can be divided into three stages: an incubation stage, a transitional stage, and a stable stage. Both the number of newly generated cracks and the number of newly removed target particles first increase and then decrease as the machining process progresses. The duration of the incubation stage decreases as air pressure increases. The maximum number of newly generated cracks and the number of newly removed target particles both increase with an increase in air pressure. An indicator called the “contribution rate”, which represents the contribution of newly generated cracks to target particle removal, is proposed. Damage occurs in the target substrate during abrasive air jet machining. The accumulation of this damage facilitates material removal.
- During abrasive air jet machining of micro-channels, a shallow and discontinuous erosion impression appears first. As the machining process progresses, the width and depth of the erosion impression increase. Subsequently, a shallow micro-channel with uneven edges is formed. Finally, the depth of the micro-channel gradually increases as the machining continues.
To enhance the simulation’s accuracy, the integration of a more sophisticated model for abrasive-particle interactions will be further investigated.
Author Contributions
Conceptualization, H.Y. (Haonan Yin) and Q.L.; methodology, H.Y. (Haonan Yin) and Q.L.; validation, H.Y. (Haonan Yin) and Q.L.; formal analysis, H.Y. (Haonan Yin) and Q.L.; investigation, H.Y. (Haonan Yin) and H.Y. (Huiye Yao); resources, H.Y. (Haonan Yin) and Q.L.; data curation, H.Y. (Haonan Yin) and Q.L.; writing—original draft preparation, H.Y. (Haonan Yin) and H.Y. (Huiye Yao); writing—review and editing, Q.L. and H.Y. (Huiye Yao); visualization, H.Y. (Haonan Yin); supervision, Q.L. and W.Z.; project administration, Q.L. and W.Z.; funding acquisition, Q.L. and W.Z. All authors have read and agreed to the published version of the manuscript.
Funding
This research was funded by National Natural Science Foundation of China (grant number 32102141).
Data Availability Statement
The data presented in this study are available on request from the corresponding author.
Conflicts of Interest
The authors declare no conflicts of interest.
References
- Du, H.H.; Zhao, D.P.; Liu, C.L.; Chen, H.W.; To, S. Laser-assisted slow tool servo diamond turning of single-crystal silicon for fabricating micro-lens arrays. J. Manuf. Process. 2024, 127, 174–183. [Google Scholar] [CrossRef] [Scilit]
- Zhang, J.C.; Zhang, J.J.; Cui, T.; Hao, Z.W.; Al Zahrani, A. Sculpturing of single crystal silicon microstructures by elliptical vibration cutting. J. Manuf. Process. 2017, 29, 389–398. [Google Scholar] [CrossRef] [Scilit]
- Li, H.; Lee, A.; Fan, J.; Yeoh, G.H.; Wang, J. On DEM–CFD study of the dynamic characteristics of high speed micro-abrasive air jet. Powder Technol. 2014, 267, 161–179. [Google Scholar] [CrossRef] [Scilit]
- Wang, J.; Moridi, A.; Mathew, P. Micro-grooving on quartz crystals by an abrasive air jet. Proc. Inst. Mech. Eng. Part C J. Mech. Eng. Sci. 2011, 225, 2161–2173. [Google Scholar] [CrossRef] [Scilit]
- Li, J.L.; Li, Q.L.; Deng, Y.F.; Zhang, W.P.; Yin, H.N. Micro-Abrasive Air Jet Machining Technology for Fabrication of Helical Grooves on Bovine Bone. Micromachines 2025, 16, 149. [Google Scholar] [CrossRef] [Scilit]
- Yang, R.B.; Li, Q.L.; Zhang, W.P.; Deng, Y.F.; Li, J.L. An Investigation into the Multi-Pass Radial-Mode Micro Abrasive Air Jet Turning of Fused-Silica Rods. Machines 2023, 11, 164. [Google Scholar] [CrossRef] [Scilit]
- Li, Q.; Deng, Y.; Li, J.; Shi, W. Roughness characterization and formation mechanism of abrasive air jet micromachining surface studied by power spectral density. J. Manuf. Process. 2020, 57, 737–747. [Google Scholar] [CrossRef] [Scilit]
- Fan, X.; Li, Q.; Zhang, W.; Yin, H. Multi-objective process parameter optimization for abrasive air jet machining using artificial bee colony algorithm. Machines 2025, 13, 964. [Google Scholar] [CrossRef] [Scilit]
- Li, H.; Wang, J.; Kwok, N.; Thai, N.; Yeoh, G. A study of the micro-hole geometry evolution on glass by abrasive air-jet micromachining. J. Manuf. Process. 2018, 31, 156–161. [Google Scholar] [CrossRef] [Scilit]
- Qi, H.; Fan, J.; Wang, J.; Li, H. Impact erosion by high velocity micro-particles on a quartz crystal. Tribol. Int. 2015, 82, 200–210. [Google Scholar] [CrossRef] [Scilit]
- Qi, H.; Fan, J.; Wang, J.; Li, H. On the erosion process on quartz crystals by the impact of multiple high-velocity micro-particles. Tribol. Int. 2016, 95, 462–474. [Google Scholar] [CrossRef] [Scilit]
- Zhu, G.; Li, H.; Wang, Z.; Zhang, T.; Liu, M. Semi-resolved CFD-DEM modeling of gas-particle two-phase flow in the micro-abrasive air jet machining. Powder Technol. 2021, 381, 585–600. [Google Scholar] [CrossRef] [Scilit]
- Nekahi, M.; Vazquez, E.; Papini, M. Numerical modeling of the erosion of alumina particulate reinforced epoxy-matrix composites: Material removal mechanisms including reinforcement fracture. Wear 2023, 522, 204710. [Google Scholar] [CrossRef] [Scilit]
- Kowsari, K.; Nouhi, A.; Hadavi, V.; Spelt, J.; Papini, M. Prediction of the erosive footprint in the abrasive jet micro-machining of flat and curved glass. Tribol. Int. 2017, 106, 101–108. [Google Scholar] [CrossRef] [Scilit]
- Nouhi, A.; Kowsari, K.; Spelt, J.; Papini, M. Abrasive jet machining of channels on highly-curved glass and PMMA surfaces. Wear 2016, 356, 30–39. [Google Scholar] [CrossRef] [Scilit]
- Zhang, G.; Sun, Y.; Gao, H.; Liu, X.; Zuo, D. Characteristics of cryogenic abrasive air-jet direct-write machining: A comparison with abrasive air-jet direct-write machining at oblique angles. J. Mater. Process. Technol. 2022, 299, 117394. [Google Scholar] [CrossRef] [Scilit]
- Liu, Z.N.; Qiao, Y.; Suo, Y.F.; Diao, H.Y. Discrete Element Simulation on the Evolution Mechanism of Excavation Damage Zone in Deep-Buried Tunnels Under Confining Pressure and Comprehensive Structural Planes. Geosciences 2025, 15, 443. [Google Scholar] [CrossRef] [Scilit]
- Dong, Q.G.; Li, C.X.; Liu, H.M.; Liu, Q.W.; Xu, Y. Research on Crack Propagation in Hard Rock Coal via Hydraulic Fracturing. Appl. Sci. 2025, 15, 11696. [Google Scholar] [CrossRef] [Scilit]
- Li, H.; Wang, J.; Fan, J. Analysis and modelling of particle velocities in micro-abrasive air jet. Int. J. Mach. Tools Manuf. 2009, 49, 850–858. [Google Scholar] [CrossRef] [Scilit]
- Melentiev, R.; Fang, F.Z. Fabrication of micro-channels on Co-Cr-Mo joints by micro-abrasive jet direct writing. J. Manuf. Process. 2020, 56, 667–677. [Google Scholar] [CrossRef] [Scilit]
- Shafagh, S.; Papini, M. The effects of blast lag in abrasive jet machined micro-channel intersections. Precis. Eng. 2020, 62, 162–169. [Google Scholar] [CrossRef] [Scilit]
- Zhu, G.; Li, H.; Zhang, T.; Liu, M. Modeling and simulation of micro-hole fabrication on brittle material using abrasive air jet machining. J. Manuf. Process. 2021, 72, 361–374. [Google Scholar] [CrossRef] [Scilit]
- Song, J.; Liu, J.; Song, R. Study on optimization of 3DP rock elastoplastic properties: Coupling experimental and DEM simulation. Processes 2025, 13, 3940. [Google Scholar] [CrossRef] [Scilit]
- Li, J.; Yu, J.; Xu, W.; Li, X.; Fu, T.; Deng, L. Influence of cutter ring structure on rock-breaking force and efficiency of TBM disc cutter based on discrete element method. Buildings 2025, 15, 3050. [Google Scholar] [CrossRef] [Scilit]
- Ma, H.; Xia, X.; Zhou, L.; Xu, C.; Liu, Z.; Song, T.; Zou, G.; Liu, Y.; Huang, Z.; Liao, X.; et al. A comparative study of the performance of different particle models in simulating particle charging and burden distribution in a blast furnace within the DEM framework. Energies 2023, 16, 3890. [Google Scholar] [CrossRef] [Scilit]
- Melentiev, R. Physical theories of solid particle erosion and abrasive jet wear. J. Manuf. Process. 2023, 106, 422–452. [Google Scholar] [CrossRef] [Scilit]
- Arani, N.H.; Eghbal, M.; Papini, M. Modeling the solid particle erosion of rubber particulate-reinforced epoxy. Tribol. Int. 2021, 153, 106656. [Google Scholar] [CrossRef] [Scilit]
- Dehnadfar, D.; Friedman, J.; Papini, M. Laser shadowgraphy measurements of abrasive particle spatial, size and velocity distributions through micro-masks used in abrasive jet micro-machining. J. Mater. Process. Technol. 2012, 212, 137–149. [Google Scholar] [CrossRef] [Scilit]
- Stevenson, A.N.J.; Hutchings, I.M. Scaling laws for particle velocity in the gas-blast erosion test. Wear 1995, 181, 56–62. [Google Scholar] [CrossRef]
- Veld, F.; Slikkerveer, P. Towards prediction of flux effects in powder blasting nozzles. Wear 1998, 215, 131–136. [Google Scholar] [CrossRef] [Scilit]
- Andrews, D.R.; Horsfield, N. Particle collisions in the vicinity of an eroding surface. J. Appl. Phys. 1983, 16, 525. [Google Scholar] [CrossRef] [Scilit]

Disclaimer/Publisher’s Note: The statements, opinions and data contained in all publications are solely those of the individual author(s) and contributor(s) and not of MDPI and/or the editor(s). MDPI and/or the editor(s) disclaim responsibility for any injury to people or property resulting from any ideas, methods, instructions or products referred to in the content. |
© 2026 by the authors. Licensee MDPI, Basel, Switzerland. This article is an open access article distributed under the terms and conditions of the Creative Commons Attribution (CC BY) license.