


Abstract
Laser local forming is an effective method for reshaping optical glass, yet the deformation of the material during the cooling phase remains poorly understood. This study investigates the dynamic evolution of the molten pool, specifically focusing on the transition from an initial convex shape to a final “M-shaped” profile. A combined approach using thermal-fluid simulation and high-speed imaging experiments was employed to track the surface changes throughout the heating and cooling cycles. The results show that while the surface bulges outward during laser irradiation, the material redistributes after the laser is switched off due to non-uniform cooling and volumetric shrinkage. The specific roles of viscosity and surface tension in driving this reverse flow were identified. Furthermore, the study established a quantitative model linking laser parameters to the final surface dimensions, providing a reliable tool for predicting and controlling the precision of glass forming.
1. Introduction
With the rapid advancement of high-end optical technologies, the demand for high-precision and complex glass optical components has been steadily increasing in fields such as optical communication, imaging sensors, and advanced display systems [1,2]. However, traditional surface fabrication methods, including mechanical cutting, nanoimprint lithography, electrochemical etching, and inkjet deposition [3,4,5,6], still face significant challenges in terms of processing flexibility and efficiency. Mechanical cutting tends to induce surface microcracks; nanoimprint lithography is limited by mold durability and the aspect ratio of fabricated structures; electrochemical etching offers poor local control; and inkjet deposition suffers from restricted precision in droplet control. These limitations hinder the further development of glass optical component manufacturing technologies. Laser selective forming technology, as a highly promising process, has been applied in the high-precision manufacturing of optical glass due to its high spatial resolution, controllable energy input, and non-contact processing characteristics [7,8]. In this method, laser irradiation locally heats and softens the glass, enabling rapid and controllable reshaping of optical surfaces.
In recent years, the morphological evolution and internal flow of the molten pool during laser processing have become key research topics [9,10]. Numerous studies have shown that both the heating and cooling stages of the molten pool are strongly influenced by thermally driven fluid motion and surface tension variations, which together determine the final geometric features and quality of the formed surface. Jin et al. [11] reported that during localized laser irradiation of metallic materials, non-uniform energy distribution can significantly enhance Marangoni convection, thereby altering the internal temperature gradient of the molten pool and affecting the final solidification morphology of the metal melt. Ni et al. [12] revealed in their thermodynamic study of AlSi10Mg alloys that the coupling among laser power, irradiation duration, and latent heat of phase transition determines the aspect ratio of the molten pool, while the cooling rate and movement of the solid–liquid interface jointly influence the residual stress distribution and overall forming accuracy.
Compared with metals, glass exhibits much higher viscosity, the absence of a melting–solidification phase transition, and extremely strong temperature-dependent rheology under laser irradiation. Skiba et al. [13] achieved high-precision microstructure formation of borosilicate glass materials using femtosecond laser irradiation without material removal. Nishida et al. [14] observed SiO2 migration toward cooler regions in high-temperature silicate melts under extreme thermal gradients. This phenomenon indicates that compositional segregation may occur within glass melts under strong thermal fields, potentially affecting flow stability. Shen et al. [15] pointed out that viscous flow and volume redistribution occur when glass enters a thermally softened state, and localized melting followed by rapid cooling can lead to the formation of M-shaped uneven surfaces. Leung et al. [16] further found in additive manufacturing research that metal materials tend to produce spattering during processing, whereas the high viscosity of glass suppresses the Marangoni effect, thereby reducing spatter formation.
In summary, most existing studies have focused on metal forming or non-metal joining and scanning processes, while little attention has been given to the dynamic evolution of the molten pool in glass materials during the cooling stage of curved surface forming. In this phase, variations in temperature gradient and surface tension can reverse the internal melt flow direction, causing the surface morphology to transition from an initially Gaussian-shaped bulge to a characteristic “M-shaped” contour. The morphological evolution occurring in this period directly determines the final optical surface accuracy and curvature distribution. However, current models fail to adequately capture the viscoelastic constraints induced by density recovery and viscosity increase during cooling. Although experimental approaches can characterize the final solidified surface morphology, they still lack the ability to directly and quantitatively observe the continuous transformation process. Therefore, developing a predictive model that describes the surface evolution of the glass molten pool throughout the entire processing cycle is of great importance for achieving controllable forming of optical glass surfaces.
This study addresses the deformation behavior of the molten pool surface during the cooling stage of laser selective forming of optical glass, elucidating its reshaping mechanism and evolution characteristics. A multiphysics fluid dynamic model based on non-isothermal viscous flow was developed to simulate the laser heating and cooling shrinkage processes, capturing the temporal evolution of temperature, flow, and surface morphology. Experimental observations validated the simulation results, showing strong agreement in temperature distribution and surface evolution. The effects of volumetric shrinkage, viscoelastic recovery, and Marangoni flow on the final morphology were further analyzed. Based on these findings, a quantitative prediction model was established to relate processing parameters to the final solidified surface profile.
2. Theoretical Model Description
The evolution of glass surface morphology under laser irradiation is a multi-scale process [17,18]. During the irradiation phase, the Gaussian energy distribution of the laser induces localized nonlinear photothermal conversion, forming an axisymmetric molten region with a significant temperature gradient [19,20,21]. The combined effects of thermal expansion and surface tension gradients establish a quasi-steady convex morphology. At this stage, the viscosity of the melt allows viscous relaxation to dominate the morphological evolution.
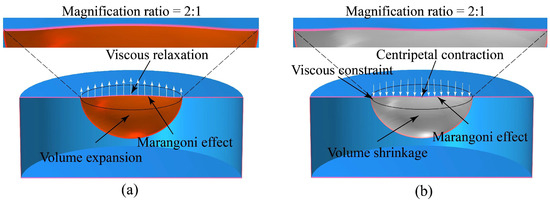
During the cooling phase, as the temperature drops below the glass transition temperature, heterogeneous thermal shrinkage strain develops due to the non-uniform thermal diffusivity of glass, leading to preferential solidification at the periphery of the molten pool. The viscosity of glass follows the Vogel–Fulcher–Tammann equation [22], causing a sharp viscosity increase at the periphery, which freezes the flow state, while the central region remains in a metastable viscous state. As the temperature continues to decrease, the solidified peripheral layer imposes viscous constraints on the central molten region, inducing centripetal contraction. This process ultimately results in the formation of a characteristic M-shaped surface topography. The surface shapes of the glass melting pool before and after cooling are shown in Figure 1.
Figure 1.
Schematic illustration of the glass melt pool evolution: (a) During laser irradiation; (b) After cooling.
3. Experiment Device and Methods
3.1. Experimental System and Equipment
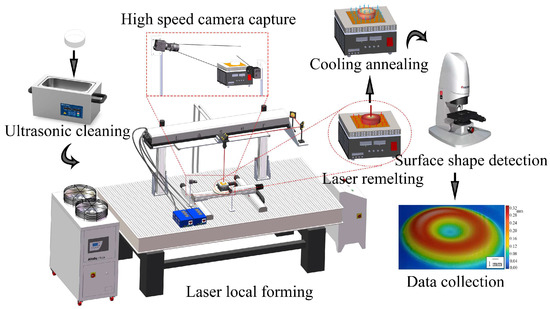
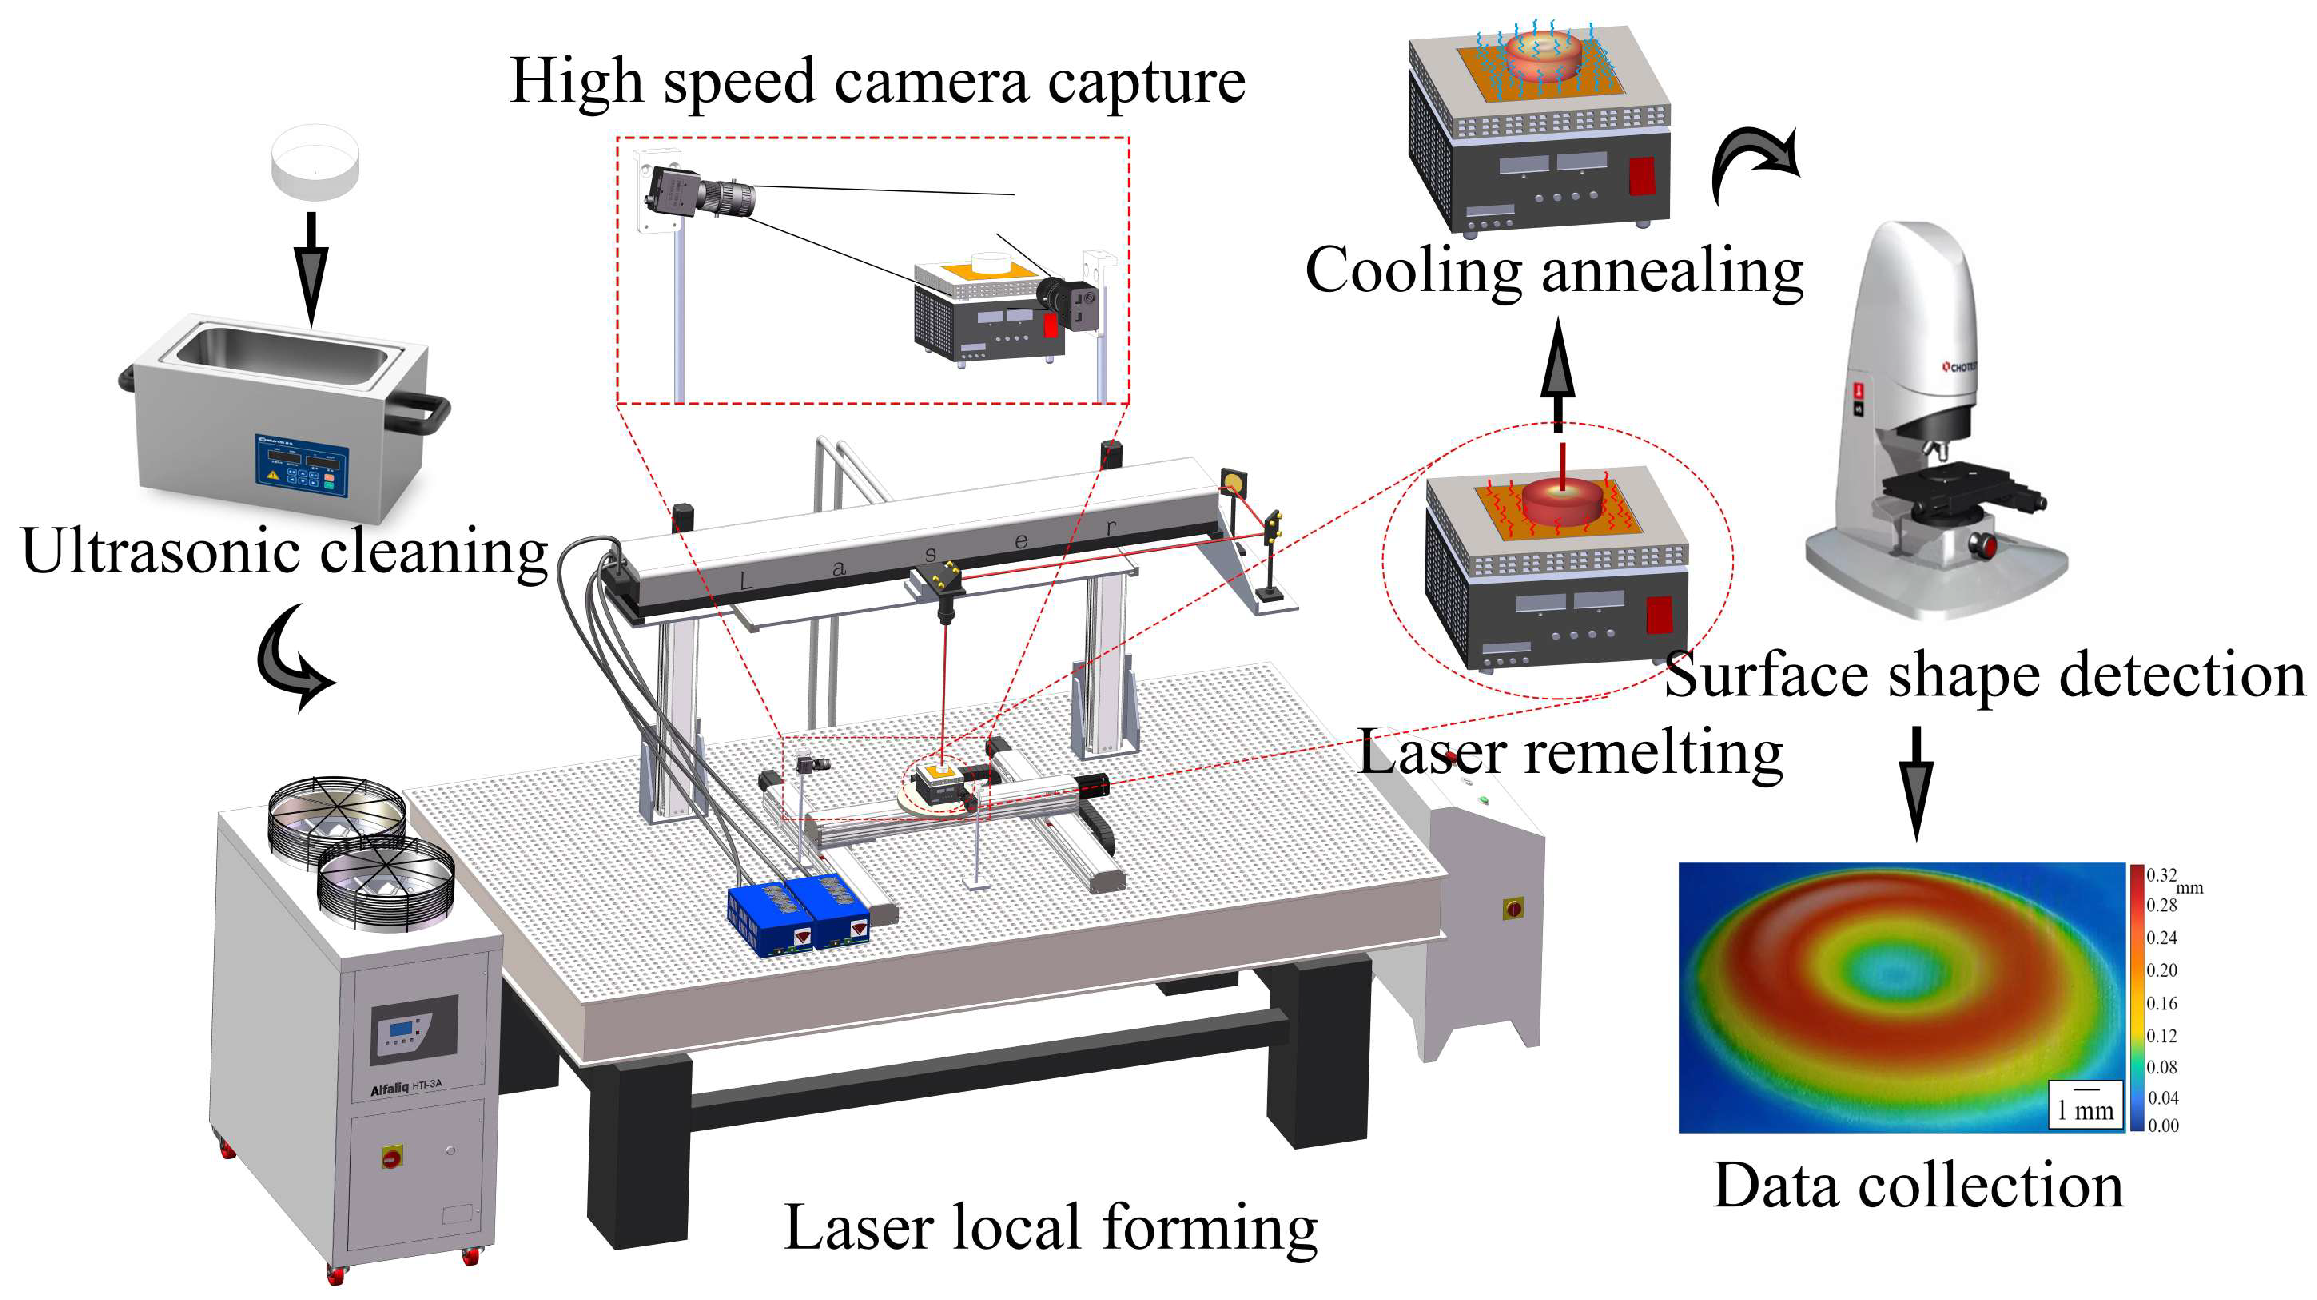
A schematic diagram of the experimental setup for laser selective forming of optical glass is shown in Figure 2. The system primarily consists of a CO2 laser source, a ZnSe focusing lens, a high-precision three-axis translation stage, a heating platform, an ultrasonic cleaning unit, and two synchronized high-speed imaging systems.
Figure 2.
Schematic diagram of the laser selective forming experimental setup.
The glass samples used in this study were cylindrical K9 optical glass specimens (Cheng Zhuo Optoelectronic Technology Co., Ltd., Dong Guan, China) with a diameter of 40 mm and a height of 15 mm. Before each experiment, the samples were sequentially cleaned in acetone and ethanol using a 120 W, 40 kHz ultrasonic cleaner (Kemet International Ltd., Maidstone, UK). This pretreatment ensured complete removal of surface contaminants, promoting uniform laser absorption and guaranteeing experimental repeatability.
The laser source employed was a continuous-wave CO2 laser (wavelength: 10.6 μm) with an adjustable output power range of 30–200 W. The beam was focused onto the glass surface through a ZnSe lens with a focal length of 50.8 mm, producing a Gaussian intensity profile. Laser power stability (±1.5%) was verified using an infrared beam analyzer, and all ambient conditions were maintained constant to ensure thermal repeatability. The glass samples were mounted on a precision XYZ translation stage (positioning accuracy ± 1 μm), allowing accurate laser alignment and ensuring geometric symmetry of the molten pool. The laser head moved vertically along the Z-axis, while the X–Y platform enabled fine sample positioning.
Based on the preliminary experiments and simulation tests, we have determined the range of laser power (60–100 W) and the range of light spot radius (7–8 mm). When the laser power is below this range, the deformation of the glass surface is too small, while higher laser power will cause excessive softening or even ablation. Similarly, the selected light spot radius can ensure that the observed molten pool area is within a reasonable range, while avoiding excessive thermal gradients and surface damage. This parameter range enables the formation of a clear molten pool in a repeatable manner and allows for systematic research on the surface evolution during the heating and cooling stages.
To capture transient molten pool behavior and surface deformation, two Phantom VEO 1310 high-speed cameras (Vision Research Inc., Wayne, NJ, USA) were employed: one for top observation at a 45-degree angle, and the other for parallel recording from the side. Both cameras operated at 14,350 frames per second with a resolution of 1280 × 720 pixels. The high-speed cameras were mainly used for qualitative observation of the transient evolution of the molten pool and surface morphology, including the transition from a flat surface to a convex bulge during laser irradiation and the subsequent transformation towards an M-shaped profile during cooling. The captured images were used to reveal the dynamic deformation mechanisms and validate the physical assumptions of the simulation. During irradiation, the glass surface temperature was monitored by an infrared pyrometer.
After laser irradiation, in order to reduce residual stress, the sample was transferred to the annealing furnace for cooling. During the entire cooling process, high-speed imaging continuously recorded the changes on the surface.
3.2. Data Measurement and Processing
After laser treatment, we employed a combined method of optical, thermal and geometric measurements to characterize the deformation and cooling contraction behavior of the glass surface. During the irradiation process, a high-speed camera was used to capture the changes in the shape of the molten pool in real time, in order to record the deformation process of the surface profile.
To verify the accuracy of the numerical simulation, we measured the surface temperature at a fixed position using an infrared high-temperature meter during both the heating and cooling stages. The temperature-time curves were compared with the temperature from the simulation, allowing for the calibration of key thermal parameters and the confirmation of the reliability of the simulation model.
After the sample cooled to room temperature, the final surface profile was measured using a Taylor Hobson PGI surface profilometer (Taylor Hobson Ltd., Leicester, UK). The obtained three-dimensional shape data were used to quantify the surface morphology of the glass.
3.3. Experimental Procedure
The experimental procedure consisted of three main stages:
- (1)
- The cleaned K9 glass samples were placed on a heating stage and preheated to the specified temperature. The laser spot radius was then adjusted, and the beam was aligned to coincide with the center of the glass surface. Throughout the experiment, the ambient temperature was kept constant to minimize environmental disturbances and ensure process stability.
- (2)
- Under the preset power and spot radius conditions, the laser beam was vertically irradiated onto the glass surface. During the irradiation process, a synchronous high-speed camera and an infrared temperature measuring instrument were used to continuously monitor the surface morphology and temperature of the glass.
- (3)
- After the laser was switched off, the sample was initially cooled in ambient conditions before being transferred to the annealing furnace. High-speed imaging continued during the early cooling phase to capture viscoelastic shrinkage and shape inversion. Finally, post-cooling samples were analyzed to quantify surface variation deformation.
4. Simulation
The temperature-dependent viscosity of glass plays a decisive role in determining the flow pattern and the evolution of the melt pool. Unlike metals, the viscosity of glass changes exponentially with temperature, spanning over a dozen orders of magnitude from the solid state to the high-temperature softening state. This significant change leads to the gradual transition of glass from a solid to a highly viscous fluid during heating, which fundamentally determines whether macroscopic flow will occur.
Unlike the traditional solid–liquid phase change model, this study treats the laser-irradiated glass as a thermally driven high-viscosity fluid. In the simulations, the relaxation behavior of glass during both laser heating and cooling is described using a temperature-dependent viscosity. During laser irradiation, the rapid temperature rise leads to a strong reduction in viscosity, allowing viscous flow and surface deformation. During cooling, the viscosity increases with decreasing temperature, progressively suppressing flow and eventually freezing the surface morphology. The fictive temperature is not explicitly introduced. Since this study focuses on surface morphology evolution rather than detailed structural relaxation, the viscosity-based description provides a reasonable approximation. This model was implemented using COMSOL Multiphysics 6.1 and can continuously calculate the temperature, fluid, and free surface morphology during the laser heating and subsequent cooling contraction stages. The model was implemented using the Heat Transfer in Solids, Laminar Flow, and Moving Mesh (ALE) modules in COMSOL Multiphysics 6.1, which were fully coupled to solve the thermo-fluid interaction during laser heating and cooling.
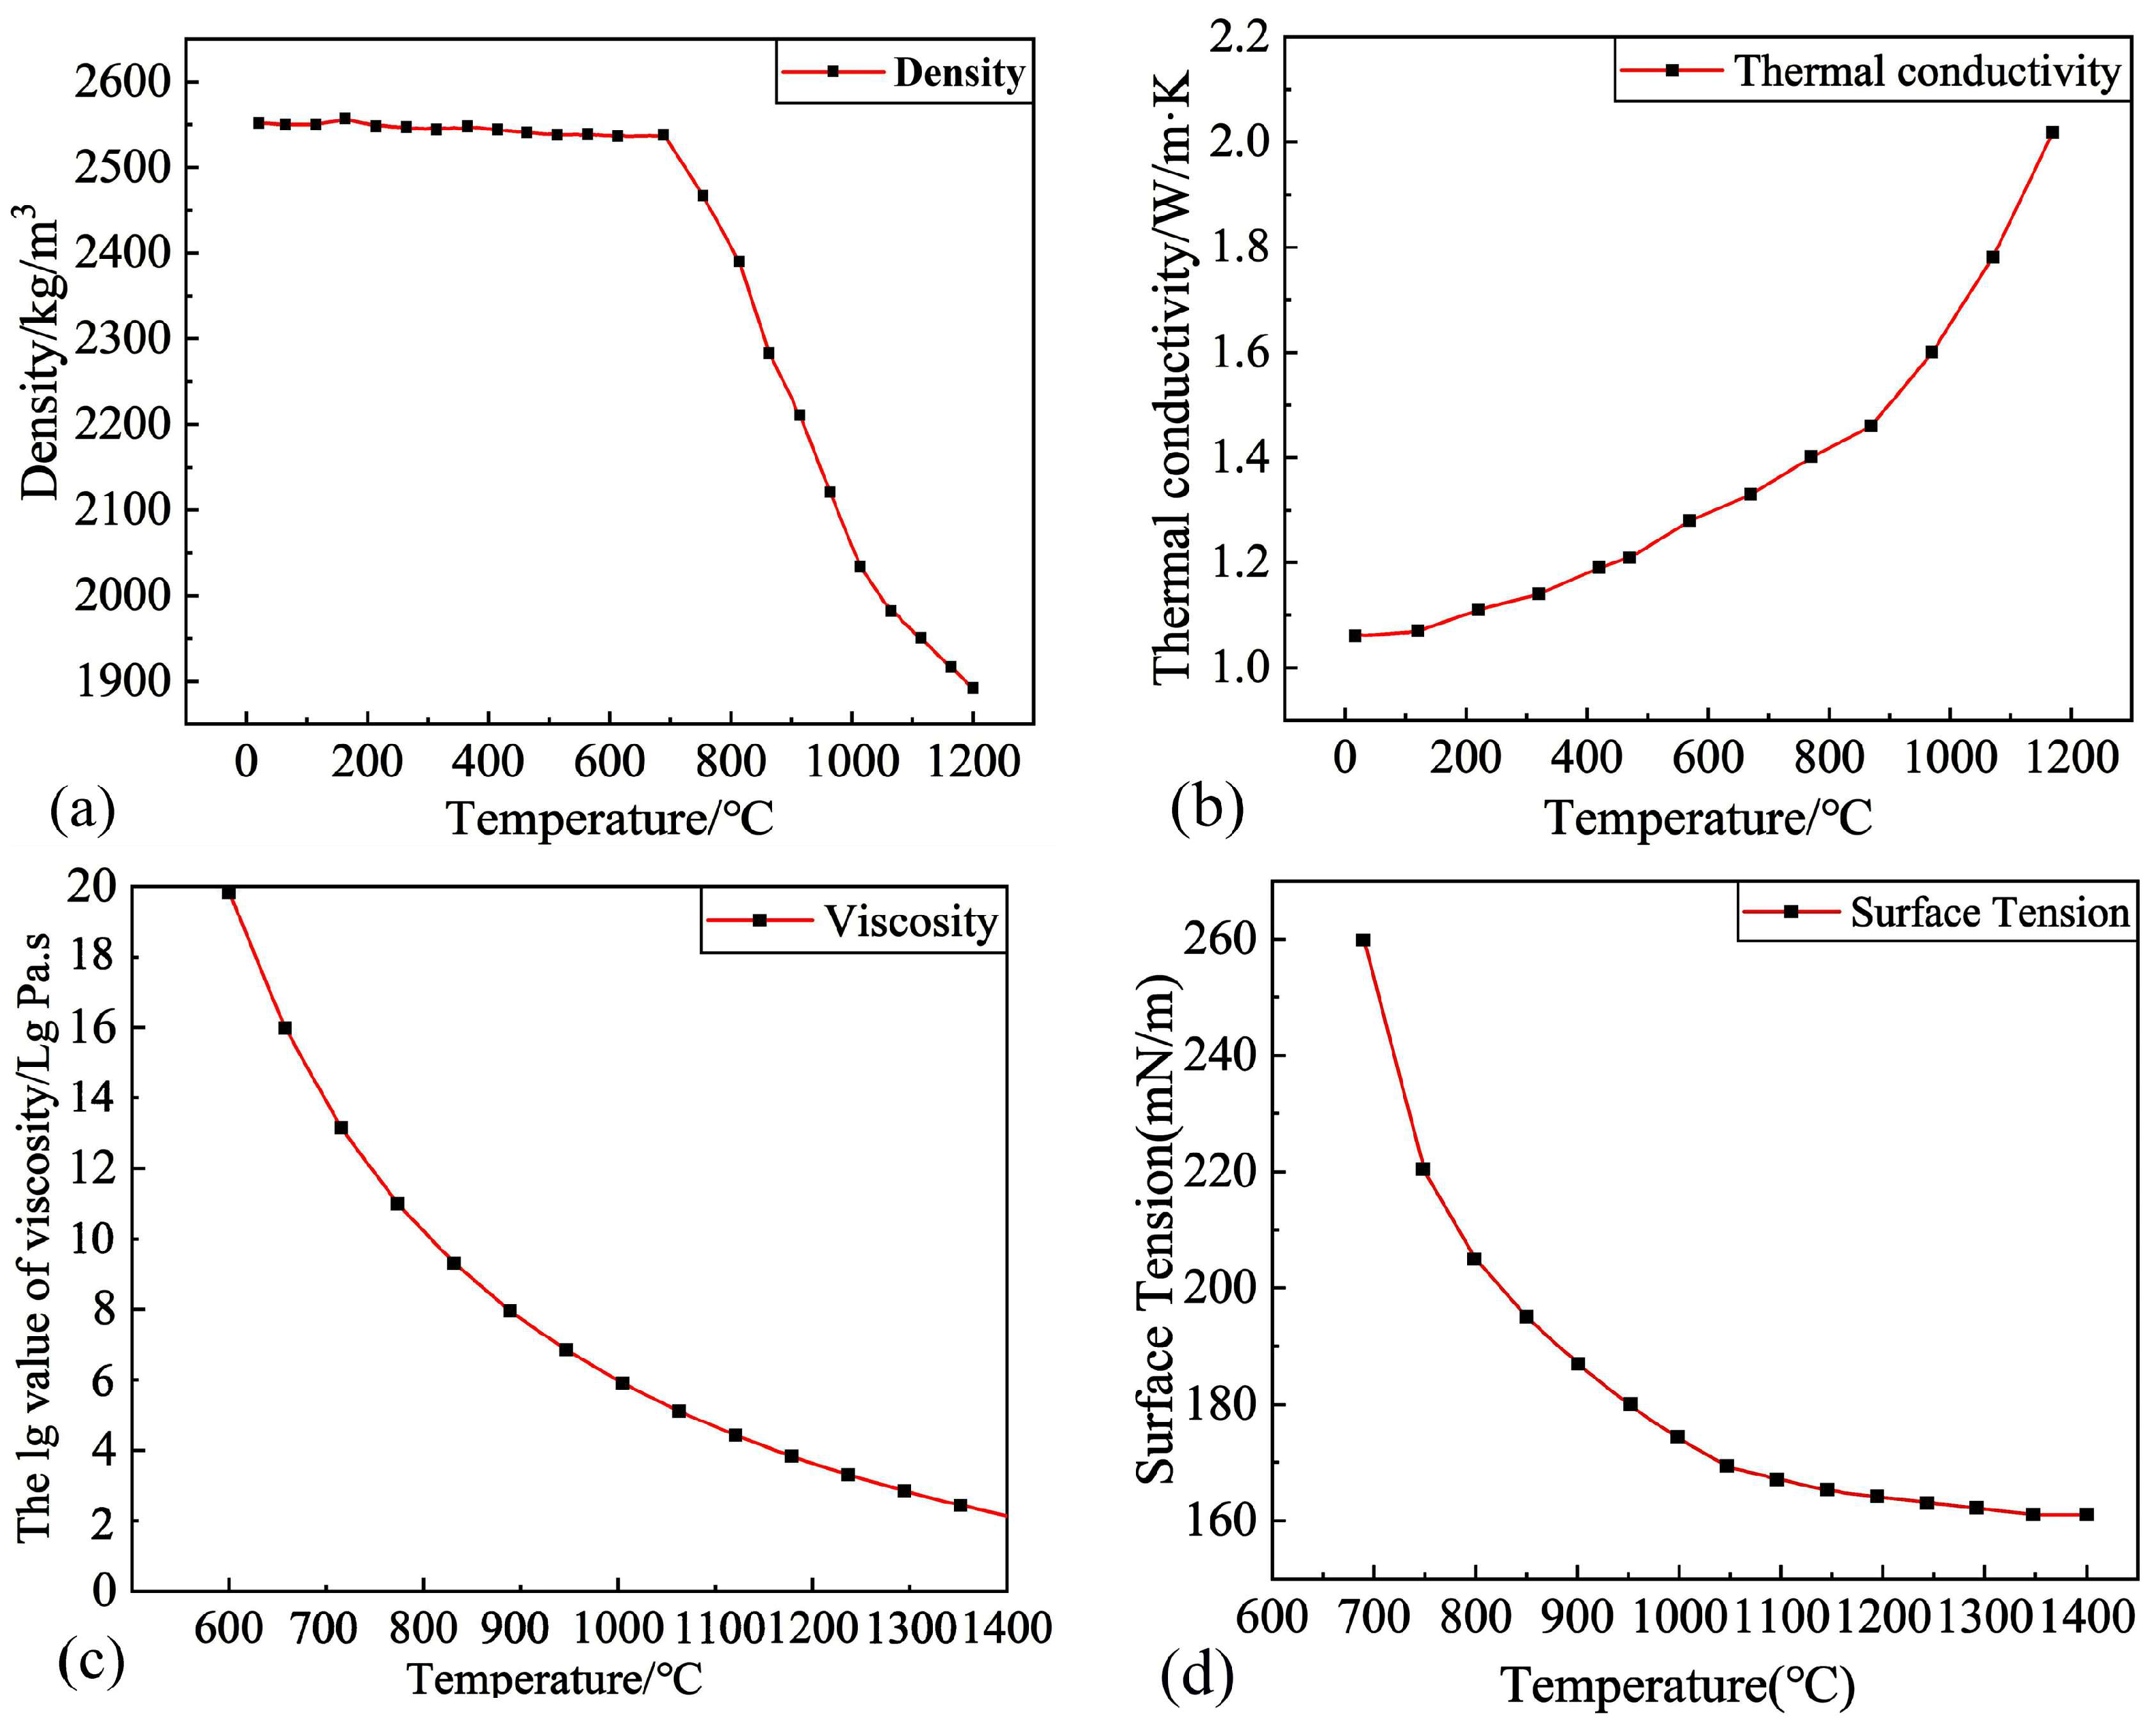
The multiphysics framework integrates fluid dynamics, heat transfer, and a moving mesh (ALE) interface. The model explicitly accounts for Marangoni convection and non-isothermal flow effects, where surface tension gradients drive the fluid motion. The Marangoni effect causes the fluid to move from the low surface tension area to the high surface tension area on the melt pool surface and affects the shape and curvature of the melt pool surface. The non-isothermal flow equation is used to describe the combined influence of temperature gradient on viscous damping and thermal convection. All material parameters, including viscosity, density, specific heat capacity, thermal conductivity, and surface tension, are defined as functions related to temperature. Specific parameters can be found in Appendix A.
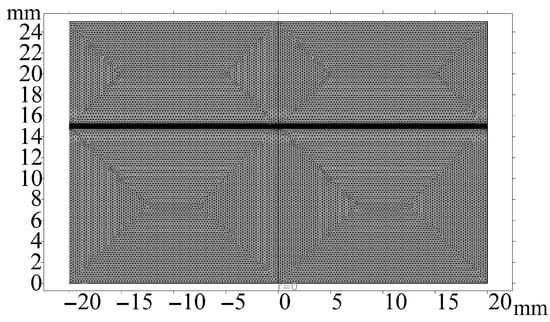
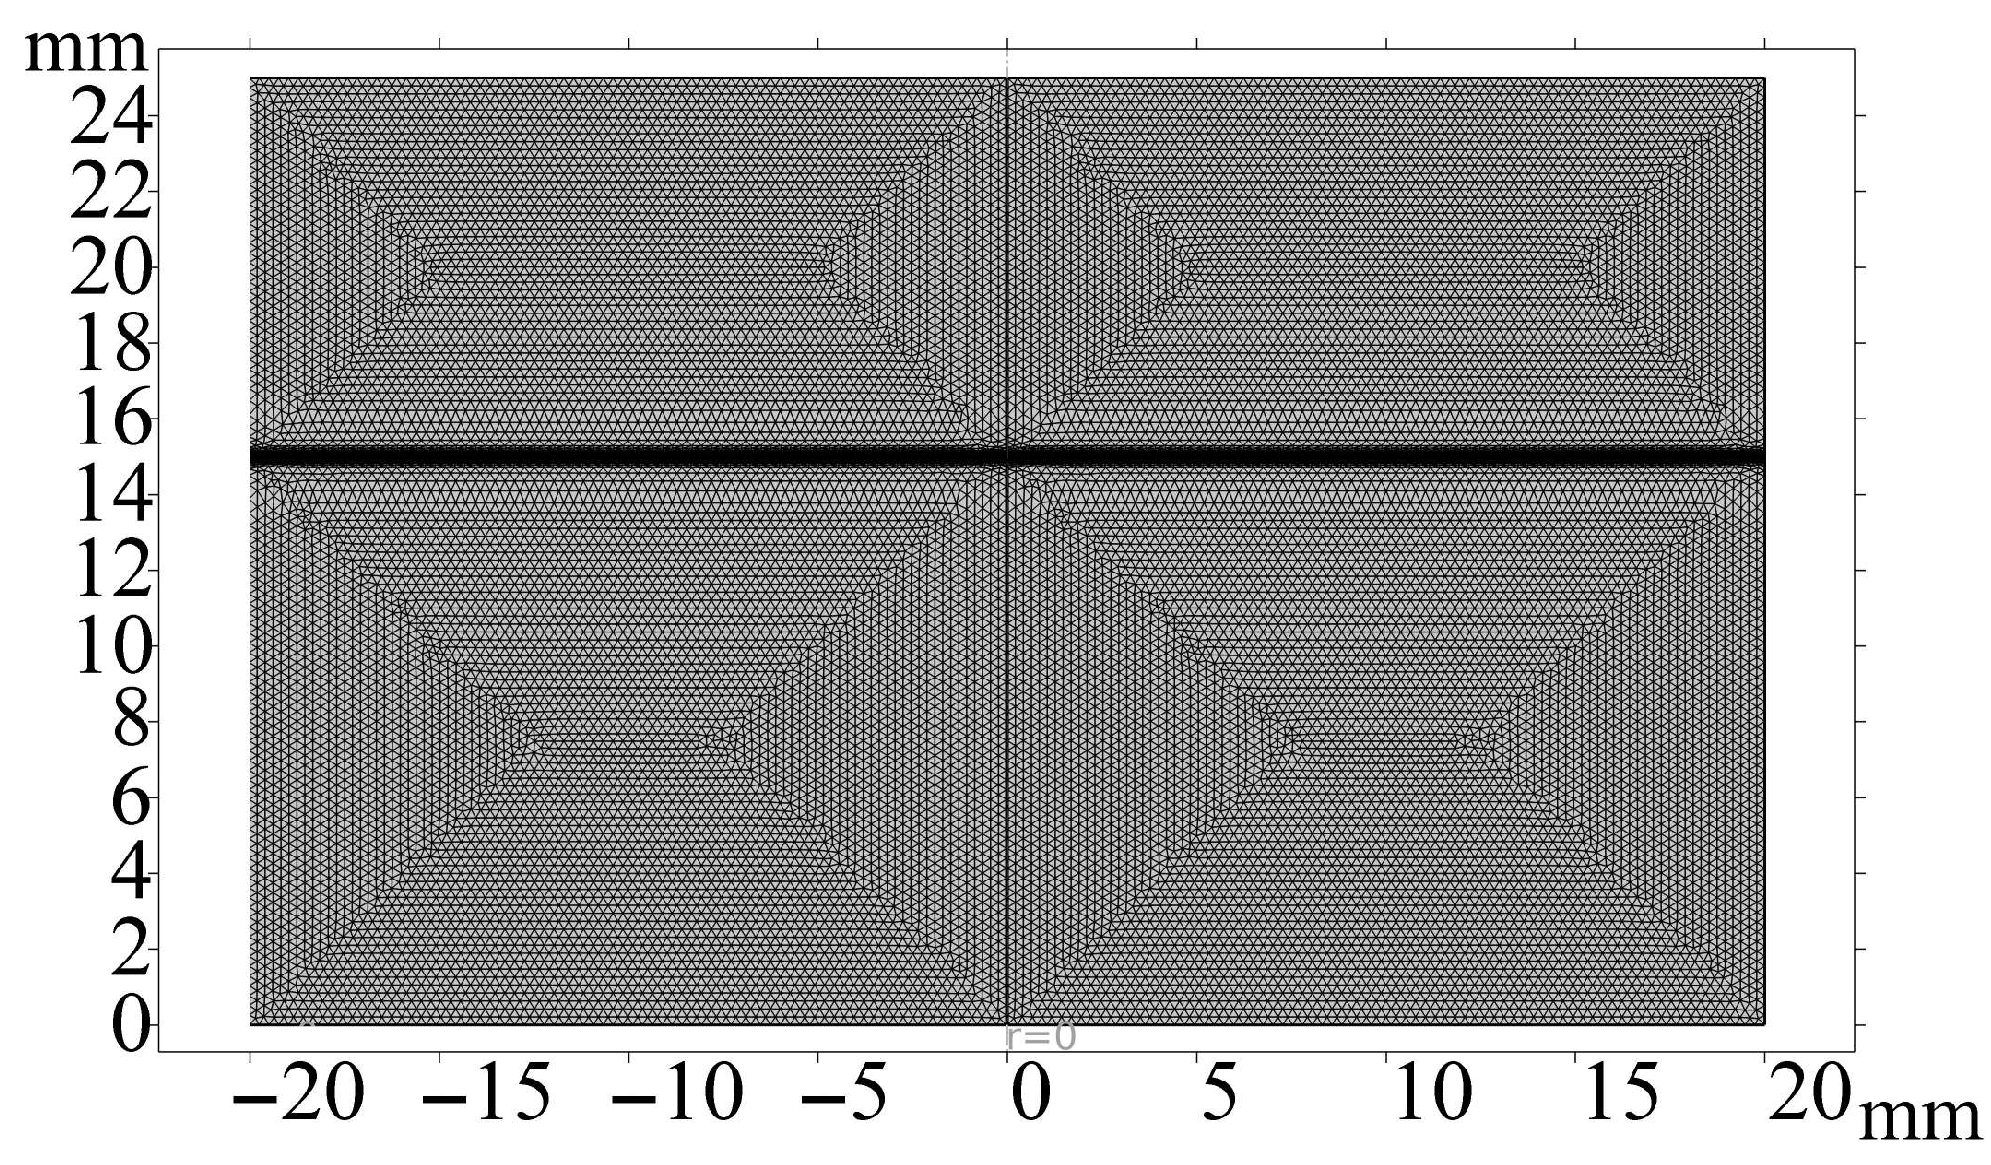
The simulation model adopts a two-dimensional axisymmetric geometric structure. The cylindrical glass sample is divided into two regions: the upper air region and the lower glass region, with the boundary line between the two regions being the glass surface. The computational grid is composed of free triangular elements, and a fine boundary layer is set at the air–glass interface to capture the dynamic changes in the free surface. The grid division is shown in Figure 3. To ensure the stability of interface tracking, a combination of dynamic grid technology and the arbitrary Lagrangian–Eulerian method is adopted, which can update the liquid surface shape in real time and accurately capture the changes in the melt pool geometry during the softening and cooling stages. Local mesh refinement was applied in the vicinity of the air–glass interface and the molten pool region to accurately capture steep gradients in temperature, velocity, and surface curvature. A mesh independence study was performed to ensure that further mesh refinement resulted in negligible changes in the predicted surface profiles.
Figure 3.
The grid of the simulation model.
The entire simulation is divided into two stages:
- (1)
- In the laser heating stage, the simulation models the transformation of the glass from a solid state to a high-viscosity fluid, as well as the subsequent formation and expansion of the molten pool. The main purpose is to obtain the spatial distribution of the temperature and velocity fields to describe the transient evolution of the molten pool shape. The boundary conditions used in the simulations are summarized as follows. A Gaussian-distributed laser heat flux was applied on the glass–air interface during the heating stage. Heat losses at the exposed surfaces were modeled using natural convection and thermal radiation boundary conditions. The bottom boundary of the glass substrate was set to a constant temperature to represent the thermal constraint imposed by the preheating platform. For the fluid flow, a no-slip boundary condition was imposed at the solid boundaries, while the free surface at the air–glass interface was allowed to deform under surface tension and Marangoni stresses.
- (2)
- In the cooling stage, the temperature field is set based on the final thermal state obtained during the heating phase. Subsequently, the numerical model continues to simulate the transient relaxation and contraction behavior of molten glass under natural cooling conditions. During the cooling stage, the same thermal and mechanical boundary conditions as those in the heating stage are applied, with the laser heat source switched off. Heat loss through convection and radiation is maintained, and the free surface evolution is continuously tracked until flow ceases due to the rapid increase in viscosity. This simulation takes into account the strong temperature dependence of viscosity and surface tension, as well as the gradual weakening of internal flow. Special attention is paid to the evolution of the thermal gradient, viscoelastic relaxation, and the effect of constrained boundaries. These factors jointly determine the inward material transport during the cooling process and the stabilization of the final surface morphology.
5. Results and Discussion
5.1. Dynamic Characteristics of Molten Pool
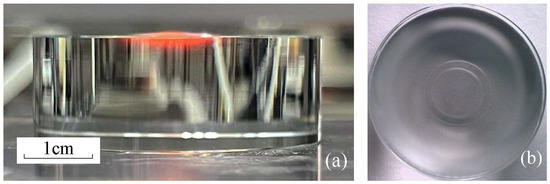
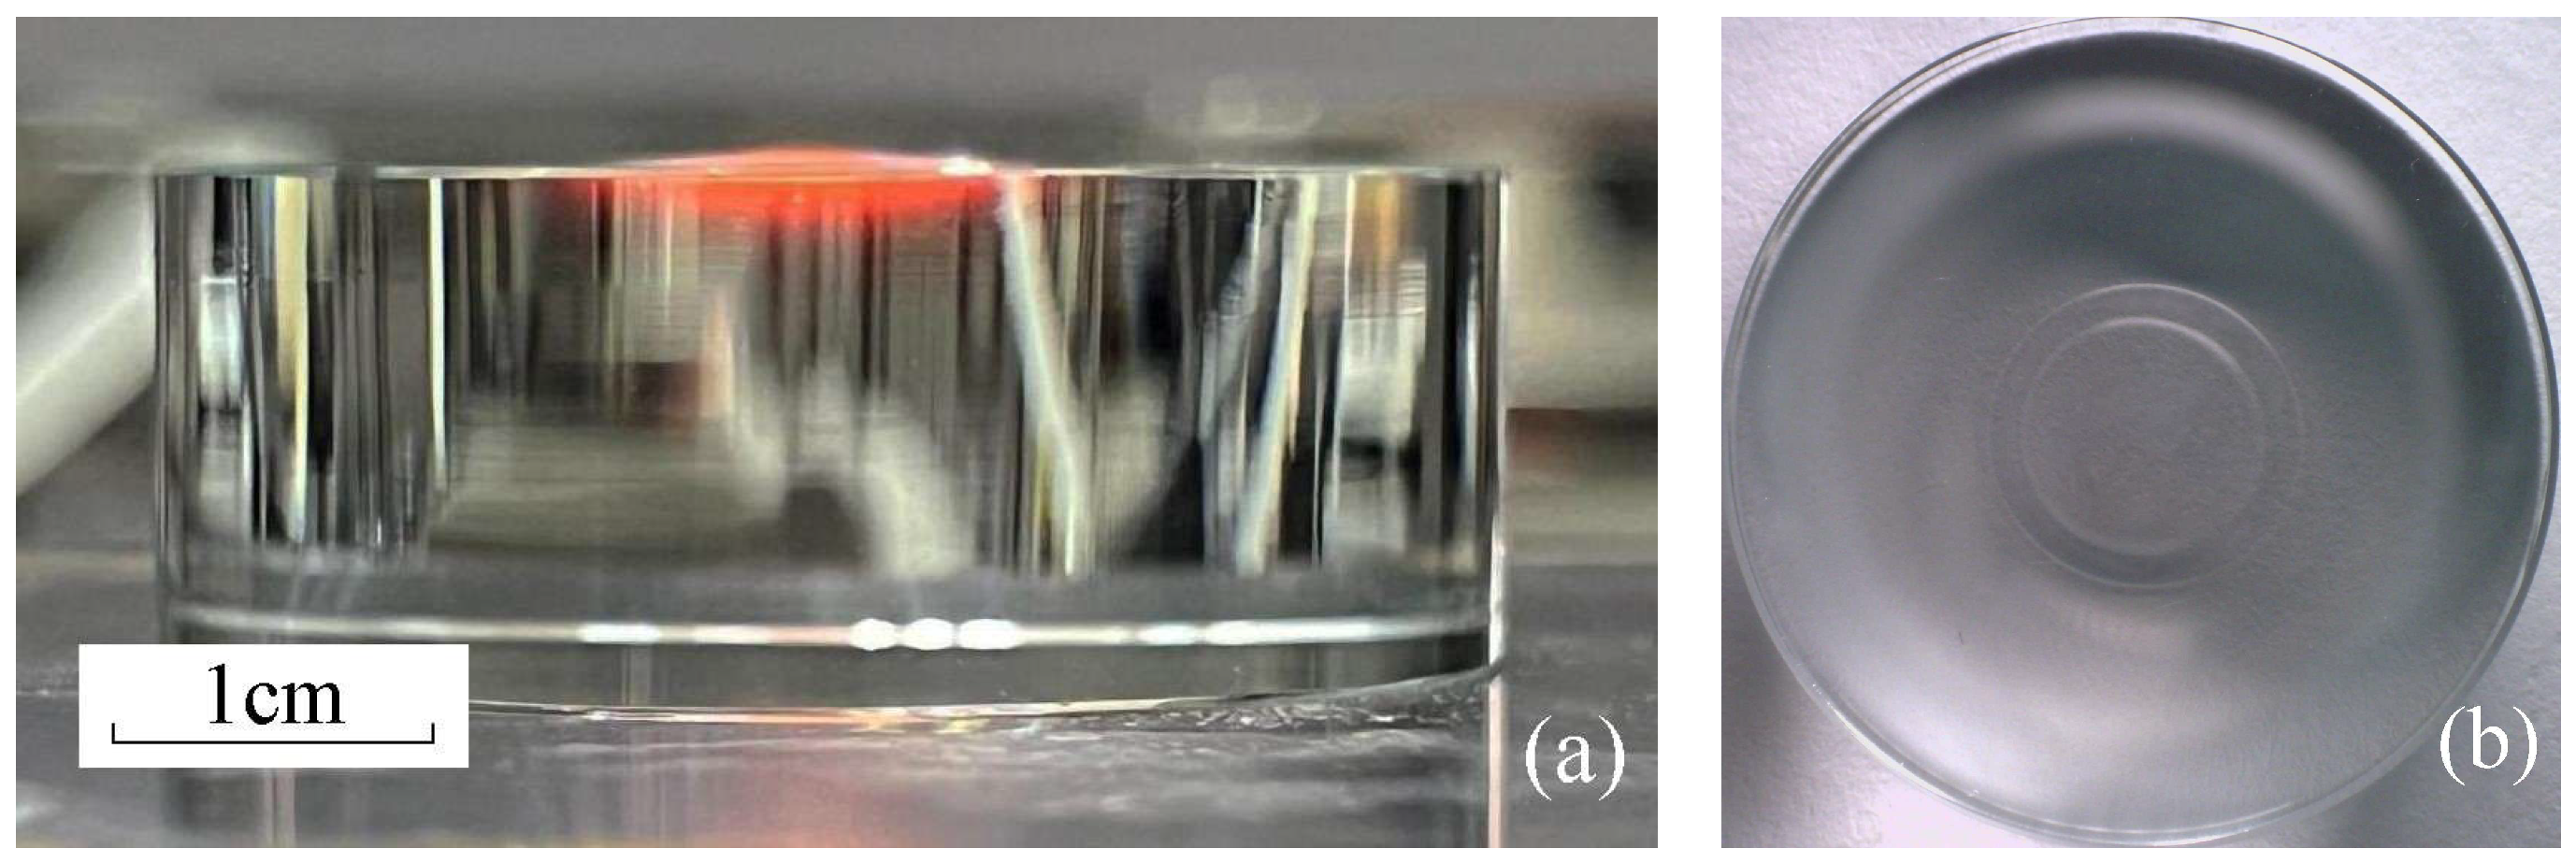
To verify the reliability of the model, the evolution of the width, depth, and surface curvature of the simulated molten pool was compared with the experimental results. The melt pool width and depth were extracted from the central cross-sectional profile passing through the laser beam axis, where the maximum temperature and deformation occur. The experimental and simulation results exhibit consistent trends, as illustrated in Figure 4. The dynamic evolution of the molten pool during laser irradiation was recorded using a high-speed camera, which enables non-contact observation of transient surface deformation and flow behavior. The post-cooling surface morphology was measured after complete solidification using a surface profilometer along the laser centerline. High-speed imaging confirms that the glass surface evolves from an initially convex profile into a characteristic “M-shaped” contour. The melt pool maintains a stable convex shape throughout the entire irradiation period. After the laser is turned off, the combined effects of temperature gradients, surface tension, and Marangoni-driven flow cause the molten region to contract, forming a contour characterized by a central depression and raised edges.
Figure 4.
Evolution of glass surface morphology: (a) Under laser irradiation; (b) After cooling.
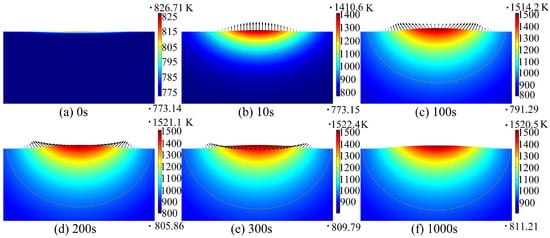
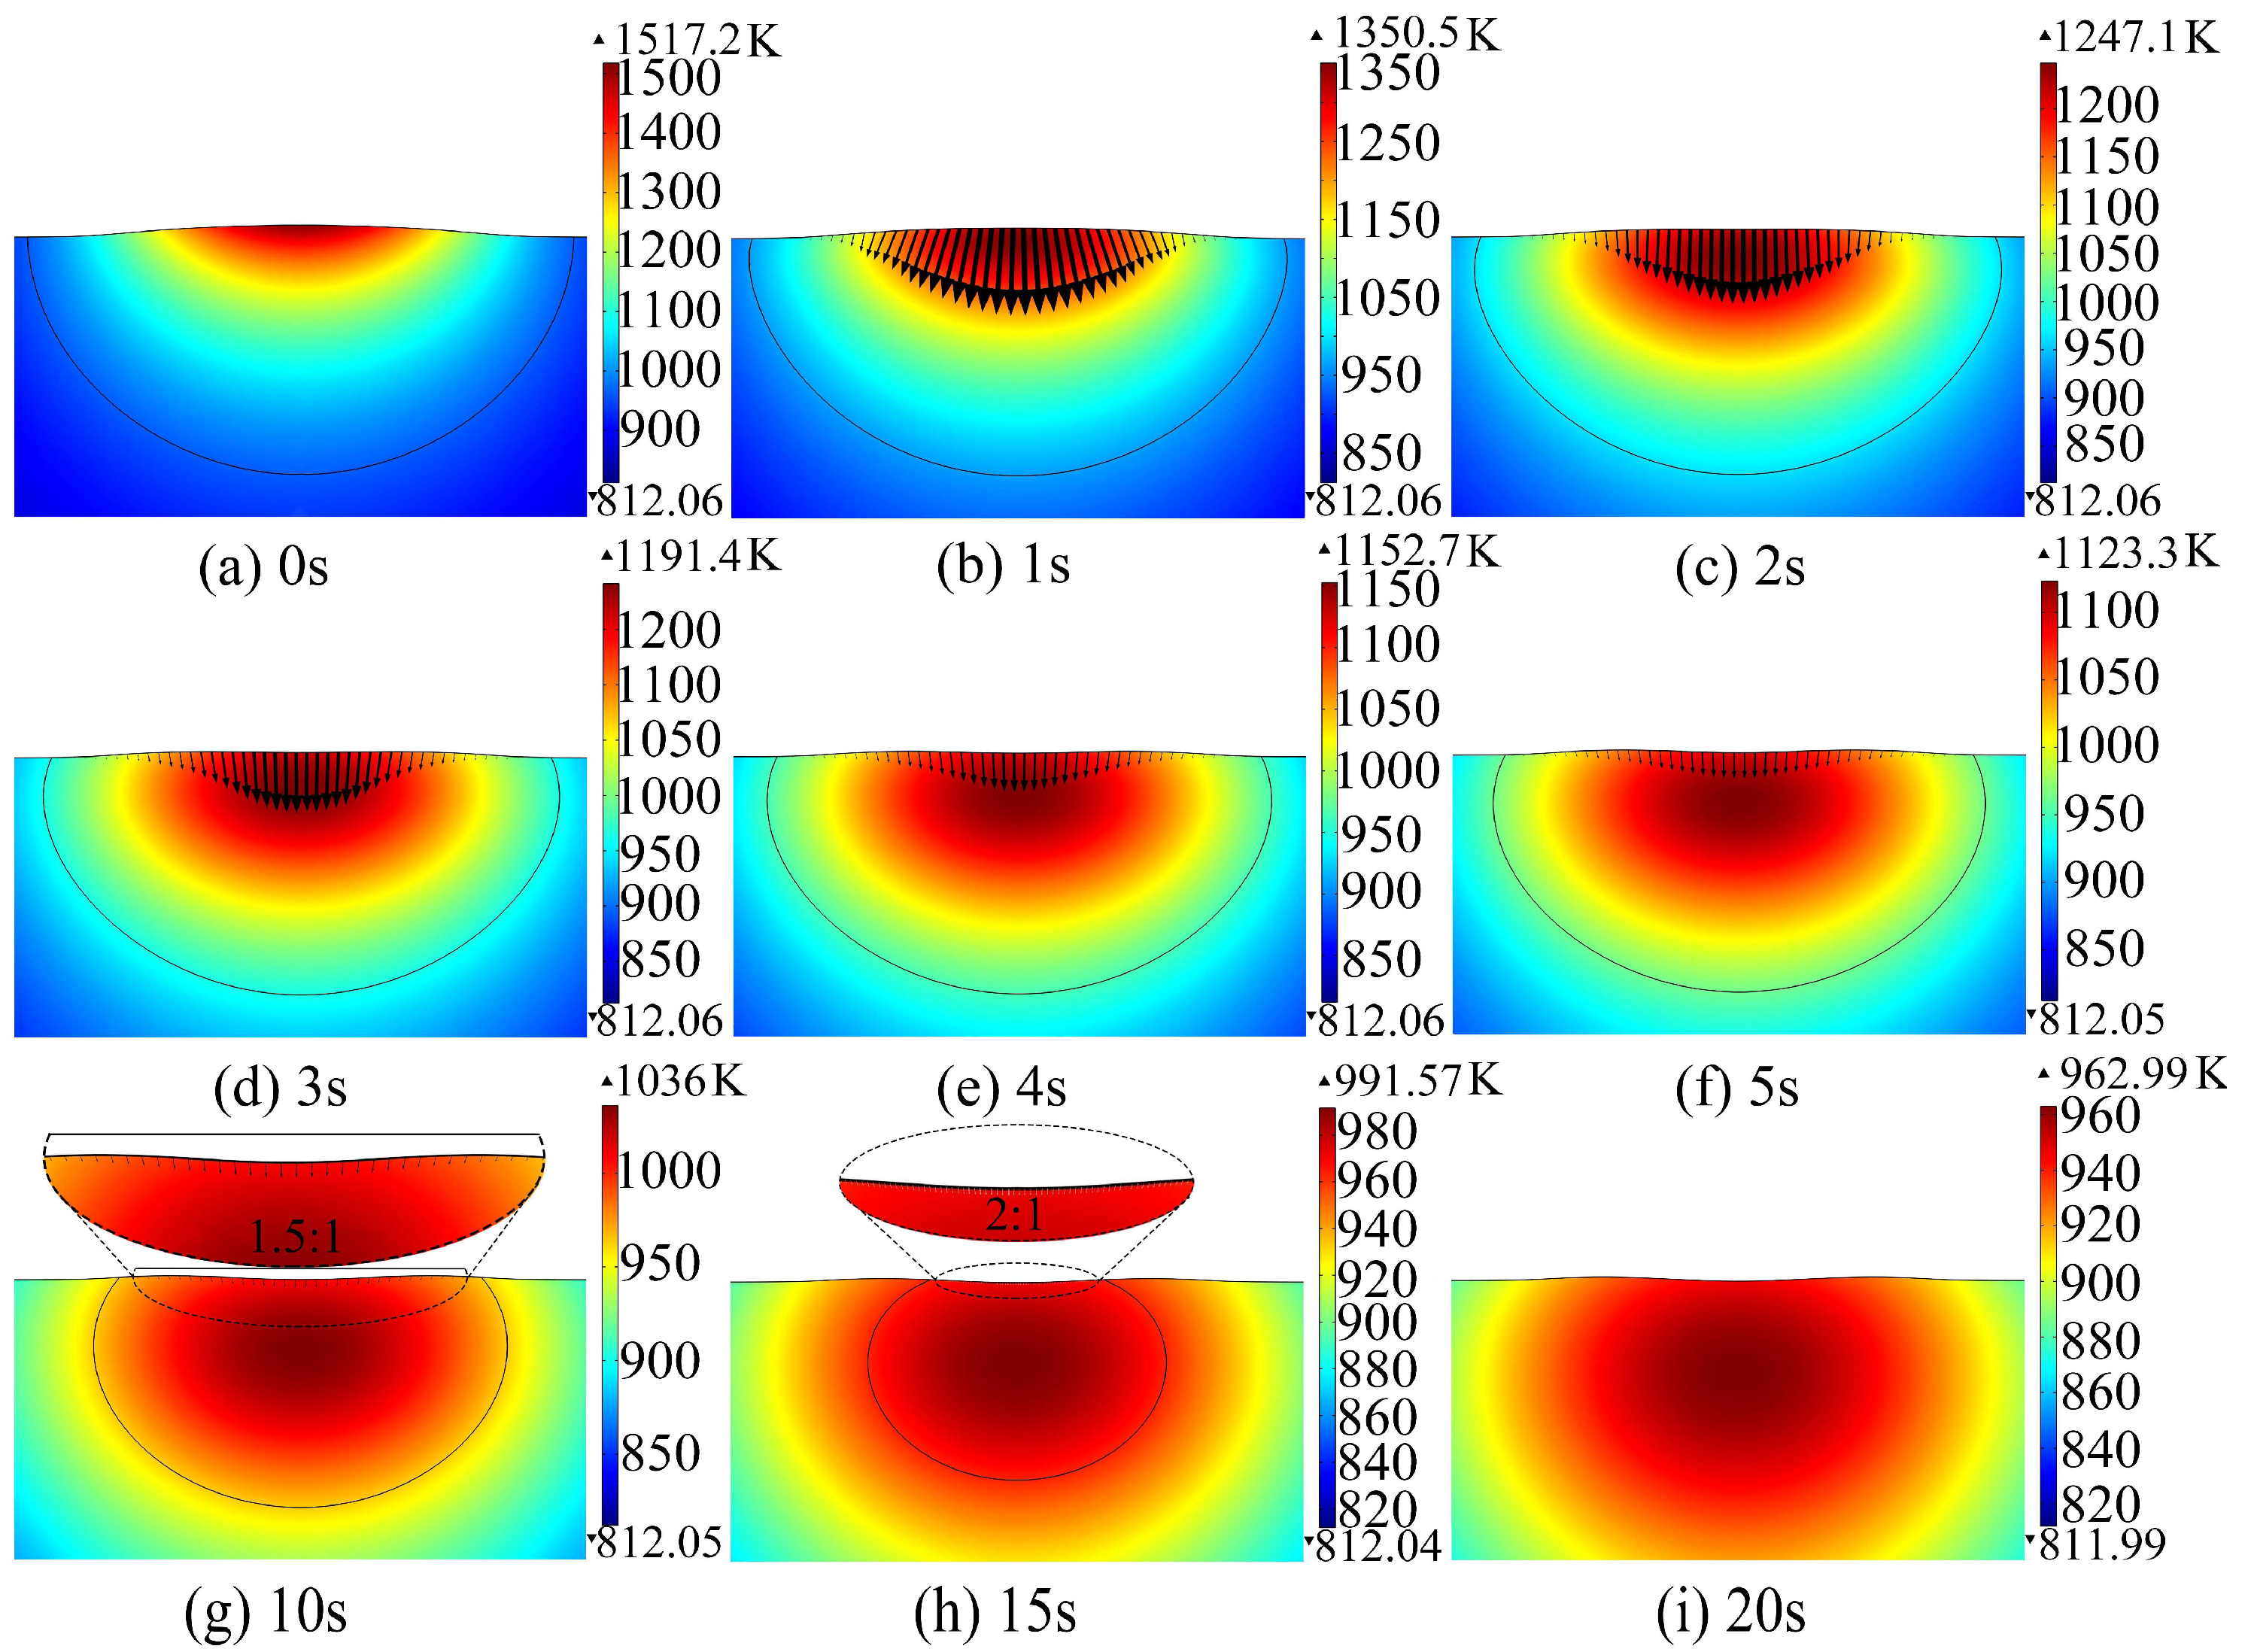
To ensure consistency between simulation and experiment, the surface profiles used for comparison were extracted along identical spatial positions and defined using the same geometric criteria. Figure 5 shows the changes in the morphology of the glass surface melt pool over time under laser point irradiation. The color contour lines represent the temperature distribution, while the superimposed arrows indicate the direction and magnitude of the surface velocity vector. The results show that the melt pool went through three main stages: the initial high-viscosity thermal expansion stage, the flow stage driven by both volume expansion and Marangoni convection, and the final surface movement stage driven by Marangoni.
Figure 5.
The velocity vector of the molten pool surface during laser irradiation.
Under continuous laser irradiation, the surface temperature exhibits a typical Gaussian distribution, with heat concentrated near the beam center. In the early stage, the high viscosity of the glass restricts internal flow, and surface deformation is mainly due to thermal expansion, resulting in a slight bulging at the center. As irradiation continues, the temperature in the central region rises rapidly, viscosity decreases significantly, and the glass gradually transitions into a viscous fluid state. The pronounced temperature gradient gives rise to Marangoni flow, driving material from the high-temperature center toward the cooler periphery. This outward flow causes the melt pool boundary to expand and the surface curvature to flatten progressively. Once dynamic thermal equilibrium is established, the temperature field becomes stable and further expansion of the molten region ceases. At this quasi-steady stage, the melt pool maintains a stable hemispherical morphology, with fluid motion primarily confined to the upper region, while the lower portion exhibits weaker gradients and slower flow. As the irradiation process continued, the balance between heat input and heat loss was stabilized, and the shape of the molten pool remained largely unchanged.
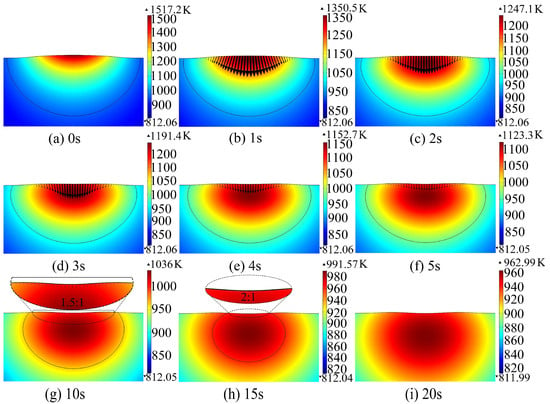
Figure 6 shows the changes in the internal temperature field and surface velocity vectors of the optical glass during the cooling and contraction process after the laser irradiation stops. Over time, as the molten pool transitions from liquid to solid state, its internal flow, temperature gradient, and surface morphology exhibit distinct phased characteristics.
Figure 6.
Velocity vector of the molten pool surface during the cooling process.
After the laser is turned off, the edge region of the molten pool solidifies first due to rapid cooling, forming a rigid boundary. At this stage, the viscosity of the edge glass rapidly increases to over 106 Pa·s, producing a pronounced viscous force constraint that limits flow in the central region. Although the temperature gradient remains large, the residual Marangoni convection gradually weakens, and the surface velocity vectors diminish noticeably. The process then enters the viscoelastic shrinkage stage. At this point, the central temperature remains above the glass softening temperature (Ts = 690 °C), and the material is in a semi-fluid state. Under the combined influence of thermal stress and edge constraints, the central region flows inward, as indicated by the velocity vectors pointing from the edges toward the center. Volume contraction and viscoelastic recovery jointly drive the surface to sink gradually, forming the characteristic M-shaped central depression. When the viscoelastic contraction ends, the overall temperature of the molten pool drops below Tg, and the flow completely freezes, stabilizing the shape. The surface velocity vector almost disappears, and the distribution of residual stress tends to reach a balanced state. This staged process indicates that the evolution of the molten pool shape is controlled by the coupling effect of multiple physical fields.
The results reveal a clear and systematic dependence of the final M-shaped surface profile on the laser processing parameters. Both the peak height and width of the M-shaped depression after cooling vary monotonically with laser power and spot radius, indicating that the post-cooling surface morphology is not random but closely linked to the thermal history imposed by the laser irradiation.
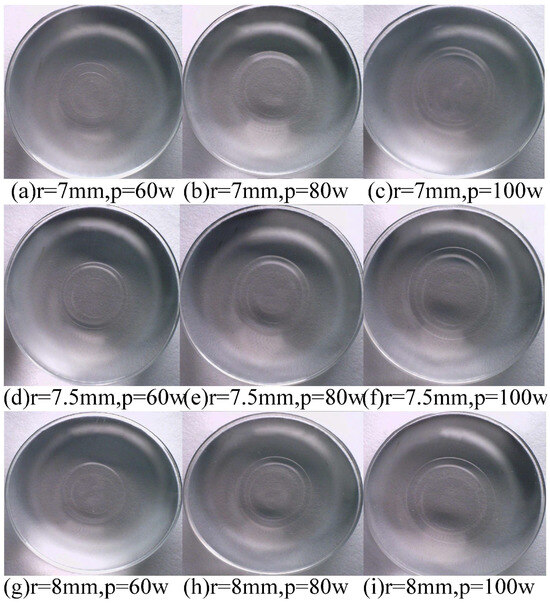
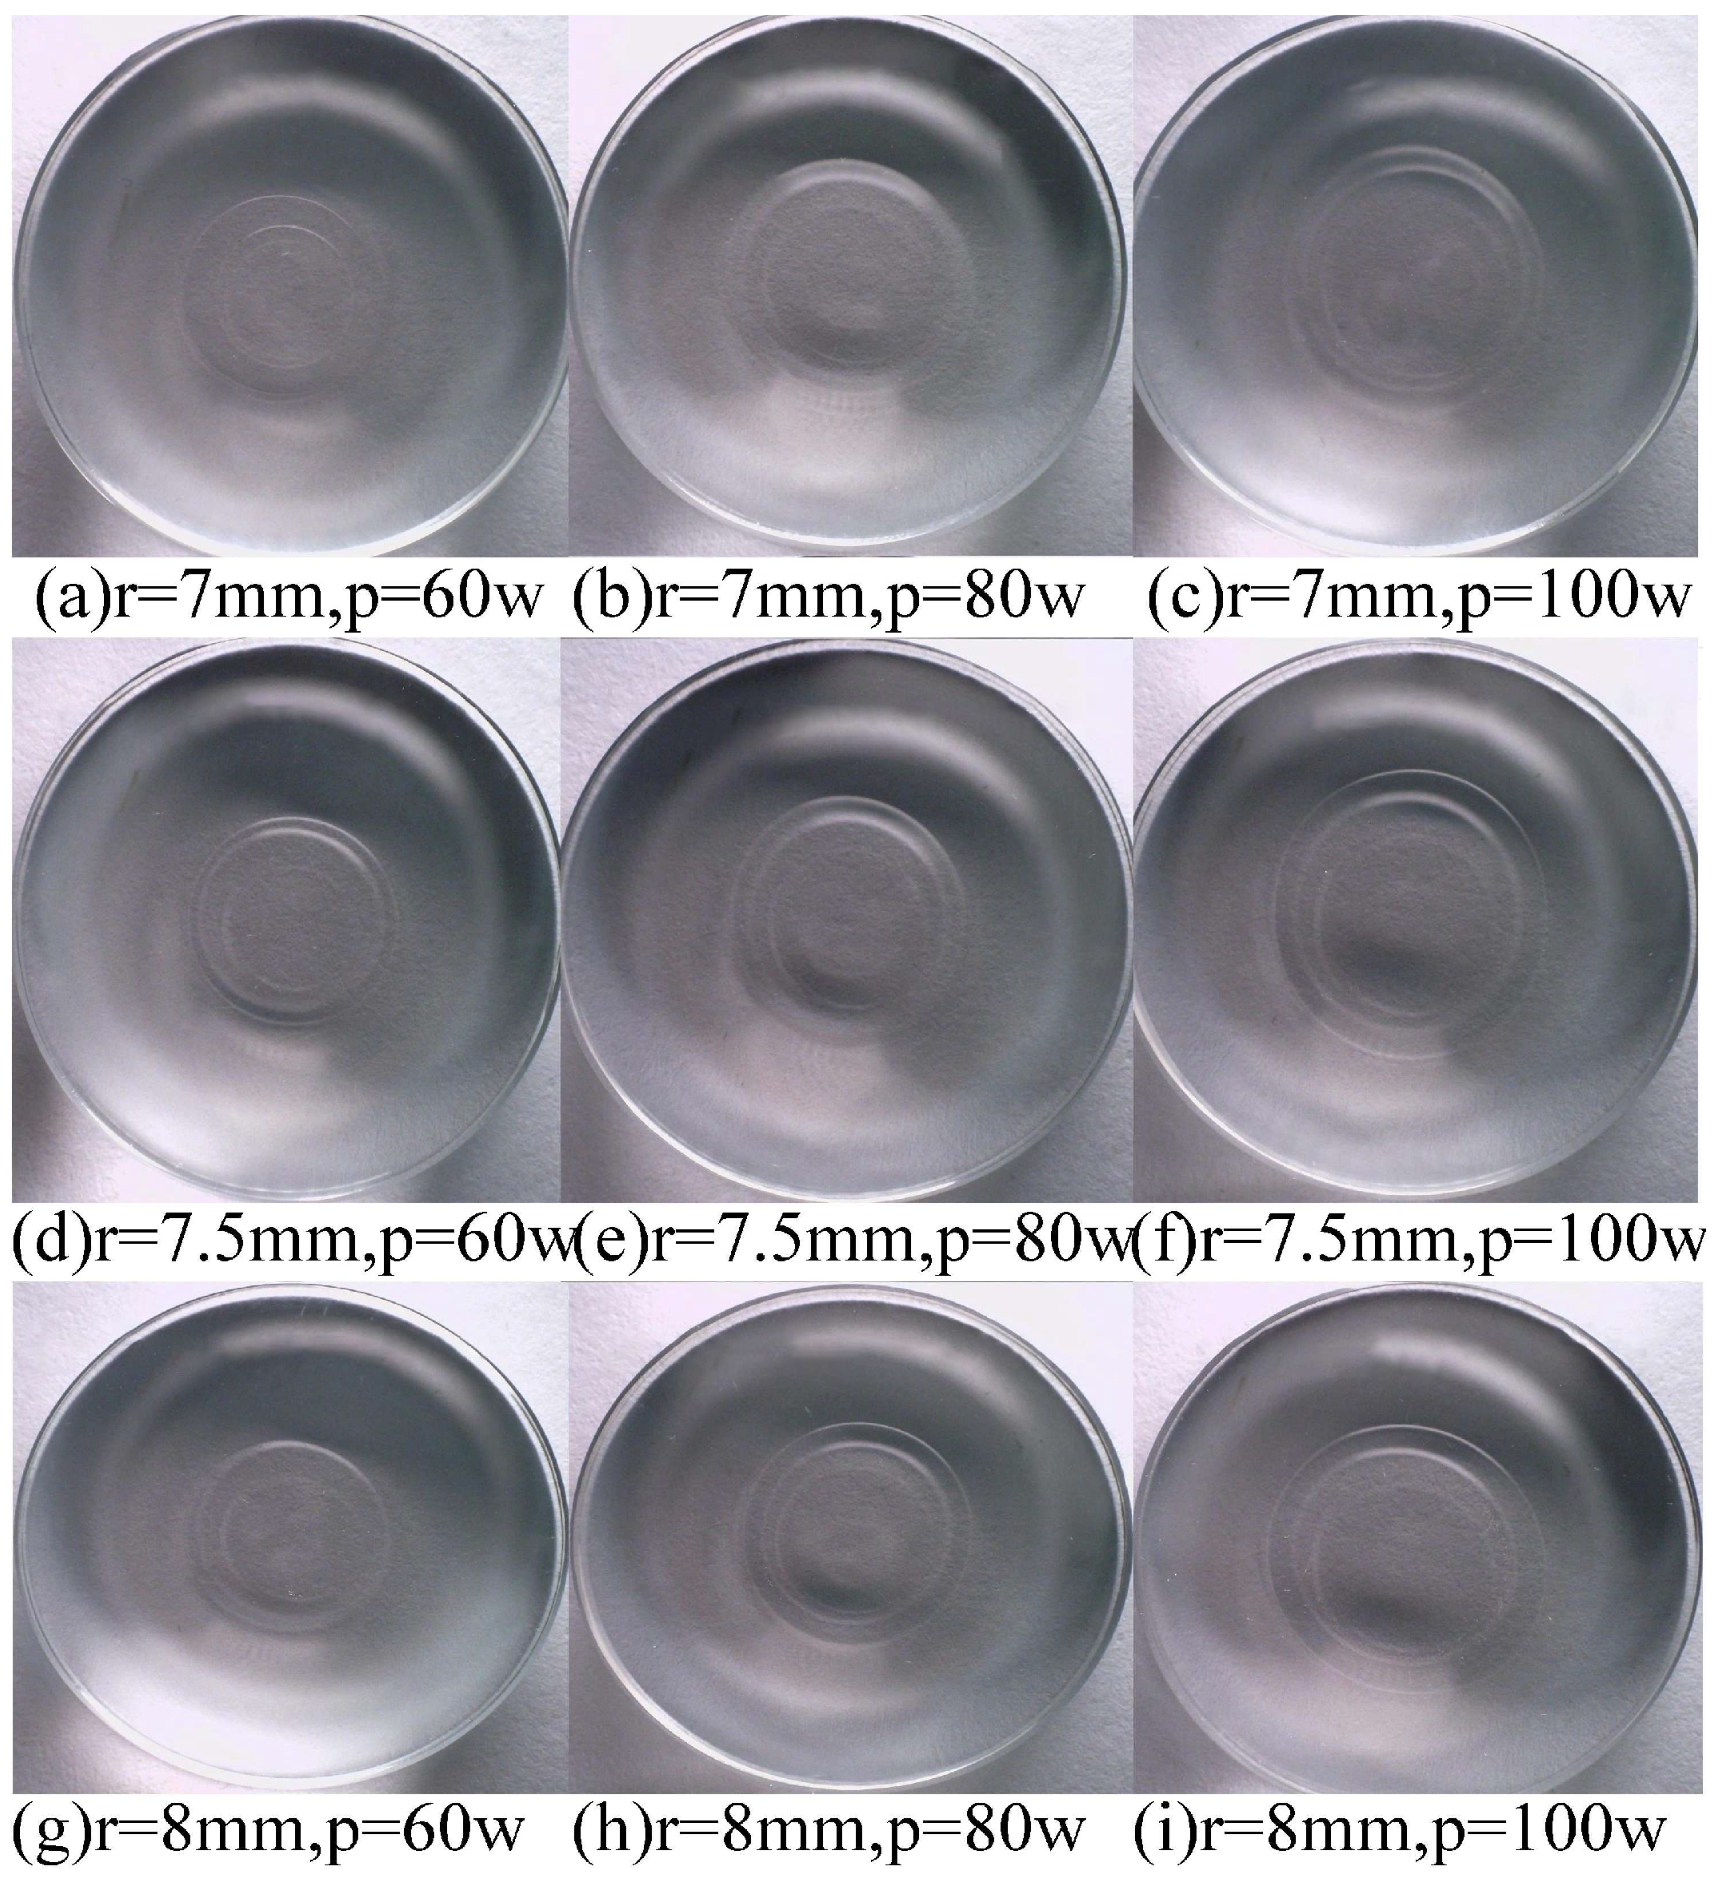
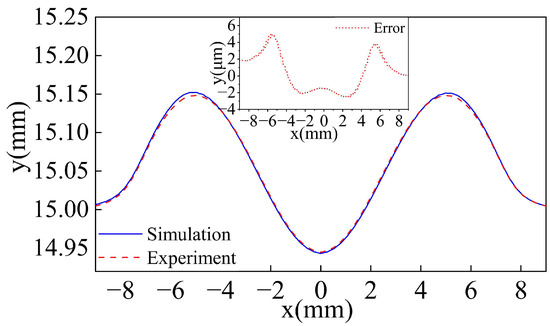
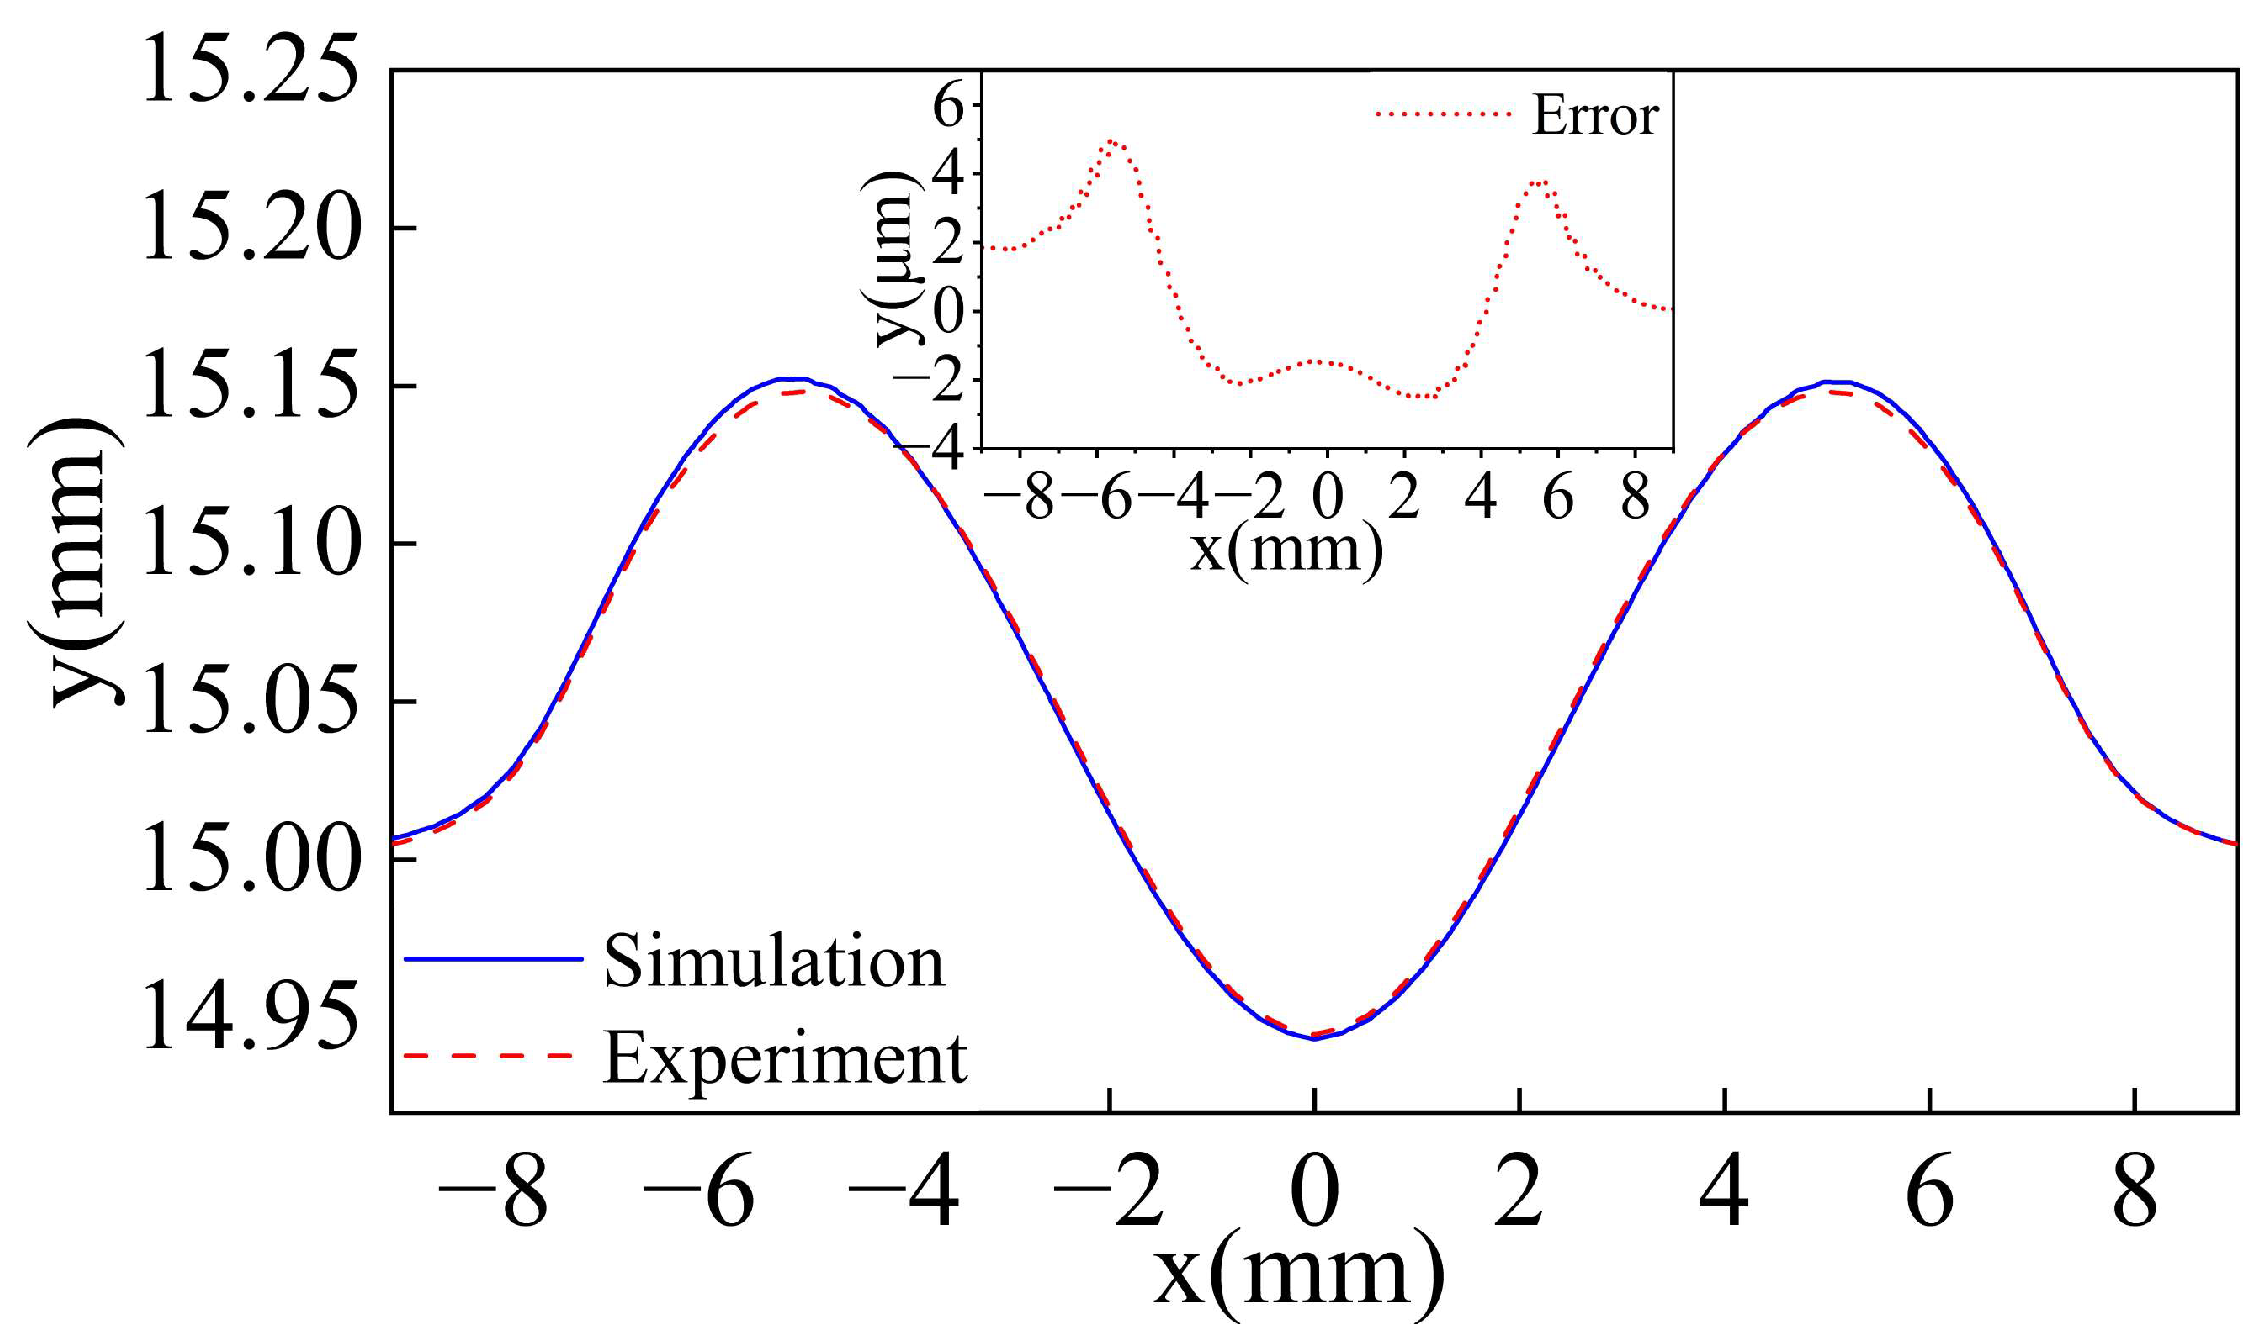
The surface morphology after cooling under different laser parameters is shown in Figure 7. As the laser power and laser radius gradually increase, the convex radius of the glass surface after cooling also gradually increases. To evaluate the reliability of the proposed model, the numerical predictions were quantitatively compared with the experimental measurements. Figure 8 shows the comparison results obtained at r = 7 mm and P = 100 W, where the simulated surface profile shows excellent agreement with the experimentally measured profile. The maximum deviation in surface height between the simulation and experiment is less than 0.005 mm. Moreover, by averaging the absolute deviations obtained under different processing conditions, an overall mean error of 0.008 mm was obtained. These results verified the accuracy of the model in capturing the cooling process and its related morphological evolution.
Figure 7.
Experimental surface morphology of the glass after cooling under different processing parameters.
Figure 8.
Comparison of simulated and experimental surface profiles (r = 7 mm, P = 100 W).
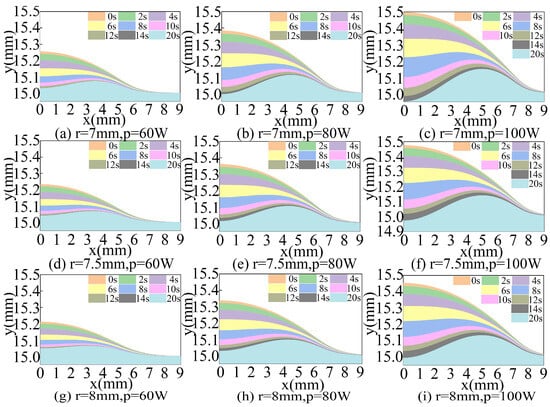
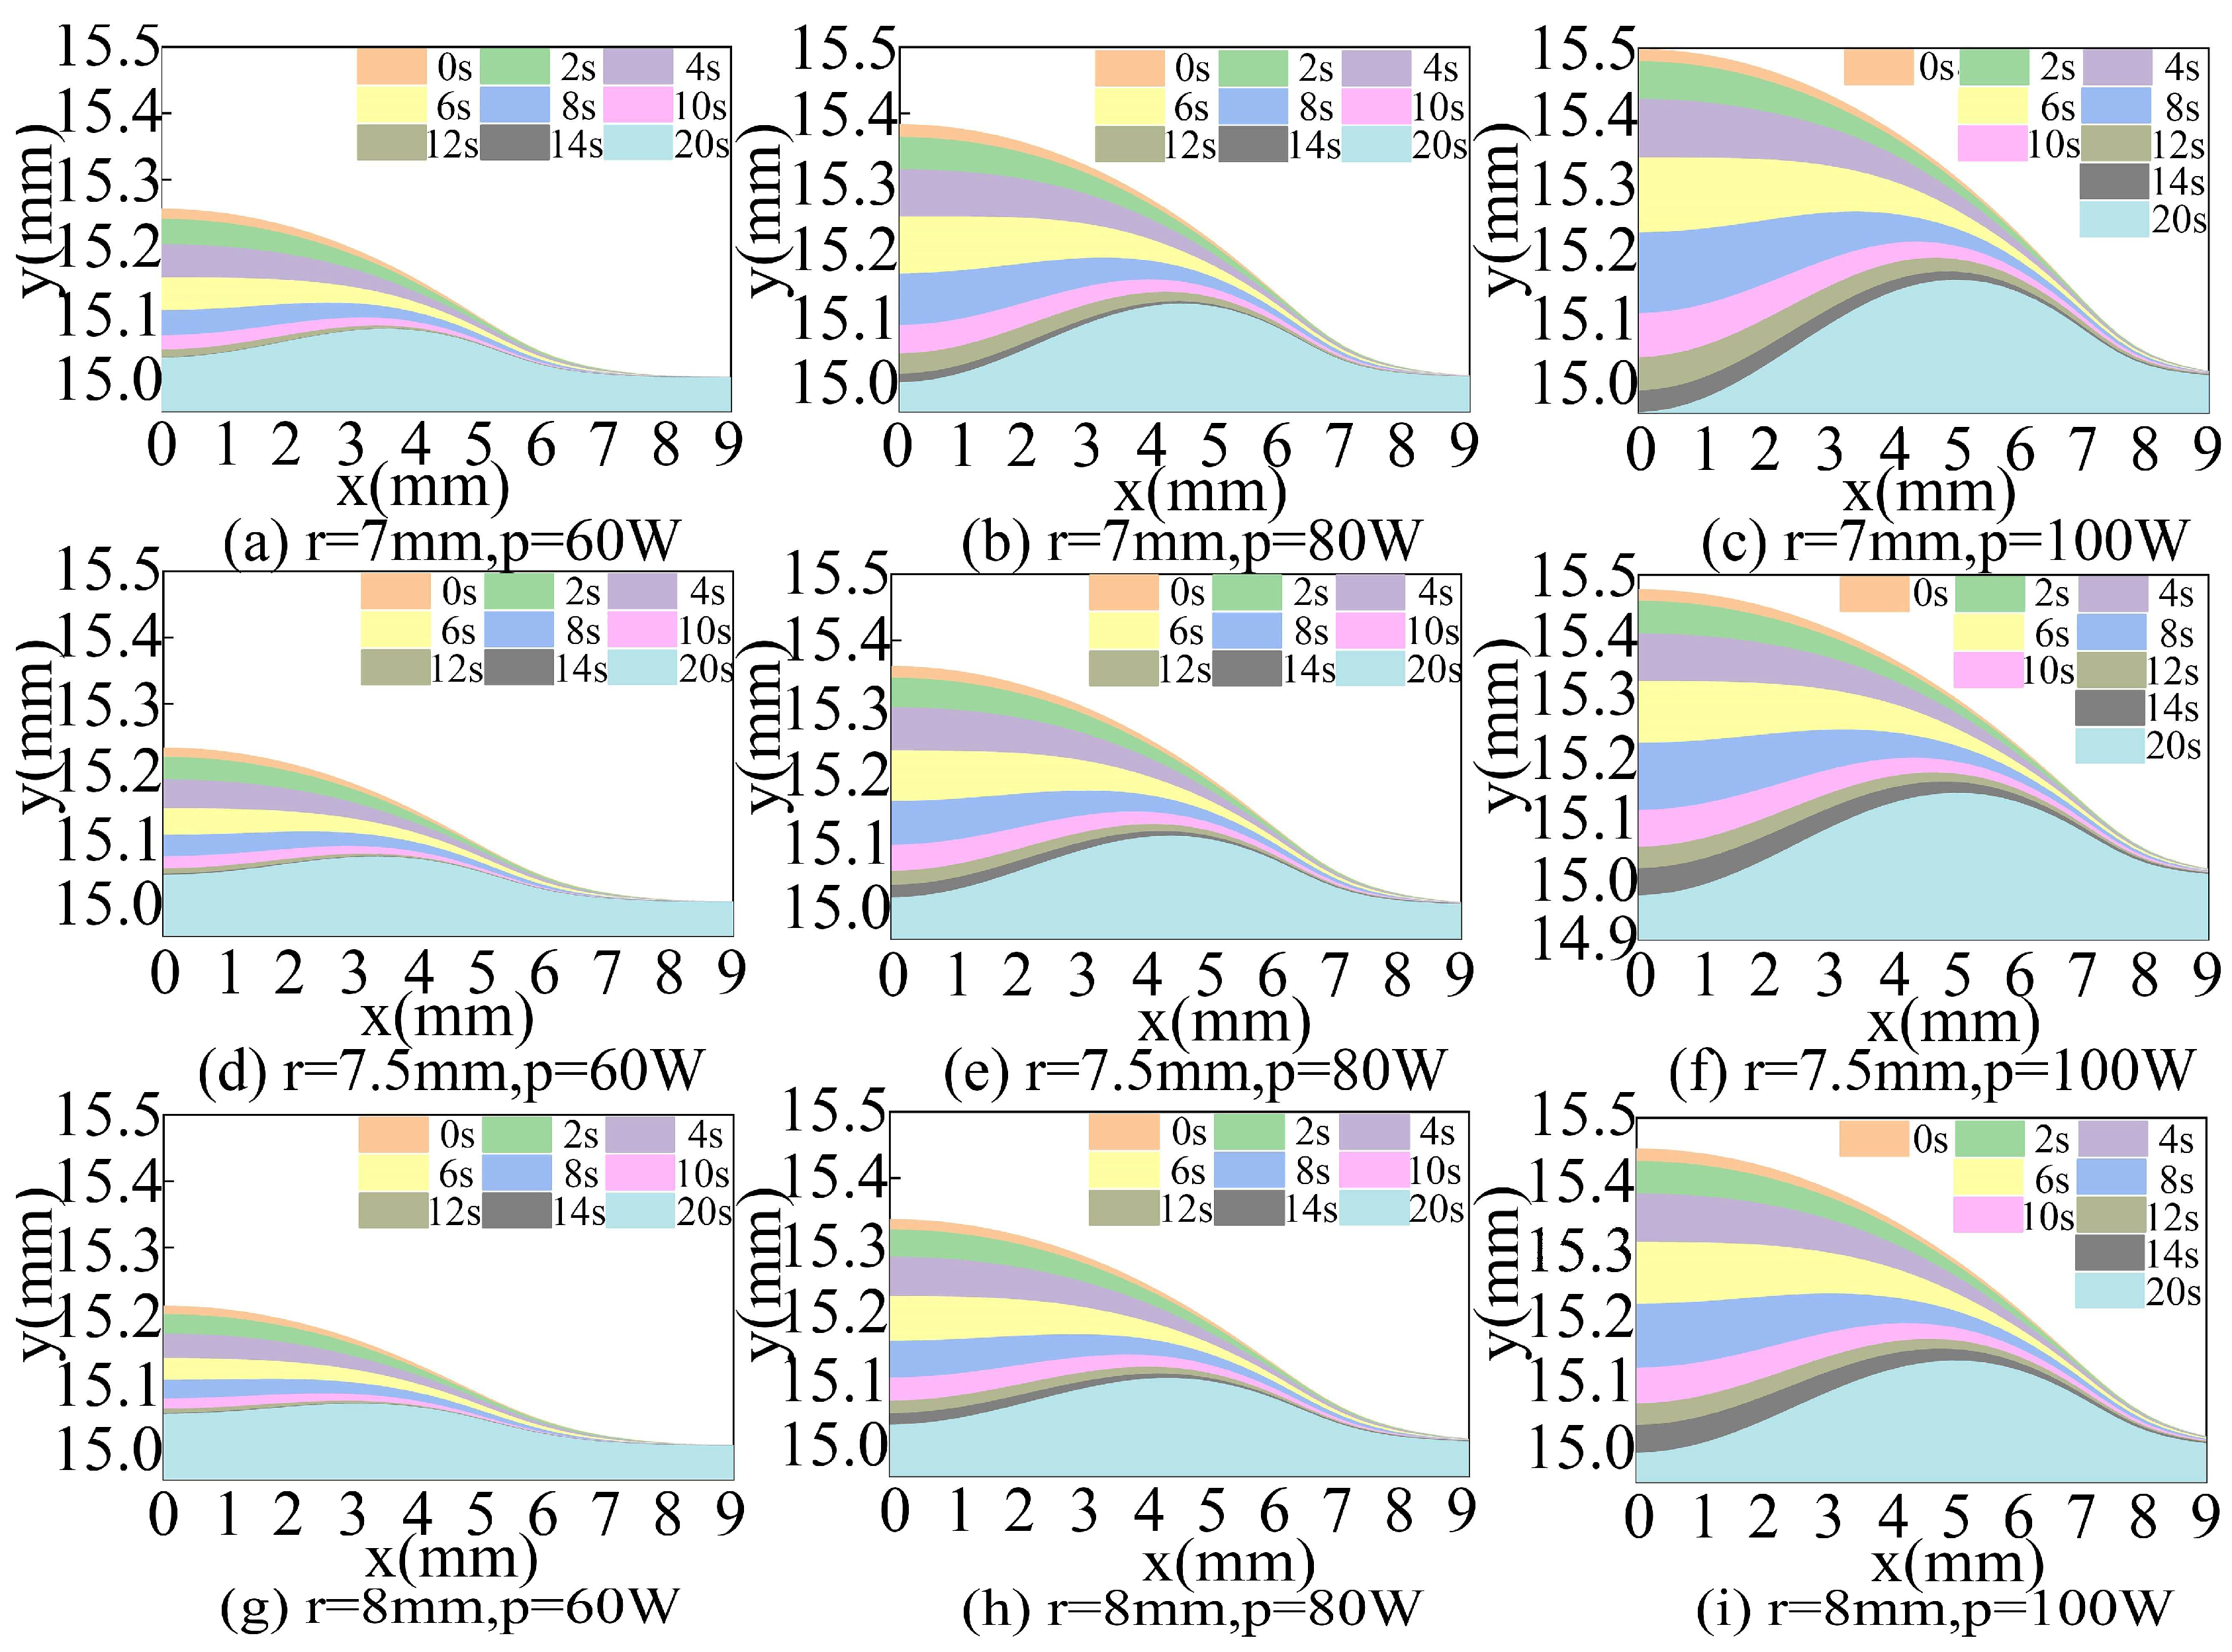
Figure 9 shows the temporal evolution of the optical glass molten pool surface morphology after laser irradiation ceases, under different laser powers (60–100 W) and spot radii (7–8 mm). Under all conditions, the molten pool undergoes a typical evolution path from rapid shrinkage to gradual stabilization after the laser is turned off.
Figure 9.
Cooling shrinkage process of molten pool surface under different process parameters.
In the initial stage, the molten pool remains at a high temperature, exhibiting a pronounced convex surface with a rapidly decreasing central height. This significant deformation results from the low viscosity of the high-temperature glass and the rapid release of volumetric shrinkage effects. As time progresses, the temperature field drops quickly, the material viscosity increases, and the surface shrinkage rate decreases markedly. After 10 s, the molten pool profile tends to stabilize, indicating that the system has entered the morphology freezing stage. At this point, the central bulge almost disappears, and a depression appears in the center.
A comparison among different parameter sets reveals that laser power and radius have a decisive influence on the deformation amplitude during the cooling stage. For the same spot radius, as power increases from 60 W to 100 W, the initial molten pool height rises significantly, and the post-cooling surface displacement becomes larger. This indicates that a higher laser power produces a deeper molten zone, releasing more heat and volumetric strain during cooling. Meanwhile, a larger spot radius (r = 8 mm) leads to a more uniform thermal distribution and slower contraction amplitude, resulting in a smoother deformation process and higher surface stability. Conversely, a smaller spot radius (r = 7 mm) corresponds to a steeper temperature gradient and faster cooling rate, leading to a rapid early-stage contraction concentrated in the central region.
These results indicate that, although the cooling-induced deformation proceeds at different rates under varying laser parameters, the molten pool consistently follows a similar shrinkage-to-freezing evolution path, with the deformation amplitude being primarily governed by the imposed thermal conditions.
5.2. Influence of Laser Parameters on Final Surface Geometry
To quantitatively characterize the M-shaped surface profile formed after the cooling shrinkage of glass, surface parameters were extracted based on experimentally measured cross-sectional curves and simulated surface morphology distributions. Three key geometric parameters were defined to describe the post-cooling M-shaped structure: the total width of the M-shaped region (Wm), the peak height (Hm), and the peak-to-valley height difference (ΔH).
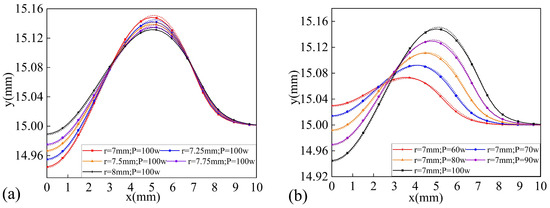
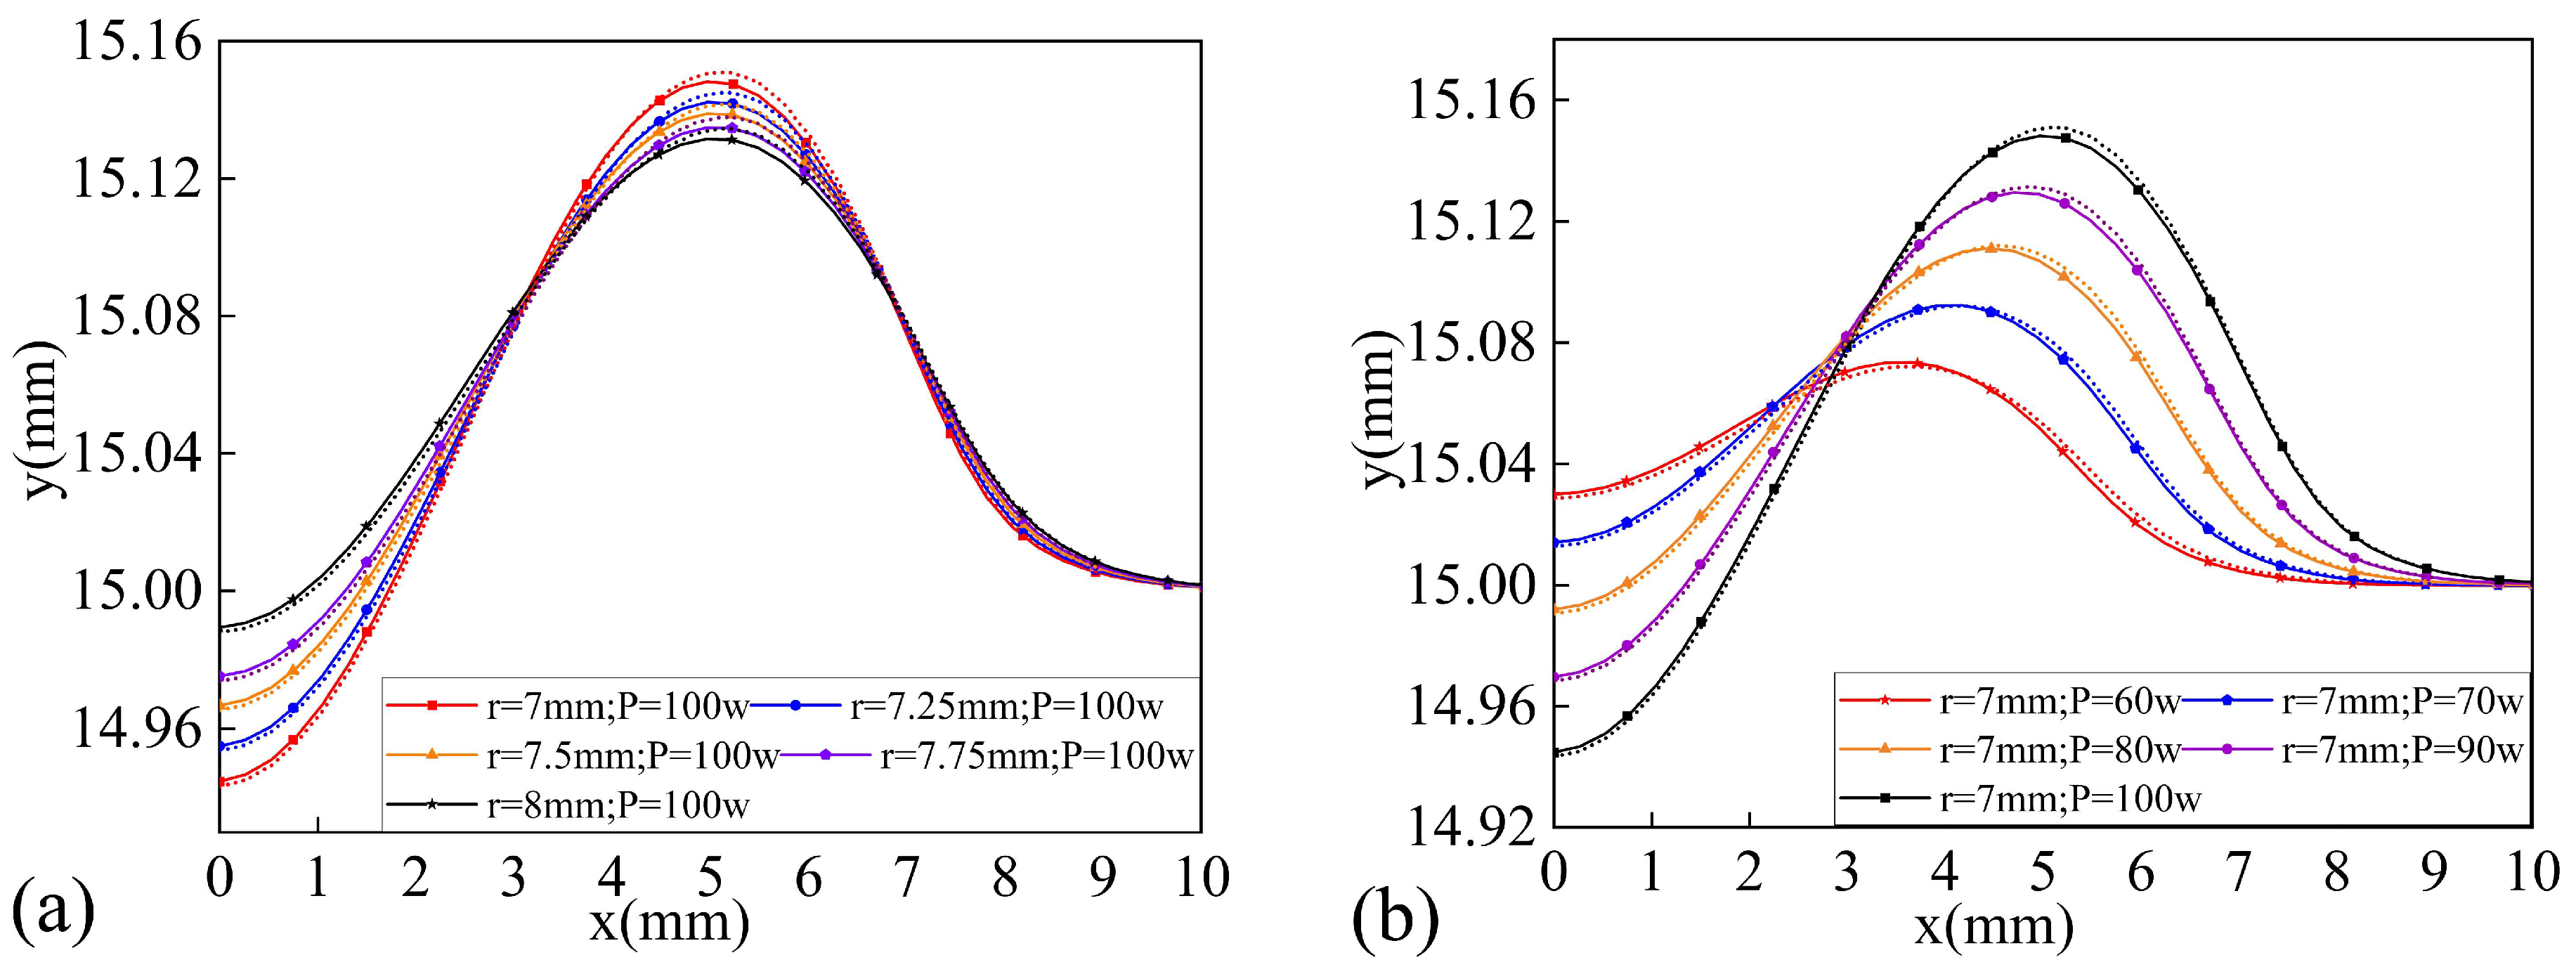
Figure 10 presents the cross-sectional profiles of the glass surface after cooling under different laser powers and spot radii. In this figure, solid lines correspond to the experimentally measured surface profiles, while dashed lines represent the corresponding simulation results. As the laser power increases, both Hm and Wm exhibit a monotonic growth trend. Under a laser radius of 7 mm, when the power increases from 60 W to 100 W, the peak height Hm rises from 1.48 μm to 0.73 μm, the peak-to-valley height difference ΔH increases from 2.03 μm to 0.44 μm, and the total width Wm expands from 7.869 mm to 10.106 mm. The simulated surface profiles show good agreement with the experimental curves over the entire cross-sectional region for all laser powers considered, indicating that higher laser power induces stronger thermal gradients and a larger molten pool volume, thereby intensifying the nonuniform shrinkage effect and resulting in deeper and wider surface depressions after solidification.
Figure 10.
Surface shape of glass after cooling under different parameters: (a) Varying spot radius (P = 100 W) (b) Varying laser power (r = 7 mm). (Solid lines represent experimental measurements, while dashed lines represent simulation results).
In contrast, with an increasing laser spot radius, Hm decreases and the surface becomes smoother. Under a laser power of 100 W, when the beam radius increases from 7 mm to 8 mm, Hm drops from 1.48 μm to 1.31 μm, and ΔH drops from 2.03 μm to 1.42 μm. Similarly, the simulated profiles closely follow the experimentally measured surface shapes for different spot radii, confirming that the model remains valid across a broad parameter range. This suggests that a larger heat-affected zone reduces the cooling rate gradient between the center and edges, thus mitigating the uneven shrinkage responsible for the formation of the M-shaped surface. The cooling and shrinkage process is jointly governed by laser input energy and thermal distribution range. High power combined with a small spot radius tends to produce more pronounced transient bulging and shrinkage effects, whereas low power and a larger spot radius lead to smoother and more stable surface evolution. The consistency between simulation and experimental results in Figure 10 demonstrates that the proposed model can reliably predict the final surface morphology under both moderate and extreme processing conditions. These research results indicate that an appropriate matching of laser power and spot radius is crucial for controlling the shape of the M-shaped depression.
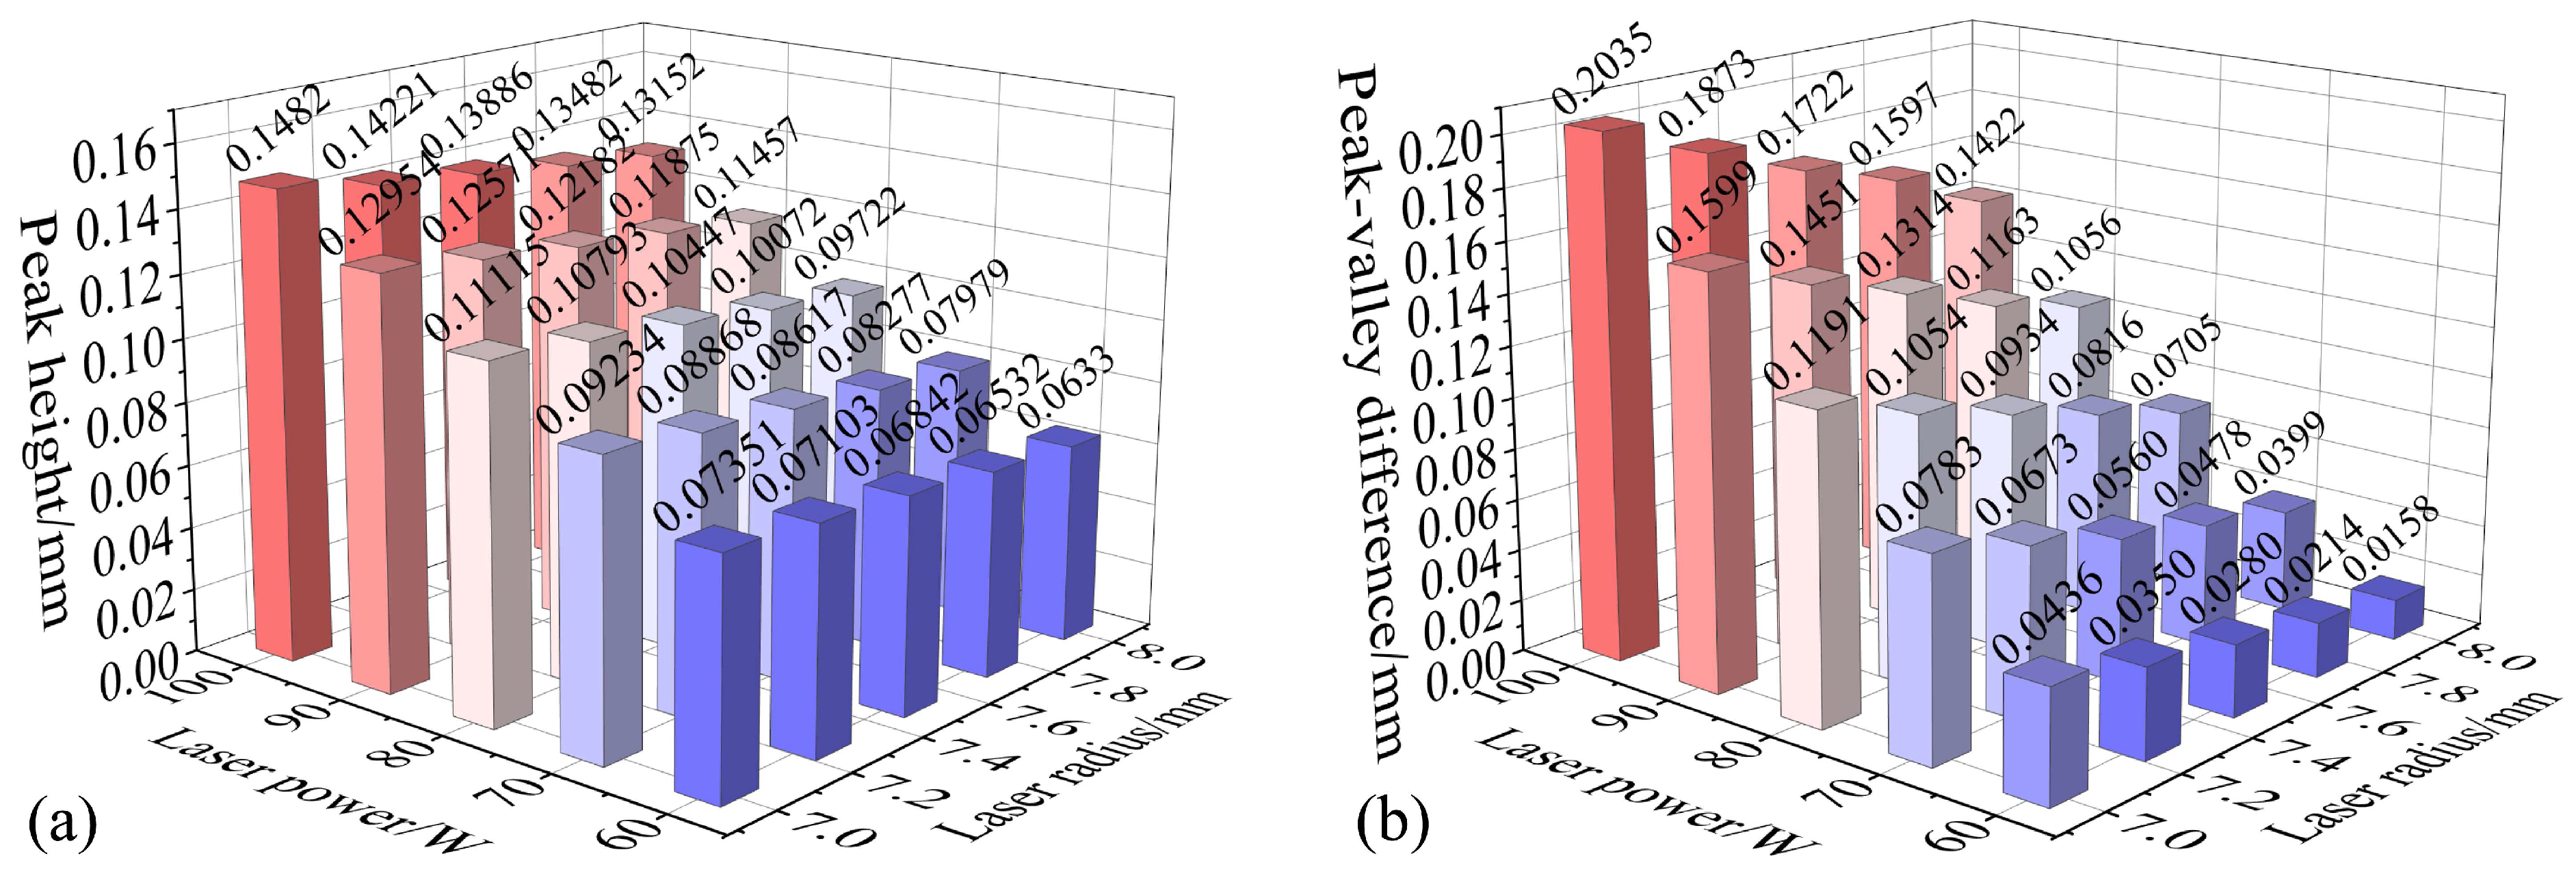
Figure 11 presents the experimentally obtained surface morphology parameters under varying laser powers and spot radii, including the peak height Hm (Figure 11a) and the peak-to-valley height difference ΔH (Figure 11b). Both metrics exhibit consistent and systematic dependencies on the processing conditions. Increasing the laser power results in greater peak elevation and larger ΔH, reflecting the stronger temperature gradients and accelerated cooling that enhance non-uniform volumetric shrinkage. In contrast, enlarging the spot radius reduces the deformation amplitude, as the broadened thermal influence region weakens spatial temperature differences and promotes more uniform solidification.
Figure 11.
Melt pool surface characteristics under different laser parameters: (a) Peak height; (b) Peak-to-valley height difference.
Based on the data in Figure 11, quantitative mapping relationships were constructed to link the laser parameters to the surface morphology outcomes. The peak height Hm and the peak-to-valley height difference ΔH were expressed as functions of laser power P and spot radius r, A preliminary regression yields the following representative forms:
The fitted models show excellent agreement with the experimental data. For the peak height Hm, the regression achieves an R2 value of 0.9998 with an RMSE of 0.00046, while the fit for the peak-to-valley height difference ΔH yields an R2 of 0.9996 and an RMSE of 0.00127. These results indicate that the constructed mapping relationships can accurately predict the final surface morphology from the given laser parameters. Accordingly, the models provide a robust quantitative basis for surface-shape forecasting.
The established mapping between laser parameters and the geometric characteristics of the M-shaped surface after cooling provides a practical basis for process design in laser selective forming of optical glass. By enabling the prediction and evaluation of final surface morphology under given laser conditions, this approach supports parameter selection for precision optical components, such as micro-optical elements and optical array mirrors.
6. Conclusions
The paper mainly investigated the dynamic evolution of glass surface morphology during laser local melting and subsequent cooling shrinkage through combined experiments and numerical simulations. Firstly, the evolution of the temperature field, flow field, and surface profile during laser irradiation and cooling was analyzed. Then, the mechanisms of Marangoni convection, volume contraction, and viscoelastic deformation governing the morphological transition were revealed. Finally, the mapping relationship between the parameters of the M-shaped curved surface and the laser parameters was analyzed. The specific conclusions can be summarized as follows.
- (1)
- During laser irradiation, the molten pool maintains a stable convex shape driven by surface tension and Marangoni flow. Once the laser is turned off, nonuniform temperature gradients and volume contraction cause the molten glass to flow inward, forming a characteristic M-shaped profile with a central depression and raised edges. The simulated results show good agreement with experiments, with the average deviation in surface profile less than 0.008 mm.
- (2)
- The evolution of the molten pool exhibits multi-stage transient characteristics. During the heating stage, it is characterized by: initially, it is a reaction stage controlled by thermal forces; at this time, the fluid mobility is limited and mainly dominated by thermal expansion; as the viscosity of the molten pool decreases, the molten pool enters a redistribution stage controlled by convection. During the cooling stage, it is mainly characterized by progressive solidification and viscous elastic contraction. The formation of a rigid boundary layer limits the internal flow, while temperature-dependent rheological recovery drives the material to redistribute until the morphology gradually stabilizes. The transitions between these stages are mainly dominated by density changes and temperature-dependent viscosity, which determine the speed of surface deformation and the final stable state of the glass morphology.
- (3)
- The quantitative assessment based on the total width (Wm), peak height (Hm), and peak-to-valley height difference (ΔH) indicates that higher laser power will make the temperature gradient within the molten pool steeper, thereby accelerating the cooling rate and causing more significant uneven contraction, and consequently increasing the values of Hm and ΔH. In contrast, increasing the laser spot radius will expand the heat-affected zone and reduce the temperature gradient, thereby suppressing the deformation amplitude and producing a smoother surface profile.
- (4)
- Based on the experimental data, a quantitative mapping relationship between the laser processing parameters and the surface morphology parameters (Hm and ΔH) was established, enabling predictive control of the final surface shape.
Author Contributions
Conceptualization, L.N. and X.Z.; Methodology, L.N.; Software, L.N. and W.F.; Validation, L.N. and X.Z.; Formal analysis, W.F.; Data curation, L.N.; Writing—original draft preparation, L.N.; Writing—review and editing, W.F. and X.Z.; Supervision, X.Z.; Funding acquisition, W.F. All authors have read and agreed to the published version of the manuscript.
Funding
This research is supported by Basic and Applied Basic Research Fund of Guangdong Province (Grant No. 2021A1515110927); The Open Project Program of Key Laboratory for Cross-Scale Micro and Nano Manufacturing, Ministry of Education, Changchun University of Science and Technology (Grant No. CMNM-KF202108); Scientific Research Project of Education Department of Guangdong Province (Grant No. 2022KCXTD029).
Data Availability Statement
The original contributions presented in this study are included in the article. Further inquiries can be directed to the corresponding author.
Conflicts of Interest
The authors declare no conflicts of interest.
Appendix A
Appendix A.1
Figure A1.
Temperature-dependent property curves of K9 glass: (a) Density, (b) Thermal conductivity, (c) Viscosity, and (d) Surface tension.
Appendix A.2
Table A1.
Material parameters used in the simulation.
References
- Yang, D.; Zhang, Z.; Wei, F.; Li, S.; Liu, M.; Lu, Y. Comprehensive review on research status and progress in precision grinding and machining of BK7 glasses. Micromachines 2024, 15, 1021. [Google Scholar] [CrossRef] [Scilit]
- Xie, K.; Su, Y.; Huang, H.; Liu, Y.; Wang, Y.; Weng, Z.; Chen, H.; Wang, L.; Wu, Z. Design, fabrication, and characterization of hemispherical glass optics for MEMS mirror packaging applications. Opt. Express 2025, 33, 13343–13357. [Google Scholar] [CrossRef] [Scilit] [PubMed]
- Hu, W.; Teng, Q.; Hong, T.; Saetang, V.; Qi, H. Stress field modeling of single-abrasive scratching of BK7 glass for surface integrity evaluation. Ceram. Int. 2022, 48, 12819–12828. [Google Scholar] [CrossRef] [Scilit]
- Deshmukh, S.S.; Goswami, A. Recent developments in hot embossing–a review. Mater. Manuf. Process. 2021, 36, 501–543. [Google Scholar] [CrossRef] [Scilit]
- Yu, M.; Du, L.; Zhai, K.; Cheng, H.; Wang, F.; Li, A.; Wang, Z. Towards understanding uniformity of megasonic-assisted through-mask electrochemical micromachining based on bubble dynamics. J. Manuf. Process. 2023, 96, 125–137. [Google Scholar] [CrossRef] [Scilit]
- Lohse, D. Fundamental fluid dynamics challenges in inkjet printing. Annu. Rev. Fluid Mech. 2022, 54, 349–382. [Google Scholar] [CrossRef] [Scilit]
- Kim, B.S.; Lee, N.; Thota, S.; Gemming, T.; Cho, H.H. Effects of radiative local heating on metal solidification during selective laser melting for additive manufacturing. Appl. Surf. Sci. 2019, 496, 143594. [Google Scholar] [CrossRef] [Scilit]
- Siao, Y.H.; Wen, C.D. Examination of molten pool with Marangoni flow and evaporation effect by simulation and experiment in selective laser melting. Int. Commun. Heat Mass Transf. 2021, 125, 105325. [Google Scholar] [CrossRef] [Scilit]
- Gräf, S.; Kunz, C.; Müller, F.A. Formation and properties of laser-induced periodic surface structures on different glasses. Materials 2017, 10, 933. [Google Scholar] [CrossRef] [Scilit]
- Zhao, Y.; Han, B.; Shen, Z.; Li, Z.; Pan, Y. Melt flow and ripple formation induced by continuous wave laser irradiating of copper foil at 10 Pa. Opt. Laser Technol. 2023, 161, 109169. [Google Scholar] [CrossRef] [Scilit]
- Jin, P.; Tang, Q.; Song, J.; Feng, Q.; Guo, F.; Fan, X.; Jin, M.; Wang, F. Numerical investigation of the mechanism of interfacial dynamics of the melt pool and defects during laser powder bed fusion. Opt. Laser Technol. 2021, 143, 107289. [Google Scholar] [CrossRef] [Scilit]
- Ni, X.; Wang, A.; Hu, Z.; Yang, W.; Hu, Z.; Luo, Y.; Zhao, Z.; Deng, X.; Wang, H.; Qu, Z.; et al. Thermodynamic study of molten pool during selective laser melting of alsi10mg alloy. Therm. Sci. 2024, 28, 5231–5243. [Google Scholar] [CrossRef] [Scilit]
- Skiba, M.; Resche, S.; Seiler, M.; Lasagni, A.F.; Bliedtner, J. Targeted Microforming of Borosilicate Glass Induced by a Laser-Ablation-Free Process Using Femtosecond Pulses. Adv. Mater. Interfaces 2024, 11, 2400439. [Google Scholar] [CrossRef] [Scilit]
- Nishida, Y.; Shimizu, M.; Okuno, T.; Matsuoka, J.; Shimotsuma, Y.; Miura, K. Ultra-high temperature Soret effect in a silicate melt: SiO2 migration to cold side. J. Chem. Phys. 2023, 159, 134504. [Google Scholar] [CrossRef] [Scilit]
- Shen, X.; Song, C.; Shi, F.; Tian, Y.; Tie, G.; Qiao, S.; Peng, X.; Zhang, W.; Hou, Z. Research on laser-induced damage post-restoration morphology of fused silica and optimization of patterned CO2 laser repair strategy. Micromachines 2023, 14, 1359. [Google Scholar] [CrossRef] [Scilit]
- Leung, C.L.A.; Marussi, S.; Towrie, M.; Garcia, J.d.V.; Atwood, R.C.; Bodey, A.J.; Jones, J.R.; Withers, P.J.; Lee, P.D. Laser-matter interactions in additive manufacturing of stainless steel SS316L and 13-93 bioactive glass revealed by in situ X-ray imaging. Addit. Manuf. 2018, 24, 647–657. [Google Scholar] [CrossRef] [Scilit]
- Panahibakhsh, S.; Jelvani, S.; Jaberi, M. Micro-and nanostructures formation on glass surface with different parameters of excimer laser irradiation. Opt. Eng. 2019, 58, 011005. [Google Scholar] [CrossRef] [Scilit]
- Shimizu, M.; Sakakura, M.; Ohnishi, M.; Yamaji, M.; Shimotsuma, Y.; Hirao, K.; Miura, K. Three-dimensional temperature distribution and modification mechanism in glass during ultrafast laser irradiation at high repetition rates. Opt Express 2012, 20, 934–940. [Google Scholar] [CrossRef] [Scilit] [PubMed]
- Dai, W.; Xiang, X.; Jiang, Y.; Wang, H.; Li, X.; Yuan, X.; Zheng, W.; Lv, H.; Zu, X. Surface evolution and laser damage resistance of CO2 laser irradiated area of fused silica. Opt. Lasers Eng. 2011, 49, 273–280. [Google Scholar] [CrossRef] [Scilit]
- Kumar, A.; Ramadas, H.; Kumar, C.S.; Nath, A.K. Laser polishing of additive manufactured stainless-steel parts by line focused beam: A response surface method for improving surface finish. J. Manuf. Process. 2025, 133, 1310–1328. [Google Scholar] [CrossRef] [Scilit]
- Lu, H.; Wang, D.; Wu, S.; Pan, Z.; Wang, G.; Guo, G.; Tian, Y.; Xiang, D. A review of laser polishing on Ti6Al4V based on energy density. J. Mater. Process. Technol. 2024, 331, 118520. [Google Scholar] [CrossRef] [Scilit]
- Prado, M.O.; Benedetto, F.E. Assigning Viscosity Values in the Glass Softening Temperature Range. Materials 2023, 16, 1596. [Google Scholar] [CrossRef] [Scilit] [PubMed]
Disclaimer/Publisher’s Note: The statements, opinions and data contained in all publications are solely those of the individual author(s) and contributor(s) and not of MDPI and/or the editor(s). MDPI and/or the editor(s) disclaim responsibility for any injury to people or property resulting from any ideas, methods, instructions or products referred to in the content. |
© 2026 by the authors. Licensee MDPI, Basel, Switzerland. This article is an open access article distributed under the terms and conditions of the Creative Commons Attribution (CC BY) license.