


Abstract
The Nuri deposit is currently the only Cu-W-Mo deposit in the Gangdese metallogenic belt, Tibet, China, that contains large-scale tonnages for both Cu and WO3 resources, accompanied by a medium-scale Mo resources. Previous studies have suggested the potential presence of concealed porphyry-type orebodies at depth, yet effective exploration tools for verifying this hypothesis remain lacking. In this study, microscopic identification, electron probe microanalysis (EPMA), and laser ablation inductively coupled plasma mass spectrometry (LA-ICP-MS) were integrated to investigate the mineral chemical characteristics of chlorite from the Nuri deposit. The aim was to evaluate the effectiveness of chlorite geochemistry as an exploration vector for predicting deep concealed porphyry orebodies and to establish corresponding exploration indicators. Chlorite in the deposit can be genetically classified into metasomatic (Chl-I) and hydrothermal (Chl-II) types. Both types are Mg-rich varieties, indicating formation under conditions of low oxygen fugacity and low pH. With decreasing vertical distance to the orebody and toward the southeast direction of the exploration section, the contents of Ti (10–950 ppm) and V (50–820 ppm), as well as the Ti/Sr, Ti/Mn, Ti/Li, and V/Li ratios, progressively increase. In contrast, the concentrations of Li (36–390 ppm), Mn (1270–6730 ppm), Sr (1–510 ppm), and Zn (110–1100 ppm) systematically decrease. These systematic compositional variations demonstrate that chlorite geochemistry is an effective exploration tool in the Nuri mining area and suggest the presence of a concealed mineralization center or porphyry orebody beneath the interval from ZK4501 to ZK4502.
1. Introduction
The Gangdese metallogenic belt is one of the most important metal enrichment zones on the Tibetan Plateau. Its formation is closely related to the accretion–collision orogeny associated with the subduction and demise of the Neo-Tethys Ocean [1,2,3,4]. The central part of this belt hosts numerous porphyry–skarn Cu-Mo polymetallic deposits. These include world-class super-large deposits, such as Qulong and Jiama, as well as medium- to large-size deposits, like Nuri, Zhibula, Zhunuo, and Tinggong. Most of these deposits are related to Miocene adakitic porphyry intrusions and Jurassic–Cretaceous carbonate strata [5,6]. Adakitic magmatic activity in the post-collisional setting mainly occurs in the southern Lhasa terrane, south of the Yarlung Zangbo suture zone. The emplacement ages of these intrusions range from 25 to 9 Ma [7,8,9,10,11]. The southern margin of the Gangdese belt is characterized by juvenile lower crust in the east and ancient or mixed crust in the west. It hosts an east–west-trending belt of large to super-large Cu polymetallic deposits [6,12]. In recent years, exploration in this belt led to the discovery of the Nuri Cu-W-Mo ore district north of Zetang, adjacent to the Yarlung Zangbo suture zone [13,14].
Previous geochronological analyses of magmatic rocks from the surface and some drill holes in the Nuri deposit yielded ages of 95.93–33.76 Ma [15,16]. These ages are all older than the molybdenite Re-Os mineralization age (~24 Ma) [17]. This indicates that the ore-forming parent intrusion may be located at depth. In addition, drill core observations reveal a well-developed fracture–vein system related to underplating of deep intrusions [18,19]. Proven shallow skarn–deep porphyry systems are widely developed in the eastern Gangdese belt (e.g., Jiama, Zhibula). Clinopyroxene–garnet pairs from the Nuri deposit record weakly acidic and strongly oxidizing hydrothermal conditions [20,21]. These features suggest that the exposed skarn mineralization at Nuri likely represents the shallow expression of a deeper porphyry Cu–W–Mo system. However, traditional geophysical and geochemical methods are limited by detection depth, resolution, and interpretation certainty [22], resulting in high exploration costs and low success rates. To date, no substantial breakthrough has been achieved, and the existence of deep concealed orebodies remains supported mainly by indirect geological evidence.
Among the various alteration minerals developed in the Nuri deposit, including garnet, diopside, epidote, and sericite, chlorite was selected as the primary exploration indicator mineral for several reasons. First, chlorite is the most ubiquitous alteration mineral throughout the Nuri system, occurring in all alteration zones from proximal skarn to distal propylitic alteration, ensuring spatial continuity of sampling. Second, unlike garnet and diopside, which are restricted to the skarn zone, chlorite spans the entire vertical and horizontal extent of the hydrothermal system, allowing comprehensive vectoring. Third, extensive global research has established well-calibrated geochemical vectoring frameworks for chlorite in porphyry systems [23,24,25], providing a robust basis for comparison. Fourth, chlorite’s crystal structure readily accommodates a wide range of trace elements through isomorphous substitution, making its composition highly sensitive to variations in hydrothermal conditions.
Recent exploration in the Nuri ore district has encountered major bottleneck s in deep and peripheral prospecting, with no significant breakthrough achieved. Therefore, this study focuses on chlorite, which is widely developed throughout the Nuri deposit. Chlorite samples were systematically collected along the well-constrained exploration Line No. 45. Through in situ major and trace element analyses, this study aims to establish chlorite-based geochemical vectors for deep mineral exploration and to provide a reliable guide for future prospecting in the Nuri mining area.
2. Geological Setting
2.1. Regional Geology
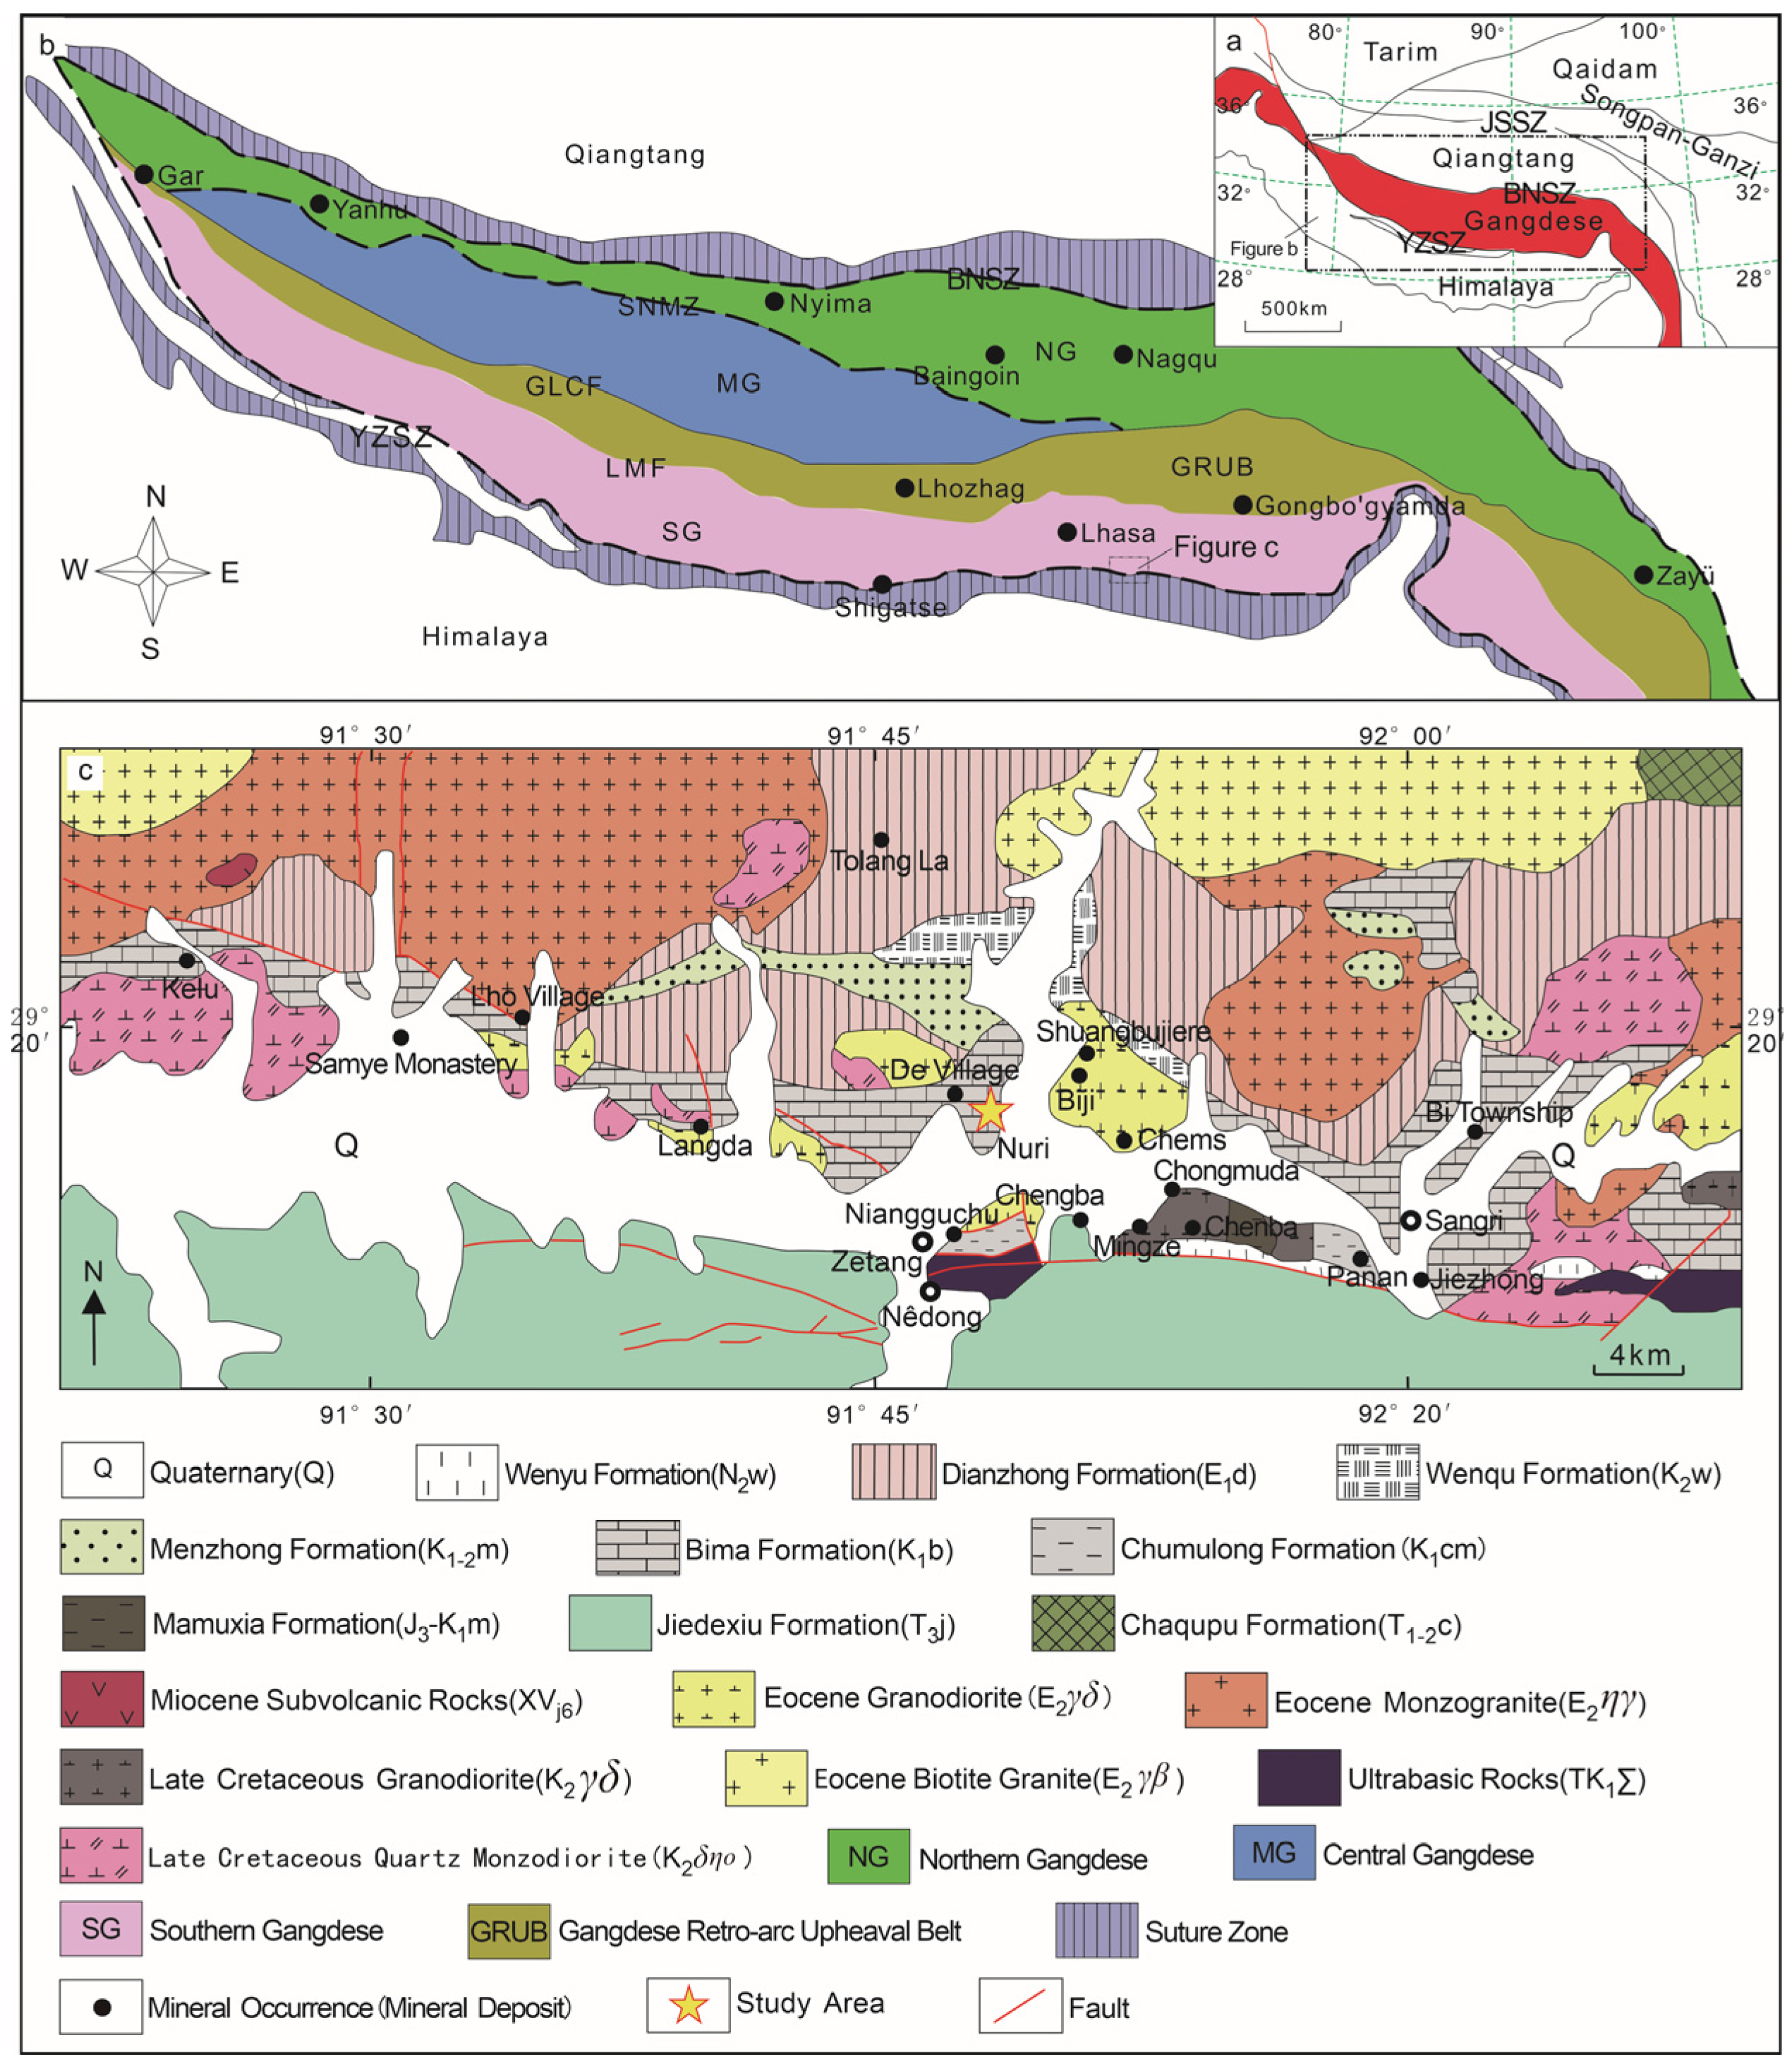
The Gangdese metallogenic belt in Tibet is a world-class Cu-Mo-Au-Ag-Pb-Zn polymetallic belt within the Tethys–Himalayan metallogenic domain, one of the three major global porphyry belts [2,6,26]. The belt extends in an east–west-trending elongate zone and is bounded by the Bangonghu–Nujiang Suture Zone (BNSZ) to the north and by the Indus–Yarlung Zangbo Suture Zone (YZSZ) to the south (Figure 1a) [1,27,28]. Its evolution resulted from prolonged northward subduction of the Neo-Tethys Ocean and subsequent India–Eurasia continental collision orogeny, accompanied by extensive geological, tectonic, and magmatic activities, ultimately stabilizing in the Late Cenozoic. The belt is characterized by widespread intermediate–acid, shallow to mid-level intrusions and well-developed fault systems, providing exceptional metallogenic conditions for ore exploration [1,4,6,27,28,29,30].
The Gangdese metallogenic belt can be divided into three sub-belts—northern, central, and southern—based on distinct ore metal assemblages and spatial distribution (Figure 1b) [31,32,33]. Previous studies indicate that the northern sub-belt (NG) is dominated by hydrothermal vein-type, skarn-type, and porphyry-type deposits, forming a Pb-Zn-Ag polymetallic metallogenic sub-belt. Representative deposits include the Mengya’a skarn Pb-Zn-Ag deposit, the Yaguila skarn–porphyry Pb-Zn-Mo deposit, the Dongzhongsongduo skarn Pb-Zn deposit, and the Sharang porphyry Mo deposit [34].
The central sub-belt (MG) is dominated by porphyry Cu-Mo polymetallic deposits and represents the largest mineralization concentration area within the Tibetan Plateau orogenic belt. The deposits are mainly medium to large in scale, with representative examples including the Zhunuo, Chongjiang, and Tinggong Cu deposits [35,36].
The southern sub-belt (SG) hosts porphyry–skarn Cu-W-Mo polymetallic deposits, with larger ones including the Nuri Cu-W-Mo deposit, the Mingze Mo deposit, the Kelu Cu-Au deposit, the Chongmuda Cu-Au deposit, and the Chenba Cu-Au deposit [37,38]. Furthermore, a pronounced north–south spatial zonation in mineralization element assemblages is evident, displaying a trend from Fe(Cu) in the north, through Pb-Zn(Ag-Mo) and Cu-Mo, to W-Mo(Cu) and Cu-Au in the south [29,38]. This distinctive zoning pattern of ore-forming elements is closely related to the multi-stage tectonic, magmatic, and metallogenic evolution of the region.
Figure 1.
Tectonic sketch map of the Tibetan Plateau and the Gangdese belt (a,b) and geological sketch map of the Nuri area (c) [36,39]. JSSZ, Jinshajiang Suture Zone; BNSZ, Bangonghu–Nujiang Suture Zone; YZSZ, Yarlung Zangbo Suture Zone; SNMZ, Shiquanhe–Namuco Ophiolitic Mélange Zone; GLCF, Gar–Lunggar–Coqên Fault Zone; LMF, Luobadui–Milashan Fault Zone; NG, Northern Gangdese; MG, Central Gangdese; GRUB, Gangdese Retro-arc Upheaval Belt; SG, Southern Gangdese.
2.2. Deposit Geology
The Nuri deposit (Cu 0.55 Mt @ 0.70%, WO3 0.20 Mt @ 0.22%, Mo 0.03 Mt @ 0.07%) is located northeast of Zetang Town in the Shannan region of Tibet, at the intersection of the southern margin of the eastern Gangdese metallogenic belt (Figure 1c). The exposed stratain the mining area are relatively simple and consist mainly of the Lower Cretaceous Sangri Group Bima Formation (K1b), with subordinate Upper Cretaceous–Paleogene Danshiting Formation (K2–Ed) andesitic volcanic rocks intercalated with clastic rocks and carbonates, unconformably overlain by Quaternary aeolian deposits [17,38,40,41].
The Bima Formation (K1b) in this mining area is subdivided into the third (K1b3), fourth (K1b4), and fifth (K1b5) members of the Bima Formation. Among these, the fourth lithologic member is most closely related to mineralization and mainly comprises marble and argillaceous limestone with minor intercalated sandstone. This unit is strongly skarnized and serves as the principal ore-hosting horizon for skarn orebodies [38].
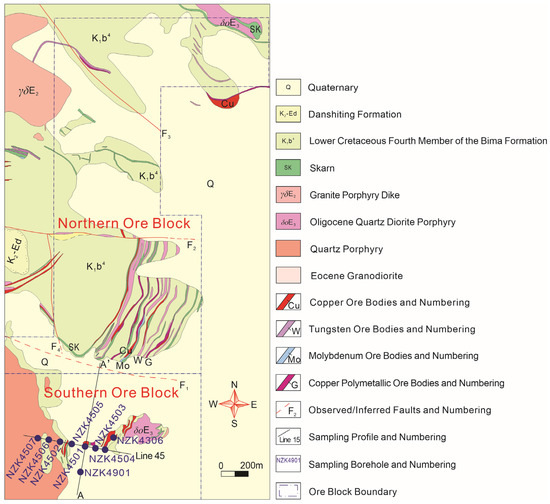
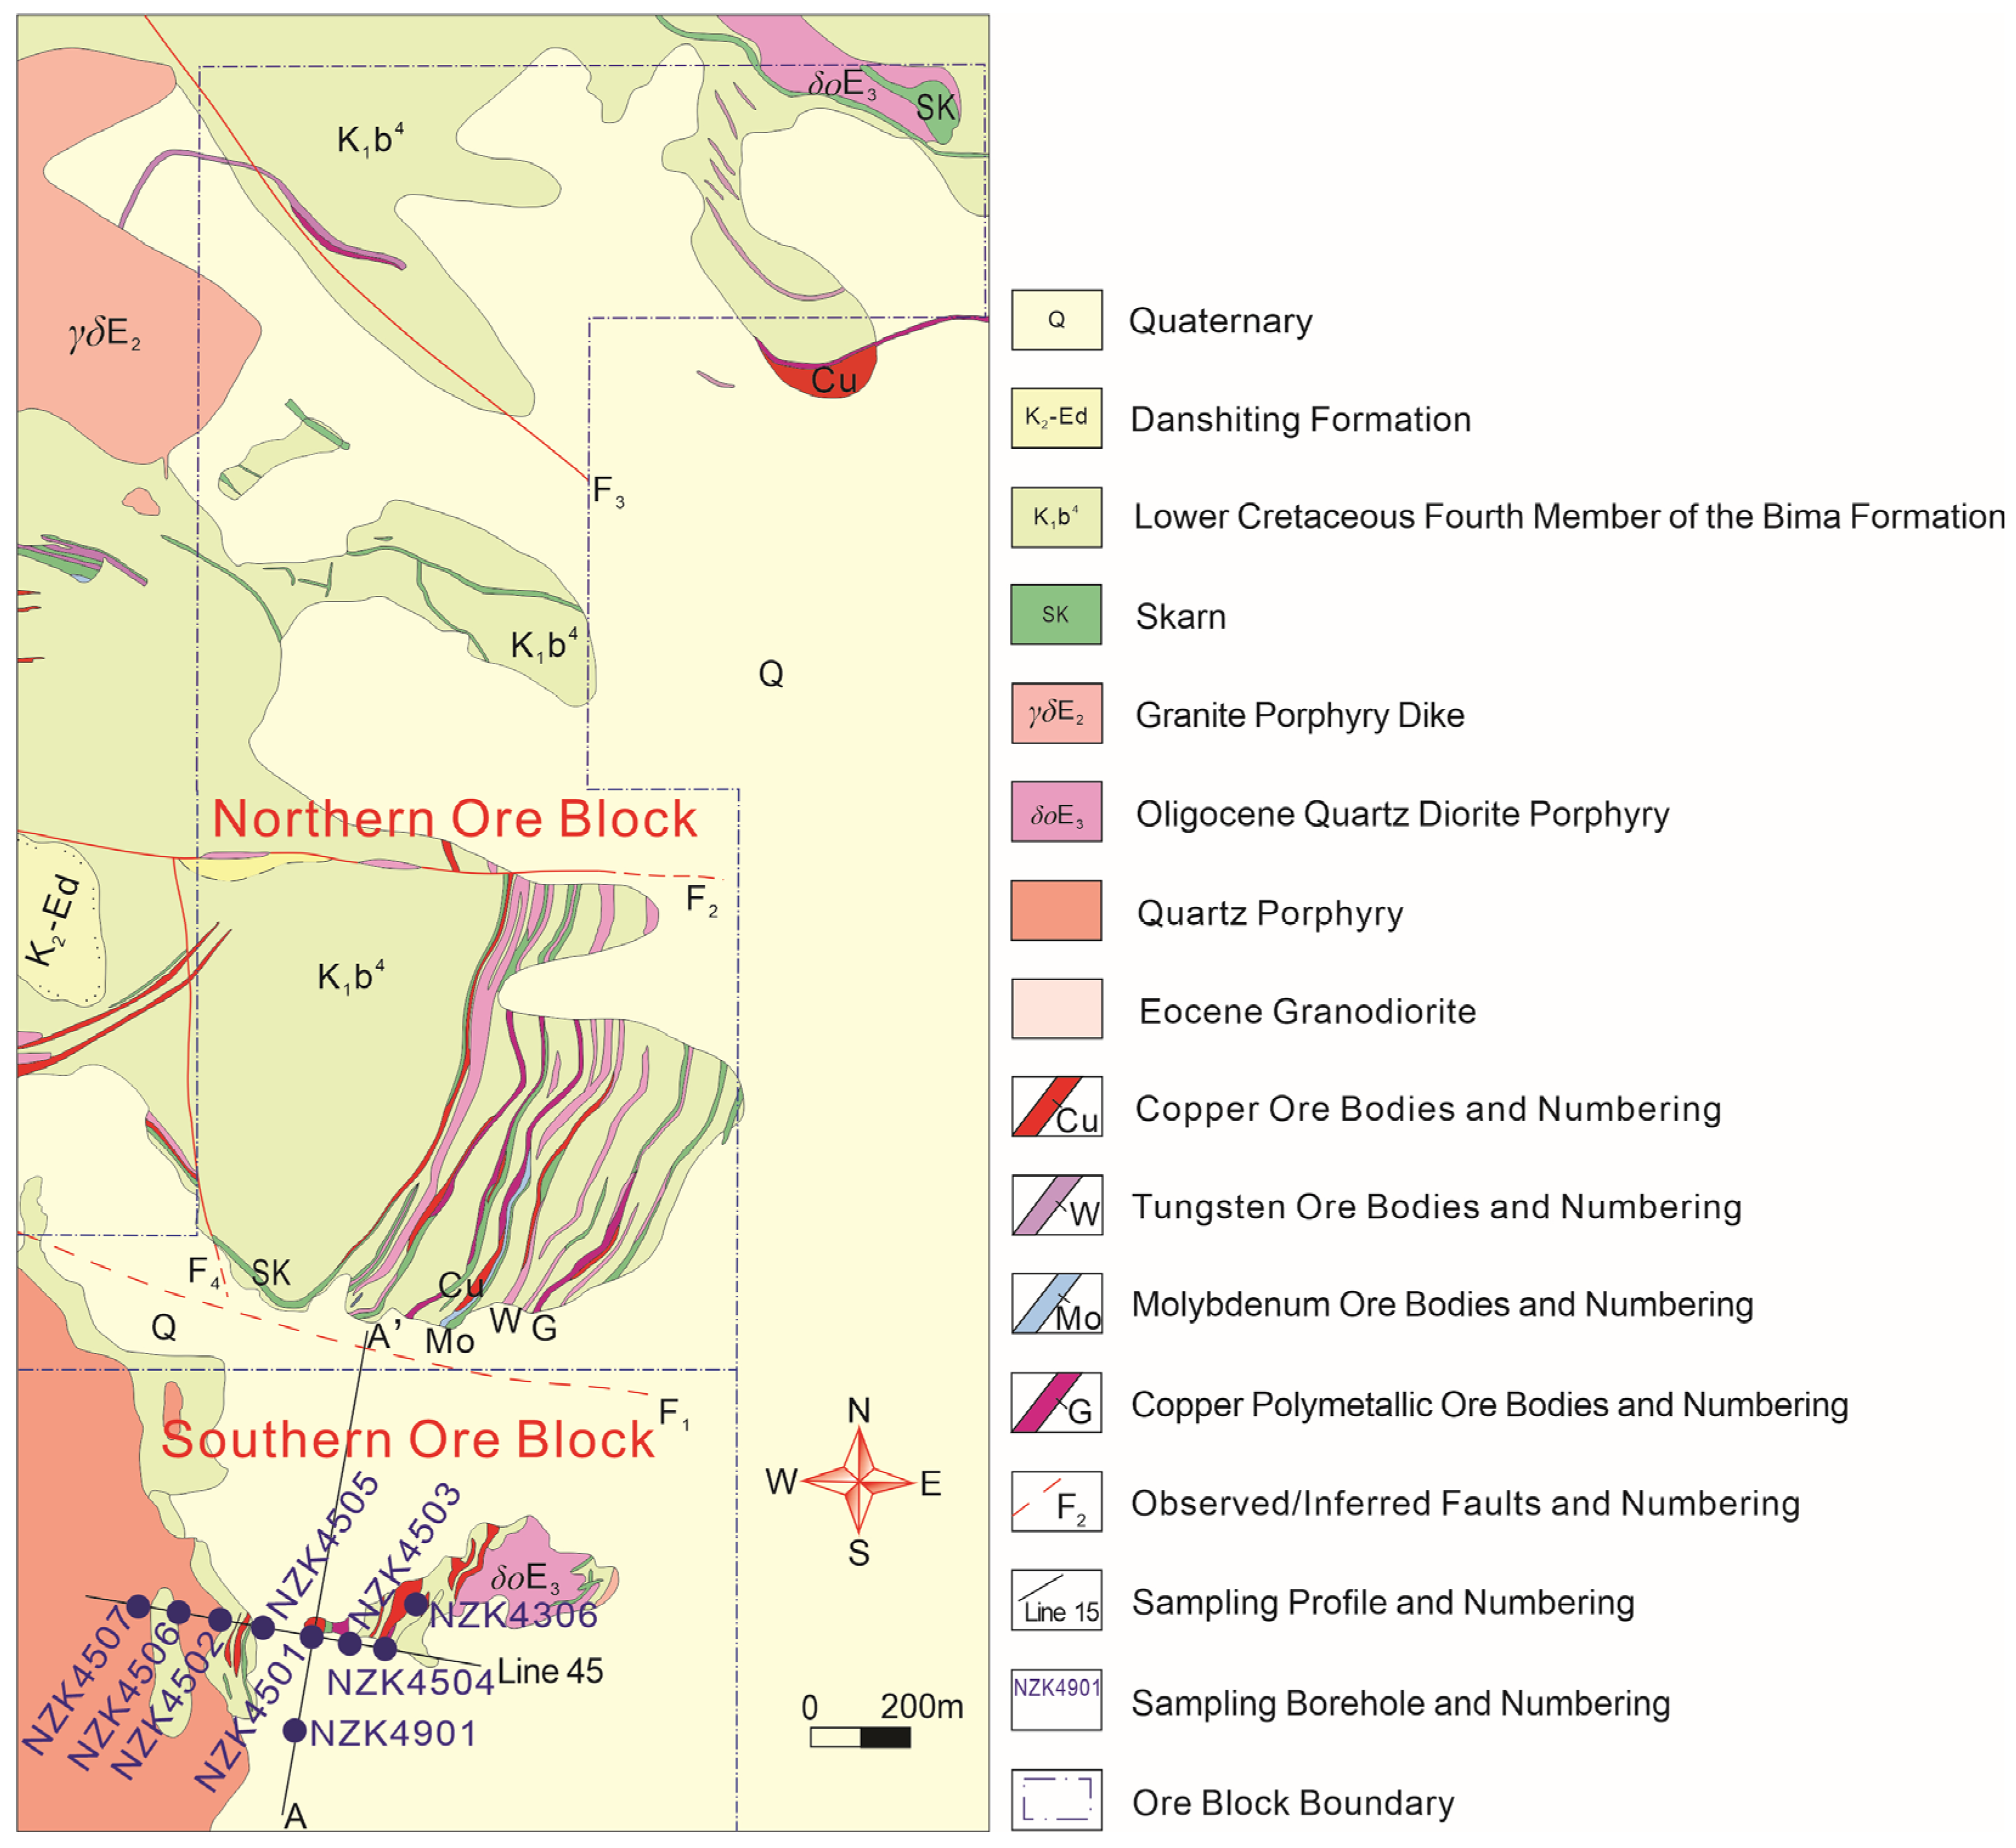
The Nuri deposit is mainly controlled by three groups of NE-trending faults [26,42]. The fault dominates the spatial distribution of the layered orebodies throughout the mining area, forming a series of secondary structural fracture zones on both sides that serve as conduits for ore–fluid migration. Along this fault zone, layered skarns such as diopside skarn and garnet skarn occur. The F2 fault extends in an east–west direction, dividing the deposit into northern and southern ore blocks. Due to sinistral strike–slip tectonism, the F2 fault disrupts the continuity of the orebodies but provides favorable pathways for later magmatic–hydrothermal fluids. The F3 fault exhibits a NW-trending orientation, dividing the northern ore block into two parts. Its sinistral strike–slip and drag action have significantly changed the orientation of the orebody in the northern block [14,21,43] (Figure 2).
Figure 2.
Geological sketch map of the Nuri Cu-W-Mo deposit and distribution of sampling drill holes [36,43].
Magmatic activity was intense in the Nuri mining area, with widespread magmatic rocks exposed, mainly consisting of intermediate–acid volcanic rock series from Late Yanshanian marine eruptions and Himalayan continental eruptions, as well as intermediate–acid intrusions emplaced into the arc volcanic rocks. Intrusive rocks mainly include quartz diorite (porphyrite), granodiorite, granite porphyry, and monzogranite [36,38].
Various types of wall–rock alteration are developed in the mining area, including skarnization, hornfelsization, propylitization, potassic alteration, and carbonatization. Limestone and marble predominantly exhibit skarnization and carbonatization. Meta-siltstone of the Bima Formation mainly displays hornfelsing and propylitization. Potassic alteration is manifested as biotitization and potassic feldspathization in the meta-siltstone of the Bima Formation and as sericitization in the intrusions [38,44]. Orebodies mainly occur as stratiform and stratoid bodies conformably within skarn, primarily hosted in lithological transition zones or interlayer fracture zones of the strata, and are enriched near intrusions and pinch out away from them [42,43]. Mineralization styles vary depending on the host rock. In skarn, molybdenite and chalcopyrite commonly occur as veinlets or fine veins together with quartz and pyrite, whereas scheelite mainly occurs as disseminations and fine veins. In granodiorite porphyry, hornfels, and altered sandstone, chalcopyrite mineralization is closely associated with biotitization and mainly occurs as veinlet-disseminated ores [38,40,44] (Table 1).
Table 1.
Summary of orebody characteristics, ore types, and wall–rock alteration at the Nuri Cu-W-Mo deposit.
Based on mineral replacement relationships and vein cross-cutting relationships, mineralization stages of the Nuri Cu-W-Mo deposit can be divided into four stages: the magmatic stage, skarn stage, quartz–sulfide stage, and supergene stage [36,38]. The magmatic stage represents the pre-ore stage and forms minerals such as augite, hornblende, plagioclase, and biotite. The skarn stage can be further subdivided into an early skarn substage and a later oxide substage. The skarn substage includes an early anhydrous skarn substage (garnet–diopside) and a late hydrous skarn substage (epidote–actinolite–chlorite). The oxide substage, characterized by magnetite–hematite–scheelite, represents the principal tungsten mineralization. The quartz–sulfide stage (quartz–sulfide–carbonate) is the main Cu-Mo mineralization stage. Chlorite investigated in this study mainly formed during the late hydrous skarn substage and the quartz–sulfide stage. The mineralization stages and paragenetic sequence of minerals for the Nuri Cu-W-Mo deposit are summarized in Table 2.
Table 2.
Mineralization stages and paragenetic sequence of the Nuri Cu-W-Mo deposit [36].
3. Sampling and Analytical Methods
3.1. Sampling
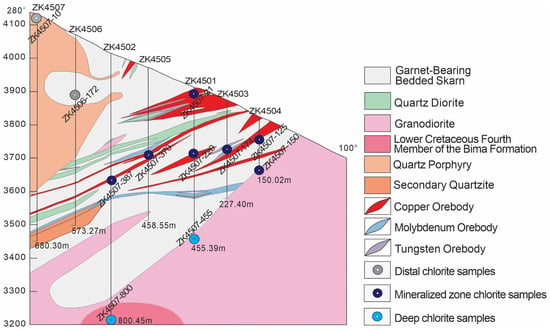
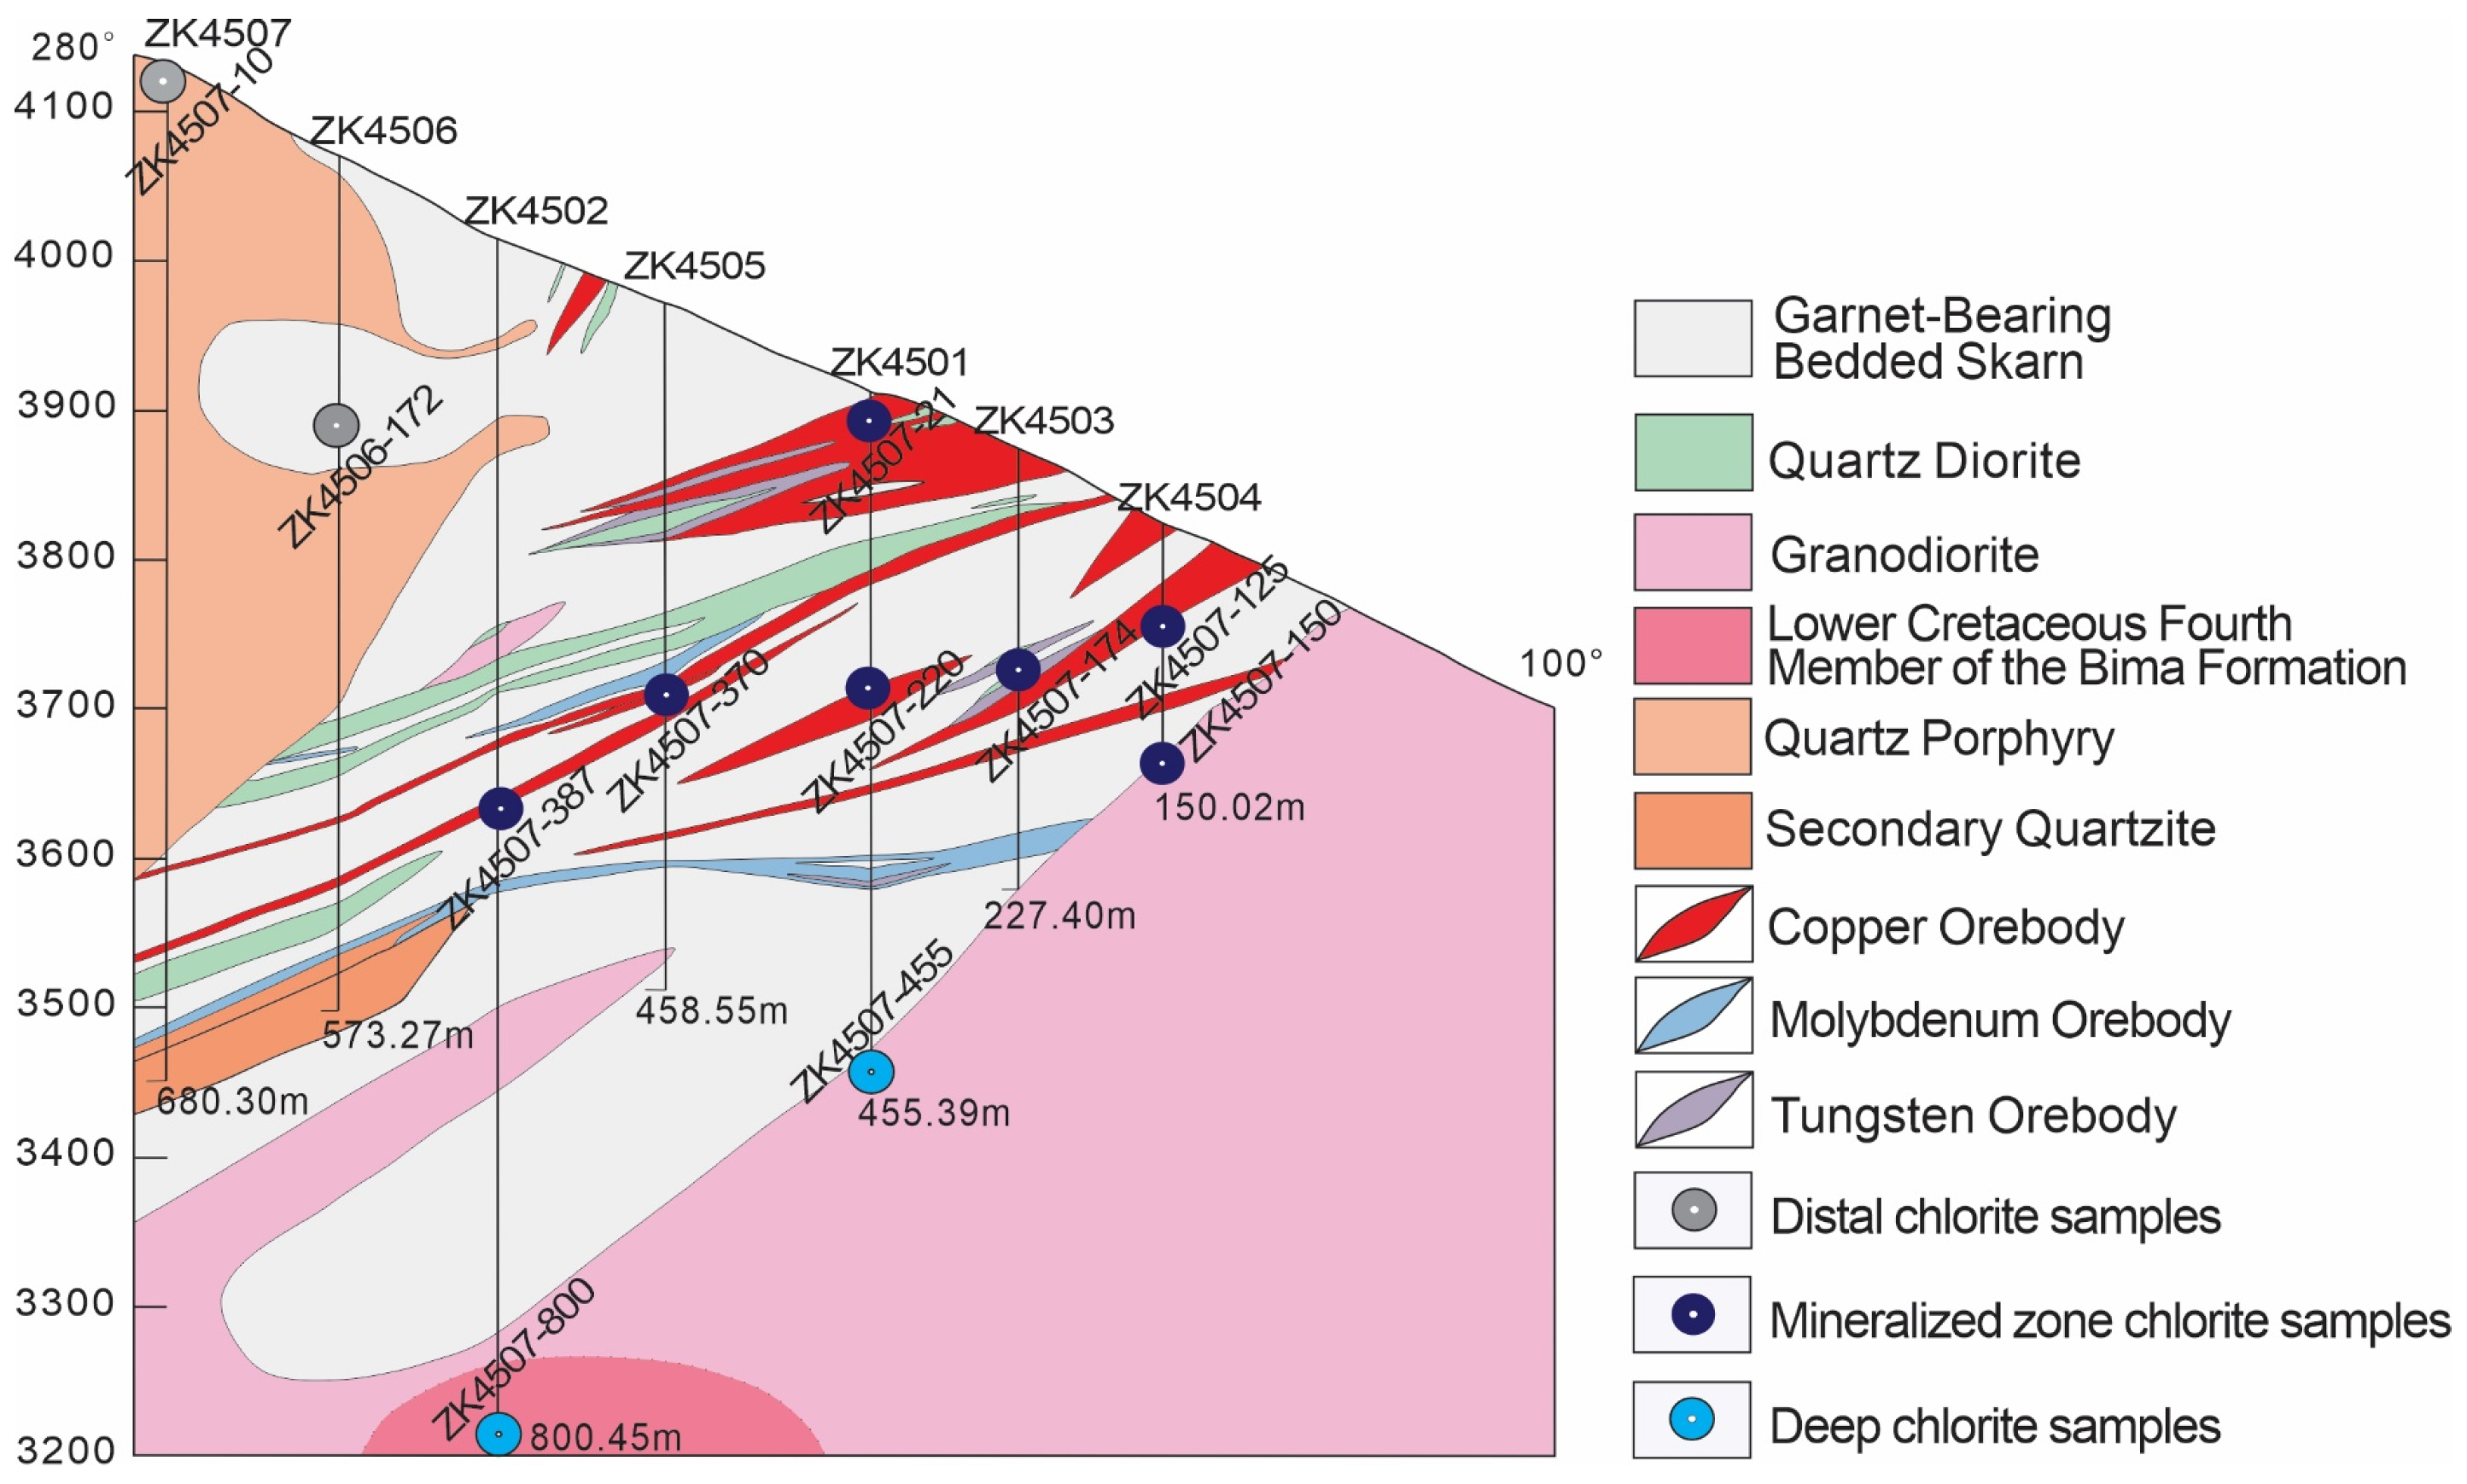
To more clearly elucidate the implications of chlorite geochemistry for mineral exploration, chlorite samples were collected from drill cores along exploration line 45 in the southern ore block, as well as from drill holes ZK4306 and ZK4901 on both sides of the exploration line. The collected samples are distributed at the top, center, and bottom of the orebodies. The locations of the drill holes and samples are shown in Figure 2 and Figure 3.
Figure 3.
Geological profile of exploration line 45 at the Nuri deposit.
3.2. EPMA
Major element analysis was performed at the laboratory of Guangzhou Tuoyan Analytical Technology Co., Ltd., using a JEOL JXA-iSP-100 electron probe microanalyzer equipped with five wavelength-dispersive spectrometers (JEOL Ltd., Tokyo, Japan). All samples were analyzed under the following conditions: accelerating voltage of 15 kV, beam current of 20 nA, and beam diameter of 5–10 μm. Matrix correction of all data was performed using the ZAF method during analysis. The contents of Si, Al, Zn, Cu, Ni, Ca, Ti, Na, Mg, Fe, Mn, and Cr were calibrated using metal standards and Chinese national reference materials (GSB), while K content was calibrated using MAC minerals from the UK. Given the complex structure and diverse formation mechanisms of chlorite, it commonly contains residual materials from incomplete replacement or mineral inclusions and coexists with other minerals [45,46]. Therefore, it is necessary to evaluate potential contamination effects on the EPMA data. It is generally accepted that chlorite with (CaO + Na2O + K2O) contents <0.5% is considered uncontaminated [45,47]. Consequently, this study only utilized chlorite data with (CaO + Na2O + K2O) ≤ 0.5%, leaving 37 valid major element analyses.
3.3. LA-ICP-MS
Normal chlorite trace element compositions exhibit Si contents of 100,000–225,000 ppm, K ≤ 1000 ppm, Ti ≤ 1000 ppm, and Zr ≤ 2 ppm. Following the CODES P1060 analytical and data processing protocols, the data were rigorously processed and screened, ultimately retaining 145 valid datasets as the foundation for subsequent discussion.
Trace element analysis was performed at the laboratory of Guangzhou Tuoyan Analytical Technology Co., Ltd., using a New Wave Research 193 nm ArF excimer laser ablation system (New Wave Research, Inc., Fremont, CA, USA) coupled with a Thermo Scientific iCap-RQ quadrupole ICP-MS (Thermo Fisher Scientific, Bremen, Germany). The analysis conditions were as follows: laser spot diameter of 35 μm, repetition rate of 6 Hz, and energy density of 3.5 J/cm2. Helium was used as the carrier gas during laser ablation, with argon as the makeup gas to optimize sensitivity. Calibration for trace element concentration measurements and data processing employed a multi-external standard total normalization method using glass reference materials NIST SRM 610 and BCR-2G [48]. Reference materials SRM 612 and BIR-1G were used as monitoring samples [49,50]. Each time-resolved analysis comprised approximately 40 s of background signal measurement and 45 s of sample signal acquisition. Offline data processing, including selection of sample and background signals, instrumental sensitivity drift correction, and element concentration calculation, was conducted using the 3D Trace Elements DRS module (v1.2, 2024) of IOLITE software (v4.8.2) [51]. Detailed analytical procedures are described in Liu et al. [48] and Chu et al. [52].
4. Results
4.1. Petrography
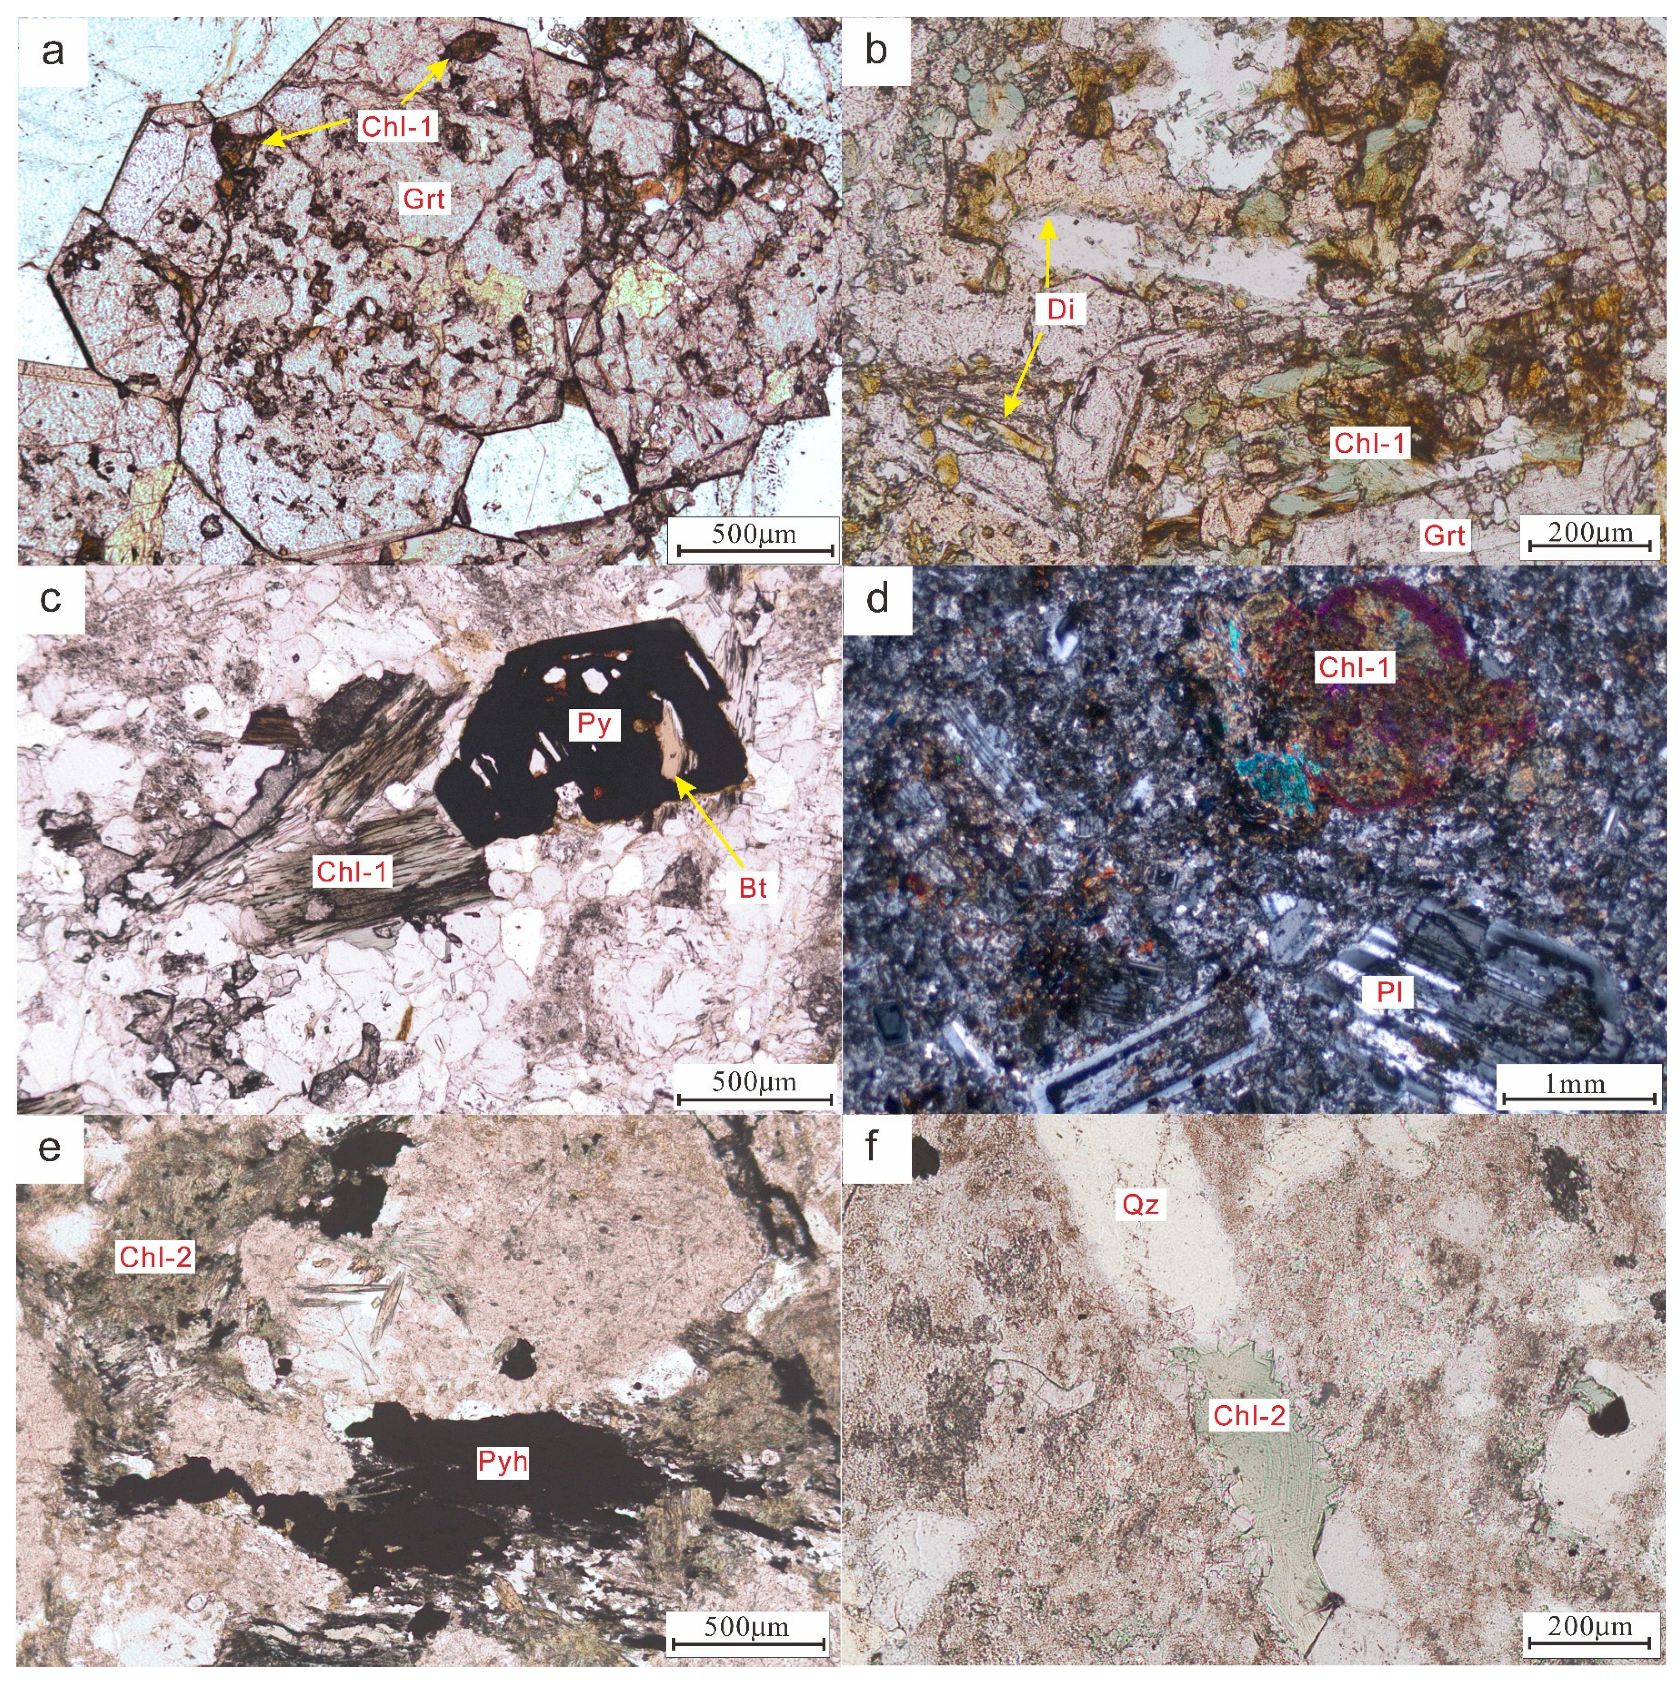
Petrographic observations indicate that two types of chlorite occur in the Nuri Cu-W-Mo deposit. One type is formed by alteration of early anhydrous skarn minerals, such as garnet and diopside (Figure 4a,b). The other type occurs within intrusions or altered sandstone, replacing mafic minerals, like biotite and hornblende, exhibiting flaky and disseminated textures (Figure 4c,d). It can also crystallize directly from hydrothermal fluids as fine-grained, scaly aggregates and as (micro)veins, where it is intergrown with quartz, calcite, epidote, pyrite, and chalcopyrite (Figure 4e,f).
Figure 4.
Petrography of chlorite from the Nuri deposit. (a) Chlorite replacing garnet. (b) Chlorite replacing diopside. (c) Chlorite replacing biotite. (d) Chlorite replacing hornblende. (e) Chlorite occurring as fine-grained scaly aggregates intergrown with pyrrhotite. (f) Chlorite occurring as veins. Mineral abbreviations: Bt, biotite; Chl, chlorite; Di, diopside; Grt, garnet; Pl, plagioclase; Py, pyrite; Pyh, pyrrhotite; Qz, quartz.
Under plane-polarized light, chlorite shows low positive relief and pleochroism ranging from pale green to bright yellow, with the color intensity affected by leaching. Under crossed polars, it displays oblique extinction, speckled extinction, and pleochroism, with interference colors varying from first-order gray to deep green; anomalous interference colors, typically indigo or purple, are occasionally observed (Figure 4d). Based on thin section observations, the chlorite in this study is classified into two types: primary metasomatic chlorite (Chl-1) and hydrothermal precipitated chlorite (Chl-2). Chl-1 consists mainly of flaky chlorite formed by replacement of early mafic minerals, such as amphibole and biotite, exhibiting relict or pseudomorphic textures. It is associated with quartz, hematite, pyrite, chalcopyrite, and bornite. Chl-2 occurs mainly as scaly and leaflike aggregates formed by dissolution–precipitation, intergrown with quartz, pyrite, chalcopyrite, bornite, and pyrrhotite.
4.2. Major Elements
The EPMA results for chlorite are listed in Table S1. Overall, chlorite from the Nuri Cu-W-Mo deposit exhibits a wide range of MgO and FeOT, high SiO2, and a relatively narrow range of Al2O3. Cation numbers were calculated based on 14 oxygen atoms using WinCcac software (v1.08) (Table S2).
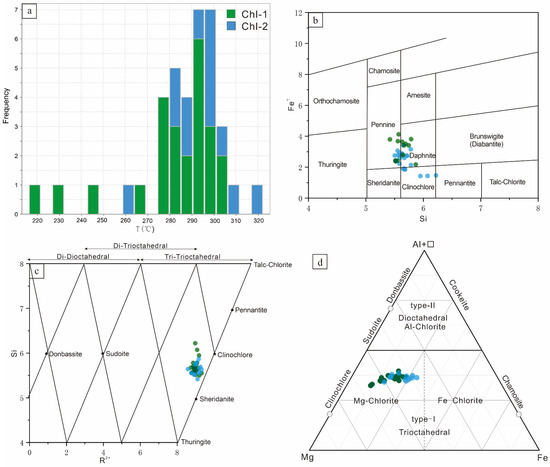
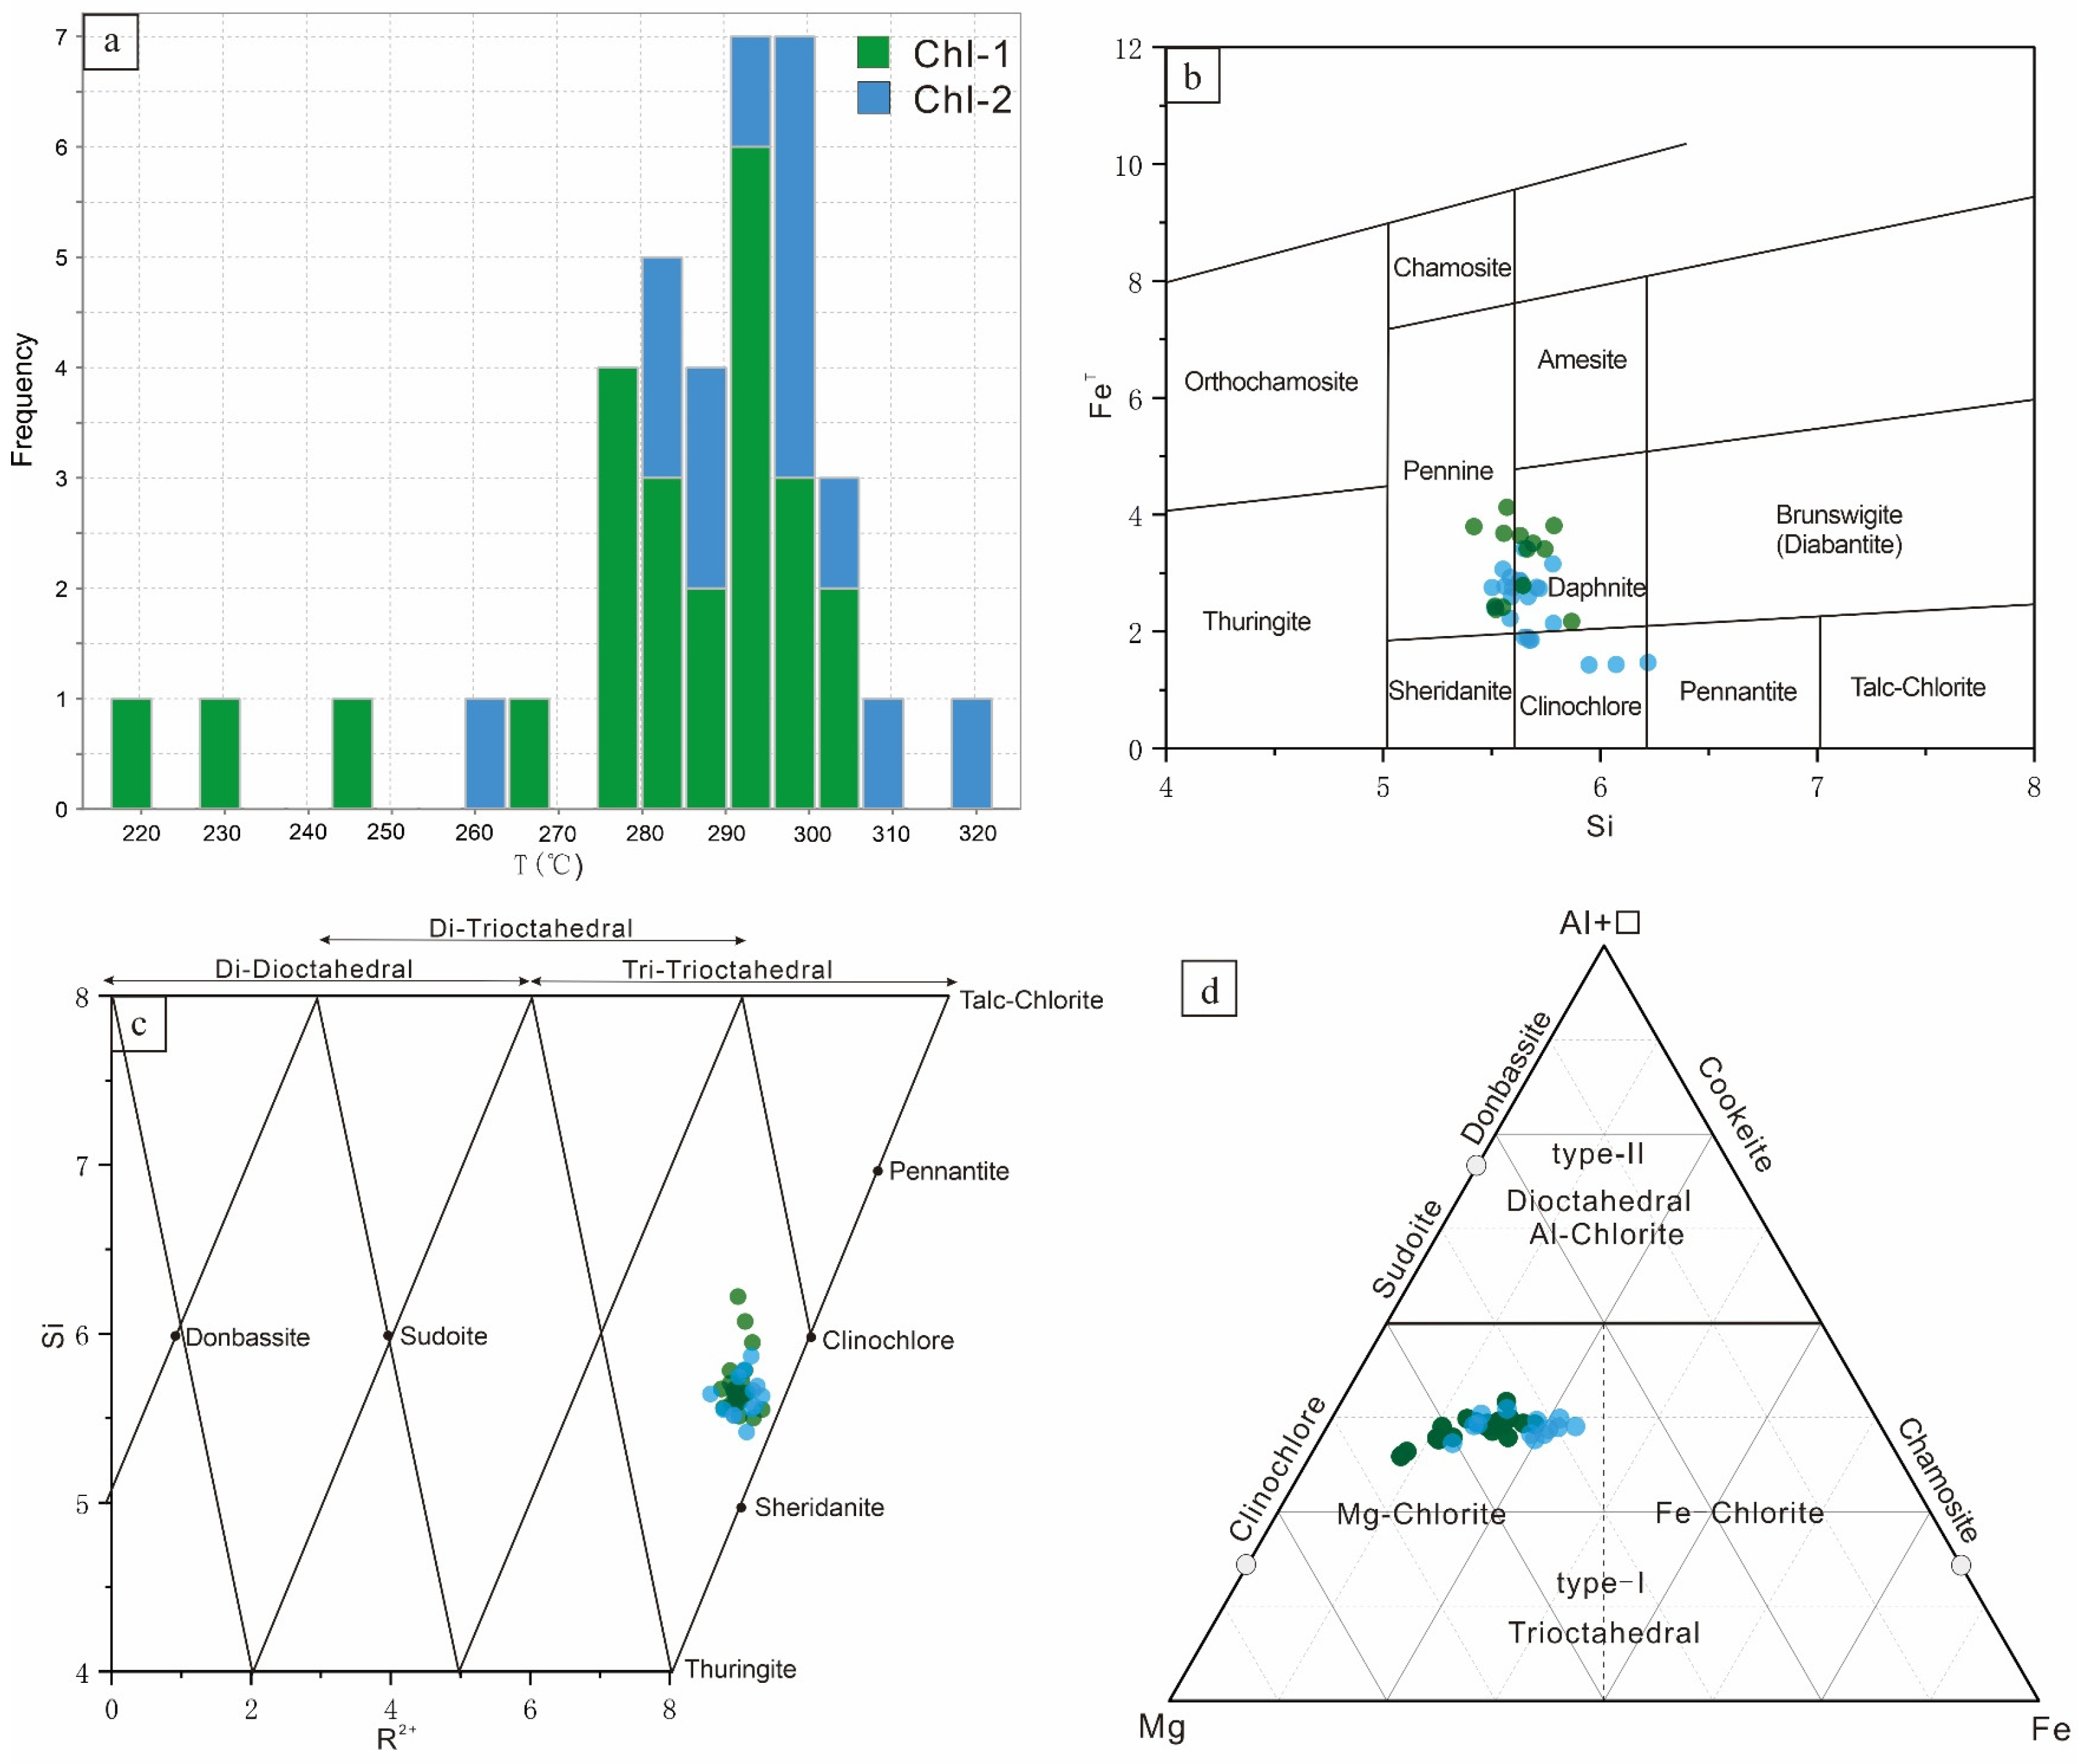
Since the 1980s, chlorite thermometry has evolved from empirical calibration to thermodynamic modeling and then to semi-empirical models [53,54,55,56,57]. It should be noted that the Kranidiotis and MacLean geothermometer was originally calibrated for massive sulfide deposits [58]. However, its applicability to porphyry–skarn systems has been demonstrated by numerous studies [23], and modern reviews of chlorite thermometry confirm that empirical AlIV-based approaches remain valid for Fe-Mg chlorite in the temperature range of 150–350 °C [59]. Importantly, the calculated temperatures (216–322 °C) are consistent with fluid inclusion homogenization temperatures from the same mineralization stages at Nuri, supporting the reliability of our estimates [60]. The formation temperatures of Chl-1 range from 216 to 305 °C (mean 282 °C), which are similar to those of Chl-2 (278 to 322 °C, mean 295 °C).
In the Si-Fe classification diagram, the chlorite samples plot in five fields. Chl-1 mainly falls in the pennine, daphnite, and clinochlore fields, with some samples limited to the diabantite field. Chl-2 is mainly distributed in the pennine and daphnite fields (Figure 5b). In the R2+-Si diagram, all chlorite data plot within the tri-trioctahedral field, belonging to the trioctahedral–trioctahedral structure, and lie between the clinochlore and sheridanite end-members (Figure 5c). Further subdivision using the Al+□-Mg-Fe (□ represents octahedral vacancies) ternary diagram shows that all samples fall within the trioctahedral chlorite field. Both Chl-1 and Chl-2 occur in the Mg–chlorite field (Figure 5d). The two types of chlorite samples show a high degree of overlap in the classification diagrams, indicating that their formation generations are superimposed. Although both chlorite types formed at similar temperatures, their classification is based on distinct petrographic characteristics (occurrence mode, textural relationships, and mineral paragenesis) rather than thermometric criteria. The overlapping temperatures indicate that both types crystallized within the same medium-low temperature hydrothermal regime, but at different stages and through different processes (replacement vs. direct precipitation).
Figure 5.
Classification diagram and empirical temperature histogram for chlorite from the Nuri deposit. (a) Histogram of chlorite formation temperatures (empirical geothermometer of Kranidiotis & MacLean [58]); (b) Si vs. Fe classification diagram for chlorite from the Nuri deposit (after Hey [61]); (c) R2+ vs. Si classification diagram for chlorite (after Wiewióra & Weiss [62]); (d) Al+□-Mg-Fe ternary diagram for chlorite from the Nuri deposit (after Zane & Weiss [63]).
4.3. Trace Elements
The LA-ICP-MS results show that the average contents of Li, K, Sc, Ti, V, Cr, Mn, Co, Ni, Zn, Ga, and Sr exceed 10 ppm, whereas those of Rb, Cs, Ba, and Ge range from 1 to 10 ppm (Table 3). Several elements are high in chlorite. For example, the median concentrations of Mn, Zn, V, Ti, Cr, Ni, K, Co, and Sc are 2757 ppm, 388 ppm, 327 ppm, 189 ppm, 127 ppm, 217 ppm, 75 ppm, 14 ppm, and 12 ppm, respectively. However, the concentrations of REEs, Zr, Ag, Be, B, P, S, Ca, Th, and Cd are very low, mostly near or below the detection limits (detailed data are listed in Table S3).
Table 3.
Trace element compositions of chlorite in the Nuri Cu-W-Mo deposit.
5. Discussion
5.1. Substitution Mechanism
As a complex layered silicate mineral, chlorite possesses a unique crystal structure involving intricate ion substitution mechanisms during its formation, which sensitively records geological information. Previous studies have demonstrated that three main ion substitution mechanisms are commonly associated with chlorite formation: ① Fe2+ ⇔ Mg2+ substitution, ② Tschermak substitution (AlIVAlVI ⇔ Si(Mg2+, Fe2+)), and ③ dioctahedral–trioctahedral substitution (3(Mg2+, Fe2+) ⇔ □ + 2AlVI) [64,65].
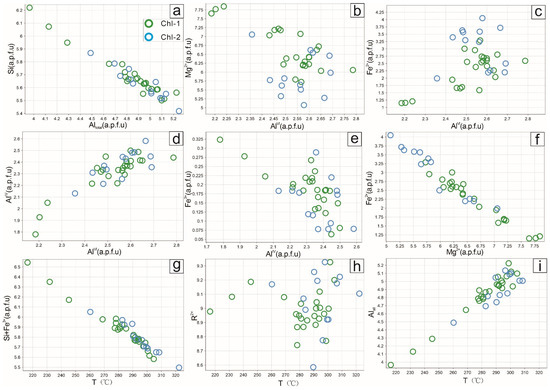
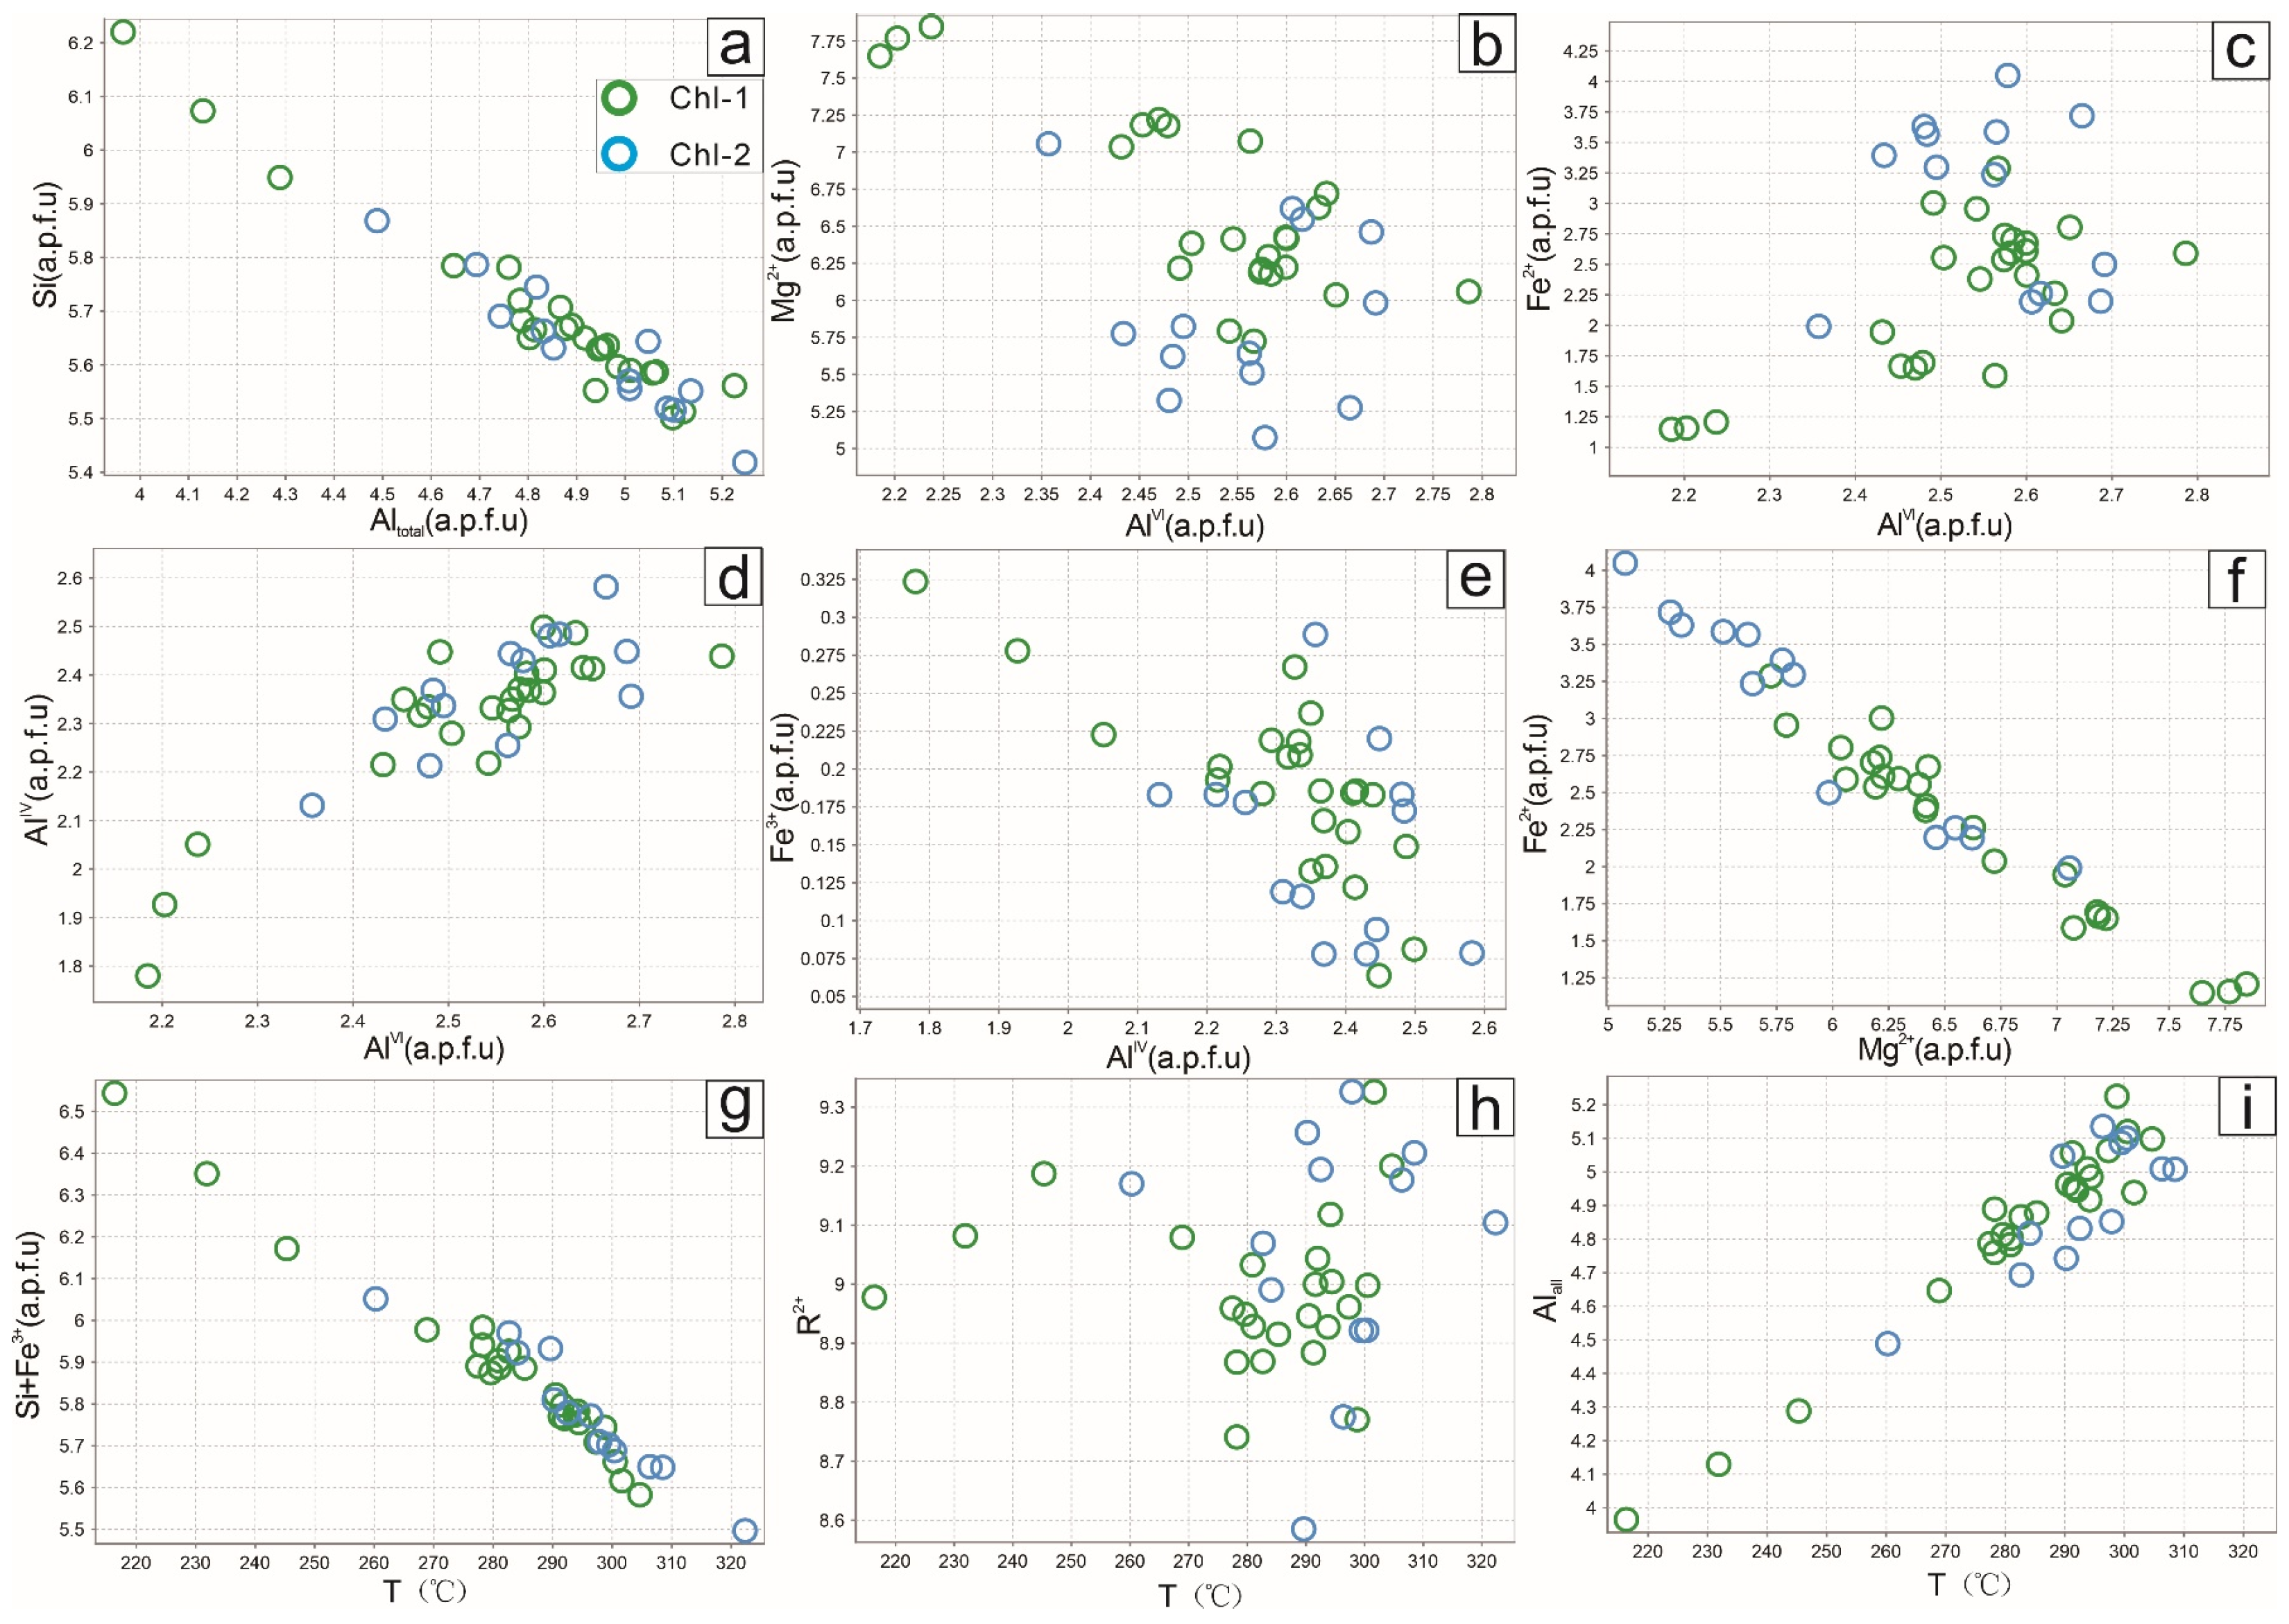
In the chlorite crystal lattice, Al typically substitutes for Si in tetrahedral sites, forming tetrahedrally coordinated Al (AlIV) (Figure 6a), and also substitutes for ions such as Mg2+ and Fe2+ in octahedral sites, forming octahedrally coordinated Al (AlVI) [66]. To maintain charge balance during this substitution, AlIV and AlVI are expected to exhibit an equivalent relationship [67]. However, in natural chlorite, the amounts of AlIV and AlVI are often unequal due to mutual substitutions among Mg2+, Fe2+, Fe3+, and other divalent cations [47,68].
Figure 6.
Ion scatter plots for chlorite from the Nuri deposit. (a) Si vs. Altot correlation diagram; (b) Mg vs. AlVI correlation diagram; (c) Fe2+ vs. AlVI correlation diagram; (d) AlIV vs. AlVI correlation diagram; (e) Fe3+ vs. AlIV correlation diagram; (f) Fe2+ vs. Mg correlation diagram; (g) Si+Fe3+ vs. T (°C) correlation diagram; (h) R2+ vs. T (°C) correlation diagram; (i) Altot vs. T (°C) correlation diagram. Red open circles represent Chl-1 (early primary metasomatic chlorite), and blue open circles represent Chl-2 (late hydrothermal precipitated chlorite). Ion contents are in atoms per formula unit (apfu), calculated based on 14 oxygen atoms; R2+ represents divalent cations.
The AlIV vs. AlVI scatter plot for the Nuri Cu-W-Mo deposit (Figure 6d) shows a positive correlation between AlIV and AlVI. However, a 1:1 linear relationship is absent, and AlIV content is generally lower than AlVI. This indicates that additional trivalent cations in tetrahedral sites, such as Fe3+, have substituted for AlIV (Figure 6e). In octahedral sites, Si, Mg2+, and Fe2+ exhibit negative correlations with AlVI due to Tschermak substitution. However, while Si and Mg2+ show negative correlations with AlVI (Figure 6a,b), Fe2+ displays a positive correlation with AlVI (Figure 6c). This indicates that the substitution of Mg2+ by AlVI plays a significant role in the Tschermak substitution, and additionally, the Fe2+ ⇔ Mg2+ substitution is also important, as evidenced by the strong negative correlation between Mg2+ and Fe2+ (Figure 6f). Previous studies have suggested that relatively reducing and acidic environments promote the substitution of Mg2+ by Fe2+ [56,69].
In the scatter plots, Chl-2 exhibits significantly higher AlVI and Fe2+ contents compared to Chl-1 (Figure 6b,c), suggesting that substitution processes in octahedral sites are primarily controlled by the redox potential and pH of the hydrothermal fluid. Existing research indicates that increasing temperature generally facilitates Al entering tetrahedral sites to substitute for Si [59,70]. Similar trends are observed in chlorite from the Nuri deposit, where (Si + Fe3+) shows a clear negative correlation with temperature (Figure 6g), while Alall exhibits a strong positive correlation with temperature (Figure 6i). These relationships indicate that substitution in tetrahedral sites is primarily temperature-controlled, with higher temperatures promoting Al incorporation into tetrahedral sites. No significant correlation is observed between R2+ and temperature (Figure 6h), suggesting that temperature may not be the dominant factor controlling substitution in octahedral sites.
5.2. Hydrothermal Environment Controls on Chlorite Composition
As a widely distributed layered silicate mineral in the Earth’s crust, chlorite forms throughout processes ranging from diagenesis and low-grade metamorphism to various magmatic–hydrothermal alterations [67]. Its crystal structure exhibits high flexibility, allowing multiple cations (e.g., Fe, Mg, Al, Mn, Li, Zn) to enter the lattice through complex isomorphous substitution, rendering its chemical composition highly sensitive to variations in temperature, redox state, and fluid composition of the ore-forming hydrothermal system. Therefore, chlorite composition and internal ionic structure can be used to infer hydrothermal environmental conditions [57,59,71,72].
The similar formation temperatures for Chl-1 and Chl-2 indicate that the hydrothermal system maintained relatively stable thermal conditions during the formation of both chlorite types. However, the two generations are distinguished by their petrographic characteristics, compositional evolution (Mg-rich to Fe-rich), and mineral paragenesis, reflecting progressive changes in fluid redox state and pH rather than temperature.
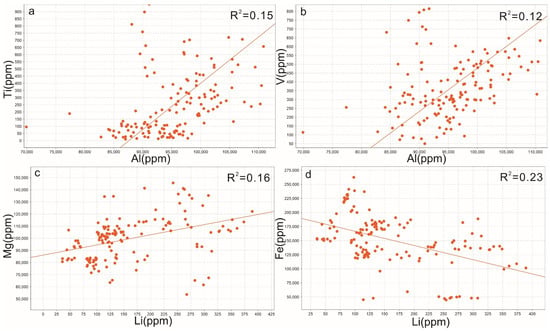
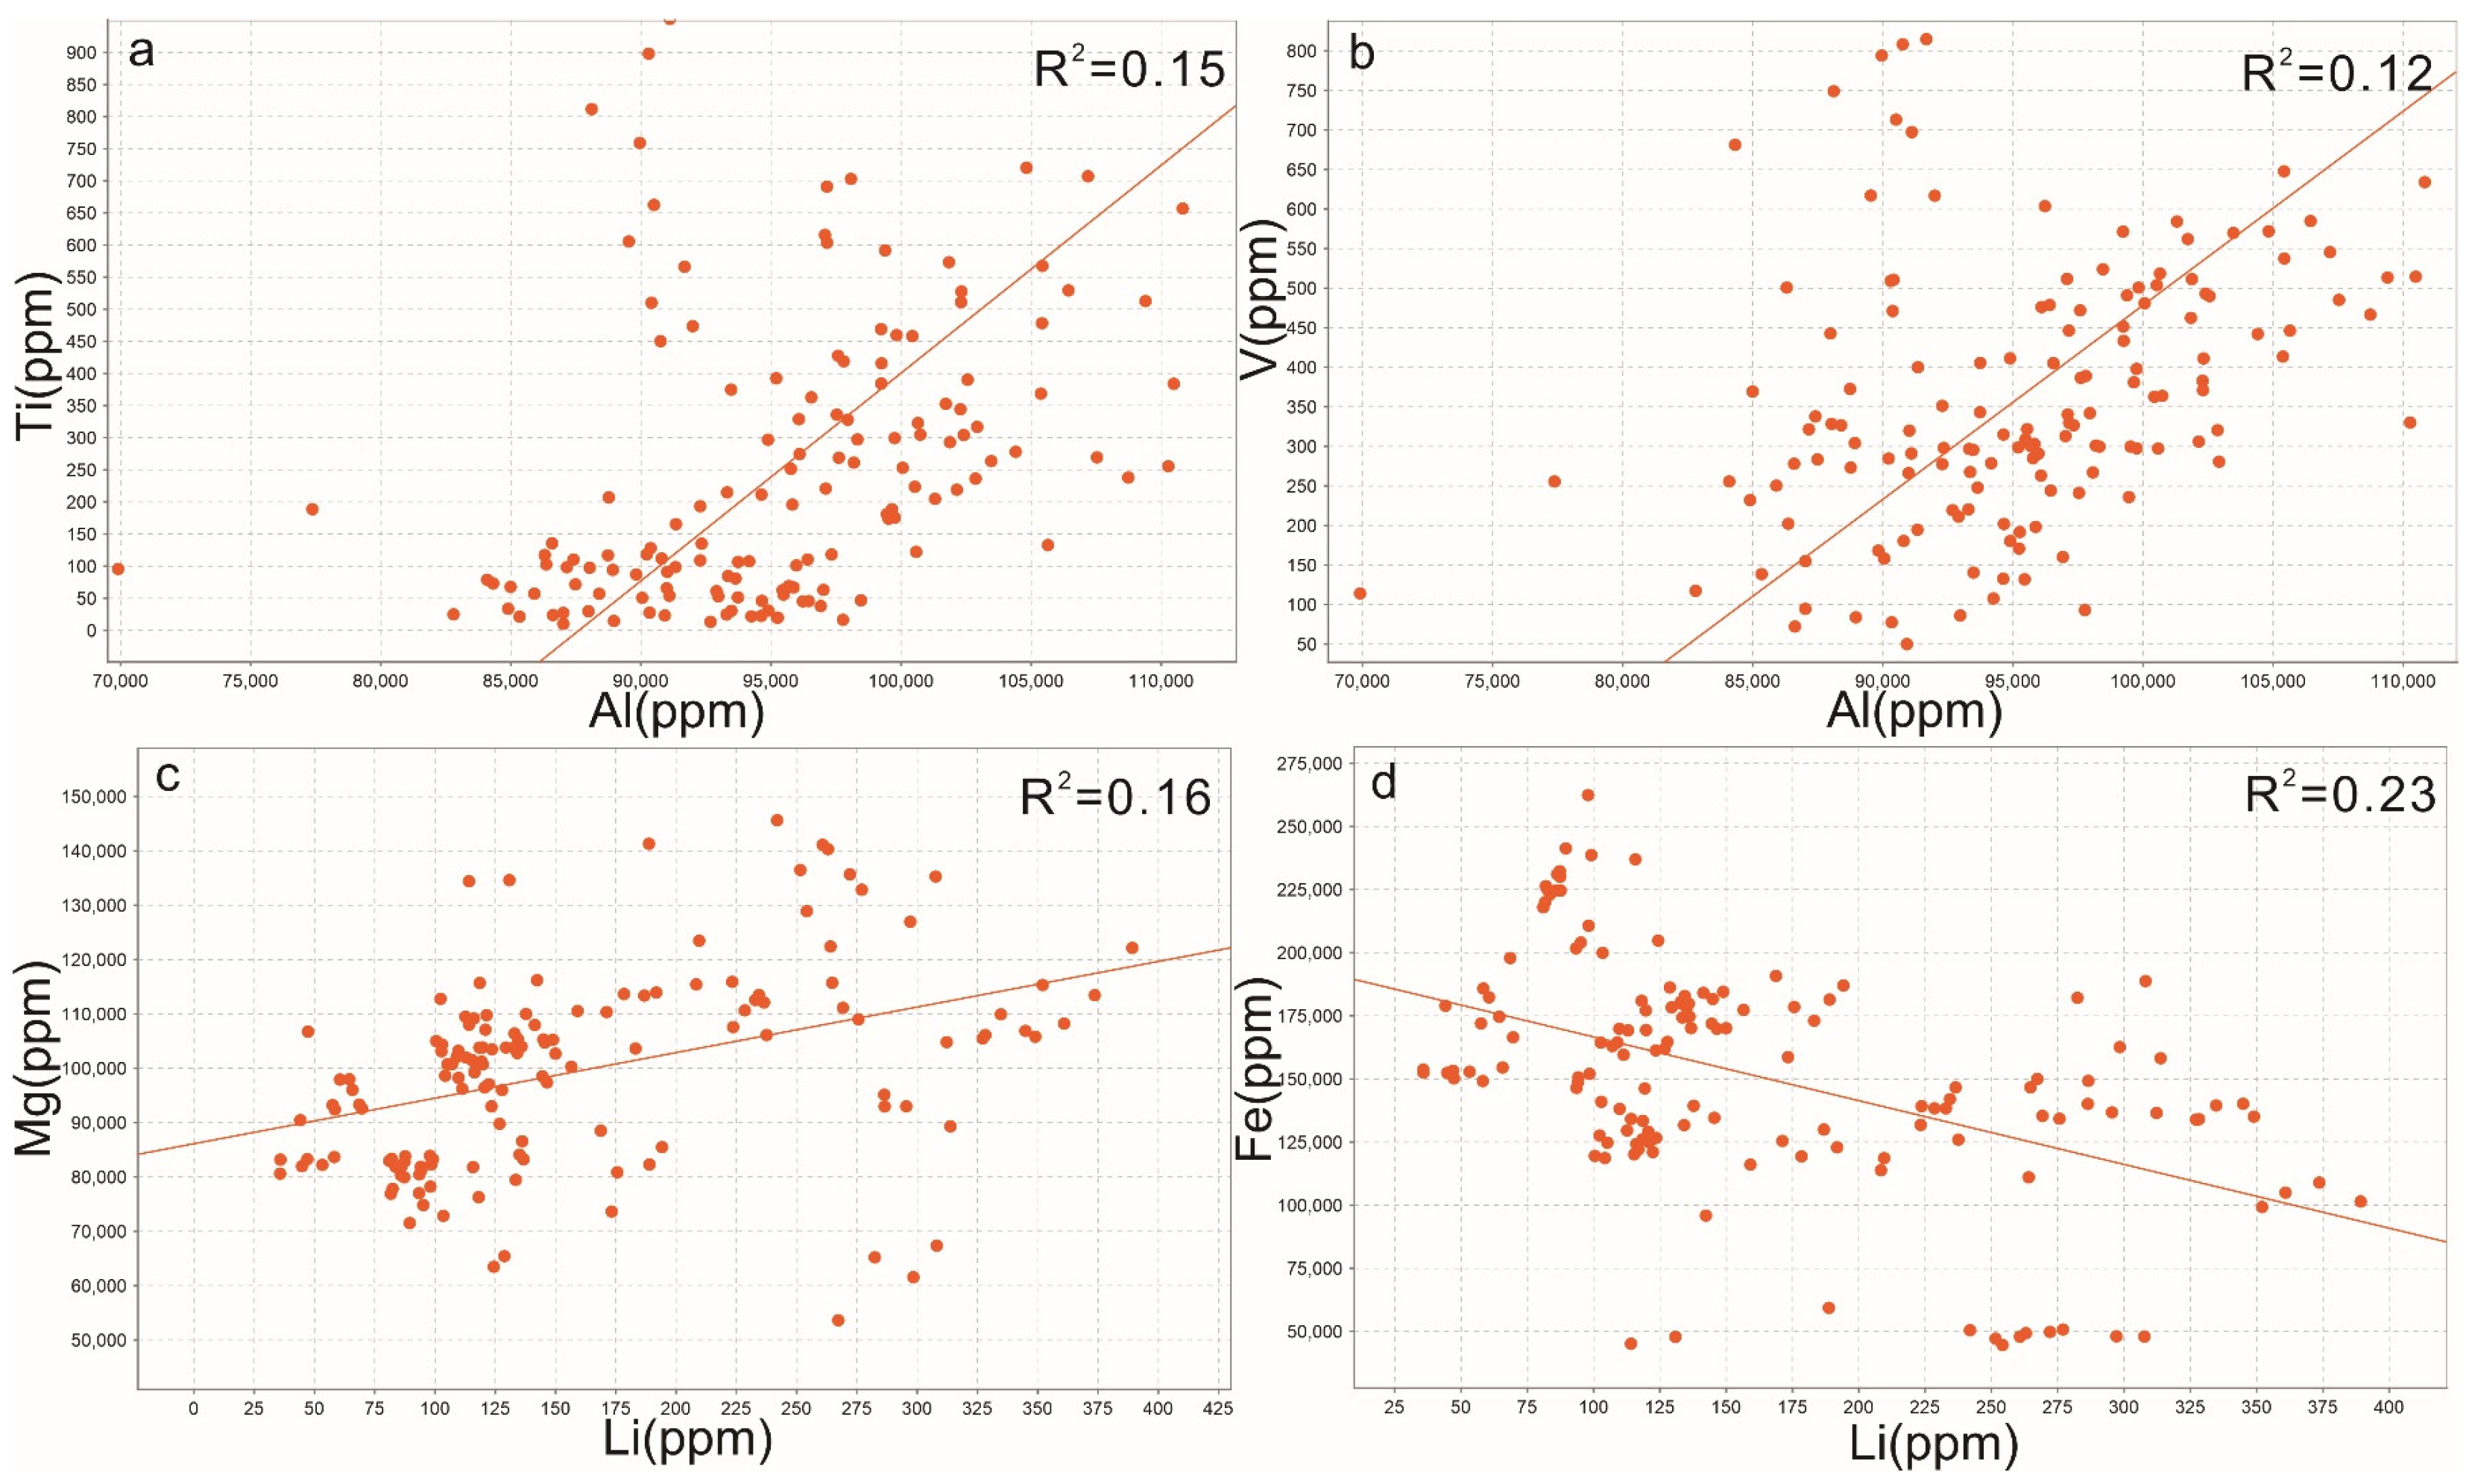
In porphyry metallogenic systems, fluid temperature and oxygen fugacity are key factors controlling metal precipitation, and reducing environments favor mineral formation [73]. Among the factors controlling chlorite composition, temperature significantly affects the contents of certain elements. Ion substitution analysis shows that Al content is mainly temperature-controlled (Figure 6i) and can serve as an indirect temperature indicator. In the major trace element scatter plots, Ti and V are weakly positively correlated with Al (Figure 7a,b), indicating that Ti and V contents in chlorite from the Nuri deposit are, to some extent, temperature-dependent. Higher temperatures promote the incorporation of Ti and V into the lattice, and their contents decrease as temperature drops. Therefore, Ti and V can effectively indicate the location of the hydrothermal center.
Figure 7.
Scatter plots of major and trace element compositions of chlorite from the Nuri deposit. (a) Al vs. Ti correlation diagram; (b) Al vs. V correlation diagram; (c) Li vs. Mg correlation diagram; (d) Li vs. Fe correlation diagram.
On the other hand, redox conditions exert strong control over the relative contents of Fe and Mg, as well as the behavior of Zn and Mn in chlorite. Previous studies have shown that Mg-rich chlorite generally forms under relatively low oxygen fugacity, whereas Fe-rich chlorite indicates more reducing and acidic conditions [74,75,76]. It can be inferred that Fe2+ ⇔ Mg2+ substitution is mainly governed by redox potential and pH, with low oxygen fugacity promoting the replacement of Fe2+ by Mg2+ in octahedral sites (Figure 6f), thus increasing the Mg content in chlorite. Furthermore, the absence of a significant linear correlation between temperature and divalent cations in chlorite (Figure 6h) further indicates that Fe2+ and Mg2+ contents are not principally temperature-controlled.
The formation environment of Chl-2 evolved toward more reducing conditions, as evidenced by its association with pyrrhotite and the progressive enrichment of Fe2+ relative to Mg2+. The lower Mg content in Chl-2 is consistent with lower pH and/or reduced fluid conditions that shift the Fe/Mg partitioning in favor of Fe-chlorite [53]. Scatter plots of Li versus Fe and Mg show that Li is moderately positively correlated with Mg (Figure 7c) and moderately negatively correlated with Fe (Figure 7d), indicating that reducing and relatively acidic environments inhibit the incorporation of Li into the chlorite lattice to some extent. Thus, low Li contents, together with Zn, Mn, and Sr depletion, may serve as effective indicators of favorable mineralization conditions.
5.3. Exploration Implications
Chlorite exhibits systematic spatial variations in trace element compositions and elemental ratios relative to distance from the mineralization center, providing effective guidance for mineral exploration. Based on studies of porphyry Cu deposits, such as Batu Hijau and El Teniente, researchers proposed the “chlorite proximal indicator” concept: elements enriched near the orebody (e.g., Ti, V) are temperature-controlled, whereas those enriched at distal locations (e.g., Li, Sr) are controlled by fluid composition. The logarithms of Ti/Sr and Ti/Li ratios show a linear relationship with distance, enabling semi-quantitative estimation of concealed orebody distances. This method has been validated and extended to various deposit types, including porphyry and skarn, becoming an important technique in alteration mineral exploration [69,72,77,78,79].
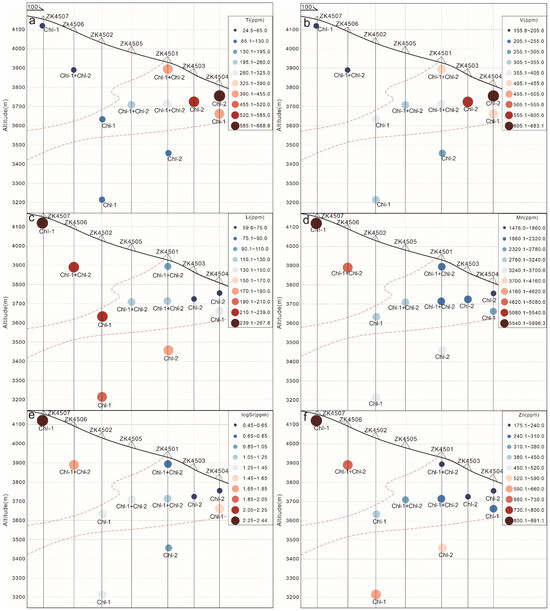
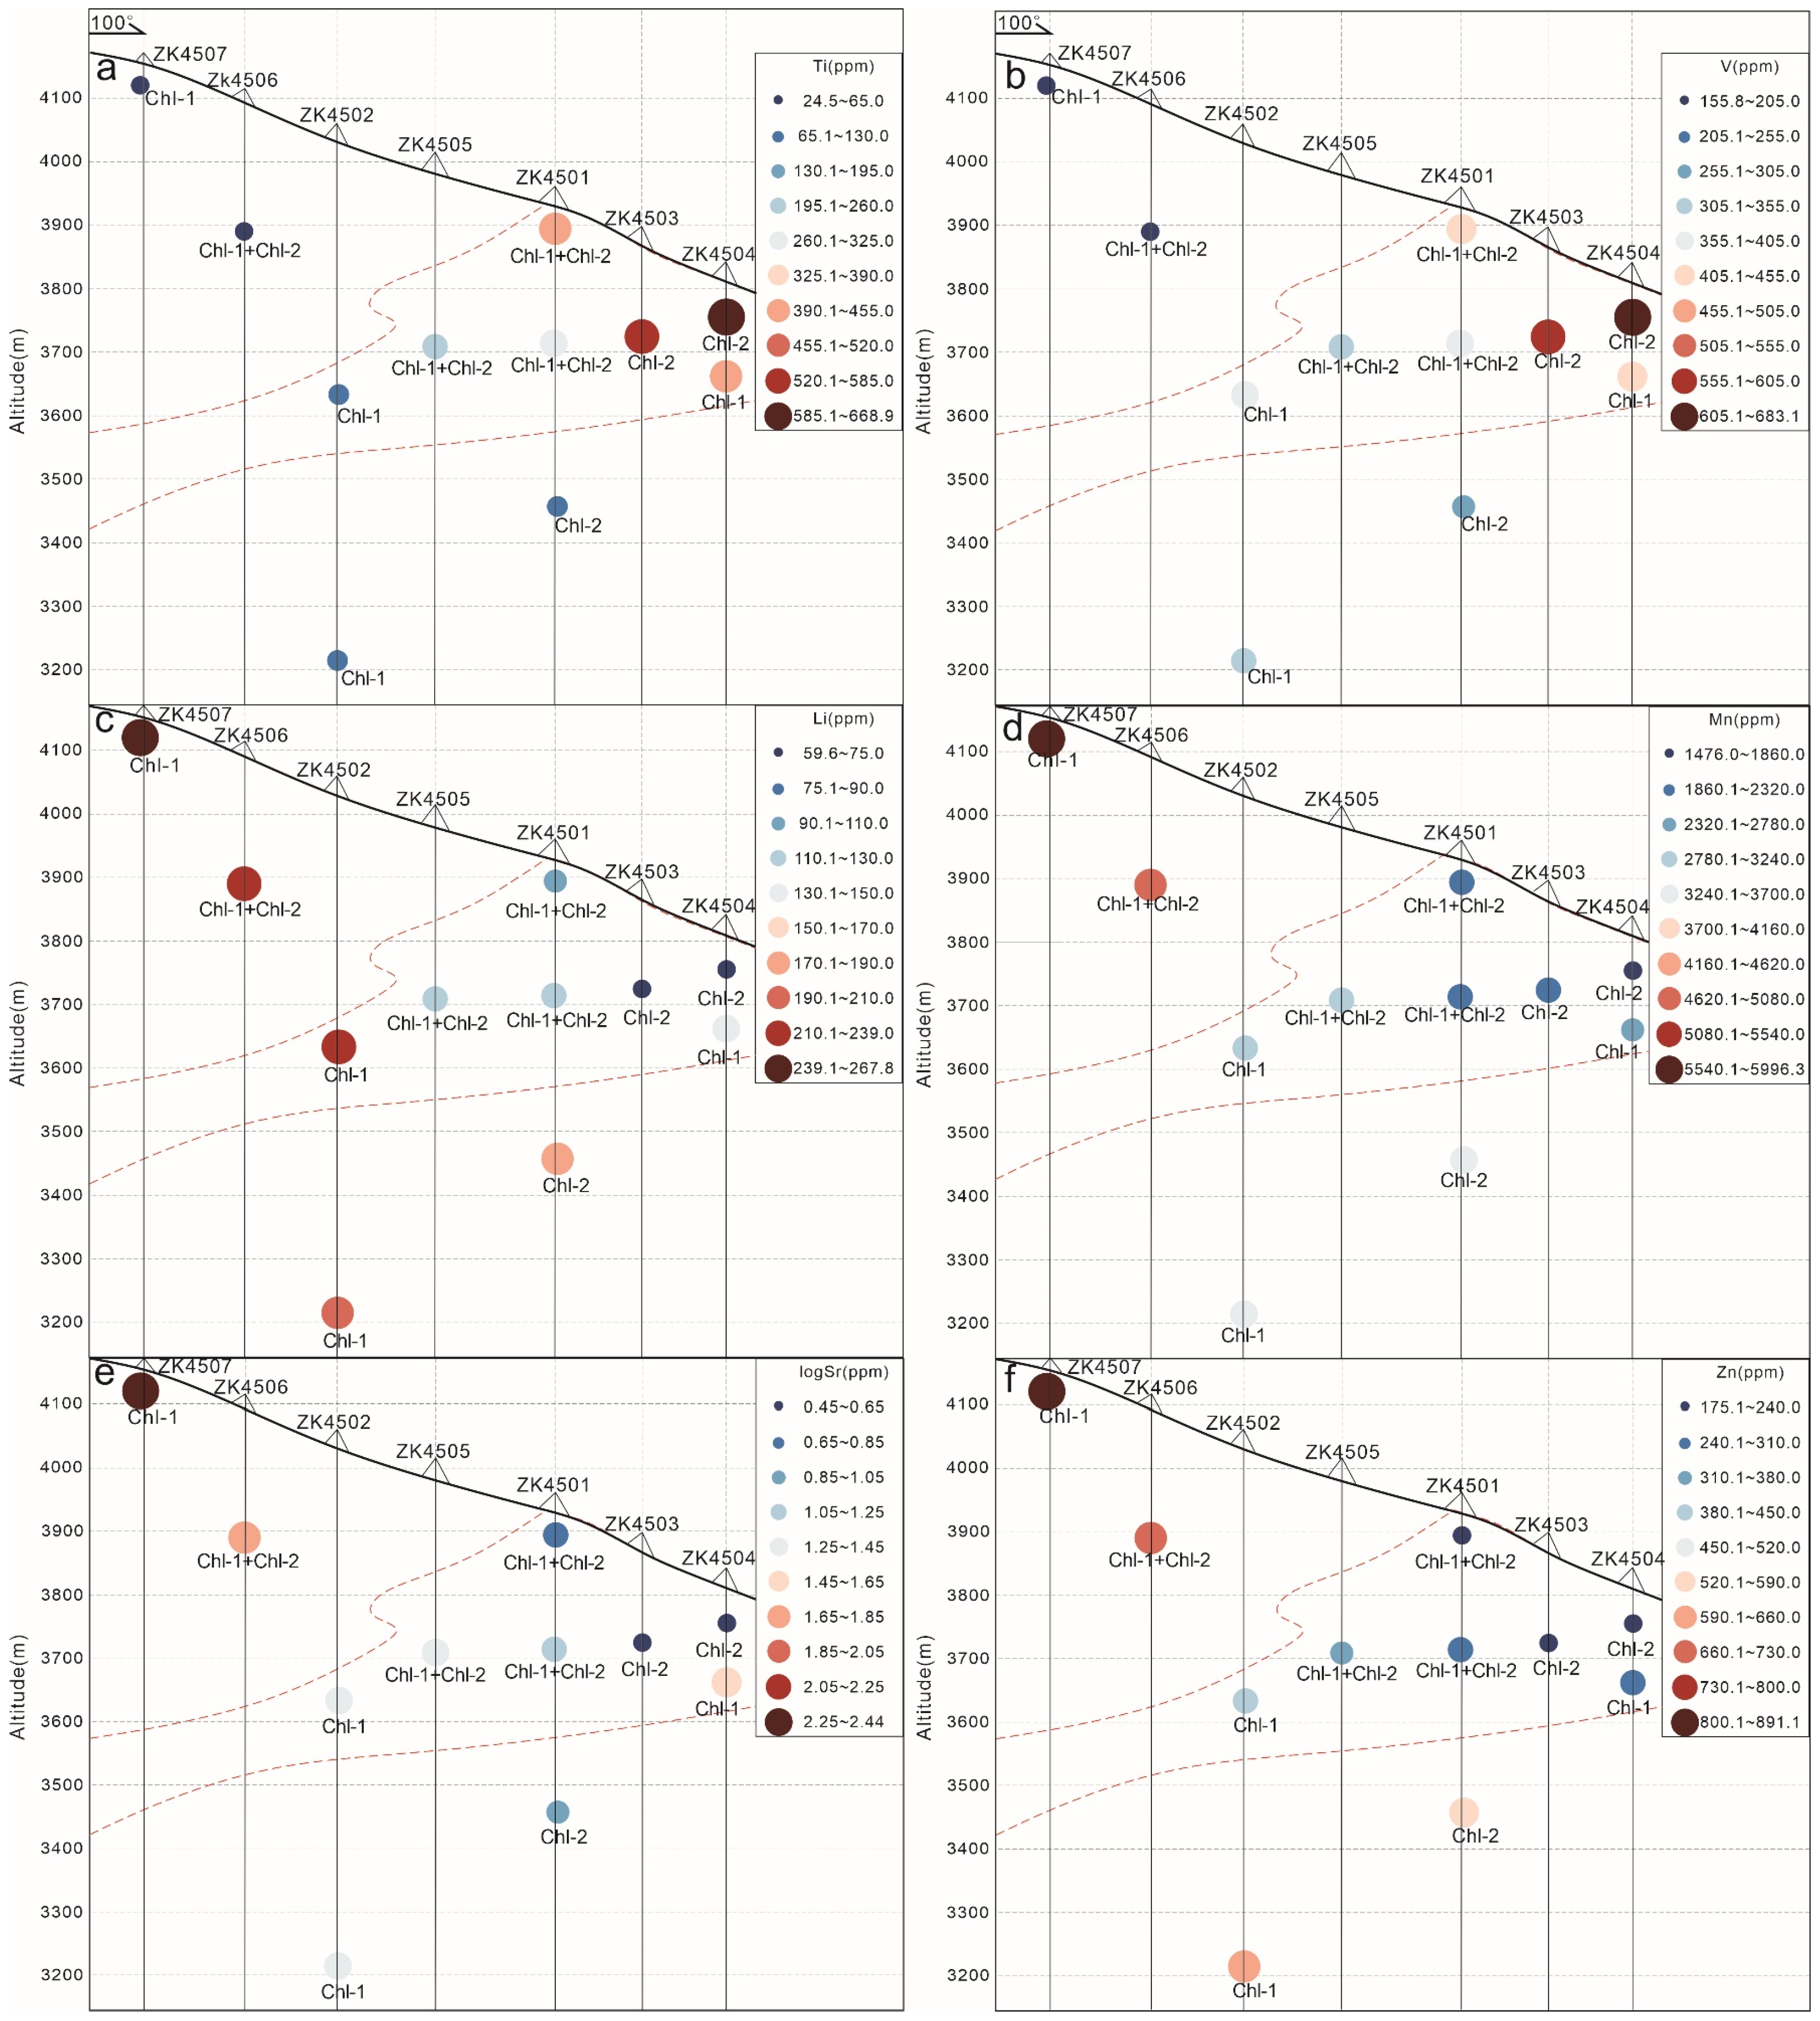
To illustrate the spatial variation of chlorite chemistry in the Nuri Cu-W-Mo deposit and evaluate the applicability of these proximal indicators, chlorite geochemical data were plotted along exploration line No. 45. In addition to the temperature-sensitive elements, such as Ti and V, elements previously demonstrated to be controlled by hydrothermal fluid conditions (e.g., Zn and Mn) were also evaluated. The Ti and V contents of chlorite generally increase upward from depth toward the shallow orebodies (Figure 8a,b). This trend is particularly pronounced in drill hole ZK4501, whereas no obvious increase is observed in ZK4502. In contrast, chlorite samples from distal locations, including ZK4507-10 and ZK4506-172, exhibit notably lower Ti and V contents (Figure 8a,b). Within the altitude range of 3600–3800 m, Ti and V contents in chlorite increase markedly from ZK4502 to ZK4504.
Figure 8.
Spatial distribution of chlorite element contents versus sample altitude along exploration line 45 in the Nuri mining area. (a) Spatial variation of Ti content. (b) Spatial variation of V content. (c) Spatial variation of Li content. (d) Spatial variation of Mn content. (e) Spatial variation of Sr content. (f) Spatial variation of Zn content. The red dashed zone indicates the mineralized area. Larger circles represent higher element contents.
Conversely, the spatial trends of Li, Zn, Mn, and Sr contents are completely opposite to those of Ti and V (Figure 8c–f). Both Chl-1 and Chl-2 display the same overall spatial trends in Ti, V, Li, Mn, Sr, and Zn contents, with Ti and V increasing toward the orebody, while Li, Mn, Sr, and Zn decrease (Figure 8). At equivalent spatial positions, the concentration ranges of Ti, V, Mn, and other elements in Chl-2 are similar to those in Chl-1. Moreover, both chlorite types exhibit identical vectoring patterns, indicating that these spatial geochemical gradients reflect deposit-scale hydrothermal zoning rather than differences related to chlorite generation.
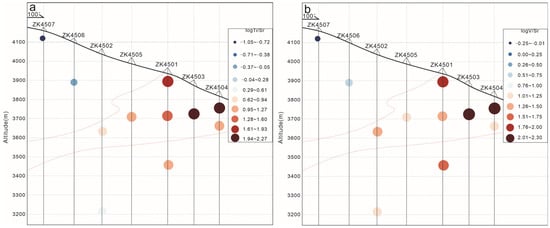
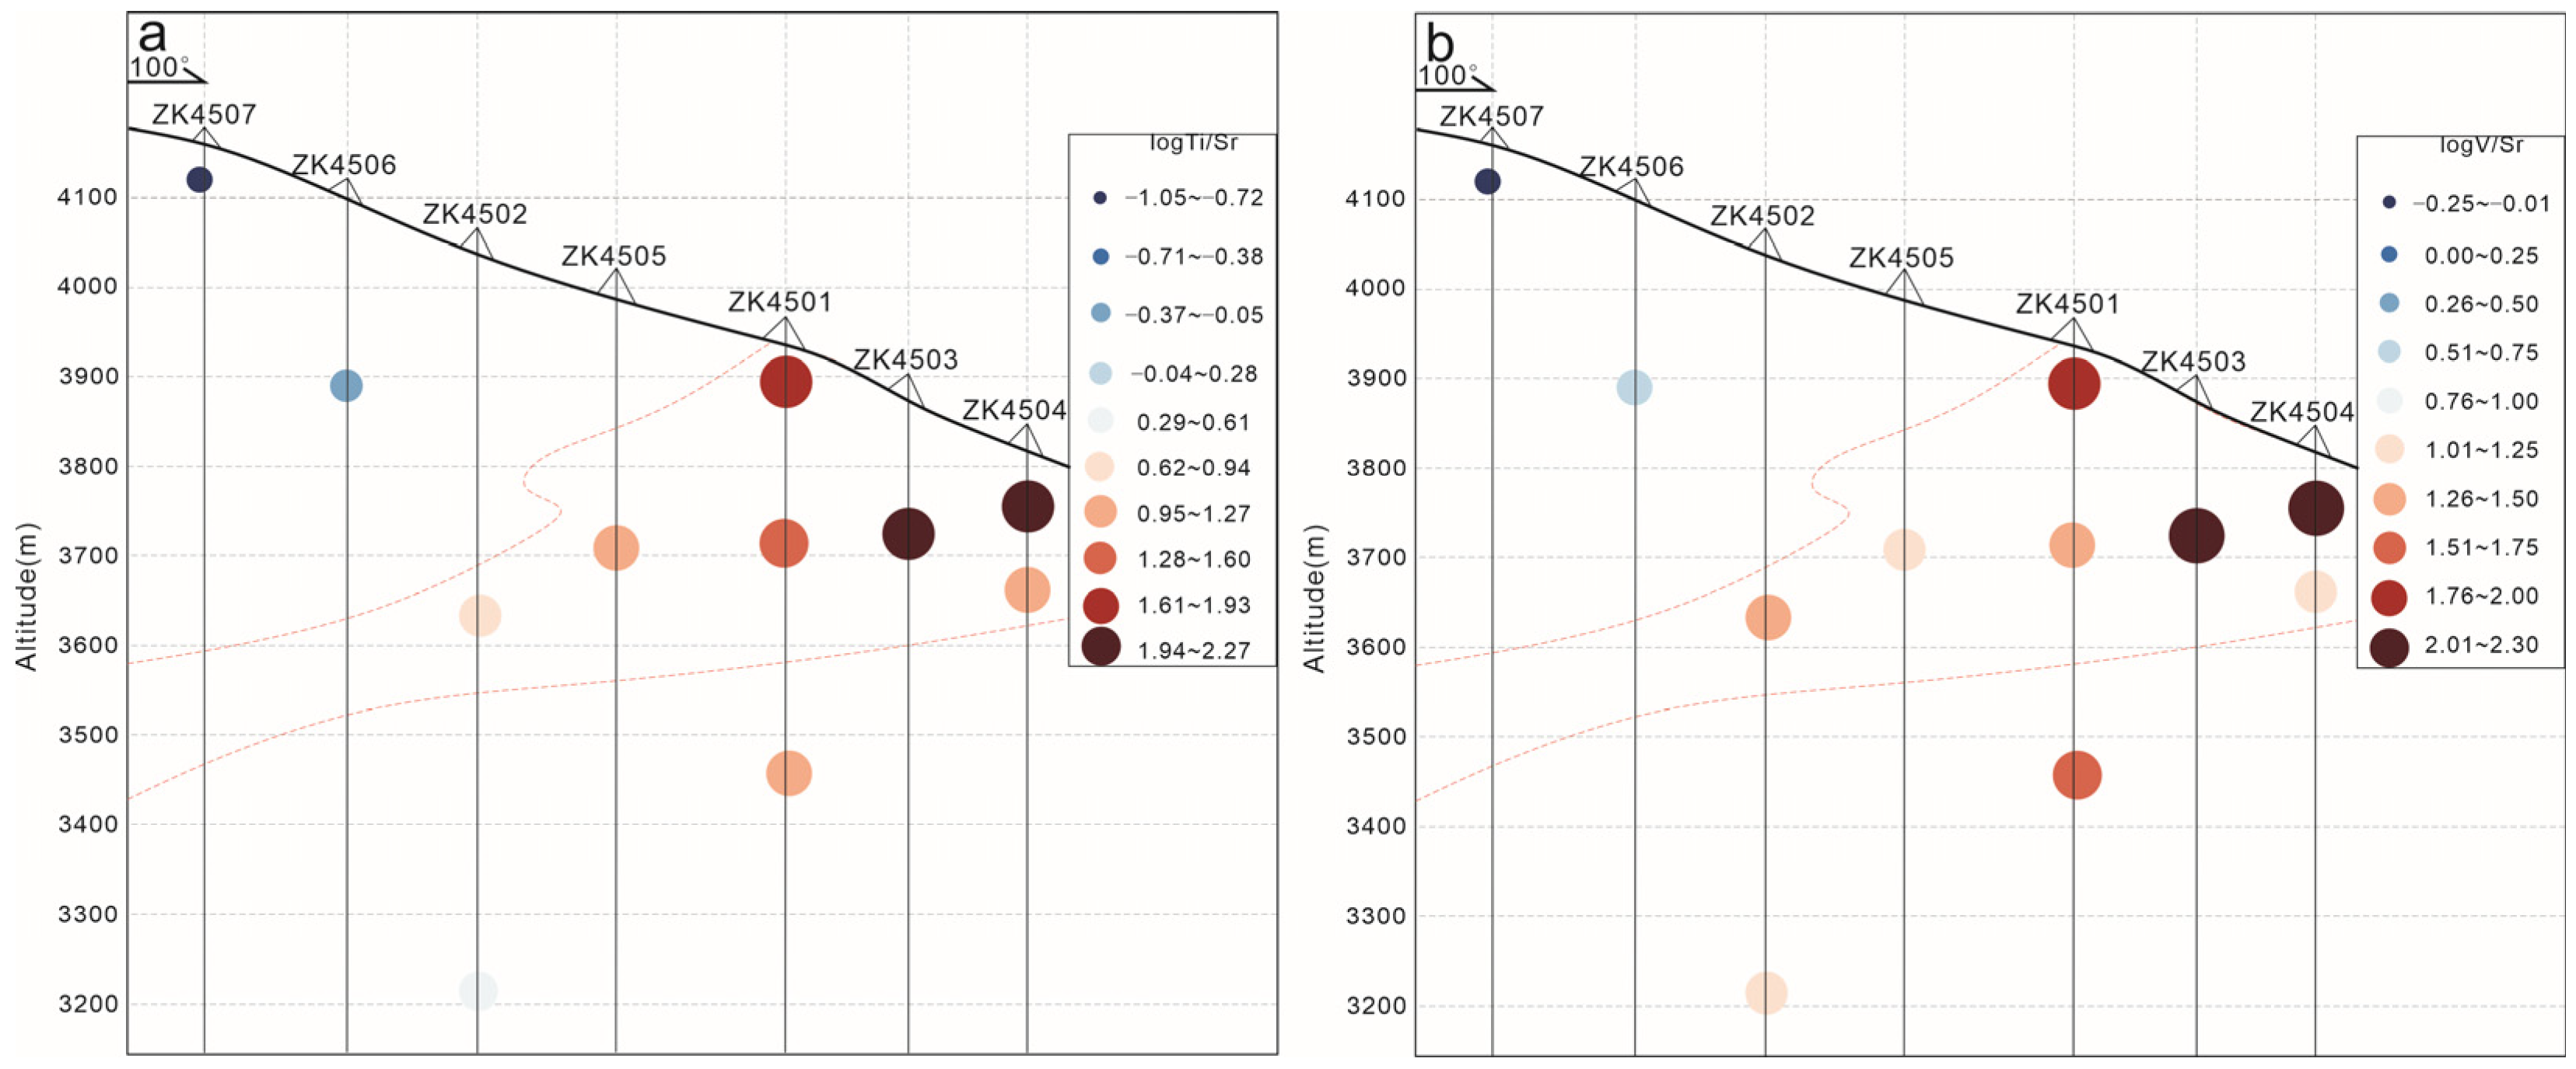
After ratio calculation and logarithmic transformation, the data exhibit more systematic variation patterns. Element ratios such as Ti/Sr and V/Sr show a significant increasing trend from distal to proximal locations relative to the orebody. Within the altitude range of 3600–3800 m, these ratios also increase obviously from ZK4502 to ZK4504 along the southeast direction of the section (Figure 9a,b). The previous exploration results from the Nuri mining area indicate that drill holes in the western part (e.g., ZK4507) encountered only weak mineralization at depth [21,43]. Therefore, chlorite samples ZK4507-10 and ZK4506-172 are not associated with mineralization and exhibit element ratios significantly lower than those of chlorite from the mineralized and deep zones.
Figure 9.
Spatial distribution of chlorite element ratios versus sample altitude along exploration line 45 in the Nuri mining area. (a) Spatial variation of Ti/Sr ratio. (b) Spatial variation of V/Sr ratio. The red dashed zone indicates the mineralized area. Larger circles represent higher element contents.
In contrast, deep chlorite samples ZK4502-800 and ZK4501-455 show Ti/Sr and V/Sr ratios comparable to, or even exceeding, those of chlorite samples from known mineralized zones, including ZK4502-387, ZK4505-370, ZK4504-150, and ZK4501-220. These features suggest the possible presence of an additional concealed mineralized zone at depth that influenced the trace element composition of chlorite in drill holes ZK4502-800 and ZK4501-455.
It should be noted that chlorite trace element vectors are not universally applicable in all geological settings. Wang et al. demonstrated that Ti/Sr ratios show poor correlation with distance to mineralization at the Cimabanshuo porphyry Cu deposit in Tibet, attributed to elemental migration disturbances in continental collision settings [72]. Similarly, Freij et al. showed through machine learning analysis that chlorite chemistry is more strongly controlled by deposit type than by proximity to mineralization at a global scale [80]. However, our study focuses on intra-deposit spatial variation within a single hydrothermal system where host rock and system-scale variables are relatively constant. The coherent and systematic multi-element trends observed along exploration at Nuri (Figure 8 and Figure 9), with consistent vectoring patterns across Ti, V, Li, Mn, Sr, and Zn, indicate that the primary hydrothermal signal is well preserved and that elemental migration has not significantly disturbed the geochemical vectors in this specific setting.
Integrating the chlorite geochemical vectors with existing geological evidence strengthens the case for deep concealed mineralization beneath ZK4501–ZK4502. Several independent lines of evidence support this interpretation: (1) the ore-forming intrusion age (~24 Ma) significantly postdates the exposed magmatic rocks (95.93–33.76 Ma), indicating that the parental intrusion remains at depth [6,8,12]; (2) the fracture–vein system in the deposit is interpreted to be rooted in deep-seated intrusions [13,14]; and (3) analogous shallow skarn–deep porphyry systems have been documented in the eastern Gangdese belt (e.g., Jiama, Qulong), confirming that such configurations are geologically expected.
Based on these findings, we recommend (1) extension of drill holes ZK4501 and ZK4502 to greater depths (below 800 m) to test the inferred mineralization target; (2) integration of deep-penetrating geophysical methods (e.g., controlled-source audio frequency magnetotellurics, CSAMT) to detect potential deep intrusive bodies; and (3) systematic chlorite geochemical sampling along additional exploration lines to define the lateral extent of the geochemical anomaly.
6. Conclusions
- (1)
- Chlorite from the Nuri Cu-W-Mo deposit includes metasomatic (Chl-1) and hydrothermal-precipitated (Chl-2) varieties. Both are Mg-rich, forming at 216–305 °C and 278–322 °C, respectively, indicative of a medium-temperature environment with low oxygen fugacity and pH.
- (2)
- The dominant substitution mechanisms in chlorite from the Nuri Cu-W-Mo deposit are Fe2+ ⇔ Mg2+ exchange and Tschermak substitution (Al3+)IV + (Al3+)VI ⇔ (Si4+)IV + (Mg2+, Fe2+)VI.
- (3)
- Analysis of chlorite composition and hydrothermal environment shows that Al content is mainly controlled by temperature, while Ti and V contents are, to some extent, also controlled by temperature. In contrast, the contents of Fe, Mg, Zn, and Mn are, to some degree, influenced by the hydrothermal environment (oxygen fugacity and pH). These element contents can indicate the hydrothermal mineralization center.
- (4)
- Trace element analysis of chlorite shows that, both vertically and horizontally, Ti and V contents increase toward the orebody. Ratios of Ti/Sr and V/Sr show increasing trends toward mineralization. Based on the trace element characteristics of deep chlorite samples, the presence of a concealed orebody is inferred at depth along exploration line 45 in the Nuri Cu-W-Mo deposit.
Supplementary Materials
The following supporting information can be downloaded at: https://www.mdpi.com/article/10.3390/min16060656/s1, Table S1: Major element data of chlorite from the Nuri deposit; Table S2: Calculation results of chlorite temperature and oxygen fugacity; Table S3: Trace element data of chlorite from the Nuri deposit.
Author Contributions
Conceptualization, Y.W.; methodology, Y.Q., Y.W. and Q.D.; validation, Y.Q., Y.W. and M.S.; formal analysis, Y.Q. and Z.W.; investigation, Y.Q. and Z.W.; resources, Y.W. and Q.D.; data curation, Y.Q. and M.S.; writing—original draft preparation, Y.Q.; writing—review and editing, Y.W. and Q.D.; supervision, Y.W.; project administration, Y.W.; funding acquisition, Y.W. All authors have read and agreed to the published version of the manuscript.
Funding
This work was financially supported by the Deep Earth Probe and Mineral Resources Exploration National Science and Technology Major Project, the National Natural Science Foundation of China (Grant No. 2024ZD1003205), the National Natural Science Foundation of China (Grant Nos. 42002097 and 42502086), and the Geological Investigation Project (Grant No. DD202402028).
Data Availability Statement
All data derived from this research are presented in the enclosed figures and tables.
Acknowledgments
We give special thanks to Yang Chao from the College of Earth and Planetary Sciences, Chengdu University of Technology, for providing important theoretical and writing guidance for this paper. We also thank the two anonymous reviewers and the editors for their constructive comments and assistance.
Conflicts of Interest
The authors declare no conflicts of interest.
References
- Zhu, D.-C.; Wang, Q.; Cawood, P.A.; Zhao, Z.-D.; Mo, X.-X. Raising the Gangdese mountains in southern Tibet. J. Geophys. Res. Solid Earth 2017, 122, 214–223. [Google Scholar] [CrossRef] [Scilit]
- Wang, N.; Tang, J.; Liu, Z.; Song, Y.; Dai, J.; Li, B.; Ma, X.; Li, Z.; Yan, X.; Sun, Q. Identification of the first high-sulfidation epithermal ore-bearing lithocap in the western section of the Gangdese metallogenic belt and its significance. Ore Geol. Rev. 2025, 186, 106885. [Google Scholar] [CrossRef] [Scilit]
- Li, Z.; Lang, X.H.; Zhang, Q.Z.; Liu, X.K.; Yang, X. Petrogenesis and geodynamic implications of the intrusionsrelated to the Pusangguo skarn Cu-dominated polymetallic deposit in Tibet: Constraints fromgeochronology, geochemistry, and Sr-Nd-Pb-Hf isotopes. Geol. J. 2020, 55, 7659–7686. [Google Scholar] [CrossRef] [Scilit]
- Pan, G.T.; Wang, L.Q.; Yin, F.G.; Geng, Q.Z.; Li, G.M.; Zhu, D.C. Researcher on geological-tectonic evolution of Tibertan Plateau: A review, recent advance, and directions in the future. Sediment. Geol. Tethyan Geol. 2022, 42, 151–175. [Google Scholar] [CrossRef]
- Yang, Z.; Hou, Z.; Chang, Z.; Li, Q.; Liu, Y.; Qu, H.; Sun, M.; Xu, B. Cospatial Eocene and Miocene granitoids from the JiruCu deposit in Tibet: Petrogenesis and implications for the formation of collisional andpostcollisional porphyry Cu systems in continental collision zones. Lithos 2016, 245, 243–257. [Google Scholar] [CrossRef] [Scilit]
- Hou, Z.Q.; Zheng, Y.C.; Yang, Z.M.; Yang, Z.S. Metallogenesis of continentalcollision setting: Part I. Gangdese Cenozoic porphyry Cu-Mo systems in Tibet. Miner. Depos. 2012, 31, 647–670. [Google Scholar] [CrossRef]
- Guo, F.; Nakamuru, E.; Fan, W.; Kobayoshi, K.; Li, C. Generation of Palaeocene adakitic andesites by magmamixing: Yanji area, NE China. J. Petrol. 2007, 48, 661–692. [Google Scholar] [CrossRef] [Scilit]
- King, J.; Harris, N.; Argles, T.; Parrish, R.; Charlier, B.; Sherlock, S. First field evidence for southward ductile flow of Asian crustbeneath southern Tibet. Geology 2007, 36, 727–730. [Google Scholar] [CrossRef] [Scilit]
- Xu, W.C.; Zhang, H.F.; Guo, L.; Yuan, H.L. Miocene high Sr/Y magmatism, south Tibet: Product of partial melting of subducted Indian continental crust and its tectonic implication. Lithos 2010, 114, 293–306. [Google Scholar] [CrossRef] [Scilit]
- Wang, Y.Y.; Zheng, W.B.; Chen, Y.C.; Tang, J.X.; Leng, Q.F.; Tang, P.; Ding, S.; Zhou, Y. Descussion on the mechanism of seperation of copper and molybdenum in Jima porphyry deposit system, Tibet. Acta Petrol. Sin. 2017, 33, 495–514. Available online: https://www.sciengine.com/doi/10.0000/1d06a03cfe204fcd8d2e75f17bfe0735 (accessed on 14 June 2026).
- Yu, C.S. Origin and Evolution of the Lhasa Terrane: Constraintsfrom the Precambrian Basements. Ph.D. Dissertation, Jilin University, Changchun, China, 2025. [Google Scholar] [CrossRef]
- Hou, Z.Q. Metallogensis of Continental Collision. Acta Geol. Sin. 2010, 84, 30–58. [Google Scholar] [CrossRef]
- Chen, L.; Qin, K.; Li, G.; Li, J.; Xiao, B.; Zhao, J.; Fan, X. Sm–Nd and Ar–Ar Isotopic Dating of the Nuri Cu–W–Mo Deposit in the Southern Gangdese, Tibet: Implications for the Porphyry-Skarn Metallogenic System and Metallogenetic Epochs of the Eastern Gangdese. Resour. Geol. 2016, 66, 259–273. [Google Scholar] [CrossRef] [Scilit]
- Yan, X.Y.; Huang, S.F.; Du, A.D. Re-Os Ages of Large Tungsten, Copper and Molybdenum Deposit in the Zetang Orefield, Gangdisê and Marginal Strike-slip Transforming Metallogenesis. Acta Geol. Sin. 2010, 84, 398–406. [Google Scholar] [CrossRef]
- Chen, Y.S.; Wang, C.D.; Du, Q.A. Geological characteristics of the Mingze porphyry molybdenum deposit and prospecting prognosis in its adjacent area, Shannan, Tibet. Geol. Explor. 2011, 47, 31–35. Available online: https://kns.cnki.net/kcms2/article/abstract?v=R4S5WDEiKcvVxdSpWFDon_-rFhp6oO2eIkRwXp-DDH2nJqCEoMTdbs7hQXxxyAeMEKIt4RZ3Al5ZRo_QFLhgJGrblEXzu0kJ0G2rz1lS3BQv5ZWTESQmIFR6PV8QEdmJj8RNZXLBkYa4aFLEqth63iq76GJ0MfPB&uniplatform=NZKPT (accessed on 14 June 2026).
- Li, G.M.; Qin, K.Z.; Ding, K.S.; Li, J.X.; Wang, S.H.; Jiang, S.Y.; Lin, J.D.; Jiang, H.Z.; Fang, S.Y.; Zhang, X.C. Geology and Mineral Assemblage of Tertiary Skarn Cu-Au±Mo Deposits in the Southeastern Gangdese Arc: Implications for Deep Exploration. Acta Geol. Sin. 2006, 9, 1407–1421+1489–1490. Available online: https://kns.cnki.net/kcms2/article/abstract?v=R4S5WDEiKctbSqan5YHFqABZ31YX63L_JqbprPrlyEqfWxjj-DZ2wda3RgGST5CJJ-disrP804C5bHAWQVw690zjya8mBc_AAdeN4Y_KOWuOsTEx9OEZ-i0xzJfx2dkqKrZDQPfNc_ga0YU73T5EoNskQbwIt8gkGcEJ1sOVZym6Fi6h5nfxQQ==&uniplatform=NZKPT&language=CHS (accessed on 14 June 2026). [CrossRef] [Scilit]
- Chen, L.; Qin, K.Z.; Li, G.M.; Li, J.X.; Xiao, B.; Jiang, H.Z.; Zhao, J.X.; Fan, X.; Jiang, S.Y. Geological and skarn mineral characteristics of Nuri Cu-W-Mo deposit in southeast Gangdese, Tibet. Mineral. Depos. 2012, 31, 417–437. [Google Scholar] [CrossRef]
- Huang, S.F.; Jiang, S.Y.; Jiang, H.Z.; Chen, Y.S. Copper Polymetallic Ore-Forming System in Shannan Area and Analysis of Tectonic Stress Field in the Strike-Slip Transfer Zone in Tibet. Geol. Explor. 2011, 47, 1–10. Available online: https://kns.cnki.net/kcms2/article/abstract?v=R4S5WDEiKct7HZt8PIRuOlCm4Jczta0hbV08nykZAdpGkEMQm7B0w6a8nxTs2fBZcRVyzyULkdrEWpQrpkfnZQIhyyGUaCRayY-huki7JE8mrn9B4OFnmwDczjpItzL-Szo_W8QwNrNkEh2qZBLcJEJbHIwEBYeCt_HrrKE1FulhkhbQOWEANw==&uniplatform=NZKPT&language=CHS (accessed on 14 June 2026).
- Wang, L.Q.; Tang, J.X.; Luo, M.C.; Chen, W.; Wang, H. Study on the Existence of Blind Porphyry Ore-body in Nuri Ore District, Tibet. Met. Mine 2012, 4, 109–113. [Google Scholar] [CrossRef]
- Yan, G.Q. Geological Characteristics and Genesis of the Nuri Cu-Mo-W Deposit in Shannan, Tibet. Master’s Thesis, Chengdu University of Technology, Chengdu, China, 2015. Available online: https://kns.cnki.net/kcms2/article/abstract?v=nTS8fe6ew4o4dwLMeAloYY7RmtltOwmERsKilKoLsBZ5euTJr5lco6oABJPGLZoL_ZzTdyjNu2XP5kOx5LFIRby92gD0Bi-eYPnvegf-S0pQr1Np2jZJRp0coJpa1hQ0aPnK50e42wWyo8ZzZ5hqZvSQW18afoA-164UyqyCFlaApLvewN4QsnzUjXHPNjP9&uniplatform=NZKPT&language=CHS (accessed on 14 June 2026).
- Wu, Z.S.; Shao, X.L. Prospecting potential of porphyry Cu-Mo deposit in the Nuri Ore District, Shannan, Tibet. Mod. Min. 2016, 32, 100–103. Available online: https://kns.cnki.net/kcms2/article/abstract?v=R4S5WDEiKcv4g2hpzZfmaHU4hB-4ix96mG4wkcBOVLU2cijhvAzfVT3peEZFRGiSjgBt-BYHzjGnJTYq4wdz4V5NEIAsuc2N-LOwqPfcxUoUwlQt-8Y08IV6R3lQXuY7ODQBy4b9QsAI5yRRGrFH1NB-gSUKPj8n3Auq79GZiclIiWRNC2-rjQ==&uniplatform=NZKPT&language=CHS (accessed on 14 June 2026).
- Wilkinson, J.J.; Cooke, D.R.; Baker, M.J.; Chang, Z.; Wilkinson, C.C.; Chen, H.; Fox, N.; Hollings, P.; White, N.C.; Gemmell, J.B.; et al. Porphyry Indicator Minerals and Their Mineral Chemistry as Vectoring and Fertility Tools; Geological Survey of Canada: Ottawa, ON, Canada, 2017.
- Cooke, D.R.; Baker, M.; Hollings, P.; Sweet, G.; Chang, Z.; Danyushevsky, L.; Gilbert, S.D.; Zhou, T.; White, N.C.; Gemmell, J.B.; et al. New advances in detecting the distal geochemical footprints of porphyry systems—Epidote mineral chemistry as a tool for vectoring and fertility assessments. In Building Exploration Capability for the 21st Century; Society of Economic Geologists: Littleton, CO, USA, 2014. [Google Scholar] [CrossRef] [Scilit]
- Wilkinson, J.J.; Chang, Z.; Cooke, D.R.; Baker, M.J.; Wilkinson, C.C.; Inglis, S.; Chen, H.; Gemmell, J.B. The chlorite proximitor: A new tool for detecting porphyry ore deposits. J. Geochem. Explor. 2015, 152, 10–26. [Google Scholar] [CrossRef] [Scilit]
- Cooke, D.R.; Wilkinson, J.J.; Baker, M.; Agnew, P.; Phillips, J.; Chang, Z.; Chen, H.; Wilkinson, C.C.; Inglis, S.; Hollings, P.; et al. Using Mineral Chemistry to Aid Exploration: A Case Study from the Resolution Porphyry Cu-Mo Deposit, Arizona. Econ. Geol. 2020, 115, 813–840. [Google Scholar] [CrossRef] [Scilit]
- Zheng, W.B.; Ding, S.; Li, S.J.; Leng, Q.F.; Li, C.; Wang, H.; Li, M.T.; Dai, C.L. The first Cu deposit of main collisional stage on the northern gangdese Belt:geological features and molybdenite Re-Os dating of the Chengba skarn Cu deposit in Linzhou County and their geological significance. Acta Geol. Sin. 2019, 93, 459–469. [Google Scholar] [CrossRef]
- Tang, Y.W.; Chen, L.; Zhao, Z.F.; Zheng, Y.F. Origin of syn-collisional granitoids in the Gangdese orogen: Reworking of the juvenile arc crust and the ancient continental crust. Bulletin 2022, 134, 577–598. [Google Scholar] [CrossRef] [Scilit]
- Zhao, Y.S.; Meng, Y.K.; Sun, J.B.; Gao, Q.Z. Unraveling of the Gangdese batholith exhumation since the Miocene: Evidence from(U-Th)/He thermochronology. Sci. China Earth Sci. 2025, 55, 3438–3458. [Google Scholar] [CrossRef] [Scilit]
- Tafti, R. Metallogeny, Geochronology and Tectonic Setting of the Gangdese Belt, Southern Tibet, China. Ph.D. Thesis, University of British Columbia, Vancouver, BC, Canada, 2011. [Google Scholar]
- Zheng, Y.C.; Hou, Z.Q.; Gong, Y.L.; Liang, W.; Sun, Q.Z.; Zhang, S.; Fu, Q.; Huang, K.X.; Li, Q.Y.; Li, W. Petrogenesis of Cretaceous adakite-like intrusions of the Gangdese Plutonic Belt, southern Tibet: Implications for mid-ocean ridge subduction and crustal growth. Lithous 2014, 190–191, 240–263. [Google Scholar] [CrossRef] [Scilit]
- Zhu, D.C.; Wang, Q.; Chung, S.L.; Cawood, P.A.; Zhao, Z.D. Gangdese magmatism in southern Tibet and India–Asia convergence since 120 Ma. Geol. Soc. Lond. Spec. Publ. 2019, 483, 583–604. [Google Scholar] [CrossRef] [Scilit]
- Xie, G.Q.; Chen, X.L.; Ma, L.J.; Gao, P.; Zuo, J.Z.; Wang, X.Q. Chengba copper polymetallic skarn deposit in Linzhou County, Gangdese metallogenic belt: Implications for mineral exploration of regional Paleocene Cu deposits in southern Tibet. Mineral. Depos. 2021, 40, 625–630. [Google Scholar] [CrossRef]
- Hou, D.H.; Pan, Z.L.; Yang, X.P.; Zhang, L.G.; He, J.Y.; Zhang, H.; Cheng, Z.; Wang, S.; Wang, J.G. Chronology, geochemistry and tectonic significance of middle stage of Late Cretaceous adakite in Zhazuo aera, Tibet. Sediment. Geol. Tethyan Geol. 2023, 43, 592–603. [Google Scholar] [CrossRef]
- Leng, Q.F.; Li, W.C.; Dai, C.L.; Tang, P.; Chen, M. Sulfur and lead isotope composition tracing for the ore-forming material source of Nachatang Pb-Zn deposit in Tibet. Sediment. Geol. Tethyan Geol. 2023, 43, 168–179. [Google Scholar] [CrossRef]
- Jiang, H.; Yang, F.C.; Xu, Z.B.; Li, W.C.; Wang, X.Y.; Liu, A.L.; Jiang, L.L.; Li, S.; Jiang, X.J.; Yan, Q.G.; et al. The origin of Gangjiang adakite-like intrusions and associated porphyry Cu–Mo mineralization in the central Gangdese porphyry Cu belt, southern Tibet. Ore Geol. Rev. 2024, 172, 106190. [Google Scholar] [CrossRef] [Scilit]
- Wu, Z.S.; Wang, Y.Y.; Shi, H.Z.; Chen, B.; Huang, Y.; Du, Q.A.; Chen, W.Q.; Tang, L.W.; Bai, Y. Petrogenesis and Metallogenesis of Late Cretaceous Adakites in the Nuri Large Cu-W-Mo Deposit, Tibet, China: Constraints from Geochronology, Geochemistry, and Hf Isotopes. Minerals 2024, 14, 565. [Google Scholar] [CrossRef] [Scilit]
- Wang, Y.Y.; Wu, Z.S.; Chen, W.Q.; Du, Q.A.; Tang, L.W.; Shi, H.Z.; Ma, G.T.; Zhang, Z.; Liang, W.; Wu, B.; et al. Genesis of the Nuri Cu-W-Mo Deposit, Tibet, China: Constraints from in situ Trace Elements and Sr Isotopic Analysis of Scheelite. Acta Geol. Sin. Ed. 2024, 98, 117–131. [Google Scholar] [CrossRef] [Scilit]
- Wu, Z.S.; Tang, L.W.; Basang, Y.D.; Chen, W.Q.; Chen, B.; Du, Q.A.; Hou, H.F.; Miao, H.Y. In situ trace-element and Sr isotopic characteristics of scheelite and their implications for the genesis in the Nuri Cu-W-Mo deposit, Xizang. Sediment. Geol. Tethyan Geol. 2024, 44, 723–739. [Google Scholar] [CrossRef]
- Dai, Z.W.; Li, G.M.; Ding, J.; Huang, Y.; Cao, H.W. Late Cretaceous adakite in Nuri, Tibet: Product of oceanic ridge subduction. Geochemistry 2018, 43, 2727–2741. [Google Scholar] [CrossRef] [Scilit]
- Wang, Q.; Huang, Y.; Dong, S.L.; Yan, G.Q.; You, Q.; Jiang, H.Z.; Zhang, K. Zircon LA-ICP-MS U-Pb geochronology, geochemistry and implications of ore-forming porphyry in Nuri skarn Cu-Mo-W deposit, eastern Gangdise. Mineral. Depos. 2018, 37, 571–586. [Google Scholar] [CrossRef]
- Pan, L.; Xie, W. Fluid Geochemical Characteristics and Genesis of Skarn-porphyry Copper-Tungsten-Molybdenum Polymetallic Deposit in Nuri, Zedang, Southern Tibet. Acta Geol. Sichuan 2023, 43, 615–624. Available online: https://kns.cnki.net/kcms2/article/abstract?v=R4S5WDEiKcsqWsZiVB4rC_sI0fCKpaFlwxwt9ZPADkjg5r2_Edb054q7iLoCXrdu7qht1NLG6NL1Vn9NRjvTadVAK-7p_bHldjpXV6uwh4Ui3iK-fu35dtXy5NiD7rzj3RjC9WIVZzuqQq727ckPfS1vpfpGedRHzmtBDEYgmKJAvnGNCF2juA==&uniplatform=NZKPT&language=CHS (accessed on 14 June 2026).
- Chen, L.; Qin, K.Z.; Li, J.X.; Xiao, B.; Li, G.M.; Zhao, J.X.; Fan, X. Fluid Inclusions and Hydrogen, Oxygen, Sulfur Isotopes of Nuri Cu-W-Mo Deposit in the Southern Gangdese, Tibet. Resour. Geol. 2012, 62, 42–62. [Google Scholar] [CrossRef] [Scilit]
- Tang, L.W.; Wang, Y.Y.; Chen, W.Q.; Chen, B.; Wu, Z.S.; Miao, H.Y.; Wu, B.; Chen, L.Z. Geological Characteristics of the South Section of the Nuri Copper Polymetallic Deposit in Tibet and the Exploration Application of Short-Wave Infrared Spectra. Geol. Explor. 2024, 60, 932–943. Available online: https://kns.cnki.net/kcms2/article/abstract?v=R4S5WDEiKct6E5lZmCM-6oEhp5KeSOyRdD65iw6N_vFzyg5ImoJNbvnC4plmMLu8Bror6cTOIO0W5GaW_fCl0FyZLl7fljs1XflknaDEEHAWUWPmxUUOTkHdGvi5JJhy-EQBHXbwYiYUVI2EYANGkqefmtw3A4q_D3qb7x7WfrNOmI-xBVvBgA==&uniplatform=NZKPT&language=CHS (accessed on 14 June 2026).
- Wang, L.Q.; Tang, J.; Chen, W.; Luo, M.C.; Jiang, H.Z.; Zhang, K. Sulfur and Lead Isotopic Geochemistry of the Nuri and Chengba Cu-Mo-W Deposits in Tibet. Acta Geosci. Sin. 2014, 35, 39–48. [Google Scholar] [CrossRef]
- Inoue, A.; Kurokawa, K.; Hatta, T. Application of Chlorite Geothermometry to Hydrothermal Alteration in Toyoha Geothermal System, Southwestern Hokkaido, Japan. Resour. Geol. 2010, 60, 52–70. [Google Scholar] [CrossRef] [Scilit]
- Xiao, B.; Chen, H.Y.; Hollings, P.; Wang, Y.F.; Yang, J.T.; Wang, F.Y. Element transport and enrichment during propylitic alteration in Paleozoic porphyry Cu mineralization systems: Insights from chlorite chemistry. Ore Geol. Rev. 2018, 102, 437–448. [Google Scholar] [CrossRef] [Scilit]
- Foster, M.D. Interpretation of the Composition and a Classification of the Chlorites; U.S. Government Printing Office: Washington, DC, USA, 1962.
- Liu, Y.S.; Hu, Z.C.; Gao, S.; Günther, D.; Xu, J.; Gao, C.G.; Chen, H.H. In situ analysis of major and trace elements of anhydrous minerals by LA-ICP-MS without applying an internal standard. Chem. Geol. 2008, 257, 34–43. [Google Scholar] [CrossRef] [Scilit]
- Jochum, K.P.; Weis, U.; Stoll, B.; Kuzmin, D.; Yang, Q.C.; Raczek, I.; Jacob, D.E.; Stracke, A.; Birbaum, K.; Frick, D.A.; et al. Determination of reference values for NIST SRM 610–617 glasses following ISO guidelines. Geostand. Geoanal. Res. 2011, 35, 397–429. [Google Scholar] [CrossRef] [Scilit]
- Wu, S.; Wörner, G.; Jochum, K.P.; Stoll, B.; Simon, K.; Kronz, A. The Preparation and Preliminary Characterisation of Three Synthetic Andesite Reference Glass Materials (ARM-1, ARM-2, ARM-3) for in Situ Microanalysis. Geostand. Geoanal. Res. 2019, 43, 567–584. [Google Scholar] [CrossRef] [Scilit]
- Paton, C.; Hellstrom, J.; Paul, B.; Woodhead, J.; Hergt, J. Iolite: Freeware for the visualisation and processing of mass spectrometric data. J. Anal. At. Spectrom. 2011, 26, 2508–2518. [Google Scholar] [CrossRef] [Scilit]
- Chu, G.B.; Chen, H.Y.; Zhang, S.T.; Zhang, Y.; Cheng, J.M. Geochemistry and Geochronology of Multi-Generation Garnet: New Insights on the Genesis and Fluid Evolution of Prograde Skarn Formation. Geosci. Front. 2023, 14, 101495. [Google Scholar] [CrossRef] [Scilit]
- Walshe, J.L. A Six-Component Chlorite Solid Solution Model and the Conditions of Chlorite Formation in Hydrothermal and Geothermal Systems. Econ. Geol. 1986, 81, 681–703. [Google Scholar] [CrossRef] [Scilit]
- Cathelineau, M. Cation Site Occupancy in Chlorites and Illites as Function of Temperature. Clay Miner. 1988, 23, 471–485. [Google Scholar] [CrossRef] [Scilit]
- Bourdelle, F.; Cathelineau, M. Low-Temperature Chlorite Geothermometry: A Graphical Representation Based on a T-R2+–Si Diagram. Eur. J. Mineral. 2015, 27, 617–626. [Google Scholar] [CrossRef] [Scilit]
- Cui, T.; Yu, H.C.; Jowitt, S.M.; Li, Z.S.; Wei, X.L.; Zou, S.H.; Bo, J.W.; Pei, L.; Li, S.S.; Nassif, M.T.; et al. Chlorite composition records the formation of increased oxygen fugacity-induced disseminated gold mineralization within the Guocheng gold deposit, China. Geol. Soc. Am. Bull. 2025, 137, 4786–4800. [Google Scholar] [CrossRef] [Scilit]
- Zang, W.; Fyfe, W.S. Chloritization of the hydrothermally altered bedrock at the Igara Bahia gold deposit, Carajás, Brazil. Miner. Depos. 1995, 30, 30–38. [Google Scholar] [CrossRef] [Scilit]
- Kranidiotis, P.; MacLean, W.H. Systematics of chlorite alteration at the Phelps Dodge massive sulfide deposit, Matagami, Quebec. Econ. Geol. 1987, 82, 1898–1911. [Google Scholar] [CrossRef] [Scilit]
- Bourdelle, F. Low-temperature chlorite geothermometry and related recent analytical advances: A review. Minerals 2021, 11, 130. [Google Scholar] [CrossRef] [Scilit]
- Chen, L.L. Study on the Fluid Inclusions from Nuri Cu-W-Mo Deposit in Tibet. Master’s Thesis, Chengdu University of Technology, Chengdu, China, 2014. Available online: https://kns.cnki.net/kcms2/article/abstract?v=R4S5WDEiKcvVR7vge90IJAcxaVHkvo8yO2MNLjvlC3yMczqe6ddQ2sWykiKxeLjUOA9uSBaDhIQjAE_GQ5PAPmbvCfeQQ7k0HALUXtNrlOEYt75cPV4TpcaXYZUKQMvvyDvCcc_6S7x12pbqqCPXEnmQeUcrSF6lZCRq4GsnfbuYH3WDoHf7gA==&uniplatform=NZKPT&language=CHS (accessed on 14 June 2026).
- Hey, M.H. A new review of the chlorites. Mineral. Mag. J. Mineral. Soc. 1954, 30, 277–292. [Google Scholar] [CrossRef] [Scilit]
- Wiewióra, A.; Weiss, Z. Crystallochemical classifications of phyllosilicates based on the unified system of projection of chemical composition: II. The chlorite group. Clay Miner. 1990, 25, 83–92. [Google Scholar] [CrossRef] [Scilit]
- Zane, A.; Sassi, R.; Guidotti, C.V. New data on metamorphic chlorite as a petrogenetic indicator mineral, with special regard to greenschist-facies rocks. Can. Mineral. 1998, 36, 713–726. [Google Scholar]
- Inoue, A.; Meunier, A.; Patrier-Mas, P.; Rigault, C.; Beaufort, D.; Vieillard, P. Application of chemical geothermometry to low-temperature trioctahedral chlorites. Clays Clay Miner. 2009, 57, 371–382. [Google Scholar] [CrossRef] [Scilit]
- Bourdelle, F.; Parra, T.; Chopin, C.; Beyssac, O. A new chlorite geothermometer for diagenetic to low-grade metamorphic conditions. Contrib. Mineral. Petrol. 2013, 165, 723–735. [Google Scholar] [CrossRef] [Scilit]
- Yang, C.; Tang, J.X.; Song, J.L.; Zhang, Z.; Li, Y.B.; Sun, X.G.; Wang, Q.; Ding, S.; Fang, X.; Li, Y.B.; et al. Chlorite Characteristic of the Naruo Porphyry Cu(Au) Deposit in Tibet and Its Geological Significance. Acta Geol. Sin. 2015, 89, 856–872. Available online: https://kns.cnki.net/kcms2/article/abstract?v=R4S5WDEiKctVLYD-mMIXnvm2_cMX49w8bxXlWmUjkLWcw4SAJOL4qbew7GRT-_08hsolCMhG_8IXTRVLPL20VFP956WTCWHRPoWyKLK5x6eD-3wxy5bzxW5L-Em4oRgyqFiYcBIn3Zd1fXdH4iXuF0toDCBCY85HZz3pd2ykhYRc1bSYatnTzA==&uniplatform=NZKPT&language=CHS (accessed on 14 June 2026).
- De Caritat, P.; Hutcheon, I.; Walshe, J.L. Chlorite Geothermometry: A Review. Clays Clay Miner. 1993, 41, 219–239. [Google Scholar] [CrossRef] [Scilit]
- Hillier, S.; Velde, B. Octahedral occupancy and the chemical composition of diagenetic (low-temperature) chlorites. Clay Miner. 1991, 26, 149–168. [Google Scholar] [CrossRef] [Scilit]
- Zhang, S.; Xiao, B.; Long, X.; Chu, G.; Cheng, J.; Zhang, Y.; Tian, J.; Xu, G. Chlorite as an exploration indicator for concealed skarn mineralization: Perspective from the Tonglushan Cu–Au–Fe skarn deposit, Eastern China. Ore Geol. Rev. 2020, 126, 103778. [Google Scholar] [CrossRef] [Scilit]
- Lu, L.; Zhu, Q.; Xie, G.; Wu, C.; Wei, K.; Cai, H.; Shang, S. Correlation between geochemistry and Raman spectra of chlorite from the Fujiashan W skarn, eastern China: Implications for new exploration tool. Ore Geol. Rev. 2025, 188, 107011. [Google Scholar] [CrossRef] [Scilit]
- Zhang, W.; Zhang, F.F.; Wang, Y.H.; Wang, J.P.; Li, Y.Y.; Pei, X.X.; Gao, J.B.; Chen, Y.M. Chlorite chemistry, HOS-Pb isotopes and fluid characteristics of the Yuhai Cu-Mo Deposit in Eastern Tianshan: Implications for porphyry copper mineralization and exploration. J. Geochem. Explor. 2022, 241, 107059. [Google Scholar] [CrossRef] [Scilit]
- Wang, Z.; Wu, J.; Dou, X.; Chen, G.; Wei, J.; Jiang, X.; Li, Z. Chlorite Exploration Indicators and Their Indicative Significance in the Cimabanshuo Porphyry Copper Deposit, Tibet. Minerals 2026, 16, 304. [Google Scholar] [CrossRef] [Scilit]
- Li, F.; Tang, J.; Song, Y.; Li, S.; Tang, P.; Li, H.; Yang, H.; Wang, Q.; Wang, Y.; Danzeng, Z.; et al. Major elements geochemistry of chlorite in different ore deposits and its genesis and exploration significance: A case study from Naruo porphyry Cu deposit in Duolong ore district, Tibet. Front. Earth Sci. 2024, 12, 1378820. [Google Scholar] [CrossRef] [Scilit]
- Inoue, A. Formation of Clay Minerals in Hydrothermal Environments. In Origin and Mineralogy of Clays; Springer: Berlin/Heidelberg, Germany, 1995; pp. 268–329. [Google Scholar]
- Zhang, J.; Liu, X.X.; Wang, Y.T.; Chen, S.C.; Hu, Q.Q.; Liu, X.L. Characteristics of chlorite from the Baguamiao gold deposit in Shaanxi Province and its geological implication. Geol. Bull. China 2021, 40, 586–603. [Google Scholar] [CrossRef]
- Ji, Y.B.; Du, L.J.; Huang, Z.L.; Chen, J.; Li, B.; Li, X.Z.; Liu, L.L.; Yang, Z.F. The genetic mineralogy of chlorite in the Yangla copper deposit in the Northwestern Yunnan. Acta Mineral. Sin. 2023, 43, 343–357. [Google Scholar] [CrossRef]
- Pacey, A.; Wilkinson, J.; Cooke, D. Chlorite and Epidote Mineral Chemistry in Porphyry Ore Systems: A Case Study of the Northparkes District, NSW, Australia. Econ. Geol. 2020, 115, 701–727. [Google Scholar] [CrossRef] [Scilit]
- Wang, Y.; Fan, H.; Pang, Y.; Xiao, W. Geochemical Characteristics of Chlorite in Xiangshan Uranium Ore Field, South China and Its Exploration Implication. Minerals 2022, 12, 693. [Google Scholar] [CrossRef] [Scilit]
- Wang, Y.; Yang, X.Y.; Kang, X.N.; Tang, C.; Sun, J.D.; Cao, J.Y. Geochemical and mineralogical studies of zircon, apatite, and chlorite in the giant Dexing porphyry Cu-Mo-Au deposit, South China: Implications for mineralization and hydrothermal processes. J. Geochem. Explor. 2022, 240, 107042. [Google Scholar] [CrossRef] [Scilit]
- Freij, N.; Gregory, D.D.; Zhang, S.; Morrison, S.M. Chlorite geochemical vectoring of ore bodies: A natural kind clustering approach. Front. Earth Sci. 2023, 11, 1222291. [Google Scholar] [CrossRef] [Scilit]

Disclaimer/Publisher’s Note: The statements, opinions and data contained in all publications are solely those of the individual author(s) and contributor(s) and not of MDPI and/or the editor(s). MDPI and/or the editor(s) disclaim responsibility for any injury to people or property resulting from any ideas, methods, instructions or products referred to in the content. |
© 2026 by the authors. Licensee MDPI, Basel, Switzerland. This article is an open access article distributed under the terms and conditions of the Creative Commons Attribution (CC BY) license.