


Abstract
The pore structure of shales from the Qingshankou Formation in the Songliao Basin was investigated using scanning electron microscopy, nitrogen gas adsorption, and high-pressure mercury intrusion porosimetry. Correlations between pore structure parameters and total organic carbon (TOC), mineral composition, and hydrocarbon content were analyzed. The results reveal that micropores (<10 nm) are predominantly hosted within illite/smectite (I/S) clay minerals and constitute 37% of the total pore volume; mesopores (10–300 nm) are inferred to be composite pores associated with organic–clay complexes and account for 58% of the total pore volume; macropores (>300 nm) are primarily quartz interpaticle pores and account for 5% of the total pore volume. With increasing maturity (Ro = 0.4%–1.3%), TOC content decreases and I/S clay content increases, leading to reduced mesopore volume and enhanced micropore volume. Free hydrocarbon content exhibits a significant positive correlation with the mesopore volume fraction, whereas adsorbed hydrocarbon content positively correlates with micropore volume. These findings suggest that free hydrocarbons are preferentially stored within larger pores of organic–clay complexes, while adsorbed hydrocarbons are mainly hosted in smaller pores of I/S clay minerals.
1. Introduction
The lacustrine shales possess complex nanometer-to-micrometer pore-throat systems, with average throat diameters generally less than 10 nm, which are primarily controlled by diverse matrix pore types and complex diagenetic processes [1,2,3,4]. Matrix-related shale pore types include interparticle (interP) pores, intraparticle (intraP) pores associated with mineral particles, and organic pores within organic matter (OM) [5]. Previous studies have shown that the matrix pores of lacustrine shale are dominated by mineral pores, with poorly developed organic pores [6,7]. In fact, OM and inorganic minerals in lacustrine shales are intimately associated and mutually interact, commonly forming organic–clay complexes that host distinctive composite pore systems [8,9]. Diagenetic processes principally include hydrocarbon generation and mineral alteration [4]. For instance, hydrocarbon generation and bitumen infill can significantly reduce the connected “free” pore volume and specific surface area of shale by occupying primary mineral pores [10,11,12]. During diagenesis, the transformation from montmorillonite to illite causes dehydration and shrinkage of clay interlayers, resulting in a more than 15% decrease in clay micropore volume [13]. Meanwhile, formation fluid pressure promotes the development of illite interparticle pores and microfractures, effectively improving the physical properties of shale reservoirs [14]. Therefore, the complex pore network within lacustrine shales has not been fully characterized, and the coupling relationships between pore structure, mineral composition and thermal maturity remain elusive and require further systematic investigation.
Analysis of the correlation between oil content and pore volume enables a preliminary evaluation of the primary pore spaces for shale oil storage. For example, Wang et al. [15] analyzed the relationships between pyrolysis free hydrocarbon S1 content and pore volumes within different pore size ranges in Shahejie Formation shales, and proposed that movable oil is predominantly hosted in pores larger than 30 nm. Zhu et al. [16] compared the variations in average pore diameter before and after the extraction of soluble organic matter (SOM) from Shahejie Formation shales, and suggested that the lower pore size limit for movable oil occurrence is 12 nm. Han et al. [10] compared pore volume changes in artificially matured Qingshankou Formation (QSK) shales before and after SOM removal, and concluded that liquid hydrocarbons mainly reside in micropores (<2 nm). Our previous studies demonstrate that mercury porosity exhibits a distinct positive correlation with oil content in QSK shales, indicating that shale oil is mainly stored in well-connected pores [2]. Mercury intrusion pore data reveal that nanopores in shales have a small pore-throat ratio and favorable connectivity, serving as the primary migration pathways for shale oil, while micron-scale pores have a large pore-throat ratio and poor connectivity, and act as effective storage spaces for shale oil [1]. Although considerable progress has been made in investigating the pore spaces for shale oil storage, no unified consensus has been reached so far, and some viewpoints are even contradictory. These discrepancies arise from the insufficient consideration of shale oil components (free or adsorbed state) in previous studies.
The QSK shales in the Songliao Basin are typical lacustrine organic-rich shales with promising shale oil resource potential in China [17]. In this study, 14 QSK shale core samples were collected for multi-scale pore structure characterization via scanning electron microscopy (SEM), low-temperature nitrogen gas adsorption (LTNA), and high-pressure mercury intrusion porosimetry (HPMIP), combined with organic geochemical testing and mineral composition analysis. This study aims to clarify the quantitative relationships between pore structure parameters, TOC content, mineral composition, and hydrocarbon content. The objectives of this research include: (1) characterizing the morphological features, pore size distribution, and volumetric contributions of different pores in lacustrine shales; (2) revealing the formation, evolution, and diagenetic control mechanisms of different pore types; and (3) illustrating the differential control of pores on the occurrence state and enrichment of free and adsorbed shale hydrocarbons.
2. Geological Setting
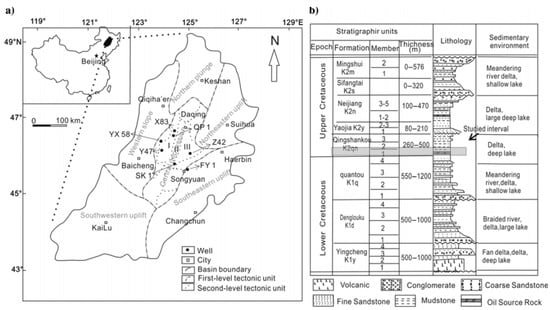
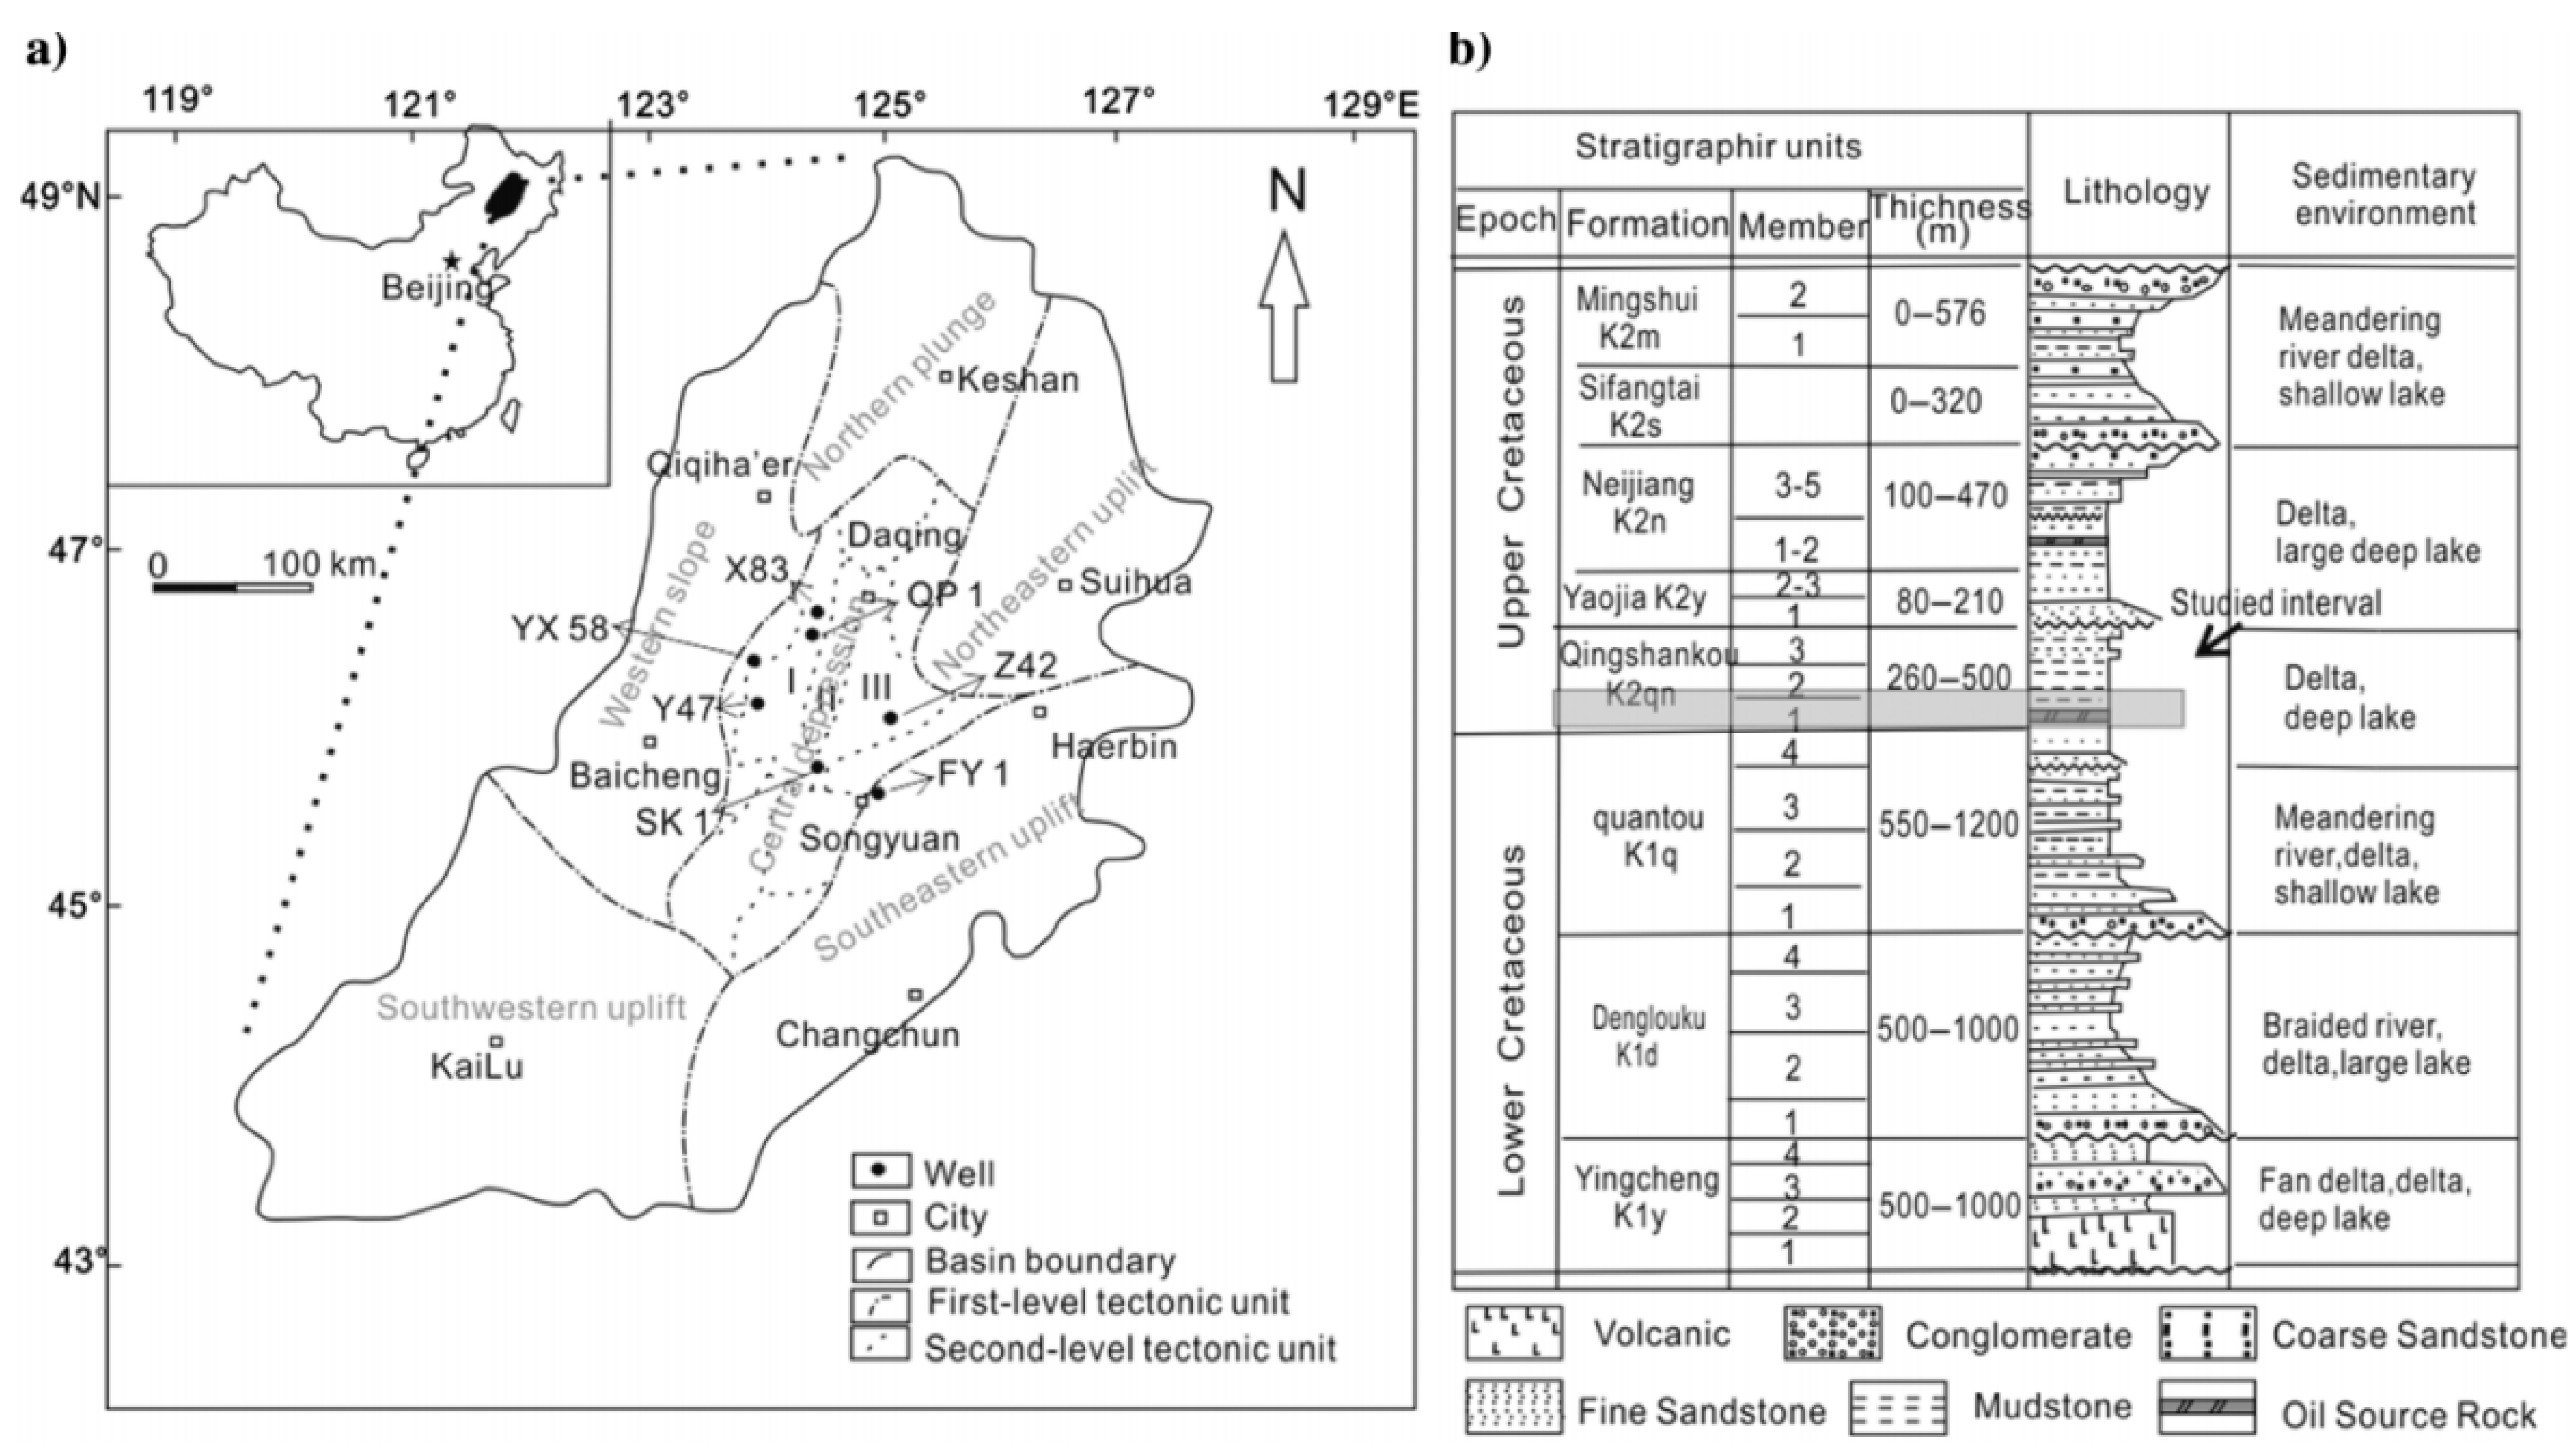
The Songliao Basin, China’s premier Mesozoic–Cenozoic oil-gas bearing basin, is situated in Northeast China with an area of ~260,000 km2. It is divided into six structural units: northern plunge, western slope, central depression, northeastern uplift, southeastern uplift and southwestern uplift [18] (Figure 1a). The central depression, the main hydrocarbon-producing province, is further subdivided into ten secondary petroleum system units. For instance, the Qijia-Gulong sag is the major hydrocarbon generator for the Daqing anticline, while the Fuyu uplift serves as a key reservoir for oil from the Changling sag [19].
Figure 1.
(a) Structural units of the Songliao Basin and sampling well locations (note: I Qijia-Gulong Sag, II Daqing Anticline, and III Sanzhao Sag) and (b) stratigraphic units and studied interval (modified from Feng et al. [18]).
Filled with Jurassic to Neogene clastic sediments averaging 10 km in thickness (Figure 1b), the basin is a typical superimposed basin: lower strata formed in fault-block basins, and upper strata in a depression basin [18]. Fault-block basins developed in the Late Jurassic–Early Cretaceous with coal-bearing fluvial, fan-delta and lacustrine deposits plus volcanic rocks. The depression basin evolved from the Early to Late Cretaceous, dominated by a large central lake with deltaic and fluvial margins; later Pacific compression shifted depocenters westward and uplifted the east.
Widely deposited during the depression stage [17], the QSK comprises two members: K2qn1 (50–90 m, black mudstones/shales) and K2qn2+3 (200–400 m, siltstone/sandstone). K2qn1, formed in a deep lake with periodic marine incursions, contains abundant Type I OM and is the basin’s best source rock [20,21], mostly mature for oil generation in the central depression, with locally low-mature shales in the eastern uplift [19].
3. Samples, Data, and Methods
A total of 14 shale core samples with consistent lithology and variable thermal maturity were collected from seven drilling wells in the central depression of the Songliao Basin, covering four major structural units: the Gulong Sag (Wells YX58, Y47, SK1), Qijia Sag (Wells X83, QP1), Sanzhao Sag (Well Z42), and southeast uplift (Well FY1) (Figure 1). All samples were obtained from the K2qn1 and are dominated by dark black lacustrine shale. Basic geochemical data, including TOC content, Rock-Eval parameters, and mineral composition of all samples (excluding sample FY1-2), were adopted from our previous publication [11], with detailed sample information summarized in Table 1. The pore size distribution data obtained using the LTNA method was adopted from our previous publication [11]. This study supplemented the microscopic pore structure characterization of all samples using SEM and HPMIP tests.
Table 1.
TOC, pyrolysis parameters, and mineral composition of shales in Qingshankou Formation.
Pore morphology and pore types of representative shale samples were characterized using a field-emission scanning electron microscope (FE-SEM, SU8010 Hitachi High-Technologies Corporation, Tokyo, Japan) [11]. Prior to imaging, sample surfaces were flatly polished by argon ion milling at 3 kV using a Hitachi IM4000 ion milling system. Secondary electron and back scattered electron modes were applied to characterize pore topography and shale compositional heterogeneity, respectively. To mitigate electron-beam damage, all observations were performed at a low accelerating voltage of 1.5 kV on uncoated polished surfaces, with a working distance of 2–6 mm and a spatial resolution of 5 nm. Notably, FE-SEM in this study was only used for qualitative identification and morphological characterization of pore types, without quantitative pore size distribution analysis from micrographs. Images were selected to represent the typical pore types in each sample.
HPMIP analysis was performed using a Micromeritics AutoPore IV 9510 porosimeter (Micromeritics Instrument Corporation, Norcross, GA, USA) [2]. The instrument operates at working pressures ranging from 0.01 to 379 MPa. Prior to testing, approximately 3–5 g of 1–20 mesh sample was dried in a vacuum oven at 80 °C for 24 h to eliminate residual moisture. Since mercury is an incompressible liquid, the mercury intruded volume can be taken as the pore volume of the porous medium. The equivalent pore radius (pore-throat size) was calculated from capillary pressure based on the Washburn equation [22]:
where D is pore-throat diameter (nm), P is intrusion pressure (MPa), γ is mercury surface tension (set to 485 mN/m), and θ is mercury contact angle (set to 130°).
The IUPAC classification divides pores into micropores (<2 nm), mesopores (2–50 nm), and macropores (>50 nm), and it has been widely applied to shale gas reservoirs [3]. Nevertheless, this classification may not be suitable for shale oil systems, given that the molecular diameter of oil is substantially larger than that of gas [5]. Accordingly, a pore size classification based on the intrinsic pore size distribution characteristics of lacustrine shales is preferred [23,24,25,26]. Referring to the pore structure characteristics of typical QSK shale samples [11], pores in this study were divided into three categories: micropores (diameter < 10 nm), mesopores (10–300 nm), and macropores (>300 nm). The 300 nm cutoff was selected to match the detection boundary of LTNA and HPMIP, separating fine pore systems quantified by LTNA from large pore-throat systems measurable by HPMIP. LTNA was used to quantify the pore size distributions of micropores and mesopores using the Barrett–Joyner–Halenda (BJH) method [11]. Limited by its upper detection limit, LTNA cannot capture large pores; thus, HPMIP was adopted to characterize macropore features. The macropore volume was calculated from mercury intrusion volumes corresponding to pore-throat diameters > 300 nm. It should be noted that HPMIP characterizes mercury-accessible pore throats rather than pore bodies. Therefore, the reported macropore volume represents the volume of mercury-invaded pore throats, not the intrinsic pore-body volume. Several previous studies have also employed HPMIP to measure macropore volumes in shale [27,28].
To quantitatively characterize the thermal evolution degree of OM, the hydrocarbon generation conversion ratio (f) was selected as the thermal maturity indicator and calculated using the following formula [29]:
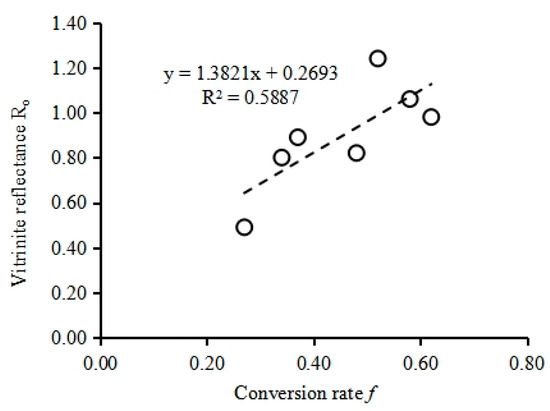
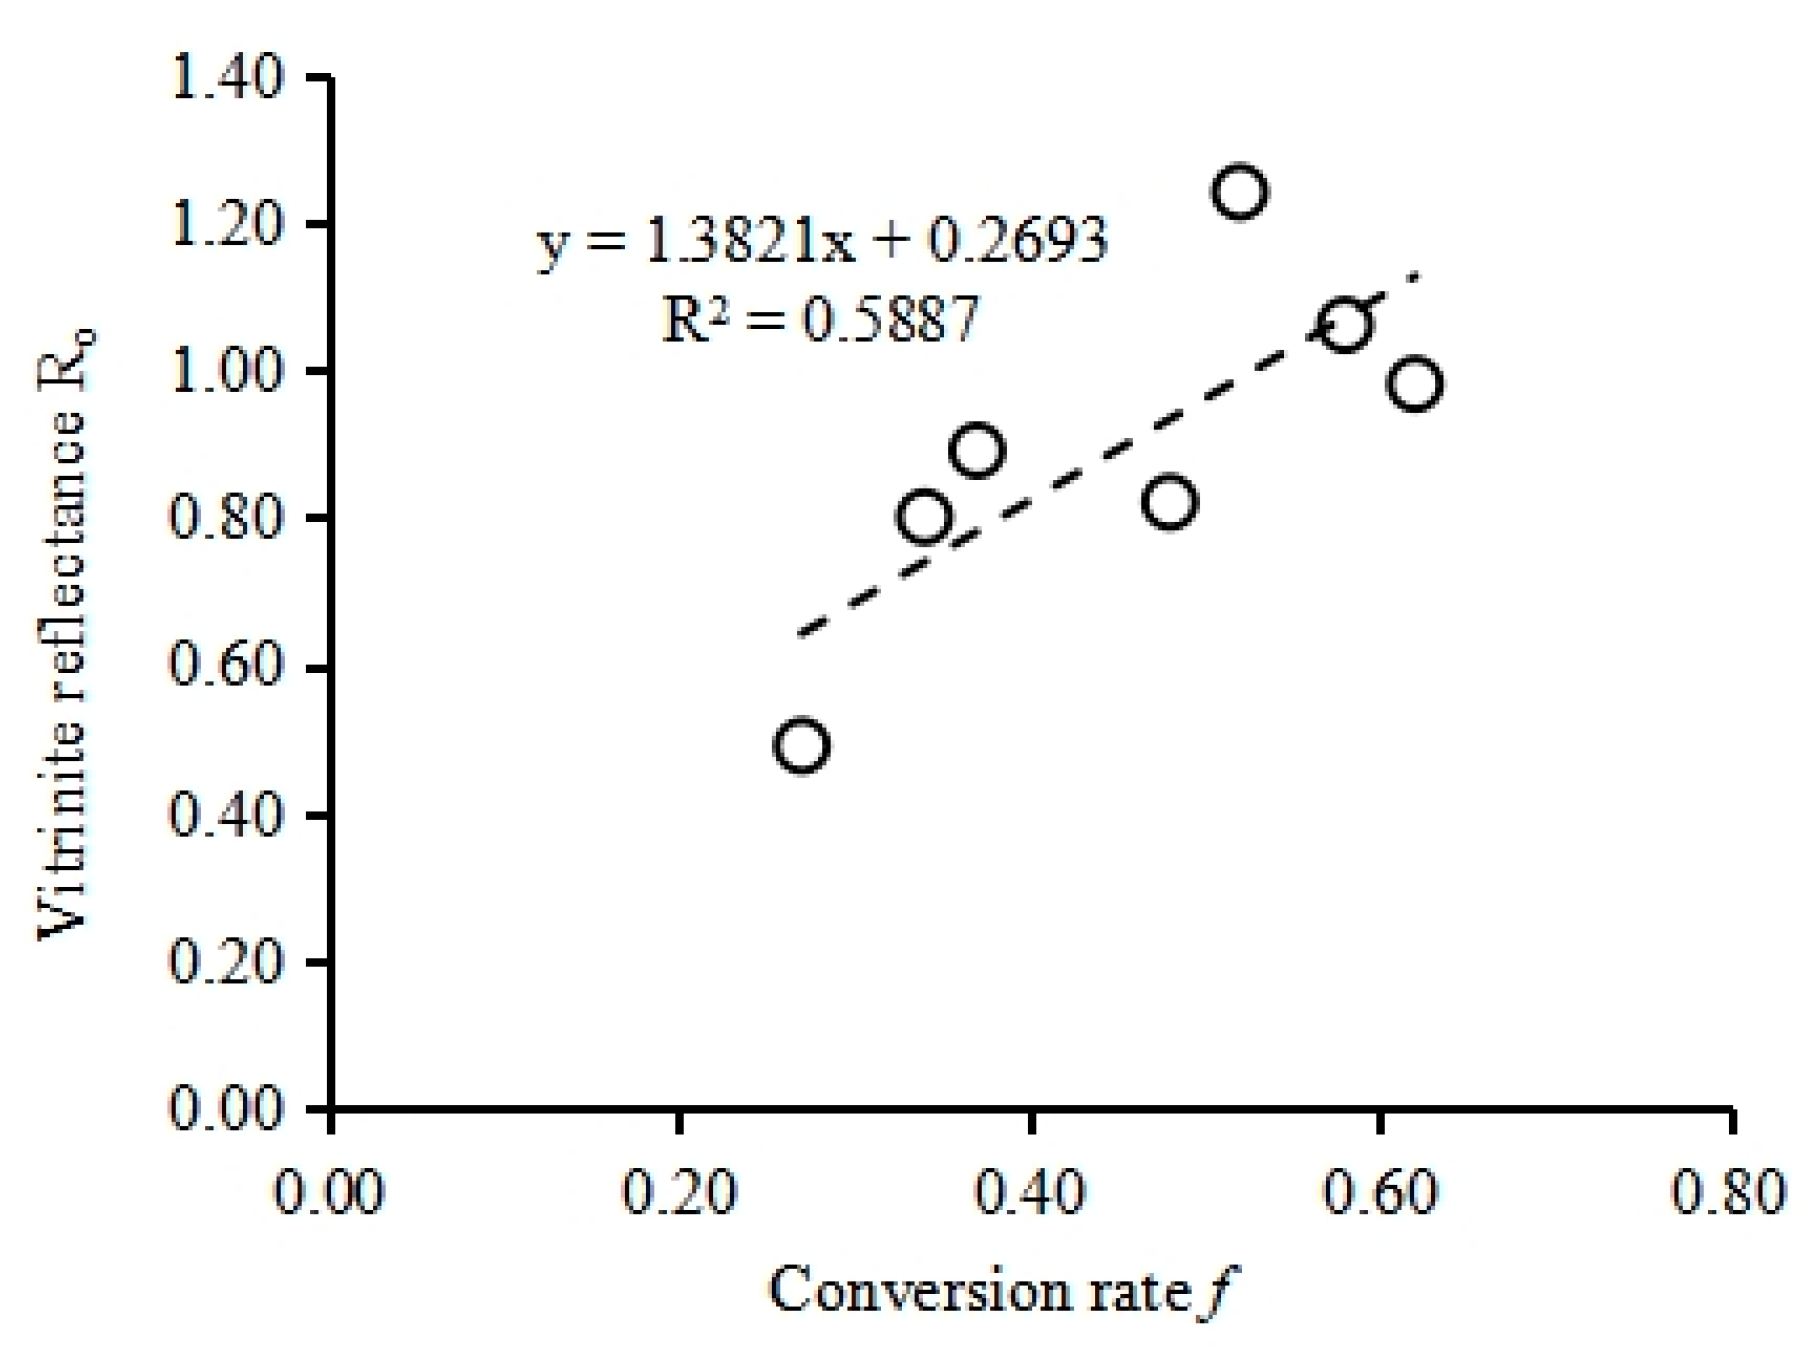
where HI0 is the original hydrogen index of immature OM, and HI is the measured hydrogen index of shale samples. The QSK shale is dominated by Type I kerogen or OM, with a unified HI0 value of 900 mg HC/g TOC [29]. The calculated f values of all samples range from 0.27 to 0.76, corresponding to a vitrinite reflectance (Ro) range of 0.4%–1.3%. The two parameters show a significant positive linear correlation (Figure 2), indicating that the OM of the studied samples evolved from low-mature to mature stage [30].
f = (HI0 − HI)/HI0
Figure 2.
Correlation between conversion rate of hydrocarbon generation and vitrinite reflectance.
4. Results and Discussion
4.1. Pore Types and Structural Characteristics of the Lacustrine Shales
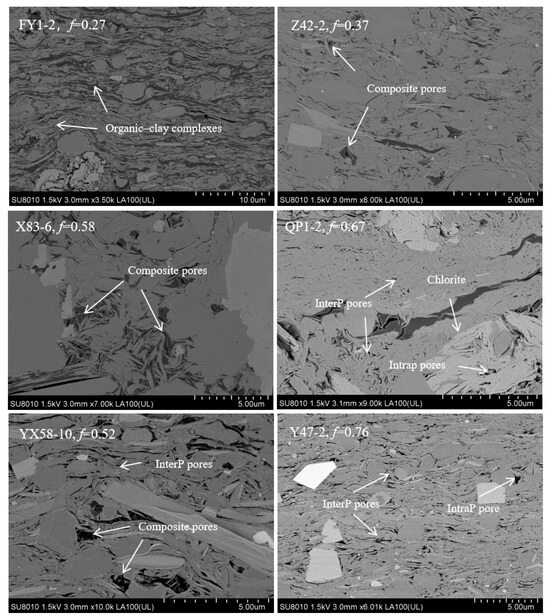
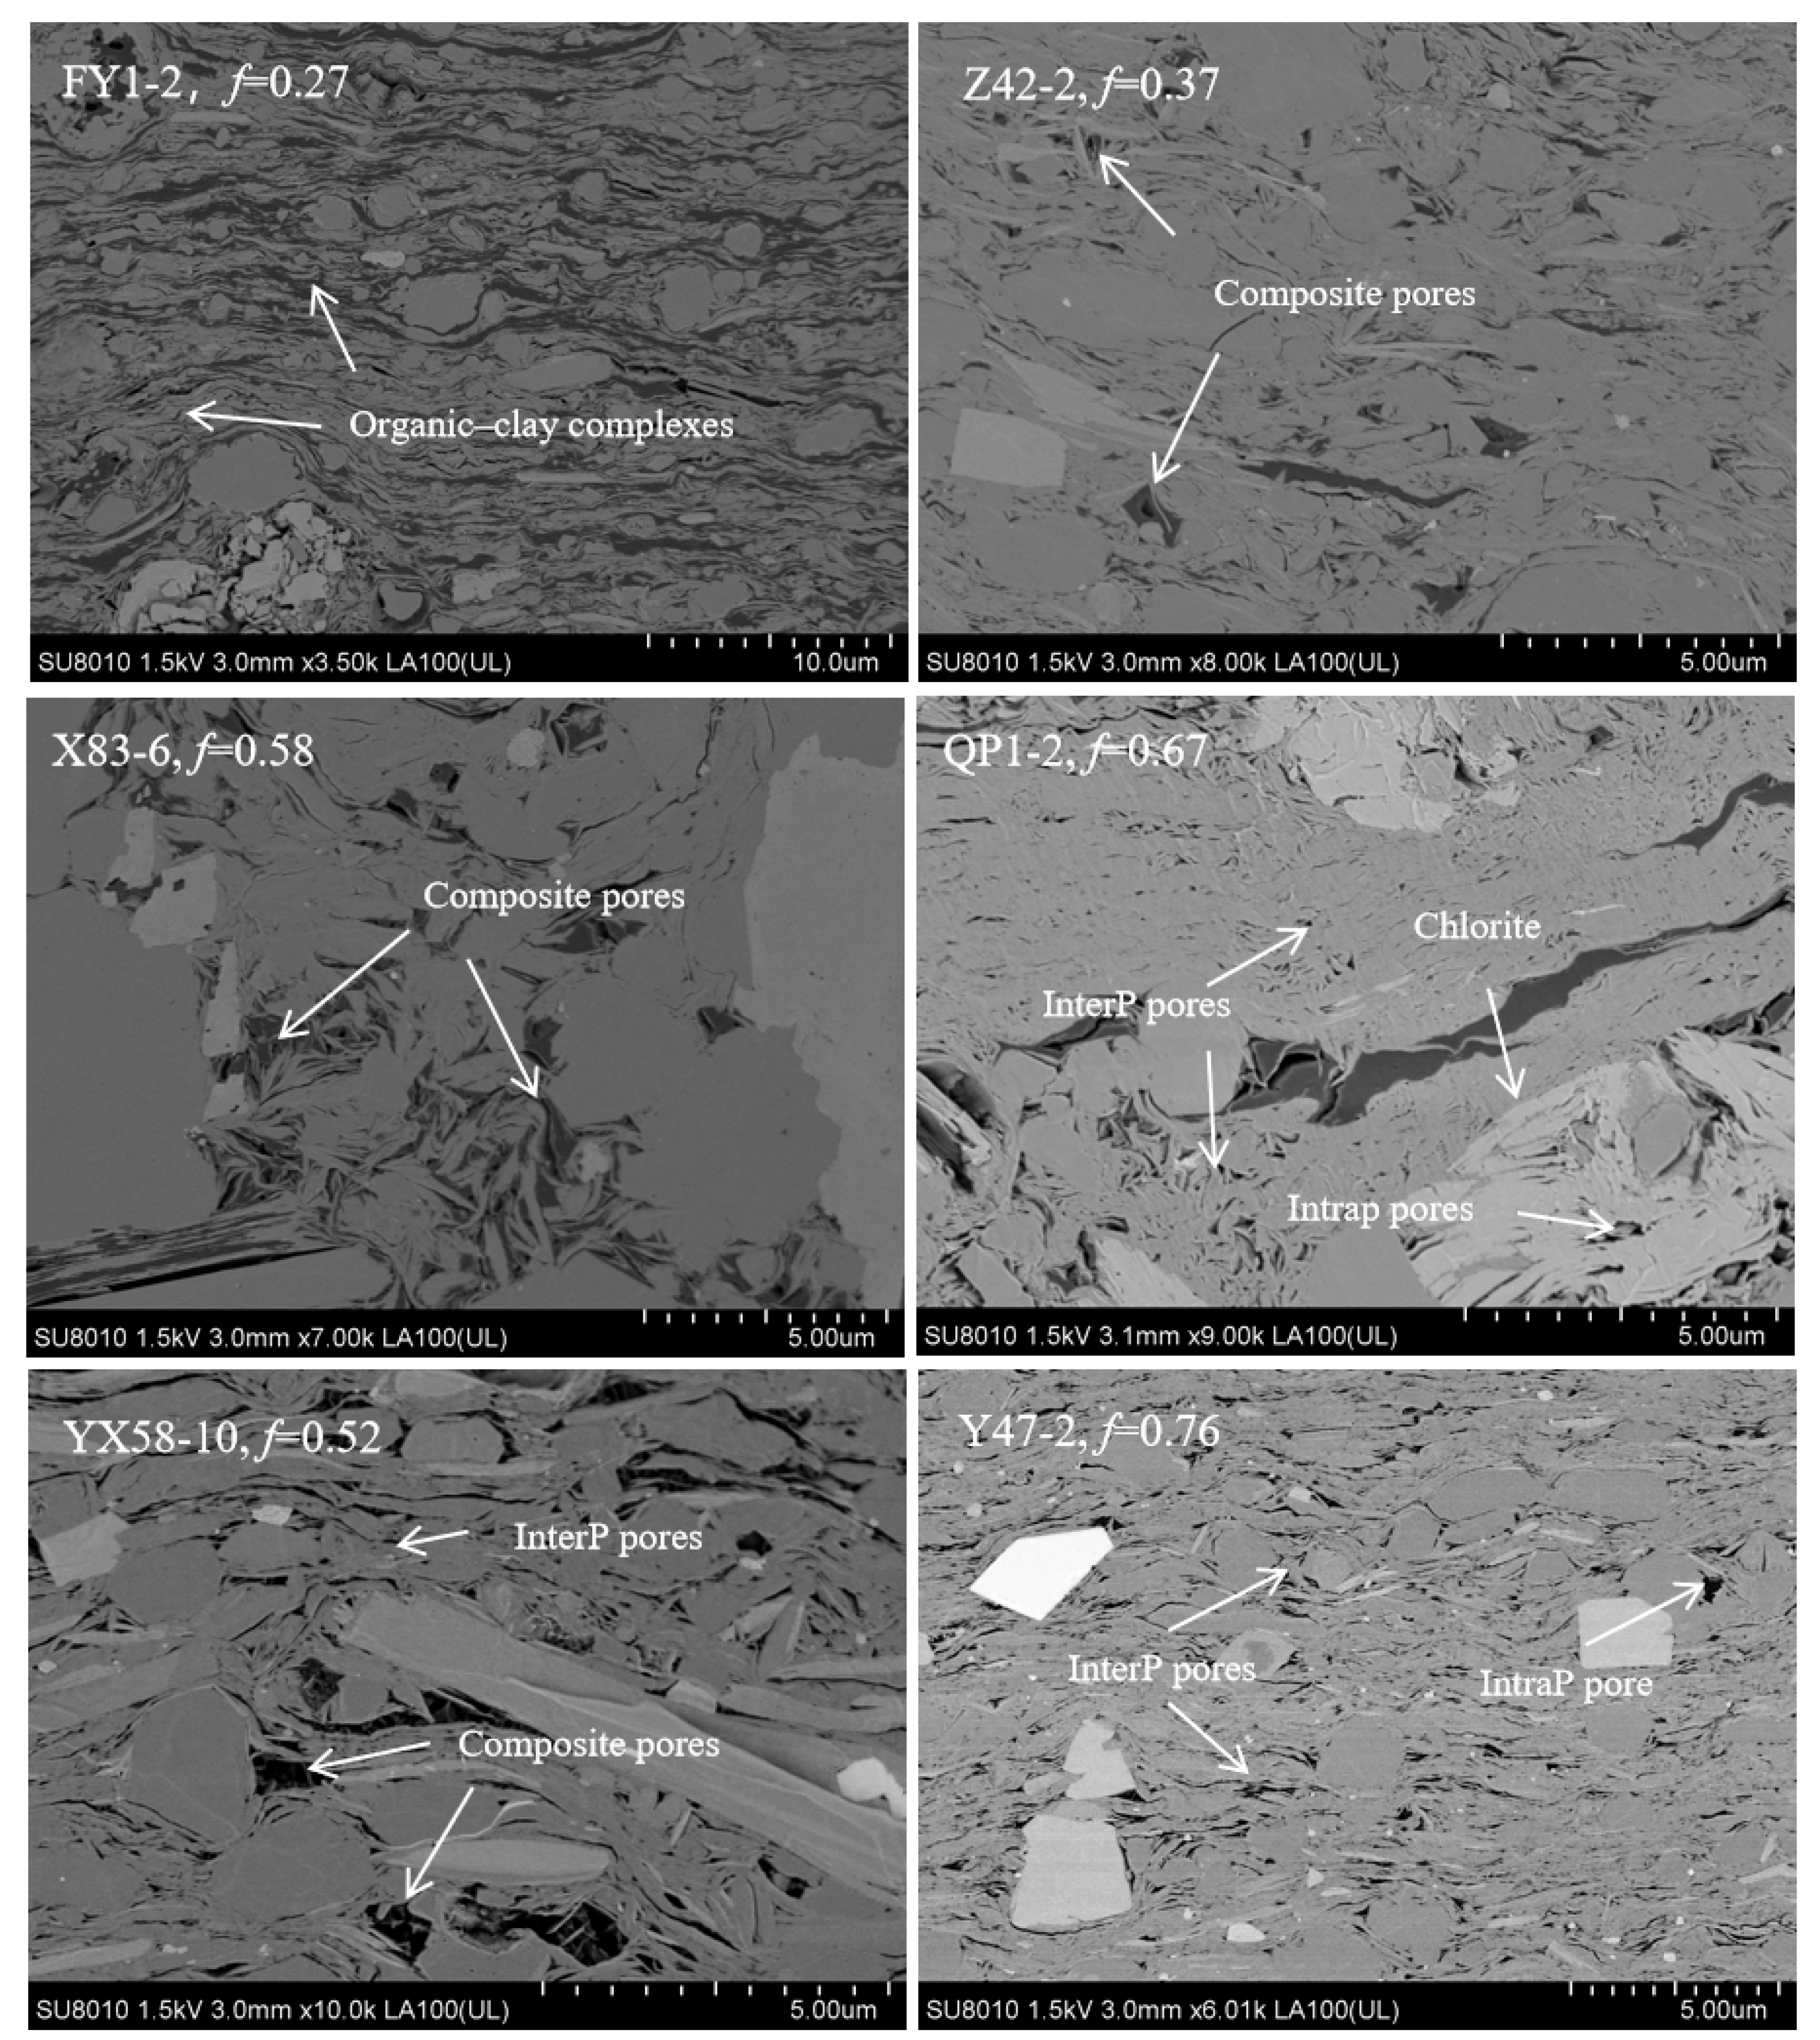
SEM observations of typical shale samples show distinct microscopic structural differences between low-mature and mature shales (Figure 3). In low-mature samples (e.g., FY1-2), OM and clay minerals are alternately distributed in bedding-parallel banded structures, forming continuous organic–clay complex matrices, with scattered quartz and feldspar detrital particles. Low-mature shales develop abundant nanoscale organic–clay composite pores, mainly occurring as marginal pores at the OM-I/S mineral interfaces, and a small number of microscale microfractures. Mature shales are also dominated by nanoscale composite pores, but exhibit significantly reduced OM abundance, with residual OM mainly filling clay interparticle pores. The development of siliciclastic interP macropores varies significantly among samples due to mineral compositional differences. For example, sample QP1-2 with high I/S clay content has poorly developed siliciclastic interP pores; sample YX58-10 with high quartz content develops abundant quartz interP pores; sample Y47-2 has equivalent quartz content to YX58-10 but finer grain size, resulting in limited macropore development.
Figure 3.
FE-SEM images of various types of pores in shales of Qingshankou Formation. Composite pores are mainly marginal pores at the OM–I/S mineral interfaces.
Previous studies on QSK shale pore controlling factors are limited by widespread pore filling by liquid hydrocarbons, leading to ambiguous mineral-pore correlations [2,30]. In this study, SOM was extracted prior to pore testing to eliminate hydrocarbon filling interference, and the corrected pore volume data and proportional contributions of each sample are listed in Table 2. The pore volumes were obtained by integrating LTNA and HPMIP results with a non-overlapping segmentation strategy to prevent double-counting. LTNA quantified pore volume for pores < 300 nm (micropores <10 nm and mesopores 10–300 nm), and HPMIP was only used for pore throats >300 nm.
Table 2.
Pore size fractions of shale samples from Qingshankou Formation.
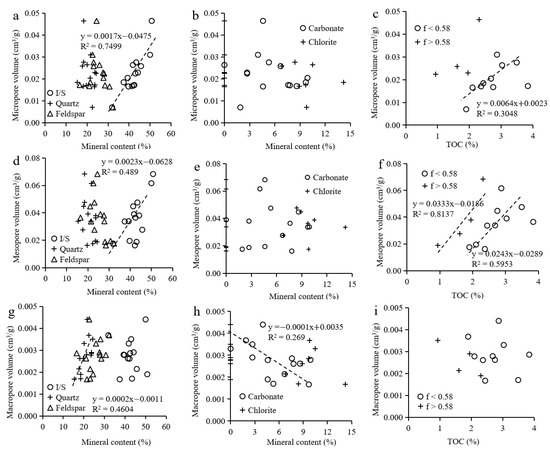
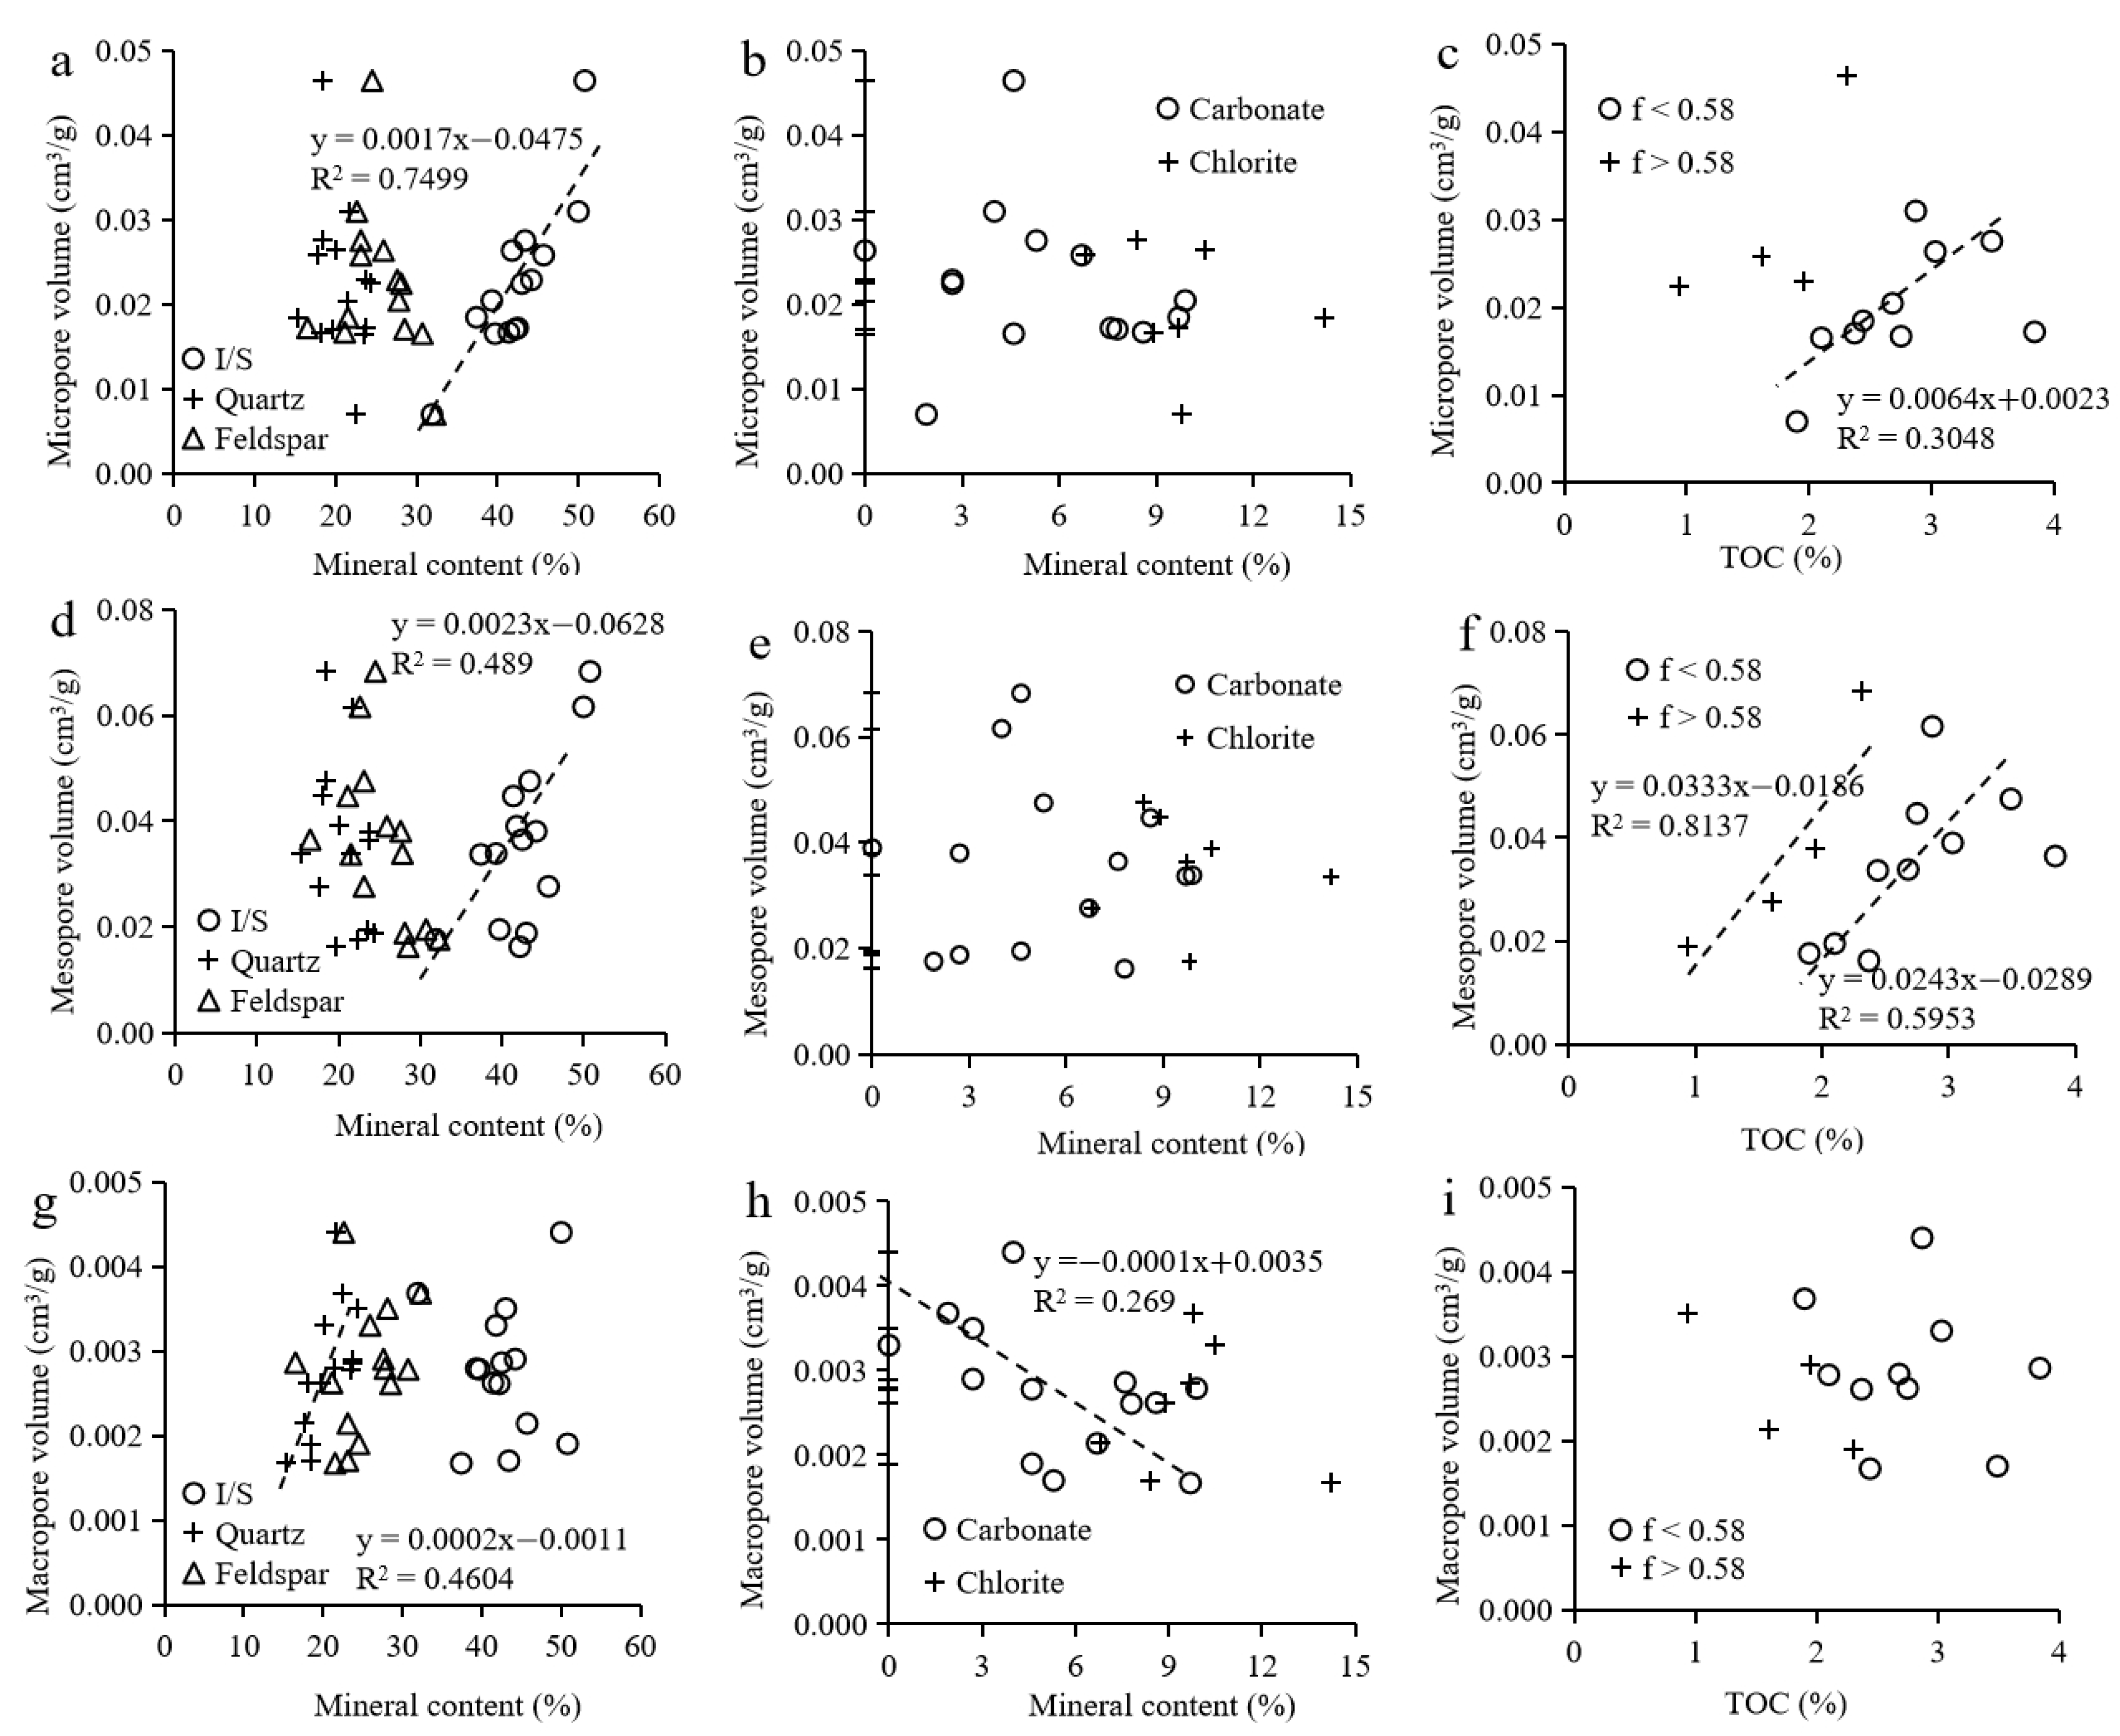
The correlation relationships between mineral composition, TOC content, and three pore size fractions are shown in Figure 4. Micropore volume exhibits a stronger positive linear correlation with the content of I/S clay mineral (R2 = 0.7499) than with TOC content (R2 = 0.3048). This suggests that micropores in shale are predominantly hosted in I/S clay minerals, which is attributed to the development of abundant ~3 nm intraP micropores in I/S clays [31]. Mesopore volume shows positive correlations with both I/S clay minerals and TOC content. Combined with the SEM observations described above (Figure 3), this finding may suggest that these mesopores could occur as marginal pores associated with organic–clay complexes. Macropore volume displays clear correlations with quartz and carbonate minerals, corresponding to detrital quartz interP pores and pore destruction by carbonate cementation. Notably, the TOC–mesopore volume correlation presents two distinct segmented stages with a maturity threshold at f = 0.58 (Ro ≈ 1.0%). When Ro exceeds 1.0%, massive hydrocarbon expulsion occurs during OM thermal evolution [32], leading to significant TOC consumption and an obvious left shift of the correlation trend line. For low-maturity samples (f < 0.58), micropore volume shows a weak positive correlation with TOC content, which may be linked to organic–clay complex formation and limited organic micropore development within the early-peak oil window (Ro = 0.7%–1.1%) [33]. Mesopores display a better correlation with TOC than micropores (R2 = 0.5953), implying that organic pores are mainly mesoporous. This correlation is further strengthened in high-maturity samples (f > 0.58; R2 = 0.8137). This finding supports previous results that organic pore size distribution shifts from micropores to mesopores in the late oil window (Ro = 1.1%–1.4%) [33].
Figure 4.
Correlations between the shale compositions and the pore volumes. Mineral and TOC contents vs. (a–c) micropore volume, (d–f) mesopore volume, and (g–i) macropore volume.
A binary linear mixing model was established to quantitatively separate the respective contributions of OM and I/S clay minerals to mesopores volume, with the formula as follows [11]:
where PVmeso = mesopore volume; WI/S and WTOC = mass fractions of I/S clay minerals and TOC; VI/S and VTOC = pore density of I/S clay minerals and OM, respectively. The conversion coefficient from TOC to total organic matter (TOM) for Type I kerogen is set as 0.86 [34]; Y = regression intercept, representing the comprehensive influence of diagenesis (compaction, thermal maturation) on pore development.
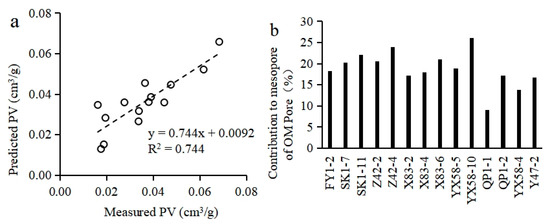
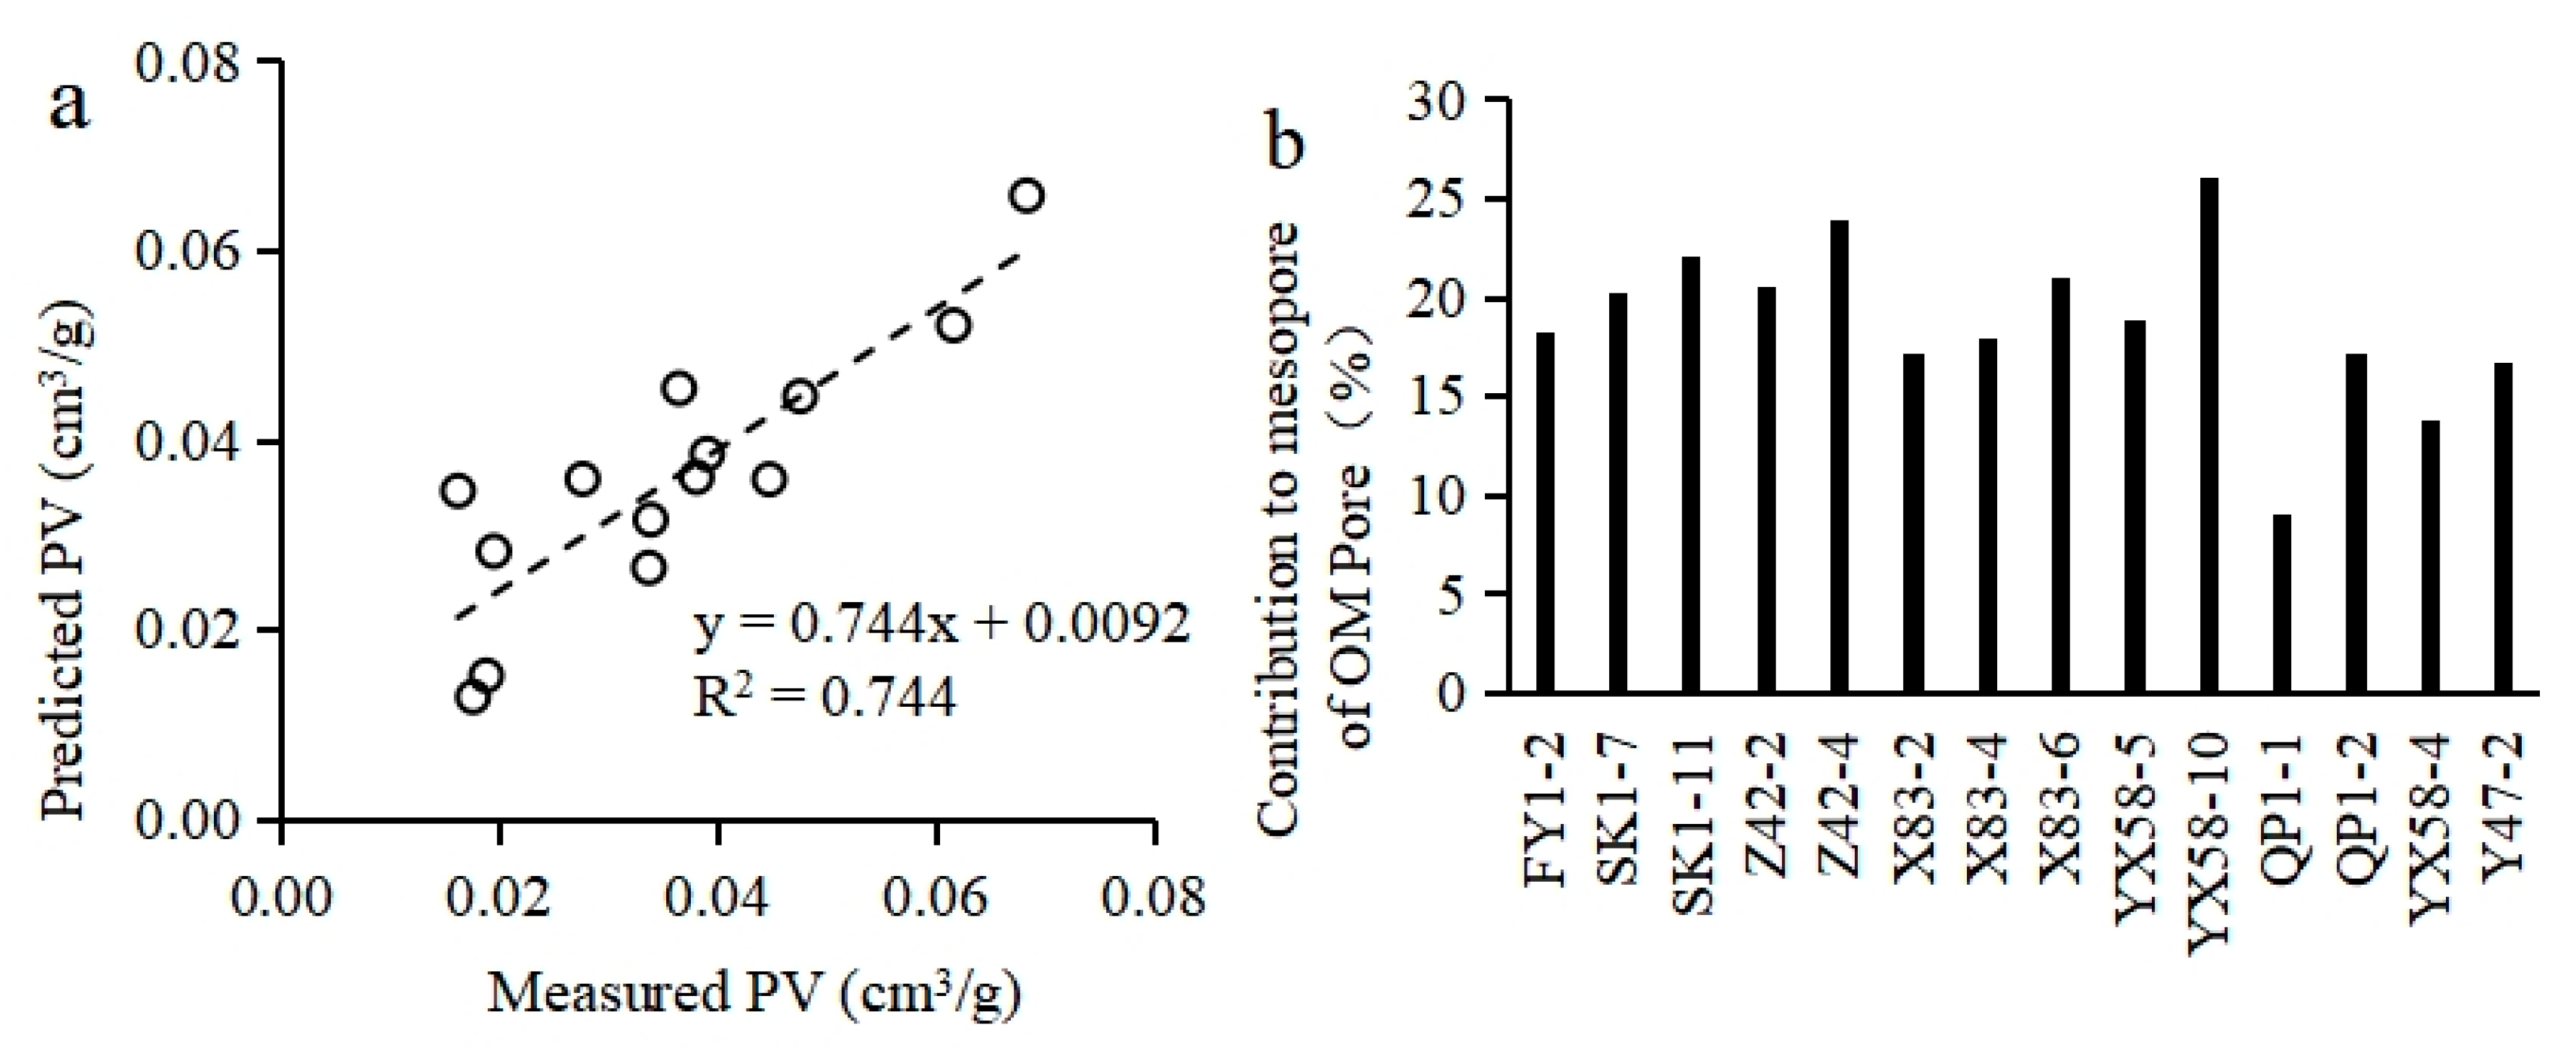
Considering the segmented variation in TOC–mesopore correlations with maturity, linear regression was performed separately for samples with f < 0.58 and f > 0.58. For low-maturity samples (f < 0.58), the fitted pore densities of I/S clay and OM and the intercept are 0.17, 0.78, and −0.057, respectively. For high-maturity samples (f > 0.58), the corresponding parameters are 0.36, 1.84, and −0.155. The predicted mesopore volumes are highly consistent with measured values (Figure 5a), verifying the reliability of the quantitative model. The OM/clay pore density ratios are 4.36 and 5.09 for low- and high-maturity samples, respectively, indicating that organic pore development is significantly enhanced at higher thermal maturity. Nevertheless, the continuous consumption of TOC during thermal evolution reduces the volumetric contribution of OM to mesopores. The statistical results show that OM pores contribute 9%–26% (average 19%) of the total mesopore volume (Figure 5b).
Figure 5.
Binary linear mixing simulation of mesopores in shales. (a) Correlation between predicted pore volume (PV) and measured pore volume. (b) Contribution of OM pore to the mesopore volume.
4.2. Evolution of Shale Pores with Thermal Maturity
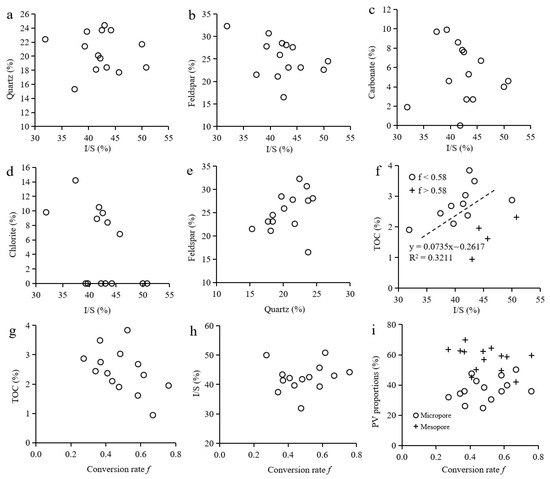
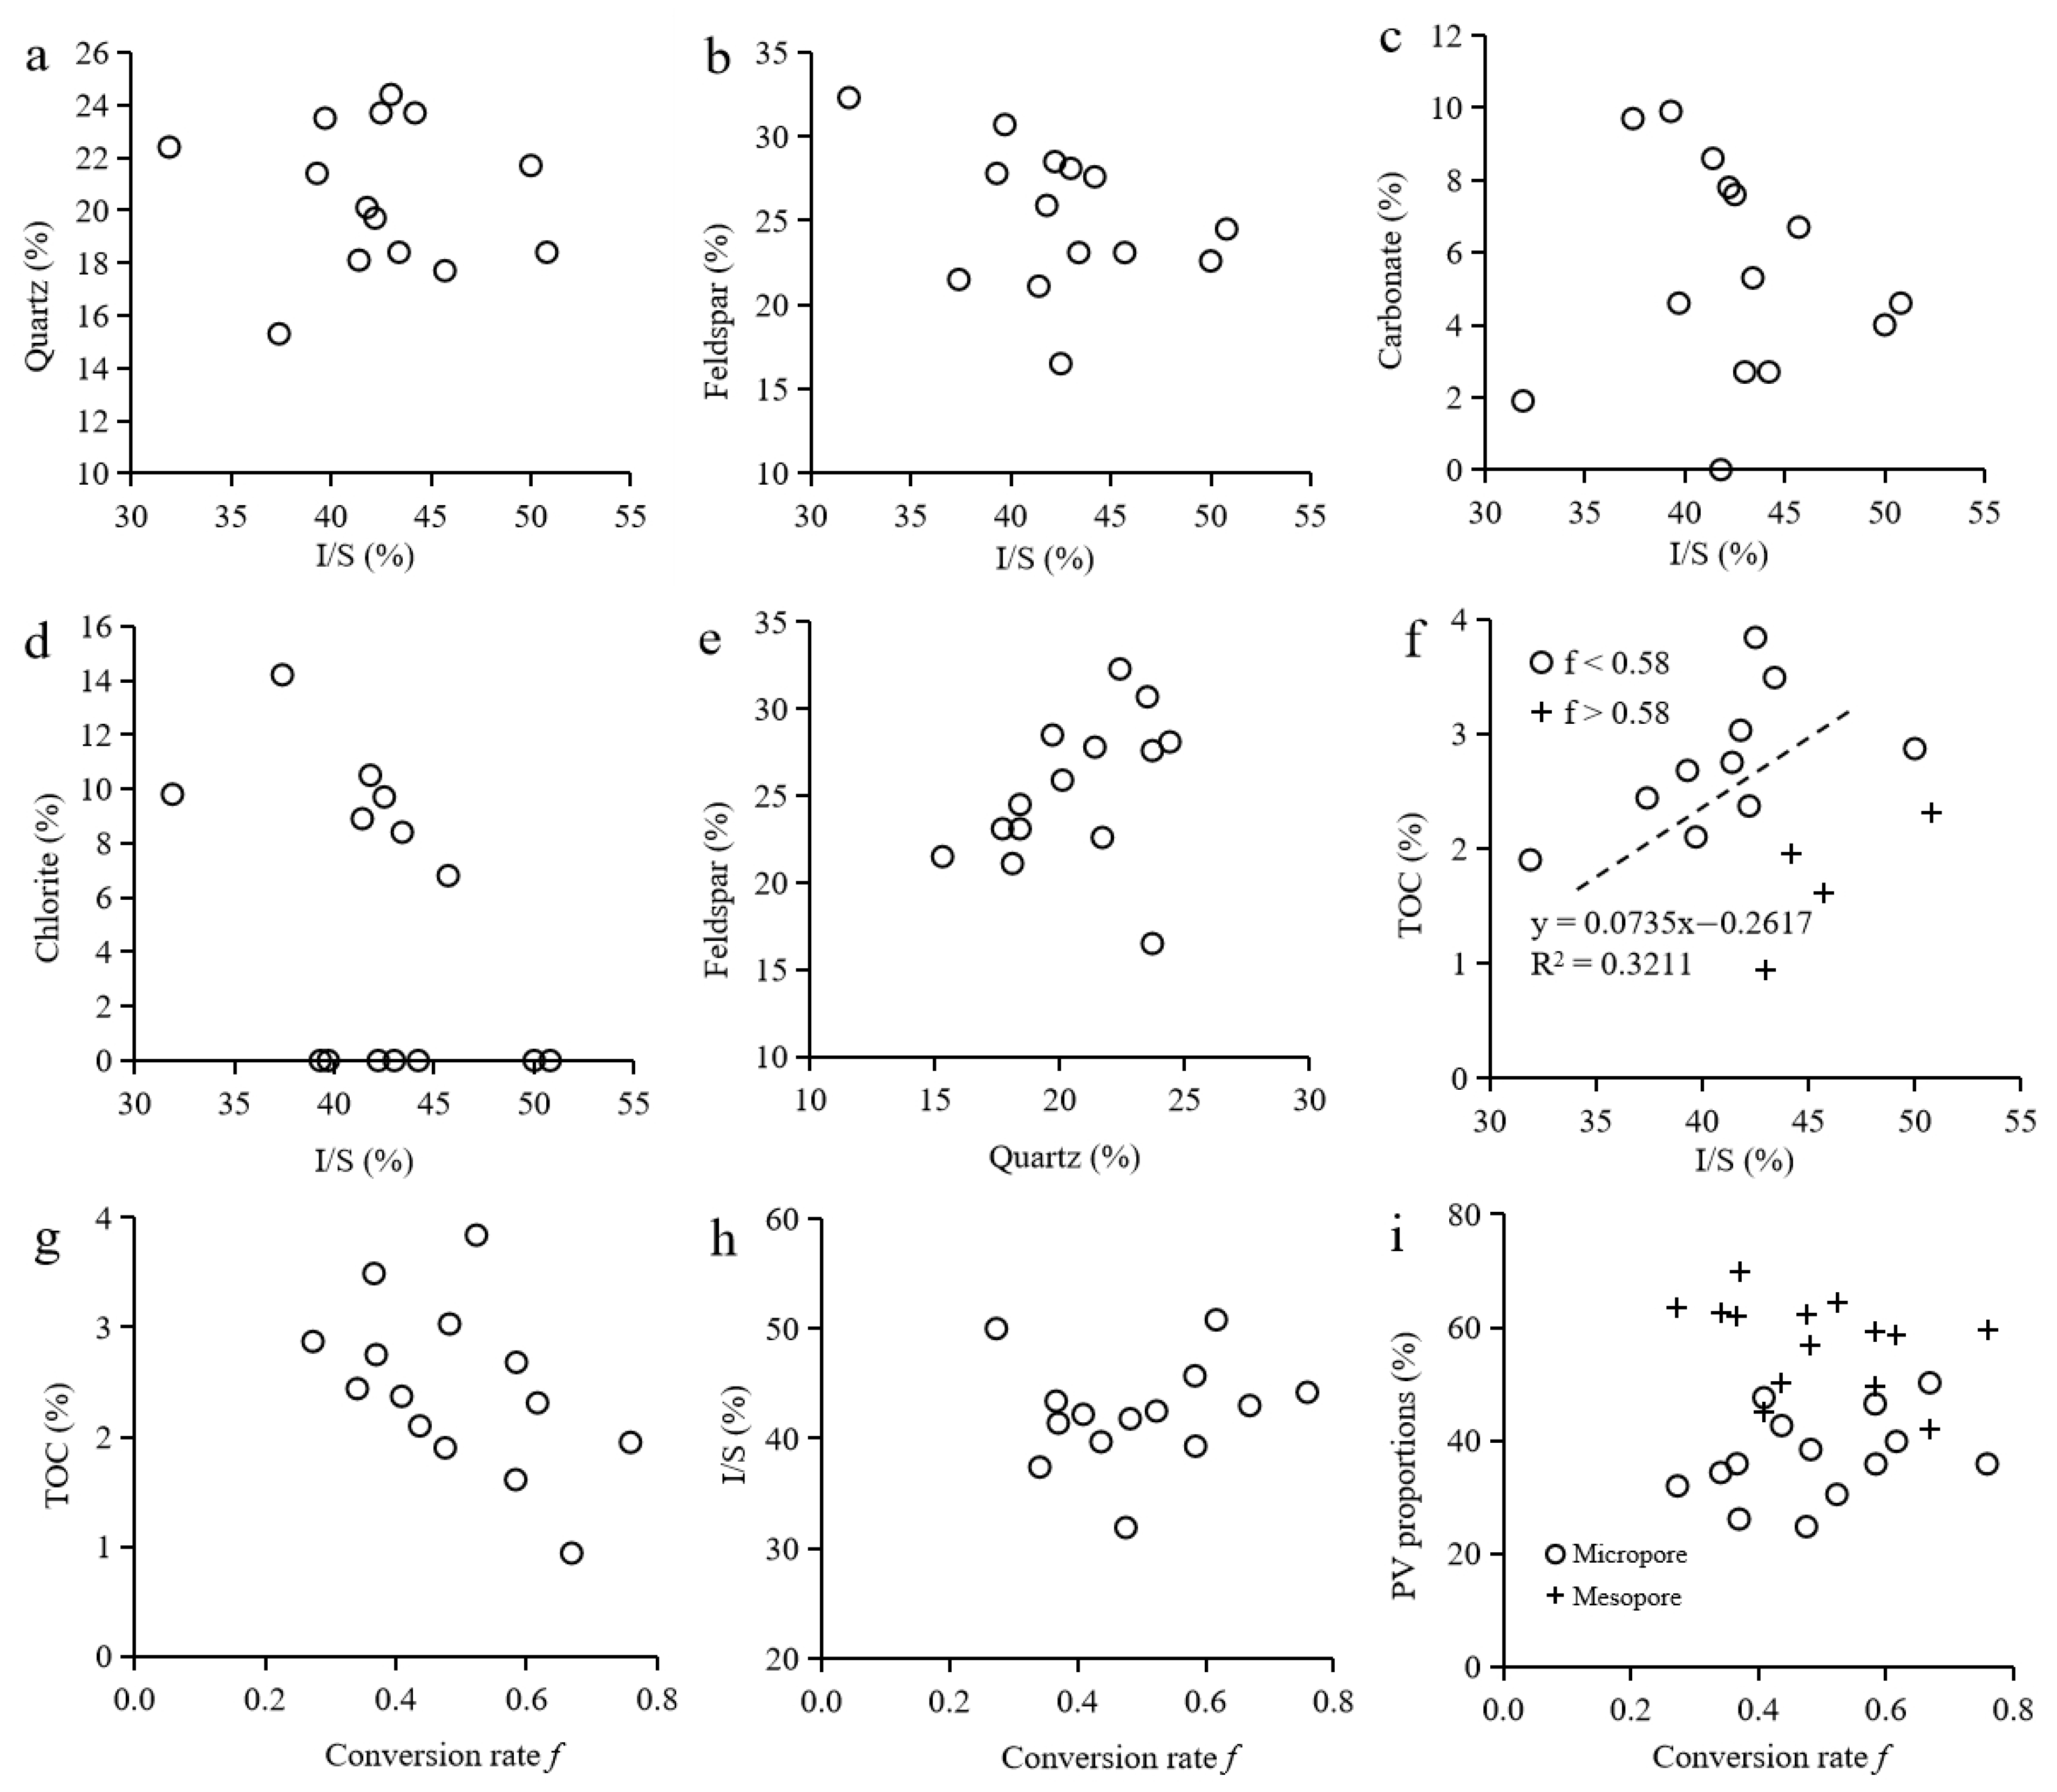
The formation of mineral matrix in shales is controlled by primary sedimentary environments [35]. The QSK shale was deposited in a stable deep-lacustrine environment during basin thermal subsidence [17,18], with bulk rock compositions dominated by terrigenous clay minerals, feldspar, and quartz (Table 1). Mineral correlation analysis shows significant negative correlations between I/S clay and feldspar, as well as between I/S clay and carbonate/chlorite, while quartz and feldspar exhibit positive covariation (Figure 6b–e). These correlations indicate competitive proportional relationships between terrigenous felsic minerals and clay minerals under variable lacustrine hydrodynamic conditions [36], and the authigenic origin of carbonate and chlorite minerals, which is further supported by euhedral crystal morphologies in SEM images (Figure 3). The significant positive correlation between I/S clay and TOC confirms the widespread development of organic–clay complexes in QSK shales, consistent with observations in modern estuarine fine-grained sedimentary systems [37]. The brackish depositional environment developed during marine transgression of the QSK favored the proliferation of algae [20]. Under the flocculation effect of clay minerals, algal OM settled and precipitated, ultimately generating organic–clay complexes [21]. Notably, this symbiotic relationship is maintained even in high-mature samples, indicating that hydrocarbon generation and expulsion do not destroy the basic organic–clay complex framework.
Figure 6.
Correlations between (a–f) shale mineral compositions; conversion rate f values vs. (g) TOC content, (h) I/S content, and (i) pore volumes.
The development of shale pores is controlled by subsequent diagenetic evolution [38]. With the increase in thermal maturity (f value), shale TOC content decreases continuously due to kerogen degradation and hydrocarbon generation, while I/S clay mineral content increases progressively (Figure 6g,h). The increasing I/S clay content is attributed to smectite illitization during burial diagenesis and increasing thermal maturity [14,39,40], which requires K supply from the dissolution of K-bearing minerals [38,41]. Meanwhile, smectite illitization releases SiO2, forming autogenic microcrystalline quartz closely associated with clay minerals [41], which accounts for the weak correlation between I/S clay and quartz (Figure 6a).
Thermal maturity also significantly controls pore size distribution evolution. With rising f values, the volumetric proportion of micropores increases, while the mesopore proportion decreases (Figure 6i). The micropore increment is controlled by increasing I/S clay content, whereas the mesopore reduction is governed by TOC consumption and the consequent decrease in organic–clay complex abundance. This evolutionary trend differs from previous thermal simulation results that mesopore (2–50 nm) volume increases with maturity due to kerogen decomposition or carbon loss [10]. Such discrepancy is mainly derived from differences in natural geological samples vs. simulation samples and distinct data statistical methods.
Much of the initial research on nanopore development for marine shales in the oil-to-gas window was developed in the late 2000s and early 2010s by a host of researchers [42,43,44,45]. Correlations between nanopore development and consumption of TOC with thermal maturity have been well documented. For instance, Loucks et al. [43] reported that most nanopores in the Barnett Shale (1.3%Ro) are organic pores due to thermal decomposition of OM during hydrocarbon generation; Curtis et al. [44] observed that organic pores in the Woodford Shale first emerge at 1.23%Ro, and OM types exert a complicating control on organic pore development. The data presented in this study help validate and expand upon these early findings, particularly for lacustrine shales within the oil window.
4.3. Hydrocarbon Storage Capacity of Different Pores
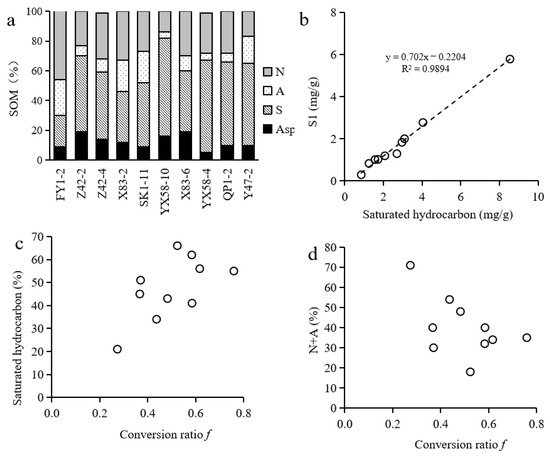
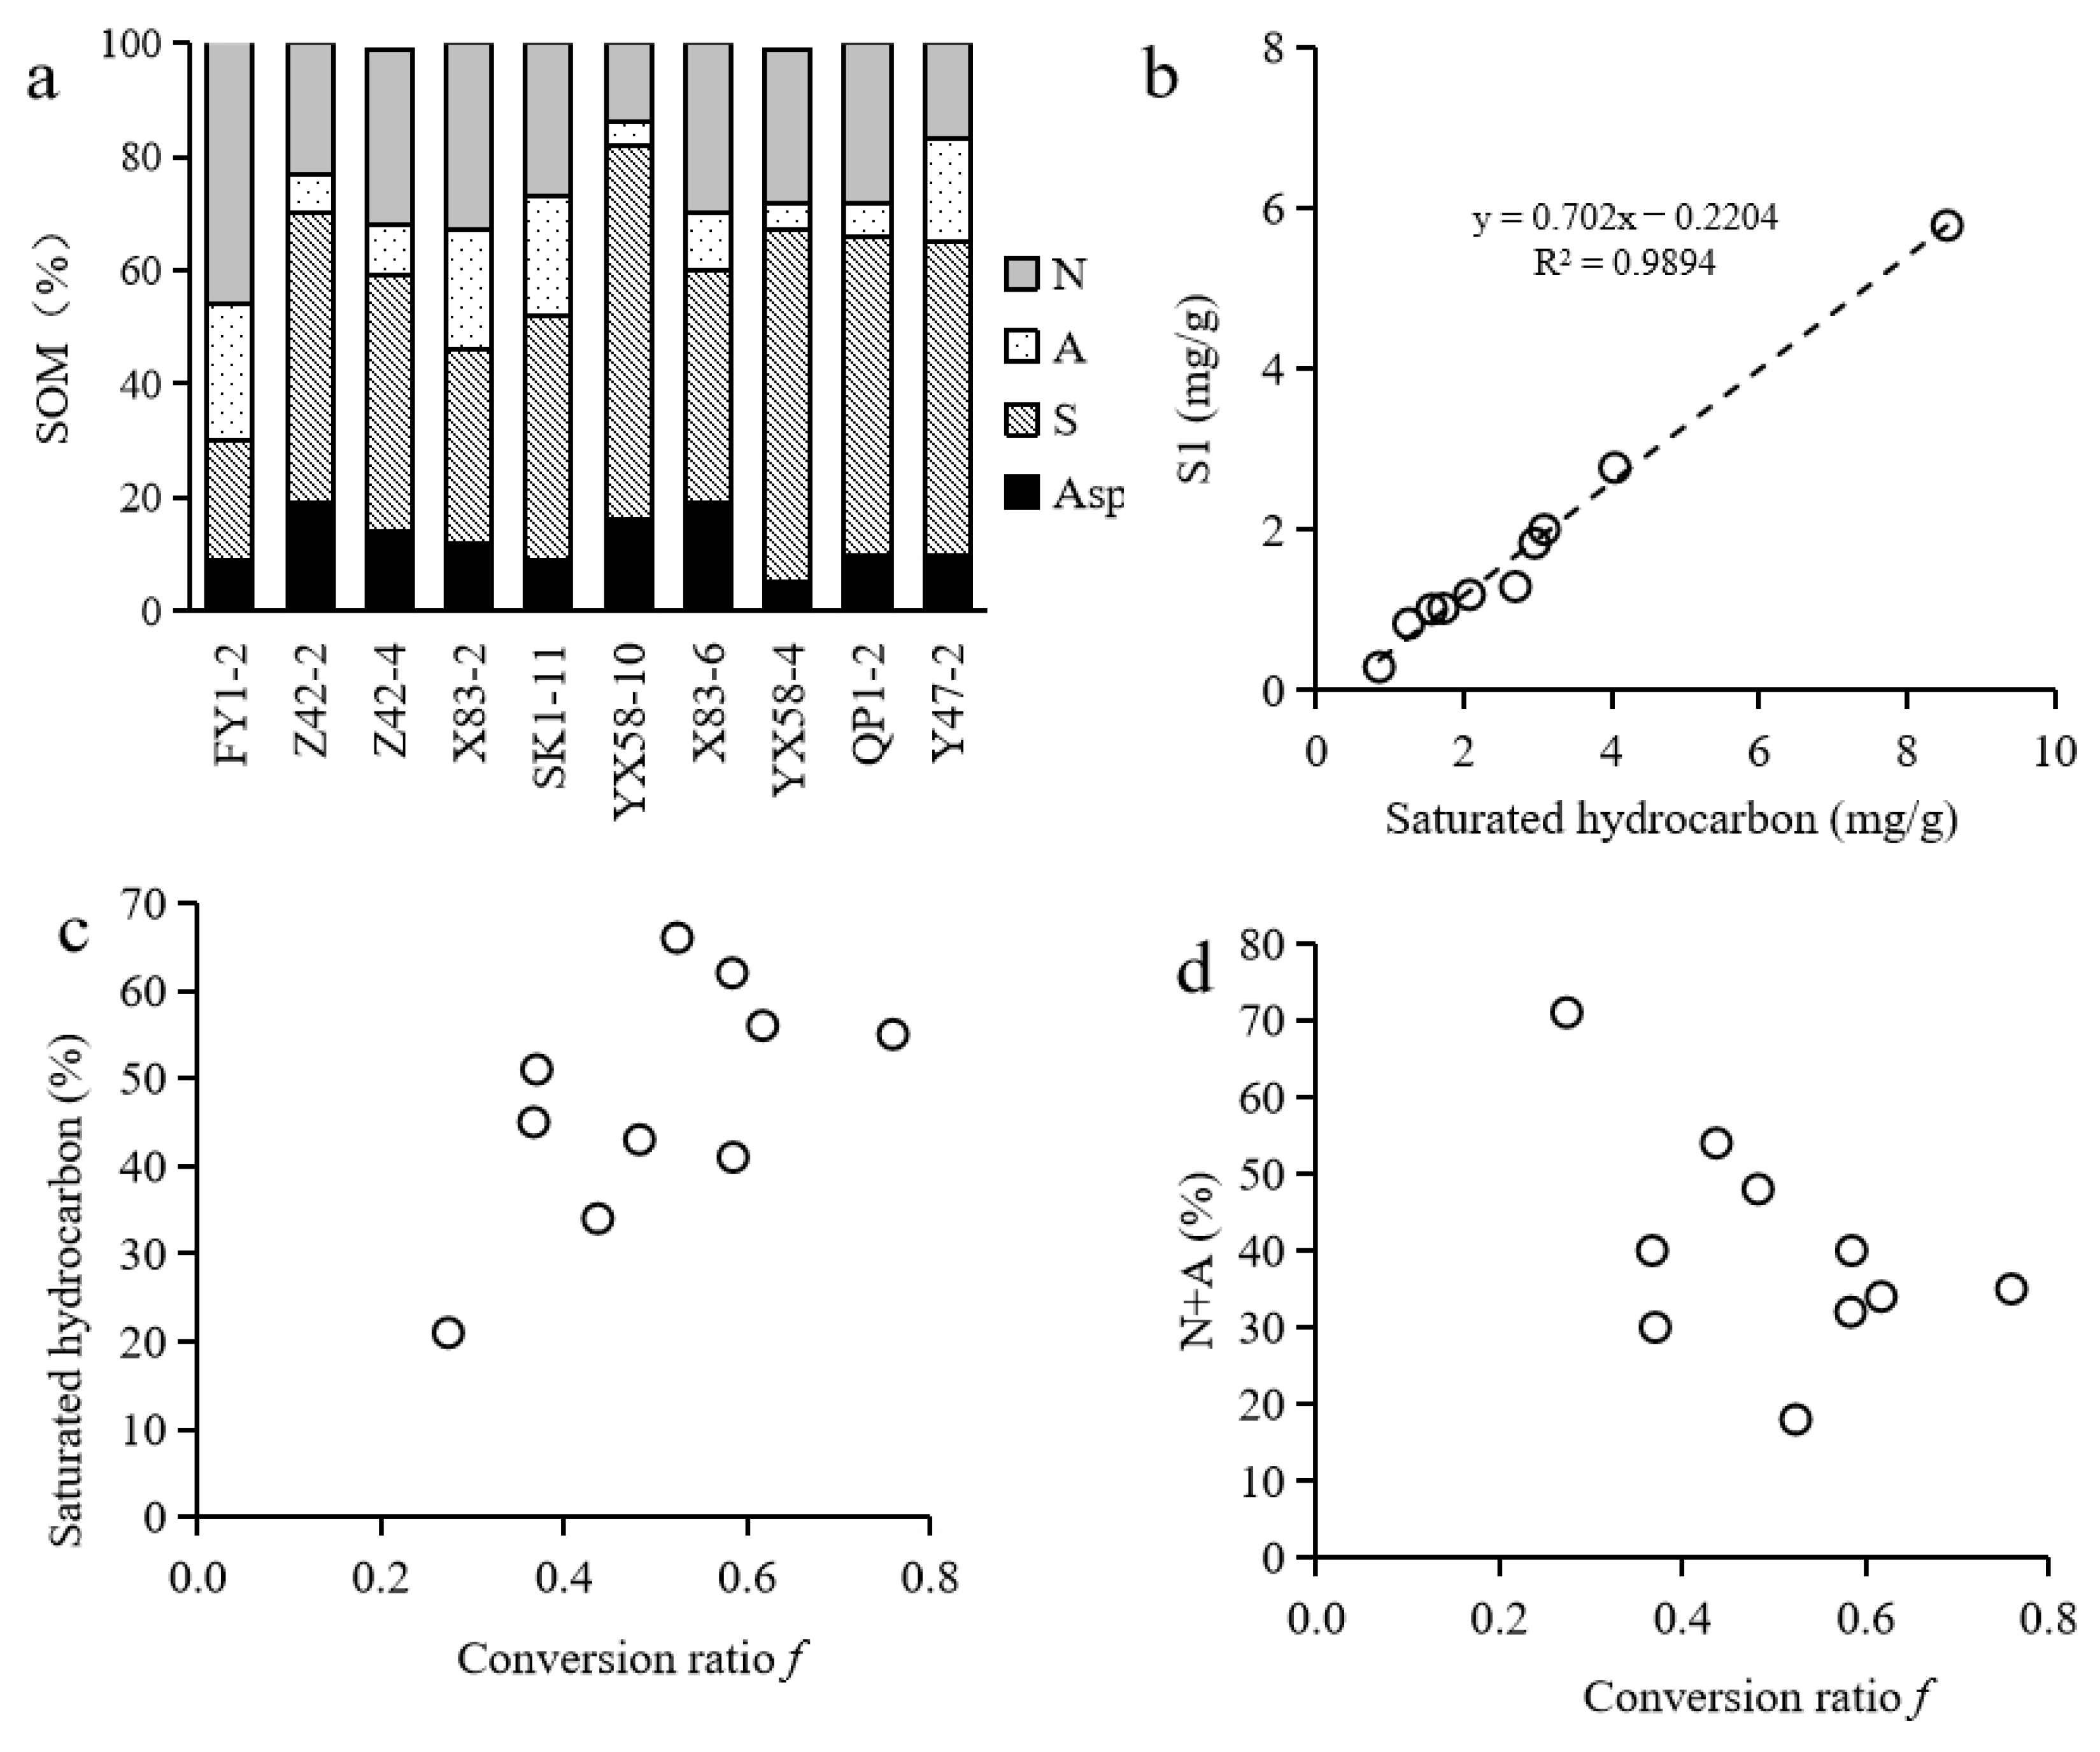
Rock-Eval pyrolysis and solvent extraction experiments were combined to characterize shale hydrocarbon occurrence states. SOM was extracted via Soxhlet extraction and further separated into saturated hydrocarbon, aromatic hydrocarbon, non-hydrocarbon, and asphaltene fractions [29]. The total extraction recovery rate exceeded 90% (Table 3), ensuring the validity of geochemical data. Saturated hydrocarbons and non-hydrocarbon components dominate SOM (Figure 7a), accounting for 21%–66% (average 47%) and 14%–47% (average 28%), respectively. The significant positive correlation between saturated hydrocarbon content and pyrolysis S1 value (Figure 7b) confirms that S1 can effectively represent free hydrocarbon abundance. Aromatic hydrocarbons and non-hydrocarbon polar components, which are tightly adsorbed on pore surfaces, are defined as adsorbed hydrocarbons in this study. It should be noted that the core samples in this study were stored unsealed for years, which induced light hydrocarbon loss for shale S1 [46]. Nevertheless, uniform storage and pre-test preparation were adopted for all samples. Despite the decline in absolute S1 values, relative S1 contents between samples are still comparable.
Table 3.
Soluble organic matter and related parameters in shales of Qingshankou Formation.
Figure 7.
(a) Oil fractions of total soluble organic matter (SOM) in the shales; (b) correlations between S1 value and saturated hydrocarbon content; (c,d) correlations between f and saturated hydrocarbon, total of aromatic hydrocarbon and non-hydrocarbon. N—non-hydrocarbon; A—aromatic hydrocarbon; S—saturated hydrocarbon; Asp—asphaltene fraction.
To eliminate the interference of variable OM abundance, two OM-normalized oil saturation indices (OSI) were established: OSI1 = S1/TOC for free hydrocarbons and OSI2 = (aromatics + non-hydrocarbons)/TOC for adsorbed hydrocarbons. Considering that pore structure rather than absolute pore volume controls hydrocarbon enrichment [47], pore volume proportions of micropores, mesopores, and macropores were selected for correlation analysis with hydrocarbon saturation indices.
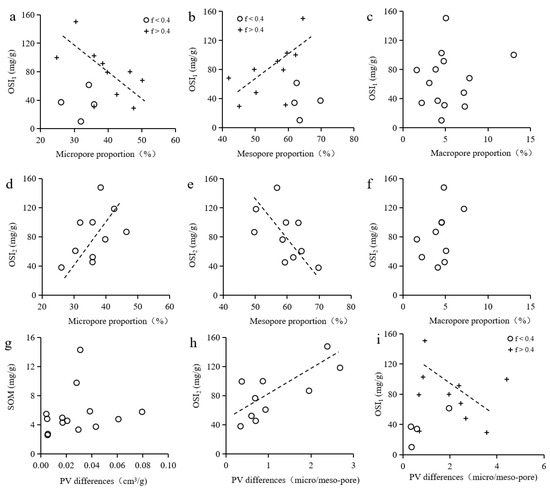
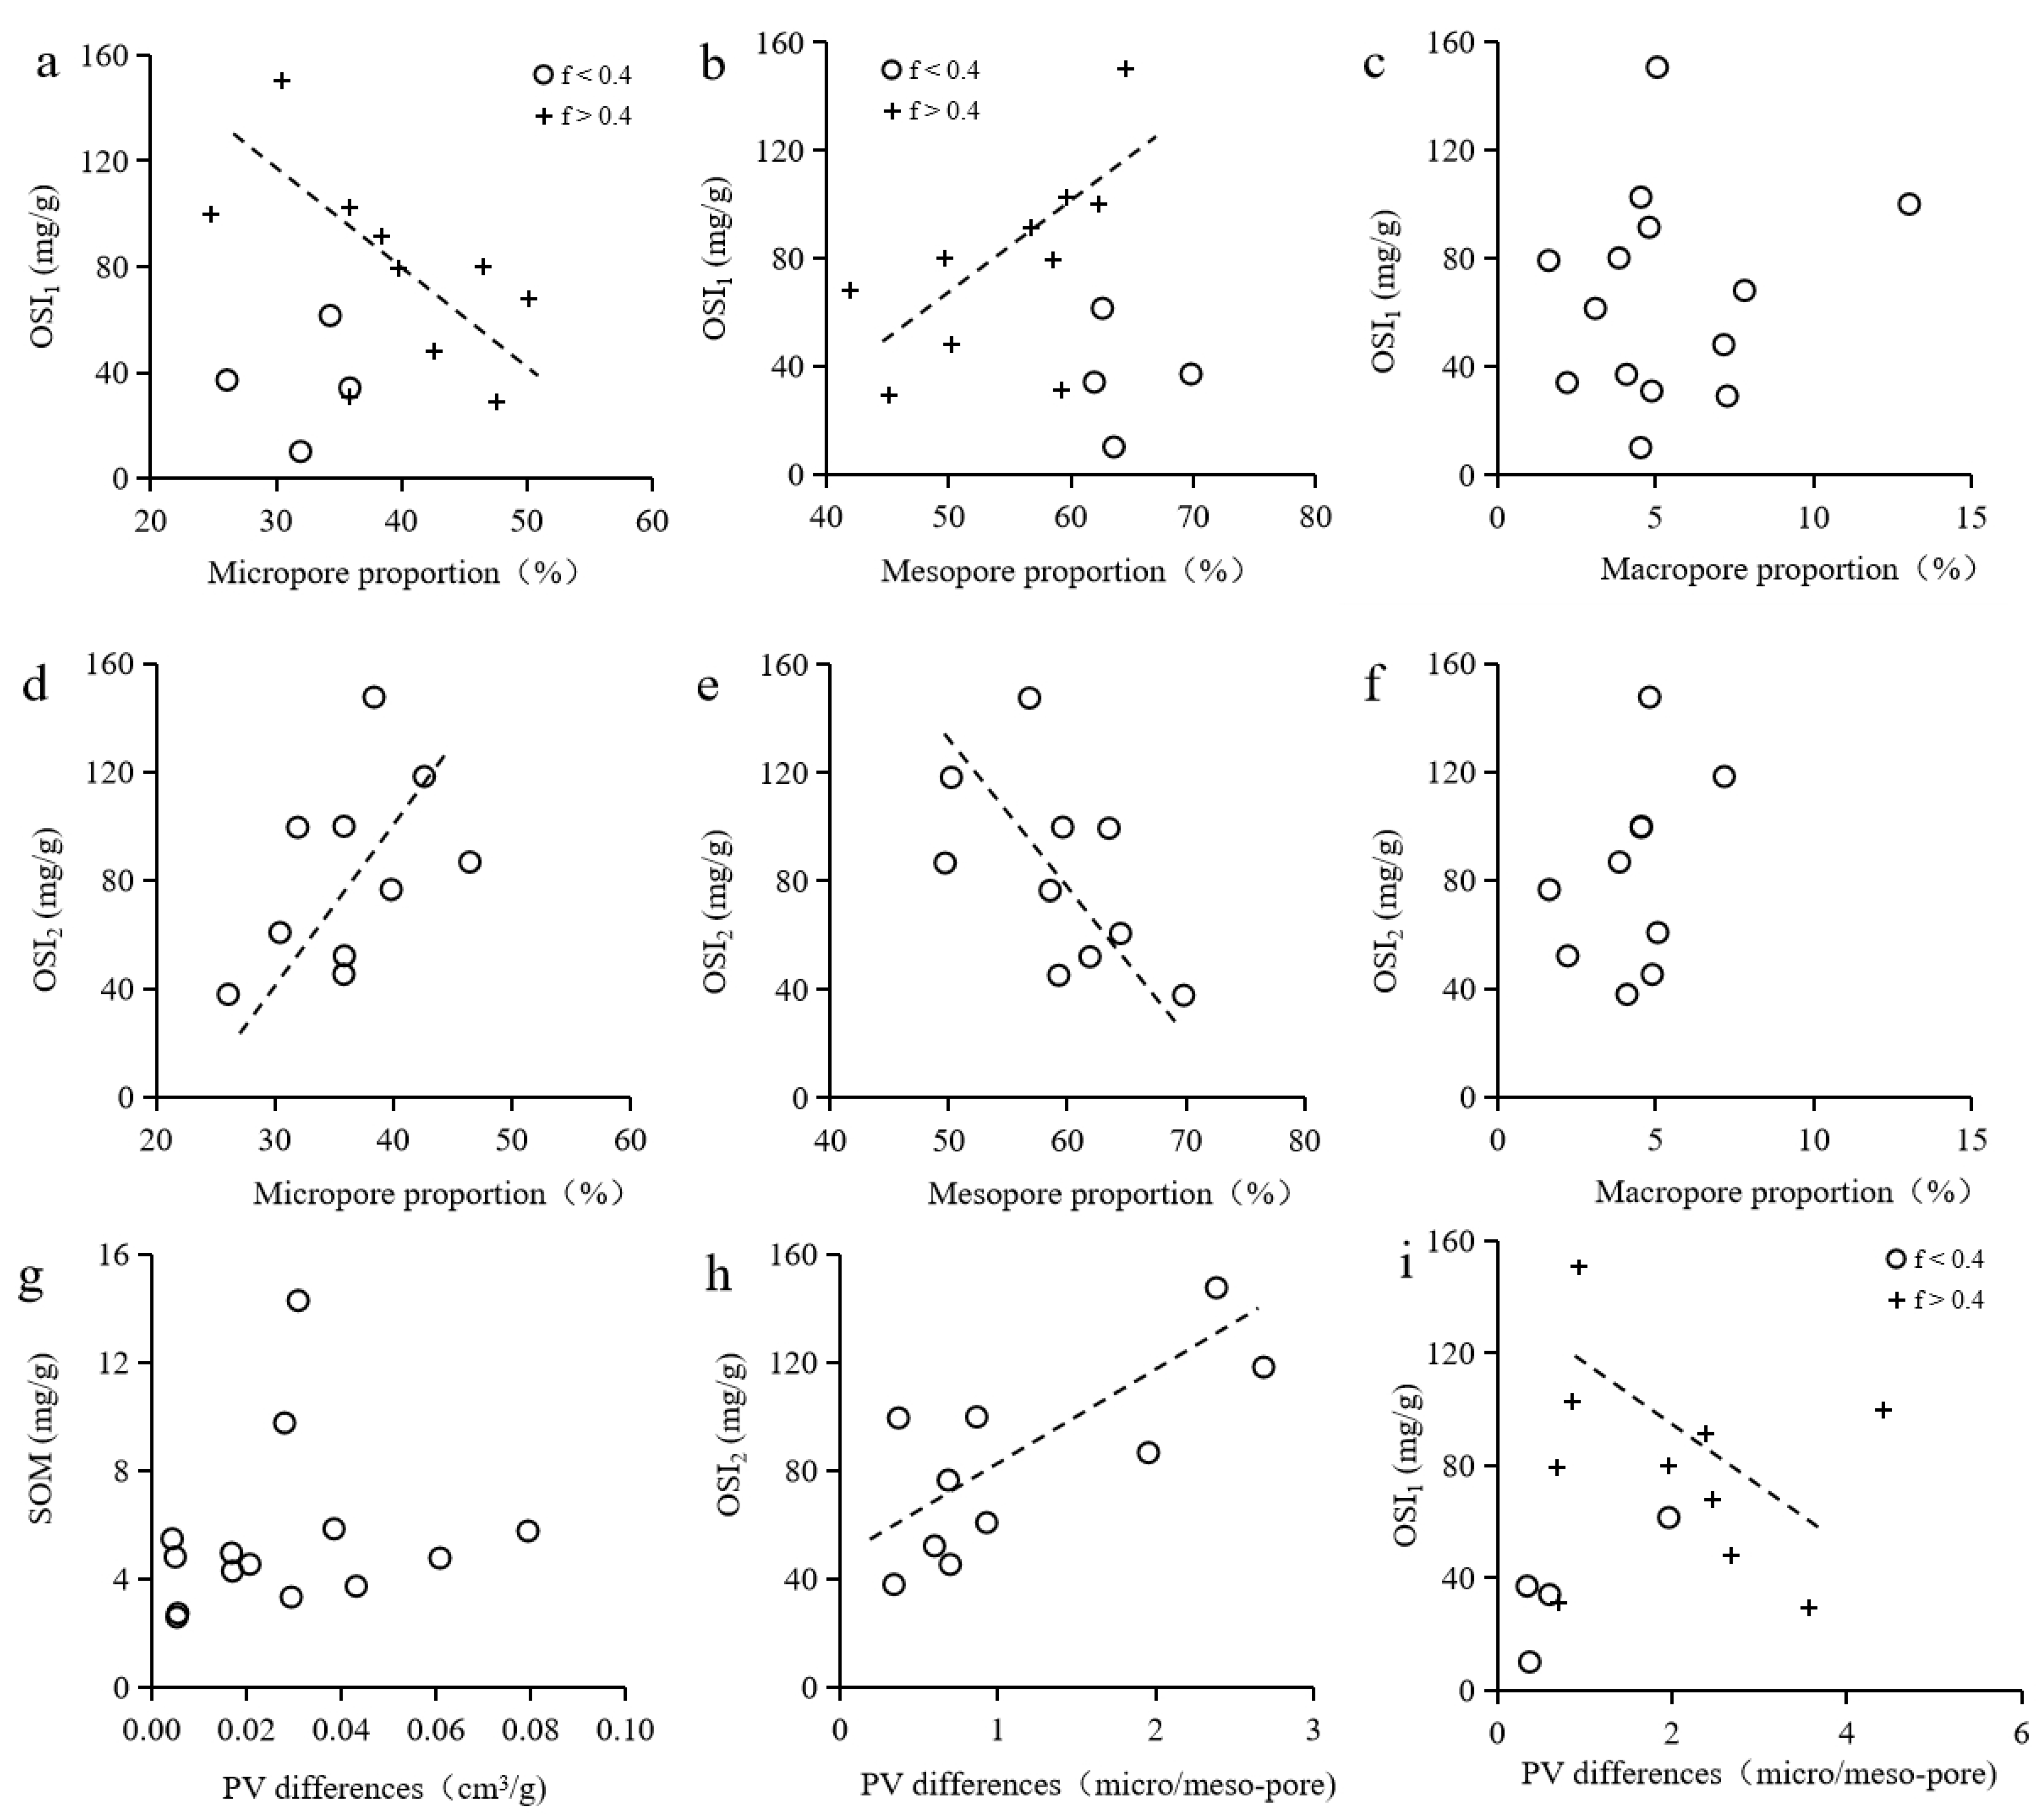
Excluding low-mature samples (f < 0.4, 0.8%Ro) with extremely low hydrocarbon abundance, OSI1 of mature shales (f > 0.4, except for sample X83-6) shows a significant negative correlation with micropore proportion and a prominent positive correlation with mesopore proportion (Figure 8a,b), demonstrating that free hydrocarbons are predominantly stored in mesopores. Previous studies have proposed that QSK shale oil preferentially occupies pores larger than 40 nm [48]. This study further hypothesizes that these oil-bearing large pores are predominantly lipophilic organic–clay complex mesopores [49,50]. Low-mature samples deviate from the linear trend due to insufficient hydrocarbon generation and infilling at the early oil mature stage and unsaturated mesopore space. Macropore proportion exhibits no significant correlation with OSI1 (Figure 8c). This can be attributed to light-hydrocarbon volatilization during sampling and pretreatment, which gives rise to the loss of mobile free hydrocarbons [46]; additionally, quartz-associated macropores characterized by weak lipophilicity and high fluid mobility further enhance the volatilization of pore-hosted free hydrocarbons [51,52]. Sample X83-6 deviates from the linear trend shown in Figure 8a,b, which is likely associated with its favorable pore connectivity and permeability, resulting in substantial loss of free hydrocarbons [2].
Figure 8.
Correlations between pore volumes and oil contents of shales. (a–c) OSI1 vs. pore size fractions; (d–f) OSI2 vs. pore size fractions; (g) SOM vs. PV differences before and after solvent extraction; the ratio of micro- to mesopore PV differences vs. (h) OSI2; and (i) OSI1. OSI1-free hydrocarbons; OSI2-adsorbed hydrocarbons.
In contrast, OSI2 is positively correlated with micropore proportion and negatively correlated with mesopore proportion (Figure 8d,e), indicating that adsorbed hydrocarbons are mainly hosted in I/S clay-related micropores. Previous studies suggested that liquid hydrocarbons preferentially occupy pores smaller than 2 nm [10]. This study further clarifies that these small-pore hydrocarbons correspond to polar adsorbed components, which are easily adsorbed on high-polarity clay micropore surfaces [53]. Additionally, the weak positive correlation between OSI2 and macropore proportion (Figure 8f) is attributed to the moderate polarity of quartz macropores, which can adsorb a small amount of aromatic and non-hydrocarbon components.
The QSK shale develops a typical “small throat + large pore” network system [1]. It is speculated herein that clay micropores act as narrow throats, while organic–clay complex mesopores represent the dominant reservoir spaces. Hydrocarbon occurrence states show obvious maturity differentiation: low-mature shales are dominated by adsorbed hydrocarbons, while high-mature shales are enriched in free hydrocarbons (Figure 7c,d). The pore volume difference before and after solvent extraction exhibits no distinct correlation with SOM content (Figure 8g), demonstrating that this parameter cannot fully reflect total hydrocarbon content. A plausible explanation is the extensive development of narrow pore throat [54,55], which may be occluded by liquid hydrocarbons. Nevertheless, the ratio of micropore volume difference to mesopore volume difference displays clear correlations with hydrocarbon components (Figure 8h,i), which implies that adsorbed hydrocarbons occupy micropores, whereas free hydrocarbons fill mesopore spaces.
In summary, during the progressive thermal evolution of kerogen, early-generated polar adsorbed hydrocarbons preferentially occupy high-polarity clay micropores, whereas late-generated mobile free hydrocarbons massively charge and occupy large-scale lipophilic organic–clay complex mesopores, forming a distinct differential hydrocarbon accumulation pattern controlled by shale pore structure.
5. Conclusions
- (1)
- The pores in the QSK lacustrine shale are classified into micropores (<10 nm), mesopores (10–300 nm) and macropores (>300 nm), and the associated minerals hosting these pores are identified. The micropores (<10 nm) are predominantly hosted within I/S clay minerals as intraparticle pores, accounting for 24%–50% (average 37%) of total pore volume. The mesopores are mainly associated with organic–clay complexes and occur as marginal pores, contributing 42%–70% (average 58%) to the total pore volume. OM pores contribute 9%–26% (average 19%) of the mesopore volume, with higher pore density at elevated thermal maturity. The macropores are primarily interparticle pores within quartz grains, contributing a minor volumetric proportion of 1%–13% (average 5%) to the total pore volume.
- (2)
- The formation and evolution of shale pores are jointly controlled by primary sedimentary assemblages and secondary diagenetic modification. The positive TOC–I/S clay correlation records the stable development of organic–clay complexes. As thermal maturity increases, kerogen degradation leads to continuous TOC consumption, which reduces the abundance of organic–clay complexes and causes a gradual decline in the volumetric proportion of mesopores. Smectite illitization promotes the development of clay-hosted micropores and further reshapes the pore size distribution of the shale.
- (3)
- Different pores control the differential enrichment of shale oil components. Free hydrocarbon saturation is positively correlated with mesopore proportion, whereas adsorbed hydrocarbon saturation shows a positive correlation with micropore proportion. Early-stage adsorbed hydrocarbons preferentially occupy small I/S clay micropores via polar adsorption, while late-generated free hydrocarbons are predominantly stored in large lipophilic mesopores of organic–clay complex. This study establishes a pore-controlled differential accumulation model for terrestrial lacustrine shale oil, providing new insights into the fine evaluation of shale oil reservoir quality and hydrocarbon enrichment mechanisms.
Author Contributions
Writing—original draft, W.Z.; Investigation, X.C. and T.C.; Writing—review and editing, Z.S. and L.Y. All authors have read and agreed to the published version of the manuscript.
Funding
This research was financially supported by the Guangdong Basic and Applied Basic Research Foundation (No. 2025A1515010228), the National Natural Science Foundation of China (No. 42302172).
Data Availability Statement
The data used to support the findings of this study are included within the article.
Conflicts of Interest
The authors declare no conflicts of interest.
References
- Zeng, W.; Song, Z.; Zhou, G. Pore structure of Qingshankou Formation shales in Songliao Basin and its geological significance. J. China Univ. Pet. (Ed. Nat. Sci.) 2021, 45, 35–41. (In Chinese) [Google Scholar] [CrossRef]
- Zeng, W.; Zhou, G.; Cao, T.; Song, Z. Pore structure of the Cretaceous lacustrine shales and shale-oil potential assessment in the Songliao Basin, Northeast China. Interpretation 2021, 9, T21–T33. [Google Scholar] [CrossRef] [Scilit]
- Chen, L.; Jiang, Z.; Liu, Q.; Jiang, S.; Liu, K.; Tan, J.; Gao, F. Mechanism of shale gas occurrence: Insights from comparative study on pore structures of marine and lacustrine shales. Mar. Pet. Geol. 2019, 104, 200–216. [Google Scholar] [CrossRef] [Scilit]
- Xiao, D.; Zheng, L.; Xing, J.; Wang, M.; Wang, R.; Guan, X.; Guo, X. Coupling control of organic and inorganic rock components on porosity and pore structure of lacustrine shale with medium maturity: A case study of the Qingshankou Formation in the southern Songliao Basin. Mar. Pet. Geol. 2024, 164, 106844. [Google Scholar] [CrossRef] [Scilit]
- Loucks, R.; Reed, R.; Ruppel, S.; Hammes, U. Spectrum of pore types and networks in mudrocks and a descriptive classification for matrix-related mudrock pores. AAPG Bull. 2012, 96, 1071–1098. [Google Scholar] [CrossRef] [Scilit]
- Liu, Y.; Lu, Z.; Qi, M.; Tian, T.; Feng, M. Microscopic characteristics of shale oil reservoirs in Shahejie Formation in Zhanhua Sag, Bohai Bay Basin. Pet. Geol. Exp. 2017, 39, 180–185. (In Chinese) [Google Scholar] [CrossRef]
- Li, C.; Zhou, S.; Li, J.; Yang, Y.; Fu, D.; Ma, Y.; Li, Y. Pore Characteristics and Controlling Factors of the Yanchang Formation Mudstone and Shale in the South of Ordos Basin. Acta Sedimentol. Sin. 2017, 35, 315–329. (In Chinese) [Google Scholar] [CrossRef]
- Sun, L.; Wang, F.; Bai, X.; Feng, Z.; Shao, H.; Zeng, H.; Gao, B.; Wang, Y. Discovery of nano organo-clay complex pore-fractures in shale and its scientific significances: A case study of Cretaceous Qingshankou Formation shale, Songliao Basin, NE China. Pet. Explor. Dev. 2024, 51, 708–719. (In Chinese) [Google Scholar] [CrossRef]
- Ren, W.; Zeng, X.; Wang, G.; Guo, J.; Liu, Y. Molecular simulations of a multicomponent hydrocarbon-water mixture in the organic matter clay-mineral composite pore system of lacustrine shales: A case study of the Da’anzhai Member of the Jurassic Ziliujing Formation, Sichuan Basin. Oil Gas. Geol. 2025, 46, 304–314. (In Chinese) [Google Scholar] [CrossRef]
- Han, H.; Guo, C.; Zhong, N.; Pang, P.; Chen, S.; Lu, J.; Gao, Y. Pore structure evolution of lacustrine shales containing Type I organic matter from the Upper Cretaceous Qingshankou Formation, Songliao Basin, China: A study of artificial samples from hydrous pyrolysis experiments. Mar. Pet. Geol. 2019, 104, 375–388. [Google Scholar] [CrossRef] [Scilit]
- Zeng, W.; Song, Z. Influences of Clay Mineral and Organic Matter on Nanoscale Pore Structures of the Cretaceous Lacustrine Shales in the Songliao Basin, Northeast China. Energies 2022, 15, 7075. [Google Scholar] [CrossRef] [Scilit]
- Curtis, M.; Sondergeld, C.; Ambrose, R.; Rai, C. Microstructural investigation of gas shales in two and three dimensions using nanometer-scale resolution imaging. AAPG Bull. 2012, 96, 665–677. [Google Scholar] [CrossRef] [Scilit]
- Bergaya, F.; Theng, B.K.G.; Lagaly, G. (Eds.) Handbook of Clay Science. In Developments in Clay Science; Elsevier: Amsterdam, The Netherlands, 2006; ISBN 9780080441832. [Google Scholar]
- Hou, L.; Wu, S.; Jing, Z.; Jiang, X.; Yu, Z.; Hua, G.; Su, L.; Yu, C.; Liao, F.; Tian, H. Effects of types and content of clay minerals on reservoir effectiveness for lacustrine organic matter rich shale. Fuel 2022, 327, 125043. [Google Scholar] [CrossRef] [Scilit]
- Wang, M.; Ma, R.; Li, J.; Lu, S.; Li, C.; Guo, Z.; Li, Z. Occurrence mechanism of lacustrine shale oil in the Paleogene Shahejie Formation of Jiyang Depression, Bohai Bay Basin, China. Pet. Explor. Dev. 2019, 46, 833–846. [Google Scholar] [CrossRef] [Scilit]
- Zhu, X.; Cai, J.; Liu, Q.; Liu, Q.; Li, Z.; Zhang, X. Thresholds of petroleum content and pore diameter for petroleum mobility in shale. AAPG Bull. 2019, 103, 605–617. [Google Scholar] [CrossRef] [Scilit]
- Liu, C.; Wang, Z.; Gao, Z.; Hong, W.; Dun, C.; Zhang, X.; Li, B.; Wu, L. Enrichment and distribution of shale oil in the Cretaceous Qingshankou Formation, Songliao Basin, Northeast China. Mar. Pet. Geol. 2017, 86, 751–770. [Google Scholar] [CrossRef] [Scilit]
- Feng, Z.; Jia, C.; Xie, X.; Zhang, S.; Feng, Z.; Cross, T. Tectonostratigraphic units and stratigraphic sequences of the nonmarine Songliao basin, northeast China. Basin Res. 2010, 22, 79–95. [Google Scholar] [CrossRef] [Scilit]
- Zhou, Y.S.; Littke, R. Numerical simulation of the thermal maturation, oil generation and migration in the Songliao Basin, Northeastern China. Mar. Pet. Geol. 1999, 16, 771–792. [Google Scholar] [CrossRef] [Scilit]
- Feng, Z.; Fang, W.; Wang, X.; Huang, C.; Huo, Q.; Zhang, J.; Huang, Q.; Zhang, L. Microfossils and molecular records in oil shales of the Songliao Basin and implications for paleo-depositional environment. Sci. China Earth Sci. 2009, 52, 1559–1571. [Google Scholar] [CrossRef] [Scilit]
- Xu, J.; Bechtel, A.; Sachsenhofer, R.; Liu, Z.; Gratzer, R.; Meng, Q.; Song, Y. High resolution geochemical analysis of organic matter accumulation in the Qingshankou Formation, Upper Cretaceous, Songliao Basin (NE China). Int. J. Coal Geol. 2015, 141, 23–32. [Google Scholar] [CrossRef] [Scilit]
- Washburn, E. Note on a method of determiningthe distribution of pore sizes in a porous material. Proc. Natl. Acad. Sci. USA 1921, 7, 115–116. [Google Scholar] [CrossRef] [Scilit] [PubMed]
- Wang, H.; Wu, W.; Chen, T.; Yu, J.; Pan, J. Pore structure and fractal analysis of shale oil reservoirs: A case study of the Paleogene Shahejie Formation in the Dongying Depression, Bohai Bay, China. J. Petrol. Sci. Eng. 2019, 177, 711–723. [Google Scholar] [CrossRef] [Scilit]
- Zhang, P.; Lu, S.; Li, J.; Zhang, J.; Xue, H.; Chen, C. Comparisons of SEM, Low-Field NMR, and Mercury Intrusion Capillary Pressure in Characterization of the Pore Size Distribution of Lacustrine Shale: A Case Study on the Dongying Depression, Bohai Bay Basin, China. Energy Fuels 2017, 31, 9232–9239. [Google Scholar] [CrossRef] [Scilit]
- Zhang, P.; Lu, S.; Li, J.; Xue, H.; Li, W.; Zhang, P. Characterization of shale pore system: A case study of Paleogene Xin’gouzui Formation in the Jianghan basin, China. Mar. Pet. Geol. 2017, 79, 321–334. [Google Scholar] [CrossRef] [Scilit]
- Lu, S.; Li, J.; Zhang, P. Classification of microscopic pore-throats and the grading evaluation on shale oil reservoirs. Petrol. Explor. Dev. 2018, 45, 452–460. [Google Scholar] [CrossRef] [Scilit]
- Zhang, J.; Tang, Y.; He, D.; Sun, P.; Zou, X. Full-scale nanopore system and fractal characteristics of clay-rich lacustrine shale combining FE-SEM, nano-CT, gas adsorption and mercury intrusion porosimetry. Appl. Clay Sci. 2020, 196, 105758. [Google Scholar] [CrossRef] [Scilit]
- Xi, Z.; Tang, S.; Wang, J.; Yang, G.; Li, L. Formation and development of pore structure in marine-continental transitional shale from northern China across a maturation gradient: Insights from gas adsorption and mercury intrusion. Int. J. Coal Geol. 2018, 200, 87–102. [Google Scholar] [CrossRef] [Scilit]
- Zeng, W.; Song, Z.; Cao, X. Oil potential of Qingshankou Formation source rocks in northern Songliao Basin. Geochimica 2018, 47, 345–353. (In Chinese) [Google Scholar] [CrossRef]
- Zeng, W.; Zhou, G.; Song, Z. Influence of pore structure on the shale oil accumulation of the Qingshankou Formation in the Songliao Basin. Geochimica 2019, 48, 632–643. (In Chinese) [Google Scholar] [CrossRef]
- Kuila, U.; Prasad, M. Specific surface area and pore-size distribution in clays and shales. Geophys. Prospect. 2013, 61, 341–362. [Google Scholar] [CrossRef] [Scilit]
- Huang, W.; Salad, H.; Lu, S.; Deng, S. Quantitative modelling of hydrocarbon expulsion and quality grading of tight oil lacustrine source rocks: Case study of Qingshankou 1 member, central depression, Southern Songliao Basin, China. Mar. Pet. Geol. 2017, 84, 34–48. [Google Scholar] [CrossRef] [Scilit]
- Liu, B.; Wang, Y.; Tian, S.; Guo, Y.; Wang, L.; Yasin, Q. Impact of thermal maturity on the diagenesis and porosity of lacustrine oil-prone shales: Insights from natural shale samples with thermal maturation in the oil generation window. Int. J. Coal Geol. 2022, 261, 104079. [Google Scholar] [CrossRef] [Scilit]
- Gao, Y.; Zou, Y.; Liang, T.; Peng, P. Jump in the structure of Type I kerogen revealed from pyrolysis and 13C DP MAS NMR. Org. Geochem. 2017, 112, 105–118. [Google Scholar] [CrossRef] [Scilit]
- Yan, Y.; Wang, M.; Misch, D.; Sachsenhofer, R.; Wu, Y.; Li, J. Mineral diagenesis in lacustrine organic-rich shales: Evolution pathways and implications for reservoir characteristics. J. Asian Earth Sci. 2024, 263, 106026. [Google Scholar] [CrossRef] [Scilit]
- Liu, B.; Wang, H.; Fu, X.; Bai, Y.; Bai, L.; Jia, M.; He, B. Lithofacies and depositional setting of a highly prospective lacustrine shale oil succession from the Upper Cretaceous Qingshankou Formation in the Gulong sag, northern Songliao Basin, northeast China. AAPG Bull. 2019, 103, 405–432. [Google Scholar] [CrossRef] [Scilit]
- Zeng, W.; Zheng, Z.; Zhang, C.; Zhou, P. Sedimentary Records of the Dramatic Environmental Changes in the Lingdingyang Bay of the Pearl River Estuary in Southern China. Ocean Sci. J. 2023, 58, 12. [Google Scholar] [CrossRef] [Scilit]
- Wang, L.; Liu, B.; Bai, L.; Ma, L.; Yu, Z.; Huo, Q.; Taylor, K. Differential mineral diagenetic evolution of lacustrine shale: Implications for CO2 storage. Int. J. Coal Geol. 2024, 295, 104629. [Google Scholar] [CrossRef] [Scilit]
- Aldega, L.; Corrado, S.; Grasso, M.; Maniscalco, R. Correlation of diagenetic data from organic and inorganic studies in the Apenninic-Maghrebian fold-and-thrust belt: A case study from Eastern Sicily. J. Geol. 2007, 115, 335–353. [Google Scholar] [CrossRef] [Scilit]
- Aldega, L.; Carminati, E.; Scharf, A.; Mattern, F. Thermal maturity of the Hawasina units and origin of the Batinah Mélange (Oman Mountains): Insights from clay minerals. Mar. Pet. Geol. 2021, 133, 105316. [Google Scholar] [CrossRef] [Scilit]
- Li, L.; Bao, Z.; Li, Z.; Chen, L.; Xu, X.; Li, Y.; Zhao, Y.; Song, X. Origin of quartz and its implications for different phase fluids in lacustrine shales from the Qingshankou Formation, southern Songliao Basin, China. Geoenergy Sci. Eng. 2024, 234, 212673. [Google Scholar] [CrossRef] [Scilit]
- Jarvie, D.; Hill, R.; Ruble, T.; Pollastro, R. Unconventional shale-gas systems: The Mississippian Barnett Shale of north-central Texas as one model for thermogenic shale-gas assessment. AAPG Bull. 2007, 91, 475–499. [Google Scholar] [CrossRef] [Scilit]
- Loucks, R.; Reed, R.; Ruppel, S.; Jarvie, D. Morphology, genesis, and distribution of nanometer-scale pores in siliceous mudstones of the Missippian Barnett Shale. J. Sediment. Res. 2009, 79, 848–861. [Google Scholar] [CrossRef] [Scilit]
- Curtis, M.; Cardott, B.; Sondergeld, C.; Rai, C. Development of organic porosity in the Woodford Shale with increasing thermal maturity. Int. J. Coal Geol. 2012, 103, 26–31. [Google Scholar] [CrossRef] [Scilit]
- Bernard, S.; Horsfield, B.; Schulz, H.; Wirth, R.; Schreiber, A.; Sherwood, N. Geochemical evolution of organic-rich shales with increasing maturity: A STXM and TEM study of the Posidonia Shale (Lower Toarcian, northern Germany). Mar. Pet. Geol. 2012, 10, 70–89. [Google Scholar] [CrossRef] [Scilit]
- Wang, M.; Li, M.; Li, J.; Xu, L.; Zhang, J. The key parameter of shale oil resource evaluation: Oil content. Pet. Sci. 2022, 19, 1443–1459. [Google Scholar] [CrossRef] [Scilit]
- Hu, Q.; Ewing, R.; Rowe, H. Low nanopore connectivity limits gas production in Barnett formation. J. Geophys. Res. Solid Earth 2015, 120, 8073–8087. [Google Scholar] [CrossRef] [Scilit]
- Wang, M.; Yang, J.; Wang, Z.; Lu, S. Nanometer-Scale Pore Characteristics of Lacustrine Shale, Songliao Basin, NE China. PLoS ONE 2015, 10, e0135252. [Google Scholar] [CrossRef] [Scilit] [PubMed]
- Wang, X.; Zeng, J.; Kong, X.; Xu, H.; Wang, Q.; Jia, K. Controlling effect of shale pore wettability on spontaneous imbibition. J. Cent. South Univ. Sci. Technol. 2022, 53, 3323–3336. (In Chinese) [Google Scholar] [CrossRef]
- Xue, H.; Dong, Z.; Tian, S.; Lu, S.; An, C.; Zhou, Y.; Li, B.; Xin, X. Characteristics of Shale Wettability by Contact Angle and Its Influencing Factors: A Case Study in Songliao. Front. Earth Sci. 2021, 9, 736938. [Google Scholar] [CrossRef] [Scilit]
- Xue, H.; Ding, G.; Dong, Z.; Zhao, R.; An, C.; Li, B.; Zhou, Y.; Yan, P.; Yan, J.; Li, C.; et al. Study on the Wettability and Spontaneous Imbibition Characteristics of Lacustrine Shale. Geofluids 2022, 4023435. [Google Scholar] [CrossRef] [Scilit]
- Huang, X.; Li, Z.; Han, X.; Wang, Y.; Guo, Y. Lithofacies-Controlled Pore Characteristics and Mechanisms in Continental Shales: A Case Study from the Qingshankou Formation, Songliao Basin. Minerals 2025, 15, 1239. [Google Scholar] [CrossRef] [Scilit]
- Liu, X.; Zhang, J.; Liu, Y.; Huang, H.; Liu, Z. Main factors controlling the wettability of gas shales: A case study of over-mature marine shale in the Longmaxi Formation. J. Nat. Gas. Sci. Eng. 2018, 56, 18–28. [Google Scholar] [CrossRef] [Scilit]
- Gou, Q.; Xu, S.; Hao, F.; Lu, Y.; Zhang, A.; Wang, Y.; Cheng, X.; Qing, J. Characterization method of shale pore structure based on nano CT: A case study of Well JY-1. Acta Pet. Sin. 2018, 39, 1253–1261. (In Chinese) [Google Scholar] [CrossRef]
- Clarkson, C.; Solano, N.; Bustin, R.; Bustin, A.; Chalmers, G.; He, L.; Melnichenko, Y.; Radliski, A.; Blach, T. Pore structure characterization of North American shale gas reservoirs using USANS/SANS, gas adsorption, and mercury intrusion. Fuel 2013, 103, 606–616. [Google Scholar] [CrossRef] [Scilit]

Disclaimer/Publisher’s Note: The statements, opinions and data contained in all publications are solely those of the individual author(s) and contributor(s) and not of MDPI and/or the editor(s). MDPI and/or the editor(s) disclaim responsibility for any injury to people or property resulting from any ideas, methods, instructions or products referred to in the content. |
© 2026 by the authors. Licensee MDPI, Basel, Switzerland. This article is an open access article distributed under the terms and conditions of the Creative Commons Attribution (CC BY) license.