


Abstract
Deep exploration in mature gold districts requires subsurface alteration evidence that can be related quantitatively to three-dimensional (3D) geological architecture. This study develops a workflow for the Tudui–Shawang deposit in the Muping–Rushan metallogenic belt that integrates drill-core short-wave infrared (SWIR) spectroscopy, 3D alteration modeling, ore-controlling geological constraints, positive–unlabeled (PU) learning, and ensemble prospectivity prediction. A total of 2140 spectra from 10 drillholes were processed to identify mineral assemblages, extract spectral scalars and feature-shape attributes, classify alteration facies, and construct continuous 3D alteration evidence. Discrete smooth interpolation and indicator kriging were used for continuous and categorical attributes, respectively, and CatBoost, LightGBM, XGBoost, and Random Forest were evaluated within a spatially separated PU-bagging design. Quantitative analyses show that individual SWIR attributes have weak deposit-scale relationships with Au grade. Nevertheless, local IC minima, relatively lower pos2200 values near several mineralized intervals, alteration-facies transitions, and a broader shift toward longer pos2250 wavelengths characterize relevant parts of the mineralized system. FUSE performed best under 1 km × 1 km spatial holdout validation, with an ROC AUC of 0.8900 and a PRAUC of 0.8926. Prediction-area analysis and the 3D probability volume delineated three ranked exploration targets (T1–T3). The results show that drill-core SWIR-derived 3D alteration evidence, when integrated with ore-controlling geology and spatially validated machine learning, provides a practical basis for target prioritization in mature gold districts.
1. Introduction
Alteration minerals are key records of fluid–rock interaction in hydrothermal ore systems, preserving information on fluid composition, physicochemical evolution, alteration zoning, and ore-forming processes [1]. In mature mining districts, where shallow resources have been intensively explored, exploration is increasingly directed toward deep and concealed mineralization. This shift creates a need for rapid, non-destructive observations that preserve depth information and characterize mineral assemblages, mineral chemistry, and alteration vectors [2,3,4,5,6,7,8]. Drill-core short-wave infrared (SWIR) spectroscopy is well suited to this task because it is sensitive to hydroxyl-, water-, carbonate-, and sulfate-bearing minerals and can be acquired systematically along drillholes [9,10,11,12]. Diagnostic absorption positions, crystallinity-related parameters, and other feature-shape attributes provide complementary information on mineral chemistry, alteration assemblages, and exploration vectors [13,14,15,16]. Their exploration value is strongest when the spectral responses are interpreted within local mineralogical, structural, and hydrothermal contexts rather than treated as universal ore indicators.
The central methodological challenge is to transform spatially discrete drill-core SWIR observations into continuous 3D alteration evidence and integrate them with ore-controlling geological constraints for deep prospectivity prediction [17,18,19,20,21,22,23,24]. Three linked issues must be resolved. First, sparse and unevenly distributed drillhole observations must be interpolated without obscuring their spatial support or geological uncertainty [25,26,27,28]. Second, single spectral scalars need to be interpreted together with mineral assemblages, feature-shape attributes, derived indices, and alteration facies so that the model represents alteration architecture rather than isolated thresholds. Third, the resulting 3D spectral and geological evidence must be evaluated with a validation design that accommodates the absence of reliable negative labels [29,30,31] while limiting spatial information leakage [32,33]. Prediction-area analysis provides an additional means of evaluating the trade-off between known-mineralization coverage and the spatial extent of prospective areas [34]. Together, these methods provide complementary tools for constructing, validating, and interpreting spatially explicit 3D prospectivity models.
The Jiaodong Peninsula is one of China’s most important gold provinces and hosts numerous large to super-large gold deposits [35,36,37,38,39,40]. As near-surface exploration space becomes increasingly limited, deep and structurally concealed gold mineralization has become a major exploration target in this region. The Tudui–Shawang gold deposit, located in the Muping–Rushan metallogenic belt of eastern Jiaodong, is well suited for investigating subsurface alteration architecture and 3D prospectivity. Gold mineralization in the belt is closely associated with shear-zone deformation, fault-controlled hydrothermal activity, and multi-stage structural overprinting [41,42,43,44]. The available dataset comprises 10 drillholes, 2140 drill-core SWIR spectra, Au assay data, fault and lithological information, and an interpreted 3D orebody model. These data allow alteration–mineralization relationships, alteration-facies transitions, and ore-controlling geological constraints to be evaluated within a common 3D framework.
This study has three objectives: (1) to characterize drill-core SWIR mineral assemblages, spectral scalars, alteration facies, and their relationships with mineralization; (2) to transform discrete SWIR observations into continuous three-dimensional alteration evidence constrained by geological architecture; and (3) to integrate these subsurface spectral–geological predictors within a spatially validated PU-learning/FUSE framework for 3D prospectivity prediction and target prioritization [21,22,23,24,29,30,31,32,33,34]. Unlike conventional mineral prospectivity studies that primarily integrate regional-scale geophysical, geochemical, or surface-derived evidence layers, this study explicitly transforms drill-core SWIR observations into three-dimensional alteration evidence and integrates them with ore-controlling geological constraints within a spatially validated positive–unlabeled learning framework. The methodological contribution lies in the coordinated transformation of drill-core SWIR observations into 3D alteration evidence, their integration with ore-controlling geological constraints, and the spatial validation of the resulting prospectivity framework.
2. Geological Setting
2.1. Regional Structural Framework and the Muping–Rushan Gold Belt
The Jiaodong gold province, located in the eastern North China Craton, is one of the world’s most important Mesozoic gold provinces [36,37,38,39]. It comprises several major gold belts, including the Zhaoyuan–Laizhou, Qixia–Penglai, and Muping–Rushan belts [39,40]. The Muping–Rushan belt lies in the central-eastern Jiaodong Peninsula along the northeastern margin of the Jiaolai Basin (Figure 1a). It is characterized by intense Mesozoic tectono-magmatic activity and a complex fault system dominated by NE-SW- to NNE-trending structures, with subordinate NW-, EW-, and locally NS-trending faults [36,37,40].
Figure 1.
Regional geological setting of the Jiaodong Peninsula and the location of the Tudui–Shawang deposit (modified after Chen et al. [45]). (a) Distribution of major gold belts, regional faults, and representative gold deposits in the Jiaodong Peninsula. (b) Geological map of the Tudui–Shawang area, showing major faults, intrusive rocks, stratigraphic units, the study area, and the ten drillholes used for drill-core SWIR spectral analysis. Green stars indicate the drillhole locations.
These structures acted as major pathways for hydrothermal fluids and exerted a first-order control on alteration and gold deposition, consistent with the structural control typical of orogenic and Jiaodong-type gold systems [37,46]. In the Muping–Rushan belt, gold mineralization is commonly related to shear-zone deformation, fault-controlled hydrothermal alteration, and multi-stage structural overprinting [39,40]. The Tudui–Shawang deposit is located in the central part of this belt, close to regional faults and intrusive bodies, providing a suitable case for evaluating the coupling between fault architecture, alteration, and gold mineralization [42,43].
2.2. Deposit Geology, Alteration, and Ore-Controlling Features of the Tudui–Shawang Deposit
The Tudui–Shawang gold deposit occupies a favorable structural position along the northeastern margin of the Jiaolai Basin [42,43]. Its main framework is defined by NE-SW- to NNE-trending faults, which are overprinted by EW-, NW-, and NS-trending secondary faults. Regional structures, including the Taocun, Guocheng, and Yazi faults, likely influenced hydrothermal fluid migration, alteration zoning, and orebody localization [40,42].
Ore bodies are mainly hosted in fault-related alteration zones, fracture-dense intervals, and locally favorable intrusive-contact domains. They occur as bands, lenses, or irregular veins along structural belts, with variable thickness and mineralization intensity, indicating strong control by fault architecture and fracture permeability [36,37,40]. The ore assemblage is dominated by pyrite, with subordinate sphalerite, chalcopyrite, galena, and native gold. Native gold commonly occurs as fine-grained particles enclosed in or closely associated with pyrite. The gangue assemblage is dominated by quartz, with subordinate chlorite, epidote, and sericite. Calcite and other carbonate minerals occur mainly in late quartz–carbonate veins [44]. Previous deposit-scale studies document structurally controlled hydrothermal mineralization and multistage sericitic–silicic and quartz–carbonate alteration at Tudui–Shawang [43,44]. For the SWIR-based analysis in this study, the alteration assemblages were further organized into Phyllic, Propylitic, Carbonate, and Argillic–Smectite facies, as described in Section 3.4. For SWIR interpretation and three-dimensional prospectivity modeling, the deposit was subdivided into western, central, and eastern working areas according to drillhole distribution, orebody clusters, and structural segmentation.
3. Data and Methods
The methodological workflow is organized into three linked layers that integrate drill-core SWIR-derived 3D alteration evidence, ore-controlling geological predictors and PU-label definition, and PU/FUSE-based prospectivity modeling, spatial validation, and target prioritization (Figure 2). Drill-core spectral observations were converted into continuous and categorical 3D evidence, aligned with lithological, fault-distance, and orebody-derived label information, and evaluated using spatially separated validation.
Figure 2.
Technical workflow for drill-core SWIR-based 3D alteration modeling and PU/FUSE prospectivity prediction.
3.1. Drill-Core SWIR Spectral Dataset
Drill-core reflectance spectra were acquired using an OreXpress spectrometer covering 350–2500 nm at 1 nm sampling intervals. The spectral resolution is approximately 2.8 nm in the VNIR, 8 nm at 1500 nm, and 6 nm at 2100 nm, covering the principal diagnostic absorption regions of hydrothermal alteration minerals. White-reference calibration was performed before measurement and repeated at 1 h intervals to minimize instrumental drift.
Measurements were collected from 10 drillholes at variable intervals controlled by lithological variation, with most adjacent points spaced approximately 2–5 m apart. A total of 2140 spectra were obtained and stored in .raw and .sed formats. The drillholes cover the western, central, and eastern parts of the Tudui–Shawang deposit and provide the depth-constrained dataset for mineral identification, spectral–scalar extraction, and three-dimensional alteration analysis.
3.2. Drillhole Au Assay Data, Geological Data, and Ore-Label Definition
Drillhole Au assay data were obtained from analyses of drill-core samples provided by the mine. Au concentrations were determined using the activated-carbon adsorption–hydroquinone volumetric method and are reported in g/t. Analytical procedures and quality-control checks followed the requirements of DZ/T 0130.3-2006 for chemical analysis of rock and mineral samples [47], and the analytical quality met the specified requirements. The assay data were used to examine the relationships between gold mineralization, SWIR-derived spectral parameters, and alteration-facies transitions. Au grade was not included as a predictor in the final prospectivity model.
Geological constraints were compiled from mine-scale geological maps and cross-sections of the Tudui–Shawang deposit and included lithological units, faults, and interpreted ore bodies. These datasets were integrated within a common three-dimensional coordinate framework to construct lithological and structural variables.
Ore labels were derived from the interpreted three-dimensional orebody model. Samples located within orebody volumes were assigned ore = 1 and treated as positive samples, whereas all remaining samples were treated as unlabeled rather than confirmed negatives in the PU-learning framework described in Section 3.5.
3.3. Drill-Core SWIR Spectral Preprocessing, Mineral Identification, and Scalar Extraction
Drill-core spectra were processed and interpreted using The Spectral Geologist software (TSG 8). Incomplete, saturated, anomalous, or poor-quality spectra were excluded, and the retained spectra were subjected to noise suppression while preserving the principal absorption features near 1900, 2200, 2250, 2330, and 2350 nm.
Alteration minerals were identified by jointly considering diagnostic absorption positions, absorption-feature shapes, and spectral matching with reference spectra [12]. Mineral assignments were based on the overall spectral response rather than a single absorption minimum and were subsequently standardized and grouped for alteration-facies analysis.
TSG 8-derived parameters were extracted to quantify diagnostic absorption positions and feature shapes. Five spectral-position and crystallinity attributes were retained for 3D alteration characterization and prospectivity modeling: the Al-OH absorption position near 2200 nm (pos2200), the Fe-Mg-OH-related absorption position near 2250 nm (pos2250), the wavelength position of the TSG absorption feature indexed near 2330 nm (pos2330), the carbonate-related absorption position near 2350 nm (pos2350), and the crystallinity index (IC). pos2200 records shifts in the principal Al-OH feature and was used to characterize compositional variation within mica-group minerals [13,14,15]. pos2250 characterizes wavelength shifts in the feature near 2250 nm and provides information on Fe- and Mg-bearing alteration assemblages. pos2330 records the wavelength position of an absorption feature within the carbonate-sensitive ~2.3 μm SWIR region. Absorption features in the ~2300–2350 nm interval are commonly associated with CO3-bearing minerals, and their wavelength positions may vary with carbonate mineralogy and composition [48,49,50]. However, overlapping Mg-OH absorptions may also occur within this wavelength region. Therefore, pos2330 was not interpreted independently as a diagnostic carbonate indicator. Instead, pos2330 was used together with pos2350, Area2350, carbonate-group weight, and the Carbonate facies-response score in the construction of the Carbonate-Bearing Index (CBI), thereby reducing reliance on a single absorption position. pos2350 records variation in carbonate-related absorption. For the 2200, 2250, 2330, and 2350 nm feature families, the exported feature-depth (dep), integrated-area (Area), and asymmetry (Asym) attributes were also retained where available. IC was used as a crystallinity-related parameter for mica-group variation [13,14,15].
The mineral interpretations and spectral attributes were linked to drillhole coordinates and measurement depths. pos2200, pos2250, pos2330, pos2350, IC, and the associated dep, Area, and Asym fields were used as quantitative SWIR attributes for depth-constrained 3D alteration analysis. Mineral-group information and the extracted parameters were subsequently used for alteration-facies classification and derived alteration-index construction, as described in Section 3.4.
3.4. Alteration Facies Classification and Derived Alteration Indices
SWIR mineral assemblages and diagnostic spectral parameters have been widely used to characterize hydrothermal alteration zoning in gold systems [16]. Alteration facies were classified by integrating normalized mineral-group weights and standardized diagnostic SWIR parameters. The identified minerals were grouped into mica, chlorite, epidote–amphibole, carbonate, smectite, and kaolin groups, and four principal facies were considered: Phyllic, Propylitic, Carbonate, and Argillic–Smectite. To stabilize the recognition of dominant mineral assemblages, samples with a carbonate-group weight ≥ 0.45 were preferentially assigned to Carbonate; those with a mica-group weight ≥ 0.50 and carbonate-group weight < 0.35 were assigned to Phyllic; and those with a combined chlorite and epidote–amphibole weight ≥ 0.45 and carbonate-group weight < 0.40 were assigned to Propylitic. The remaining samples were classified according to the highest facies-response score. Samples with a maximum score < 0.15 or a difference of <0.05 between the two highest scores were assigned to Uncertain.
These thresholds were derived empirically from the mineral-weight and spectral-parameter distributions of the 2140 drill-core SWIR records and were checked against drill-core logging and available alteration descriptions. Facies transitions and their spatial relationships with known mineralized intervals were also examined as a geological consistency check, although ore labels were not used directly in facies assignment. Because independent mineralogical or petrographic validation was not available for all measurement positions, these criteria are regarded as deposit-scale classification rules rather than universal alteration-facies thresholds.
Following facies classification, three derived alteration indices were calculated from standardized spectral parameters, mineral-group weights, and facies-response scores: the Phyllic Spectral Index (PSI), Carbonate-Bearing Index (CBI), and Propylitic Response Index (PRI):
where Z(·) denotes z-score standardization; Wmica, Wcarb, and Wchl_epi are the normalized weights of the mica, carbonate, and combined chlorite-epidote-amphibole groups, respectively; and Phyllic, Carbonate, and Propylitic represent the corresponding facies-response scores. PSI, CBI, and PRI were used as continuous alteration attributes to characterize alteration gradients and facies transitions within the deep alteration architecture.
3.5. Three-Dimensional Alteration Modeling and Prospectivity Modeling
Continuous SWIR attributes, including spectral scalars and derived alteration indices, were modeled in three dimensions using discrete smooth interpolation (DSI) [25], whereas categorical alteration facies were modeled using indicator kriging (IK) [26]. DSI was used to preserve continuous alteration gradients, while IK represented the spatial distribution of discrete alteration facies. The resulting models characterized the deep alteration architecture and provided subsurface alteration constraints for prospectivity modeling [27,28].
The final prospectivity predictors consisted of distance to fault; pos2200, pos2250, pos2330, and pos2350; IC; dep2200, dep2250, dep2330, and dep2350; Area2200, Area2250, and Area2350; Asym2200, Asym2250, and Asym2350; PSI, CBI, and PRI; lithology; and alteration facies. Numerical variables comprised distance to fault and the continuous SWIR-derived attributes, whereas lithology and alteration facies were treated as categorical variables. The final prospectivity predictors consisted exclusively of drill-core SWIR-derived alteration attributes and ore-controlling geological variables. Au grade was excluded to avoid label leakage, and the ore field was used only to define positive and unlabeled samples. Spatial X, Y, and Z coordinates were not included as predictors and were used only for spatial partitioning and 3D visualization.
A positive–unlabeled (PU) bagging strategy was adopted because samples outside interpreted ore bodies may include unrecognized mineralization and therefore cannot be treated as reliable negatives [29,30,31]. Samples with ore = 1 were defined as positive, and all remaining samples were treated as unlabeled. In each bag, all positive training samples were combined with randomly sampled unlabeled samples at a U:P ratio of 2:1. Bagging-based PU approaches use repeated resampling of unlabeled subsets to reduce dependence on a single unlabeled sample set [31]. The bagging procedure was repeated five times using independently sampled unlabeled subsets.
CatBoost [51], LightGBM [52], XGBoost [53], and Random Forest [54] were evaluated as candidate models. Numerical variables were median-imputed. Categorical variables were handled directly by CatBoost and were most-frequent imputed and ordinally encoded for the other models. For each model, probabilities from the five PU bags were averaged. The bag-averaged probabilities of CatBoost, LightGBM, and XGBoost were then transformed to logit space, averaged with equal weights, and mapped back to probability space using the sigmoid function:
Random Forest was retained as a comparison model and was not included in the FUSE ensemble. Spatial validation and target delineation are described in Section 3.7.
3.6. Quantitative Analysis of SWIR–Mineralization Relationships
Quantitative analyses were conducted at measured-point and three-dimensional model scales to evaluate the relationships between SWIR alteration attributes and Au mineralization. At the measured-point scale, Spearman rank correlations were calculated between matched Au grades and IC, pos2200, pos2250, pos2350, PSI, CBI, and PRI [55]. Because pos2330 represents an auxiliary carbonate-sensitive spectral descriptor within the ~2.3 μm region and may be affected by overlapping Mg–OH absorptions, it was not interpreted as an independent diagnostic carbonate vector and was therefore not included in the standalone univariate SWIR–Au correlation analysis. Pairwise complete observations were used because the availability of diagnostic SWIR parameters varied among measurement points.
At the three-dimensional model scale, interpolated IC, pos2200, and pos2250 attributes were aggregated into unique 50 × 50 × 50 m spatial blocks. Median attribute values were calculated using all grid cells within each block. A block was classified as orebody-associated when it contained at least one interpreted orebody cell; otherwise, it was classified as ore-free. Each spatial block was represented by a single record and assigned exclusively to one comparison group. Distributional differences between orebody-associated and ore-free blocks were evaluated using the Mann–Whitney U test [56], and Cliff’s delta was calculated to quantify effect magnitude and direction [57]. The absolute Cliff’s δ values were classified as negligible (<0.147), small (0.147–<0.330), medium (0.330–<0.474), or large (≥0.474) using conventional effect-size thresholds [58].
3.7. Spatial Validation, Prediction-Area Analysis, and Target Delineation
To reduce optimistic performance estimates caused by spatial autocorrelation, model evaluation used a 1 km × 1 km spatial holdout strategy. Conventional random partitioning may yield overly optimistic performance estimates when spatially neighboring observations are distributed between training and validation subsets; spatially separated validation is therefore more appropriate for assessing model performance in unsampled spatial domains [32,33]. The 1 km block size was selected to provide spatial separation among validation units while retaining sufficient positive and unlabeled samples in both training and validation partitions, given the deposit-scale distribution of drillholes and interpreted ore bodies. Given the clustered distribution of drillhole samples and positive ore labels, smaller blocks may retain strong local spatial dependence between training and validation samples, whereas substantially larger blocks would reduce the number of available spatial units and could produce imbalanced partitions. The 1 km × 1 km grid was therefore adopted as a study-specific compromise between spatial separation and sample representation. Grid identifiers were derived from projected X and Y coordinates, and all samples within the same grid cell were assigned exclusively to either the training or validation partition. Positive and unlabeled samples were partitioned at the grid-cell level, rather than at the individual-sample level, with approximately 20% of the pooled samples assigned to validation. Candidate spatial partitions were randomly generated, and the partition closest to the target validation proportion while retaining both positive and unlabeled samples in both subsets was selected.
For proxy evaluation, unlabeled validation samples were randomly downsampled to a U:P ratio of 2:1 and treated as proxy negatives only for metric calculation. The same U:P ratio as that used in PU-bagging training was retained for consistency in the sampling design. The evaluation therefore measured discrimination between known positive and sampled unlabeled observations rather than between mineralized and confirmed barren samples. Model performance was assessed using receiver operating characteristic area under the curve (ROC AUC) and precision–recall area under the curve (PRAUC). Accuracy, precision, recall, F1 score, and the Matthews correlation coefficient (MCC) were additionally calculated at a probability threshold of 0.5.
Prediction-area (P-A) analysis evaluated the trade-off between the coverage of known mineralization and the proportion of the study area classified as prospective across probability thresholds [34]. The screening threshold was selected at the balance point between the prediction-rate and study-area curves and was used for target screening rather than as an interpreted orebody boundary.
Priority targets were delineated from spatially continuous high-probability zones above the selected threshold. Target ranking further considered their continuity and spatial relationships with deep alteration architecture, alteration-facies transitions, orebody geometry, and ore-controlling structures.
4. Results
4.1. Drill-Core SWIR Mineral Assemblages and Spectral Scalar Characteristics
Representative drill-core SWIR spectra illustrate the principal absorption features used in mineral interpretation (Figure 3). The mica-group spectrum shows a prominent Al-OH absorption feature near 2.20 μm, whereas the chlorite spectrum is characterized by a Fe-Mg-OH-related feature near 2.25 μm. Calcite exhibits a carbonate-related absorption feature near 2.35 μm, and the montmorillonite-bearing spectrum shows a strong H2O-related absorption near 1.90 μm together with an Al-OH response near 2.20 μm. These measured spectra provide the spectral basis for the principal mineral groups identified from the drill-core SWIR dataset.
Figure 3.
Representative drill-core SWIR reflectance spectra of the principal alteration mineral groups identified in this study. The spectra represent mica (phengite), chlorite (Mg-chlorite), carbonate (calcite), and smectite (montmorillonite) from representative drill-core samples. Dashed vertical lines mark the principal diagnostic absorption regions near 1.90, 2.20, 2.25, and 2.35 μm.
Mineral-group statistics further show that the drill-core alteration assemblages are dominated by mica, chlorite, and carbonate minerals, with subordinate amphibole- and smectite-bearing assemblages (Figure 4). The western, central, and eastern domains differ in their dominant mineral groups and assemblage complexity.
Figure 4.
Summary statistics of mineral groups and dominant mineral types in the western (a), central (b), and eastern (c) parts of the study area. The upper panels show the relative weights of the major mineral groups, and the lower panels show the top-ranked mineral types in each area.
Laterally, the western working area is chlorite-dominated, with magnesian chlorite and Fe-Mg chlorite as the main minerals, together with common dolomite. The central working area contains the most complex assemblages, with mixed mica-, chlorite-, and carbonate-rich intervals and common poly-siliceous muscovite, illitized muscovite, Fe-Mg chlorite, and siderite. The eastern working area is characterized by stronger mica-group development, persistent carbonate minerals, and weaker chlorite-group occurrence. Overall, the deep alteration system changes from chlorite-rich assemblages in the west, through mixed assemblages in the center, to mica-dominant assemblages in the east.
Vertical variation is also pronounced (Figure 5, Figure 6 and Figure 7). In the western area, chlorite-group minerals persist through most depth intervals, with carbonates becoming stronger in the middle and deeper parts and mica-group minerals concentrated mainly in shallow and local deeper intervals. The central area shows the strongest vertical alternation among mica-, chlorite-, and carbonate-rich assemblages, indicating substantial multi-stage overprinting. In the eastern area, mica-group minerals dominate most depth intervals, carbonates recur locally, and chlorite-group minerals are enhanced only in limited zones. These profiles show systematic lateral and depth-dependent heterogeneity in the drill-core alteration assemblages.
Figure 5.
Vertical distribution of the major SWIR mineral groups in the western part of the study area: (a) ZK49532 and (b) ZK53251. Variations in the relative weights of mica, chlorite, carbonate, and smectite groups with depth indicate the vertical alteration assemblages in the western domain.
Figure 6.
Vertical distribution of the major SWIR mineral groups in the central part of the study area: (a) ZK32-6, (b) ZK32-4, (c) ZK24-2, (d) ZK8-7, and (e) ZK8-8. Variations in the relative weights of mica, chlorite, carbonate, and smectite groups with depth indicate the vertical alteration assemblages in the central domain.
Figure 7.
Vertical distribution of the major SWIR mineral groups in the eastern part of the study area: (a) ZK3201, (b) ZK1603, and (c) ZK1601. Variations in the relative weights of mica, chlorite, carbonate, and smectite groups with depth indicate the vertical alteration assemblages in the eastern domain.
The mineral co-occurrence matrices shown in Figure 8 reflect co-occurrence relationships among specific mineral species rather than merely differences in the overall abundances of broad mineral groups. In the western working area, chlorite-group minerals commonly co-occur with phengite, muscovite, and carbonate minerals such as siderite and ankerite, indicating a close association among chlorite, white mica, and Fe-rich carbonate minerals. The central working area exhibits the densest co-occurrence patterns, involving more complex associations among white mica minerals, chlorite minerals, and multiple carbonate species. In the eastern working area, co-occurrence between white mica minerals and carbonate minerals such as dolomite and calcite is more common, whereas chlorite-related associations are relatively weaker. At the level of major mineral groups, these patterns can be further summarized as a lateral trend in the deep mineral assemblages of the study area, characterized by a west-to-east transition from relatively strong chlorite-white mica-Fe-rich carbonate associations to more prominent white mica–carbonate assemblages.
Figure 8.
Mineral co-occurrence matrices for the western, central, and eastern parts of the study area.
The SWIR scalar distributions also show clear district-scale regularities (Figure 9 and Figure 10). IC is strongly right-skewed, with most samples concentrated between 0.2 and 0.8 and progressively fewer samples toward the high-value end. Higher IC values are more common at greater depths. pos2200 is concentrated mainly between 2210 and 2218 nm. pos2250 peaks mainly between 2249 and 2254 nm. pos2350 is concentrated toward the lower-wavelength side. Despite differences in sample density among drillholes, the main IC, pos2200, and pos2250 ranges are reproduced across multiple holes.
Figure 9.
Depth-colored histograms of the principal SWIR spectral scalars for all samples. (a) IC; (b) pos2200; (c) pos2250; and (d) pos2350. Color represents sample depth.
Figure 10.
Drillhole-scale comparison of SWIR scalar distributions and sample counts. (a) IC; (b) pos2200; (c) pos2250; and (d) pos2350. Bar heights show sample counts, and colors represent scalar values.
4.2. Alteration–Mineralization Relationships in Representative Drillholes and Sections
At the measured-point scale, Spearman rank correlations were calculated between matched Au grades and the principal SWIR attributes, including IC, pos2200, pos2250, pos2350, PSI, CBI, and PRI. Pairwise complete observations were used because the availability of diagnostic spectral parameters varied among measurement points. The correlation results are summarized in Table 1.
Table 1.
Spearman rank correlations between Au grade and SWIR alteration attributes at measured drill-core points.
Correlations between Au grade and the individual SWIR attributes were uniformly weak, with all |ρ| values below 0.08 (Table 1). pos2350 showed a statistically detectable negative association with Au (ρ = −0.073, p = 0.004), although the magnitude of the correlation was very small. IC, pos2200, pos2250, PSI, CBI, and PRI showed no significant monotonic relationships with Au grade. These results indicate that no individual spectral scalar or derived alteration index serves as a direct proxy for Au grade at the deposit scale.
The local expression of these relationships is further illustrated by four representative drillholes (Figure 11). At the borehole scale, Au anomalies occur mainly near changes in mineral assemblages and coordinated variations in multiple SWIR attributes rather than at persistently high or low values of a single parameter. In ZK24-2 and ZK32-4, prominent Au peaks occur mainly where chlorite-, mica-, and locally carbonate-bearing assemblages alternate. Several of these intervals are accompanied by local IC minima or inflection points and coordinated shifts in pos2200 and pos2250. ZK1603 and ZK49532 show weaker mineralization overall, but local Au anomalies likewise occur near assemblage changes and scalar inflection zones. These borehole-scale patterns are consistent with the weak deposit-scale correlations and suggest that Au enrichment is more closely associated with coordinated alteration changes than with a single spectral threshold.
Figure 11.
Representative borehole-scale relationships among SWIR mineral assemblages, Au grade, and spectral scalars in different parts of the study area. (a) ZK24-2; (b) ZK32-4; (c) ZK1603; and (d) ZK49532. The panels show downhole variations in mineral assemblages, Au grade, IC, pos2200, pos2250, and pos2350.
At the three-dimensional model scale, the distributions of interpolated IC, pos2200, and pos2250 were compared between independent 50 m spatial blocks containing interpreted orebody cells and blocks containing no orebody cells. Mann–Whitney U tests were used to evaluate distributional differences, and Cliff’s delta was calculated to assess effect magnitude (Table 2).
Table 2.
Mann–Whitney U comparison of interpolated SWIR attributes between orebody-associated and ore-free 50 m spatial blocks.
The block-scale comparison shows that orebody-associated blocks have a slightly lower median IC than ore-free blocks, although the overall distributional difference is not significant and the effect size is negligible (0.670 versus 0.719; p = 0.312; Cliff’s δ = −0.032; Table 2). pos2200 likewise shows no significant deposit-scale distributional shift (p = 0.078; Cliff’s δ = 0.057). These results indicate that lower IC and lower pos2200 do not constitute uniform deposit-scale signatures of mineralization, but they do not exclude local minima or relative decreases against the surrounding alteration background. In contrast, pos2250 is shifted toward longer wavelengths in orebody-associated blocks. Median pos2250 values are 2251.82 nm and 2249.91 nm in orebody-associated and ore-free blocks, respectively (p < 0.001; Cliff’s δ = 0.462), indicating a medium distributional effect.
The spatial expression of these model-scale relationships is illustrated by representative western, central, and eastern sections (Figure 12). The sectional comparison shows that interpreted ore bodies commonly occur near contacts or transition zones between alteration facies. In the western section, several mineralized intervals occur near alteration-facies boundaries and are spatially associated with local IC minima or lower-IC zones relative to the surrounding alteration background, together with local decreases or relatively lower pos2200 values compared with adjacent intervals. In the central section, the principal Au-rich intervals occur near Phyllic–Propylitic facies transitions and are accompanied by local IC minima or inflection points and decreases in pos2200 relative to adjacent intervals. In the eastern section, the interpreted ore bodies are smaller and occur near alteration-facies boundaries and local zones of variation in pos2200 and pos2250. The statistically more systematic pos2250 shift is expressed at the broader alteration-domain scale rather than as a sharp contrast at individual orebody boundaries. Together, these results reveal a scale-dependent spectral response to mineralization: local IC minima and relatively lower pos2200 values occur near several mineralized intervals when compared with the surrounding alteration background, whereas the longer-wavelength shift in pos2250 is more systematically expressed at the broader alteration-domain scale. SWIR attributes are therefore most informative when interpreted in terms of local gradients, inflection zones, and alteration-facies transitions rather than fixed absolute thresholds.
Figure 12.
Cross-sectional comparison of alteration zonation, Au distribution, and spectral scalar models in the western, central, and eastern sections. (a) Alteration zonation in the western section; (b) Au distribution in the western section; (c) IC in the western section; (d) pos2200 in the western section; (e) pos2250 in the western section; (f) alteration zonation in the central section; (g) Au distribution in the central section; (h) IC in the central section; (i) pos2200 in the central section; (j) pos2250 in the central section; (k) alteration zonation in the eastern section; (l) Au distribution in the eastern section; (m) IC in the eastern section; (n) pos2200 in the eastern section; and (o) pos2250 in the eastern section. Red lines indicate the projected positions of interpreted ore bodies on the sections.
4.3. Three-Dimensional Prospectivity Modeling and Model Evaluation
Figure 13, Figure 14 and Figure 15 summarize the three-dimensional evidence layers used in the prospectivity model for the western, central, and eastern domains. These layers include alteration zonation, strata, distance to fault, key SWIR spectral scalars, and the derived alteration indices PSI, CBI, and PRI, and they provide the geological context for interpreting the final prospectivity results. In view of the weak relationships between individual SWIR attributes and Au grade identified in Section 4.2, the spectral variables were incorporated as complementary descriptors of the deep alteration architecture rather than as independent threshold-based indicators of mineralization.
Figure 13.
Integrated three-dimensional evidence model for the western domain: (a) alteration zonation; (b) strata; (c) distance to fault; (d) IC; (e) pos2200; (f) pos2250; (g) pos2330; (h) pos2350; (i) CBI; (j) PSI; (k) PRI; and (l) reference geological model. Colors in the continuous-variable panels correspond to the values shown by their respective color bars, whereas categorical colors in the alteration-zonation and strata panels correspond to the legends shown below the panels.
Figure 14.
Integrated three-dimensional evidence model for the central domain: (a) alteration zonation; (b) strata; (c) distance to fault; (d) IC; (e) pos2200; (f) pos2250; (g) pos2330; (h) pos2350; (i) CBI; (j) PSI; (k) PRI; and (l) reference geological model. Colors in the continuous-variable panels correspond to the values shown by their respective color bars, whereas categorical colors in the alteration-zonation and strata panels correspond to the legends shown below the panels.
Figure 15.
Integrated three-dimensional evidence model for the eastern domain: (a) alteration zonation; (b) strata; (c) distance to fault; (d) IC; (e) pos2200; (f) pos2250; (g) pos2330; (h) pos2350; (i) CBI; (j) PSI; (k) PRI; and (l) reference geological model. Colors in the continuous-variable panels correspond to the values shown by their respective color bars, whereas categorical colors in the alteration-zonation and strata panels correspond to the legends shown below the panels.
Under the 1 km × 1 km spatial holdout evaluation, all candidate models showed discriminatory ability, with FUSE achieving the highest overall performance. FUSE yielded ROC AUC and PRAUC values of 0.8900 and 0.8926, respectively. XGBoost and CatBoost showed similar performance, with ROC AUC values of 0.8670 and 0.8675 and PRAUC values of 0.8807 and 0.8797, respectively. Random Forest achieved an ROC AUC of 0.8630 and a PRAUC of 0.8649, whereas LightGBM showed lower overall performance, with corresponding values of 0.8122 and 0.8472 (Figure 16 and Figure 17).
Figure 16.
ROC curves of FUSE and the individual base models. The dashed diagonal line represents the no-discrimination reference (ROC AUC = 0.5).
Figure 17.
Precision–recall curves of FUSE and the individual base models. The dashed horizontal line represents the positive-class prevalence (0.3333) in the proxy evaluation dataset.
The ROC and precision–recall curves further show the comparatively stable discrimination of FUSE (Figure 16 and Figure 17). FUSE maintained a higher true-positive rate at low false-positive rates and retained higher precision across a broad recall range. These results support the selection of FUSE as the primary model for three-dimensional prospectivity prediction and target prioritization.
The P-A curve in Figure 18 further illustrates the trade-off between coverage of known ore bodies and the spatial extent of the priority verification area. Across a broad probability range, FUSE maintained good coverage of known mineralization. The prediction-rate curve and the study-area curve intersected at a probability threshold of 0.8397. This threshold is therefore best treated as a screening threshold for priority targets rather than as an orebody boundary.
Figure 18.
Prediction-area (P-A) curves of the FUSE model and the intersection-based threshold selection.
Based on the spatial holdout metrics and curve-based evaluation, FUSE was selected for construction of the final three-dimensional prospectivity volume and target screening.
4.4. Three-Dimensional Prospectivity Distribution and Interpretation of Exploration Targets
The three-dimensional prospectivity results should be interpreted primarily as a tool for target prioritization rather than as a direct substitute for orebody boundaries. In the present case, the most important features are the spatial continuity of FUSE high-probability zones and their spatial relationships with favorable geological evidence, including alteration-facies transitions, local IC minima or lower-IC zones relative to the surrounding alteration background, locally lower pos2200 values compared with adjacent intervals, and proximity to faults. The priority exploration targets derived from the fused probability volume are shown in Figure 19.
Figure 19.
Three-dimensional prospectivity distribution of the FUSE model and prioritized exploration targets (T1–T3).
The high-probability zones do not simply reproduce the distribution of a single alteration mineral or SWIR attribute. They instead represent the integrated response of alteration assemblages, SWIR-derived attributes, alteration facies, and structural position. Exploration prioritization should therefore consider the relative ranking and spatial continuity of the high-probability zones together with their relationships to known ore bodies and alteration-facies transitions, rather than relying on a single spectral threshold or rigid binary classification.
Figure 19 shows that the high-probability bodies form continuous or semi-continuous clusters around known ore bodies, favorable deep alteration zones, and local structural transition sites rather than being evenly dispersed in three dimensions. This pattern suggests that the FUSE output captures favorable mineralization space defined by the superposition of multiple deep indicators rather than by a local anomaly in any single variable. The continuity of the high-probability bodies, their spatial relationship to known ore bodies, and their consistency across models are therefore all important in target prioritization.
Based on the three-dimensional probability volume, three priority targets, T1, T2, and T3, were selected. T1 is located in the western domain and spans elevations from approximately 200 to −250 m. It lies along the outer margin and inferred down-dip continuation of the known orebody cluster and is associated with a relatively large and vertically extensive high-probability body. The spatial continuity of the predicted body and its relationship with the known mineralized system support the prioritization of T1 for marginal expansion and deep-extension exploration.
T2 forms a comparatively compact and relatively isolated high-probability body in the central domain at elevations from approximately 100 to −50 m. The predicted body is spatially separated from the main western mineralized cluster and retains a coherent three-dimensional geometry. Because drill control in this part of the model is comparatively limited, its isolated but spatially coherent probability response supports its interpretation as a concealed exploration target requiring denser verification.
T3 occurs at elevations from approximately −50 to −100 m within an eastern belt of spatially aligned high-probability bodies. Although the individual predicted bodies are smaller and more discontinuous than those in the western domain, their belt-like spatial arrangement defines a coherent exploration trend. T3 was therefore selected to test the possible continuation of the eastern prospective belt and to guide further tracing along its three-dimensional extension. Together, T1–T3 represent three exploration scenarios: marginal and deep extension of known mineralization, relatively independent concealed mineralization, and belt-like continuation of an eastern prospective trend.
5. Discussion
5.1. SWIR-Defined Alteration Architecture and Its Implications for Ore Localization
The SWIR results indicate that gold mineralization in the Tudui–Shawang deposit is spatially associated with alteration architecture and structural position, rather than with the persistence of a single alteration mineral or a single spectral threshold. The western, central, and eastern parts of the study area display a systematic lateral transition from chlorite-rich assemblages, through mixed mica–chlorite–carbonate assemblages, to mica- and carbonate-dominated assemblages. Representative drillholes and cross sections show that Au anomalies commonly occur where mineral assemblages change or overlap, especially at transitions among Phyllic, Propylitic, and Carbonate facies. This pattern suggests that ore localization was favored by enhanced fluid–rock interaction, permeability contrasts, and repeated hydrothermal overprinting, rather than by any one alteration facies alone [59,60,61].
The recurrent spatial association observed between ore bodies and facies boundaries is geologically significant. In structurally controlled gold systems, alteration fronts may record zones of changing fluid pathways and wall-rock reactivity, accompanied by shifts in physicochemical conditions and sulfidation reactions. Such fluid–rock reaction gradients can modify Au transport and promote metal precipitation [59,60,62,63]. In the Jiaodong gold province, gold deposits are widely hosted by NE- to NNE-trending brittle faults, and larger orebodies are commonly associated with dilatational jogs or other structurally favorable domains [37,38,39,40]. These relationships indicate that fluid focusing and structural permeability are first-order controls on mineralization [61].
Within this framework, low IC and relatively short Al-OH absorption wavelength position near 2200 nm (pos2200) should be interpreted as local vectors to ore-proximal alteration, not as universal thresholds. This distinction is important because SWIR responses vary among deposit types and hydrothermal systems. In several porphyry and porphyry-skarn systems, high IC and low pos2200 commonly indicate proximal, high-temperature phyllic alteration; for example, the Bangpu Mo-Cu deposit uses high IC, high Dep2200, and low pos2200 as combined exploration indicators [64]. By contrast, SWIR studies of gold systems show that low crystallinity can coincide with mineralization where the main ore stage is related to relatively lower-temperature illitic alteration and structurally focused fluid flow [65]. Within this framework, local IC minima and relatively lower pos2200 values should be interpreted as spatially relative vectors to ore-proximal alteration rather than universal or deposit-wide thresholds. The quantitative results in Section 4.2 show that neither IC nor pos2200 exhibits a significant deposit-scale distributional shift between orebody-associated and ore-free spatial blocks. Their exploration significance is therefore expressed mainly through local gradients, inflection zones, and decreases relative to the surrounding alteration background.
Recent studies from Jiaodong further support the exploration value of SWIR spectral features in concealed lode-gold systems. In the Qianchen gold deposit, sericite SWIR features combined with machine-learning models distinguished gold-bearing from barren rocks and predicted concealed mineralization [13]. In the Tengjia Au deposit, white-mica pos2200 and IC values, together with OPLS-DA and random forest analysis, were used to identify ore-related alteration and concealed lode-gold mineralization [14]. These studies show that SWIR parameters are most effective when interpreted in the context of alteration stage, mineral assemblage, structure, and local hydrothermal evolution. For the Tudui–Shawang deposit, the most consistent ore-related pattern is the spatial coincidence of alteration-facies transitions and favorable structural positions with local IC and pos2200 inflection zones, rather than uniformly low absolute values of either spectral parameter.
The absorption wavelength position near 2250 nm (pos2250) shows a different scale-dependent behavior. At the 50 m spatial-block scale, orebody-associated blocks exhibit a systematic shift toward longer pos2250 wavelengths, with a medium distributional effect. However, this shift is expressed across broader alteration domains rather than as a sharp contrast at individual orebody boundaries. pos2250 is therefore interpreted as a contextual indicator of Fe-Mg-bearing alteration domains and chlorite-related transition architecture, rather than as a direct orebody discriminator. It helps identify chlorite-bearing transition zones and contributes to recognition of Propylitic and mixed alteration domains, but does not independently define orebody positions. This cautious interpretation is necessary because chlorite-related SWIR parameters may be affected by spectral mixing with epidote, sericite, carbonate, and other Fe-Mg-bearing minerals. The Tongshan porphyry Cu-Mo study similarly emphasized that chlorite-epidote mixing can influence Fe-OH/Mg-OH absorption features and that mineral-oriented classification is required before reliable peak positions are extracted [66]. Pos2250 is therefore best used in this study as an auxiliary tracer of chlorite-bearing alteration interfaces.
The west–center–east zoning is interpreted as reflecting spatially variable fluid–rock interaction and superposed hydrothermal conditions rather than a simple unidirectional temporal sequence. The chlorite-rich western domain, mixed mica–chlorite–carbonate central domain, and mica- and carbonate-rich eastern domain may record differences in structurally focused fluid flow, permeability contrasts, fluid–rock reaction, alteration-front migration, and multi-stage hydrothermal overprinting [59,60,61,62,63]. Alteration-facies transitions may be spatially associated with Au mineralization because these interfaces concentrate changes in mineral reactivity and physicochemical conditions along permeable structures. This interpretation is consistent with the observed zoning, but it does not establish a unique temporal sequence, temperature path, or pH evolution.
5.2. Integration of Drill-Core SWIR Alteration Evidence and Geological Constraints for 3D Prospectivity Prediction
The proposed workflow converts spatially discrete drill-core SWIR observations into continuous 3D alteration evidence and integrates those attributes with alteration facies, lithology, distance to fault, and orebody-derived PU labels. DSI and IK preserve the distinction between continuous spectral gradients and categorical alteration architecture, while the PU/FUSE framework combines complementary predictors without treating all unlabeled samples as confirmed barren. Spatial holdout validation and P-A analysis then evaluate model discrimination and guide target ranking. This sequence links subsurface spectral observations to ore-controlling geology in a form that remains spatially explicit and geologically testable.
International studies provide useful context for this workflow. Drill-core hyperspectral investigations have emphasized improved mineral mapping, real-time spectral processing, and deposit-scale mineral quantification from core observations [2,9,12]. Gold-focused SWIR studies at Qianchen, Tengjia, Jiaojia, and Jinwozi likewise show that absorption positions, crystallinity, and mineral assemblages are most informative when calibrated to deposit geology and alteration stage [13,14,15,16]. In mineral prospectivity mapping, the Rainy River study, positive–unlabeled modeling in the American Cordillera, and graph neural-network approaches illustrate the increasing use of spatially explicit and imbalanced-learning strategies [18,19,20]. Relative to these studies, the principal contribution of this study lies in the integrated sequence from drill-core SWIR-derived alteration evidence, through 3D modeling and geological constraints, to PU/FUSE modeling, spatial holdout validation, P-A analysis, and subsurface target ranking.
The FUSE model demonstrates the value of combining complementary deep evidence rather than relying on a single predictor. Within the positive–unlabeled learning framework, the model avoids treating all non-ore samples as true negatives, which is appropriate for mature districts where apparently barren intervals may still contain untested concealed potential. Positive–unlabeled learning is increasingly used in mineral prospectivity mapping because negative samples are difficult to define reliably and unlabeled data can still contribute useful information for model training [29,31]. In this study, FUSE achieved the best performance, with ROC AUC and PRAUC values of 0.8900 and 0.8926 under 1 km × 1 km spatial holdout validation. These results support the value of combining deep SWIR variables, alteration facies, and structural constraints for spatial prospectivity ranking.
Spatial holdout validation is particularly important for this type of modelling. Random validation can overestimate model performance when nearby training and validation samples are spatially autocorrelated. Blocked or spatial cross-validation is therefore better suited to evaluating prediction performance in new spatial domains [32,33]. Similarly, the P-A curve should be interpreted as a tool for reducing exploration search space, not as a boundary-detection method. Previous prospectivity studies have used prediction-area plots to evaluate evidential maps and prospectivity models in a data-driven way, but such thresholds remain screening criteria rather than deterministic orebody limits [34].
Accordingly, the FUSE output should be interpreted as a relative ranking of prospectivity. High-probability volumes identify spatial domains where multiple geological and alteration responses overlap, including alteration-facies transitions, local IC and pos2200 inflection zones, broader chlorite-related spectral variation, and proximity to ore-controlling structures. They do not represent orebody geometry directly. Maintaining this distinction is essential for avoiding overinterpretation of machine-learning outputs and for keeping the prospectivity model geologically testable.
5.3. Exploration Implications, Limitations, and Transferability
The exploration significance of this study lies in prioritizing deep verification targets in a mature gold district where shallow exploration space is increasingly limited. The three targets delineated from the FUSE probability volume represent different exploration scenarios. T1 spans elevations from approximately 200 to −250 m in the western domain and defines a relatively large, vertically extensive target along the outer margin and inferred down-dip continuation of the known orebody cluster. It is therefore a priority for testing marginal expansion and deep continuation of the known mineralized system. T2 occurs at elevations from approximately 100 to −50 m in the central domain and forms a compact, relatively isolated high-probability body. Its coherent three-dimensional geometry and comparatively limited drill control support its interpretation as a concealed target requiring denser verification. T3 occurs at elevations from approximately −50 to −100 m within an eastern belt of spatially aligned high-probability bodies. Although the predicted bodies are smaller and more discontinuous than those in the western domain, their belt-like arrangement defines a prospective trend that warrants further tracing along its three-dimensional extension.
These targets should be regarded as ranked exploration priorities rather than confirmed ore bodies. Higher-priority volumes are characterized by the coincidence of spatially continuous FUSE responses with favorable geological context, particularly alteration-facies transitions, ore-controlling structures, and local spectral gradients or inflection zones. Local IC minima or lower-IC zones and relatively lower pos2200 values may occur near mineralized intervals when compared with the surrounding alteration background, but neither represents a uniform deposit-scale threshold. The broader shift toward longer pos2250 wavelengths is more systematically expressed at the alteration-domain scale and is therefore interpreted as contextual evidence of Fe-Mg-bearing alteration architecture rather than a direct orebody discriminator. This interpretation is consistent with the strong structural control of Jiaodong gold mineralization by fault systems, structurally favorable dilation domains, and hydrothermal alteration along major ore-controlling structures [37,38,39,40].
Several sources of uncertainty should be considered. The 3D alteration models depend on drillhole spacing, uneven sampling density, the selected anisotropy, and the interpolation method; uncertainty therefore increases away from drill control and where directional continuity is weak [25,26,27,28]. SWIR attributes may also vary with spectral mixing, grain size, mineral abundance, weathering or core-surface condition, and overlap among carbonate- and chlorite-bearing absorption features [49,66]. These effects can influence mineral assignment, scalar extraction, alteration-facies classification, and the continuity of interpolated gradients. Such data- and workflow-related uncertainties can propagate into downstream prospectivity modeling and should therefore be considered when interpreting the final prediction results [17,22].
The PU/FUSE outputs carry a separate set of uncertainties. Unlabeled samples are not confirmed barren, repeated PU resampling introduces variability, and the constituent algorithms may respond differently to categorical and continuous evidence. The modeled values should therefore be interpreted as relative prospectivity rather than absolute occurrence probabilities. Similarly, T1–T3 are ranked exploration priorities, not confirmed ore bodies, and require independent drilling and mineralogical verification.
At the methodological level, the workflow can be transferred to other structurally controlled gold systems when four basic requirements are met: systematic drill-core SWIR coverage, reliable drillhole trajectories, a defensible geological and structural model, and known mineralization from which positive labels can be derived. Transferability does not imply numerical portability. Alteration-facies thresholds, PSI/CBI/PRI responses, and SWIR vector directions are deposit-specific and must be recalibrated against local mineral assemblages, structures, and mineralization. The Tudui–Shawang thresholds should therefore not be applied directly to another deposit.
Future work can improve spatial coverage, interpretability, and independent validation by combining drill-core observations with UAV hyperspectral imaging and underground or tunnel hyperspectral mapping [67,68], additional geophysical constraints, multi-element geochemistry, explainable-AI tools such as SHAP, formal propagation of interpolation and model uncertainty, and validation through new drilling. These additions are best viewed as extensions of the present subsurface workflow rather than prerequisites for interpreting the current results.
6. Conclusions
This study developed and tested a workflow for predicting deep concealed gold mineralization at the Tudui–Shawang deposit by integrating drill-core SWIR analysis, 3D alteration modeling, ore-controlling geological constraints, and spatially validated machine learning. The main conclusions are as follows:
(1) Drill-core SWIR data show that the alteration system is dominated by mica-, chlorite-, and carbonate-bearing assemblages that were organized into Phyllic, Propylitic, Carbonate, and Argillic–Smectite facies. The western, central, and eastern domains display a lateral transition from chlorite-rich assemblages, through mixed mica–chlorite–carbonate assemblages, to mica- and carbonate-rich assemblages.
(2) Individual SWIR attributes show weak deposit-scale relationships with Au grade. Local IC minima, relatively lower pos2200 values near several mineralized intervals, and alteration-facies transitions provide spatially relative evidence, whereas pos2250 shows a broader shift toward longer wavelengths at the alteration-domain scale. No single scalar or fixed threshold should therefore be used as a direct predictor of Au mineralization.
(3) The integration of 3D SWIR-derived alteration attributes, alteration facies, lithology, and distance to fault within the PU/FUSE framework produced the best-performing prospectivity model. Under 1 km × 1 km spatial holdout validation, FUSE achieved an ROC AUC of 0.8900 and a PRAUC of 0.8926.
(4) Prediction-area analysis and the 3D FUSE probability volume delineated three priority targets (T1–T3) representing marginal and deep extension of known mineralization, a comparatively isolated concealed target, and continuation of an eastern prospective belt. These targets are ranked exploration volumes rather than deterministic orebody boundaries.
Overall, the combination of drill-core SWIR-derived 3D alteration evidence, ore-controlling geology, and spatially validated machine learning provides a coherent basis for subsurface target prioritization in mature gold districts.
Author Contributions
Conceptualization, G.Z. and G.W.; methodology, G.Z. and G.W.; software, G.Z. and Q.P.; formal analysis, G.Z., Q.P. and Y.C. (Yuchang Chen); data curation, G.Z. and Y.C. (Yuchang Chen); visualization, Y.C. (Yuchang Chen); writing—original draft preparation, G.Z.; writing—review and editing, G.W., K.L. and Y.C. (Yi Cao). All authors have read and agreed to the published version of the manuscript.
Funding
This research was funded by the National Science and Technology Major Project, grant number 2024ZD1001900, and the Beijing Key Laboratory of Land and Resources Information Research and Development, grant number BJNRR2025-00.
Data Availability Statement
The data supporting the findings of this study are available from the corresponding author upon reasonable request. The data are not publicly available due to confidentiality restrictions associated with mine-scale geological and exploration data.
Acknowledgments
The authors thank Pengfei Zhao, Yuhan Guo, Ruimin Zhou, Jiahuan Wang, Yafei Pu and other group members for their help in this study.
Conflicts of Interest
The co-author Kun Liu is an employee of Shandong Provincial Geo-Mineral Engineering Group Co., Ltd. The paper reflects the views of the authors and not the company.
References
- Chen, H.Y.; Zhang, Y.; Zhang, S.T.; Xiao, B.; Zhao, J.F.; Zhao, H.T.; Hao, J.Y. Theories and applications of alteration mineral exploration methods: Current status and prospects. Geotecton. Metallog. 2026, 50, 1–14, (In Chinese with English abstract). [Google Scholar] [CrossRef]
- Contreras Acosta, I.C.; Khodadadzadeh, M.; Gloaguen, R. Resolution enhancement for drill-core hyperspectral mineral mapping. Remote Sens. 2021, 13, 2296. [Google Scholar] [CrossRef] [Scilit]
- Tang, N.; Qin, Z.P.; Li, Y.B.; Duo, J.; Ran, F.Q.; Dai, J.J. Mineralogical characteristics and short-wave infrared spectra of chlorite as indicators of hydrothermal centers: A case study of the giant porphyry copper-molybdenum deposit at Qulong, Tibet. Acta Geol. Sin.-Engl. Ed. 2022, 96, 490–505. [Google Scholar] [CrossRef] [Scilit]
- Ren, H.; Zheng, Y.Y.; Wu, S.; Zhang, X.; Ye, J.W.; Chen, X.D. Short-wavelength infrared characteristics and indications of exploration of the Demingding copper-molybdenum deposit in Tibet. Earth Sci. 2020, 45, 930–944, (In Chinese with English abstract). [Google Scholar] [CrossRef] [Scilit]
- Tian, C.H.; Yang, L.Q.; He, W.Y.; Zhang, S.Y.; Liu, S.T.; Wu, C. Characteristics of short wave infrared spectroscopy of sericite group minerals and their implications for exploration in the Yulong porphyry copper deposit, Tibet. Sediment. Geol. Tethyan Geol. 2022, 42, 40–49, (In Chinese with English abstract). [Google Scholar] [CrossRef]
- Wang, X.H.; Duan, S.G.; Sun, P.; Zhai, S.D.; Zhang, Y. Short-wave infrared spectroscopy analysis and prospecting indication of hydrothermal alteration of Waigang silver polymetallic deposit in Zhejiang, China. Miner. Depos. 2022, 41, 174–188, (In Chinese with English abstract). [Google Scholar] [CrossRef]
- Zhang, C.Y.; Zhou, Y.Q.; Zhang, Y.F.; Wu, J.; Zhang, S.W.; Mei, X.; Sun, J.D.; Wen, Z.L.; Liu, L. Alteration characteristics and exploration significance of the Huangjindong gold deposit in northeastern Hunan based on infrared spectroscopy. Geol. Rev. 2026, 72, 147–160, (In Chinese with English abstract). [Google Scholar] [CrossRef]
- Zeng, D.X.; Cheng, Y.S.; Wang, S.P.; Li, X.Y.; Yu, Z.J. Deep prospecting indication of infrared spectral characteristics of alteration minerals: A case study of the Banxi antimony deposit in Hunan Province. Bull. Mineral. Petrol. Geochem. 2026, 45, 1–17, (In Chinese with English abstract). [Google Scholar] [CrossRef] [Scilit]
- Thiele, S.T.; Kirsch, M.; Lorenz, S.; Saffi, H.; El Alami, S.; Contreras Acosta, I.C.; Madriz, Y.; Gloaguen, R. Maximising the value of hyperspectral drill core scanning through real-time processing and analysis. Front. Earth Sci. 2024, 12, 1433662. [Google Scholar] [CrossRef] [Scilit]
- Boiger, R.; Churakov, S.V.; Llagaria, I.B.; Kosakowski, G.; Wüst, R.; Prasianakis, N.I. Direct mineral content prediction from drill core images via transfer learning. Swiss J. Geosci. 2024, 117, 8. [Google Scholar] [CrossRef] [Scilit]
- Wu, C.Y.; Dai, J.J.; Song, Y.; Chen, W.; Liu, Z.B.; Liu, H.C.; Bai, L.Y. Study on core hyperspectral imaging and its exploration significance: A case study of the Bangpu large polymetallic deposit, Tibet. Spectrosc. Spectr. Anal. 2025, 45, 38–44, (In Chinese with English abstract). [Google Scholar]
- De La Rosa, R.; Khodadadzadeh, M.; Tusa, L.; Kirsch, M.; Gisbert, G.; Tornos, F.; Tolosana-Delgado, R.; Gloaguen, R. Mineral quantification at deposit scale using drill-core hyperspectral data: A case study in the Iberian Pyrite Belt. Ore Geol. Rev. 2021, 139, 104514. [Google Scholar] [CrossRef] [Scilit]
- Zhao, H.; Zhang, Y.; Xu, Y.; Shao, Y.; Chen, X.; Hao, J.; Zhao, L.; Shen, H.; Wang, X. Machine learning model for deep exploration: Utilizing short wavelength infrared (SWIR) of hydrothermal alteration minerals in the Qianchen gold deposit, Jiaodong Peninsula, Eastern China. Ore Geol. Rev. 2024, 168, 106060. [Google Scholar] [CrossRef] [Scilit]
- Hao, J.; Duan, L.; Zhang, Y.; Zhao, H.; Shao, Y.; Guo, Y.; Wang, X.; Song, S. Machine learning on white mica short-wave infrared (SWIR) spectral data in the Tengjia Au deposit, Jiaodong peninsula (Eastern China): A prospecting indicator for lode gold deposits. Ore Geol. Rev. 2024, 173, 106230. [Google Scholar] [CrossRef] [Scilit]
- Wang, H.; Zhang, J.; Ding, Z.; Zhang, Q.; Zhao, J. Short wavelength infrared (SWIR) of white micas as a vectoring exploration tool for the Jiaojia gold deposit, Jiaodong Peninsula: Implications for district- to deposit-scale gold exploration. Ore Geol. Rev. 2025, 181, 106626. [Google Scholar] [CrossRef] [Scilit]
- Wang, Y.; Xiao, B.; Wang, Y.; Zhao, J.; Wang, H.; Cao, G. Hydrothermal alteration and shortwave infrared (SWIR) spectroscopy exploration of the Jinwozi gold deposit in the Beishan Orogenic Belt, NW China. Ore Geol. Rev. 2025, 185, 106820. [Google Scholar] [CrossRef] [Scilit]
- Daviran, M.; Parsa, M.; Maghsoudi, A.; Ghezelbash, R. Quantifying uncertainties linked to the diversity of mathematical frameworks in knowledge-driven mineral prospectivity mapping. Nat. Resour. Res. 2022, 31, 2271–2287. [Google Scholar] [CrossRef] [Scilit]
- Behnia, P.; Harris, J.; Sherlock, R.; Naghizadeh, M.; Vayavur, R. Mineral prospectivity mapping for orogenic gold mineralization in the Rainy River area, Wabigoon Subprovince. Minerals 2023, 13, 1267. [Google Scholar] [CrossRef] [Scilit]
- Alfonso, C.P.; Müller, R.D.; Mather, B.; Anthony, M. Spatio-temporal copper prospectivity in the American Cordillera predicted by positive-unlabeled machine learning. GSA Bull. 2025, 137, 702–716. [Google Scholar] [CrossRef] [Scilit]
- Sihombing, F.M.H.; Palin, R.M.; Hughes, H.S.R.; Robb, L.J. Improved mineral prospectivity mapping using graph neural networks. Ore Geol. Rev. 2024, 172, 106215. [Google Scholar] [CrossRef] [Scilit]
- Nagasingha, L.M.A.; Berubé, C.L.; Lawley, C.J.M. A balanced mineral prospectivity model of Canadian magmatic Ni (± Cu ± Co ± PGE) sulphide mineral systems using conditional variational autoencoders. Ore Geol. Rev. 2024, 175, 106329. [Google Scholar] [CrossRef] [Scilit]
- Zhang, S.E.; Lawley, C.J.M.; Bourdeau, J.E.; Nwaila, G.T.; Ghorbani, Y. Workflow-induced uncertainty in data-driven mineral prospectivity mapping. Nat. Resour. Res. 2024, 33, 995–1023. [Google Scholar] [CrossRef] [Scilit]
- Mantilla-Dulcey, A.; Goyes-Peñafiel, P.; Báez-Rodríguez, R.; Khurama, S. Porphyry-type mineral prospectivity mapping with imbalanced data via prior geological transfer learning. Gondwana Res. 2024, 136, 236–250. [Google Scholar] [CrossRef] [Scilit]
- Sabbaghi, H.; Tabatabaei, S.H.; Fathianpour, N. Geologically constrained GANomaly network for mineral prospectivity mapping through frequency-domain training data. Sci. Rep. 2024, 14, 6236. [Google Scholar] [CrossRef] [Scilit] [PubMed]
- Mallet, J.-L. Discrete smooth interpolation. ACM Trans. Graph. 1989, 8, 121–144. [Google Scholar] [CrossRef] [Scilit]
- Journel, A.G. Nonparametric estimation of spatial distributions. Math. Geol. 1983, 15, 445–468. [Google Scholar] [CrossRef] [Scilit]
- Li, B.; Peng, Y.; Zhao, X.; Liu, X.; Wang, G.; Jiang, H.; Wang, H.; Yang, Z. Combining 3D geological modeling and 3D spectral modeling for deep mineral exploration in the Zhaoxian Gold Deposit, Shandong Province, China. Minerals 2022, 12, 1272. [Google Scholar] [CrossRef] [Scilit]
- Liu, X.; Wang, G.; Lv, J.; Peng, Y.; Zhao, X. Three-dimensional modeling and geostatistical structural analysis for ore deposit prospecting trend and wisdom mining: A case study in the Jiaoxibei gold field, China. Front. Earth Sci. 2024, 12, 1217016. [Google Scholar] [CrossRef] [Scilit]
- Xiong, Y.; Zuo, R. A positive and unlabeled learning algorithm for mineral prospectivity mapping. Comput. Geosci. 2021, 147, 104667. [Google Scholar] [CrossRef] [Scilit]
- Hajihosseinlou, M.; Maghsoudi, A.; Ghezelbash, R. A semi-supervised approach for mineral prospectivity mapping via weighted positive-unlabeled learning and tree-structured Parzen estimator for hyperparameter optimization. Ore Geol. Rev. 2025, 185, 106783. [Google Scholar] [CrossRef] [Scilit]
- Zhang, Z.; Wang, G.; Liu, C.; Cheng, L.; Sha, D. Bagging-based positive-unlabeled learning algorithm with Bayesian hyperparameter optimization for three-dimensional mineral potential mapping. Comput. Geosci. 2021, 154, 104817. [Google Scholar] [CrossRef] [Scilit]
- Roberts, D.R.; Bahn, V.; Ciuti, S.; Boyce, M.S.; Elith, J.; Guillera-Arroita, G.; Hauenstein, S.; Lahoz-Monfort, J.J.; Schroeder, B.; Thuiller, W.; et al. Cross-validation strategies for data with temporal, spatial, hierarchical, or phylogenetic structure. Ecography 2017, 40, 913–929. [Google Scholar] [CrossRef] [Scilit]
- Ploton, P.; Mortier, F.; Rejou-Mechain, M.; Barbier, N.; Picard, N.; Rossi, V.; Dormann, C.; Cornu, G.; Viennois, G.; Bayol, N.; et al. Spatial validation reveals poor predictive performance of large-scale ecological mapping models. Nat. Commun. 2020, 11, 4540. [Google Scholar] [CrossRef] [Scilit] [PubMed]
- Yousefi, M.; Carranza, E.J.M. Prediction-area (P-A) plot and C-A fractal analysis to classify and evaluate evidential maps for mineral prospectivity modeling. Comput. Geosci. 2015, 79, 69–81. [Google Scholar] [CrossRef] [Scilit]
- Groves, D.I.; Santosh, M. The giant Jiaodong gold province: The key to a unified model for orogenic gold deposits? Geosci. Front. 2016, 7, 409–417. [Google Scholar] [CrossRef] [Scilit]
- Qiu, Y.M.; Groves, D.I.; McNaughton, N.J.; Wang, L.J.; Zhou, T.H. Nature, age, and tectonic setting of granitoid-hosted, orogenic gold deposits of the Jiaodong Peninsula, eastern North China Craton, China. Miner. Depos. 2002, 37, 283–305. [Google Scholar] [CrossRef] [Scilit]
- Goldfarb, R.J.; Santosh, M. The dilemma of the Jiaodong gold deposits: Are they unique? Geosci. Front. 2014, 5, 139–153. [Google Scholar] [CrossRef] [Scilit]
- Deng, J.; Yang, L.Q.; Groves, D.I.; Zhang, L.; Qiu, K.F.; Wang, Q.F. An integrated mineral system model for the gold deposits of the giant Jiaodong province, eastern China. Earth-Sci. Rev. 2020, 208, 103274. [Google Scholar] [CrossRef] [Scilit]
- Song, M.C.; Li, S.Z.; Santosh, M.; Zhao, S.J.; Yu, S.; Yi, P.H.; Cui, S.X.; Lv, G.X.; Xu, J.X.; Song, Y.X.; et al. Types, characteristics and metallogenesis of gold deposits in the Jiaodong Peninsula, Eastern North China Craton. Ore Geol. Rev. 2015, 65, 612–625. [Google Scholar] [CrossRef] [Scilit]
- Qiu, K.F.; Goldfarb, R.J.; Deng, J.; Yu, H.C.; Gou, Z.Y.; Ding, Z.J.; Wang, Z.K.; Li, D.P. Gold deposits of the Jiaodong Peninsula, eastern China. In Geology of the World Major Gold Deposits and Provinces; Sillitoe, R.H., Goldfarb, R.J., Robert, F., Simmons, S.F., Eds.; Society of Economic Geologists: Littleton, CO, USA, 2020; Volume 23, pp. 753–774. [Google Scholar] [CrossRef] [Scilit]
- Cheng, N.; Hou, Q.; Shi, M.; He, M.; Liu, Q.; Yan, F.; Liu, H. New insight into the genetic mechanism of shear zone type gold deposits from Muping-Rushan Metallogenic Belt (Jiaodong Peninsula of Eastern China). Minerals 2019, 9, 775. [Google Scholar] [CrossRef] [Scilit]
- Tan, J.; Wei, J.H.; Li, Y.J.; Fu, L.B.; Li, H.M.; Shi, W.J.; Tian, N. Origin and geodynamic significance of fault-hosted massive sulfide gold deposits from the Guocheng-Liaoshang metallogenic belt, eastern Jiaodong Peninsula: Rb-Sr dating, and H-O-S-Pb isotopic constraints. Ore Geol. Rev. 2015, 65, 687–700. [Google Scholar] [CrossRef] [Scilit]
- Liu, X.Y.; Tan, J.; He, H.Y.; Gan, J.R. Origin of the Tudui-Shawang gold deposit, Jiaodong Peninsula, North China Craton: Constraints from fluid inclusion and H-O-He-Ar-S-Pb isotopic compositions. Ore Geol. Rev. 2021, 133, 104125. [Google Scholar] [CrossRef] [Scilit]
- Fang, Y.; Yang, Q.; Peng, X.; Wang, B.; Li, C.; Li, H.; Chen, S. Source of ore-forming materials and chronology of ore-bearing monzo-granite in the Tudui-Shawang gold deposit, Shandong Province. Gold Sci. Technol. 2025, 33, 467–481. [Google Scholar] [CrossRef]
- Chen, Y.; Li, H.; Gu, S.; Whattam, S.A.; Song, M.; Hu, B.; Duan, L.; Zheng, C.; Wu, B. The Xilaokou carbonate-sulfide vein type gold deposit: A distinct mineralization in the giant Jiaodong gold province, North China. Ore Geol. Rev. 2024, 173, 106232. [Google Scholar] [CrossRef] [Scilit]
- Groves, D.I.; Goldfarb, R.J.; Gebre-Mariam, M.; Hagemann, S.G.; Robert, F. Orogenic gold deposits: A proposed classification in the context of their crustal distribution and relationship to other gold deposit types. Ore Geol. Rev. 1998, 13, 7–27. [Google Scholar] [CrossRef] [Scilit]
- DZ/T 0130.3-2006; The Specification of Testing Quality Management for Geological Laboratories—Part 3: Chemical Components Analysis of Rock and Mineral Samples. Ministry of Land and Resources of the People’s Republic of China: Beijing, China, 2006.
- Gaffey, S.J. Spectral reflectance of carbonate minerals in the visible and near infrared (0.35–2.55 microns): Calcite, aragonite, and dolomite. Am. Mineral. 1986, 71, 151–162. [Google Scholar]
- Zaini, N.; Van der Meer, F.; Van der Werff, H. Effect of Grain Size and Mineral Mixing on Carbonate Absorption Features in the SWIR and TIR Wavelength Regions. Remote Sens. 2012, 4, 987–1003. [Google Scholar] [CrossRef] [Scilit]
- Kurz, T.H.; Miguel, G.S.; Dubucq, D.; Kenter, J.; Miegebielle, V.; Buckley, S.J. Quantitative mapping of dolomitization using close-range hyperspectral imaging: Kimmeridgian carbonate ramp, Alacón, NE Spain. Geosphere 2022, 18, 780–799. [Google Scholar] [CrossRef] [Scilit]
- Prokhorenkova, L.; Gusev, G.; Vorobev, A.; Dorogush, A.V.; Gulin, A. CatBoost: Unbiased boosting with categorical features. In Advances in Neural Information Processing Systems; Curran Associates, Inc.: Red Hook, NY, USA, 2018; Volume 31, pp. 6638–6648. [Google Scholar]
- Ke, G.; Meng, Q.; Finley, T.; Wang, T.; Chen, W.; Ma, W.; Ye, Q.; Liu, T.-Y. LightGBM: A highly efficient gradient boosting decision tree. In Advances in Neural Information Processing Systems; Curran Associates, Inc.: Red Hook, NY, USA, 2017; Volume 30, pp. 3146–3154. [Google Scholar]
- Chen, T.; Guestrin, C. XGBoost: A scalable tree boosting system. In Proceedings of the 22nd ACM SIGKDD International Conference on Knowledge Discovery and Data Mining; ACM: New York, NY, USA, 2016; pp. 785–794. [Google Scholar] [CrossRef] [Scilit]
- Breiman, L. Random forests. Mach. Learn. 2001, 45, 5–32. [Google Scholar] [CrossRef] [Scilit]
- Spearman, C. The proof and measurement of association between two things. Am. J. Psychol. 1904, 15, 72–101. [Google Scholar] [CrossRef] [Scilit] [PubMed]
- Mann, H.B.; Whitney, D.R. On a test of whether one of two random variables is stochastically larger than the other. Ann. Math. Stat. 1947, 18, 50–60. [Google Scholar] [CrossRef] [Scilit]
- Cliff, N. Dominance statistics: Ordinal analyses to answer ordinal questions. Psychol. Bull. 1993, 114, 494–509. [Google Scholar] [CrossRef]
- Meissel, K.; Yao, E.S. Using Cliff’s delta as a non-parametric effect size measure: An accessible web app and R tutorial. Pract. Assess. Res. Eval. 2024, 29, 2. [Google Scholar] [CrossRef]
- Li, H.; Wang, Q.; Yang, L.; Dong, C.; Weng, W.; Deng, J. Alteration and mineralization patterns in orogenic gold deposits: Constraints from deposit observation and thermodynamic modeling. Chem. Geol. 2022, 607, 121012. [Google Scholar] [CrossRef] [Scilit]
- Mao, X.; Chen, Y.; Liu, Z.; Yang, X.; Li, S.; Wang, D.; Chen, G. Hydrothermal alteration and its geochemistry of the Xiadian gold deposit, Jiaodong Peninsula, China: Implications for fluid-rock interaction processes and mineral exploration. Ore Geol. Rev. 2024, 170, 106134. [Google Scholar] [CrossRef] [Scilit]
- Hu, H.; Liu, S.; Fan, H.R.; Yang, K.; Zuo, Y.; Cai, Y. Structural networks constraints on alteration and mineralization processes in the Jiaojia Gold Deposit, Jiaodong Peninsula, China. J. Earth Sci. 2020, 31, 500–513. [Google Scholar] [CrossRef] [Scilit]
- Fan, H.R.; Zhai, M.G.; Xie, Y.H.; Yang, J.H. Ore-forming fluids associated with granite-hosted gold mineralization at the Sanshandao deposit, Jiaodong gold province, China. Miner. Depos. 2003, 38, 739–750. [Google Scholar] [CrossRef] [Scilit]
- Li, X.C.; Fan, H.R.; Santosh, M.; Hu, F.F.; Yang, K.F.; Lan, T.G. Hydrothermal alteration associated with Mesozoic granite-hosted gold mineralization at the Sanshandao deposit, Jiaodong Gold Province, China. Ore Geol. Rev. 2013, 53, 403–421. [Google Scholar] [CrossRef] [Scilit]
- Zhao, Z.; Liang, X.; Luo, K.; Tang, N.; Liu, G.; Qing, M.; Zhao, X.; Shen, J. Short-wave infrared (SWIR) characteristics and exploration indicators of the Bangpu porphyry Mo-Cu deposit in the eastern Gangdese metallogenic Belt, Tibet. Ore Geol. Rev. 2025, 184, 106747. [Google Scholar] [CrossRef] [Scilit]
- Yao, Y.; Zhu, Y.; Liu, J.; Li, W. Footprints of ore fluid pathway and implications to mineral exploration in the Shihu Gold Deposit, North China: Evidence from short wave infrared spectroscopy of illitic alteration rocks. J. Geochem. Explor. 2021, 229, 106833. [Google Scholar] [CrossRef] [Scilit]
- Bi, R.; Wang, F.; Zhao, J.; Zhang, K.; Wu, J.; Liu, Y.; Guo, Y. Study of Short-Wave Infrared spectroscopy (SWIR) on hydrothermal chlorite in the Tongshan porphyry Cu-Mo deposit, Heilongjiang. Ore Geol. Rev. 2025, 186, 106775. [Google Scholar] [CrossRef] [Scilit]
- Baik, H.; Son, Y.S.; Kim, K.E. A tunnel coaxial 3D hyperspectral scanning system for underground mine investigation. Sci. Rep. 2023, 13, 10417. [Google Scholar] [CrossRef] [Scilit] [PubMed]
- Koerting, F.; Asadzadeh, S.; Hildebrand, J.C.; Savinova, E.; Kouzeli, E.; Nikolakopoulos, K.; Lindblom, D.; Koellner, N.; Buckley, S.J.; Lehman, M.; et al. VNIR-SWIR imaging spectroscopy for mining: Insights for hyperspectral drone applications. Mining 2024, 4, 1013–1057. [Google Scholar] [CrossRef] [Scilit]
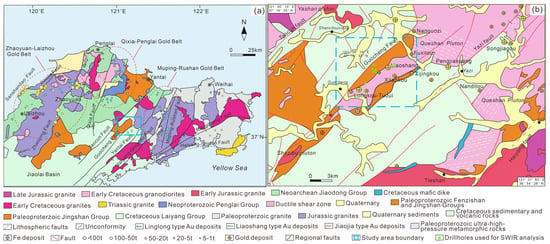
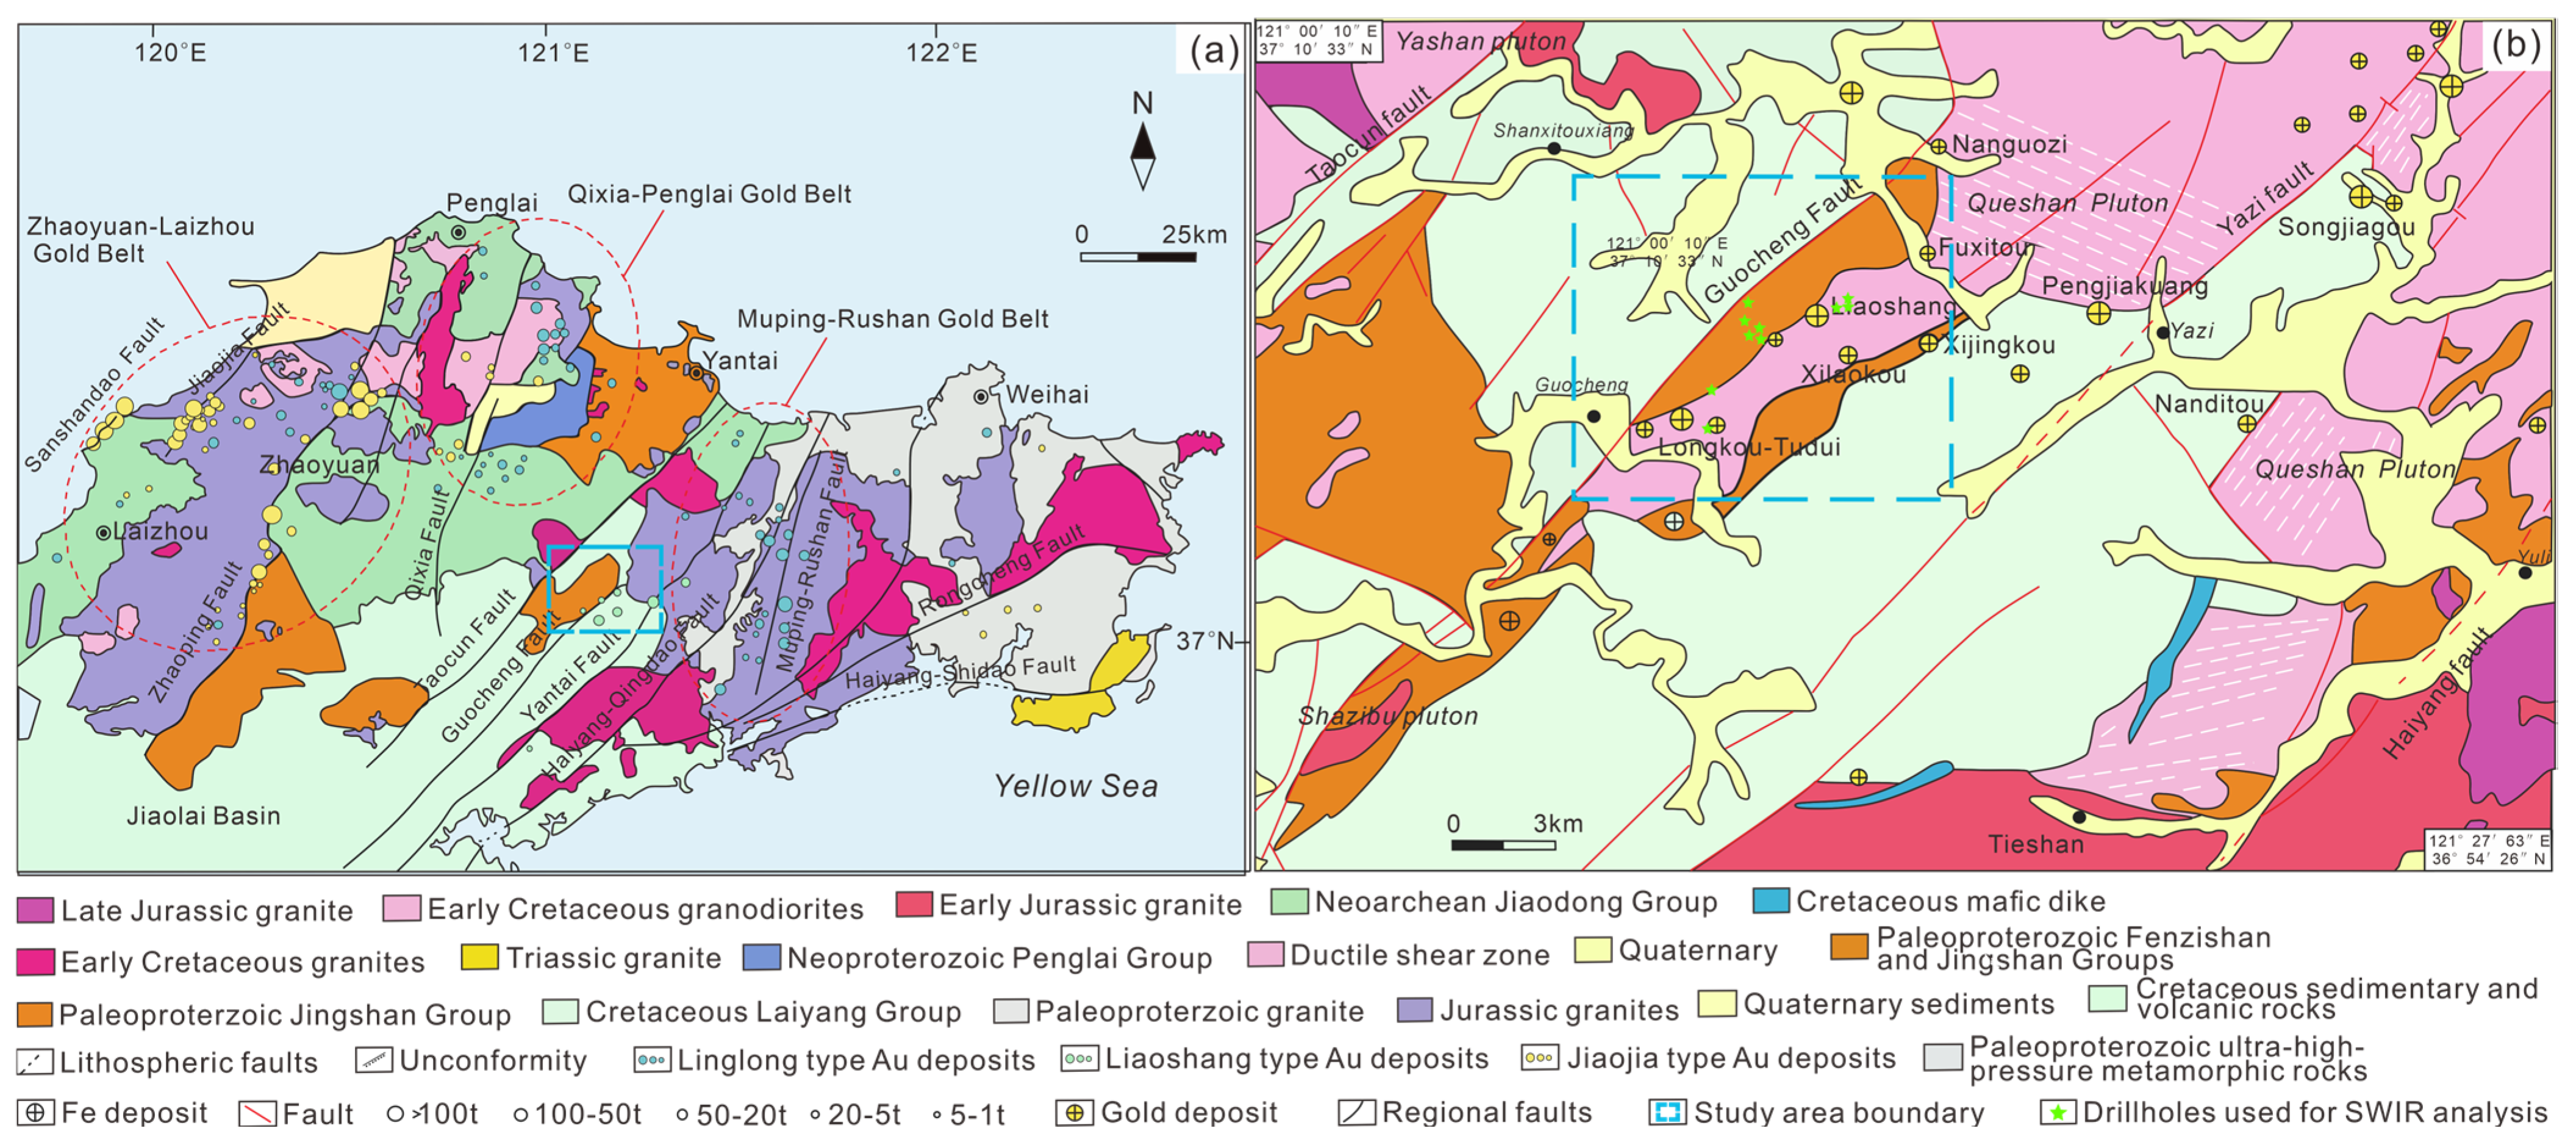
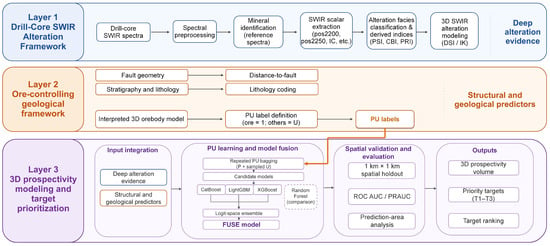
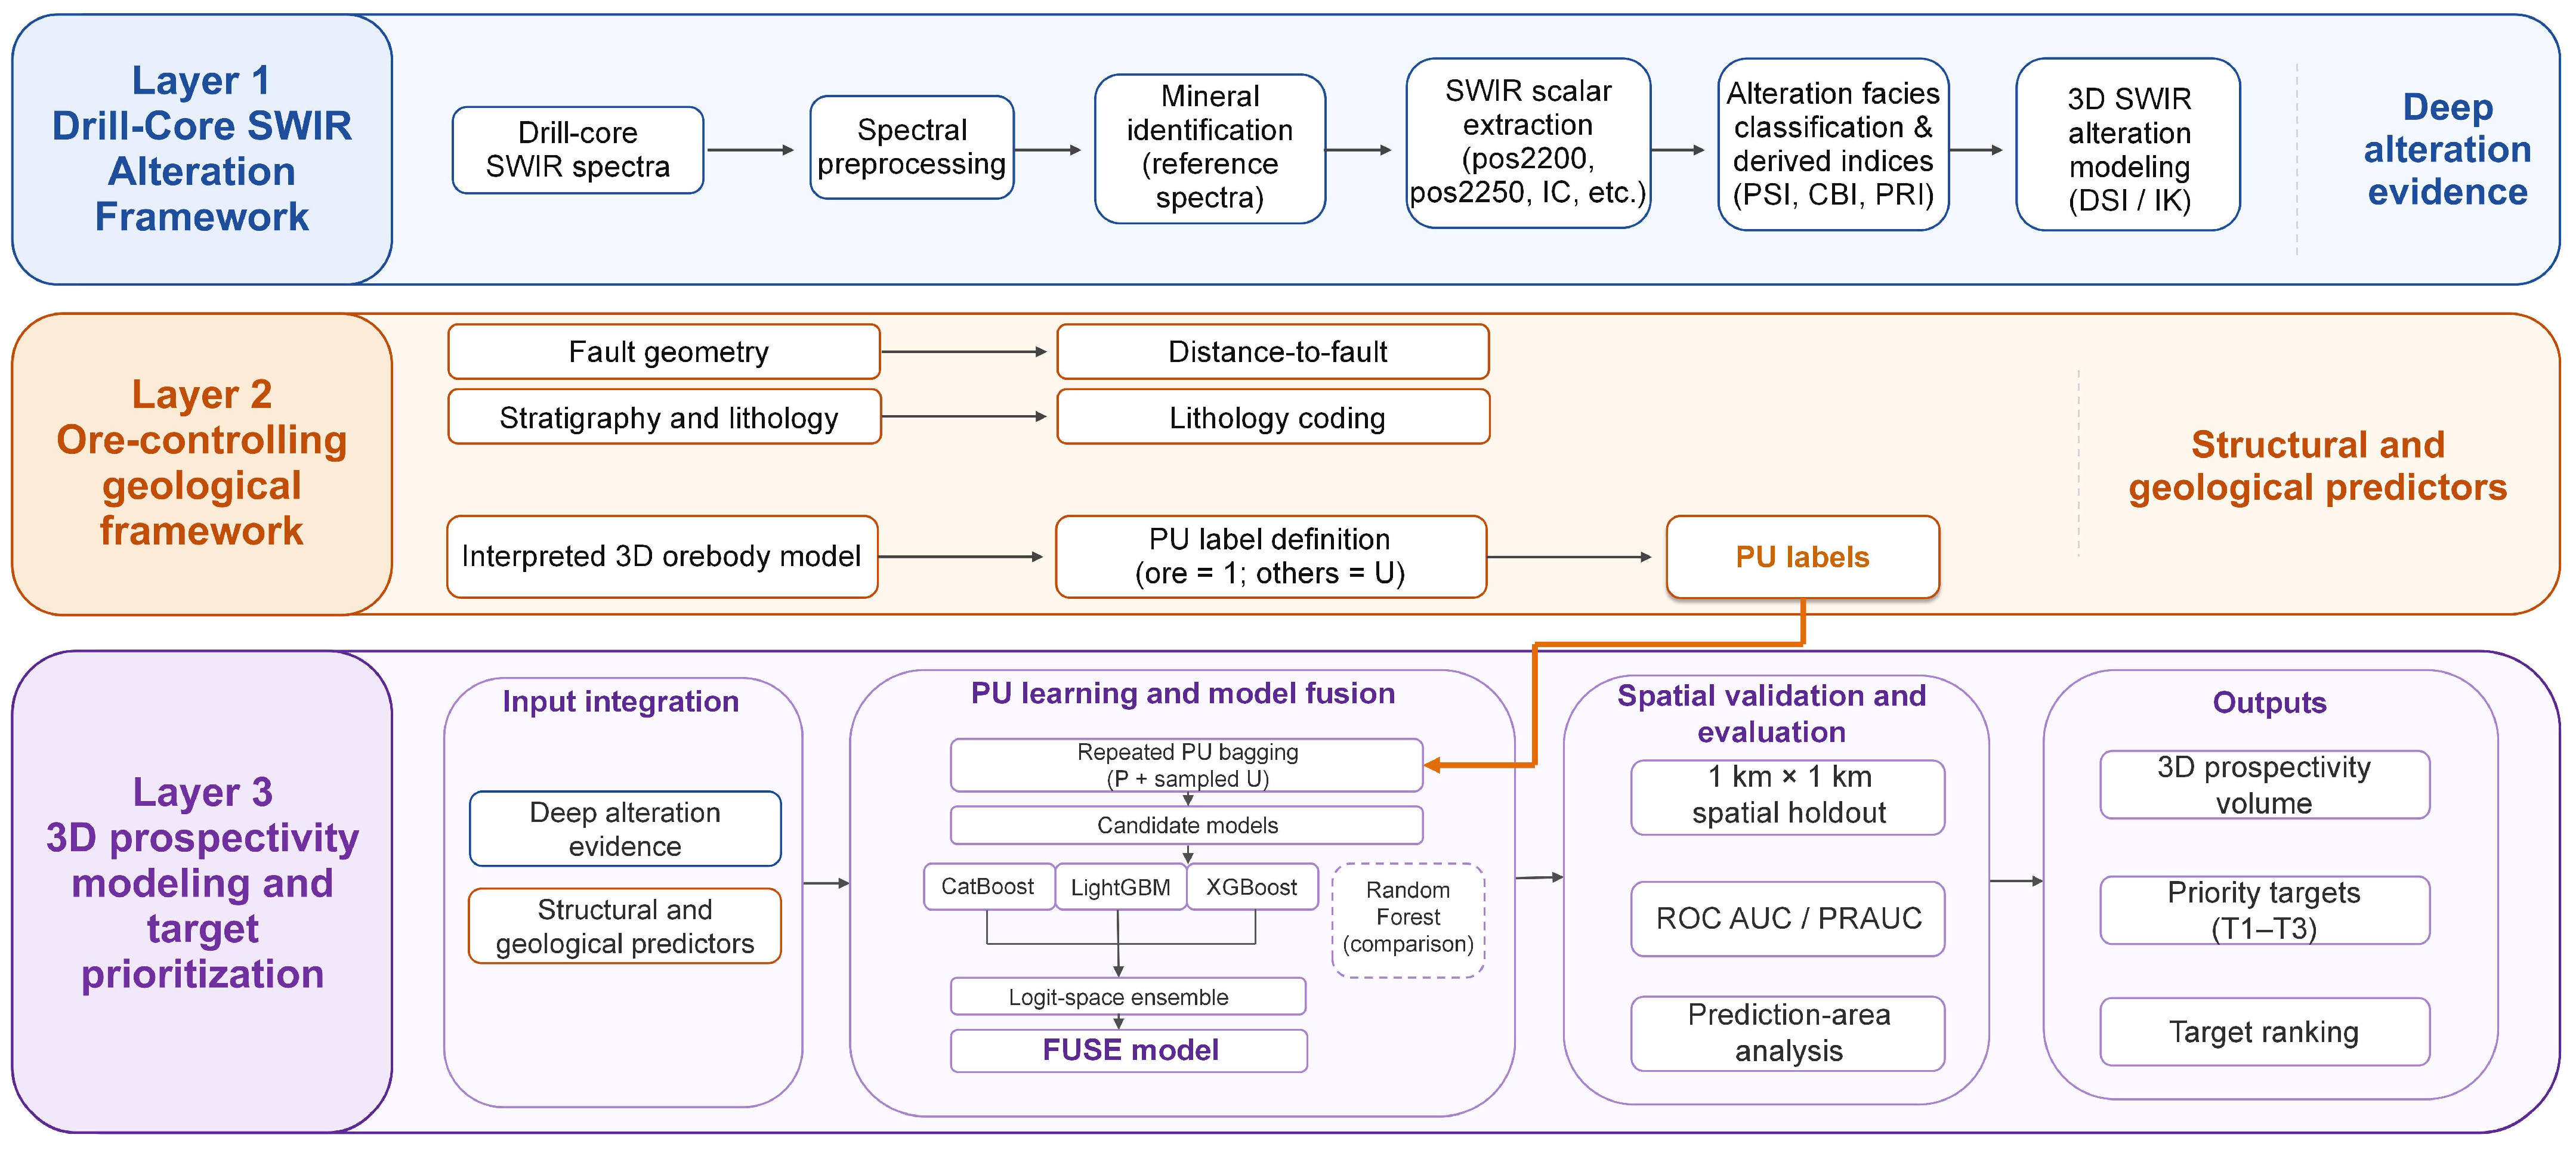
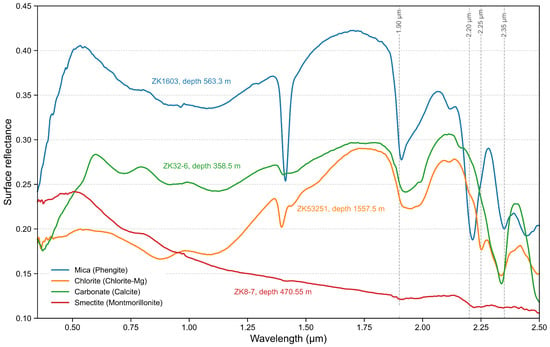
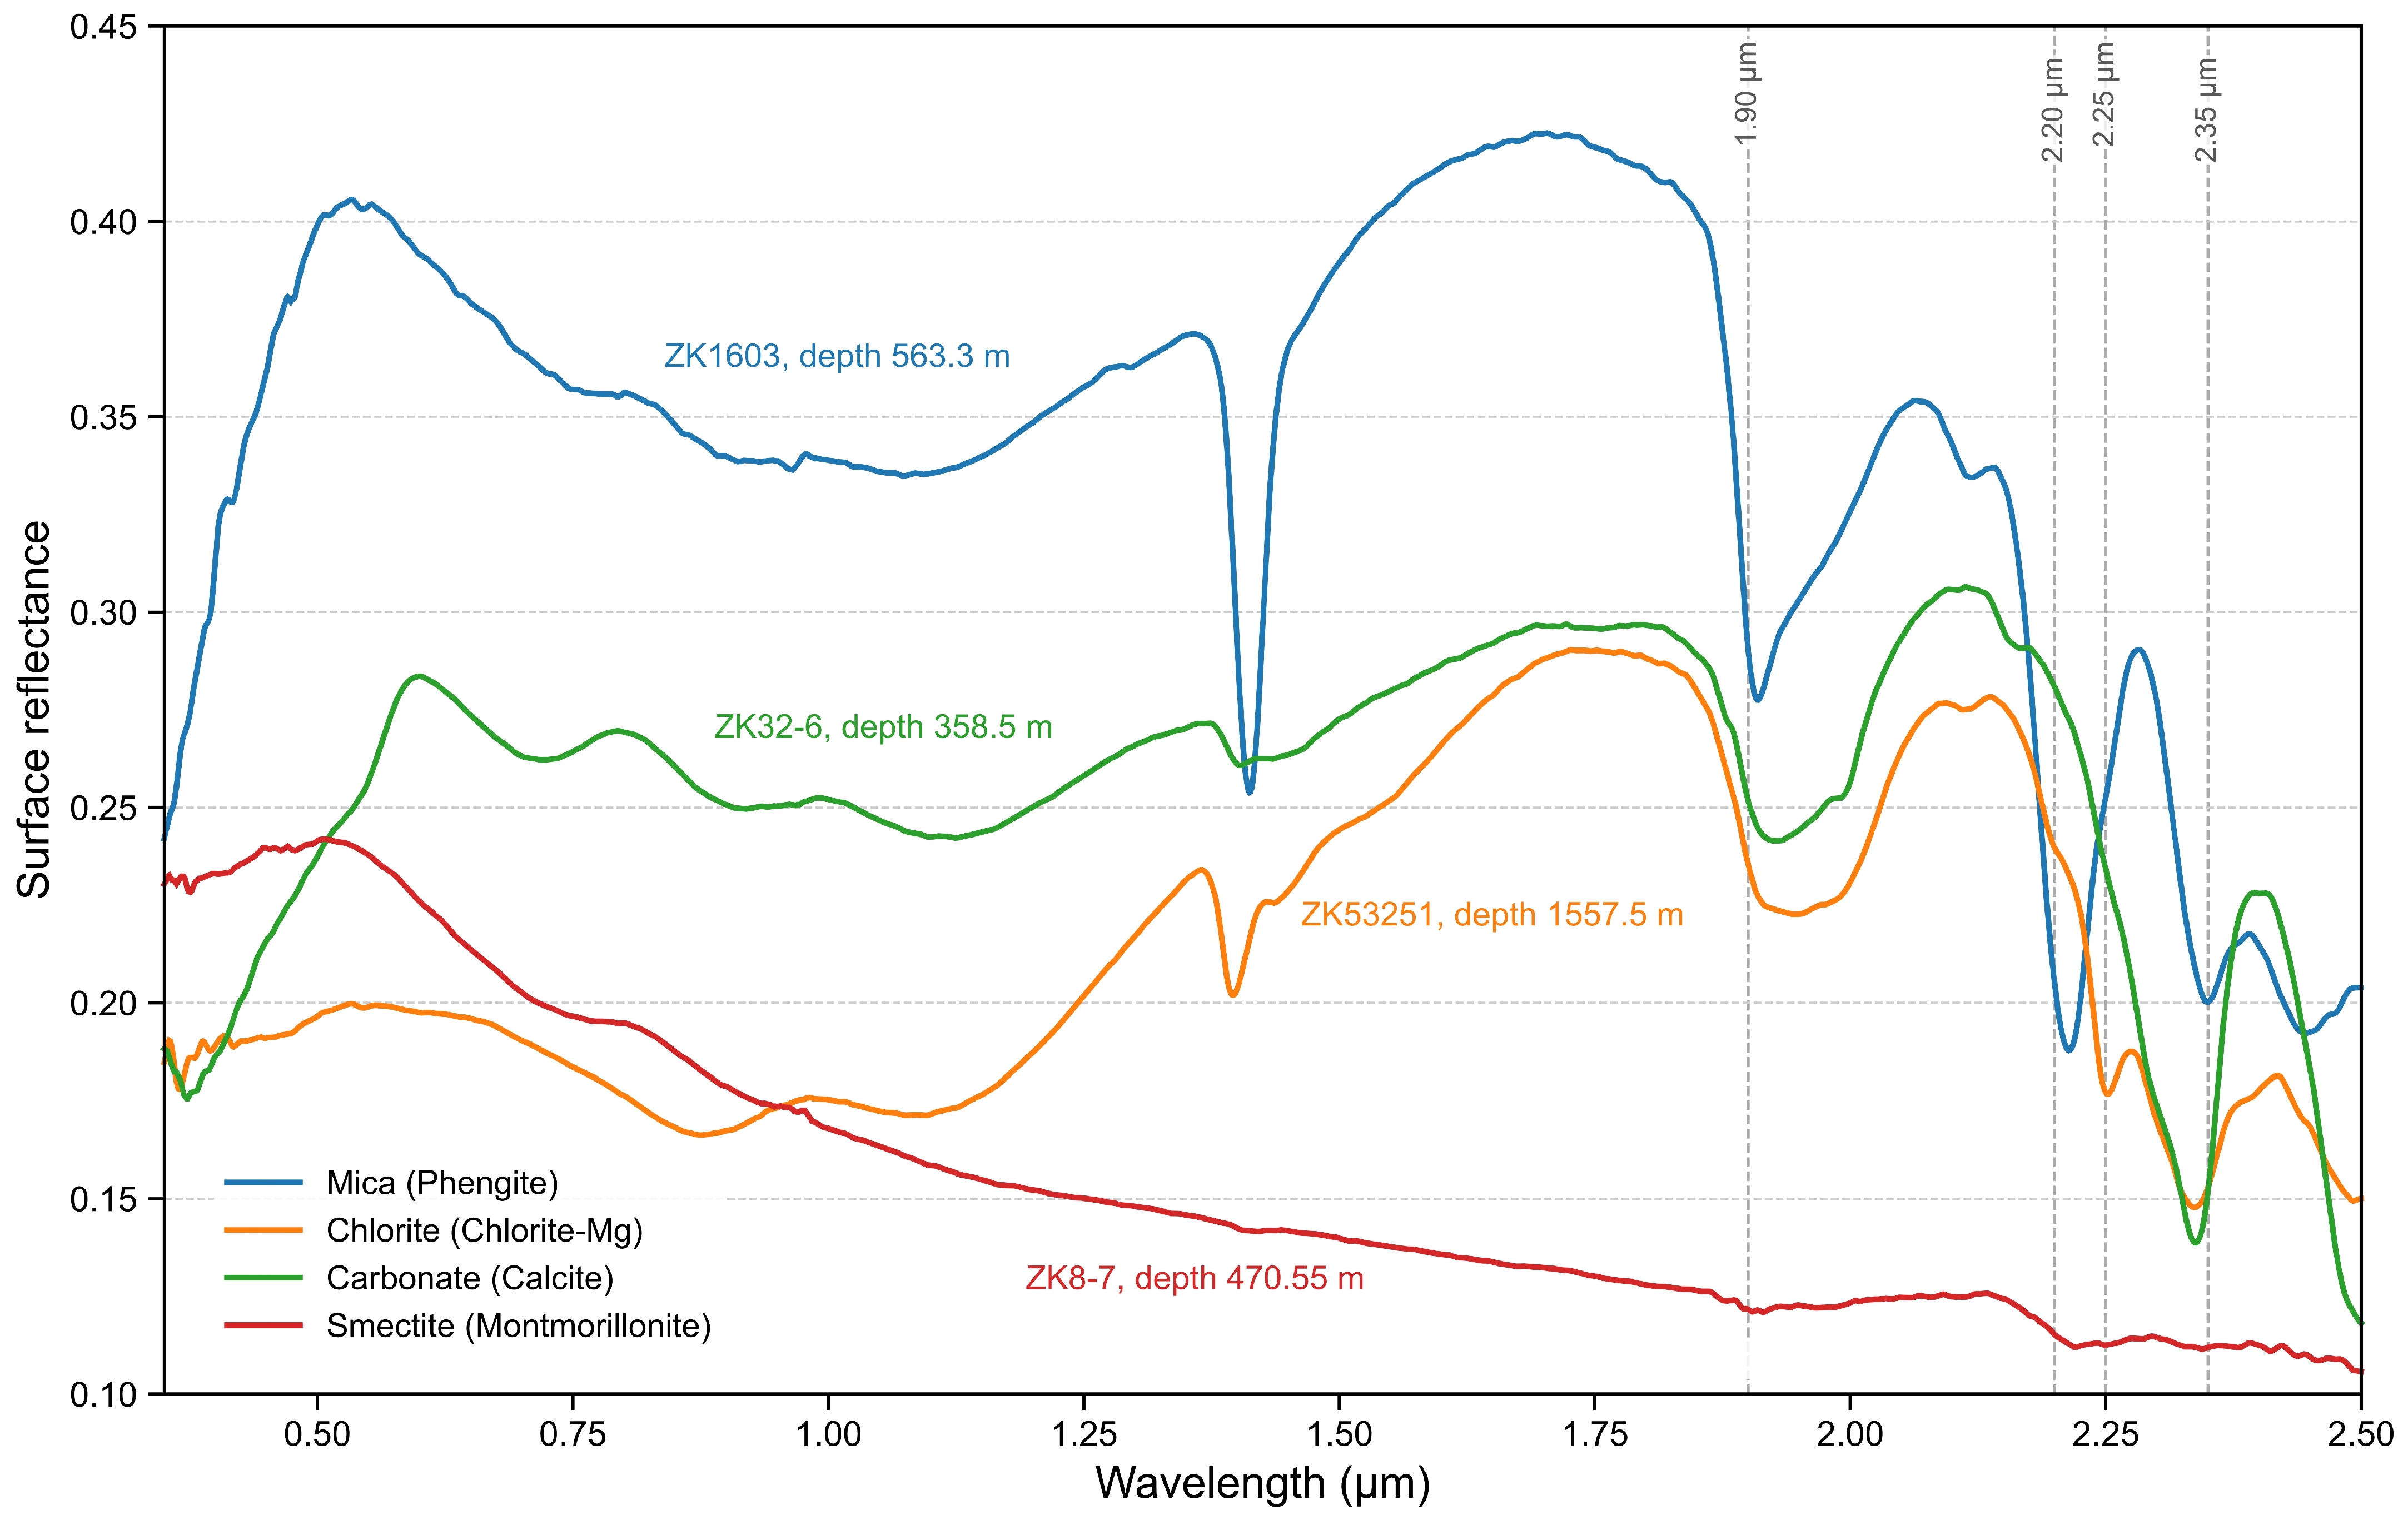
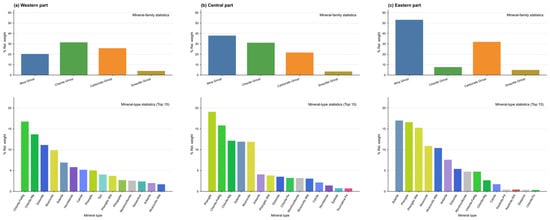
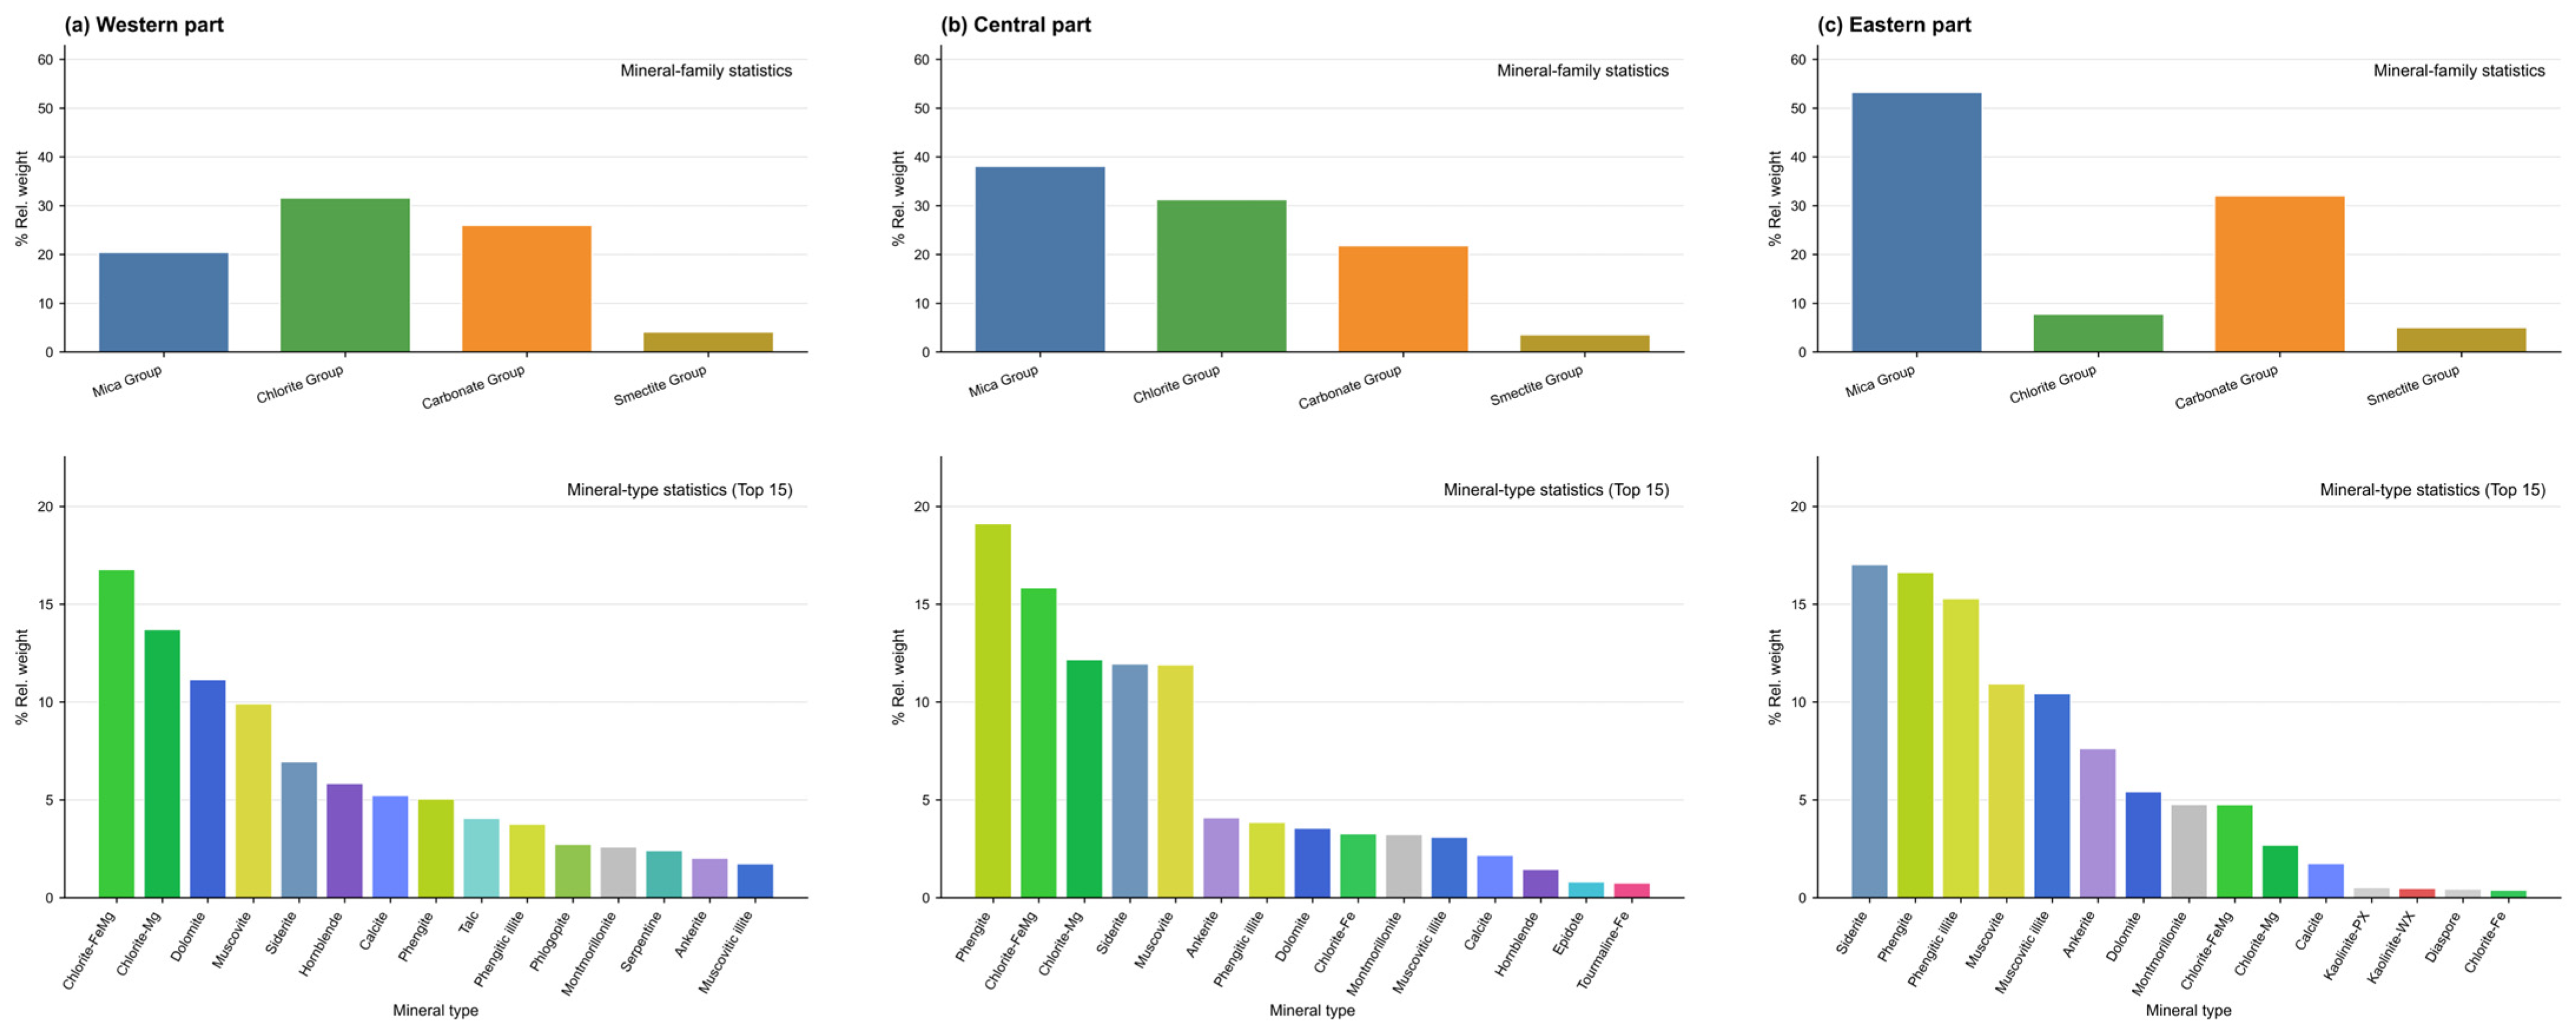
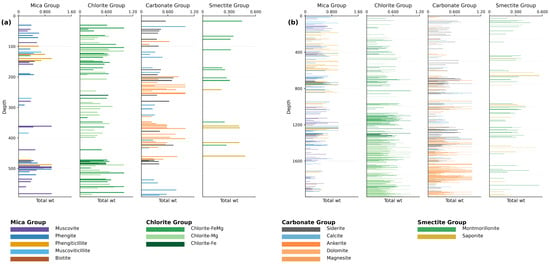
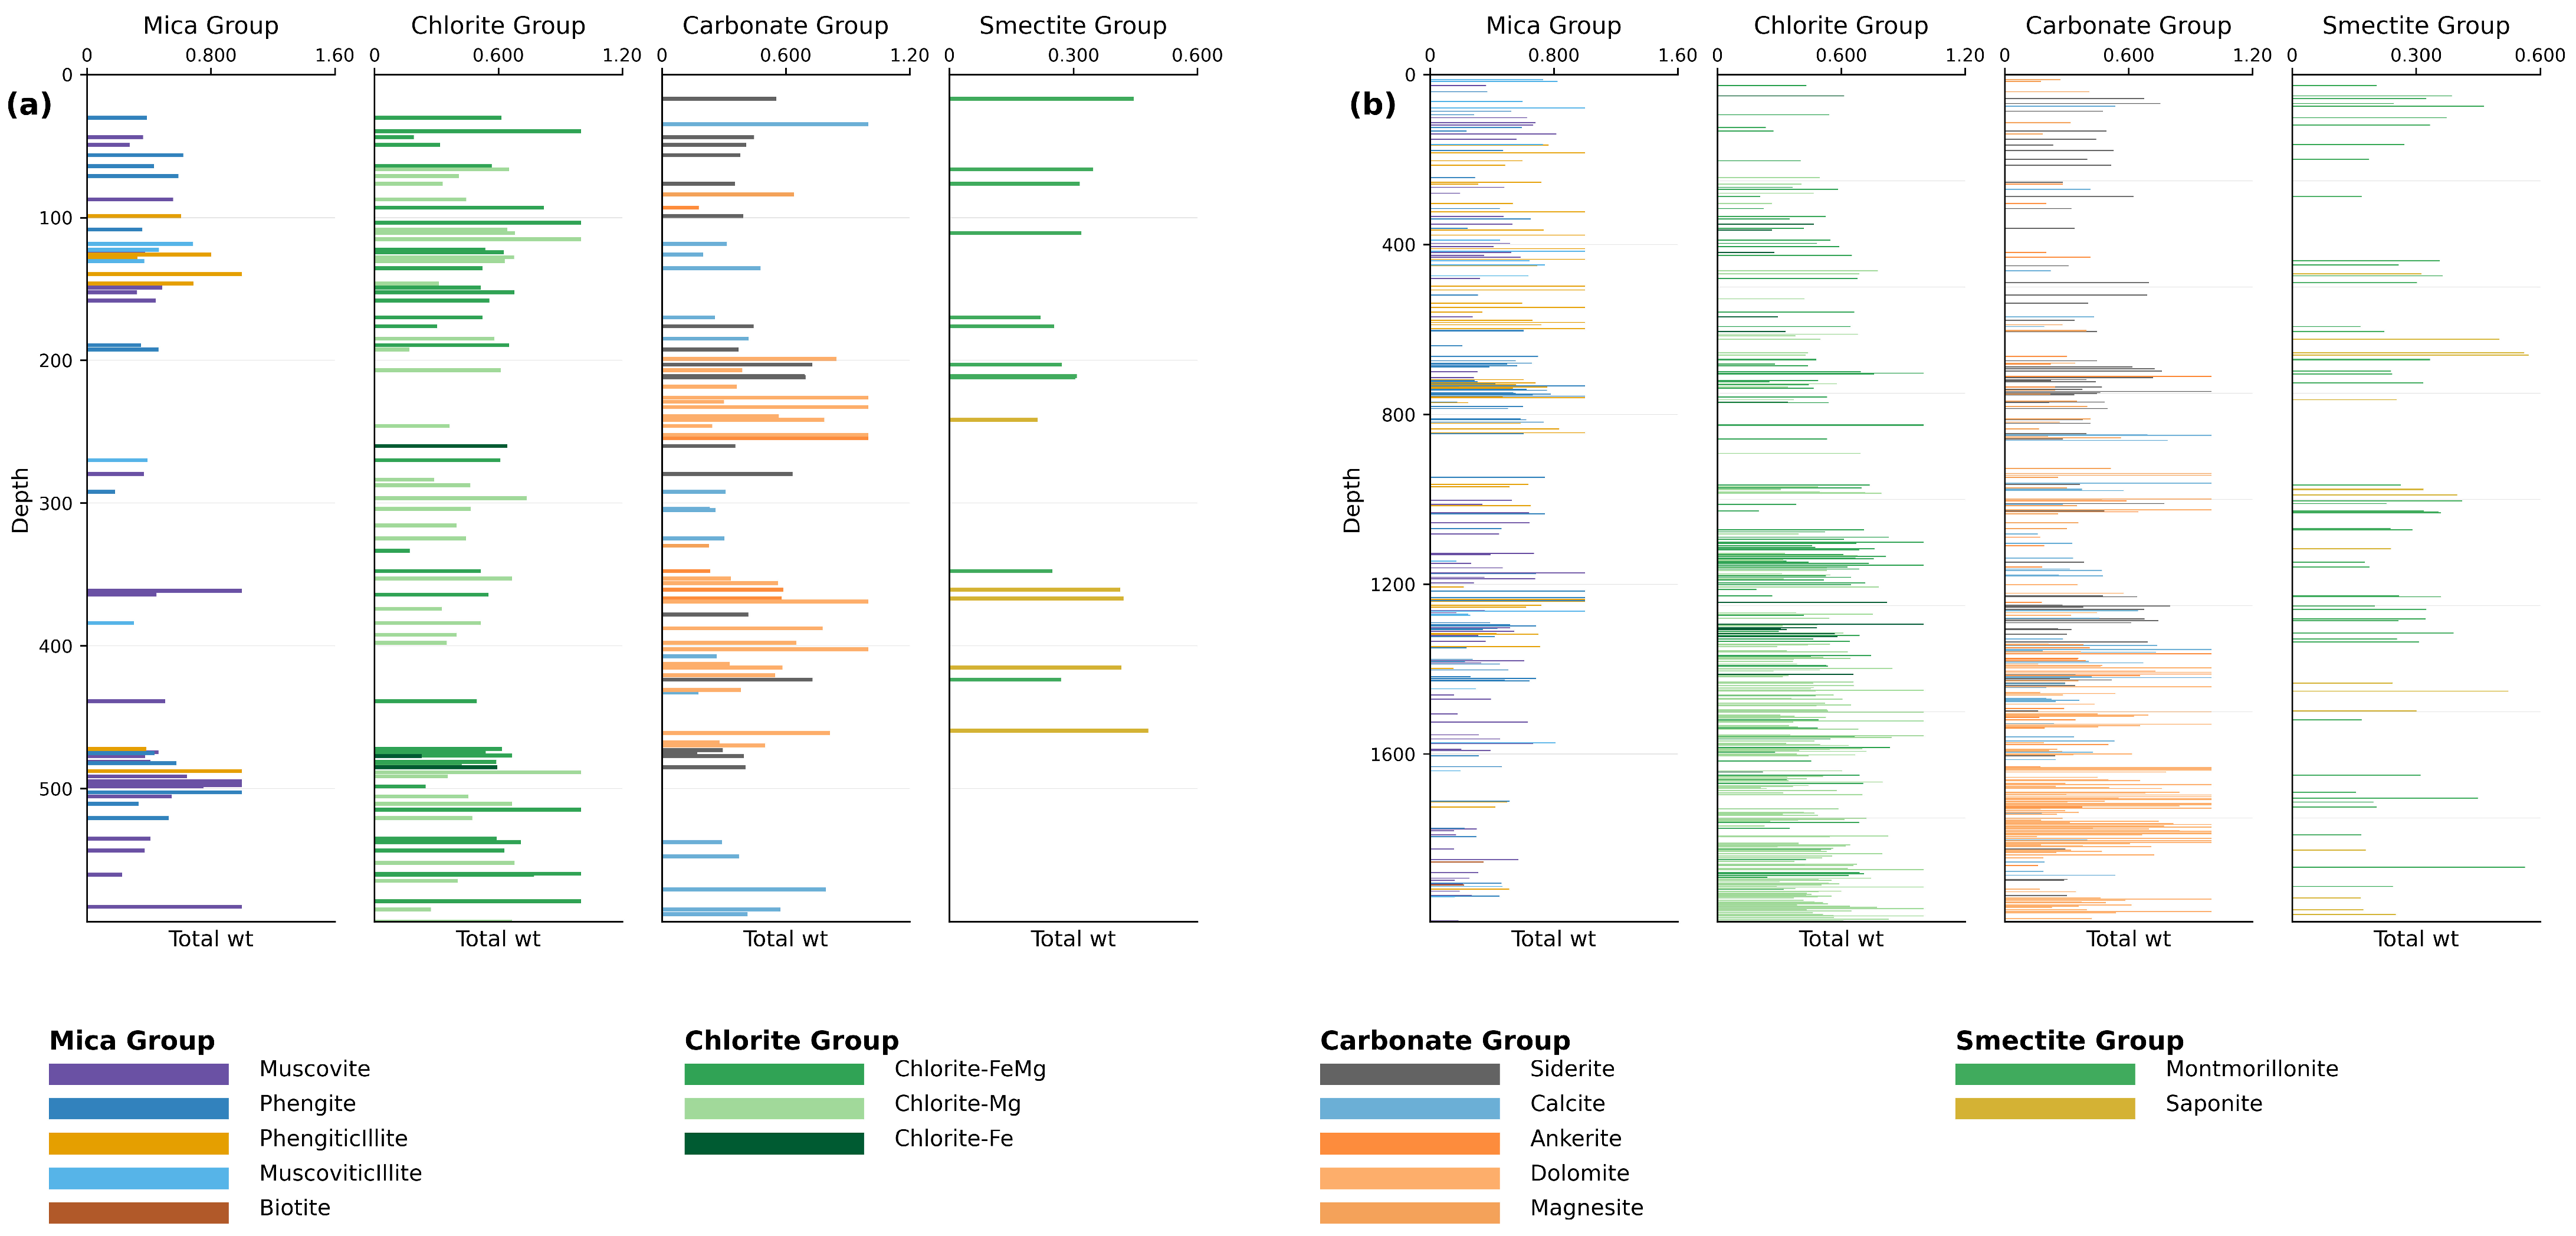
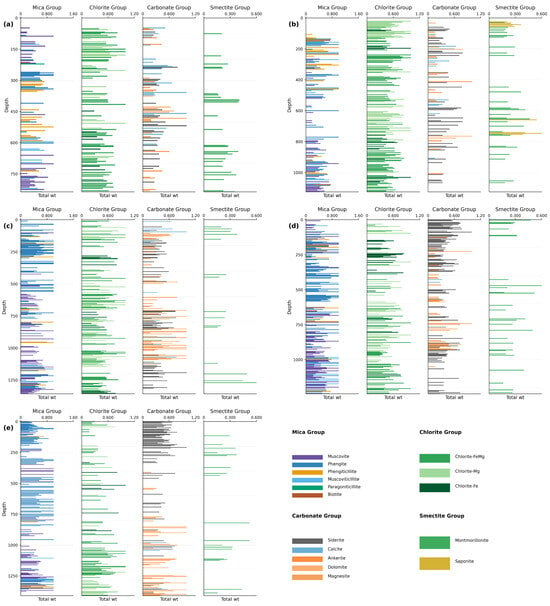
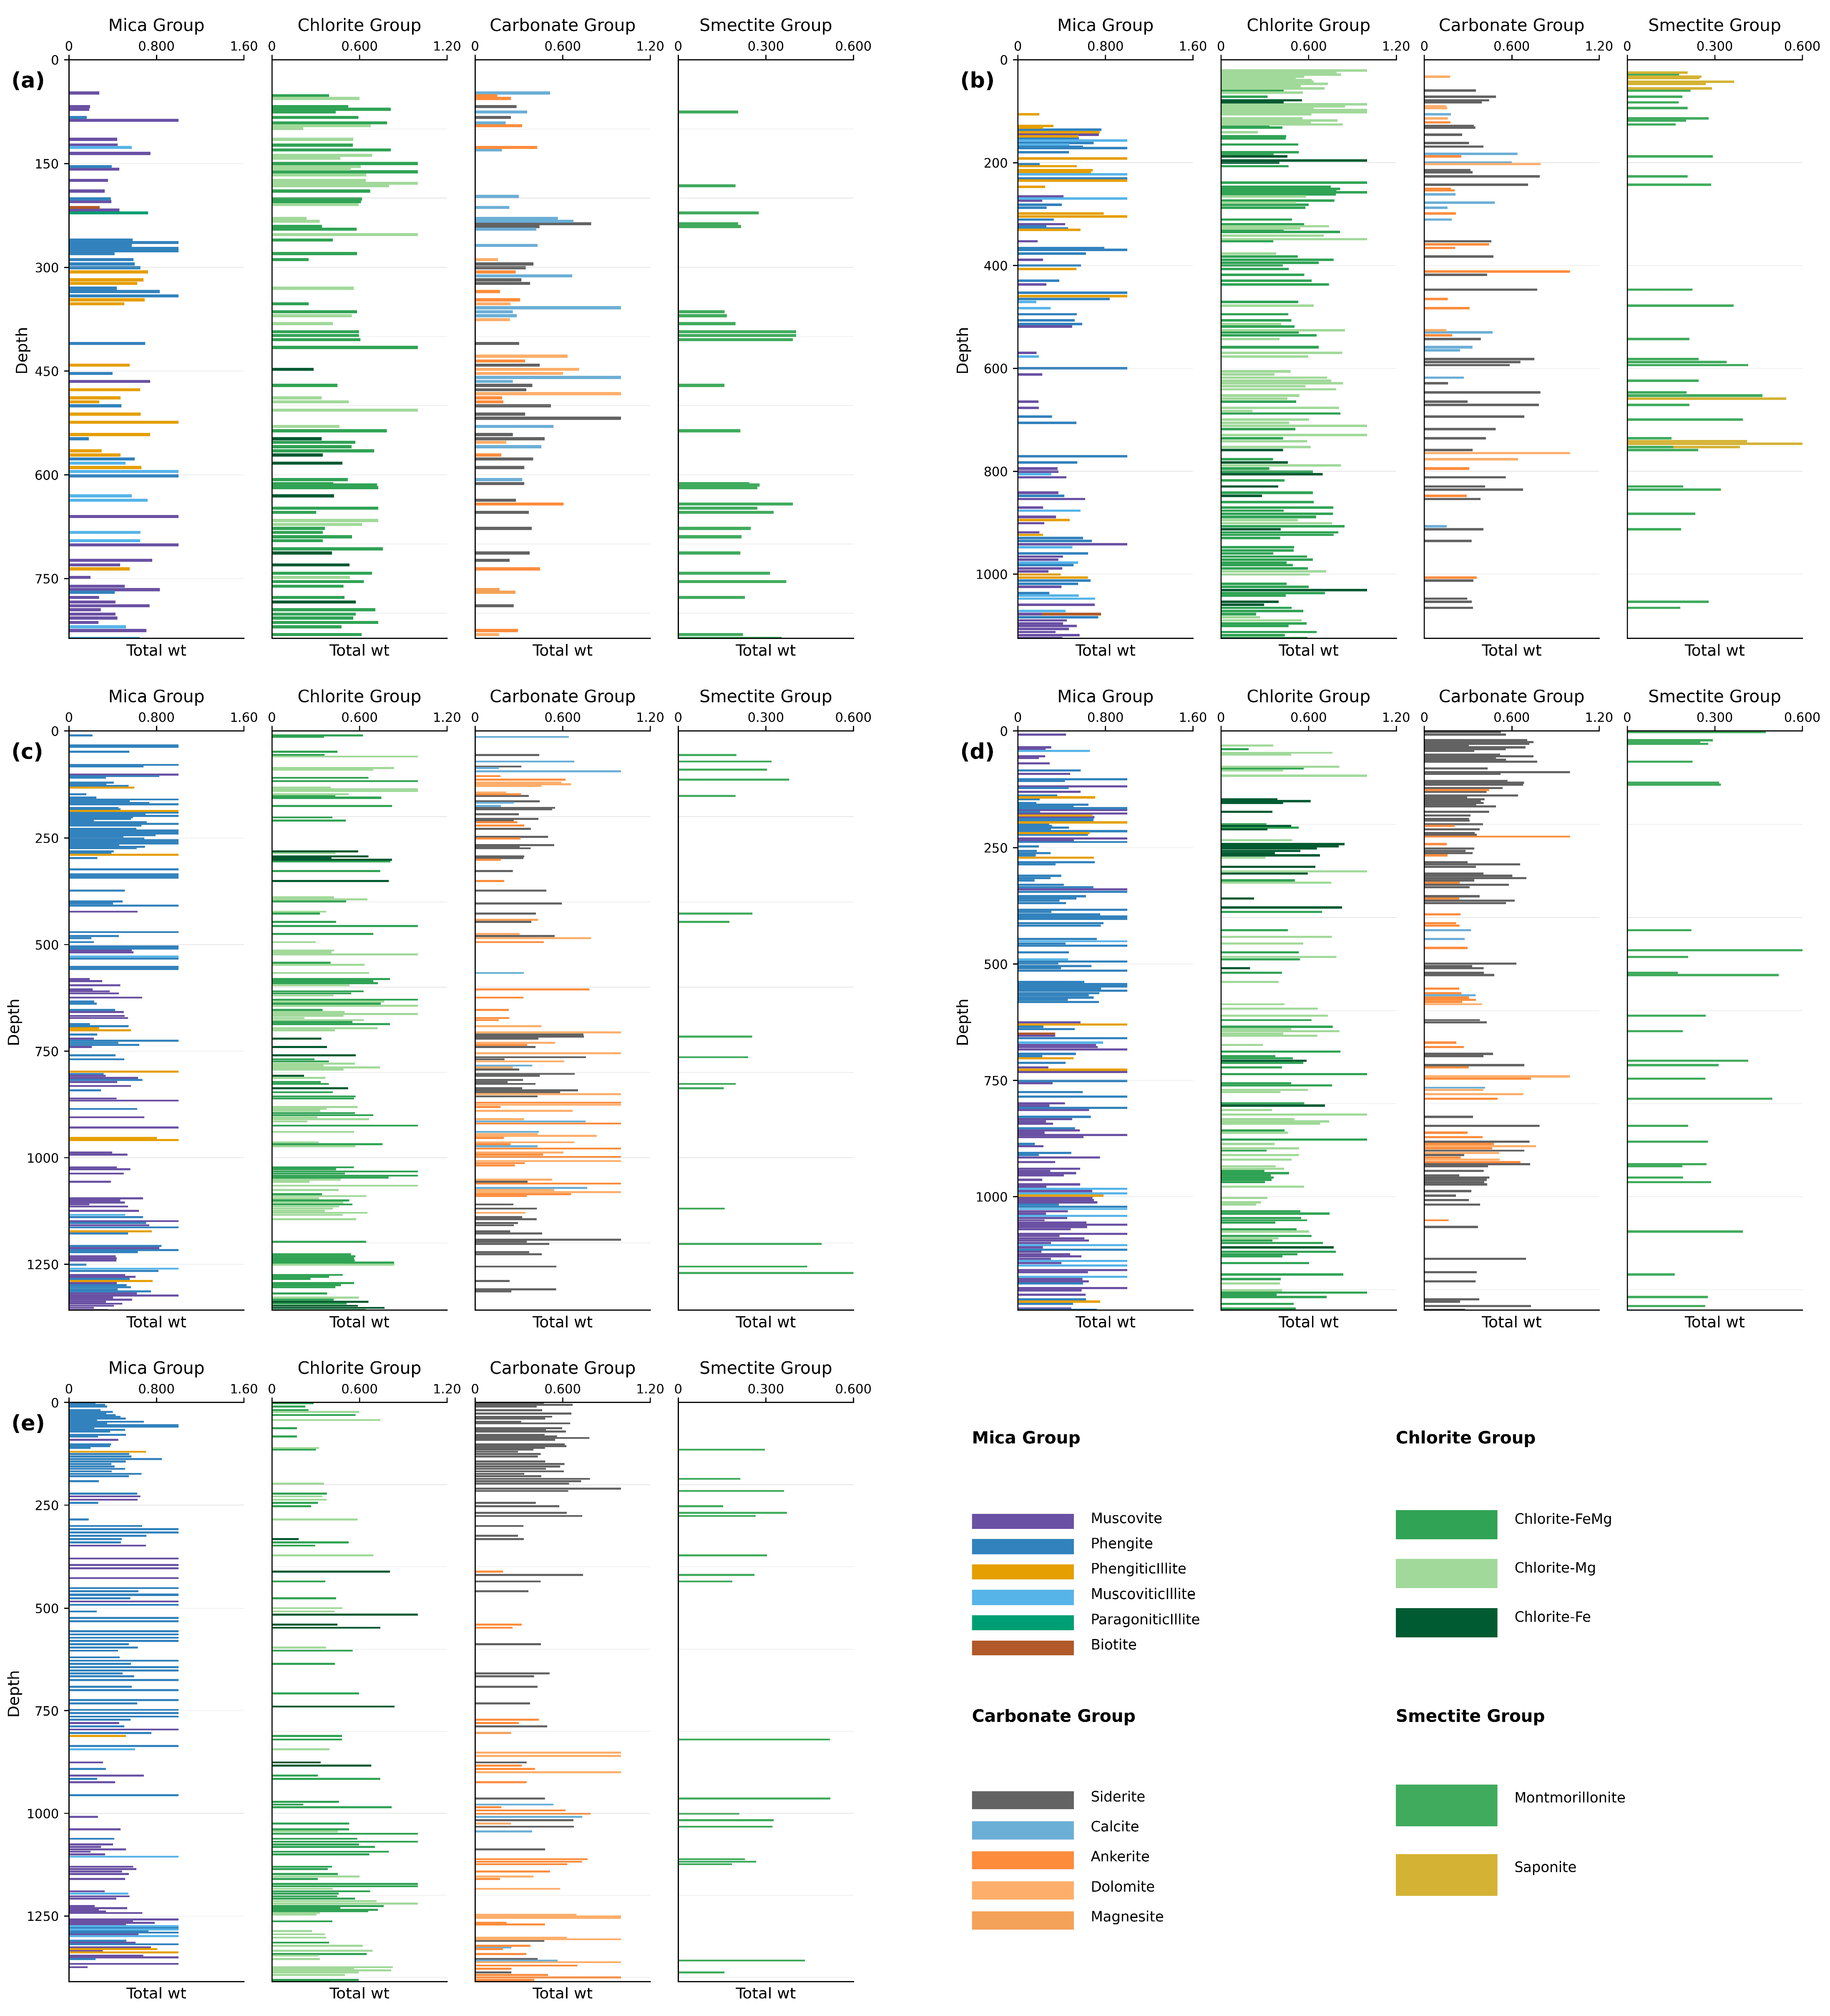
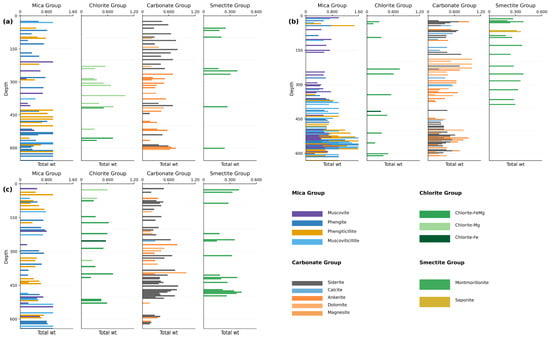
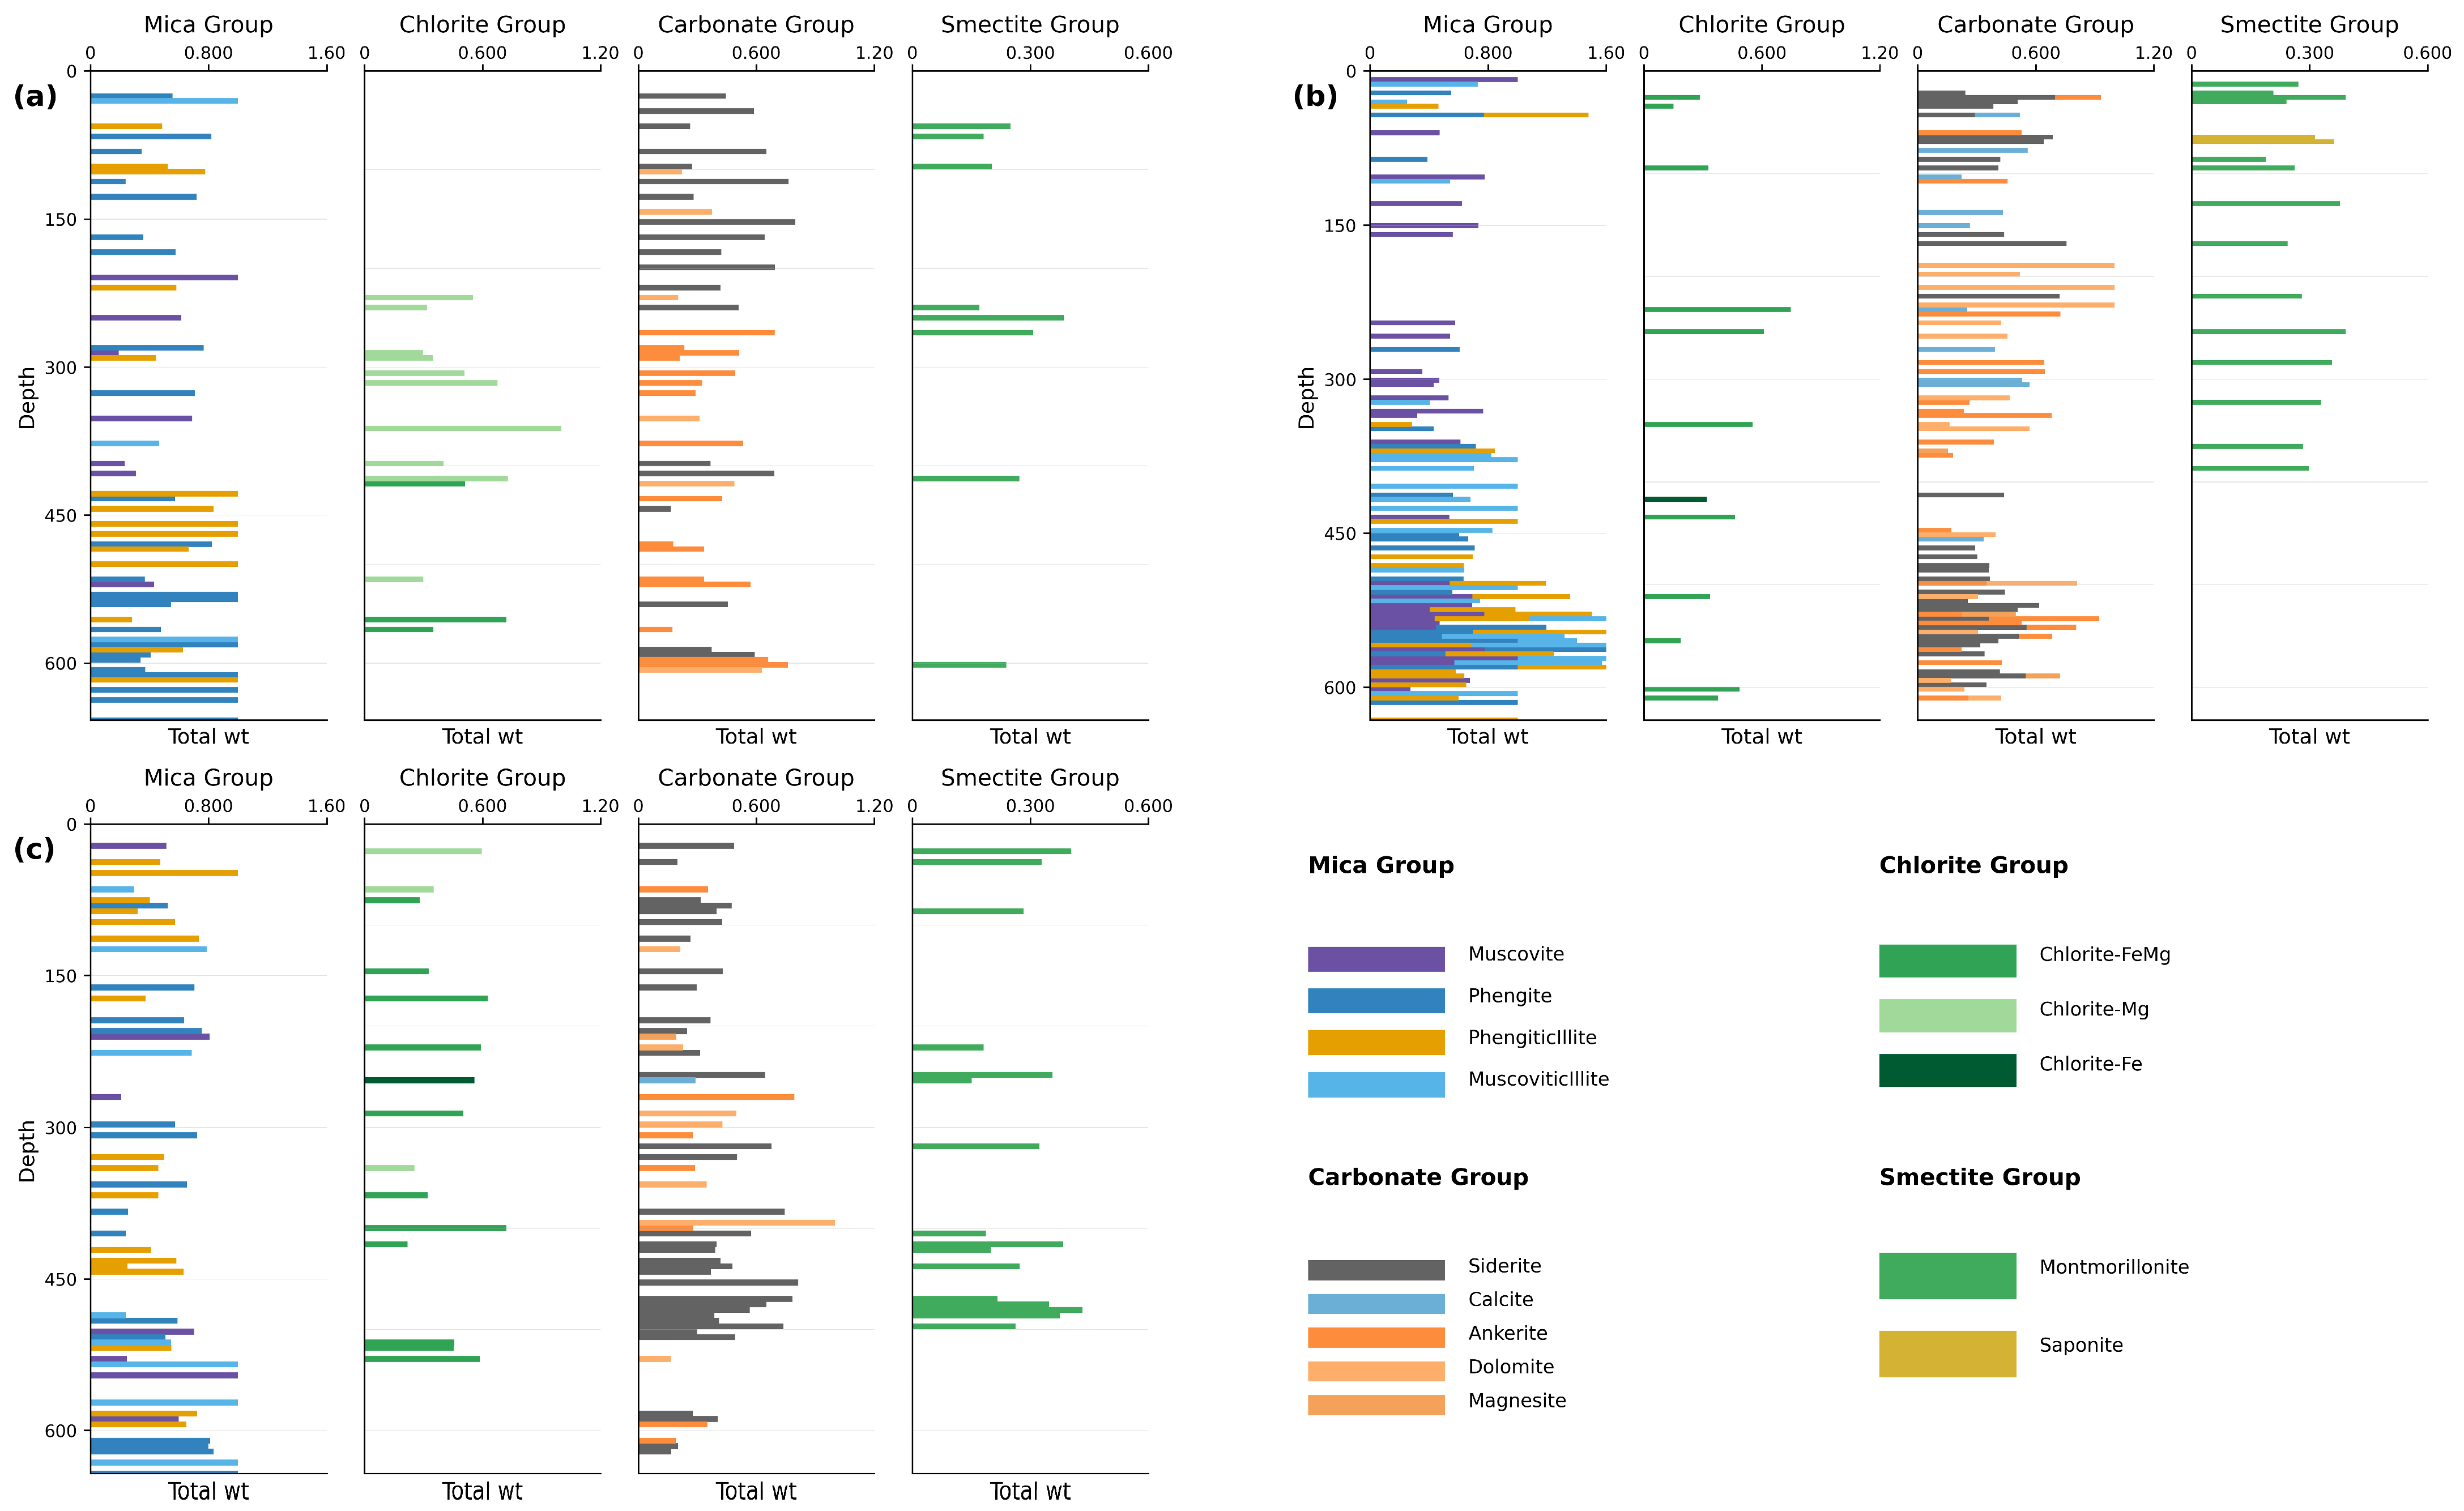
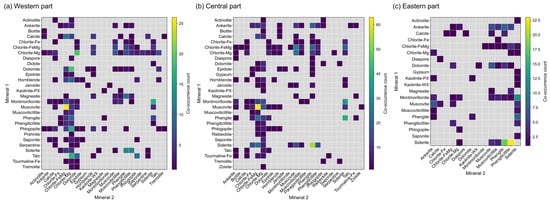
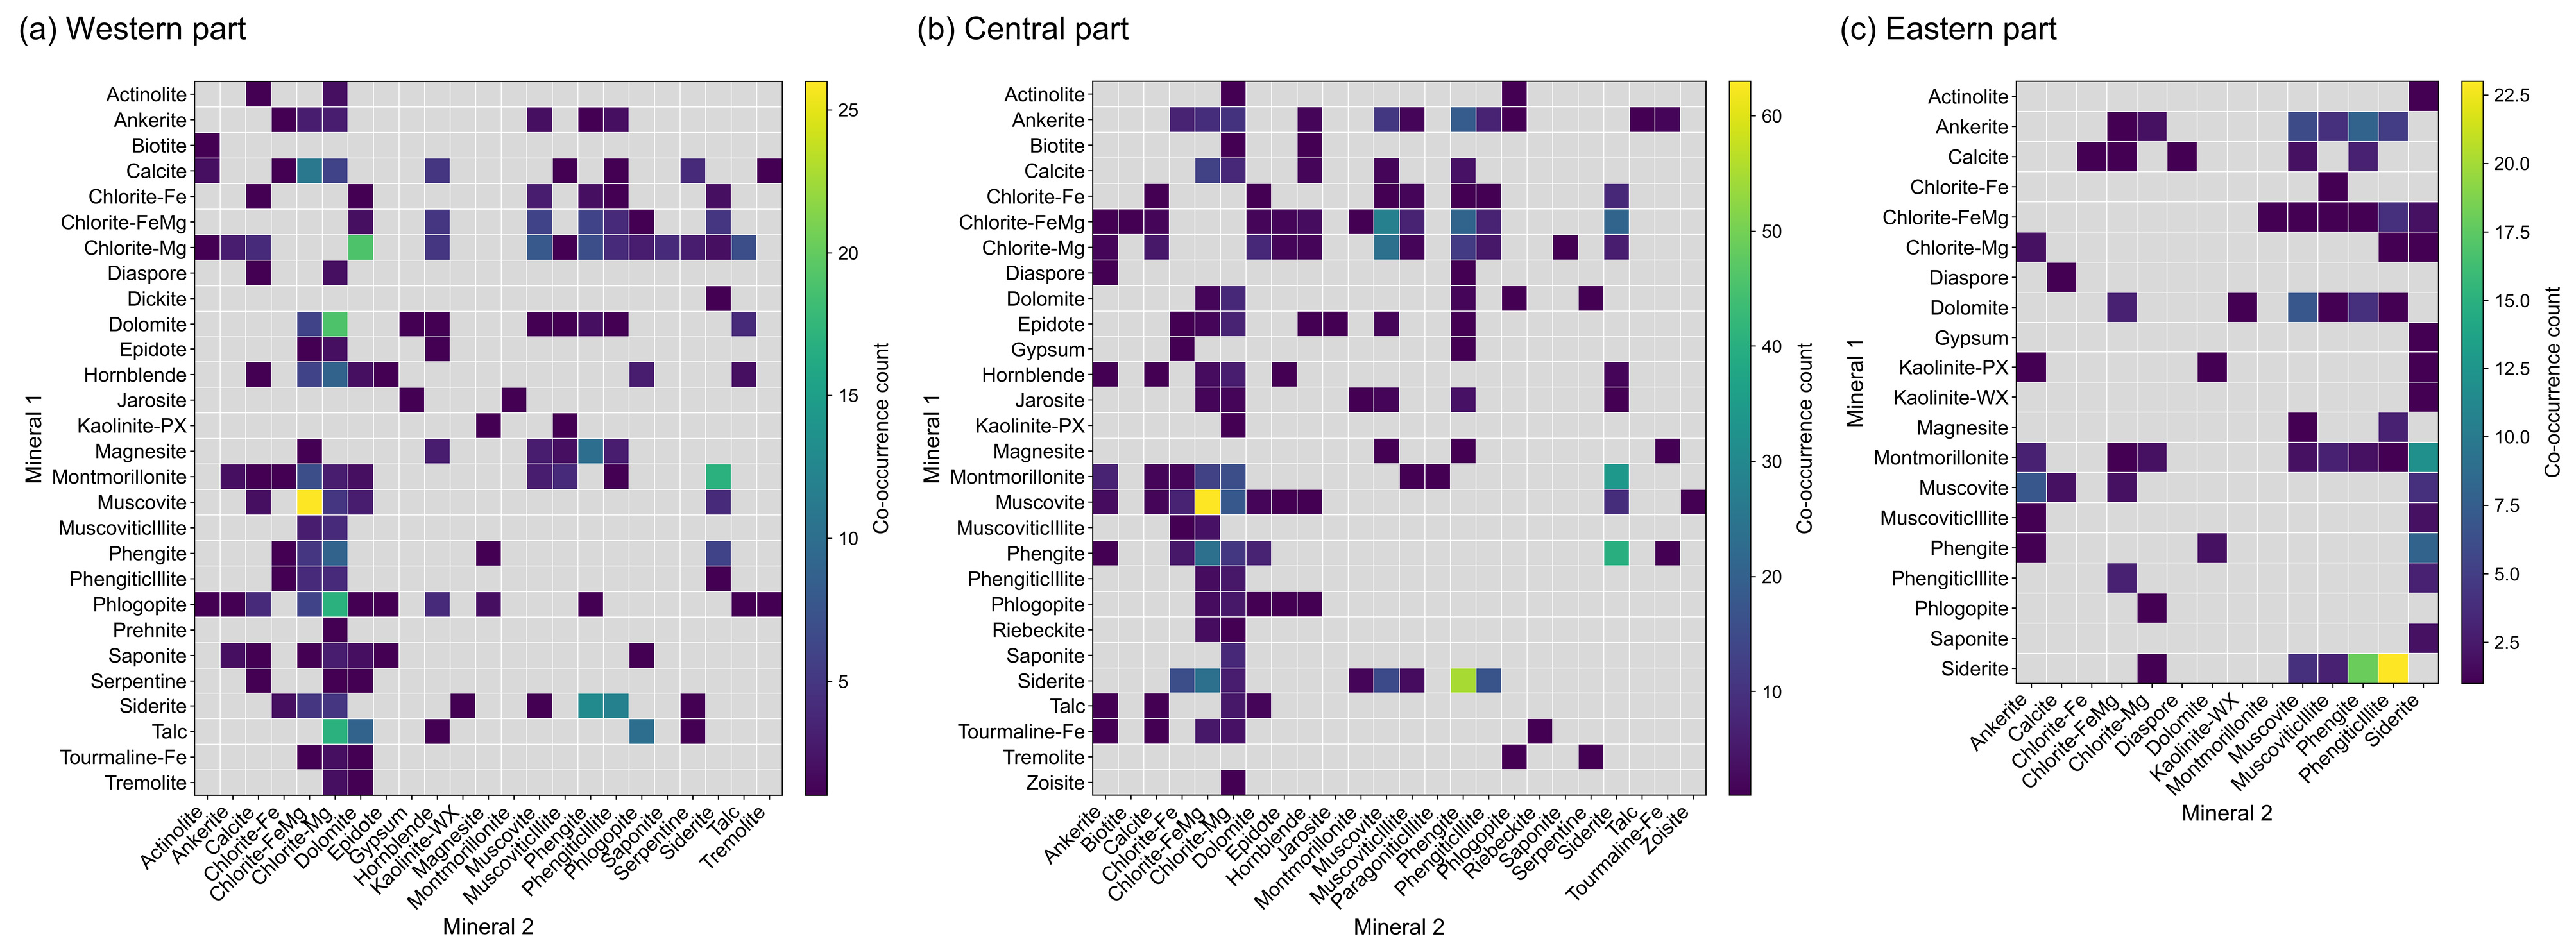
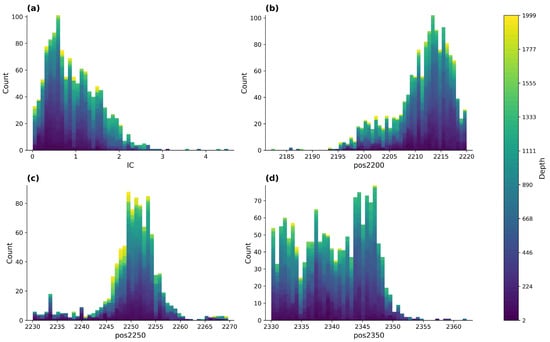
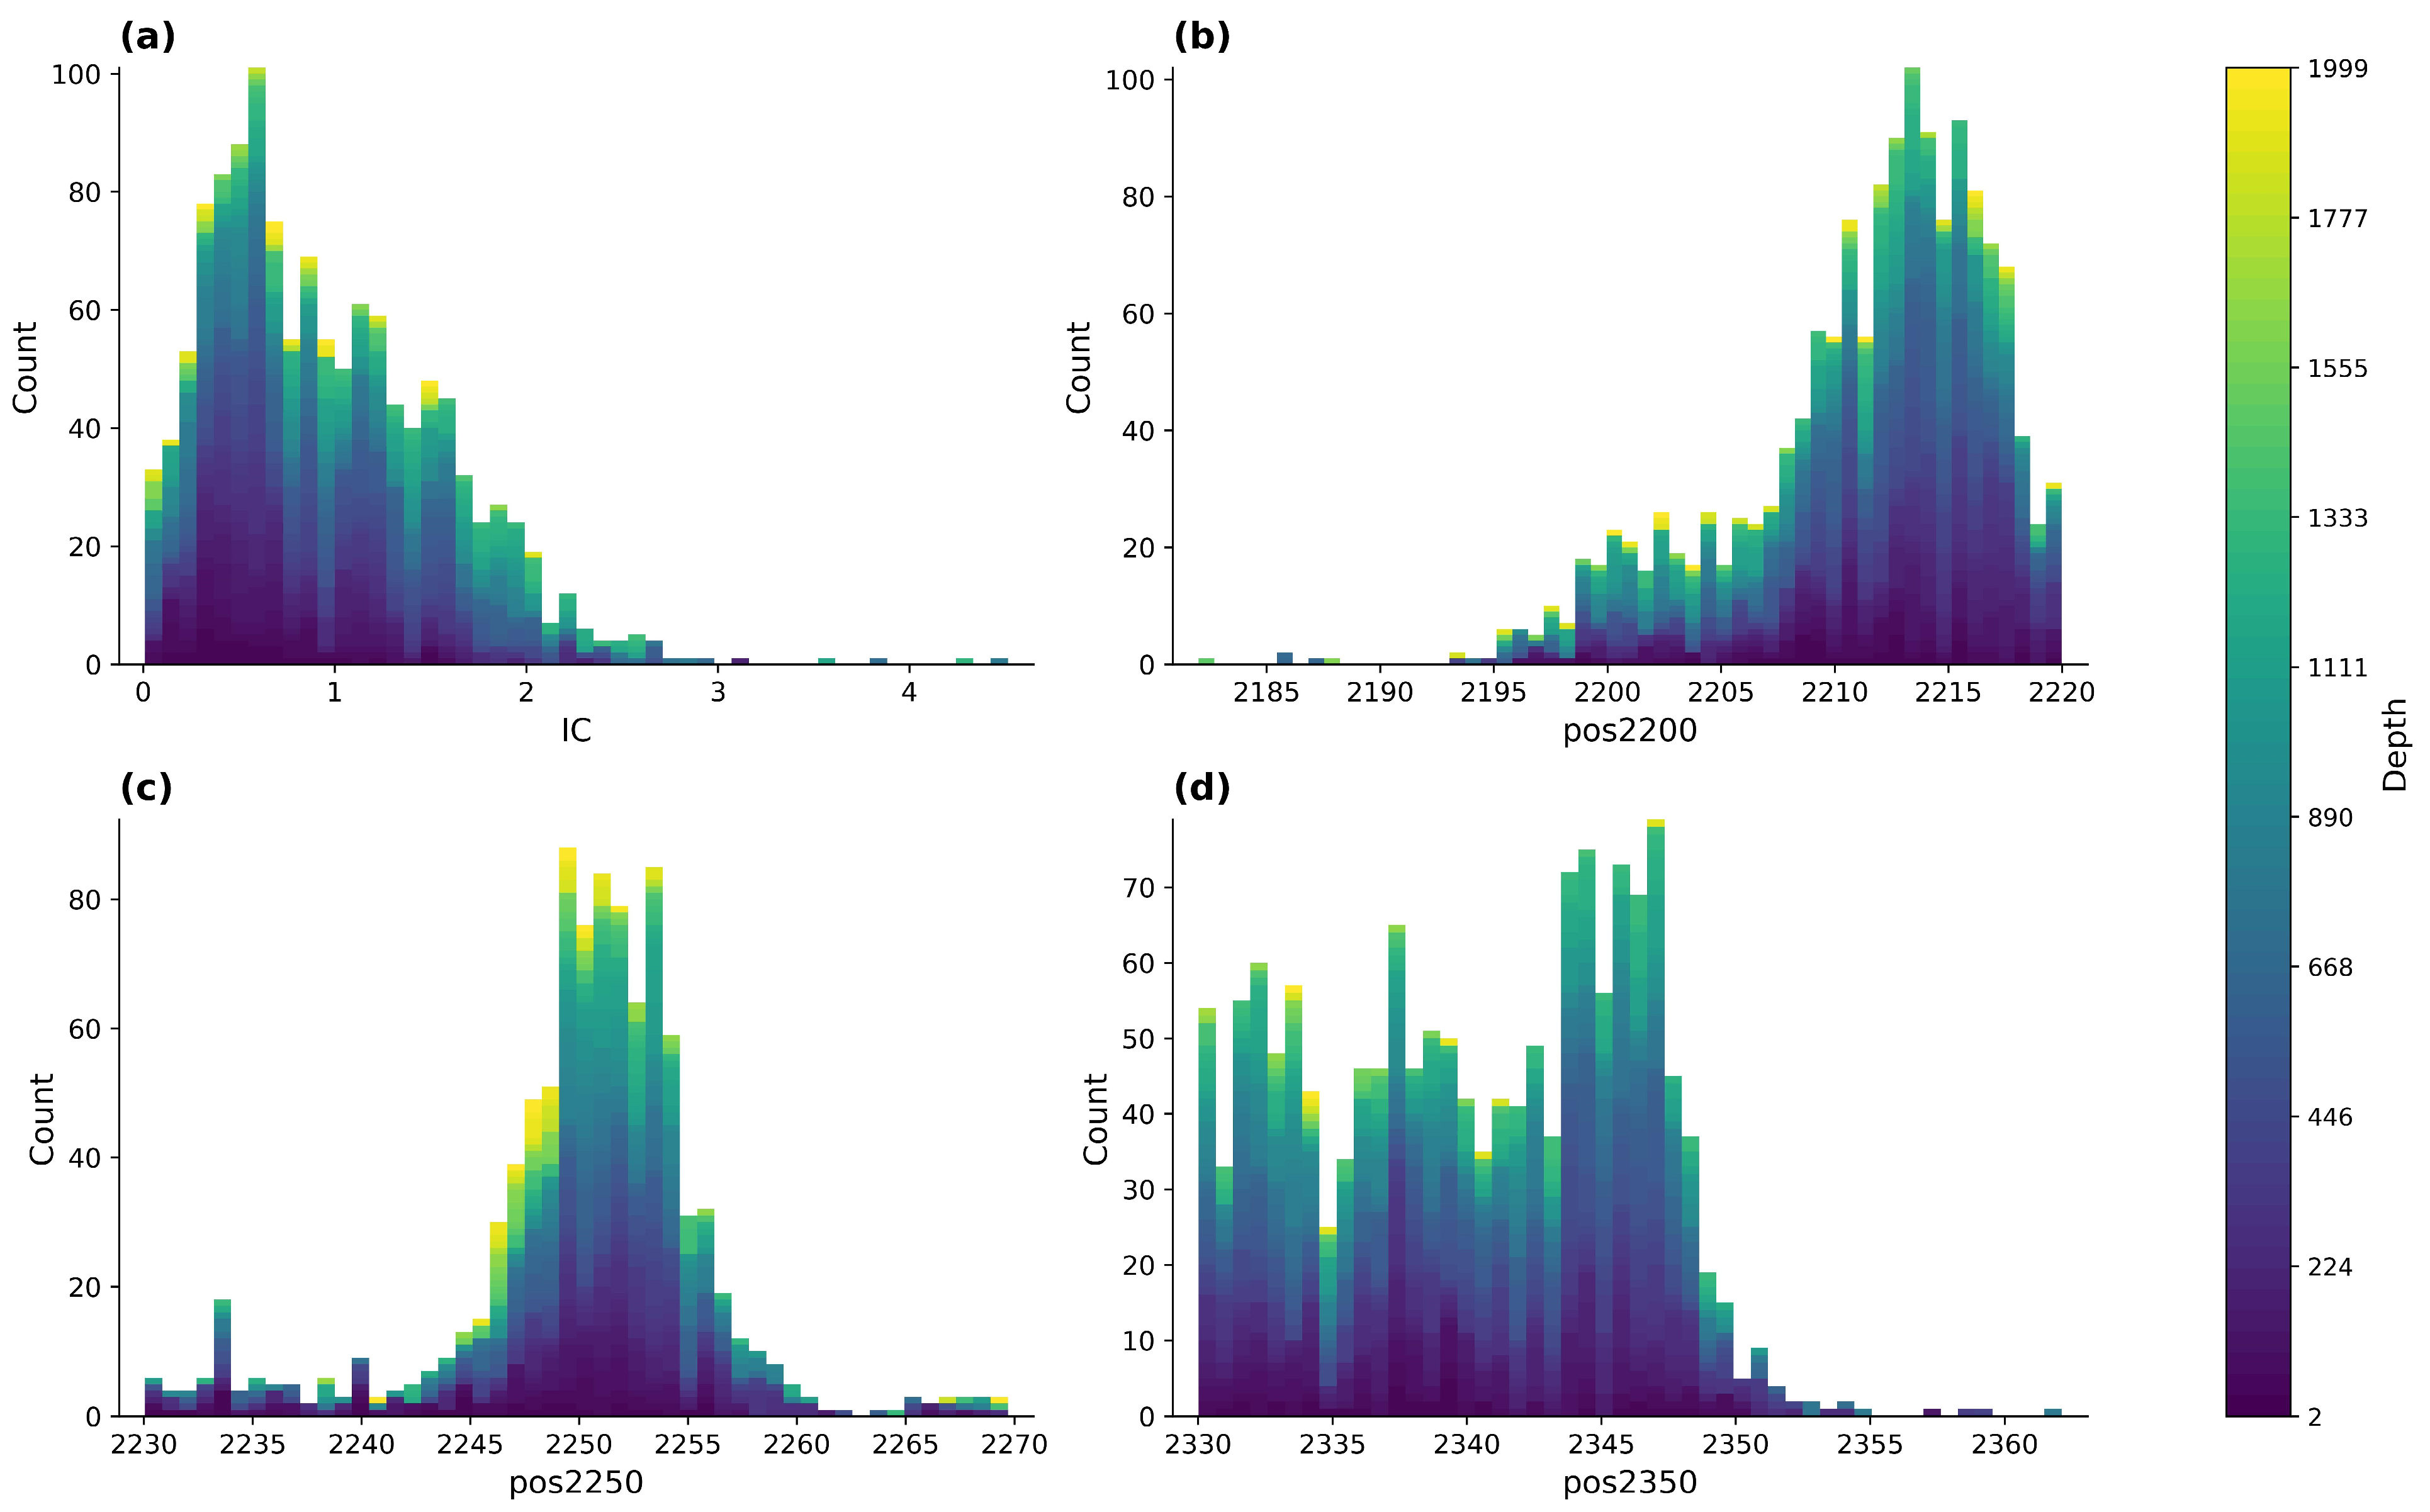
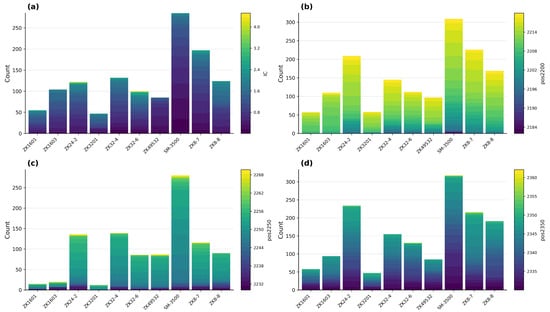
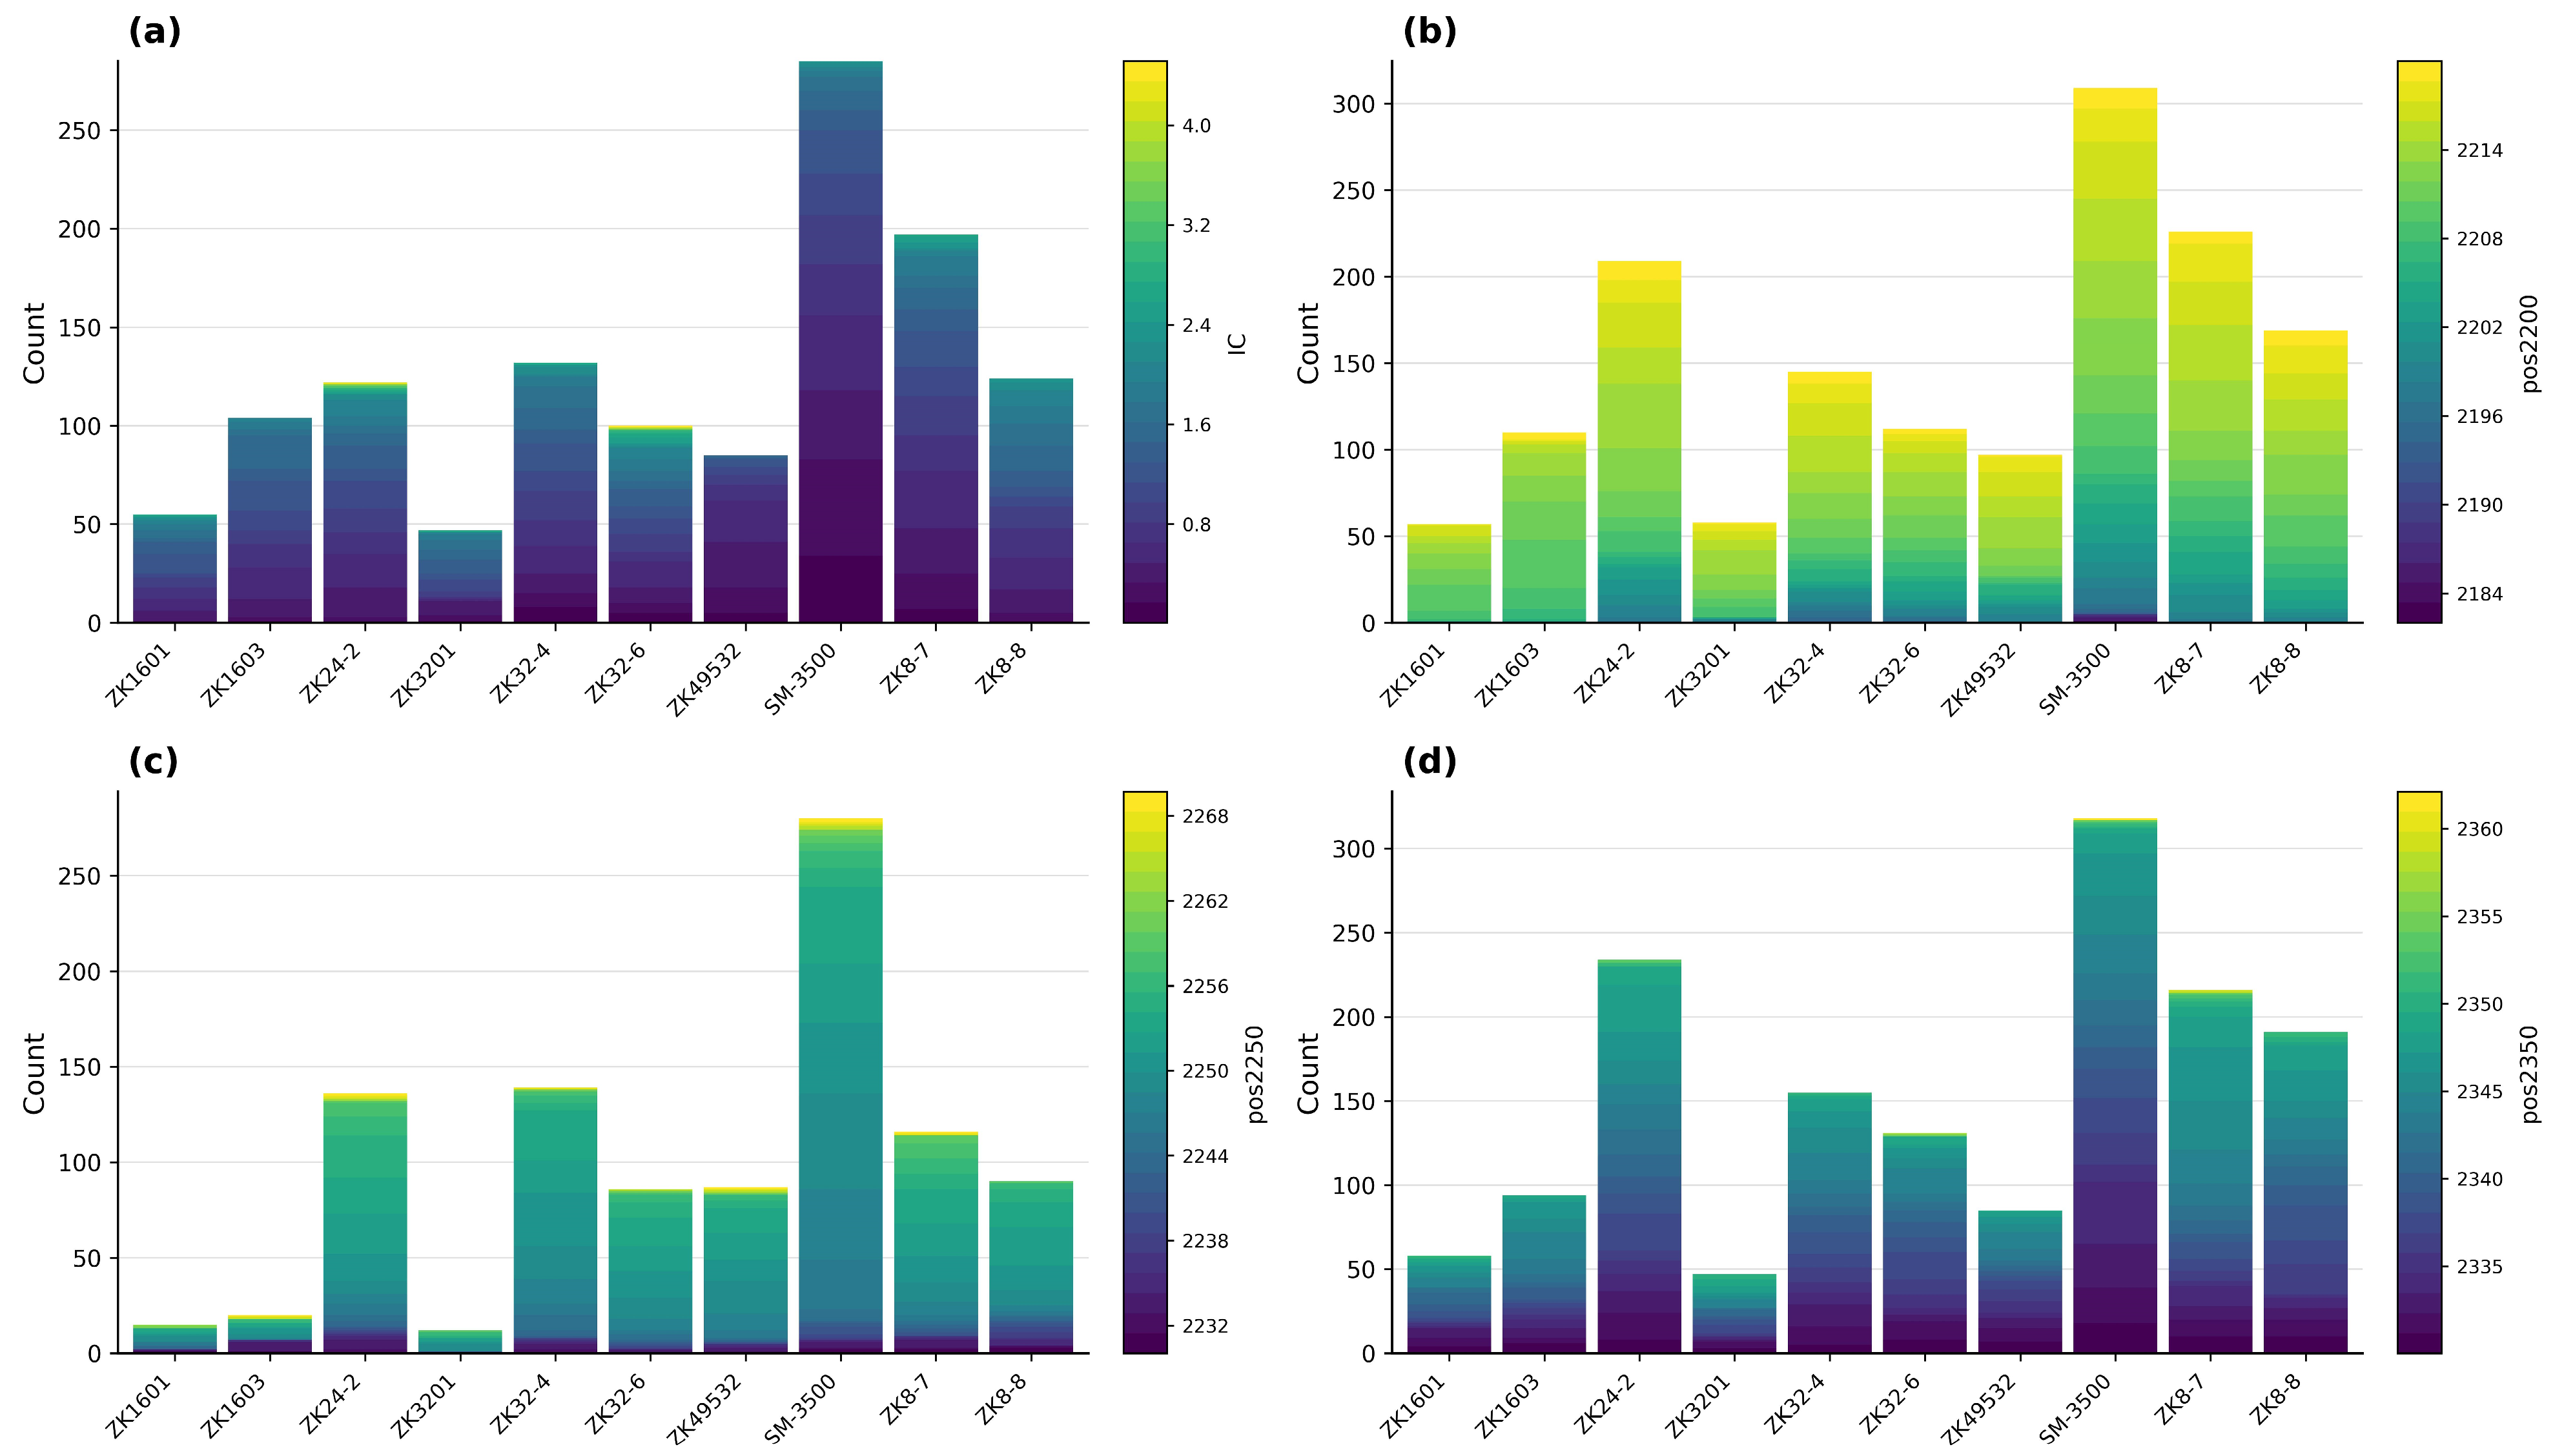
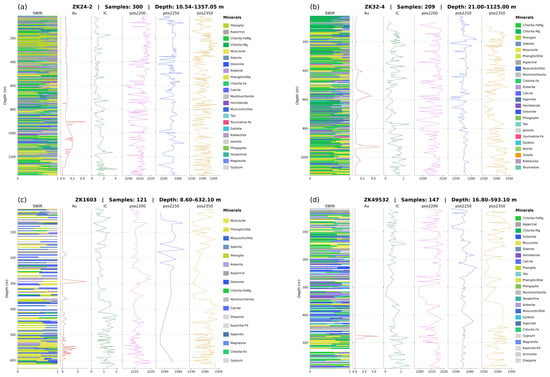
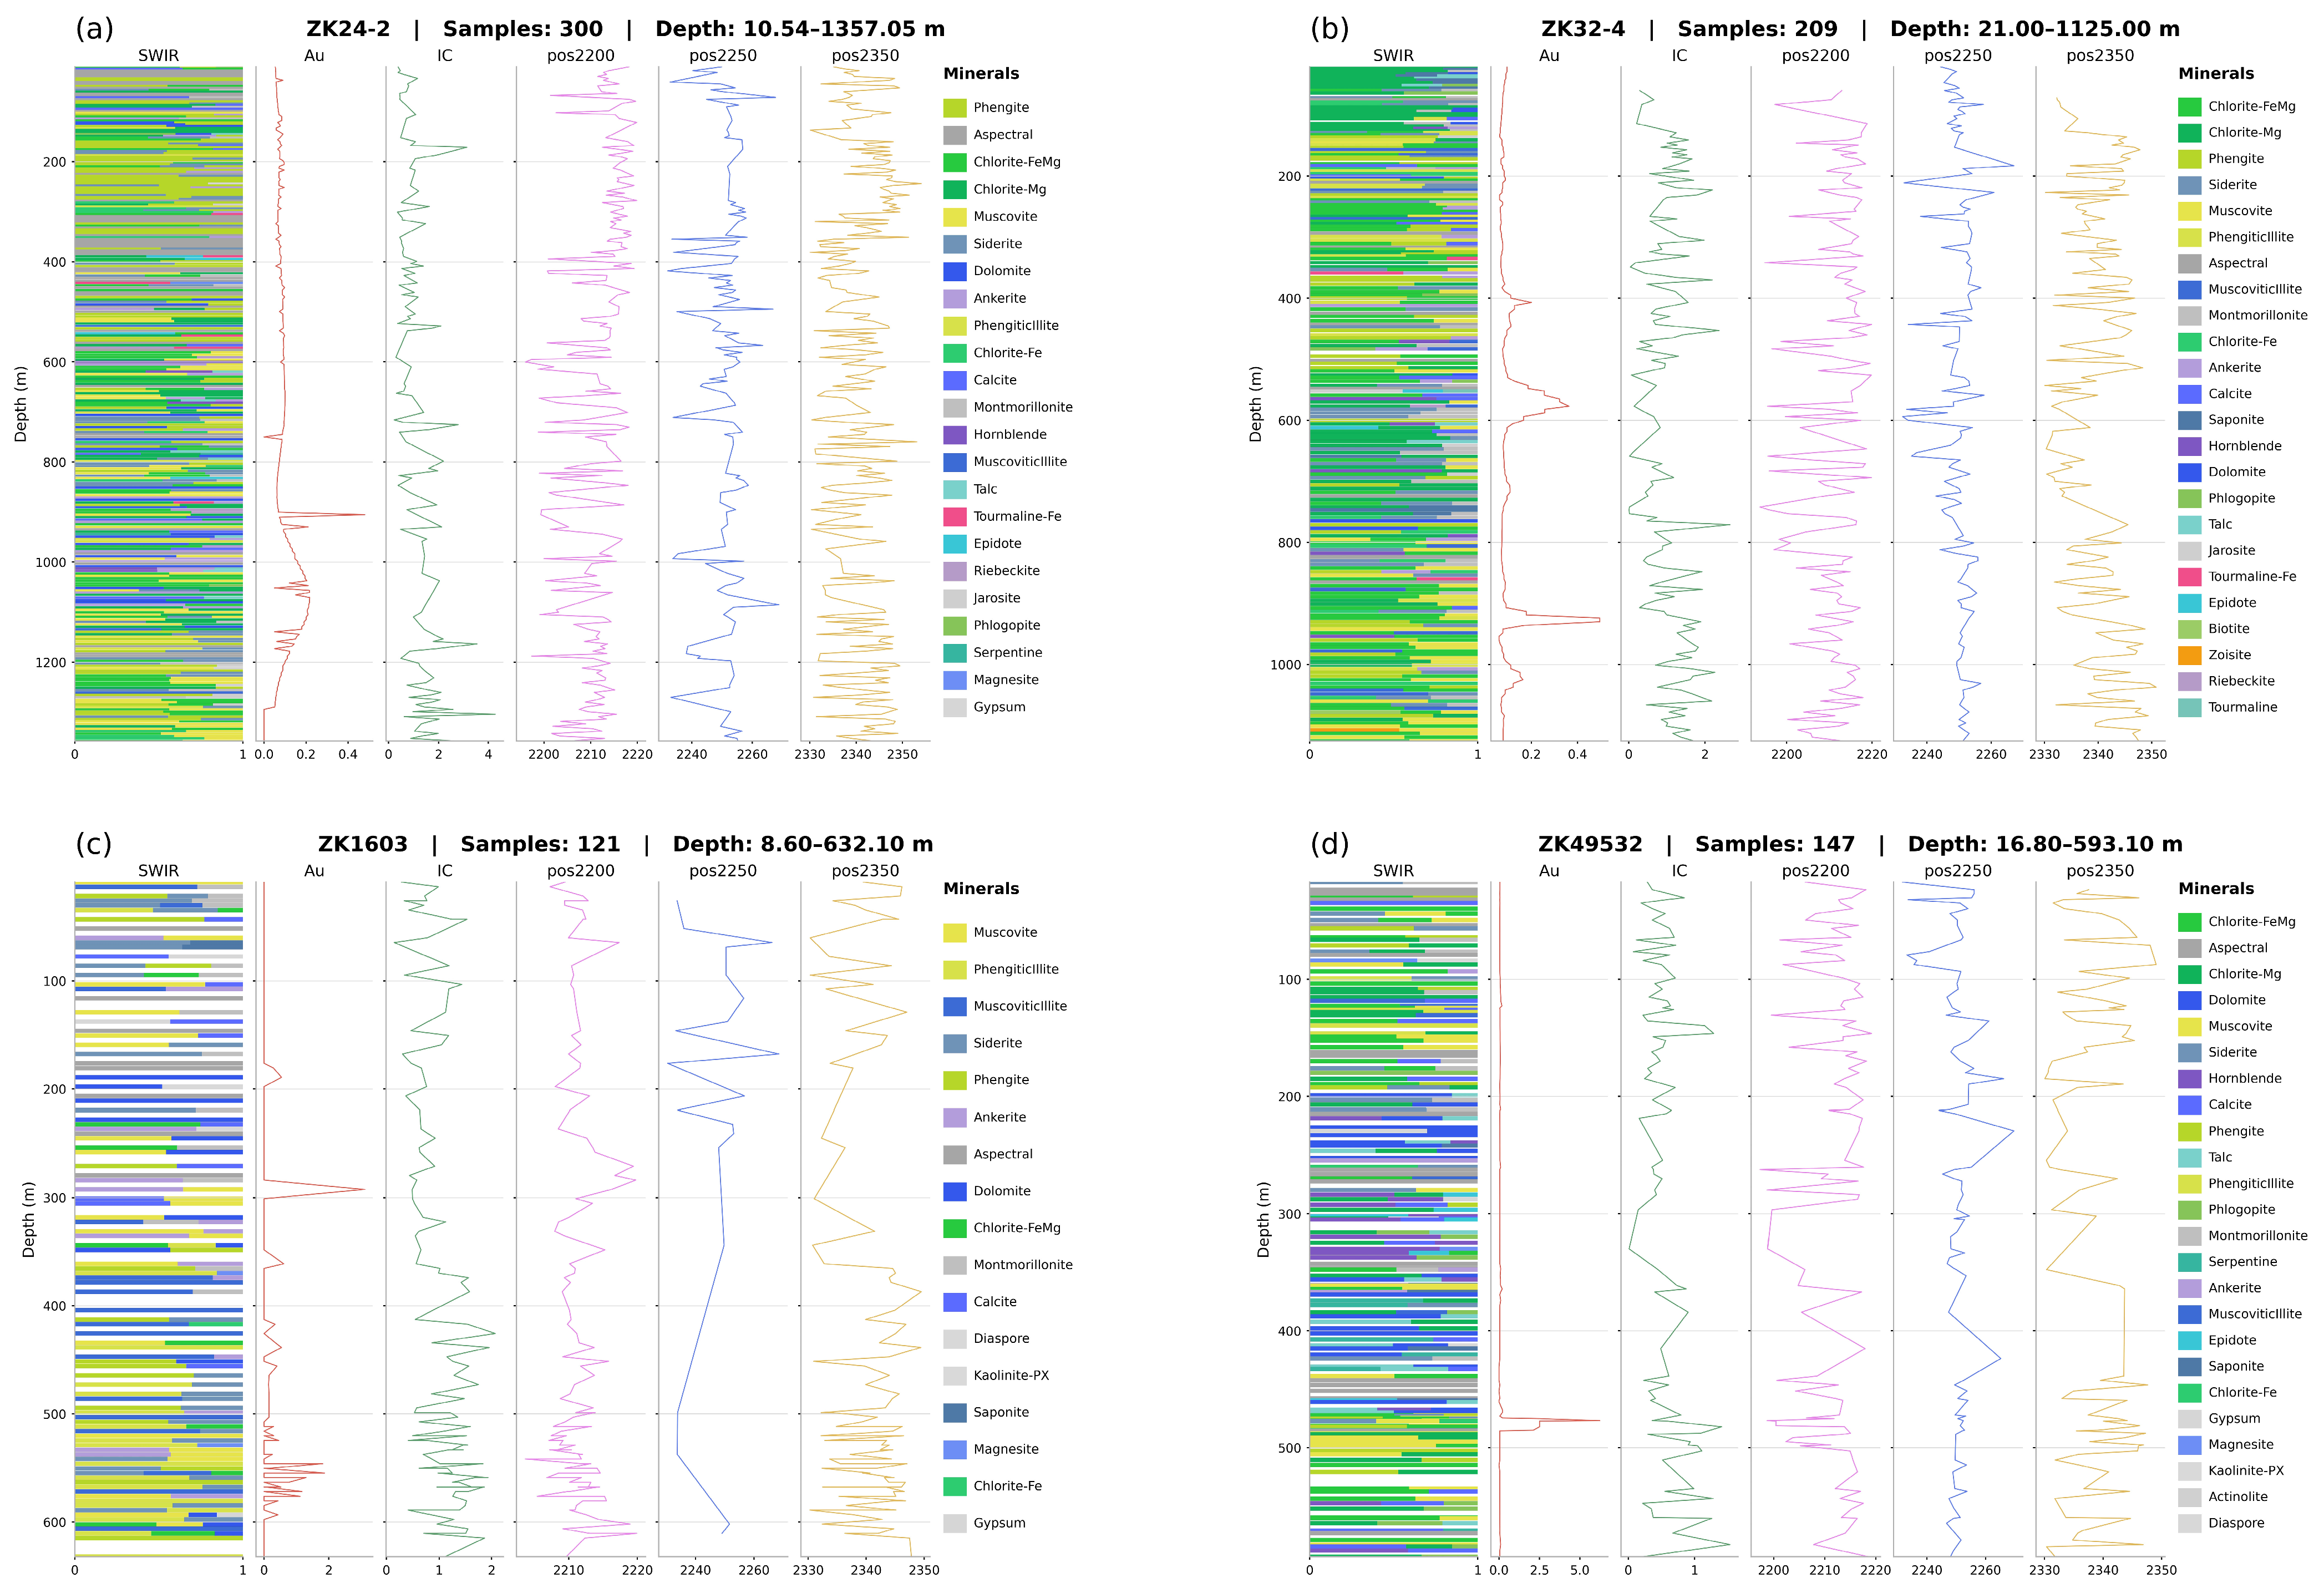
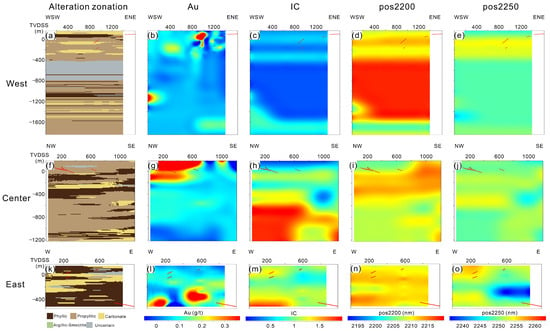
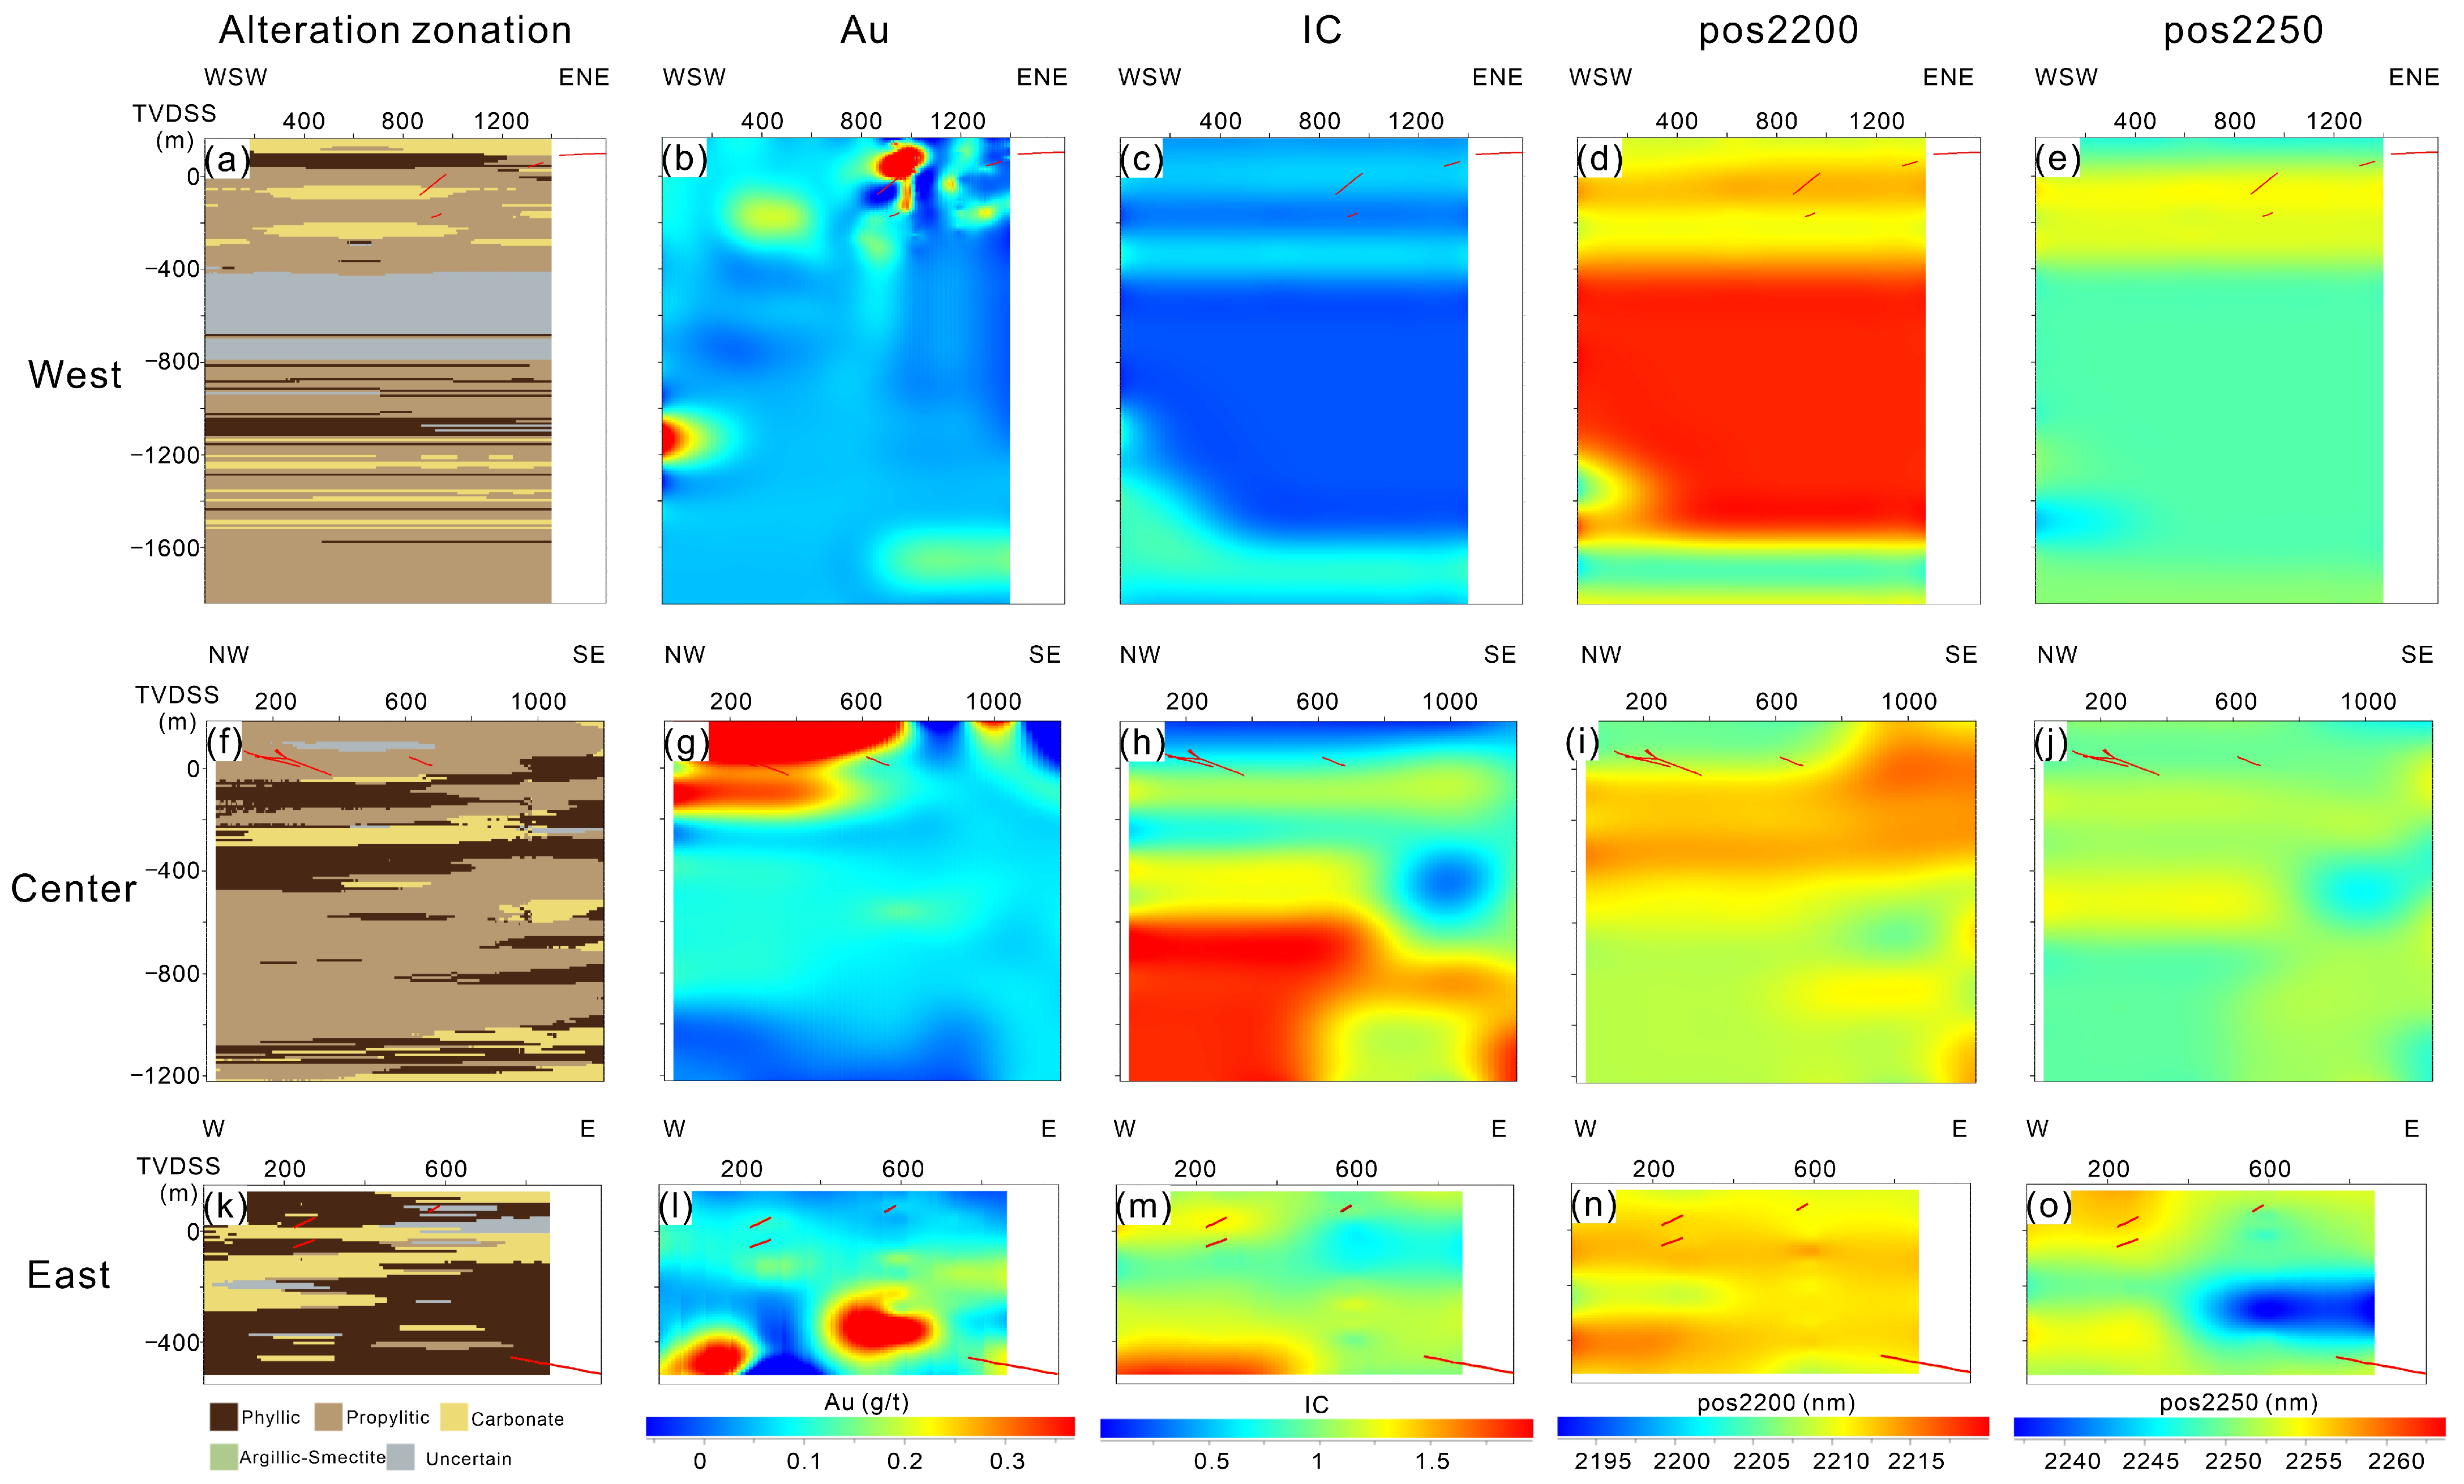
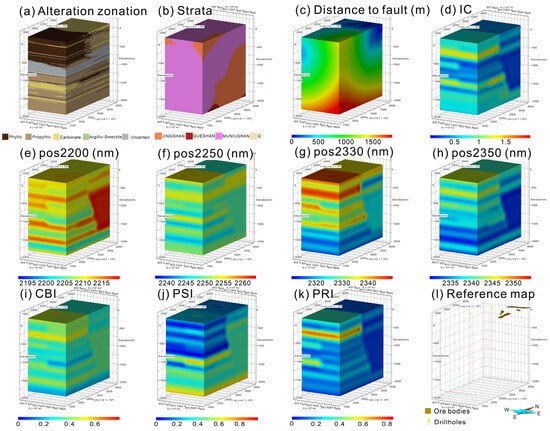
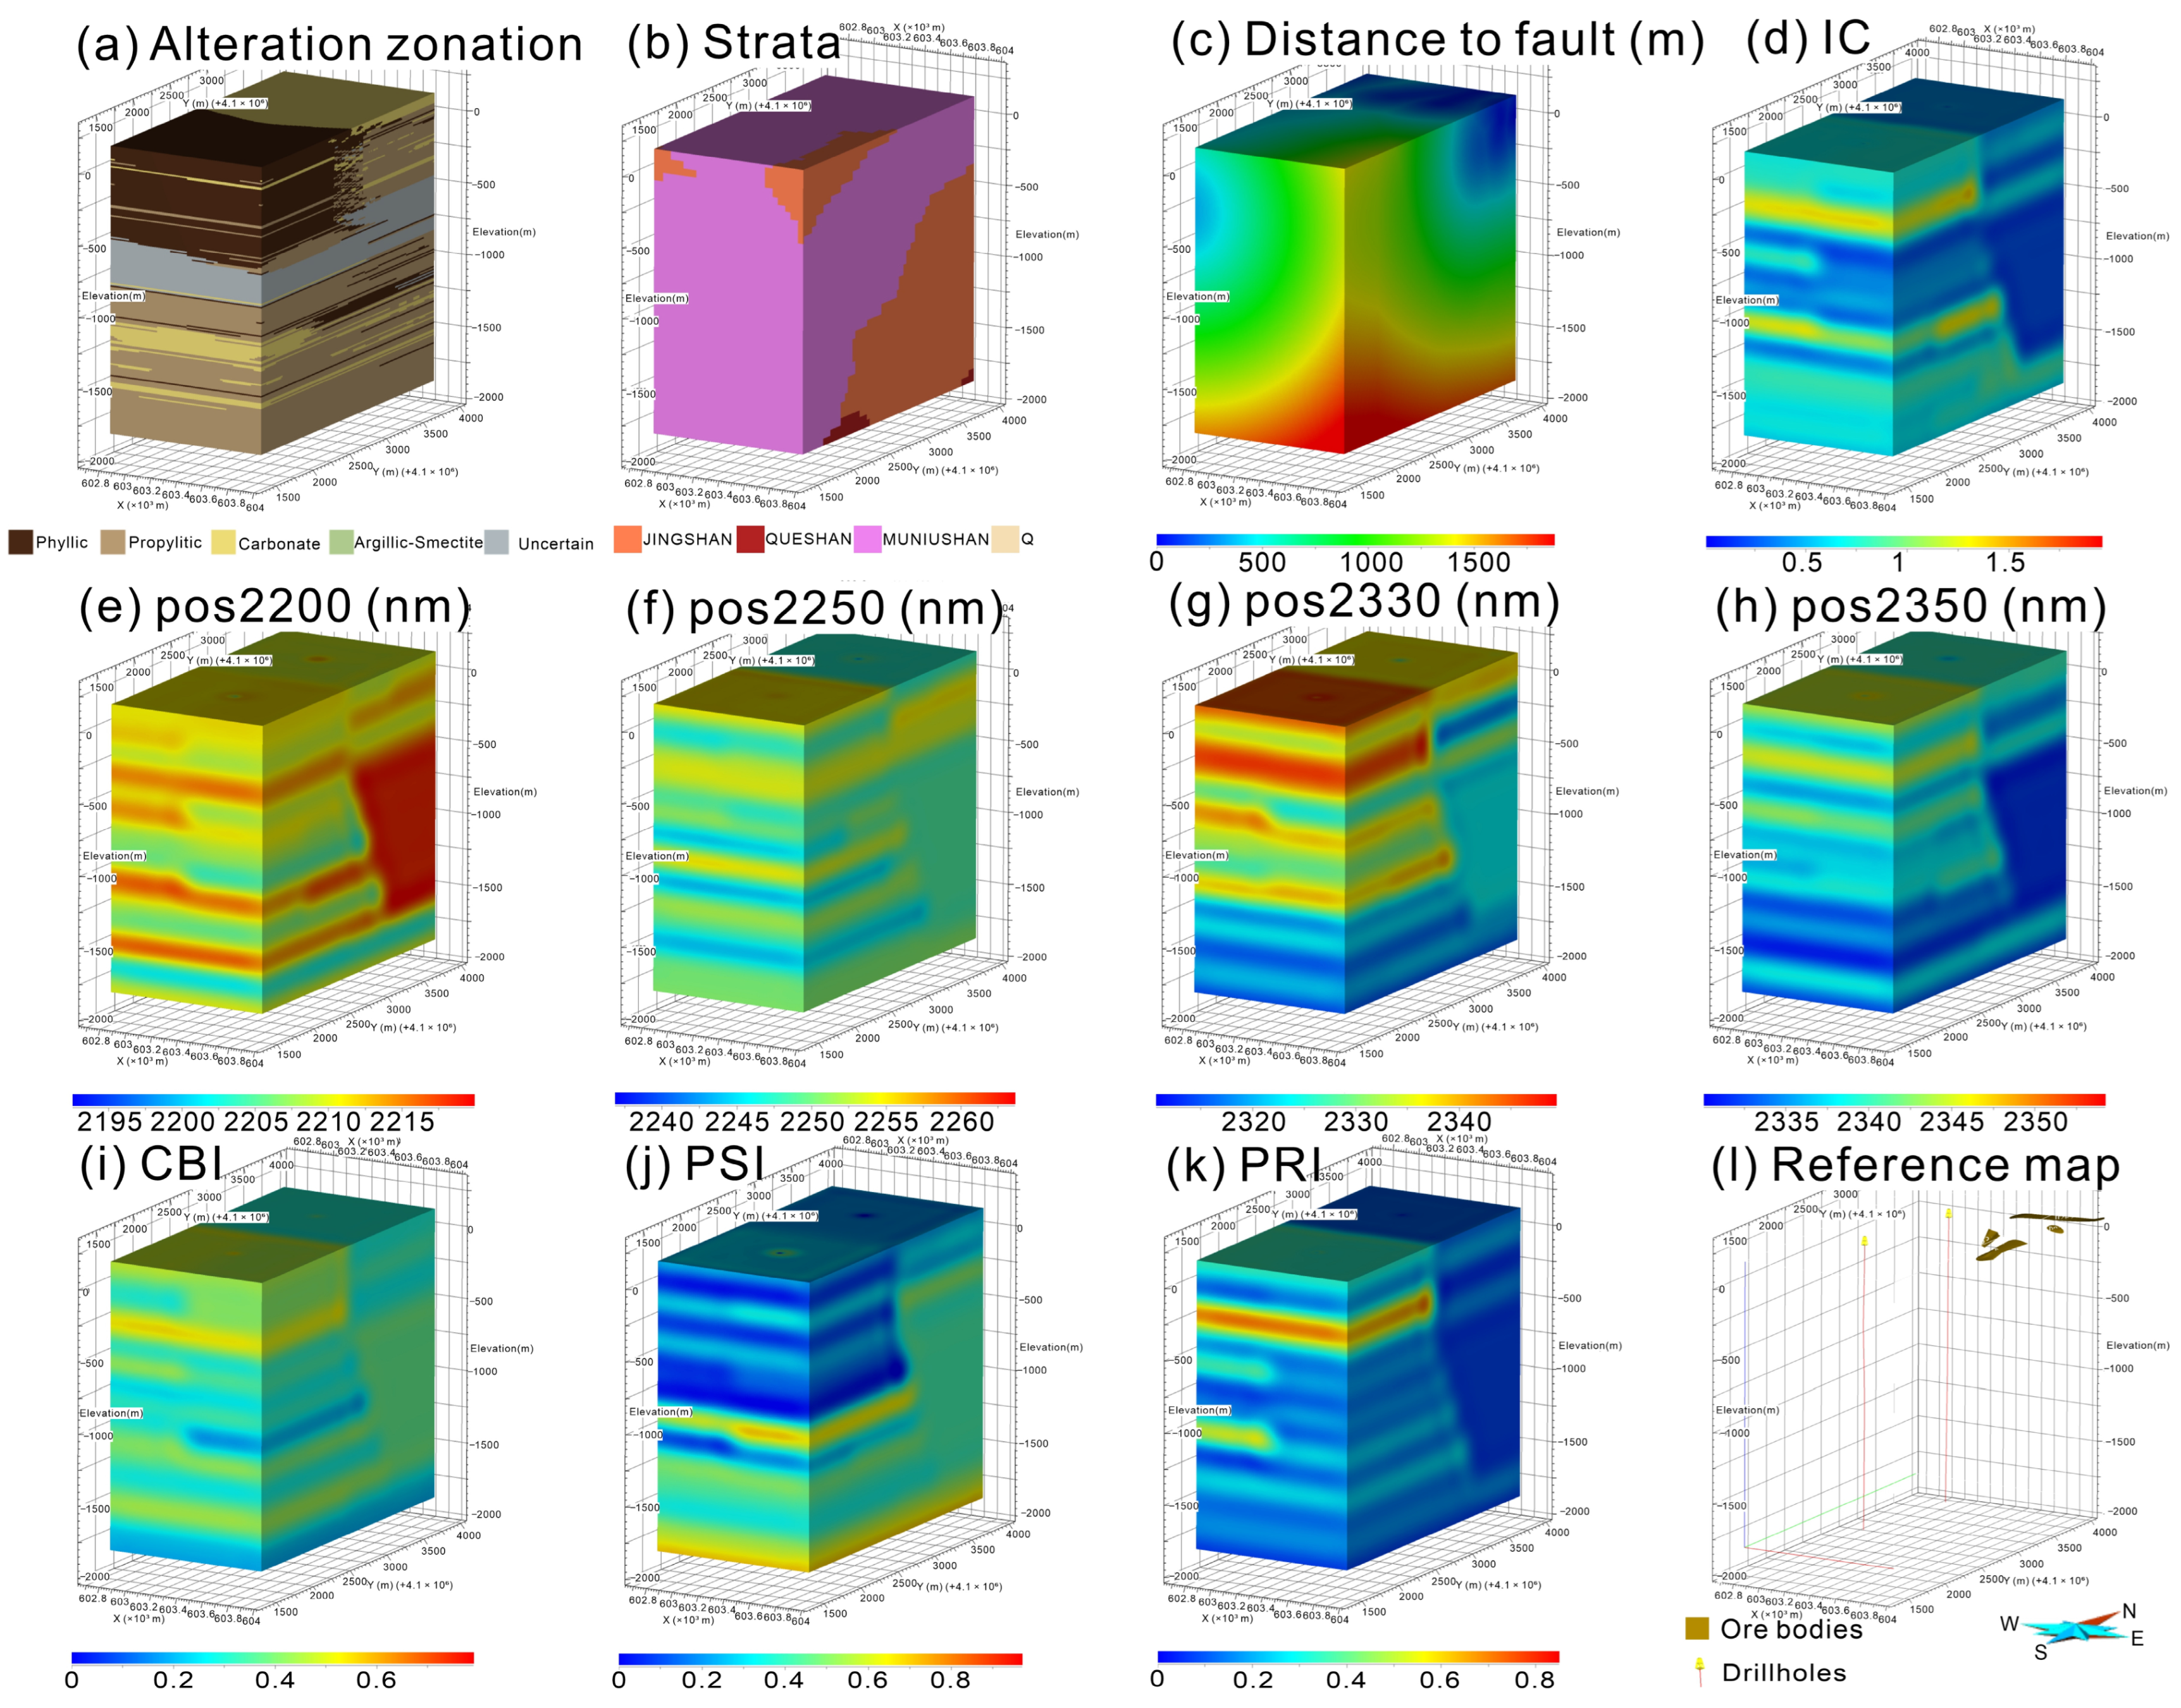
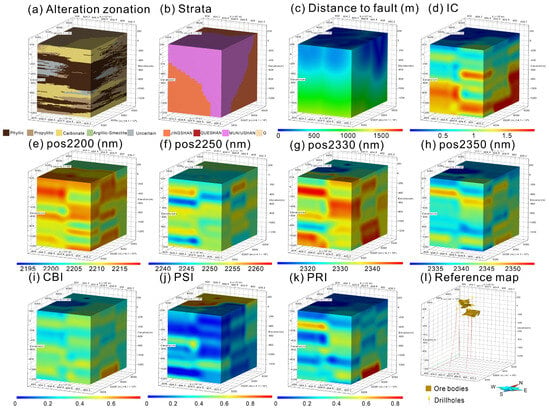
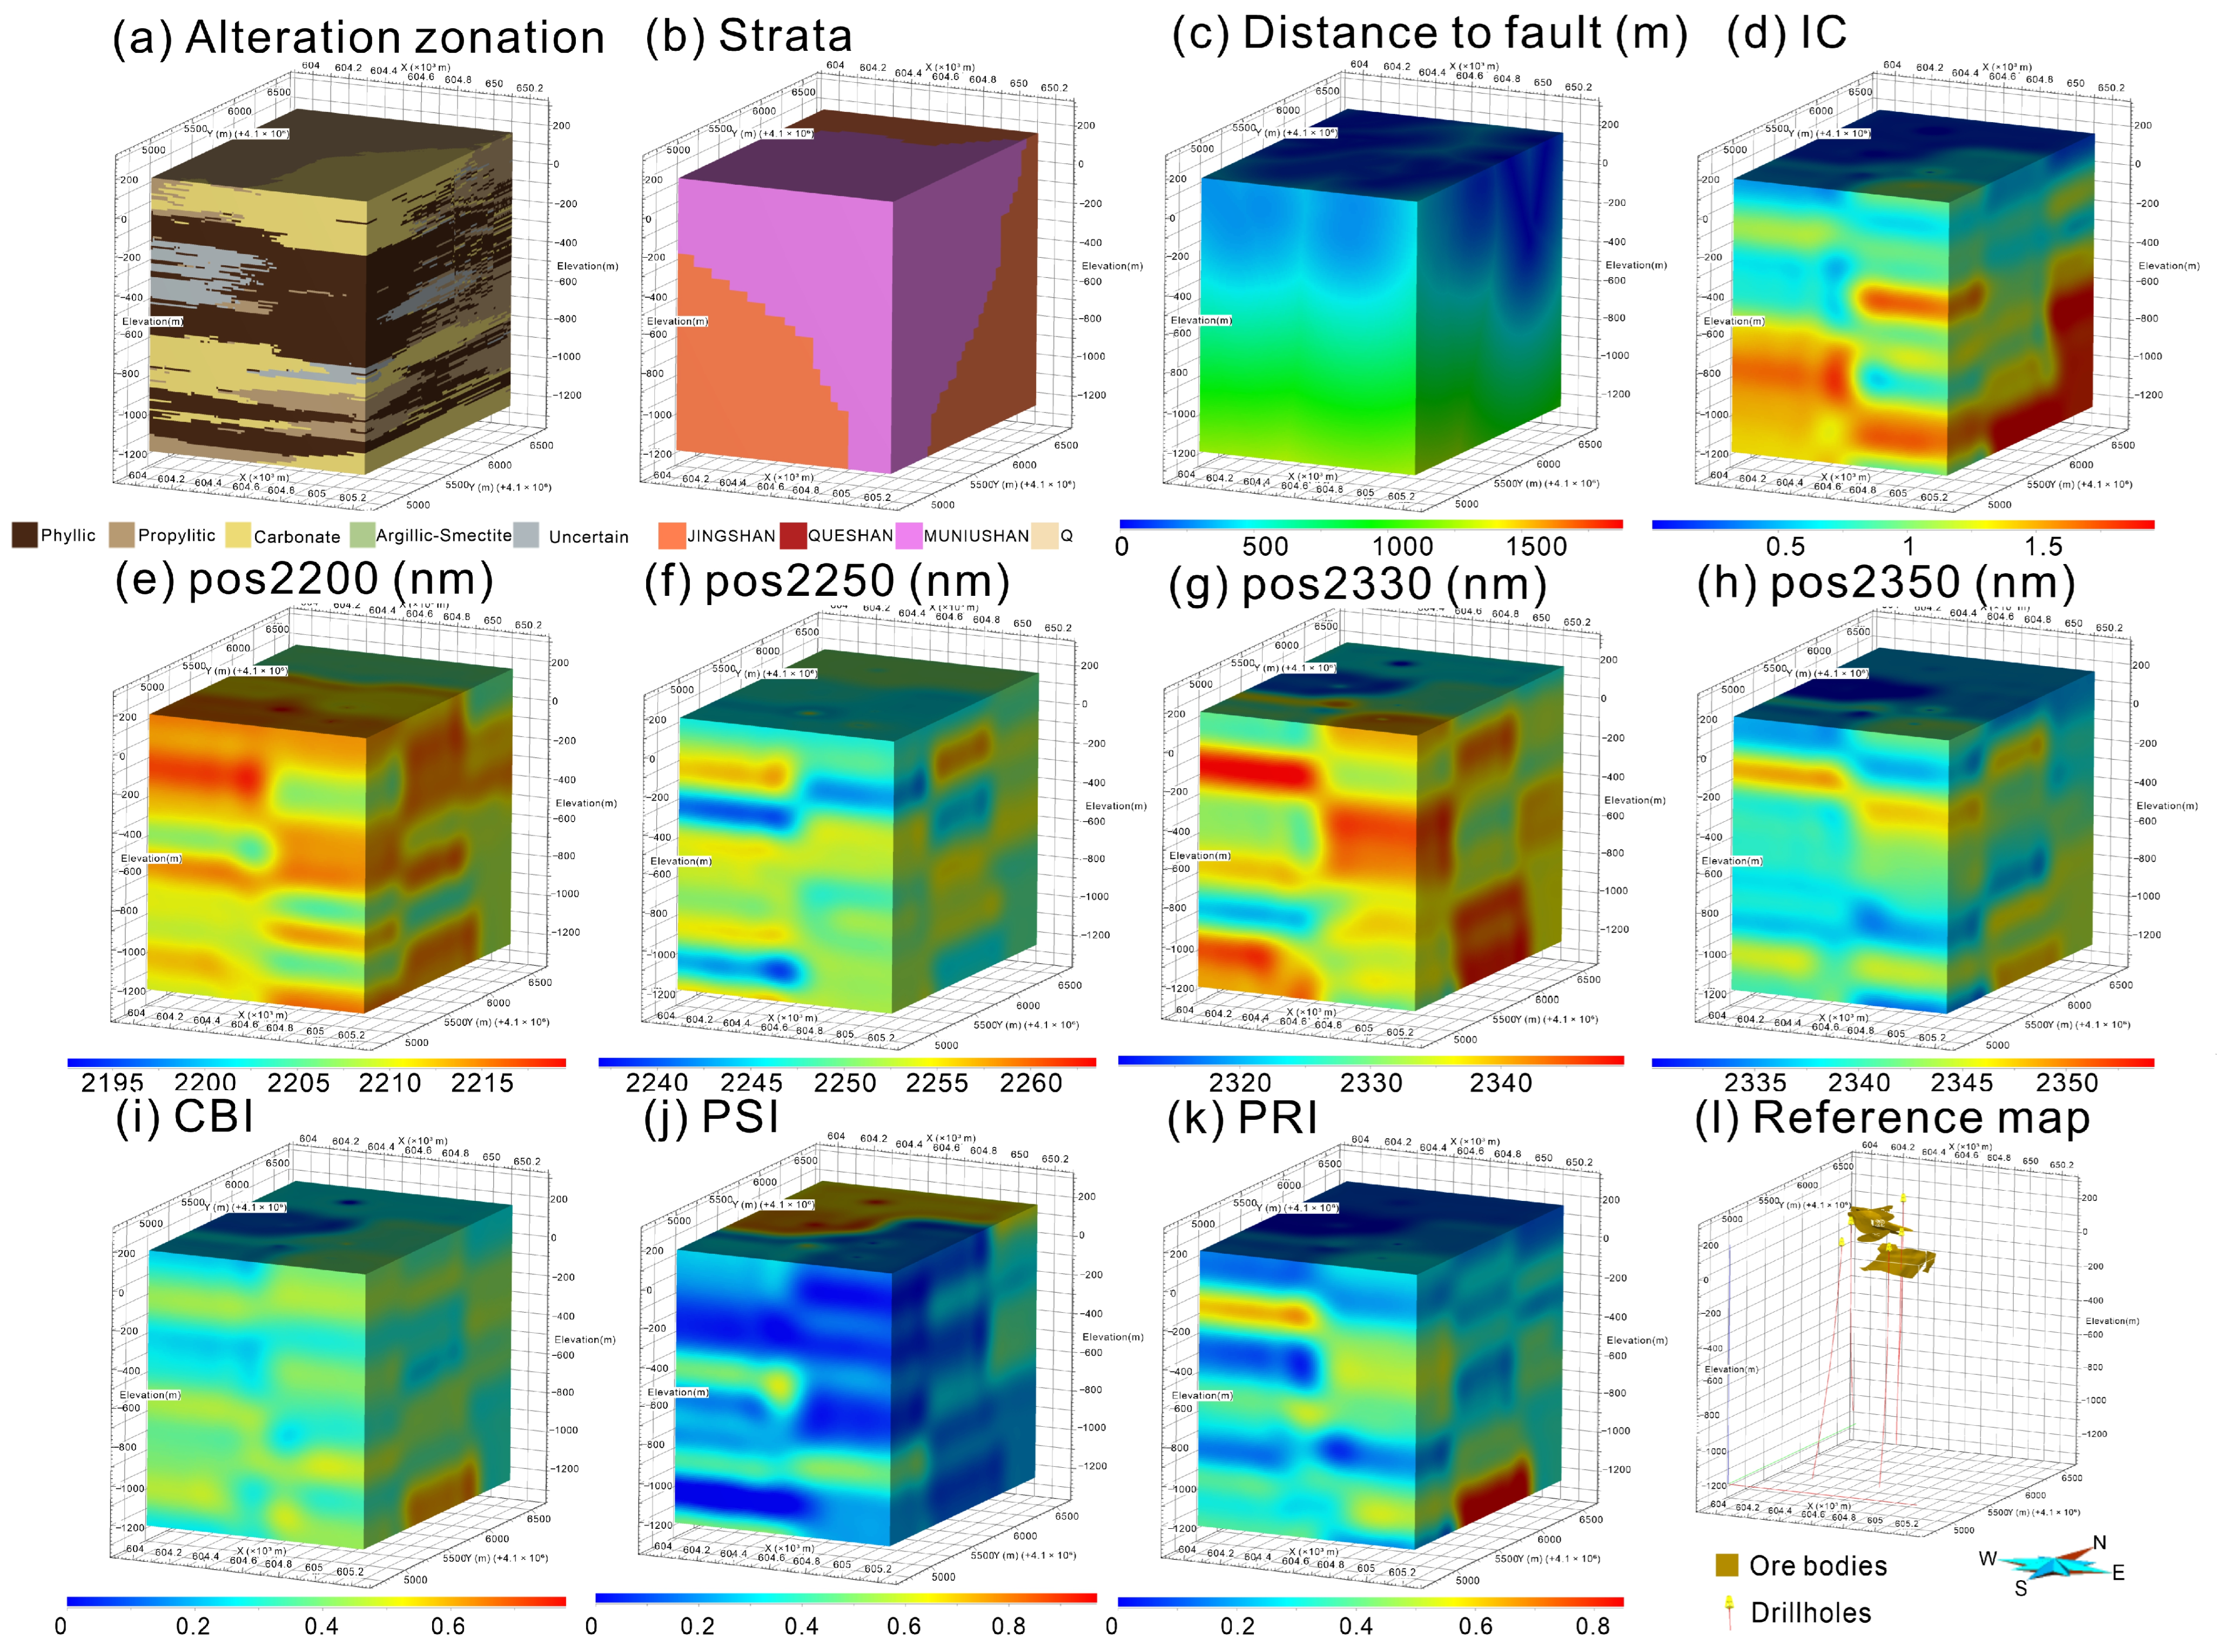
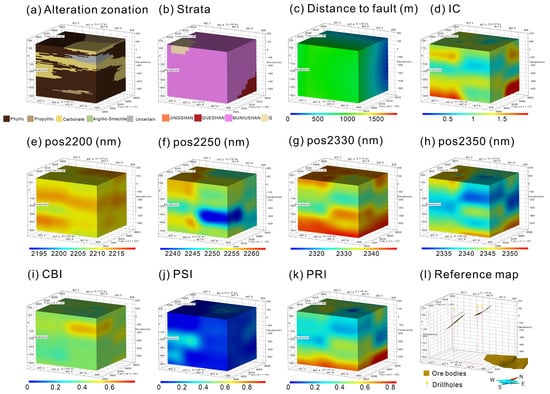
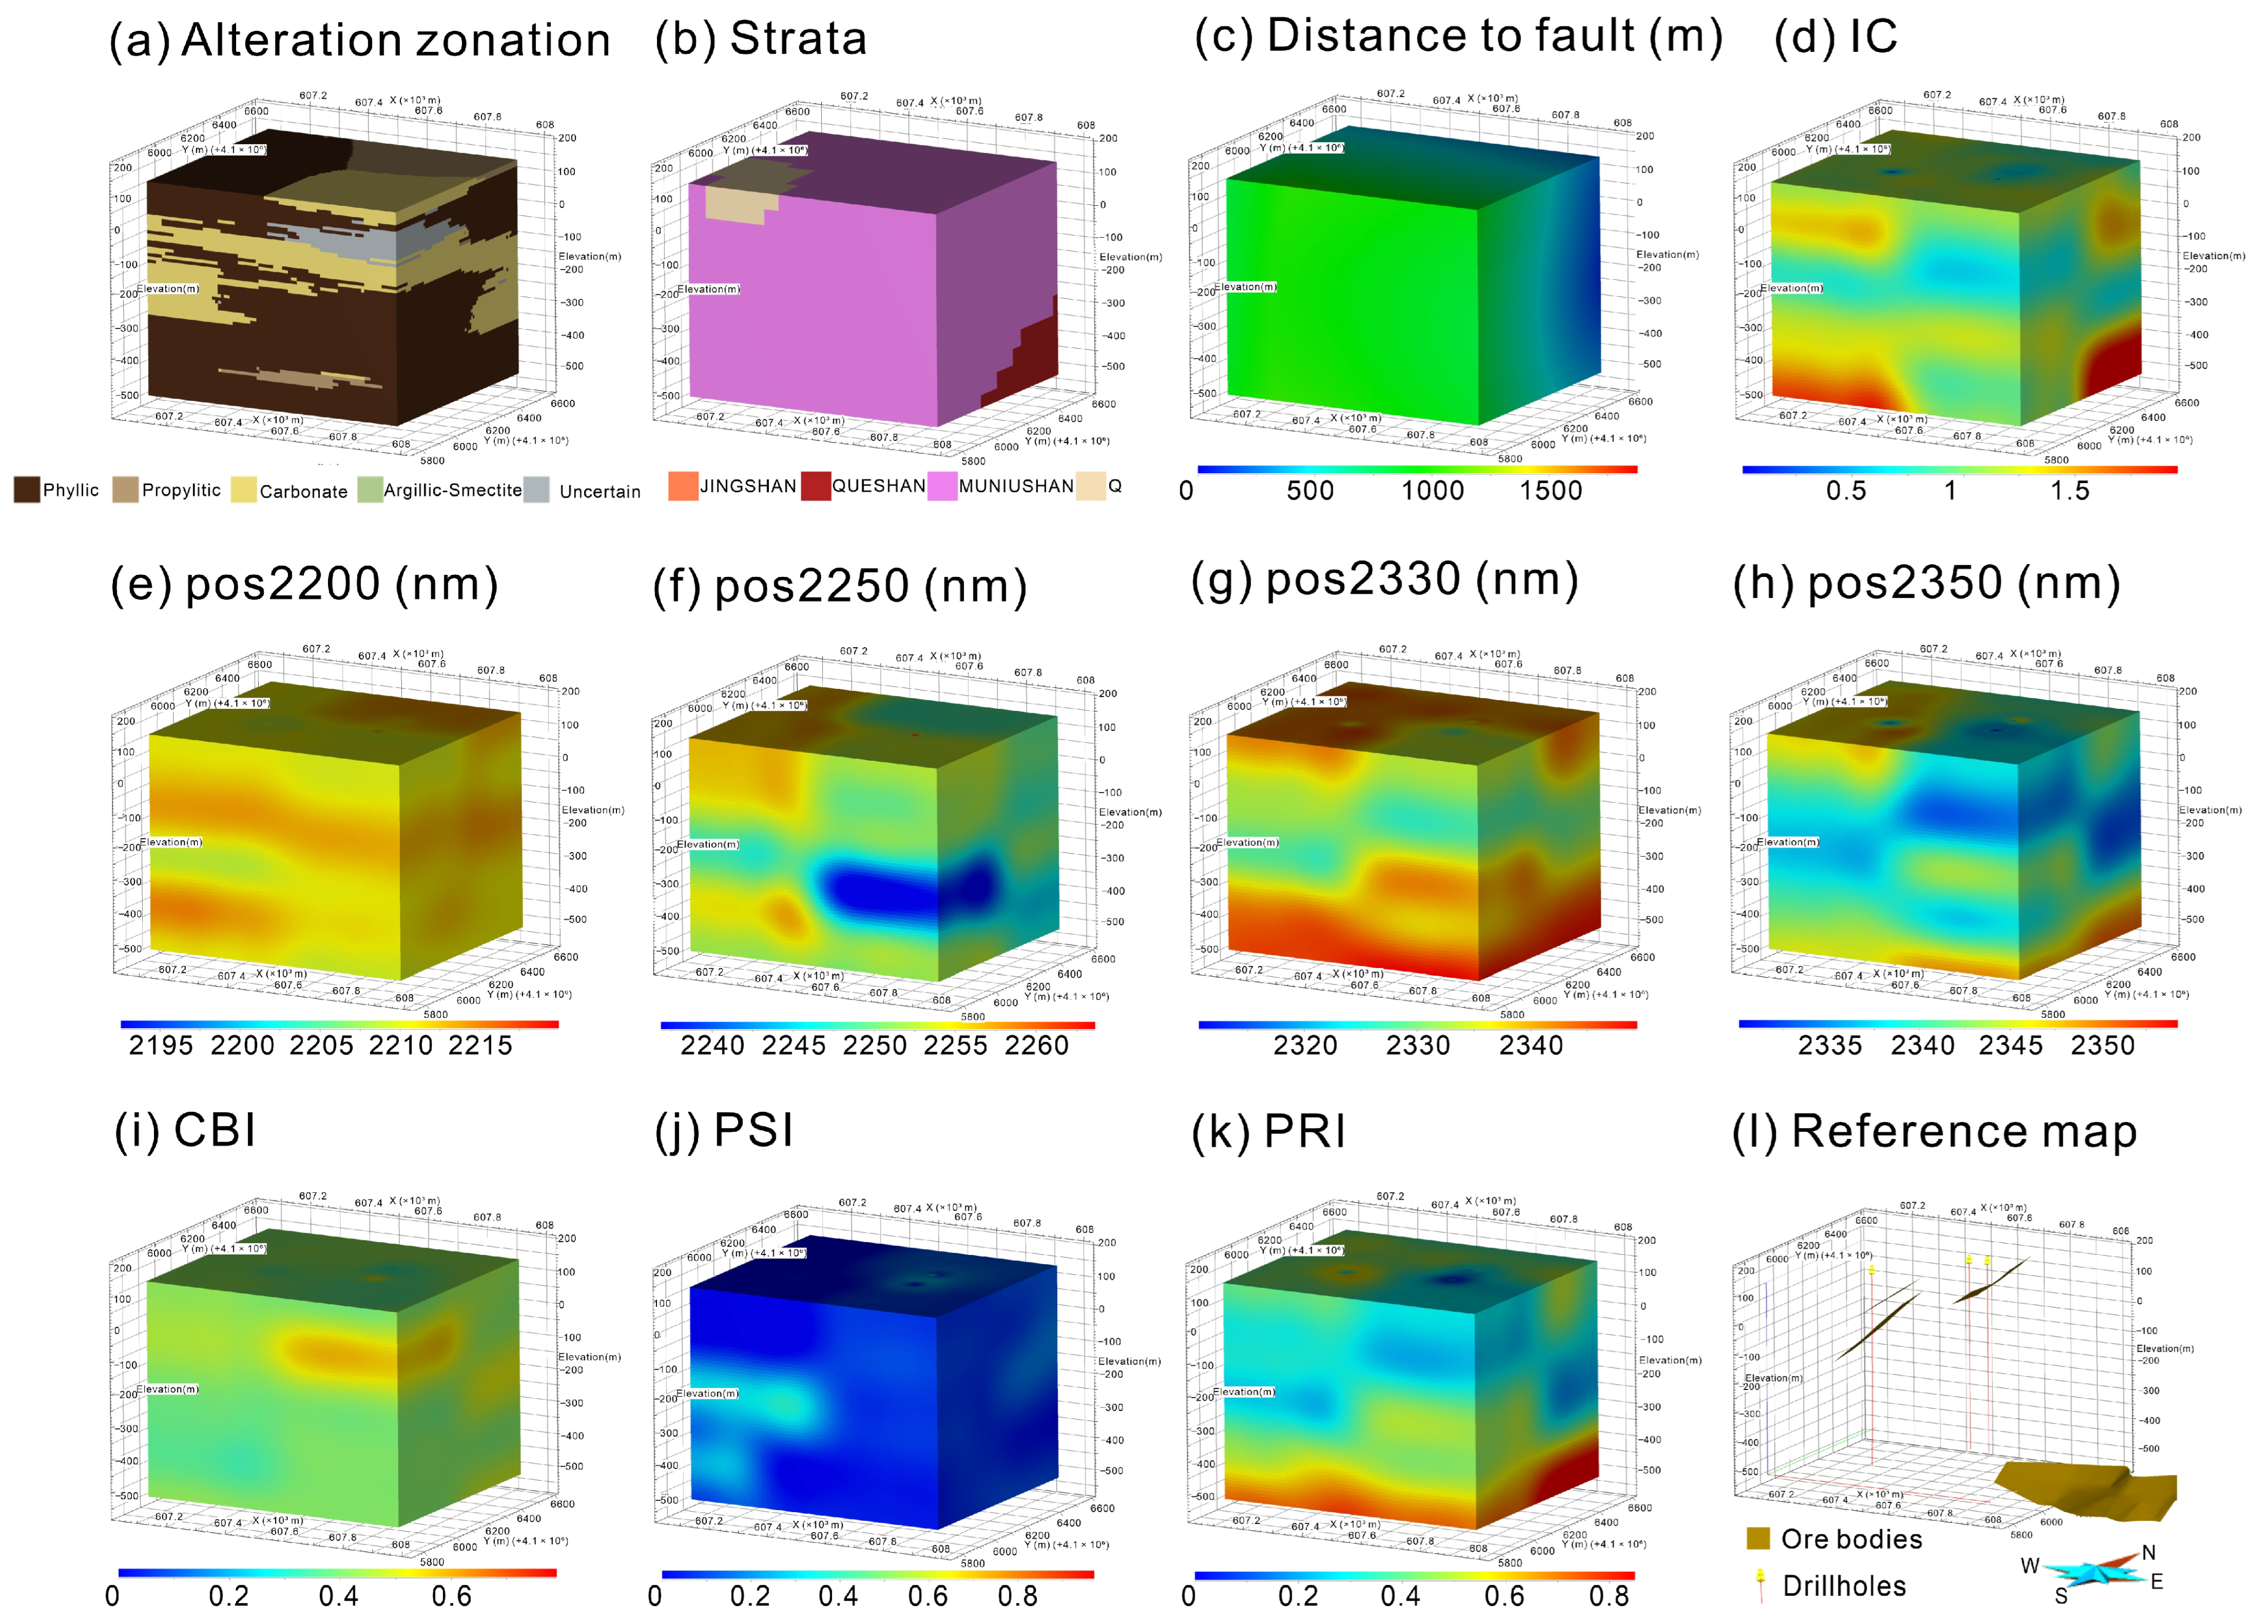
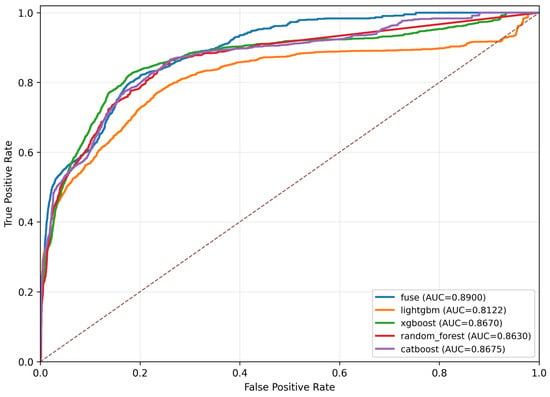
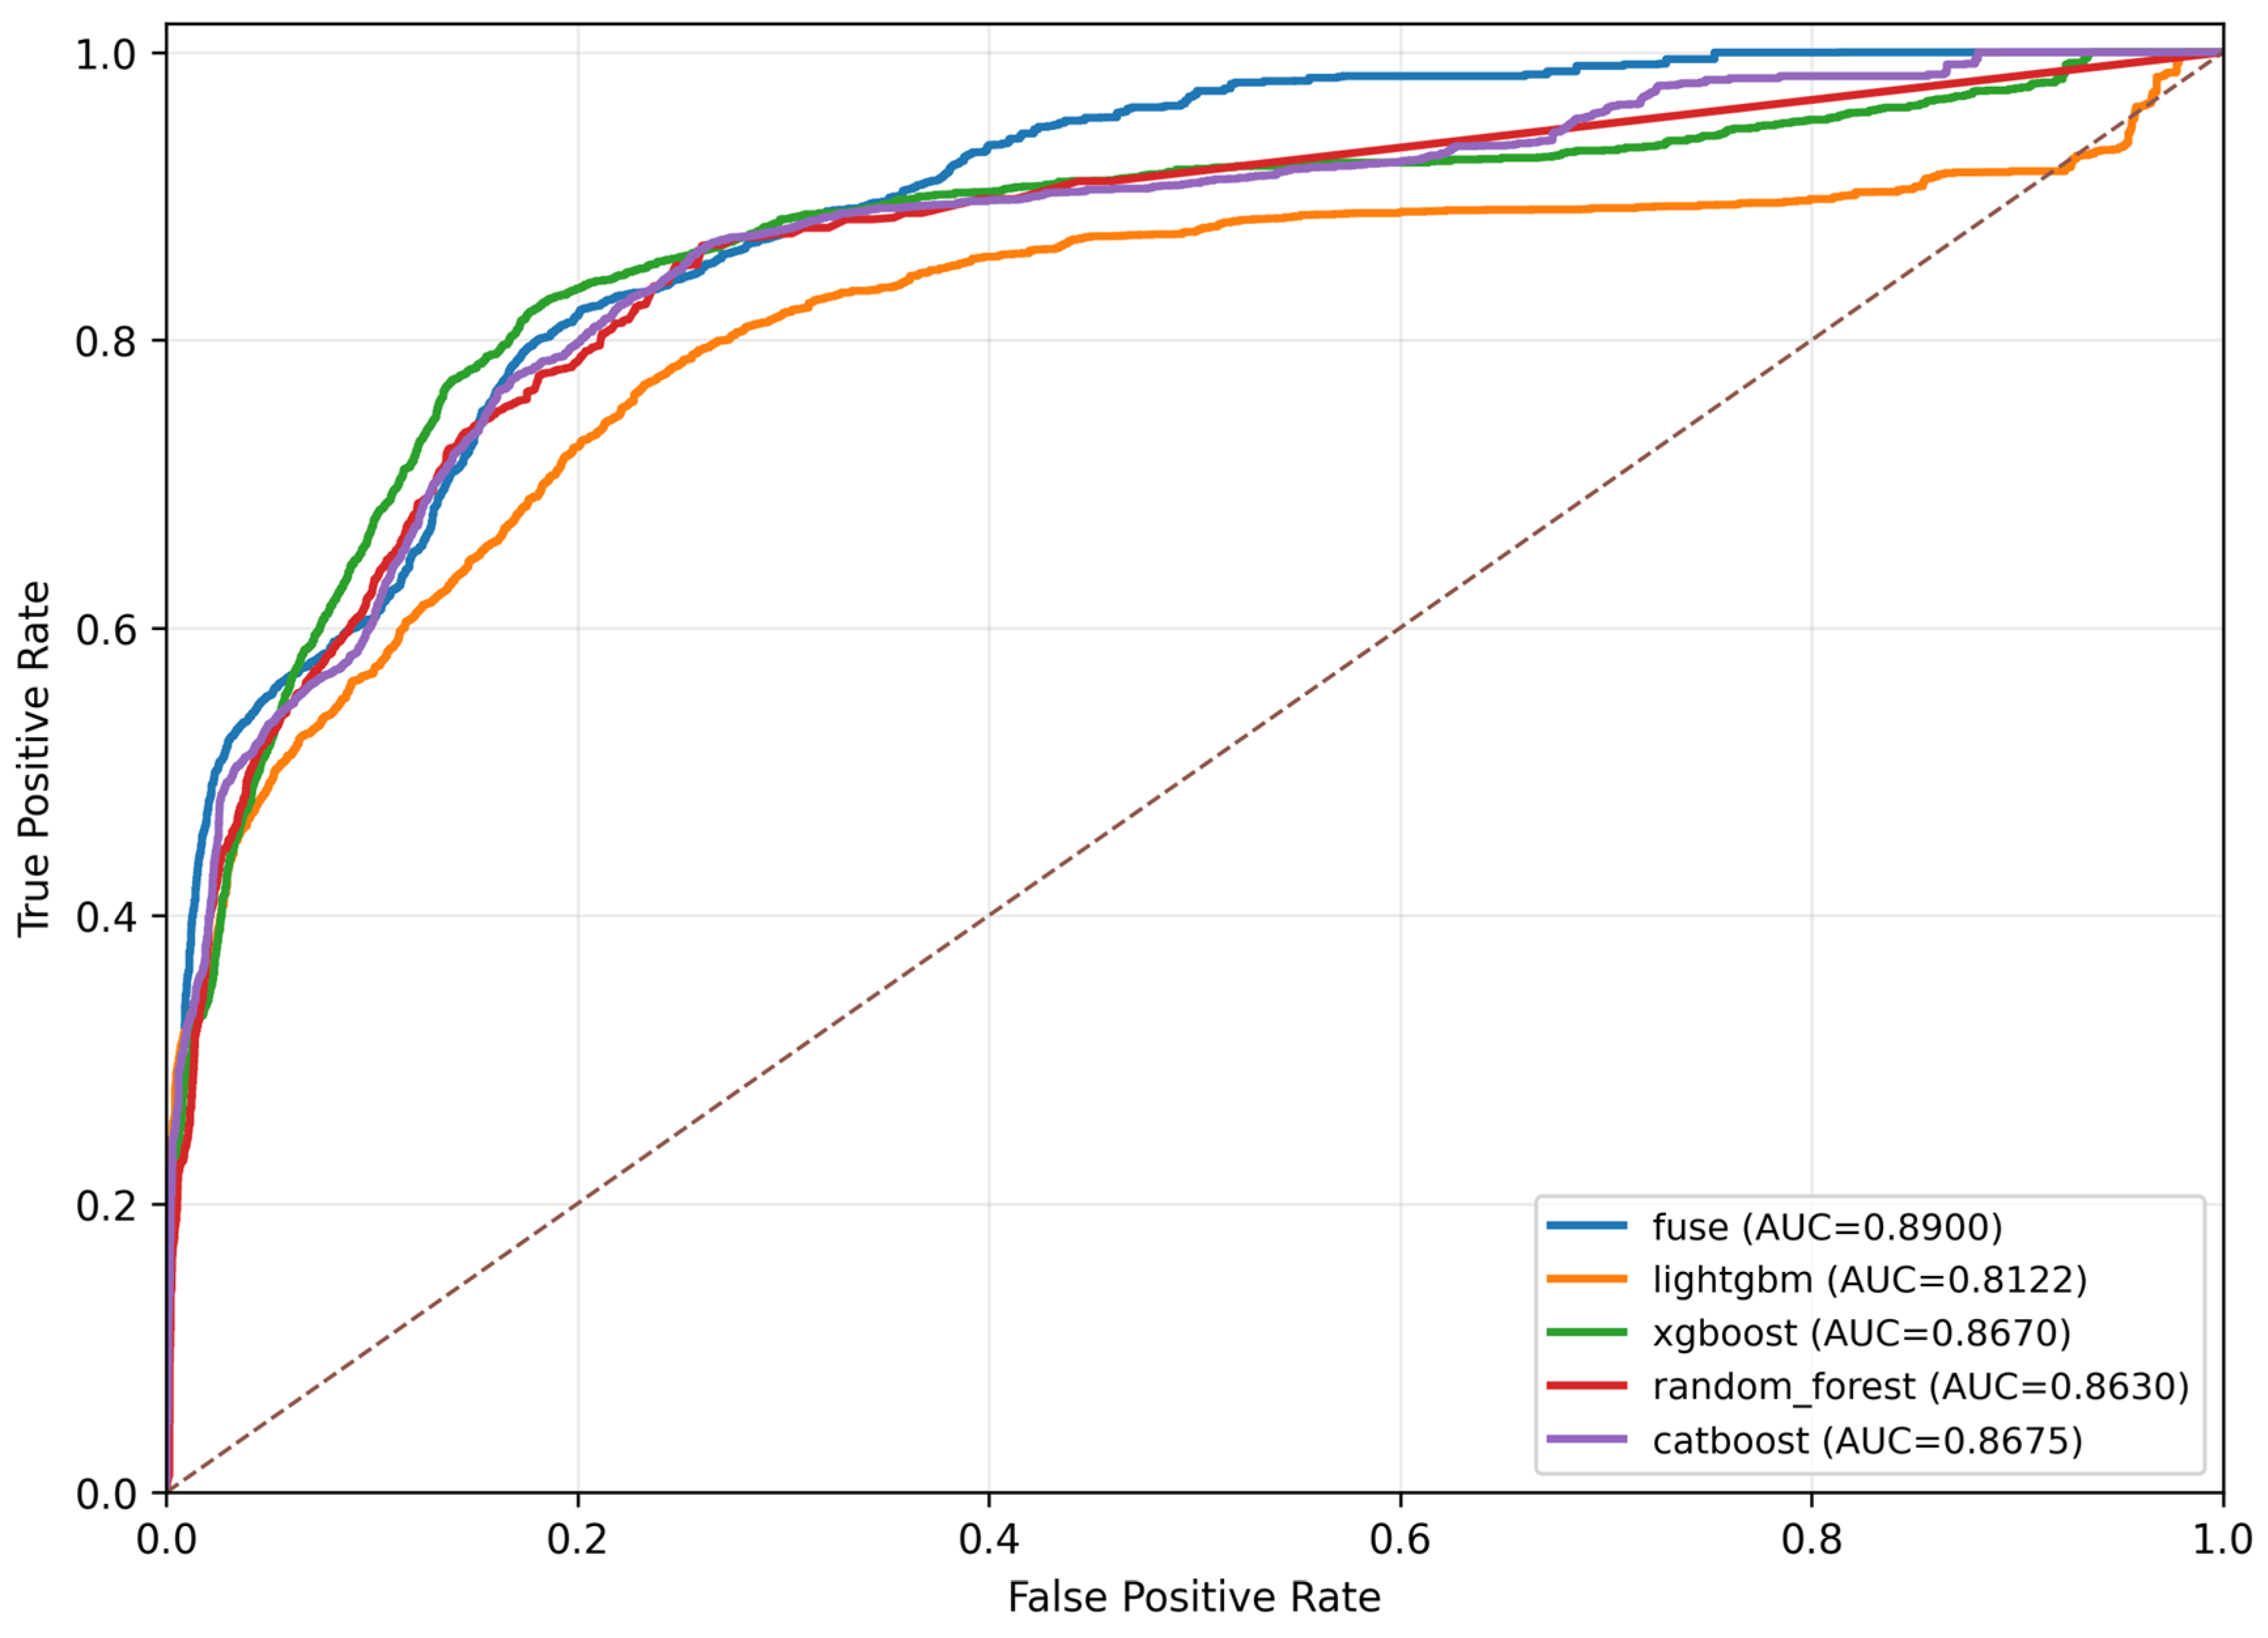
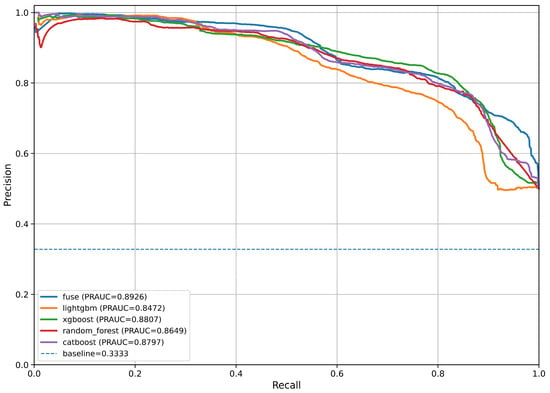
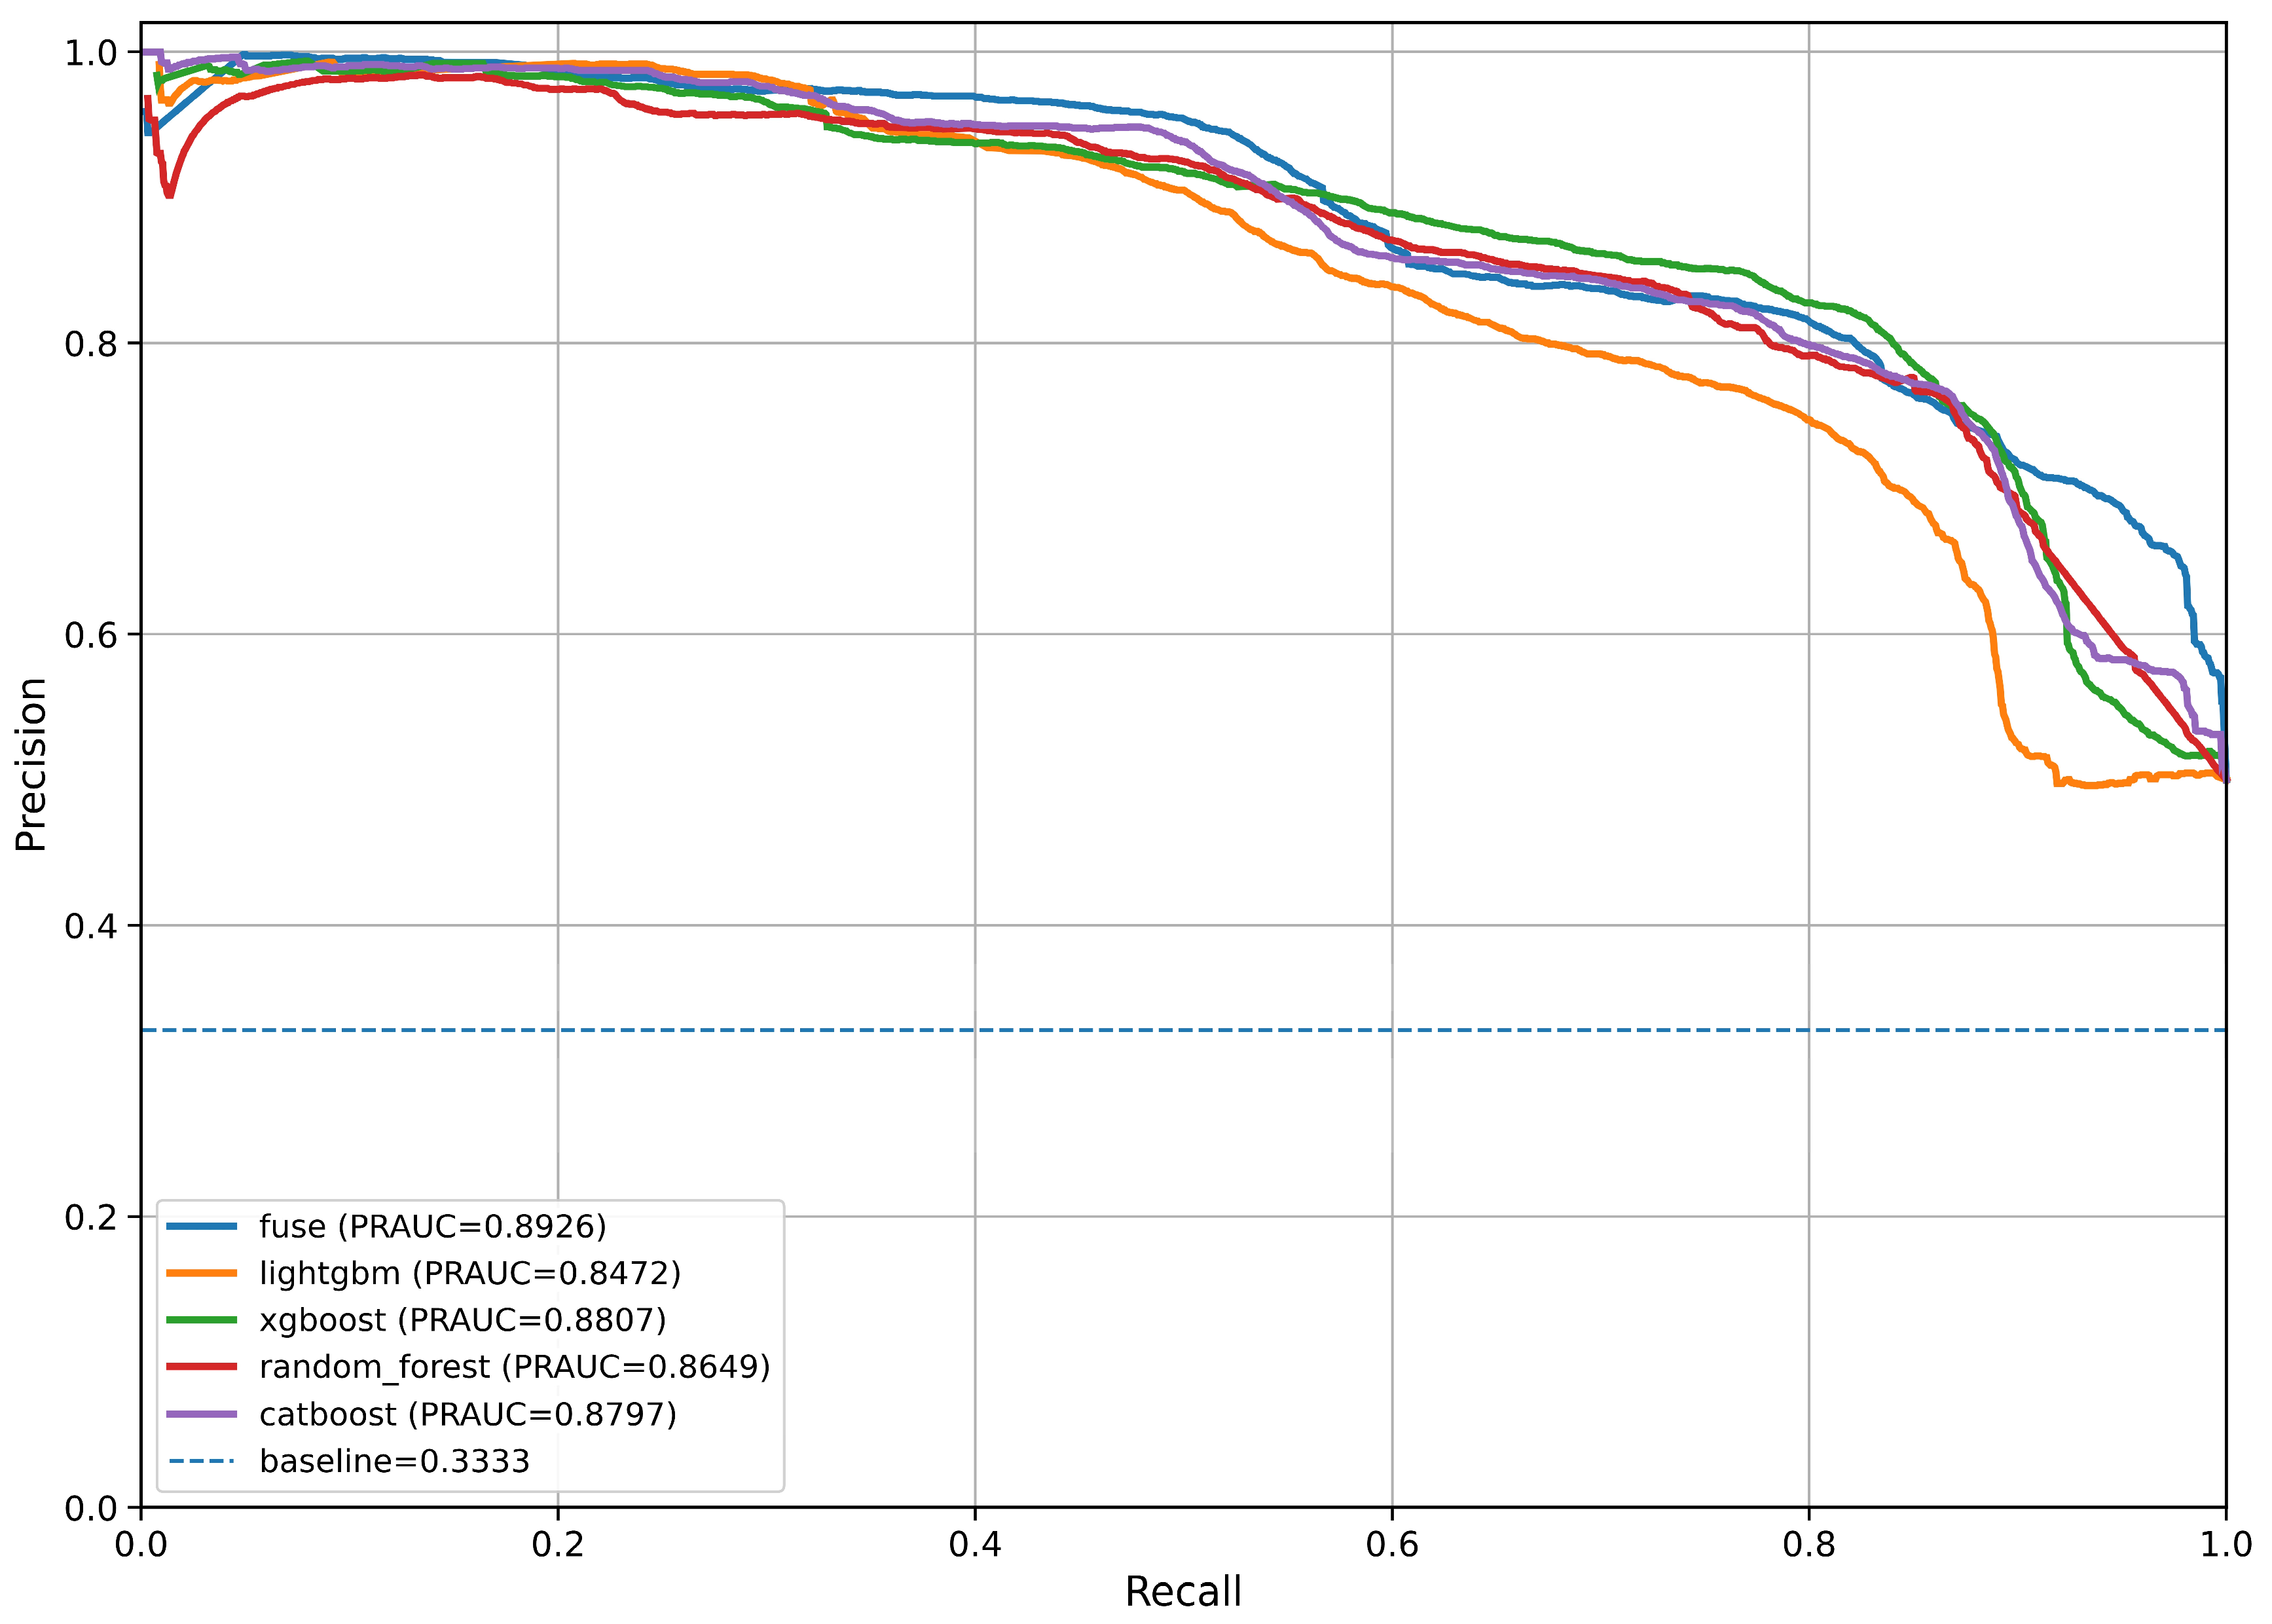
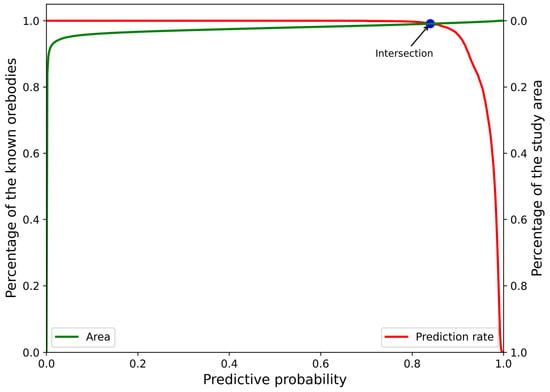
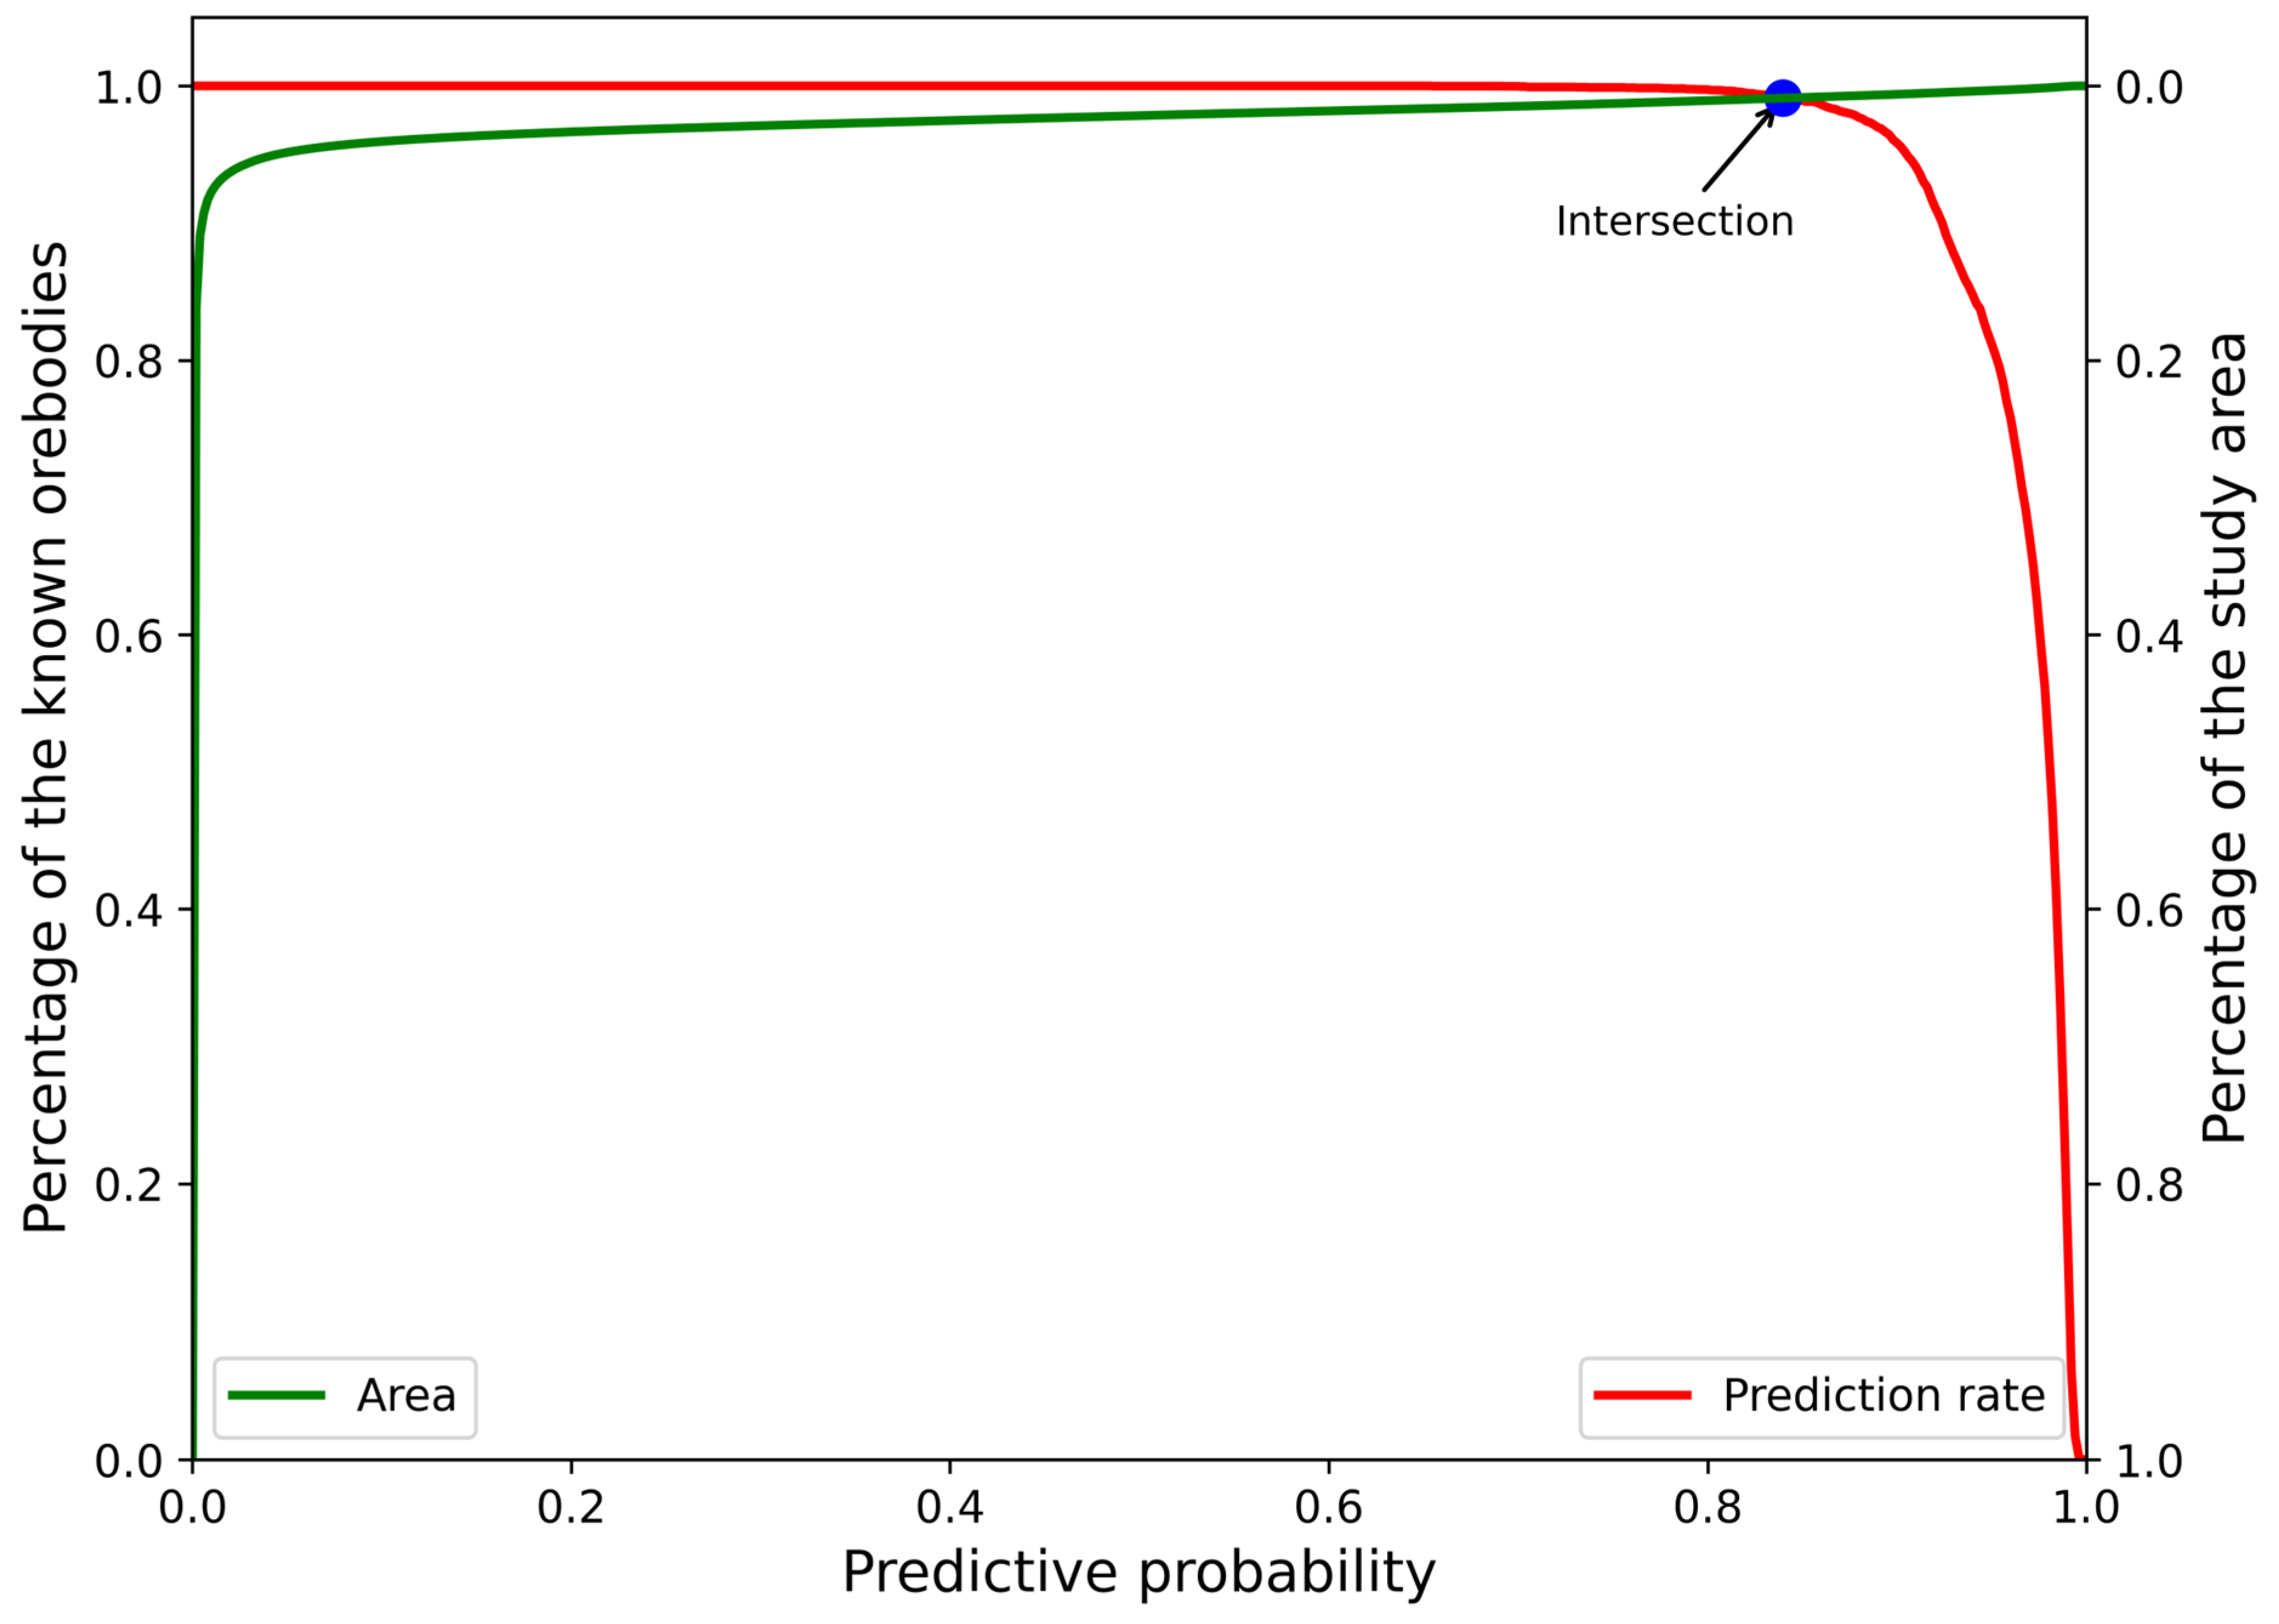
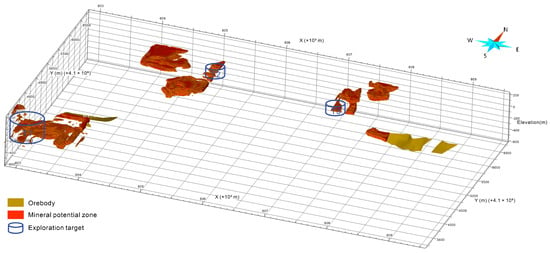
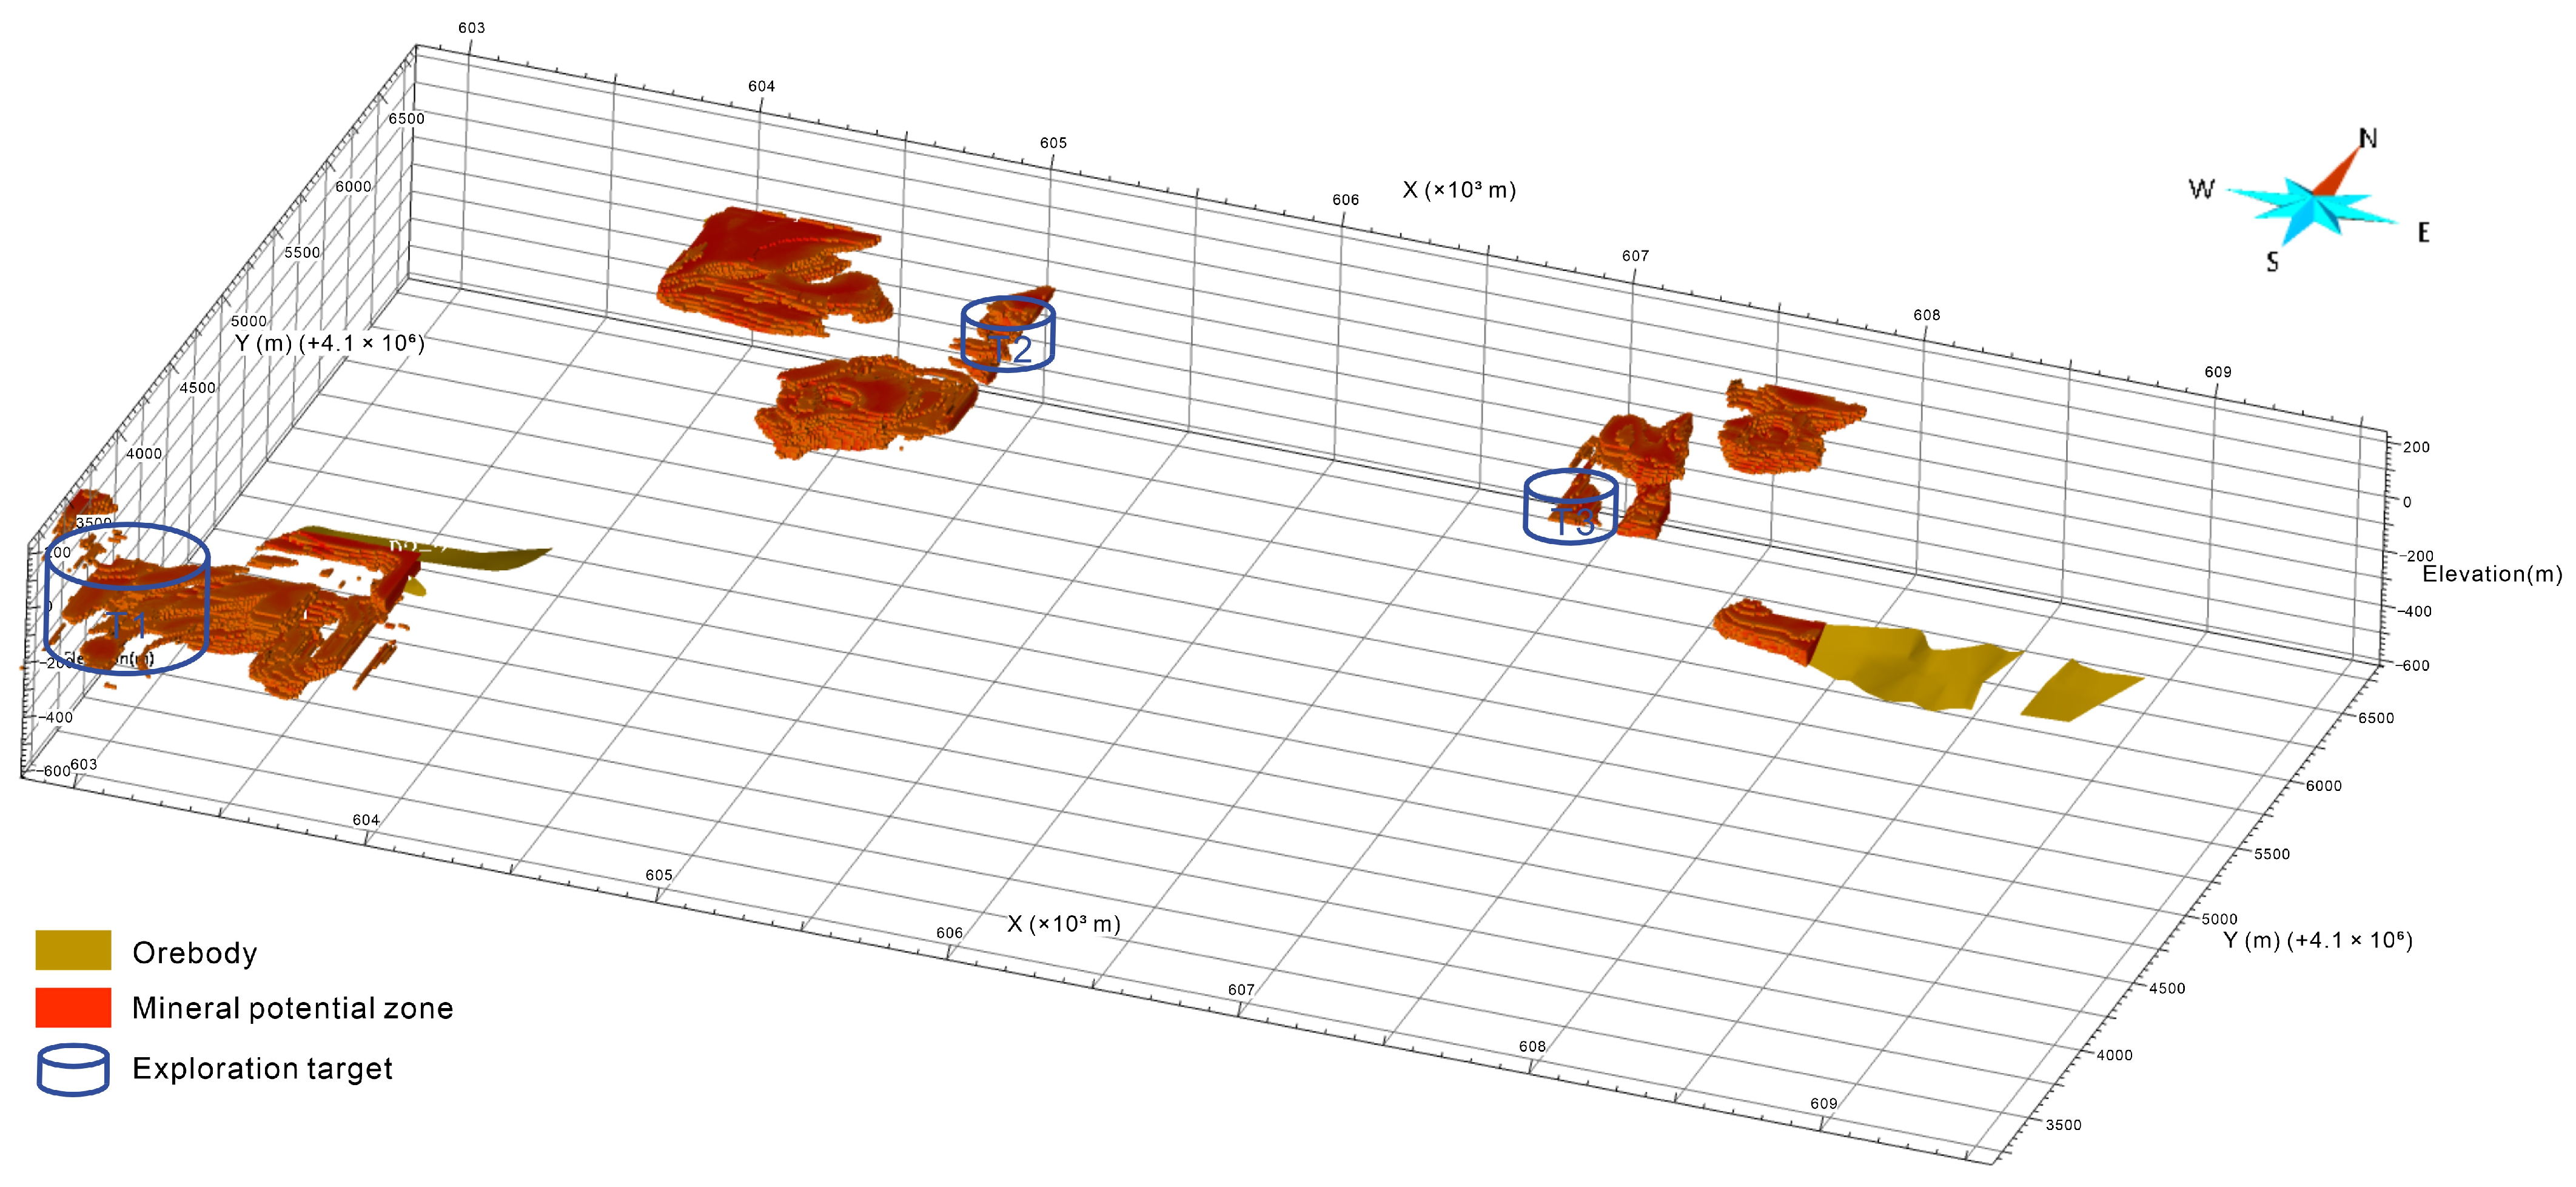

Disclaimer/Publisher’s Note: The statements, opinions and data contained in all publications are solely those of the individual author(s) and contributor(s) and not of MDPI and/or the editor(s). MDPI and/or the editor(s) disclaim responsibility for any injury to people or property resulting from any ideas, methods, instructions or products referred to in the content. |
© 2026 by the authors. Licensee MDPI, Basel, Switzerland. This article is an open access article distributed under the terms and conditions of the Creative Commons Attribution (CC BY) license.