


Abstract
The Duolong district in the central Bangong-Nujiang Suture Zone (BNSZ) is a major porphyry–epithermal Cu-Au cluster in Tibet. We combine radially averaged log-power spectra with a five-level db4 two-dimensional discrete wavelet transform (2D-DWT) to compare depth-sensitive frequency bands with their plan-view expressions in complete Bouguer gravity and reduced-to-the-pole (RTP) aeromagnetic grids. The five-level transform yields signed detail reconstructions d1–d5, ordered from fine to coarse scales, and a final cumulative low-pass approximation a5. The gravity/magnetic spectral estimates are 1.02/1.09 km for the shallow ensemble, 5.12/4.85 km for the intermediate ensemble, and 18.60/21.58 km for the deepest resolved ensemble. These values describe statistical source-depth ranges rather than discrete interfaces. The 2.98 km difference between the deep-source estimates (14.8% of the paired mean) is treated as methodological uncertainty and/or a difference in the depths of the density and magnetization transitions rather than as quantitative identity. The coarsest detail d5 and low-pass approximation a5 express a broad upper-to-middle-crustal background transition and do not image the Moho or a mantle source. Co-located mid-scale gravity and magnetic anomalies are consistent with a composite intrusive–basement source region, but the absence of site-specific density and susceptibility measurements prevents a unique lithological assignment. A southeastern anomaly zone centered approximately at 84.0° E, 31.7° N is therefore presented as a first-order regional screening hypothesis within a broad 3–8 km source-depth band, not as a quantitatively closed drill target. The interpretation distinguishes geophysical observations from geological hypotheses and explicitly incorporates the limitations of spectral and wavelet separation.
1. Introduction
The Bangong-Nujiang Suture Zone (BNSZ) in the central Tibetan Plateau records the complex tectonic evolution of the Tethyan Ocean and the collision between the Qiangtang and Lhasa terranes. Located in the central segment of this suture zone, the Duolong ore district is a super-large porphyry–epithermal Cu-Au cluster with identified copper resources exceeding 10 million tonnes [1], giving it major strategic and economic importance. Resolving its deep-to-shallow crustal architecture and the spatial relationships among intrusive, structural, and hydrothermal systems is important for evaluating models of magma and fluid transfer in an orogenic setting [2,3,4].
However, multiple superimposed tectono-magmatic events, extensive surface cover, and strongly variable country-rock properties complicate conventional geophysical interpretation [5,6,7]. Complete Bouguer anomaly and total-field aeromagnetic data contain superposed signals from sources at different depths, from regional crustal contrasts to shallow intrusive and structural features. Consequently, the spatial relationships among deep crustal property transitions, intermediate-scale anomaly sources, and shallow intrusive-structural systems remain incompletely constrained [8,9].
Wavelet methods are widely used to separate regional and residual potential-field signals, enhance source boundaries, and compare structures across scales. Recent discrete-wavelet and wavelet-entropy studies further demonstrate both the value and the scale- and boundary-sensitivity of multiresolution mapping in potential-field interpretation [10,11]. In this study, radial spectra provide statistical source-depth windows, whereas 2D-DWT provides signed, scale-specific plan-view reconstructions. The contribution is therefore a transparent frequency-to-scale comparison rather than a formal inversion or a claim that wavelet levels uniquely determine geology. The workflow is compared with mapped geology and a regional cross-section, and interpretive uncertainty is carried into regional exploration screening.
2. Geological and Geophysical Background
2.1. Regional Geological Background
The Bangong-Nujiang Suture Zone (BNSZ), which traverses the central Tibetan Plateau, records Mesozoic northward subduction and consumption of the Tethyan Ocean followed by collision between the Lhasa and Qiangtang terranes. The Duolong super-large porphyry–epithermal Cu-Au district—including the Tiegelongnan, Duobuza, Bolong, and Nating deposits—is situated along the northern margin of the central BNSZ, within the forearc-basin tectonic belt on the southern margin of the Qiangtang Terrane. Its subduction–collision–extension history produced a complex intracrustal fault framework and widespread magmatic–metallogenic activity [12,13].
The exposed stratigraphic succession is relatively simple but strongly deformed and comprises two principal sedimentary–volcanic sequences that host mineralization [7,9,14,15]:
- The Upper Triassic to Middle Jurassic Mugagangri Group is characterized by deep- to semi-deep-marine siliciclastic rocks, including interbedded sandstone, shale, and chert. Intense tectonic shearing has transformed the succession into a complex tectonic mélange that constitutes the sedimentary basement and principal country rock of the study area.
- The Lower Cretaceous Meiriqieco Formation unconformably overlies the Mugagangri Group and consists mainly of continental intermediate-to-felsic volcaniclastic rocks and lava sequences that record the late-collisional tectonic transition.
Ore-bearing magmatism in the district was concentrated at approximately 120 Ma. Granodiorite–porphyry and quartz–diorite–porphyry stocks were emplaced at shallow crustal levels (approximately 0–3 km) within a structurally complex NW- and NE-trending fault network. Geological observations support structurally focused magma and fluid ascent, but the potential-field workflow used here does not by itself resolve the full feeder geometry or demonstrate direct connection to the mantle.
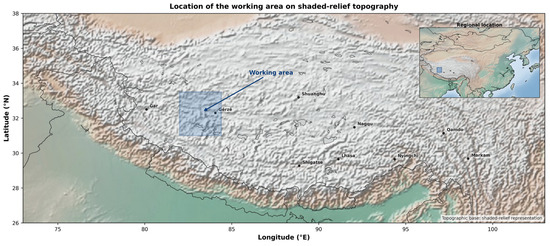
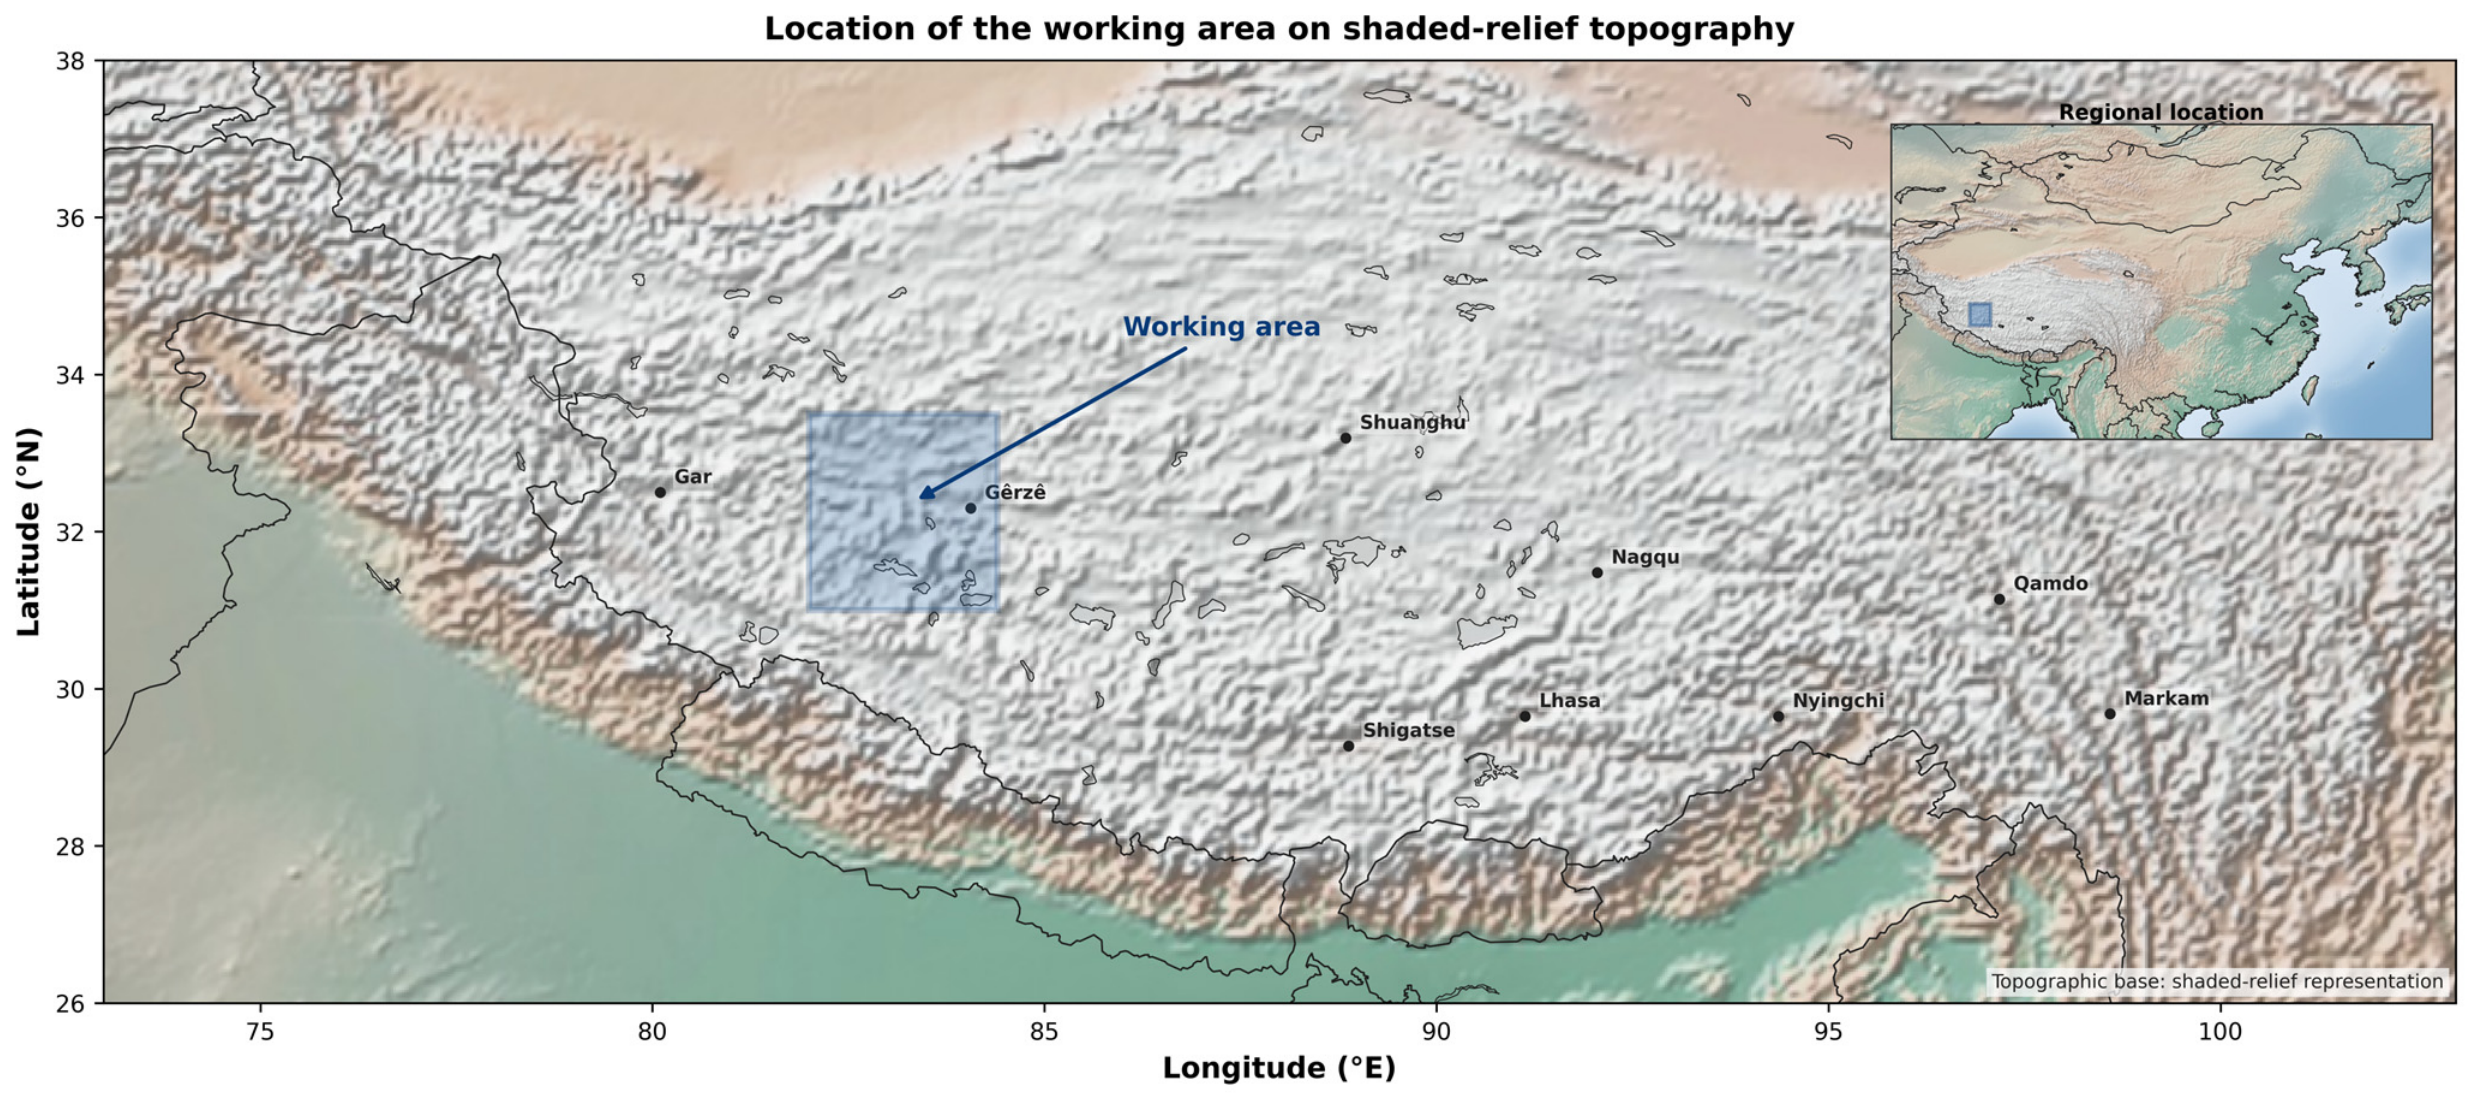
Figure 1 shows the regional working area on shaded-relief topography. The regional map spans approximately 82.0–84.4° E and 31.0–33.5° N, northwest of Gêrzé County and southwest of Shuanghu. The narrower common comparison window used for the gravity–magnetic overlays is defined in Section 3.1.
Figure 1.
Regional location of the working area on shaded-relief topography. The blue rectangle marks the regional geophysical working area (approximately 82.0–84.4° E and 31.0–33.5° N); the inset shows its location within China.
2.2. Regional Geophysical and Physical Properties
Potential-field anomalies arise from spatial contrasts in density and magnetization, and different combinations of lithology, geometry, depth, and alteration can generate similar field patterns. No new laboratory or downhole density and magnetic-susceptibility measurements were available for this study; petrophysical associations are therefore treated as qualitative geological priors rather than fixed property correlations [7,8,9].
The regional geological framework contains Mugagangri sedimentary and locally metamorphosed basement, Meiriqieco volcanic–sedimentary rocks, and Early Cretaceous intrusive complexes. Silica-rich granodioritic rocks are commonly less dense than metamorphic basement, so a gravity high cannot be assigned directly to a felsic intrusion. Positive gravity responses may also reflect basement relief, denser intermediate-to-mafic phases or cumulates, or the superposition of several sources.
Magnetic responses depend on the abundance, grain size, and alteration state of magnetic minerals as well as remanence and source temperature. A magnetic high may be associated with magnetite-bearing intrusive or volcanic rocks, whereas oxidation, hydrothermal alteration, deformation, or temperatures approaching the Curie point may reduce magnetization. Neither high nor low magnetic amplitude provides a unique lithological diagnosis.
Gravity and RTP magnetic anomalies are consequently evaluated jointly with mapped geology only after the spectral depth analysis and multiscale separation are presented. The depth-dependent property associations are developed from the results in Section 4 and Section 5, where their non-uniqueness and required independent constraints are stated explicitly.
This petrophysical context guides interpretation without predetermining the depths, geometry, or lithological identity of the recovered anomaly ensembles.
3. Methodology
3.1. Data Products and Analysis-Stage Preprocessing
The analysis uses provider-supplied gridded products: a complete Bouguer anomaly grid (mGal) and an RTP aeromagnetic grid (nT) available in the study archive. The complete Bouguer anomaly represents the gravity field after the standard Bouguer reduction applied during upstream processing. Raw gravity stations, flight-line files, line spacing, tie-line statistics, and provider-specific reduction parameters were not included in the archive; these acquisition and processing attributes therefore cannot be reconstructed independently.
Before spectral and wavelet analysis, both grids were screened for missing nodes and isolated spikes, aligned on a common regular grid, and demeaned. The common quantitative comparison window is 82.5–84.0° E and 31.0–33.0° N. For regional context, the gravity field extends westward to 82.3° E. A first-order plane and the same cosine edge taper were applied to both datasets only for Fourier-spectrum estimation to reduce spectral leakage; zero padding improved computational efficiency but added no spatial resolution. The aligned, untapered complete Bouguer and RTP grids were used for 2D-DWT. No manual editing of geological anomalies was undertaken.
Normal-gravity, free-air, Bouguer, and terrain corrections for gravity, together with diurnal/IGRF, lag, heading, tie-line leveling, and micro-leveling corrections for aeromagnetics, belong to upstream grid production. Their processing parameters could not be audited from the available archive, which limits independent reproduction from the original observations but does not prevent reproduction of the analysis from the processed grids.
3.2. Two-Dimensional Discrete Wavelet Transform (2D-DWT) Multiscale Separation
f(x, y) = Aj(x, y) + Djᴴ(x, y) + Djⱽ(x, y) + Djᴰ(x, y)
The 2D-DWT was used as a non-redundant multiresolution filter for the complete Bouguer and RTP grids. At every dyadic level j, the transform produces horizontal, vertical, and diagonal coefficient arrays (Hj, Vj, and Dj) together with a lower-frequency approximation Aj [16,17,18,19,20,21].
φ(x, y) = φ(x)φ(y)
ψᴴ(x, y) = φ(x)ψ(y), ψⱽ(x, y) = ψ(x)φ(y), ψᴰ(x, y) = ψ(x)ψ(y)
f(x, y) = a5(x, y) + ∑j = 15 dj(x, y)
A five-level decomposition (j = 1,…,5) was performed with the Daubechies db4 basis. The 15 directional coefficient arrays were not summed into five scalar arrays. For each level, a signed scale-specific field dj was reconstructed by inverse 2D-DWT while retaining Hj, Vj, and Dj at that level and setting the approximation and all other detail coefficients to zero. Thus, d1–d5 are five full-field reconstructions that preserve all three orientations; a5 is the final cumulative low-pass approximation.
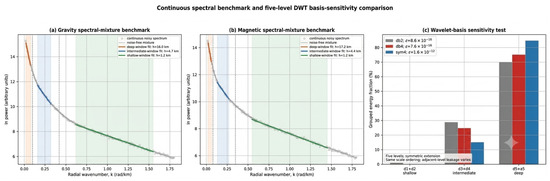
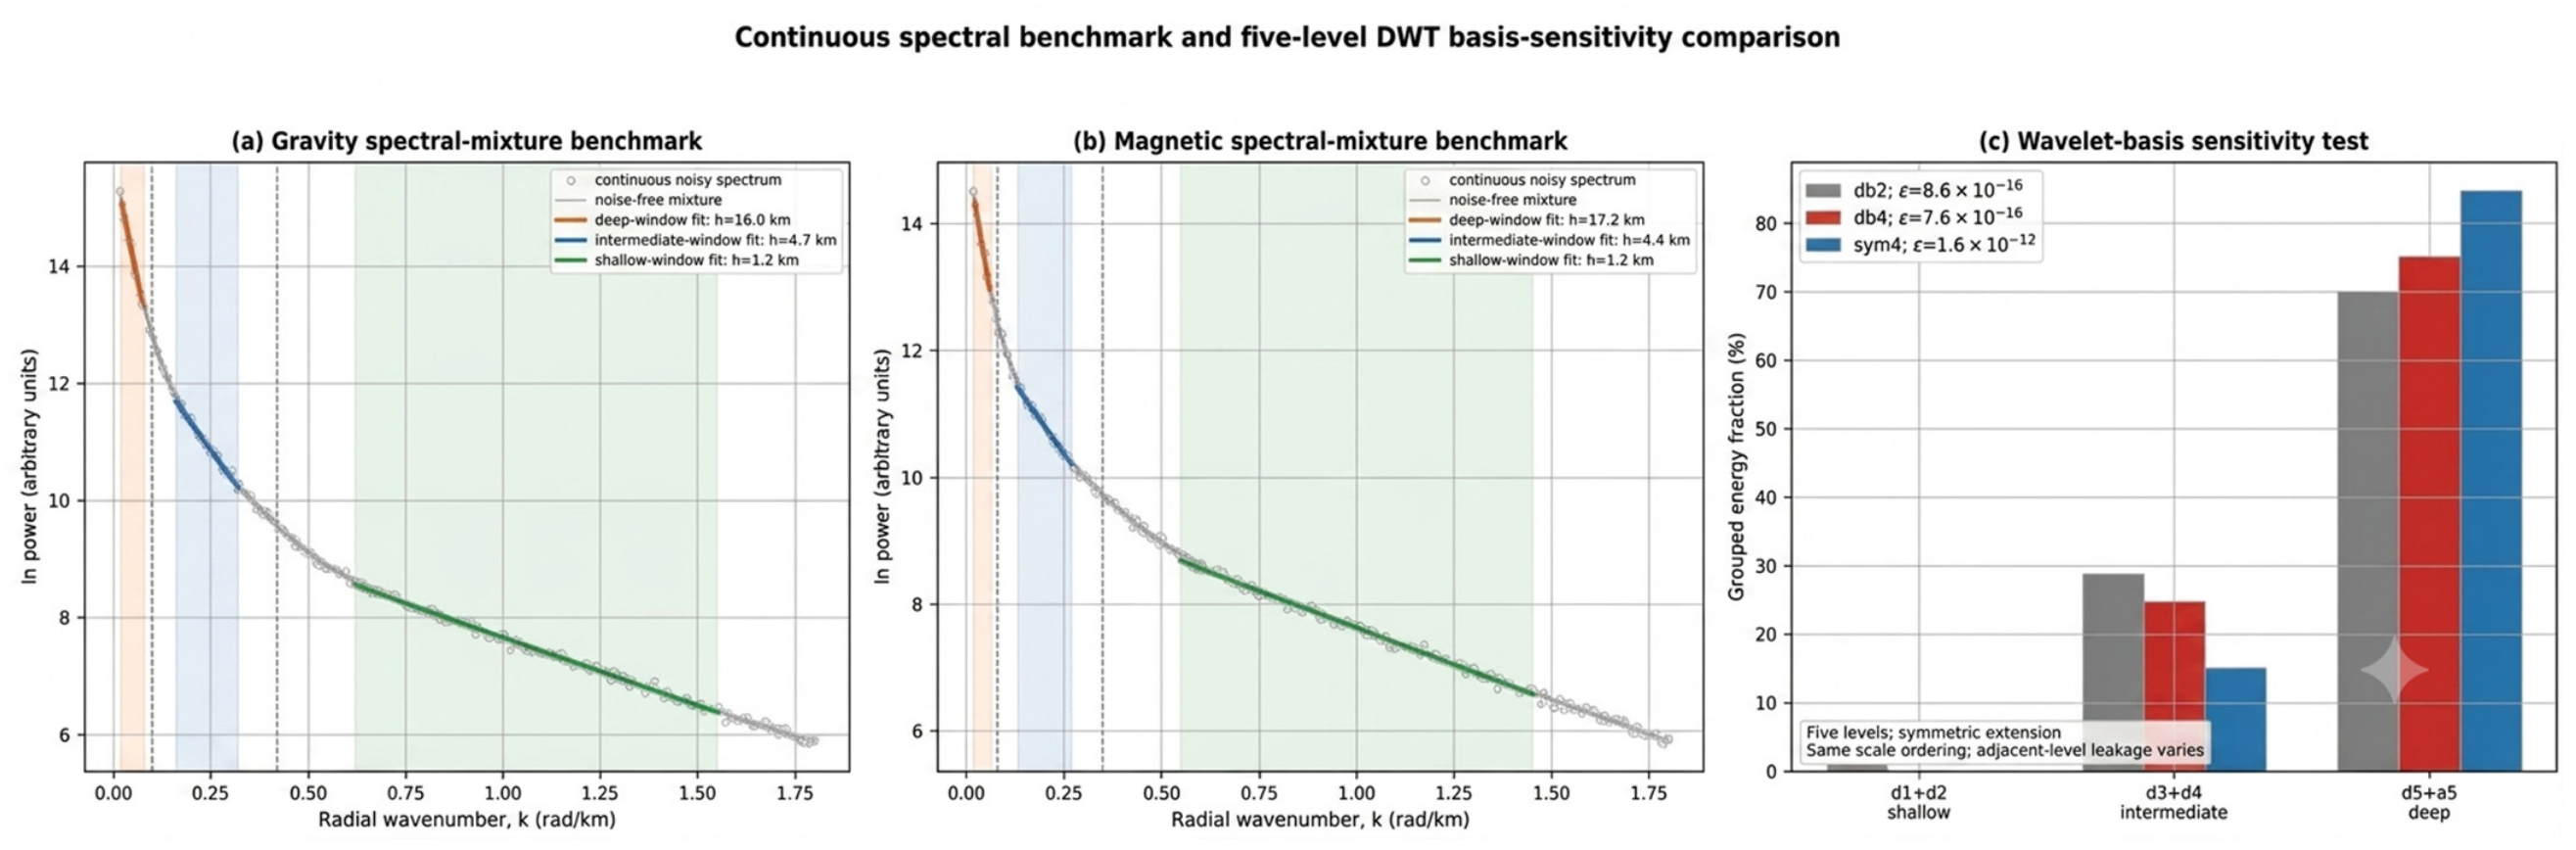
db4 was selected because its four vanishing moments suppress low-order polynomial trends while its compact support retains localized gradients. Basis dependence was evaluated on the analytical three-scale benchmark in Figure 2c by repeating the five-level decomposition with db2, db4, and sym4 under identical symmetric boundary extension. All three bases reproduced the input field with relative L2 reconstruction error ≤ 1.6 × 10⁻¹² and preserved the ordering of grouped energy among d1–d2, d3–d4, and d5 + a5. This numerical closure test evaluates reconstruction stability rather than geological validity. Absolute energy fractions varied because adjacent filters redistribute signal between neighboring levels; interpretation therefore relies on grouped bands and spatially persistent patterns. Geological contacts and the southeastern screening zone were not interpreted within the outer boundary-support region, defined at each level by half of the effective db4 filter support.
Figure 2.
Methodological benchmark: (a,b) Continuous three-ensemble spectral mixtures for the adopted slope convention; shaded intervals show fitted windows and dashed lines mark nominal cutoffs. (c) Five-level basis-sensitivity test for db2, db4, and sym4 using a synthetic three-scale field; bars show grouped wavelet-energy fractions, and ε is relative L2 reconstruction error.
3.3. Radially Averaged Log-Power Spectrum Depth Estimation
P(k) = ⟨|F(kx, kᵧ)|2⟩k
The radially averaged log-power spectrum estimates the mean depth of a statistical ensemble of potential-field sources, not the top of a unique body or a sharp interface [22]. For a selected approximately linear wavenumber interval, the adopted convention is ln P(k) = A − 2hk, where k is radial angular wavenumber (rad/km), A is an intercept, and h is the fitted ensemble depth [21,23,24,25,26].
ln P(k) = A − 2hk
k = √(kx2 + kᵧ2)
Piecewise least-squares lines were fitted over the stated wavenumber windows after visual identification of slope breaks. The depth is h = −0.5 d[ln P(k)]/dk. Regression residuals and covariance matrices from the original fitting session were not retained; formal confidence intervals are therefore not reconstructed here. Instead, Section 4.1 reports the gravity–magnetic spread as an empirical inter-method comparison, not as a statistical confidence interval.
h = −(1/2) d[ln P(k)]/dk
3.4. Spectrum-Guided Scale Coupling Strategy
For grid spacing Δ, the idealized physical wavenumber band of dyadic detail level j is approximately k ∈ [π/(2^jΔ), π/(2^(j−1)Δ)], modified by the non-ideal db4 response. Spectral depth h is estimated from the slope within a selected wavenumber interval and therefore need not follow a dyadic 1:2:4:8:16 depth sequence. The operational pairing used below associates d1–d2 with the high-wavenumber windows (gravity 0.42–1.65 rad/km; magnetics 0.35–1.48 rad/km), d3–d4 with the intermediate windows (0.10–0.42 and 0.08–0.35 rad/km), and d5 with the lowest non-zero-wavenumber windows (≤0.10 and ≤0.08 rad/km). The cumulative a5 field is retained only as a regional background. Because the numerical db4 response curves were not retained in the archive, these pairings are reported as spectrum-guided scale associations rather than exact passband equivalences or unique depth slices.
3.5. Continuous Spectral-Mixture and Wavelet-Basis Benchmark
Figure 2a,b presents a continuous synthetic spectrum generated from P(k) = ΣAi exp(−2hik). The gravity benchmark uses h = 18.0, 5.0, and 1.1 km, whereas the magnetic benchmark uses h = 21.0, 4.9, and 1.1 km. Relative amplitudes Ai were selected so that the dominant terms exchange near the stated cutoff wavenumbers, and 2% multiplicative Gaussian noise was added. Piecewise fits recover the imposed depth order and approximate values from a continuous mixed spectrum. Figure 2c applies db2, db4, and sym4 to a three-scale analytical field to compare grouped wavelet-energy allocation and reconstruction closure.
The benchmark tests the slope convention, sensitivity of fitting-window selection, exact wavelet reconstruction, and the first-order stability of grouped scale ordering across adjacent compactly supported bases. It is not a full prism forward model, contains relative spectral power rather than measured density or susceptibility, and does not validate the geological interpretation or establish a unique coupling between five wavelet levels and three source ensembles.
4. Quantitative Results and Wavefield Analysis
4.1. Spectral Source-Depth Estimation by Piecewise Regression
The radially averaged spectra contain three approximate slope regimes. These regimes are treated as statistical source ensembles and do not, on their own, demonstrate three discrete geological interfaces [27].
4.1.1. Bouguer Gravity Spectral Response
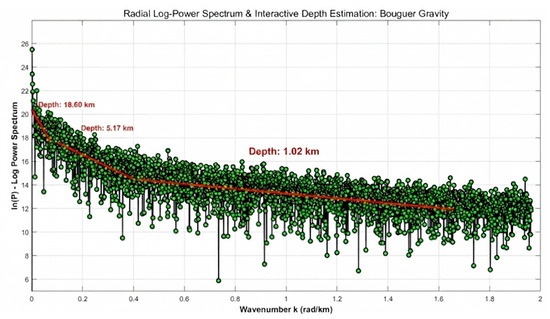
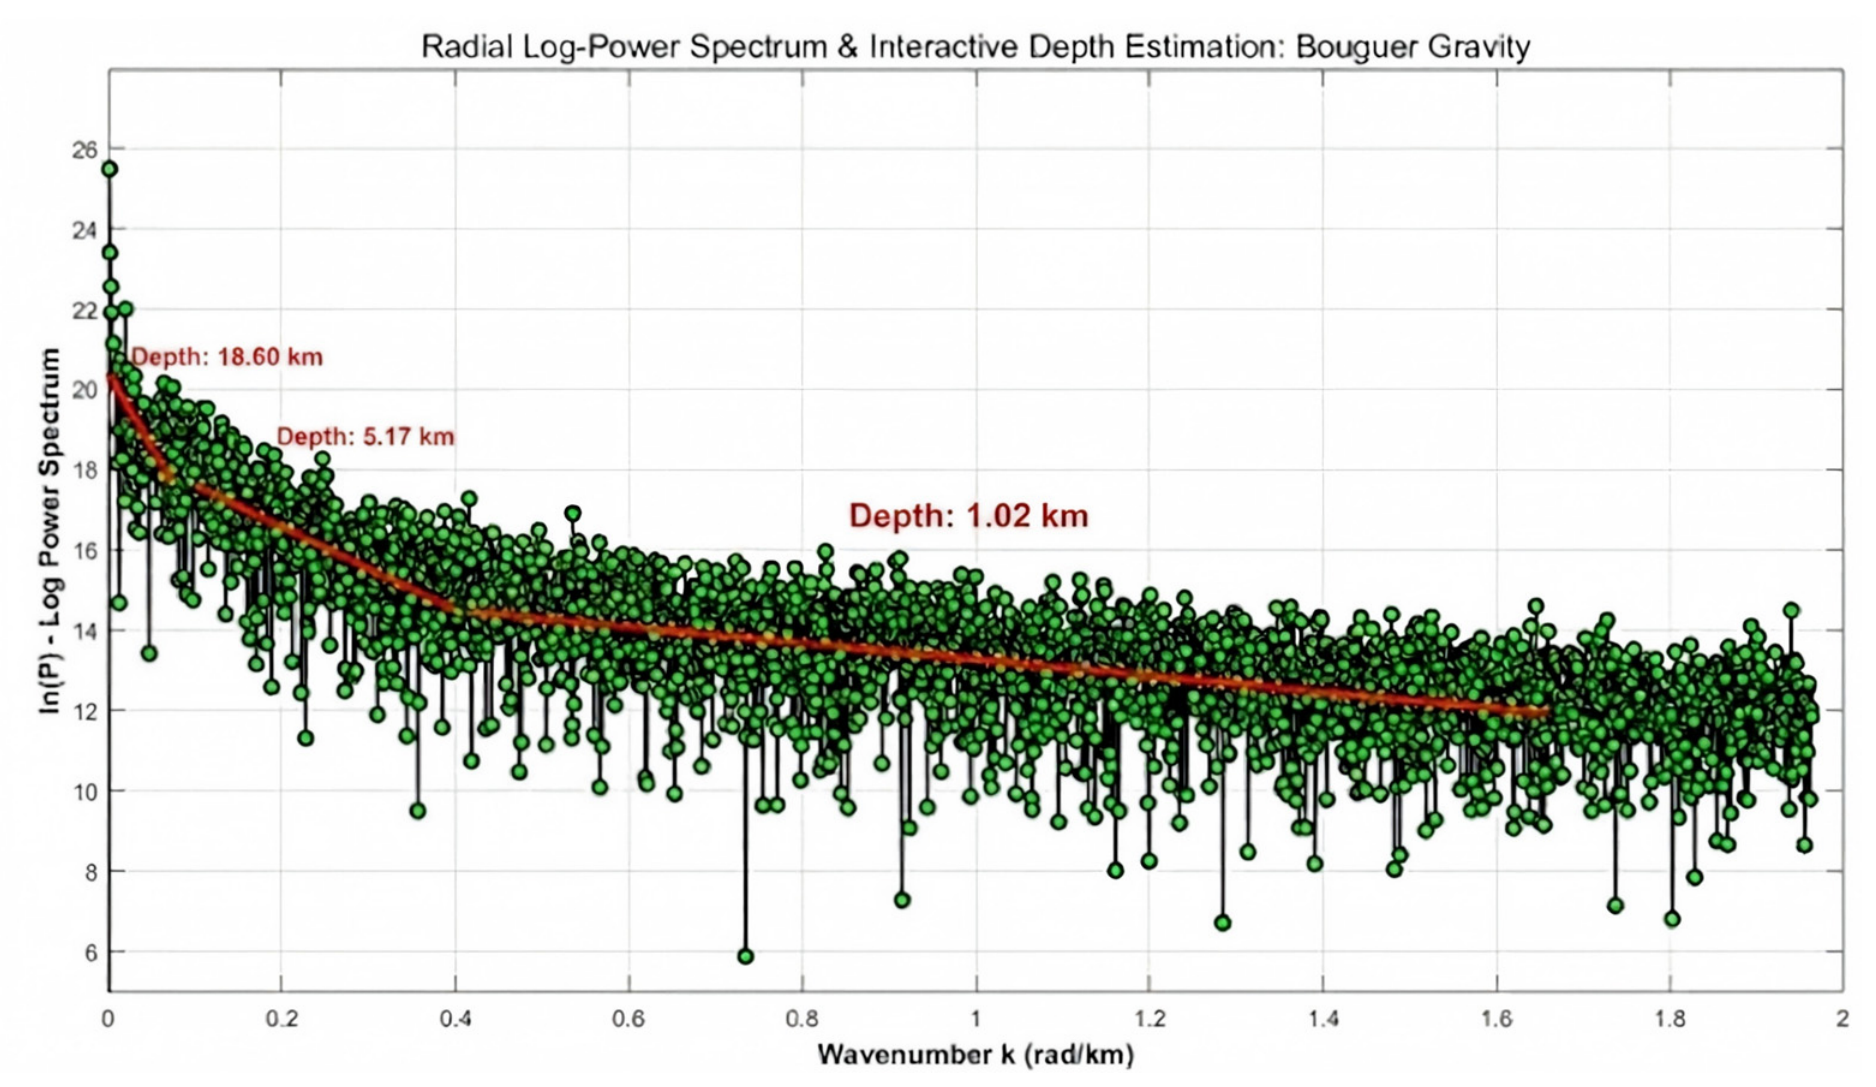
Figure 3 shows the three selected least-squares windows for the complete Bouguer anomaly spectrum:
Figure 3.
Radially averaged log-power spectrum and piecewise source-depth fits for the complete Bouguer anomaly grid.
Deep-source ensemble: The lowest non-zero-wavenumber fit (0 < k ≤ 0.10 rad/km) gives an ensemble depth estimate of 18.60 km.
Intermediate-source ensemble: The k = 0.10–0.42 rad/km fit gives 5.17 km.
Shallow-source ensemble: The k = 0.42–1.65 rad/km fit gives 1.02 km before the high-wavenumber noise floor.
4.1.2. Aeromagnetic (RTP) Spectral Response
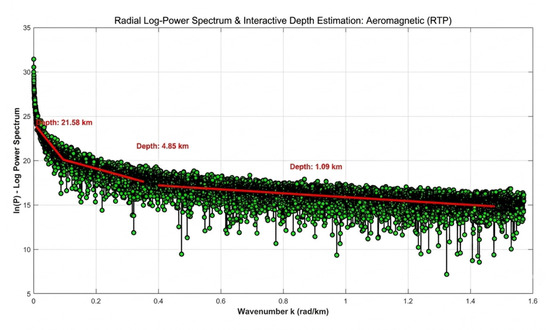
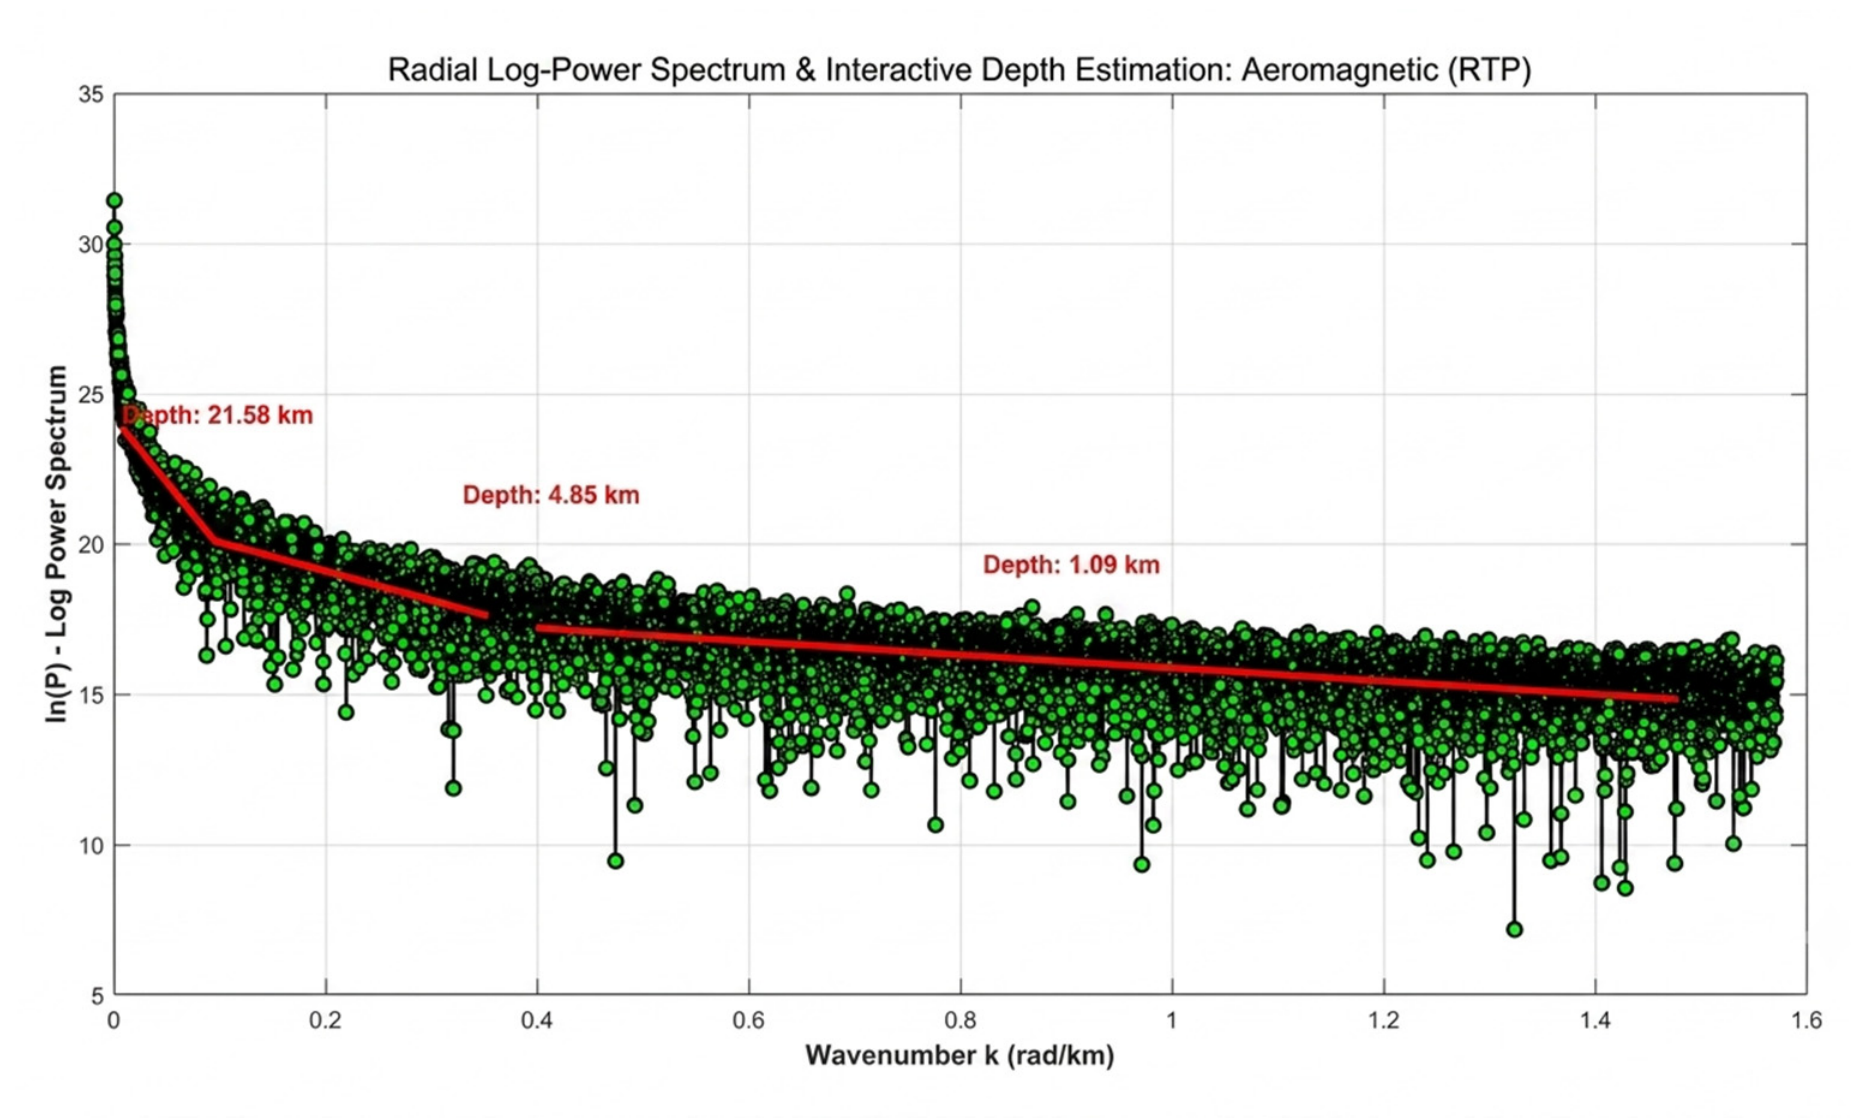
The RTP magnetic spectrum (Figure 4) shows the same three-regime ordering but not identical deep depths:
Figure 4.
Radially averaged log-power spectrum and piecewise source-depth fits for the aeromagnetic RTP grid.
Deep-source ensemble: The lowest non-zero-wavenumber fit (0 < k ≤ 0.08 rad/km) gives an ensemble depth estimate of 21.58 km.
Intermediate-source ensemble: The k = 0.08–0.35 rad/km fit gives 4.85 km.
Shallow-source ensemble: The k = 0.35–1.48 rad/km fit gives 1.09 km.
The paired gravity/magnetic depth ranges are 1.02–1.09 km (shallow), 4.85–5.17 km (intermediate), and 18.60–21.58 km (deep), with paired means of 1.055, 4.985, and 20.09 km, respectively. The full inter-method differences are 6.6%, 5.4%, and 14.8% of the paired means. These values measure agreement between two physical-property fields, not regression uncertainty; the larger deep difference is compatible with a broad density–magnetization transition and/or limited low-wavenumber resolution.
4.2. Wavelet Decomposition and Multi-Scale Plan-View Analysis
4.2.1. Scale-Depth Coupling Framework
Based on the ordering of the empirical spectral windows and the persistent spatial patterns shared by adjacent reconstructions, the fields were grouped into three operational scale ranges. The groupings are spectrum-guided interpretive associations, not discrete depth slices:
- Shallow scale range: d1 and d2, compared with the approximately 1 km spectral ensemble.
- Intermediate scale range: d3 and d4, compared with the approximately 5 km ensemble.
- Long-wavelength range: d5 plus the cumulative a5 background, compared qualitatively with the 18.60–21.58 km ensemble. a5 represents a broad regional trend, not a single interface at 18.60 km.
4.2.2. Multi-Scale Plan-View Characteristics of Bouguer Gravity Anomalies
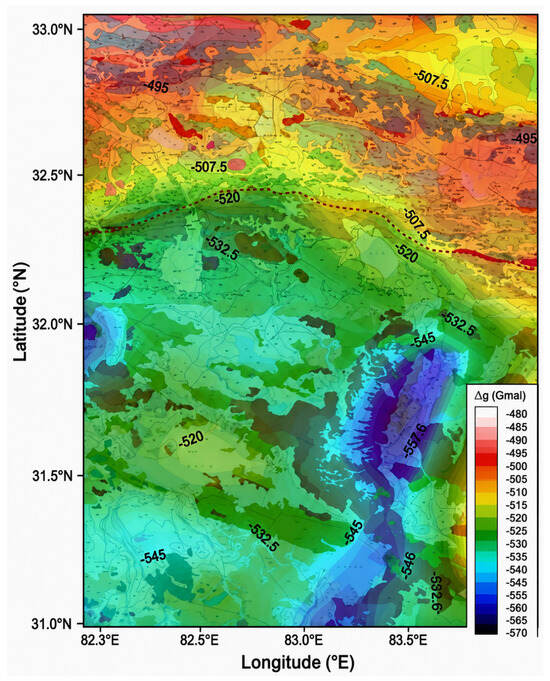
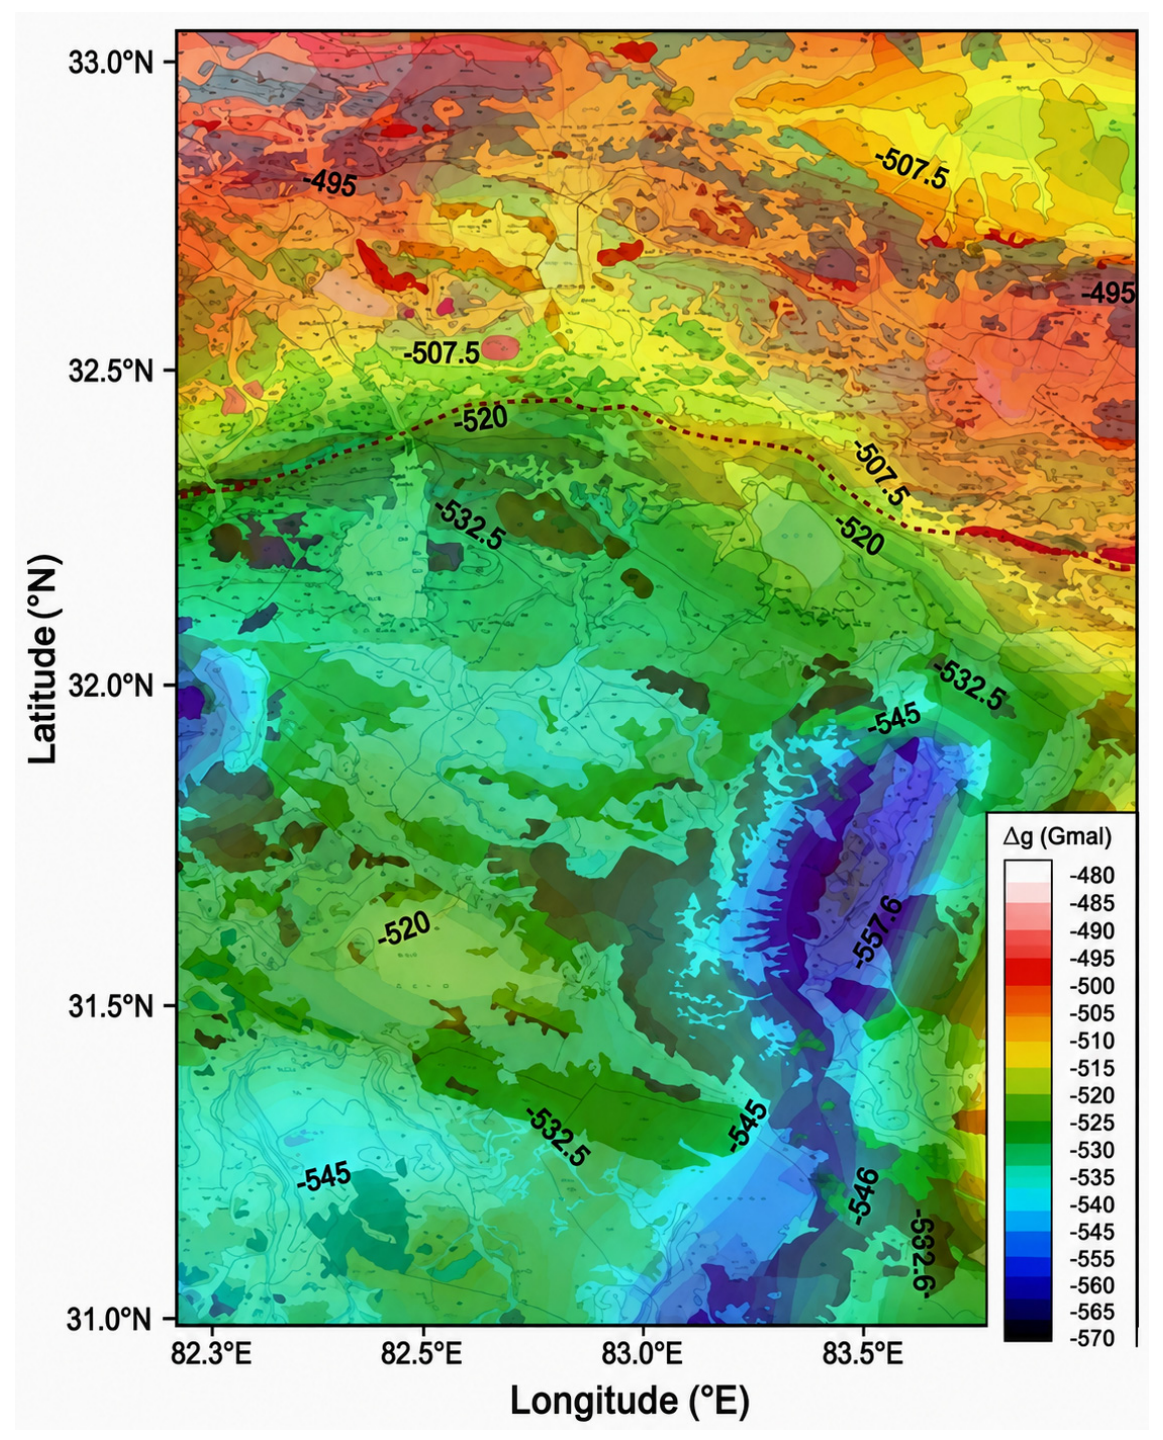
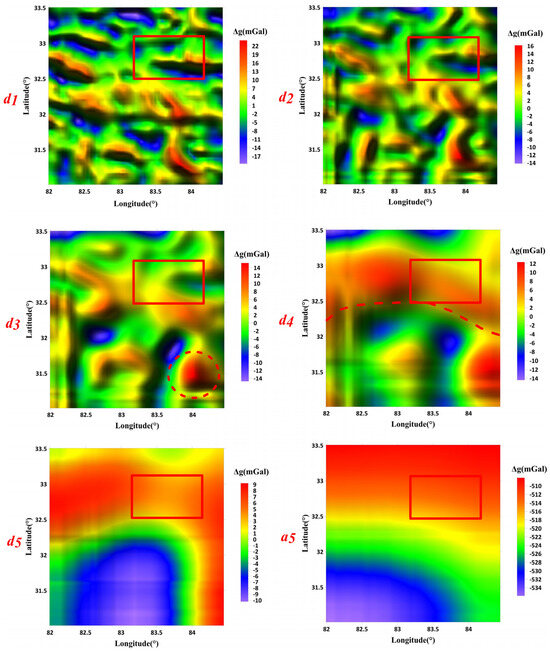
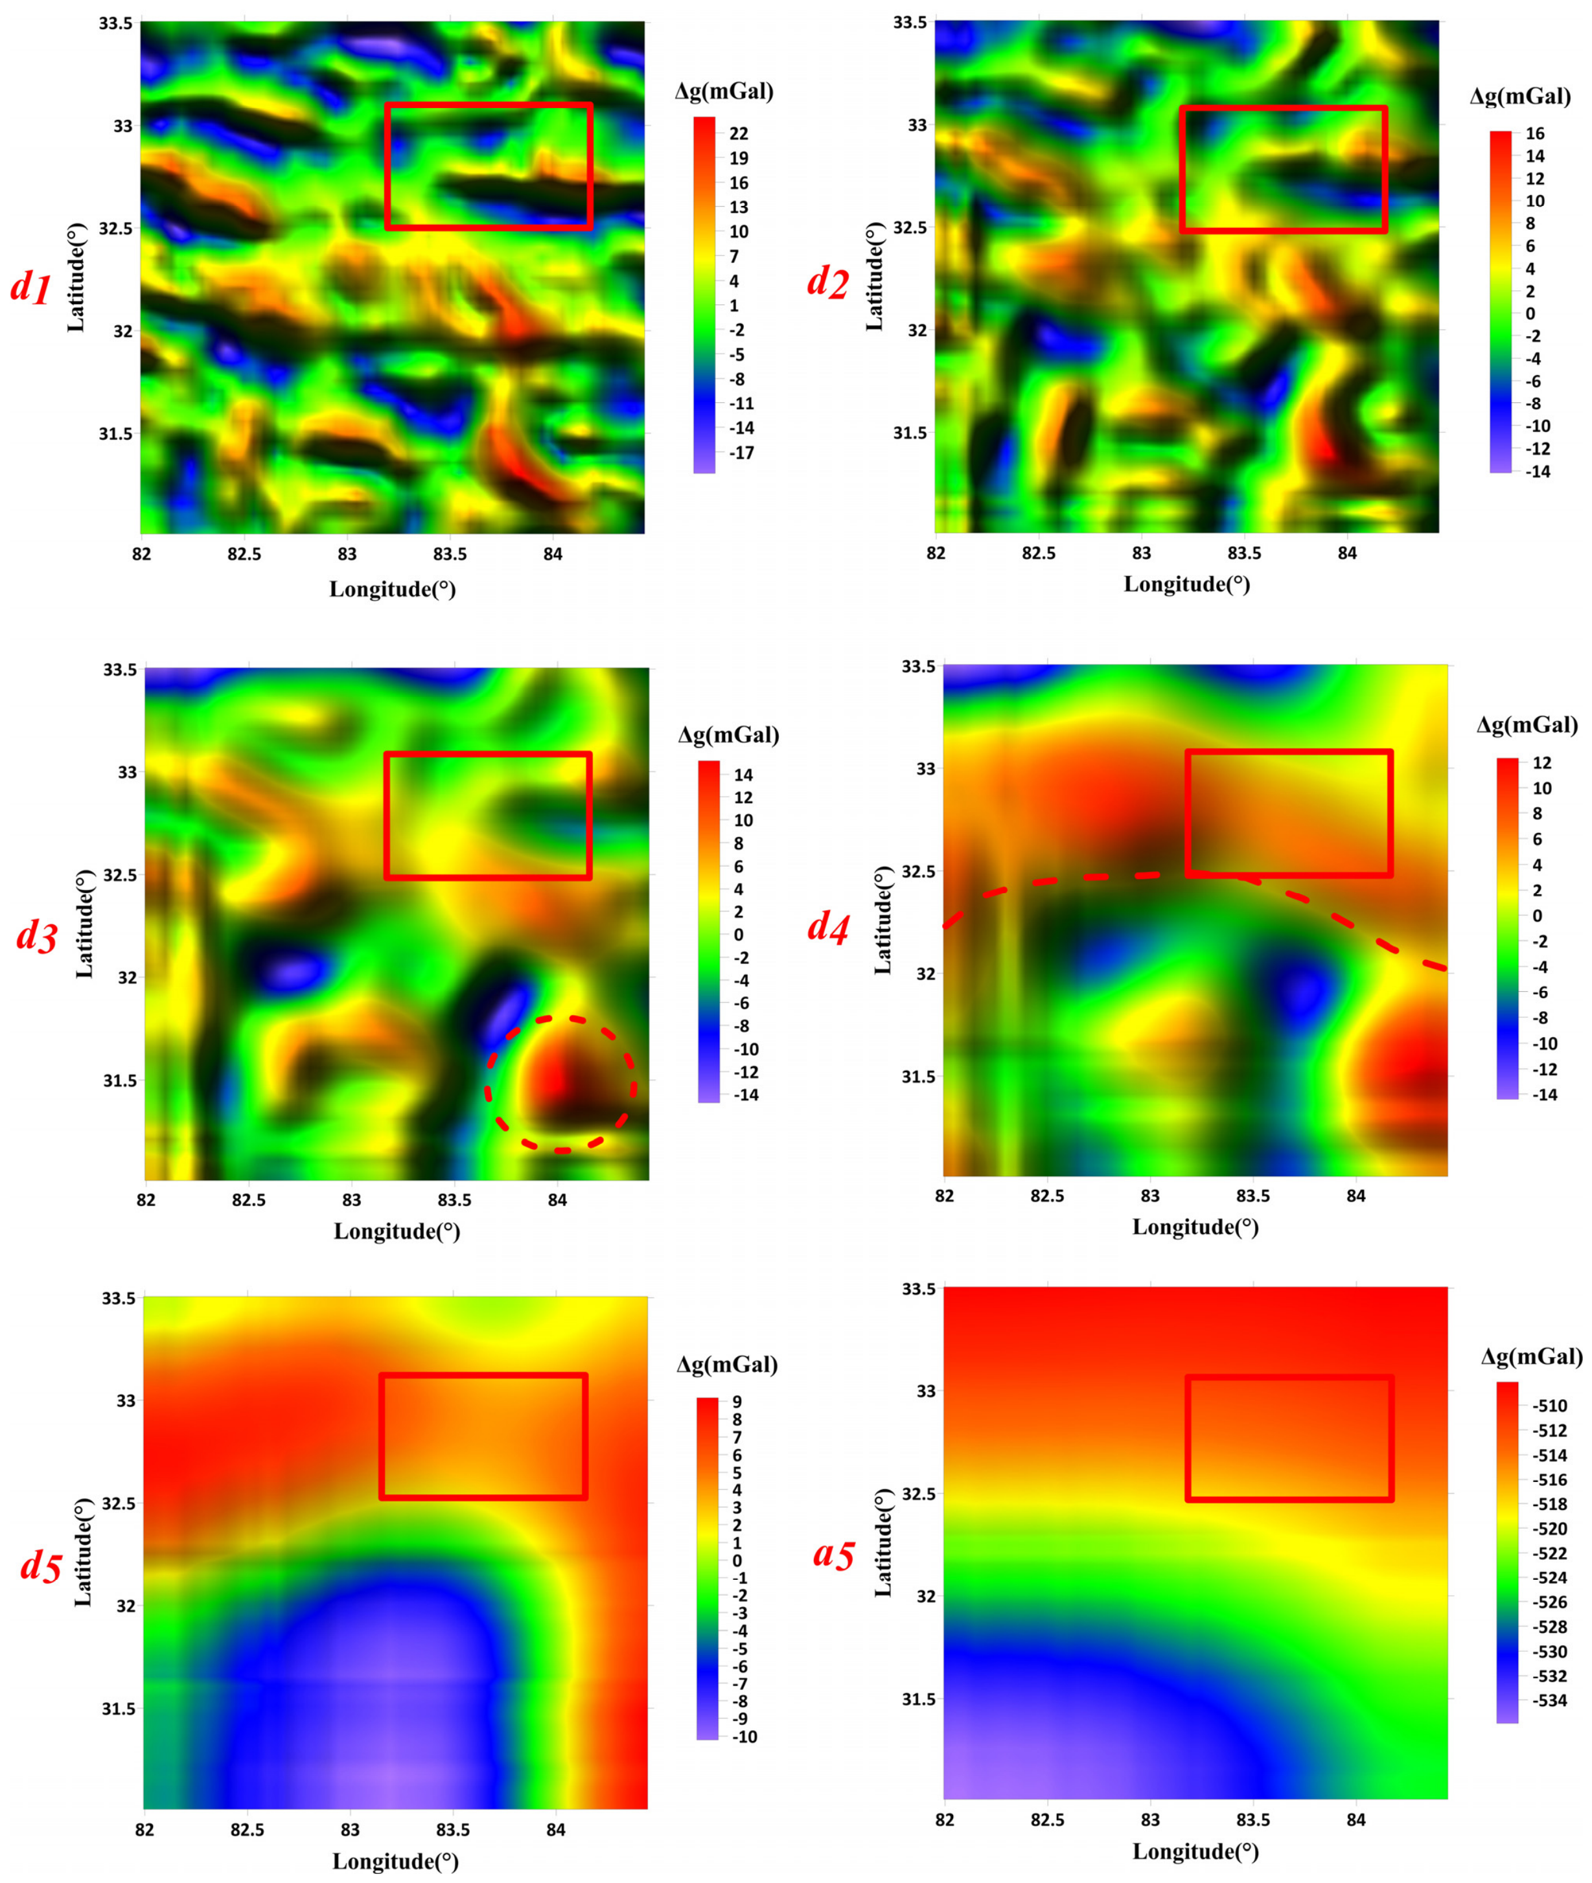
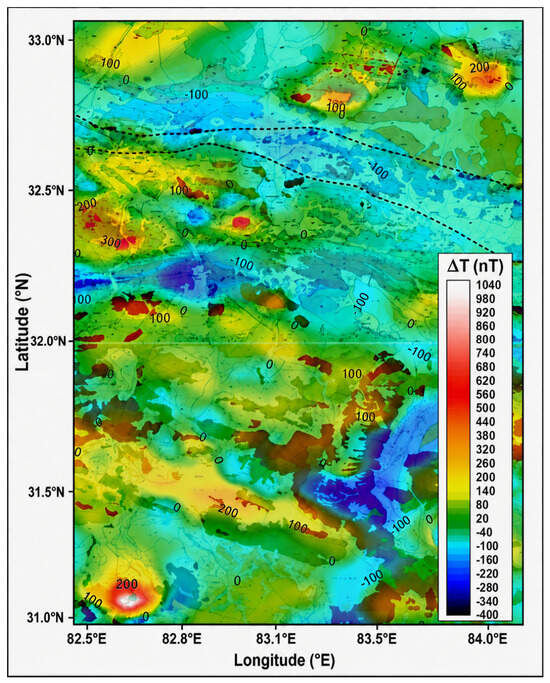
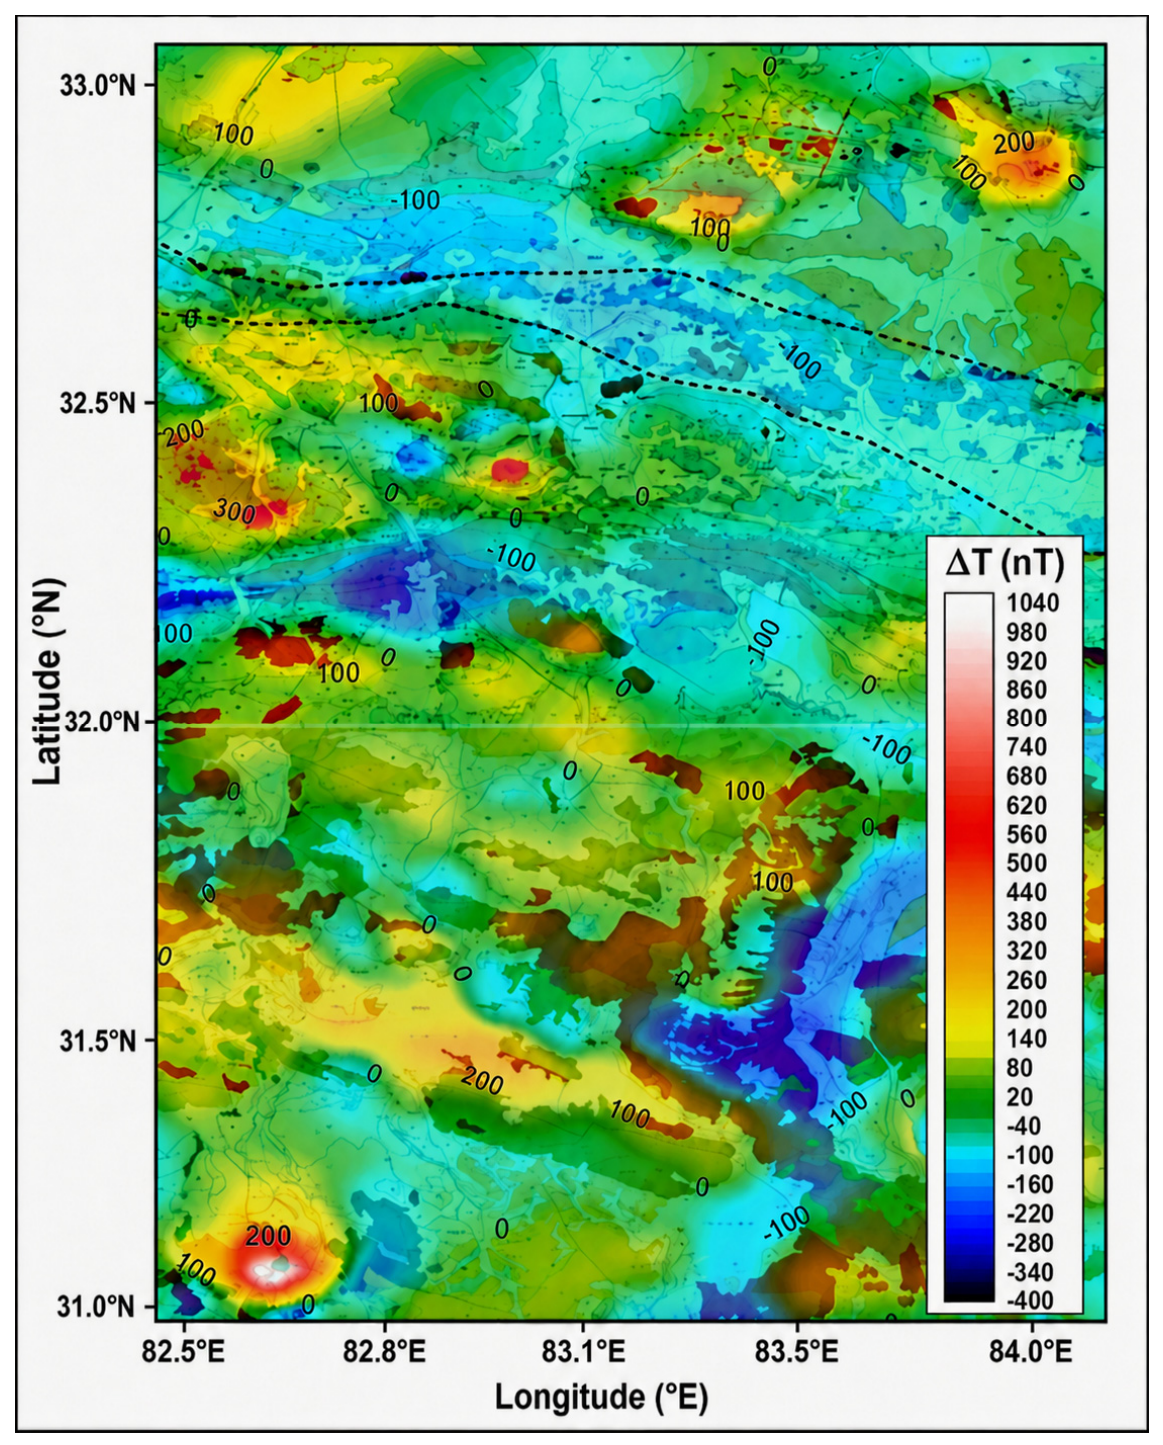
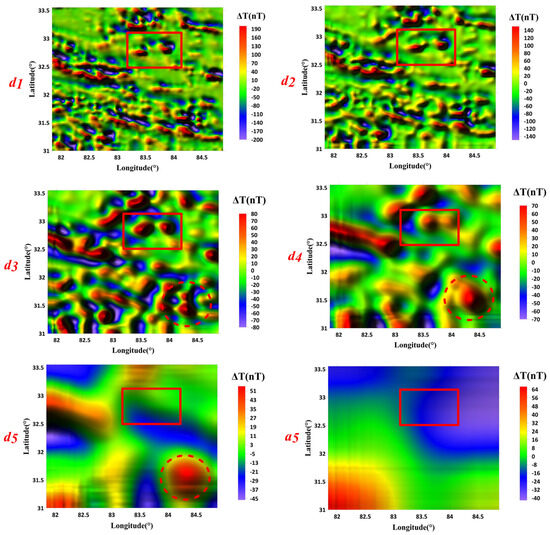
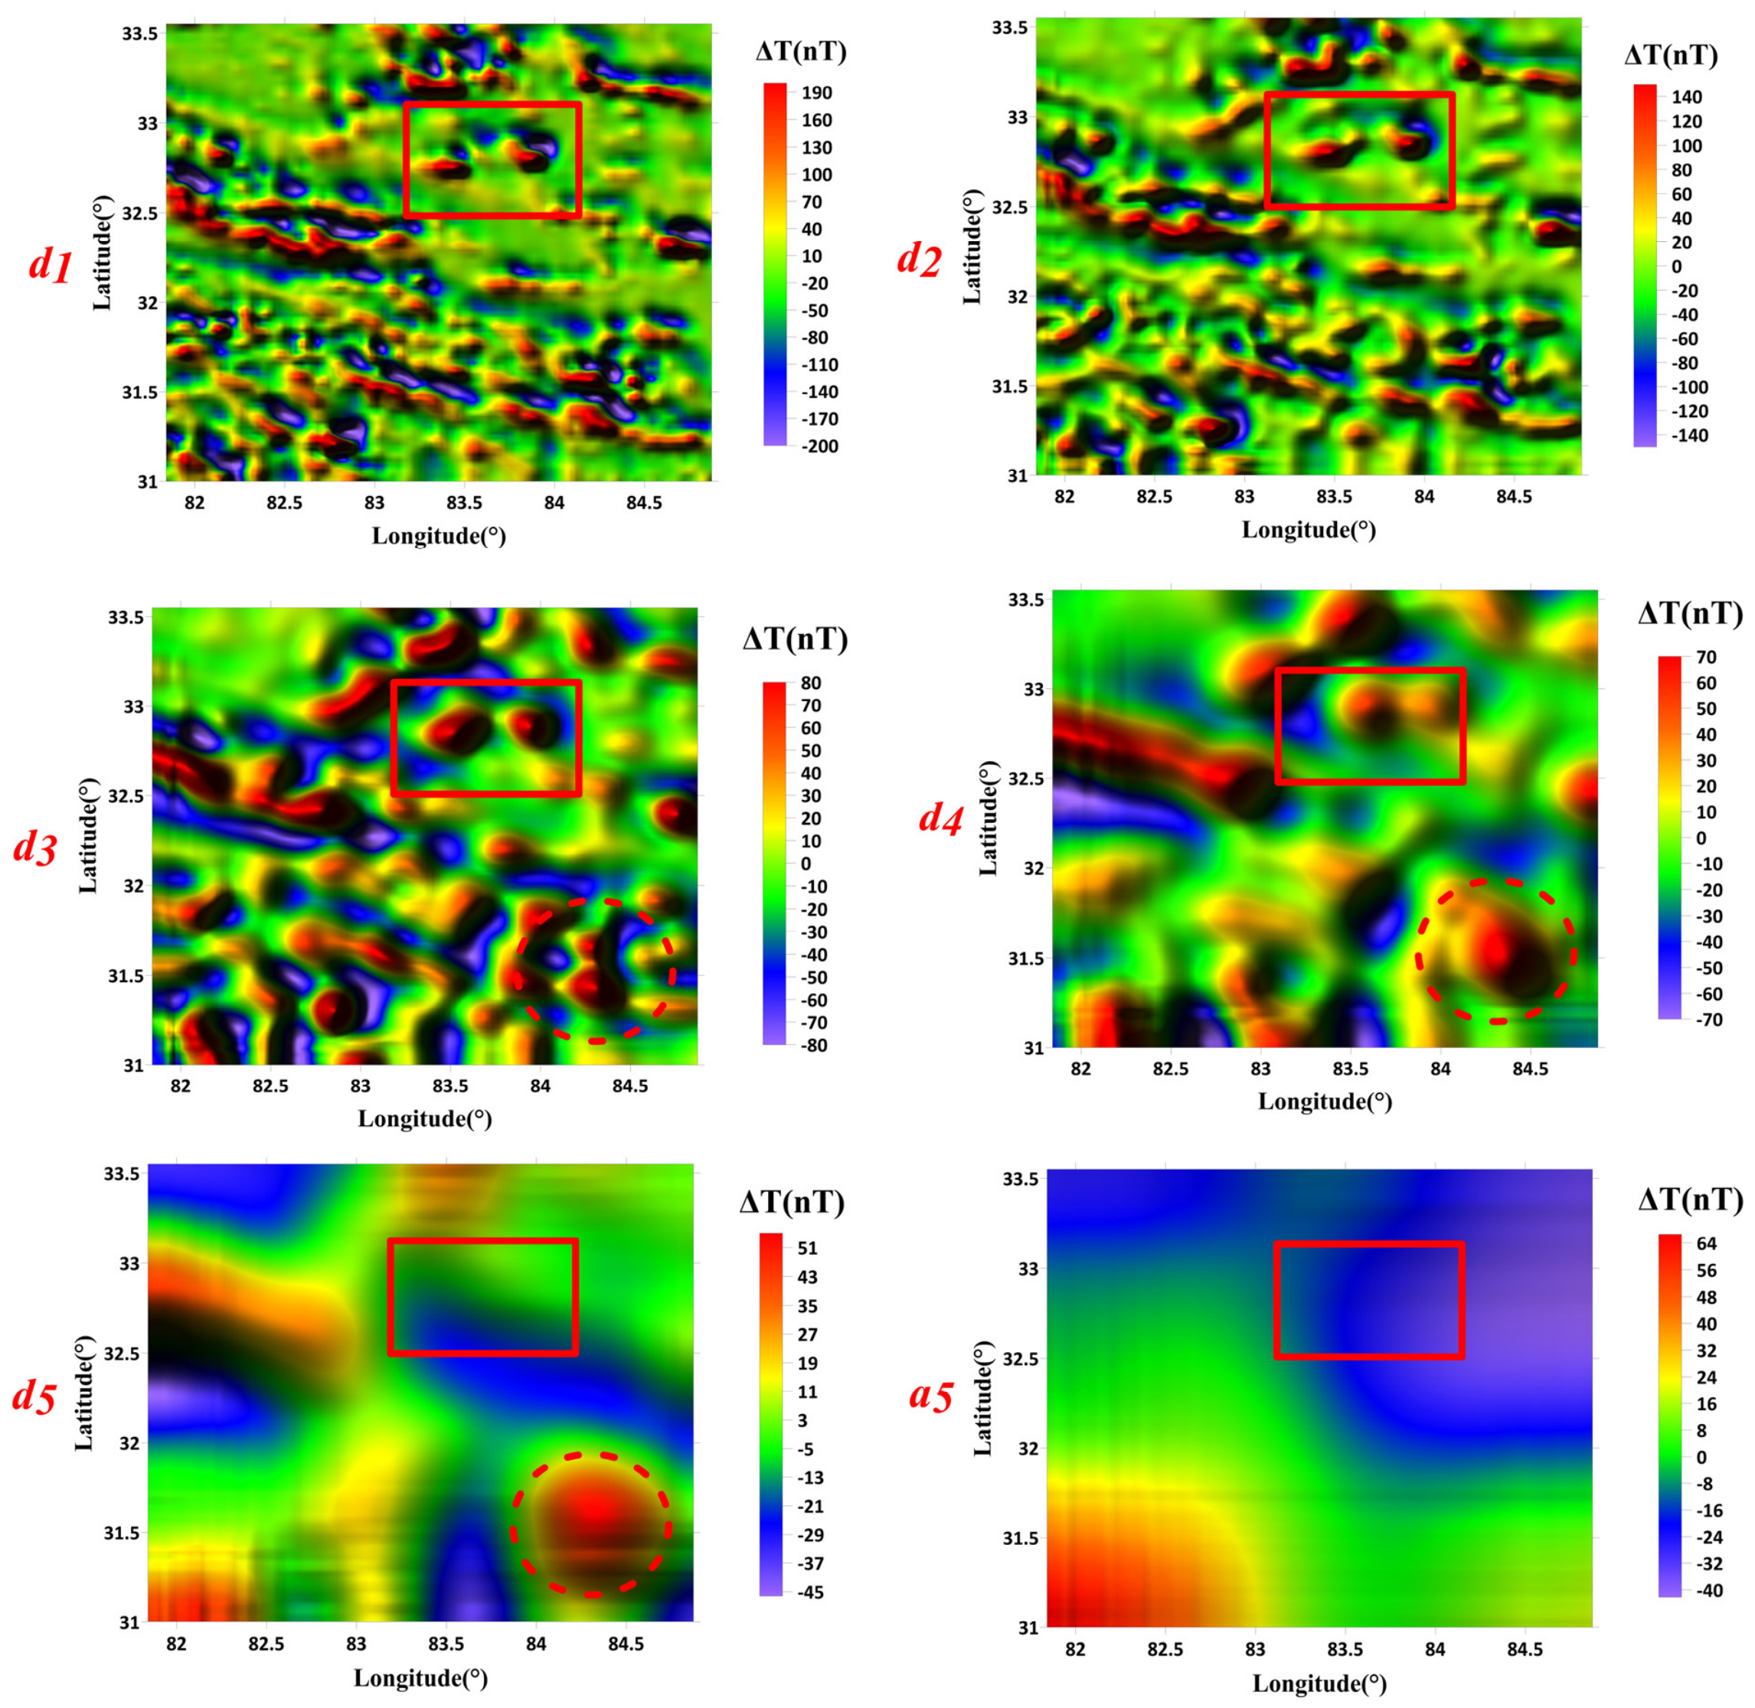
The complete Bouguer anomaly overlaid on mapped geology (Figure 5) shows the total-field superposition. Figure 6 presents the signed scale reconstructions d1–d5 and the cumulative background a5 [27,28,29,30,31].
Figure 5.
Complete Bouguer anomaly overlaid on mapped geological units and structures. Axes show longitude (° E) and latitude (° N); gravity is in mGal.
Figure 6.
Signed 2D-DWT reconstructions (d1–d5) and cumulative approximation (a5) for the complete Bouguer anomaly. The red frame marks the Duolong district; the dashed circle is a regional screening window.
Shallow details (d1 and d2): Localized gradients and short-wavelength anomalies emphasize shallow density contrasts and structural edges. Their coincidence with mapped faults supports, but does not uniquely prove, individual fault traces.
Intermediate details (d3 and d4): Broad positive and negative residuals define an anomaly-source region in and around the Duolong district. A positive residual indicates relative density contrast at this scale; it does not establish that a silica-rich batholith is denser than its metamorphic host or precisely outline a single body.
Long-wavelength components (d5 and a5): d5 expresses the broadest signed detail, whereas a5 is the cumulative low-pass regional background. Together they map regional crustal gradients; neither is interpreted as a sharp interface or a uniquely north-dipping fault.
4.2.3. Multi-Scale Plan-View Characteristics of Aeromagnetic (RTP) Anomalies
The RTP aeromagnetic field overlaid on mapped geology is shown in Figure 7, and the signed 2D-DWT reconstructions are shown in Figure 8 [27,28,29,30,31]. RTP is used for the magnetic plan-view analysis because it reduces the lateral displacement of predominantly induced anomalies at the regional scale and facilitates comparison with gravity and mapped geology.
Figure 7.
Aeromagnetic RTP anomalies overlaid on mapped geological units and intrusions. Axes show longitude (° E) and latitude (° N); magnetic intensity is in nT.
Figure 8.
Signed 2D-DWT reconstructions (d1–d5) and cumulative approximation (a5) for the RTP magnetic field. At each level, Hj, Vj, and Dj were retained during inverse reconstruction while all other levels were set to zero.The red frame marks the Duolong district; the dashed circle is a regional screening window.
Shallow details (d1 and d2): Sharp, short-wavelength magnetic anomalies coincide locally with known porphyry centers. They may reflect intrusive or alteration-related magnetite, but remanence and direct susceptibility measurements are unavailable.
Intermediate details (d3 and d4): Individual short-wavelength anomalies merge into a broader magnetic high. This is consistent with a magnetized intrusive system or related basement source, but it does not by itself prove magnetite enrichment by AFC processes.
Long-wavelength components (d5 and a5): The medium-to-low magnetic response may reflect felsic or altered/sheared material, oxidation or hydrothermal demagnetization, source temperatures approaching/exceeding the Curie temperature, or low-wavenumber resolution. It is therefore not diagnostic of either a mafic mantle feeder or its absence.
5. Discussion
5.1. Property Correspondence of Multi-Scale Anomalies and Cross-Method Depth Verification
Potential-field interpretation is non-unique. Spectral slopes provide statistical depth ranges, while wavelet reconstructions display spatial content by scale. Their combination reduces some ambiguity but is not a density/susceptibility inversion and cannot uniquely determine lithology, geometry, fault dip, or ore grade [31,32].
For the shallow ensemble, gravity and magnetic depths differ by 0.07 km (6.6% of their mean). The d1–d2 anomalies cluster around several known porphyry centers and mapped structures, supporting a shallow intrusive–structural association. The fields do not uniquely resolve individual orebodies or alteration mineralogy.
For the intermediate ensemble, gravity and magnetic depths differ by 0.27 km (5.4%). Co-located d3–d4 residuals imply overlapping density and magnetization contrasts but not necessarily a uniformly dense, acidic batholith. The gravity signal may include basement relief or denser intermediate/mafic components beneath a felsic system, while the magnetic signal may arise from magnetite-bearing phases. Without paired density and susceptibility measurements, a composite anomaly-source region is the most defensible interpretation.
For the deepest resolved ensemble, the gravity and magnetic estimates differ by 2.98 km (14.8%). This mismatch is large enough to preclude claims of quantitative identity. It may reflect different density and magnetization boundaries within a several-kilometer-thick upper-to-middle-crustal transition, source mixing at low wavenumber, or fitting-window limitations. The data do not resolve the 70–80 km Moho, and d5/a5 do not image a mantle magma source.
5.2. Comparison with Alternative Methods and Limitations
Upward continuation is useful for suppressing short wavelengths and displaying regional trends, but continuation height is a filter parameter rather than a source depth. Continuous wavelet transforms provide redundant scale localization and can support edge/depth analysis, whereas the non-redundant DWT used here offers compact scale reconstructions but is more sensitive to basis choice and boundaries.
Euler deconvolution can provide source-location clusters, but solution stability depends strongly on structural index, window size, derivative noise, and acceptance criteria [17]. Processed gravity and RTP grids were available for the present study, whereas the original station-level and flight-line data and independent structural constraints needed for a robust Euler sensitivity analysis were unavailable. Euler solutions were therefore not used as primary interpretive constraints. The interpretation avoids unconstrained dip-angle and geometric-closure claims and identifies systematic Euler or source-parameter imaging, constrained 2D/3D modeling, petrophysical sampling, and drilling as follow-up tests.
5.3. Evidence-Calibrated Interpretation Within the Regional Geological Profile
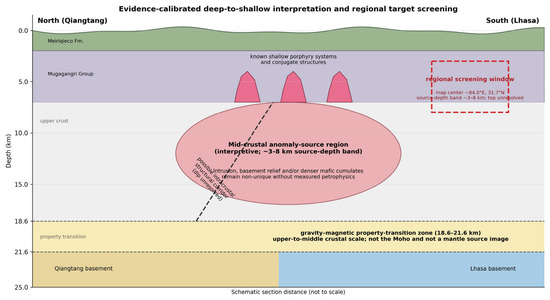
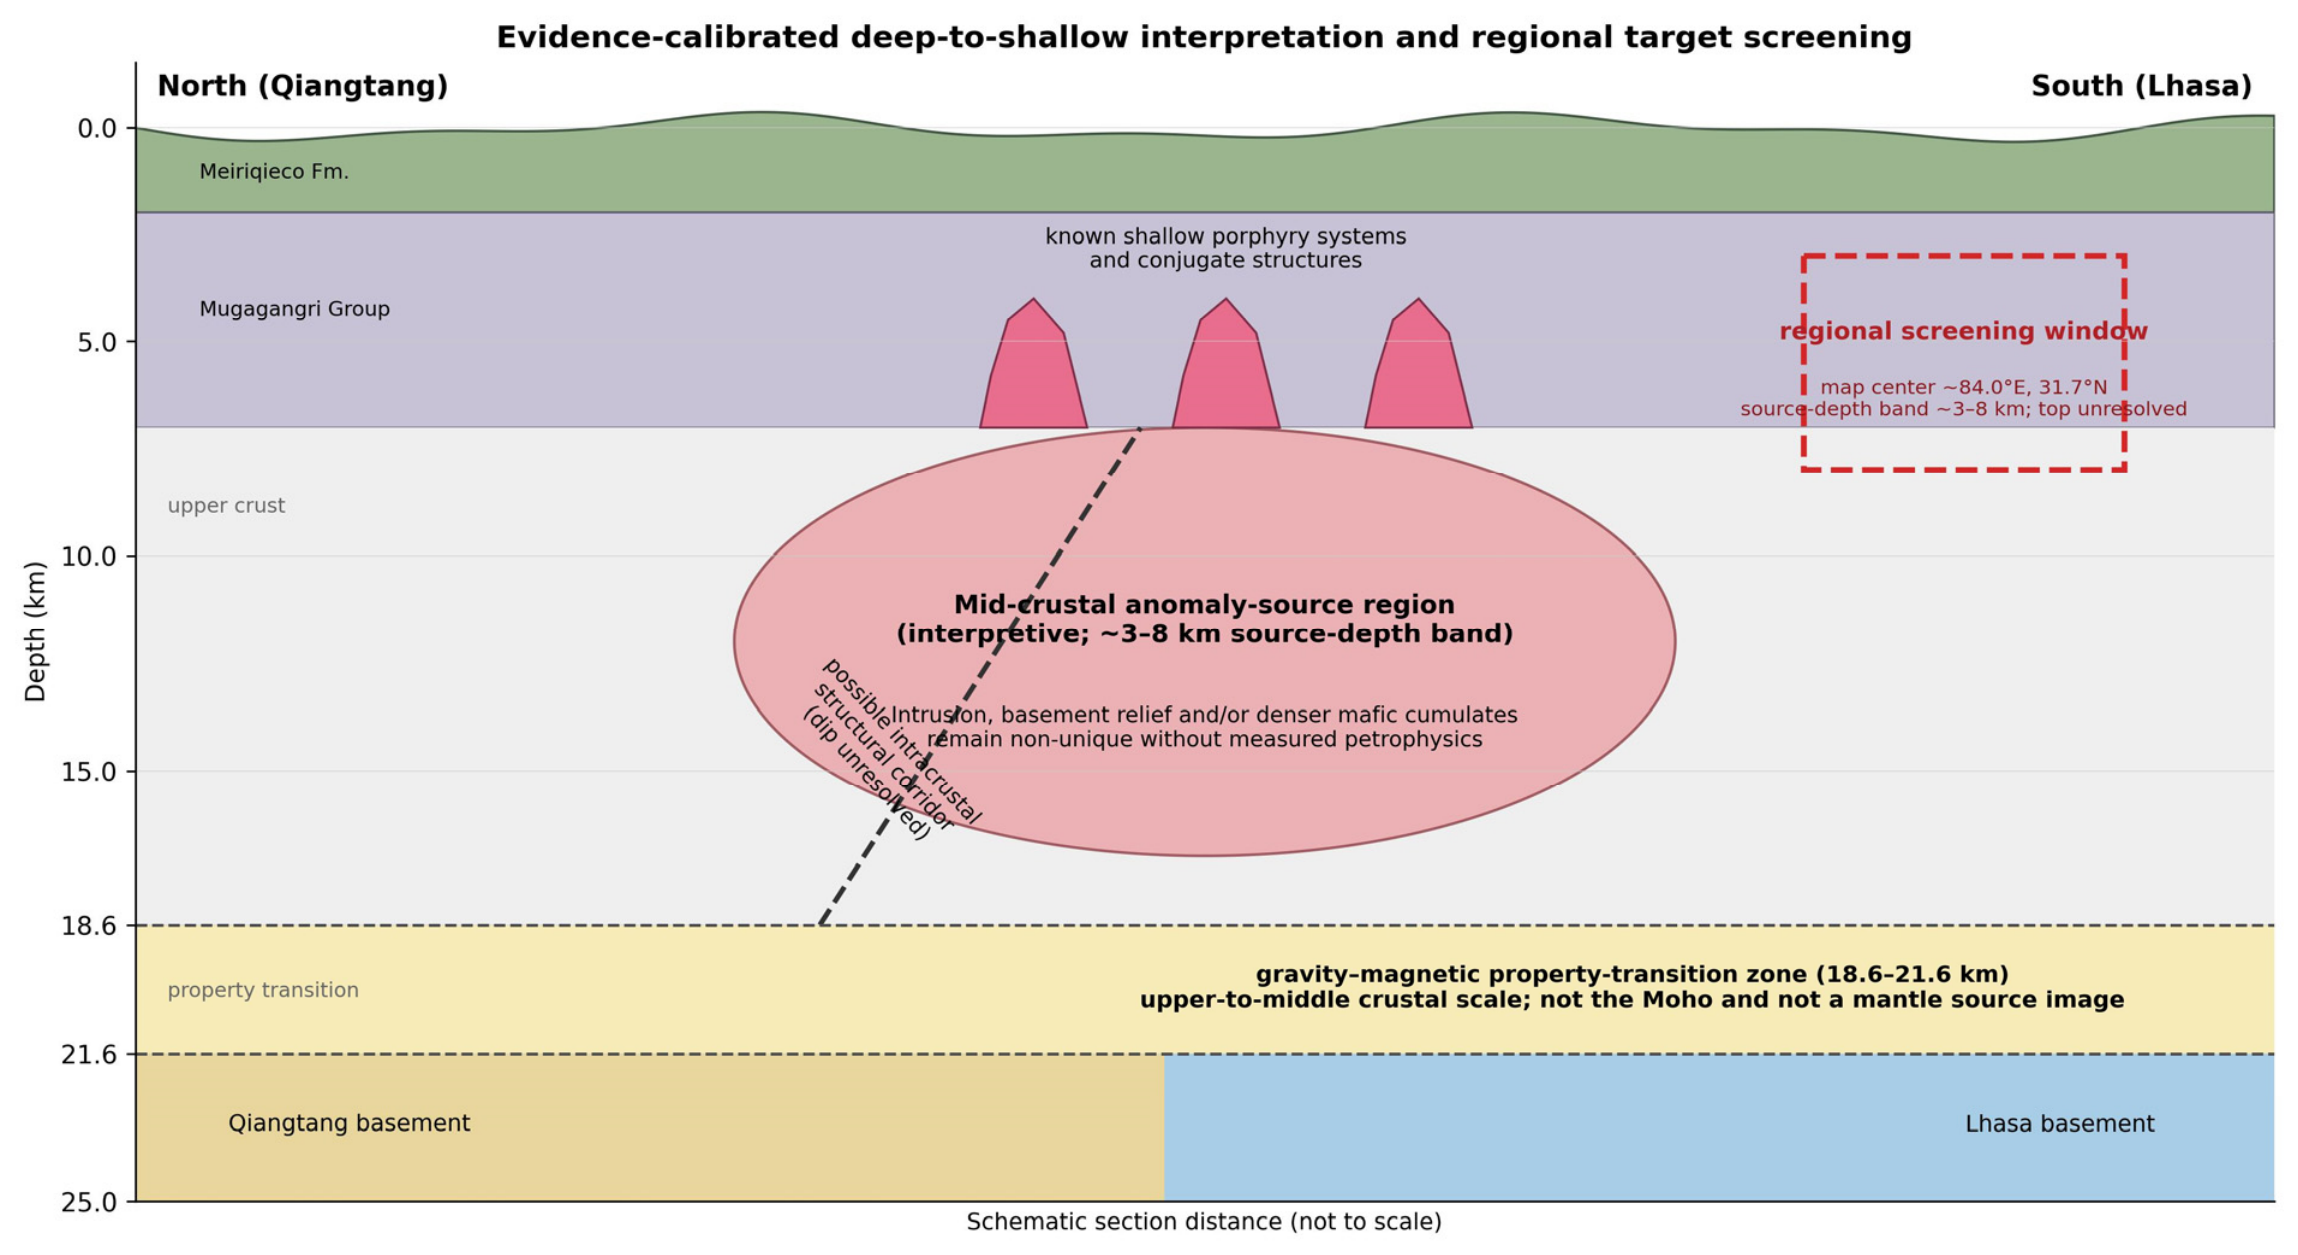
Figure 9 places the statistical depth ranges and plan-view scale associations on a regional geological profile. The section is an evidence-calibrated conceptual model rather than a potential-field inversion or a uniquely closed geometry [33,34,35,36,37].
Figure 9.
Evidence-calibrated conceptual section showing shallow porphyry systems, the interpretive intermediate anomaly-source region, the 18.60–21.58 km property-transition zone, and the southeastern regional screening zone. The crustal transfer pathway is schematic: the black dashed line represents an inferred fault, and this figure is not a quantitative inversion, and fault dip, pathway geometry, and target-top depth remain unresolved.
5.3.1. Deep Resolved Property-Transition Zone (18.60–21.58 km)
The deepest statistically resolved source ensemble spans 18.60–21.58 km. In the central Tibetan Plateau this depth is compatible with an upper-to-middle-crustal property transition (Conrad-like), not the Moho. a5 is a broad low-pass trend and is not assigned a single structural depth.
Regional geology permits an intracrustal structural corridor within the BNSZ framework, but 2D-DWT plan-view maps do not determine a 60–70° dip or demonstrate penetration to the mantle. The corridor in Figure 9 is, therefore, schematic and represents one hypothesis for crustal transfer between the deep transition and shallower magmatic system.
5.3.2. Intermediate Anomaly-Source Region (Approximately 3–8 km)
The 4.85–5.12 km spectral estimates define the central tendency of an intermediate source ensemble, not the centroid or boundary of a uniquely resolved batholith. For regional interpretation, the d3–d4 spatial bandwidth and inter-method spread are represented by an operational approximately 3–8 km anomaly-source band. This broader range is an interpretive screening interval rather than a directly resolved upper and lower boundary.
A composite magmatic-reservoir hypothesis is geologically plausible, but the overlapping residuals can also include basement relief and denser intermediate/mafic phases or cumulates associated with a more felsic intrusive system. AFC, volatile enrichment, and a direct genetic link to all known deposits remain hypotheses requiring density, susceptibility, mineralogical, geochemical, seismic, or drilling constraints.
5.3.3. Shallow Porphyry Systems and Conjugate Structures (0–3 km)
At 0–3 km, d1–d2 anomalies overlap mapped Meiriqieco Formation, Mugagangri Group structures, and known intrusions. These associations support shallow structural and intrusive sources while retaining the non-uniqueness of potential fields.
Geological evidence is consistent with episodic magma and fluid ascent through a branching upper-crustal fault network. The approximately 1 km spectral estimate represents the mean depth of a shallow source ensemble associated with porphyry centers and their alteration systems; it is not a universal optimum depth for mineralization.
5.4. Conceptual Deep-to-Shallow Model and Regional Exploration Screening
5.4.1. Working Source–Pathway–Reservoir–Convergence Model
The integrated model is a working hypothesis constrained at different confidence levels [38]:
- Deep framework: The 18.60–21.58 km range represents an intracrustal property-transition zone. A BNSZ structural corridor is plausible, but its dip and mantle connection are not resolved.
- Intermediate region: The 4.85–5.12 km spectral ensemble and d3–d4 footprints support a broad anomaly-source region. A composite reservoir is plausible but petrophysically non-unique.
- Shallow convergence: The approximately 1 km ensemble and d1–d2 anomalies coincide with several known porphyry centers and conjugate structures, consistent with shallow focusing of intrusions and fluids.
5.4.2. Southeastern Regional Screening Window
A d3 perturbation southeast of the main district defines a first-order regional screening zone centered approximately at 84.0° E, 31.7° N. Its plan-view extent is approximately 0.4° × 0.4° (roughly 38 × 44 km at this latitude) on Figure 6, so it should not be treated as a localized drilling target. Because the center lies near the eastern edge of the common gravity–magnetic overlay window, evaluation of its full plan-view expression relies on the multiscale maps in Figure 6 and Figure 8. The intermediate wavelet band suggests only a broad 3–8 km source-depth range; d3 does not determine a unique depth to top or target volume.
The screening zone is prioritized because intermediate-scale gravity structure, nearby magnetic and structural complexity, and cover conditions resemble parts of the known district. A southeasterly apophysis and long lateral fluid migration are possible but untested explanations; the data do not require direct connection to a north-dipping feeder. This is therefore a regional hypothesis for follow-up petrophysics, systematic Euler or source-parameter imaging on the processed grids, constrained 2D/3D modeling, and drilling—not a quantitative orebody prediction or drill-collar recommendation.
6. Conclusions
6.1. Efficacy of Methodology
The combined spectrum–2D-DWT workflow relates statistical source-depth windows to signed plan-view scale reconstructions. Spectral cutoffs inform, but do not objectively or uniquely determine, the grouping of dyadic levels. Gravity and magnetic estimates agree closely for the shallow and intermediate ensembles; the 14.8% deep difference is reported as uncertainty and possible property decoupling. The workflow is a scale-separation and hypothesis-building tool, not an inversion for unique geology.
6.2. Summary of Geological Findings and Exploration Implications
The results distinguish three operational scale ranges and state their evidential limits:
- Deep range (18.60–21.58 km): A broad upper-to-middle-crustal source-depth range is inferred statistically from the gravity and magnetic spectra. Neither the Moho, a mantle source, a unique fault dip, nor a direct mantle conduit is imaged.
- Intermediate range (4.85–5.12 km): Overlapping d3–d4 anomalies define an interpretive anomaly-source region. A composite magmatic reservoir is plausible, but a uniformly high-density acidic batholith and AFC-driven magnetite enrichment are not demonstrated without petrophysical evidence.
- Shallow range (1.02–1.09 km): d1–d2 anomalies are spatially associated with known porphyry centers and mapped structures but do not uniquely resolve individual orebodies.
A southeastern d3 perturbation defines a first-order regional screening zone near 84.0° E, 31.7° N within an interpretive 3–8 km source-depth band. Its depth to top and volume are unresolved, and validation requires systematic numerical grid source-location analysis, constrained modeling, petrophysical sampling, and drilling.
Author Contributions
Conceptualization, S.Z.; Methodology, S.Z.; Software, Y.L. (Yang Li); Validation, Y.L. (Yi Li); Formal analysis, Y.L. (Yi Li); Investigation, Y.L. (Yang Li); Resources, Y.L. (Yang Li); Data curation, Y.L. (Yi Li) and Y.L. (Yang Li); Writing—original draft, Y.L. (Yi Li) and Y.L. (Yang Li); Writing—review & editing, S.Z.; Visualization, Y.L. (Yi Li); Supervision, S.Z.; Project administration, S.Z.; Funding acquisition, S.Z. All authors have read and agreed to the published version of the manuscript.
Funding
This research was funded by the Deep Earth Probe and Mineral Resources Exploration—National Science and Technology Major Project (Grant No. 2025ZD1006201).
Data Availability Statement
The data are not publicly available due to legal and confidentiality reasons.The processed grids and analysis scripts required to reproduce the reported figures will be made available by the corresponding author on reasonable request, subject to the licensing restrictions of the source datasets. Raw station/flight-line observations and complete acquisition metadata were not available in the study archive; this limitation is stated in Section 3.1.
Acknowledgments
The authors thank the anonymous reviewers and the Academic Editor for their constructive comments, which improved the clarity and rigor of the manuscript.
Conflicts of Interest
The authors declare no conflicts of interest.
References
- Haifeng, L.; Yang, S.; Xiang, F.; Faqiao, L.; Yan, X.; Ke, G.; Lei, Z. The magmatism and metallogenetic ages of the Daruoluolong porphyry-skarn copper (gold) deposit in the central segment of the Bangonghu-Nujiang metallogenic belt, Tibet, and their geological significance. Acta Petrol. Sin. 2025, 41, 1644–1663. [Google Scholar] [CrossRef] [Scilit]
- Li, J.-X.; Qin, K.-Z.; Li, G.-M.; Xiao, B.; Zhao, J.-X.; Cao, M.-J.; Chen, L. Petrogenesis of ore-bearing porphyries from the Duolong porphyry Cu–Au deposit, central Tibet: Evidence from U–Pb geochronology, petrochemistry and Sr–Nd–Hf–O isotope characteristics. Lithos 2013, 160, 216–227. [Google Scholar] [CrossRef] [Scilit]
- Li, J.; Qin, K.; Li, G.; Xiao, B.; Zhao, J.; Chen, L. Magmatic-hydrothermal evolution of the Cretaceous Duolong gold-rich porphyry copper deposit in the Bangongco metallogenic belt, Tibet: Evidence from U-Pb and 40Ar/39Ar geochronology. J. Asian Earth Sci. 2011, 41, 525–536. [Google Scholar] [CrossRef] [Scilit]
- Li, J.-X.; Qin, K.-Z.; Li, G.-M.; Xiao, B.; Zhao, J.-X.; Chen, L. Petrogenesis of Cretaceous igneous rocks from the Duolong porphyry Cu–Au deposit, central Tibet: Evidence from zircon U–Pb geochronology, petrochemistry and Sr–Nd–Pb–Hf isotope characteristics. Geol. J. 2016, 51, 285–307. [Google Scholar] [CrossRef] [Scilit]
- Wang, Y.-Y.; Fang, X.; Tang, J.-X.; Lin, B.; Song, Y.; Yang, H.-H.; Zhang, Z.; Wang, Q.; Gao, K.; Zhan, H.-Y. Geology and metallogenesis of the Tiegelongnan Cu–Au–Ag deposit, Duolong ore district, Tibet. Geol. J. 2023, 58, 2987–3007. [Google Scholar] [CrossRef] [Scilit]
- Tian, C.H.; He, W.Y.; Yang, L.Q.; Gao, X.; Zhan, S.Y.; Zhang, X.; Xie, Y.L. Petrogenesis and metallogenic implications of the composite ore-bearing porphyry in the Yulong porphyry Cu-Mo deposit, Tibet. Acta Petrol. Sin. 2026, 42, 1363–1384. [Google Scholar] [CrossRef] [Scilit]
- Wei, S.; Song, Y.; Tang, J.; Liu, Z.; Wang, Q.; Lin, B.; Feng, J.; Hou, L.; Danzhen, W. Geochronology, geochemistry, Sr–Nd–Hf isotopic compositions, and petrogenetic and tectonic implications of Early Cretaceous intrusions associated with the Duolong porphyry–epithermal Cu–Au deposit, central Tibet. Int. Geol. Rev. 2018, 60, 1116–1139. [Google Scholar] [CrossRef] [Scilit]
- Zhang, T.-Y.; Deng, J.H.; Wang, M.; Li, C.; Zhang, L.; Sun, W. Geochemistry and genesis of the Nadun Nb-enriched arc basalt in the Duolong mineral district, western Tibet: Indication of ridge subduction. Geosci. Front. 2022, 13, 101283. [Google Scholar] [CrossRef] [Scilit]
- Sun, H.; Song, Y.; Wilkinson, J.J.; Liu, Z.; Zheng, M.; Wang, B. Petrogenesis of Early Cretaceous Duorenlieqian igneous rocks (113~117 Ma) in the western Bangong-Nujiang metallogenic belt, Tibet, China: Implications for tectono-magmatic evolution and porphyry Cu-Au mineralization. Ore Geol. Rev. 2025, 182, 106650. [Google Scholar] [CrossRef] [Scilit]
- Dwivedi, D.; Chamoli, A. Source Edge Detection of Potential Field Data Using Wavelet Decomposition. Pure Appl. Geophys. 2021, 178, 919–938. [Google Scholar] [CrossRef] [Scilit]
- Dwivedi, D.; Chamoli, A.; Rana, S.K. Wavelet Entropy: A New Tool for Edge Detection of Potential Field Data. Entropy 2023, 25, 240. [Google Scholar] [CrossRef] [Scilit] [PubMed]
- Sun, J.; Mao, J.; Beaudoin, G.; Duan, X.; Yao, F.; Ouyang, H.; Wu, Y.; Li, Y.; Meng, X. Geochronology and geochemistry of porphyritic intrusions in the Duolong porphyry and epithermal Cu-Au district, central Tibet: Implications for the genesis and exploration of porphyry copper deposits. Ore Geol. Rev. 2017, 80, 1004–1019. [Google Scholar] [CrossRef] [Scilit]
- Lin, B.; Chen, Y.; Tang, J.; Wang, Q.; Song, Y.; Yang, C.; Wang, W.; He, W.; Zhang, L. 40Ar/39Ar and Rb-Sr Ages of the Tiegelongnan Porphyry Cu-(Au) Deposit in the Bangong Co-Nujiang Metallogenic Belt of Tibet, China, Implication for Generation of Super-Large Deposit. Acta Geol. Sin. Engl. Ed. 2017, 91, 602–616. [Google Scholar] [CrossRef] [Scilit]
- Li, Y.B.; Zhong, W.T.; Guo, J.C.; Qin, Z.P.; Zhang, Z.; Li, J.L.; Deng, S.Q.; Li, Y.C. Petrogenesis of igneous rocks and ore-forming material source of the Nating porphyry Cu (Au) deposit in the western section of the Bangong Co-Nujiang metallogenic belt, Tibet. Acta Petrol. Sin. 2019, 35, 1717–1737. [Google Scholar] [CrossRef] [Scilit]
- Li, X.-K.; Li, C.; Sun, Z.-M.; Wang, M. Origin and tectonic setting of the giant Duolong Cu–Au deposit, South Qiangtang Terrane, Tibet: Evidence from geochronology and geochemistry of Early Cretaceous intrusive rocks. Ore Geol. Rev. 2017, 80, 61–78. [Google Scholar] [CrossRef] [Scilit]
- Fedi, M.; Quarta, T. Wavelet analysis for the regional-residual and local separation of potential field anomalies. Geophys. Prospect. 1998, 46, 507–525. [Google Scholar] [CrossRef] [Scilit]
- Cella, F.; Fedi, M. Inversion of potential field data using the structural index as weighting function rate decay. Geophys. Prospect. 2012, 60, 313–336. [Google Scholar] [CrossRef] [Scilit]
- Martelet, G.; Perrin, J.; Truffert, C.; Deparis, J. Fast mapping of magnetic basement depth, structure and nature using aeromagnetic and gravity data: Combined methods and their application in the Paris Basin. Geophys. Prospect. 2013, 61, 857–873. [Google Scholar] [CrossRef] [Scilit]
- Goyal, P.; Tiwari, V.M. Application of the continuous wavelet transform of gravity and magnetic data to estimate sub-basalt sediment thickness. Geophys. Prospect. 2014, 62, 148–157. [Google Scholar] [CrossRef] [Scilit]
- Sailhac, P.; Gibert, D.; Boukerbout, H. The theory of the continuous wavelet transform in the interpretation of potential fields: A review. Geophys. Prospect. 2009, 57, 517–525. [Google Scholar] [CrossRef] [Scilit]
- Torrence, C.; Compo, G.P. A Practical Guide to Wavelet Analysis. Bull. Am. Meteorol. Soc. 1998, 79, 61–78. [Google Scholar] [CrossRef] [Scilit]
- Spector, A.; Lawler, T.L. Application of aeromagnetic data to mineral potential evaluation in Minnesota. Geophysics 1995, 60, 1704–1714. [Google Scholar] [CrossRef] [Scilit]
- Droujinine, A. Multi-scale geophysical data analysis using the eigenimage discrete wavelet transform. J. Geophys. Eng. 2006, 3, 59–81. [Google Scholar] [CrossRef] [Scilit]
- Bhattacharyya, B.K. Continuous Spectrum of the Total-Magnetic-Field Anomaly Due to a Rectangular Prismatic Body. Geophysics 1966, 31, 97–121. [Google Scholar] [CrossRef] [Scilit]
- Spector, A.; Grant, F.S. Statistical Models for Interpreting Aeromagnetic Data. Geophysics 1970, 35, 293–302. [Google Scholar] [CrossRef] [Scilit]
- Blakely, R.J. Potential Theory in Gravity and Magnetic Applications; Cambridge University Press: Cambridge, UK, 1995. [Google Scholar] [CrossRef] [Scilit]
- Thomas, M.D.; Pilkington, M.; Mccuaig, M. Evaluation of mineral exploration targets defined by airborne gravity gradiometry through gravity and magnetic modelling, vicinity of the Iron Range Fault, Purcell anticlinorium, southern Canadian Cordillera. Can. J. Earth Sci. 2019, 56, 452–470. [Google Scholar] [CrossRef] [Scilit]
- Sun, J.; Melo, A.T.; Kim, J.D.; Wei, X. Unveiling the 3D undercover structure of a Precambrian intrusive complex by integrating airborne magnetic and gravity gradient data into 3D quasi-geology model building. Interpretation 2020, 8, SS15–SS29. [Google Scholar] [CrossRef] [Scilit]
- Pamuk, E. Investigating edge detection, Curie point depth, and heat flow using EMAG2 magnetic and EGM08 gravity data in the northern part of Eastern Anatolia, Turkey. Turk. J. Earth Sci. 2019, 28, 805–821. [Google Scholar] [CrossRef] [Scilit]
- Mandal, A.; Chandroth, A.; Basantaray, A.K.; Mishra, U. Delineation of shallow structures in Madawara igneous complex, Bundelkhand Craton, India using gravity–magnetic data: Implication to tectonic evolution and mineralization. J. Earth Syst. Sci. 2020, 129, 90. [Google Scholar] [CrossRef] [Scilit]
- Darijani, M.; Farquharson, C.G.; Lelièvre, P.G. Joint and constrained inversion of magnetic and gravity data, A case history from the McArthur River area, Canada. Geophysics 2021, 86, B79–B95. [Google Scholar] [CrossRef] [Scilit]
- Zhdanov, M.S.; Wan, L.; Jorgensen, M. Joint Three-Dimensional Inversion of Gravity and Magnetic Data Collected in the Area of Victoria Mine, Nevada, Using the Gramian Constraints. Minerals 2024, 14, 292. [Google Scholar] [CrossRef] [Scilit]
- Hao, L.-L.; Hu, W.-L.; Wang, Q.; Kerr, A.C.; Dan, W.; Zhang, X.-Z.; Yang, Z.-Y.; Sun, P. Bangong-Nujiang Neo-Tethyan Ocean (Central Tibet): Geodynamics, Crustal Evolution, Metallogeny, and Linkages to the “Yanshan Movement”. Earth Sci. Rev. 2025, 265, 105119. [Google Scholar] [CrossRef] [Scilit]
- Wu, C.; Liu, C.; Fan, S.; Zuza, A.V.; Ding, L.; Liu, W.; Ye, B.; Yang, S.; Zhou, Z. Structural analysis and tectonic evolution of the western domain of the Eastern Kunlun Range, northwest Tibet. Bulletin 2020, 132, 1291–1315. [Google Scholar] [CrossRef] [Scilit]
- Li, S.; Han, Z.; Li, Y.; Tan, X.; Todrani, A.; Ma, X.; Li, Z.; Wang, X.; Dai, J.; Wang, C. Magnetostratigraphy of the Niubao Formation in the Bangong-Nujiang Suture Zone: Constraints on the Amount of Crustal Shortening of the Tibetan Plateau Since 60 Ma. Geophys. Res. Lett. 2024, 51, e2024GL111729. [Google Scholar] [CrossRef] [Scilit]
- Chen, S.-S.; Shi, R.-D.; Zou, H.-B.; Huang, Q.-S.; Liu, D.-L.; Gong, X.-H.; Yi, G.-D.; Wu, K. Late Triassic island-arc–back-arc basin development along the Bangong–Nujiang suture zone (central Tibet): Geological, geochemical and chronological evidence from volcanic rocks. Lithos 2015, 230, 30–45. [Google Scholar] [CrossRef] [Scilit]
- Hou, Z.; Liu, L.; Zhang, H.; Xu, B.; Wang, Q.; Yang, T.; Wang, R.; Zheng, Y.; Li, Y.; Gao, L.; et al. Cenozoic eastward growth of the Tibetan Plateau controlled by tearing of the Indian slab. Nat. Geosci. 2024, 17, 255–263. [Google Scholar] [CrossRef] [Scilit]
- Wu, Y.; Tian, X.; Han, J. Crustal architecture of the Bangong-Nujiang Suture reveals Meso-Tethyan bidirectional subduction: Evidence from Pn-wave receiver function imaging. Tectonophysics 2025, 914, 230903. [Google Scholar] [CrossRef] [Scilit]
Disclaimer/Publisher’s Note: The statements, opinions and data contained in all publications are solely those of the individual author(s) and contributor(s) and not of MDPI and/or the editor(s). MDPI and/or the editor(s) disclaim responsibility for any injury to people or property resulting from any ideas, methods, instructions or products referred to in the content. |
© 2026 by the authors. Licensee MDPI, Basel, Switzerland. This article is an open access article distributed under the terms and conditions of the Creative Commons Attribution (CC BY) license.