


Abstract
In the saline–alkaline lake (SAL) systems of the Nhecolândia region, Brazilian Pantanal, soils exhibit complex mineralogical assemblages controlled by sediment inheritance, pedogenesis, and hydrogeochemical gradients. This study investigates the distribution and transformation of 2:1 phyllosilicates along representative SAL toposequences. Soil samples were characterized by Fourier transform infrared spectroscopy (FTIR) and X-ray diffraction (XRD), supported by granulometry and adjustment of the FTIR spectra. Mineralogical data were integrated with geochemical (Al, K, Mg, Ca, Na) and pH data and examined using principal component analysis (PCA). Greenish loamy horizons act as key morphological controls on hydrogeochemistry, regulating solute retention along mid- to downslope transitions. Illite is more strongly associated with upslope positions, whereas downslope alkaline environments are associated with smectitic phases (e.g., montmorillonite and Mg-rich varieties such as saponite) and mixed-layer minerals structures (e.g., illite–smectite and montmorillonite–vermiculite structures). These assemblages are consistent with non-linear transformation pathways, with illite as a possible transitional phase between micas and expandable structures. The PCA results suggest a primary mineral distribution structured by fine-material content and depth, while pH and alkalinity emerge as key geochemical controls that differentiate mineral stability fields and reinforce the hydrogeochemical compartmentalization of the profiles. Geochemical data show strong associations of Al, Mg, and K with fine-fraction accumulation. The integration of these approaches highlights that a 2:1 phyllosilicate assemblage results from multiple superimposed pedogenetic pathways, offering a conceptual framework for studying complex soil–lake systems.
1. Introduction
The Nhecolândia study area, located in the Pantanal of Mato Grosso do Sul, Brazil, is renowned for its biodiversity and environmental significance. This tropical region undergoes a hydrological annual cycle, divided into dry and rainy seasons that cause seasonal floods, resulting in a complex interaction between surface fluxes, soils, and groundwater. The area is characterized by a complex system of saline–alkaline lakes (SALs) and freshwater lakes (FLs), locally known as salinas and baías, respectively, which are interspersed with sandy ridges (cordilheiras). Soils around SALs are associated with different types of environments (eutrophic, oligotrophic turbid, and clear vegetated oligotrophic) representative of the variability of geochemical conditions in which Arenosols (>50% sand fraction) transform into Solonetz and Solods [1,2]. Correlated areas are also classified as salt-affected soils, such as gleyic Solonetzes, Eutric Planosols, and Eutric Vertisols, based on past and recent favorable environmental conditions, relating the uniqueness of these soils to their intense geochemical and mineralogical variations [3,4,5]. When linked to the local climate, mineral structural changes reflect a variety of conditions capable of differentiating active mineral transformation processes, which directly influence the composition of the waters and the dynamics of each type of ecosystem.
Regionally, the established hydrogeochemical dynamic allows for the coexistence of SALs and FLs, managed by the presence of greenish loamy horizons in the subsurface that support the accumulation of salts through evapotranspiration over long periods [6,7,8].
Thus, the interactions between water, different types of clays, salts, and organic matter (OM) create a highly dynamic system with significant seasonal variations. Around SALs, phyllosilicates such as kaolinite, illite, smectite, and mixed-layer mineral structures (MLMs) are among the most common clay minerals [9,10,11]. Underlying geological formations (the Pantanal Formation) also influence SAL environments, providing the primary source of sediments and minerals [12].
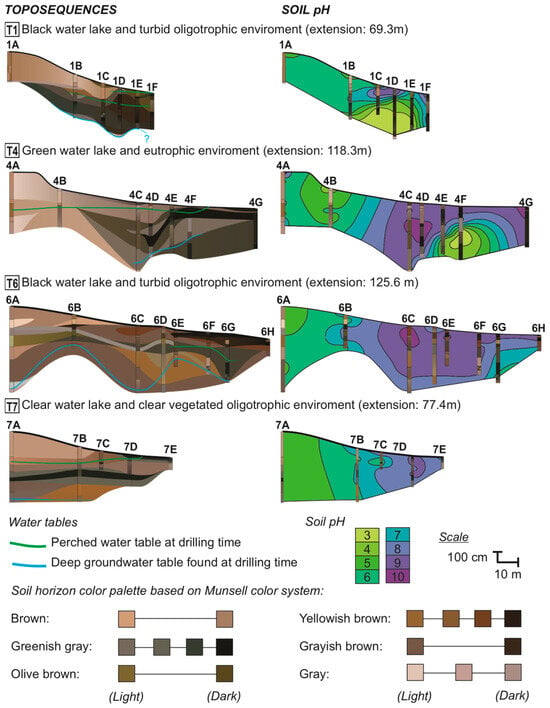
Generally, SAL-surrounding soils show a massive texture, with brown-gray and fine to very fine sands in upslope boreholes, transitioning to greenish loamy layers downslope, with indurated layers composed of quartz (silcrete) or clay minerals, Fe (oxihydr)oxides, and carbonates [7,8,12,13,14]. Geochemical processes and influencing factors such as salinization, solonization, solodization, redoximorphic processes, and OM influence are all ruled by hydrogeochemical conditions [6,9,10,15,16,17]. Evidence of this dynamic behavior is reflected in the soil pH, which ranges from 3 to 10, becoming progressively more alkaline towards SAL margins, apart from localized hyperacidic zones occurring in deeper horizons (Figure 1).
Figure 1.
Toposequences and soil pH distribution around saline–alkaline lakes (SALs) in Nhecolândia. The environmental type of each lake is specified. Profile codes indicate the lake number and toposequence position, where A represents upslope profiles and subsequent letters follow the slope alphabetically towards the lake. Soil horizons and water table levels are shown on the (left), while soil pH distribution (right) shows localized hyperacidic zones near the lakes at T1 and T4. Left side toposequence colors correspond to field descriptions based on the Munsell soil color system. Different water table levels, measured in September 2017 for T1–T4 and in October 2019 for T6–T7, are separated by color. Source: Adapted from Ref. [8].
Classical geochemical models largely described sequential or progressive transformation pathways among phyllosilicates [18,19,20], whereas field-based pedogenetic studies highlight that such transformations operated through overlapping, non-linear, and locally constrained pathways [21,22,23]. For the Nhecolândia region, such processes are exemplified by the presence of trioctahedral magnesian smectites (stevensite and saponite) in the upper dark horizons near the lake water level, and Fe-illite and glauconite in the poorly permeable green horizons [24]. Illite-rich phases have been reported as dominant in strongly alkaline–saline–sodic soils, whereas more acidic Solod conditions have been associated with increasing smectitic and kaolinitic components, a dynamic supported by the occurrence of mixed-layer clays (e.g., illite–smectite and kaolinite–illite structures) and by decreasing illite proportions in response to solonization and solodization processes [10,25].
These observations motivated a more targeted analytical approach aimed at isolating the mineralogical processes operating in the Nhecolândia soil–lake system. Given the non-uniform response of horizon geometry and soil pH observed in surrounding soils (Figure 1), this study specifically focuses on the soil domain rather than lake sediments to characterize geochemical and mineralogical changes in 2:1 phyllosilicate-rich soil–lake samples, focusing on specific 2:1 phyllosilicate subgroups to elucidate their occurrence, spatial distribution, transformation pathway hypotheses, and predominant phases. Particular emphasis is placed on the methodological adjustment required to investigate these minerals in kaolinite-dominated systems.
For this analysis, Fourier transform infrared spectroscopy (FTIR) and X-ray diffraction (XRD), supported by the Hit Quality Index (HQI) derived from adjusted FTIR spectra (kaolinite subtraction) and grain-size separation into fine and coarse clay fractions, were conducted on soil samples from Costa-Silva et al. (2024) [8]. However, while this previous study established the general pedological, hydrological, granulometric, and mineralogical framework of the studied toposequences, the present study specifically investigates the finer-scale distribution and interpretation of 2:1 phyllosilicates within these profiles. In this sense, this manuscript refines the mineralogical resolution of a mineral group that remained only broadly characterized.
2. Materials and Methods
2.1. Location and Field Work
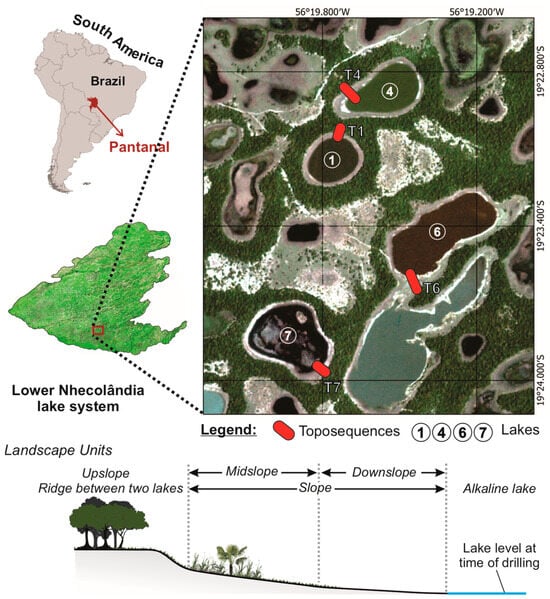
The four toposequences carried out by Costa-Silva et al. (2024) [8] at Fazenda São Roque (19°23′26″ S and 56°19′33″ W, Aquidauana, Mato Grosso do Sul, Brazil) were located around each type of SAL (Figure 1).
Sampling locations and general site characterization followed Costa-Silva et al. (2024) [8], whereas the present study focused on targeted sampling, fraction separation, and FTIR-based refinement to investigate 2:1 phyllosilicates.
The targeted samples are representative of all the microforms of local reliefs around lakes 1, 4, 6, and 7, from sand ridges upslope towards the edge of each lake downslope (Figure 2). Soil sampling was conducted through boreholes drilled along each toposequence using a 7 cm diameter hand auger, following the standard pedological procedures detailed in Section 2.3 [26,27,28]. A total of 26 boreholes were drilled across all toposequences, reaching depths ranging from approximately 80 to 570 cm, depending on local soil conditions and profile development. These boreholes allowed for the characterization of vertical soil variability, including horizon organization, texture, and geochemical gradients.
Figure 2.
Location of toposequences and schematics of their landscape units. Circle numbers refer to saline-alkaline lakes, while red bars indicate associated toposequences. Source: The authors.
The toposequences surrounding the various typical types of SAL were considered suitable for investigating the functioning of these processes due their simultaneous and continuous transition from brownish sandy to greenish saline soils towards the lakes.
2.2. Sample Selection and Dataset Definition
A total of 42 representative soil samples were selected across the four toposequences. In cases where samples presented very low fine-fraction content, preventing complete analytical characterization, nearby samples with similar stratigraphic positions and higher clay–silt content were used to ensure analytical consistency. As a result, samples 4B–10 cm and 4D–10 cm were analyzed exclusively by XRD and replaced by samples 4B–25 cm and 4D–45 cm in the FTIR dataset. Thus, two corresponding datasets of 40 samples were established, constituting the main analytical datasets used in this study.
FTIR-adjusted spectra, including kaolinite subtraction and HQI re-evaluation, were obtained from the same 40 samples analyzed by FTIR. From this dataset, a representative subset of 20 samples was selected for exploratory PCA, aiming to capture the main spatial and mineralogical variability along the profiles. Additionally, 12 samples with sufficient fine material were selected for XRD analysis of fine and coarse clay fractions separately.
2.3. Sample Preparation and Laboratory Procedures
All samples were dried in a ventilated drying oven at 40 °C, initially crushed and sieved to >2 mm (oven-dried fine earth, ODFE), and then ground and sieved to >106 µm. Particle-size distribution was determined using the Robinson pipette method [27], and textural classes followed the United States Department of Agriculture classification [28]. Clay and silt fractions were obtained by centrifugation [29], requiring suspension in ultrapure water, which is likely to dissolve evaporitic minerals or very small carbonates. The powdered clay fraction, free of organic matter (OMF), was analyzed by Fourier transform infrared spectroscopy (FTIR) and X-ray diffraction (XRD). The OM was removed with sodium hypochlorite (NaClO) at pH 9.5 [30].
FTIR was performed on OMF clay pellets mixed with potassium bromide (KBr) in a Shimadzu IR Prestige-21 spectrophotometer (Shimadzu, Kyoto, Japan). Spectra ranged from 400 to 4600 cm−1. Saturation or low-resolution bands were re-evaluated in replicates with lower or higher sample mass pellets. Normalization of results was achieved according to the mineral phase band with the highest absorption, considering an absorbance correction factor based on mass values of the sample, KBr, and pellets. FTIR analysis of clay minerals by KBr pressed clay pellets is widely used for routine characterization of di- and trioctahedral clay minerals [31], with mineral interpretation established by characteristic absorption bands [32,33,34,35,36,37,38,39,40,41] and candidate matching using Spectrus Processor software (Version 2023, ACD Labs, Toronto, ON, Canada) paired with the FDM Minerals and Inorganics spectral database (Fiveash Data Management Inc., Monona, WI, USA).
However, FTIR spectra processed in the Spectrus Processor (Version 2023, ACD Labs, Toronto, ON, Canada) could be further adjusted. Because kaolinite was a dominant phase in many samples and strongly overlapped the absorption bands of other phyllosilicates, an additional spectral subtraction step was applied to improve the interpretability of the secondary features. Spectral subtraction is an established FTIR procedure for isolating overlapping signals in complex mixtures, including soils, although it requires cautious interpretation because subtraction artifacts may occur and the results depend strongly on the quality of the reference spectrum and the objective of the analysis [42,43]. For this purpose, a laboratory reference kaolinite (Aiken, SC, USA) was analyzed under the same instrumental conditions as the samples, and its FTIR spectrum was subtracted from the sample spectra.
Prior to subtraction, both sample and reference spectra were processed following identical preparation and acquisition procedures, and baseline correction was performed, ensuring consistency in absorbance units and minimizing instrumental or preparation-related artifacts. Subsequently, spectra were aligned on the same wavenumber scale, with particular attention to kaolinite absorption bands 3620, 2655, 3672 and 3695 cm−1. The subtraction procedure was then performed interactively by applying scales factors close to 1 (0.88 to 0.96), aiming to reduce the dominant kaolinite contribution while avoiding over-subtraction effects such as band inversion or negative residuals in diagnostic regions. The adjustment criterion was based on minimizing kaolinite-related bands while preserving the overall spectral structure of the remaining signals.
Because complete removal of kaolinite features is neither expected nor desirable in complex natural samples, remaining signals on the resulting adjusted spectra were interpreted as overlapping contributions from other minerals phases. The resulting adjusted spectra were then searched by similarity against the same spectral database. Thus, “adjusted spectra” or “adjusted HQI” refer to FTIR analysis and results without the influence of kaolinite bands.
The Hit Quality Index (HQI), before and after kaolinite subtraction, was used only as a spectral similarity metric to rank candidate matches, as the HQI does not represent mineral abundance. By itself, it does not guarantee the correctness of an assignment since search algorithms always return a best match and the numerical values depend on the algorithm and scaling adopted by the software [44]. For this reason, HQI values were interpreted together with the position of diagnostic bands and complementary XRD evidence. A value of 50% was adopted as an empirical working threshold for internally consistent matches across the dataset. This threshold was not treated as a universal confidence limit. Matches below 50% were not automatically discarded but were only considered in interpretation when supported by XRD results. Accordingly, the adjusted FTIR procedure is treated here as a spectral adjustment tool to improve discrimination of 2:1 phyllosilicate candidates in kaolinite-dominated samples, rather than as a standalone validation method. The subtraction allowed for interpretations of the most likely mineral candidates within four 2:1 phyllosilicate subgroups: (i) non-expansive (Nex), (ii) expansive (Ex), (iii) mixed-layer minerals (MLM), and (iv) primary mica (Pmi).
XRD samples were analyzed using a Philips PW 1877 diffractometer (Philips, Amsterdam, The Netherlands) operated at 40 kV potential and 40 mA current, using CuKα radiation with a graphite crystal monochromator. The scan was performed from 3° to 70° (2θ) with a step of 0.02° and 2.5 s per time accumulation step. Analysis was performed on samples oriented and saturated (1) with magnesium chloride (MgCl2), later solvated with ethylene glycol (G), and (2) with potassium chloride (KCl), later heated to 550 °C [45]. Mineral phases were interpreted on the X’ Pert HighScore Plus version 4.9 software package (Malvern Panalytical, Almelo, The Netherlands). Representative peaks used for mineral interpretation were as follows: quartz, 3.34, 4.25, and 1.81 Å; feldspars (microcline and/or orthoclase), 3.24, 4.21, and 3.29 Å; micas (muscovite and/or illite), 4.29, 3.86, and 10 Å; kaolinite, 7.13, 3.56, and 4.35 Å; 2:1 expansive clay minerals (smectites), 12 to 15 Å; calcite, 3.02, 1.87, and 2.28 Å. XRD adjustment followed standard protocols for fine- and coarse-fraction separation, allowing for both techniques to complement and validate each other.
Major elements (Al, K, Mg, Na, and Ca) were determined using a total melting of soil samples and measured by Inductively Coupled Plasma Optical Emission Spectroscopy (ICP-OES) at Actlabs (Ancaster, ON, Canada). These variables were not directly used for mineralogical interpretation but rather to support the multivariate analysis of environmental gradients.
Soil pH was measured in a 1:2.5 (w:w) soil–water suspension using oven-dried fine earth (ODFE), following the Brazilian Agricultural Research Corporation (Embrapa) procedure [46].
2.4. Statistical Analysis
Principal component analysis (PCA) was performed using XLSTAT 2025 on the 20 adjusted FTIR samples. PCA reduces multidimensional data into a lower-dimensional subspace by minimizing residual variance [47]. In this study, we applied a correlation-based PCA on standardized variables and representative samples to ensure that the analysis was not influenced by differences in variable scales. This approach constructs a table based on the Pearson correlations between active variables, allowing for further suggestions about the relationships between adjusted HQI-based mineral subgroups, fine-material content (clay + silt or C+S), geochemical variables (Al, K, Mg, Na, and Ca), sample depth, and soil pH. Ca, Na, and pH were included exclusively in the PCA as complementary geochemical variables to better capture the hydrogeochemical variability of the soil–lake system, particularly in relation to salinity, alkalinity, and cation distribution along the toposequences. Si and sand contents were excluded due to their dominance across all samples.
3. Results
3.1. Clay Mineralogy
The mineralogical composition of whole soil and clay OMF fractions is represented, respectively, by quartz, feldspars, mica, and kaolinite, and by kaolinite, carbonates, iron oxyhydroxides, and expansive and non-expansive 2:1 phyllosilicate minerals.
Quartz, feldspars, and kaolinite were persistent across all four toposequences, indicating stability under contrasting environments and geochemical conditions. In contrast, muscovite, smectites, illite, and MLM were more frequently observed in deeper samples (>150 cm), as summarized in Table 1. Representative diffractograms, FTIR spectra highlighting the main absorption bands, and COD reference files are provided as Supplementary Materials Figures S1 and S2, and File S1, respectively. Carbonates were restricted to alkaline settings and were more common at the surface near lakes or segregated from the soil matrix as nodules larger than 2 mm. Calcite (COD 9016706) was the dominant carbonate phase, although dolomite XRD peaks (COD 9001419) and a characteristic FTIR absorption band at 1441–1443 cm−1 were also detected, suggesting an association with elevated Mg contents [41].
Table 1.
Mineralogy composition of superficial (<150 cm) and deep (>150 cm) samples.
Illite was the most widespread hydromica interpreted as a secondary non-expansive 2:1 phyllosilicate (Nex) across the studied toposequences, consistent with distributions reported for comparable saline–alkaline soil systems by Andrade et al. (2020) [10] and Vidoca (2020) [25]. Although illite bands are discernible in all FTIR spectra, their interpretation is more robustly supported by XRD. Variations between the COD reference files revealed a closer correspondence with structurally well-ordered illite in upslope samples (COD 9009665), interpreted as relatively more stable forms, whereas downslope samples showed better agreement with transitional states (illite to Fe-bearing celadonites; COD 9013722). This preliminary interpretation is consistent with the possibility that illitic phases participate in ongoing mineral transformation processes [22,23]. Vermiculitic components (COD 9000009; COD 9000016; COD 9000146) were also interpreted, most commonly occurring within mixed-layer structures, although the presence of discrete vermiculite-type phases cannot be excluded.
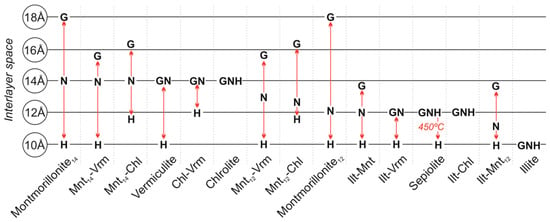
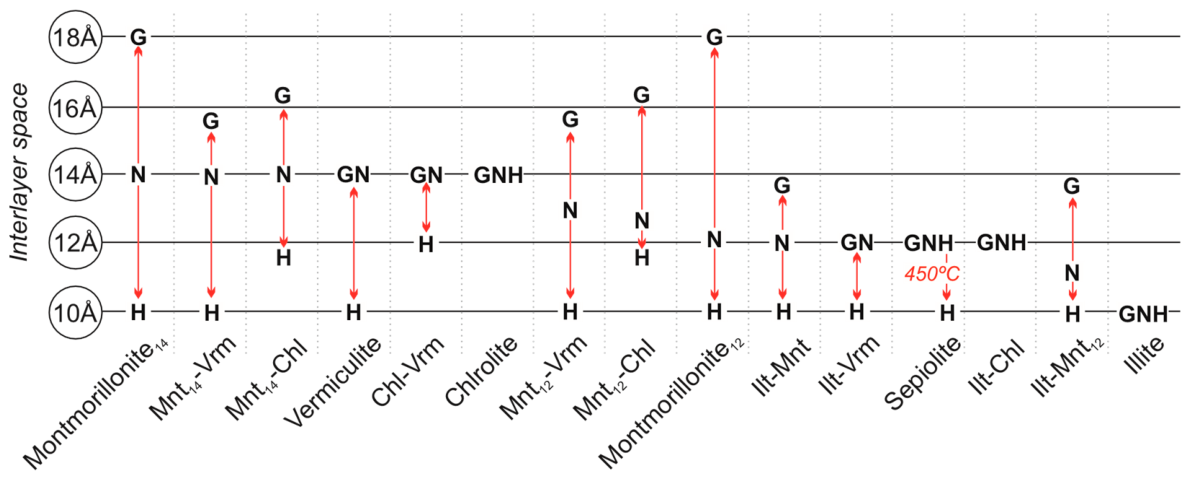
Among expansive structures (Ex), smectitic phases were predominant, with montmorillonite-type phases (COD 9002779; COD 9010958) consistently returned as a representative candidate. Based on the peak-expansion behavior described by Lucas, Camez, and Millot (1959) [49] for MgCl2-saturated XRD samples (Figure 3), the dominant expansion near 14 Å is consistent with smectitic structures, while deeper downslope samples showed features compatible with mixed-layer structures. The illite–smectite mixed-layer structure was only suggested by FTIR similarity matching and interpreted at the subgroup level. Samples exhibiting more than one peak within the characteristic smectite region in XRD patterns were accordingly interpreted as MLM.
Figure 3.
XRD peak-expansion behavior of 14 and 12 Å montmorillonite (Mnt), vermiculite (Vrm), chlorite (Chl), sepiolite, and illite (Ilt) under natural (N; 23 °C), glycolated (G), and heated (H; 550 °C) conditions. Red arrows highlight the variation in the interlayer space of each mineral structure. Source: Adapted from [49].
3.2. XRD and FTIR Adjustment
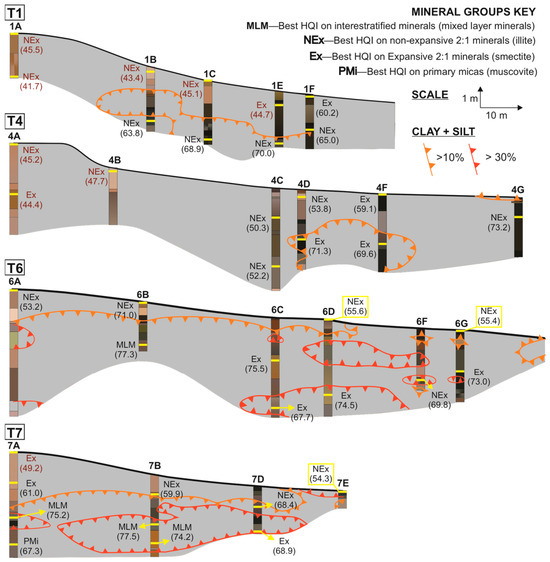
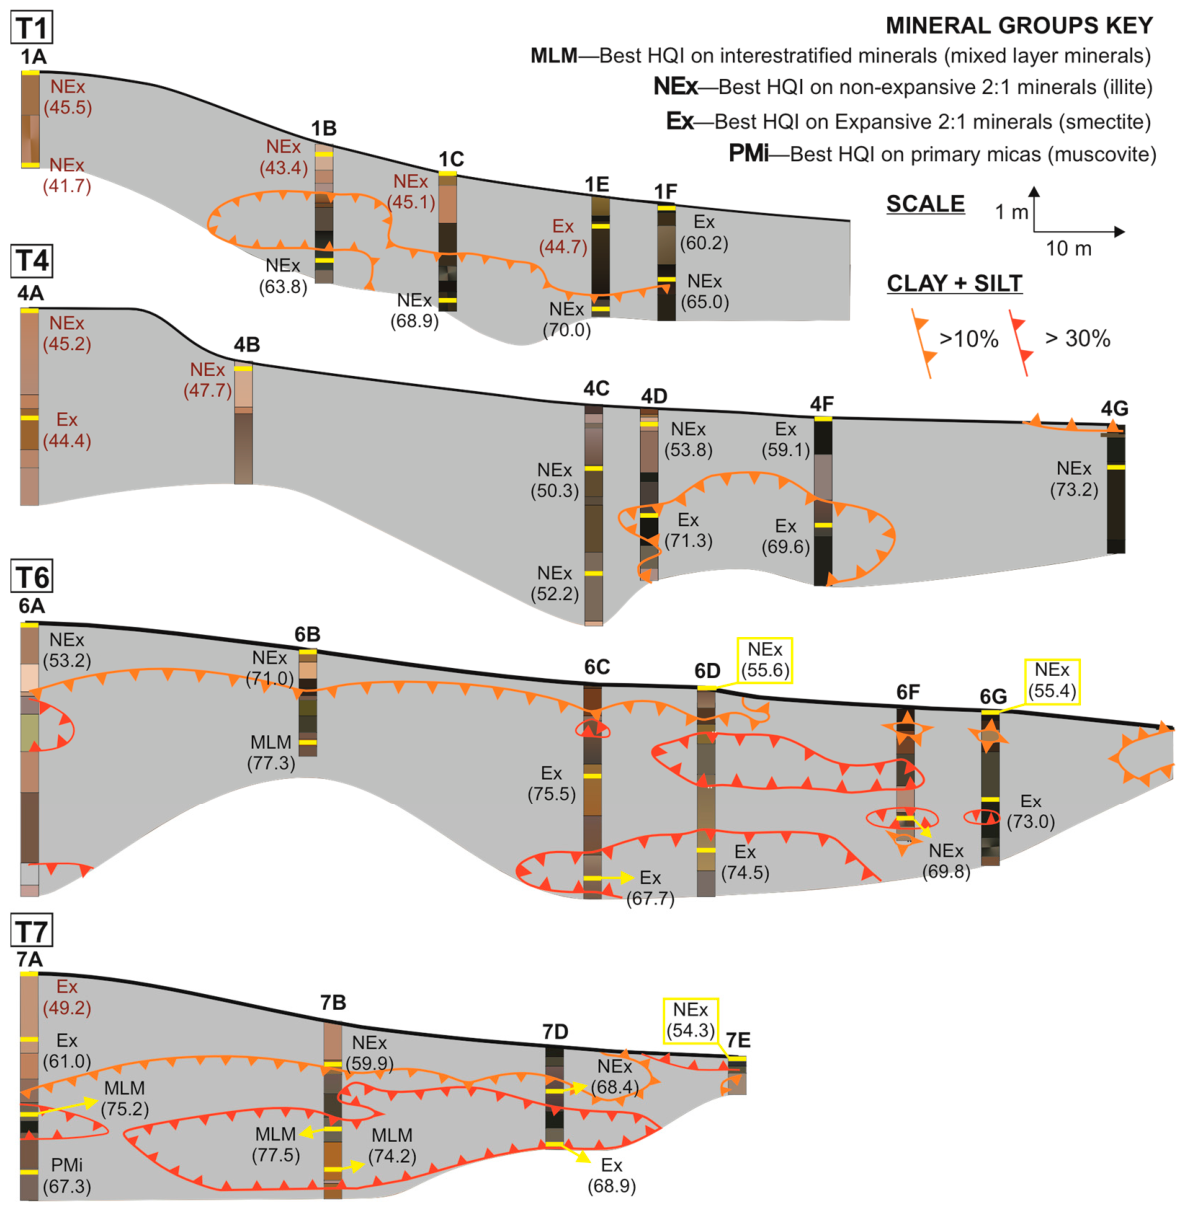
Initial FTIR-based adjustments consistently preserved the interpretation of minerals already recognized by FTIR and XRD (e.g., illite), indicating that the adjustment procedure did not alter the mineralogical interpretation and supporting the use of a 50% adjusted HQI-ranked threshold as an operational criterion for tracking the candidate mineral phase and their vertical trends within the soil profiles. When integrated with the fine material distribution patterns of Costa-Silva et al. (2024) [8], adjusted HQI values helped to understand the distribution of non-expansive (NEx), expansive (Ex), mixed-layer (MLM), and primary mica (PMi) 2:1 phyllosilicate subgroup patterns across each toposequence, thereby increasing confidence in subsequent discussions (Figure 4).
Figure 4.
Distribution of Hit Quality Index (HQI) values along the toposequences, based on adjusted FTIR spectra. Yellow bars mark sample positions. Mineral subgroups include mixed-layer (MLM), expansive (Ex), non-expansive (NEx), and primary mica (PMi). Code names and numbers denote the mineral subgroup with the highest HQI and its corresponding percentage. Values in red indicate HQI < 50%, for which XRD interpretation was required and prioritized. Orange and red lines indicate intervals with higher proportions of fine materials. The colors of soil profiles follow the same scheme presented in Figure 1. Source: Adapted from Ref. [8].
Although adjusted HQI values above 50% provided higher confidence in mineral assignment, results below this threshold were also retained (Figure 4, Table 2) since we recognized that these subgroups are not independent from each other. This justified that mineral interpretation was not inferred from FTIR alone and was considered valid only when the HQI matches were independently supported by XRD.
Table 2.
HQI values for each mineral subgroup derived from adjusted FTIR spectra. Mineral subgroups include mixed-layer minerals (MLMs), expansive (Ex), non-expansive (NEx), and primary micas (PMi). The letter “X” indicates the absence of the respective mineral subgroup in a given sample. Source: The authors.
Within this framework, illite was interpreted as the dominant secondary mica, particularly in superficial and sandy upslope zones, representing the NEx subgroup. Smectites remained recurrent within the expansive subgroup, although the adjustment procedure did not allow for a reliable discrimination between specific mineral phases. When XRD adjustment was considered, Mg-rich smectites remained plausible candidates, although they typically exhibited low HQI values in the adjusted FTIR spectra. Among these, a saponite-type phase, previously reported by Furian et al. (2013) [24] and Furquim (2008, 2010a, 2010b) [3,4,5] as trioctahedral smectite associated with alkaline lake environments, was intermittently matched as a candidate with HQI values ranging from 32.3% to 59.1%. Spatial distribution of this matching supports the arbitrary HQI threshold proposed on values since HQI > 50% are consistent only in samples proximal to lakes (profiles 1F at 13 cm, 6G at 190 cm, and 4F at 13 cm). Accordingly, the Ex subgroup is appropriately represented as smectites rather than as specific mineral phases. MLM retained the variability observed prior to adjustment (Mnt–Vrm and Ilt–Sme structures), and muscovite was consistently interpreted as representative of the PMi subgroup.
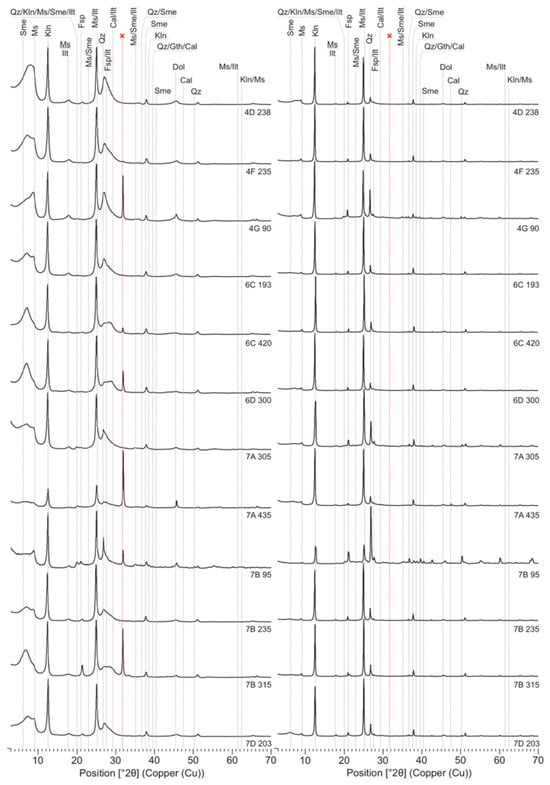
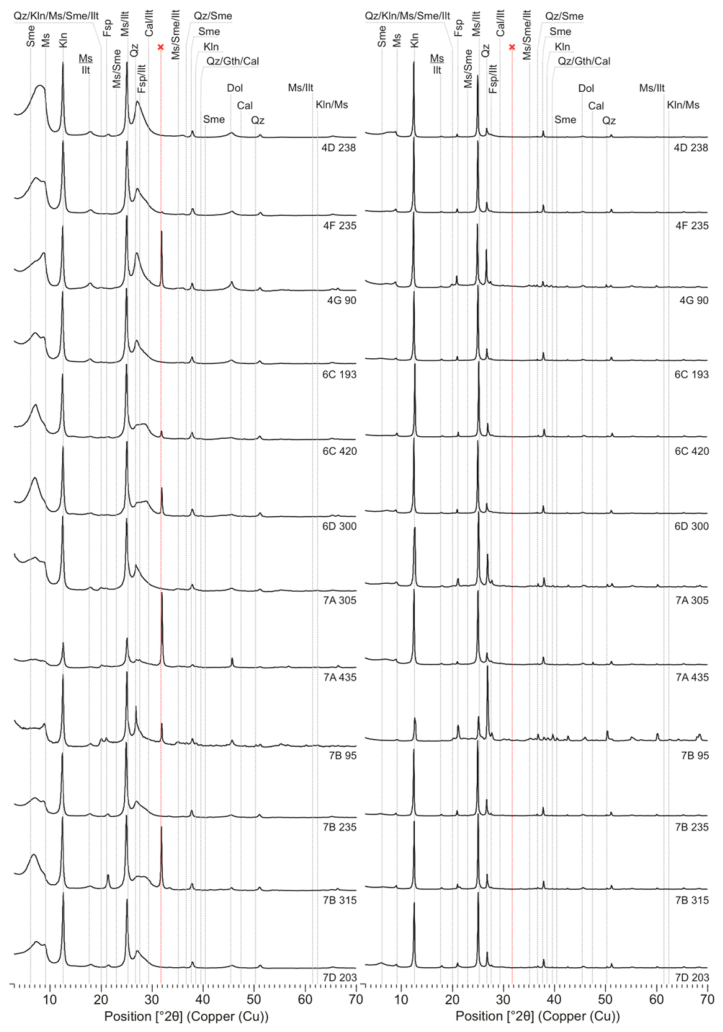
This reinforced the essential role of XRD, particularly in cases where minerals reported in the literature yield low HQI match values following FTIR adjustment. In horizons enriched in fine particles (mainly deeper samples), smectitic phases preferentially occurred in the fine fraction, as indicated by broad diffraction peaks within the 5–10° and 25–32° (2θ) ranges (Figure 5) [49]. In contrast, sharp and well-defined peaks of primary micas in the coarse fraction suggest derivation from parent materials, although these minerals also persist in the fine fraction. A minor peak at 2.81° (2θ) observed in some fine-fraction diffractograms was interpreted as an artifact related to sample preparation.
Figure 5.
XRD patterns of coarse (right) and fine (left) clay fractions. The red line marks an artifact related to sample preparation. Sme—smectite; Ms—muscovite; Kln—kaolinite; Ilt—illite; Qz—quartz; Fsp—Feldspar; Cal—calcite; Gth—Goethite; Dol—dolomite.
3.3. Chemical Distribution of Al-K-Mg
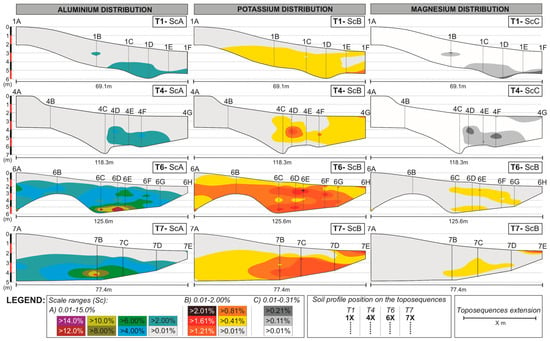
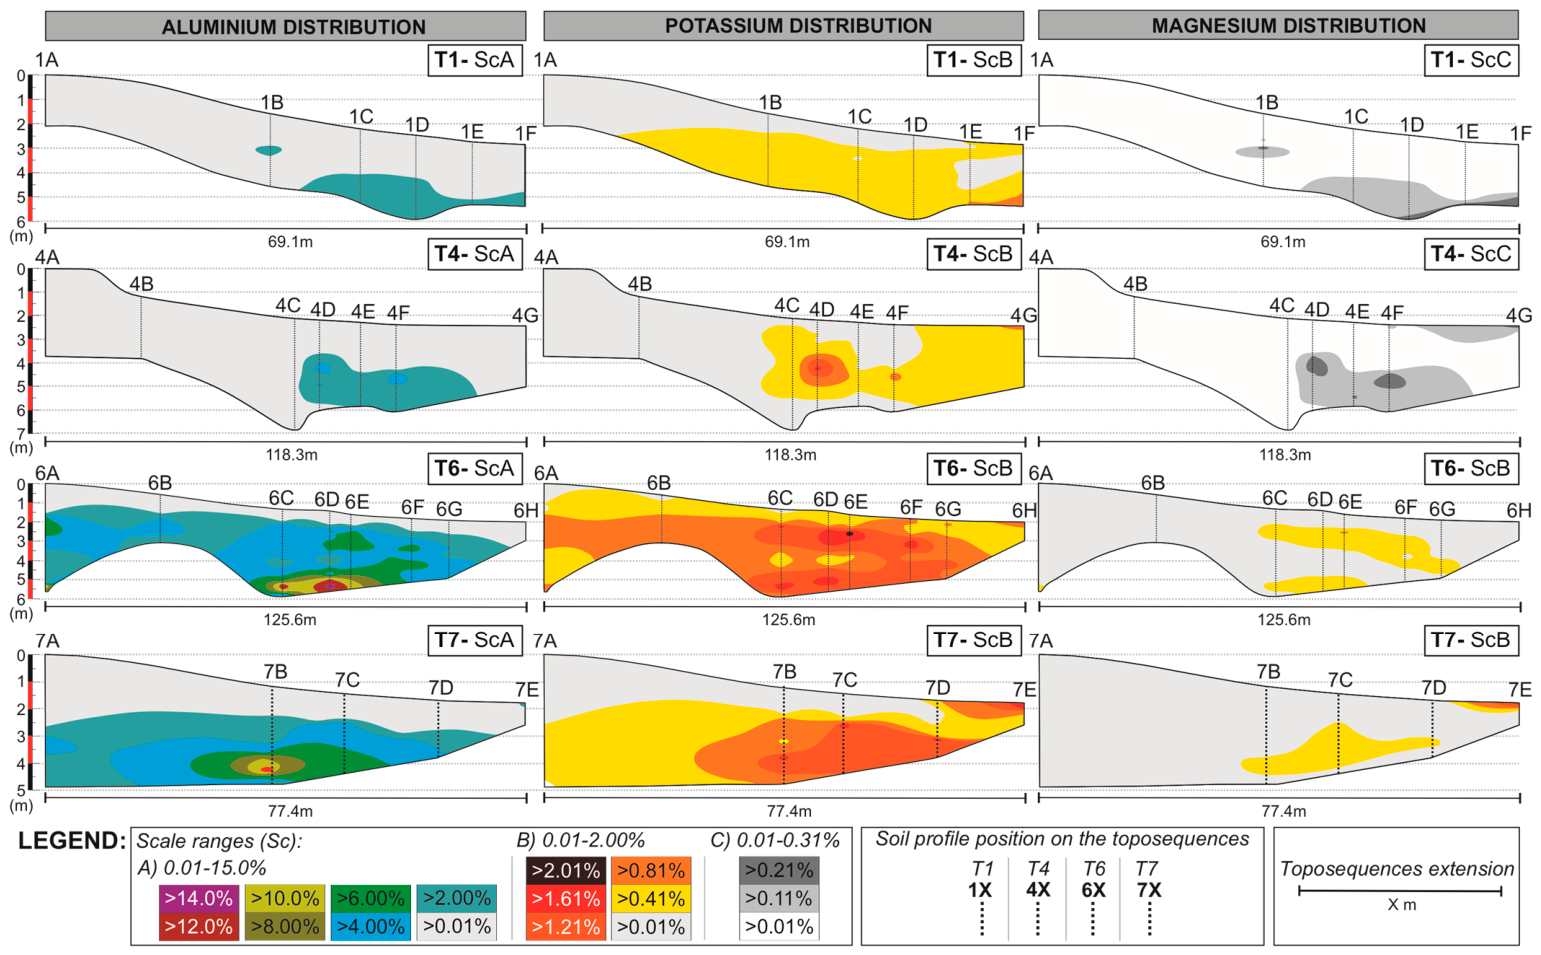
With the adjusted mineralogical results, geochemical data were subsequently used to delineate zones of elemental accumulation, focusing specifically on Al, K, and Mg (Figure 6), as they constitute the dominant structural and interlayer cations of the primary micas, illitic phases, smectites, mixed-layer structures, and associated carbonates.
Figure 6.
Distribution and relative accumulation of Al, K, and Mg along the studied toposequences. Scales A, B, and C reflect different ranges of relative concentration. In the depth scale bars in the left, red and black colors alternate solely to improve visual distinction between successive 1-m depth intervals. Source: The authors.
Higher elemental accumulations were consistently observed in transitional mid- to downslope sectors, generally within deeper horizons and commonly associated with pH extremes. These include alkaline environments across all toposequences (pH > 8.5) and localized hyperacidic zones in T1 and T4 (pH < 5, Figure 1). This behavior was reflected in the development of element-specific accumulation zones, with Al preferentially concentrated in deeper intermediate profiles (1D, 4D, 6D, and 7B), whereas K and Mg showed deep and near-surface enrichment close to the lakes (1F, 4G, 6E, 6F, and 7E).
In addition, the geochemical dataset revealed distinct Al and Mg concentration ranges for T6 and T7, characterized by Al content up to 14.79% at 6D-388 cm and Mg content up to 1.96% at 7 × 10⁻⁵ cm (Figure 6).
3.4. Exploratory Statistical Analysis
Table 3 presents the complete dataset used in the PCA, including all variables and their corresponding values for the selected samples. This PCA result should be interpreted as exploratory, particularly considering the limited sample size and the partial dependence between HQI-derived variables.
Table 3.
Complete dataset used for the exploratory PCA (n = 20), including HQI-derived variables for 2:1 phyllosilicate subgroups, geochemical parameters, depth, and fine-material content (clay + silt).
The Pearson correlation matrix (Table 4) showed strong (±0.8 ≥ rP ≥ ±0.9) to optimal (rP ≥ ±0.9) positive correlations between all 2:1 phyllosilicate subgroups, as expected, given their shared structural framework. However, HQI-derived variables correlations should be interpreted as relative associations rather than quantitative relationships.
Table 4.
Pearson correlation table (n = 20). Strong (±0.8 ≥ rp ≥ ±0,9) and optimal (rp ≥ ±0,9) correlations are highlighted in yellow and green, respectively. Values in bold are different from 0 with a significance level alpha = 0.05.
Within this overall affinity, however, the relative strength of the correlations allowed for meaningful differentiation between subgroup relationships. The strongest association occurred between the adjusted HQI of Ex and MLM subgroups (rP = 0.979), consistent with the interpretation that expansive phases predominantly occur as interstratified structures. Primary micas (PMi) exhibited optimal correlations with all other subgroups, particularly with NEx (rp = 0.963), reinforcing their role as a structural source for non-expansive secondary phases. Conversely, the lowest correlation was observed between NEx and Ex (rp = 0.836), which, despite remaining strong, is consistent with these subgroups representing the most structurally divergent end-members within the 2:1 phyllosilicate spectrum.
HQI-derived variables associations and major elements distribution resulted in selective and moderate correlations. The strongest associations involved the MLM subgroup with Mg (rP = 0.809) and K (rP = 0.808), and Ex subgroup with K (rP = 0.800). Among the elemental variables, Al-Mg (rP = 0.976) and Al-Ca (rP = 0.924) showed optimal correlations, while strong correlations were also established for Ca–K (rP = 0.899), Mg–K (rP = 0.890), Mg–Ca (rP = 0.885), and Al–K (rP = 0.872). Fine-material content (C + S) showed optimal correlations with Al (rP = 0.988), Mg (rP = 0.969), and Ca (rP = 0.924), and a strong correlation with K (rP = 0.849). Positive correlations were also observed with 2:1 phyllosilicate subgroups, although below the strong-correlation threshold. The highest association occurred with MLM (rP = 0.747), followed by Ex, PMi, and NEx (rP = 0.615), suggesting that similarity patterns associated with these subgroups are more frequently observed in samples with higher fine-material content. Very weak negative correlations were observed between Ex, MLM, and PMi subgroups and soil pH, which is consistent with a limited influence of pH on their spectral variability, while no meaningful correlation was observed with NEx.
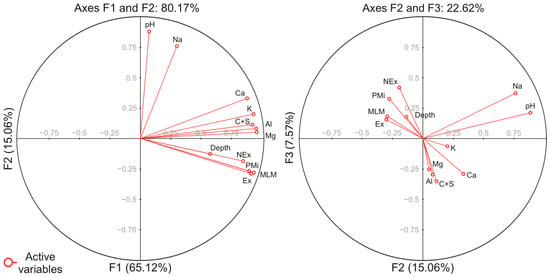
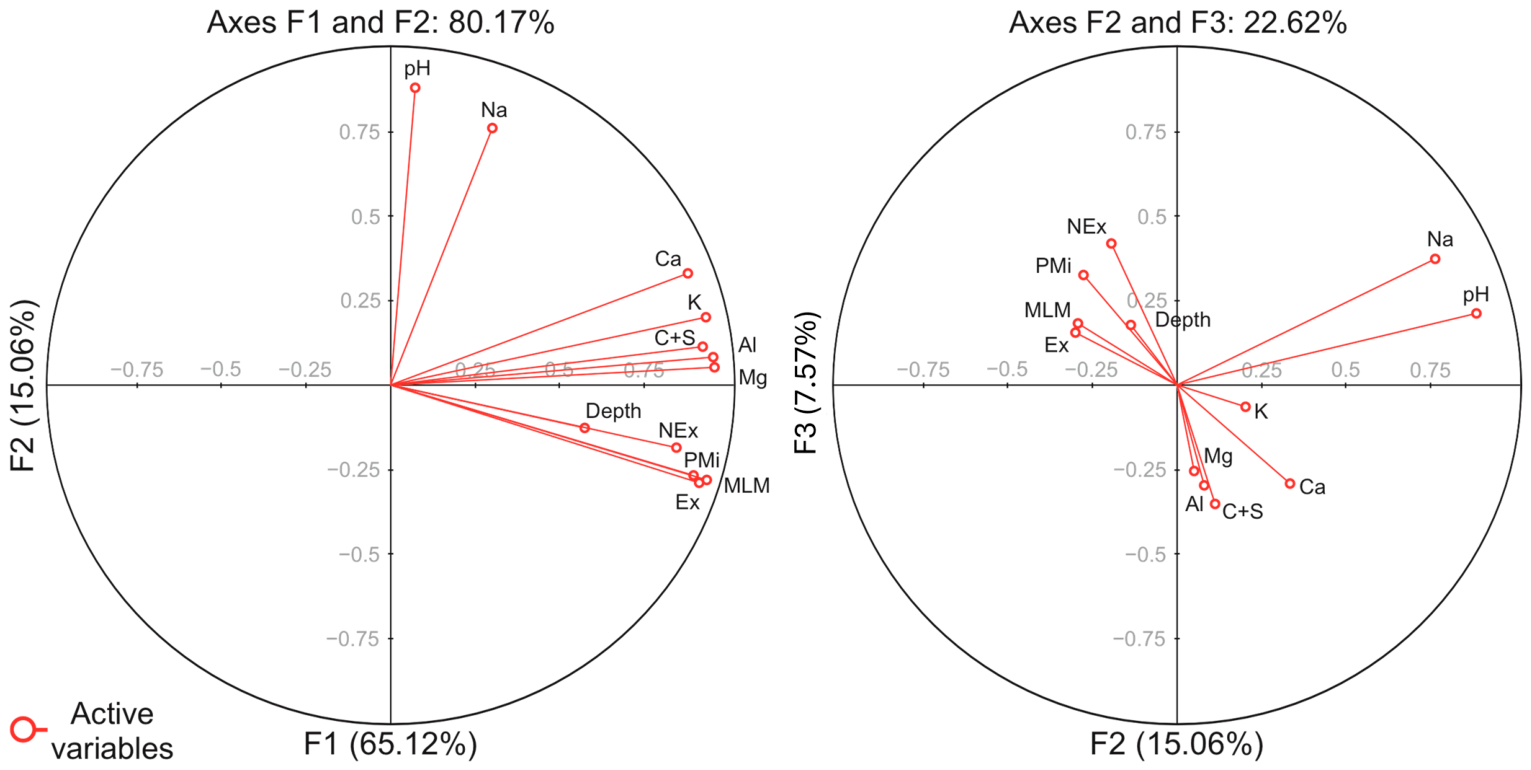
All these correlations are illustrated in the PCA biplot (Figure 7). The first two factorial axes (F1 and F2) explain 80.17% of the total variance. Axis F1 is characterized by the alignment of 2:1 phyllosilicate subgroups associations, fine-material content (C + S), depth, and Al–Mg–Ca–K concentrations, reflecting their shared variance structure. Axis F2 is dominated by pH and Na, plotted nearly orthogonal, which may represent a secondary geochemical gradient with limited interaction with the main variance structure.
Figure 7.
PCA biplots (n = 20) of samples and active variables. Results are projected on factorial axes F1 and F2 on the left side, while on factorial axes F2 and F3 on the right side. Each red dot represents an active variable. Source: The authors.
The F2 and F3 projection further illustrates secondary variability by separating HQI subgroups associations and depth from the granulometric–geochemical cluster defined by C+S, Al, Mg, K, and Ca. This separation suggests that, beyond the dominant variance captured by F1, HQI variability may retain an additional vertical component related to depth.
4. Discussion
4.1. Possible Spatial Controls, Pedogenetic Pathways and Transformation Sequences
The present results provide further resolution on the spatial organization and interpretation of 2:1 phyllosilicates within this framework. Results suggest that spatial expression of 2:1 phyllosilicate subgroups across the studied profiles are primarily constrained by granulometry and profile position on the toposequence. Particle-size distribution and slope setting define the physical conditions that regulates solute residence time, fine-material retention and the detectability of secondary mineral phases, consistent with classical soil-system frameworks [27,28].
Within the Nhecolândia soil–lake system, geomorphic setting and horizon architecture further constrain these physical controls. The organization of green loamy horizons, especially in depth, it as key morphological regulator of hydrogeochemistry, influencing local flow paths and promoting spatially structured zones of solute retention and element redistribution along mid- to downslope transitions [6,8]. Therefore, rather than acting as an independent driver, the geochemical variability observed across the toposequences can be explained within this granulometric–morphological template as capable of reinforcing interpretations from mineral distributions.
The coupling between soil physical structure and hydrochemical regimes as controls for mineral transformations is a common feature when discussing Pantanal lake environments [7,9,15,24]. The mineral assemblages observed are consistent with progressive, but non-linear, transformation pathways among 2:1 phyllosilicates acting along vertical and lateral gradients. Illite is interpreted as most likely derived from primary micas under conditions of limited hydrological flux and moderate weathering, whereas downslope environments favor the development of smectitic and mixed-layer structures. The interpretation of smectitic phases is consistent with a scenario involving progressive K release during mica alteration and interlayer modification, in which illitic phases may represent transitional and metastable states between inherited primary micas and more expandable 2:1 structures [3,22,25]. Mixed-layer minerals structures occur preferentially in intermediate positions and transitional horizons, which is consistent with layer-by-layer transformation and partial interstratification during pedogenetic processes rather than with terminal mineral products [21,50].
All scenarios agree with the geochemical models for Al-rich systems, such as that of Tardy, Duplay, and Fritz (1987) [20], and Nhecolândia’s pedogenetic studies, such as Andrade et al. (2020) [10]. The occasional interpretation of vermiculite-type components, although limited in frequency, remained compatible with the transformation framework. Overall, the interpretation of illite, smectites, and MLM coexisting within individual profiles suggests the superposition of inherited minerals and ongoing pedogenetic reworking rather than a single linear transformation sequence.
4.2. Estimation of Environmental and Geochemical Controls Under Saline–Alkaline Conditions
The possible pedogenetic pathways interpreted in the profiles are strongly modulated by the environmental and geochemical conditions associated with the saline–alkaline lake system. In this framework, pH emerges as key geochemical indicator of the internal organization of the system, because it simultaneously records mineral stability contrasts and the spatial separation between alkaline perched domains and deeper acidic compartments. However, these geochemical barriers are not generated by pH alone, but by its interaction with horizon geometry, fine-material accumulation and hydrological confinement. Variations in pH, ionic strength and cation availability imposed differential stability fields for 2:1 phyllosilicates, influencing their persistence and transformation along the soil–lake continuum [3,18,20,51].
It is important to note that total concentrations of Al, K, Mg, and Ca reflect contributions from multiple mineral sources, including primary minerals, secondary clay phases, and amorphous components [1,10,24]. Therefore, their interpretation in relation to phyllosilicate distribution must be approached with caution, as these elements cannot be exclusively attributed to the identified clay minerals.
The geochemical results are consistent with elemental accumulation concentrating in intermediate soil profiles, where strong pH contrasts are recurrent and solution retention is expected. These sectors commonly correspond to mid- to downslope transitions. A possible mechanism that may explain aluminum enrichment under hyperacidic conditions involves increased mobilization followed by local retention through complexation and ternary associations with silica (DOM–Al–Si). This mechanism relies on the known affinity of Al3+ for dissolved organic matter, where it can act as a bridging element between organic ligands and silicate species [52]. Although this process has been primarily demonstrated in experimental settings, it is consistent with the environmental conditions of the Nhecolândia lake–soil system, where dissolved silica, aluminum and organic matter coexist under strong pH gradients. With this conceptual framework, complexation processes may contribute to limiting rapid Al transport and promoting localized accumulation within specific horizons. These observations should be regarded as hypotheses consistent with the observed patterns rather than as standard processes. They nevertheless highlight the potential importance of organic components in regulating geochemical redistribution in SAL systems and support future investigations integrating organic matter characterization to better constrain Al dynamics.
Downslope environments and zones proximal to saline–alkaline lakes are characterized by alkaline conditions that indeed are more compatible with smectite stability, whereas transitional or acidic compartments are associated with mixed-layer structures and illite destabilization, consistent with experimental and field-based studies [3,9,25,53]. Although reverse transformation pathways (smectite to illite) have been described in potassium-rich and more confined systems, such as burial diagenetic settings where K availability and hydraulic confinement are consistent with illitization [54,55,56], these conditions are not dominant in the studied soil–lake environment, where open-system pedogenesis and lateral redistribution are a recurrent environmental aspect. The concept of solid-state “conversion” proposed by Tardy, Duplay, and Fritz (1987) [20] provides an appropriate framework for interpreting these transformations, encompassing progressive interlayer modification and chemical exchange.
Environmental confinement and depth further may enhance smectite stability by increasing solute concentration and residence time, explaining the persistence of multiple 2:1 phyllosilicate phases under fluctuating hydrogeochemical conditions [7,20,52].
4.3. Multivariate Integration and Methodological Implications
The multivariate statistical analysis provided quantitative support for the mineralogical and spatial patterns interpreted in the profiles. The PCA results suggest that phyllosilicate assemblages are structured by coupled granulometric, depth-related, and geochemical gradients rather than by isolated pedogenetic processes.
The integration of HQI-adjusted FTIR results with XRD-adjusted data highlighted the complementarity of the analytical approaches. While the HQI highlighted the relative spatial variations between mineral groups, XRD interpretation remained essential in environments where structurally similar or Mg-rich 2:1 phyllosilicates coexisted. In such cases, low HQI values reflected spectral complexity rather than mineral abundance, reinforcing the need for integrated analytical strategies in saline–alkaline pedogenetic systems.
5. Conclusions
This study concludes that the saline–alkaline lake (SAL) soil–lake system of Nhecolândia, Pantanal, is characterized by a complex and spatially organized assemblage of phyllosilicates controlled by granulometry, depth, and local hydrogeochemical conditions, among which pH stands out as a major indicator of mineral stability contrasts and geochemical compartmentalization within the profiles. While no single line of evidence is sufficient to fully resolve the mineral evolution in such environments, the convergence of FTIR, XRD, HQI adjustment, and grain-size separation was considered consistent for supporting the hypotheses presented here.
Illite, smectites, and mixed-layer minerals structures exhibited systematic variations along the toposequences, with illite preferentially associated with upslope settings, and more expandable phases increasingly expressed in downslope and alkaline environments. These trends are consistent with the coherent transformation pathways operating within the Pantanal soil–lake system, even when individual indicators display inherent analytical or environmental limitations.
Overall, the integration of complementary mineralogical and granulometric approaches proved essential for strengthening interpretations in a highly dynamic saline–alkaline context. When combined, these techniques provide a robust and transferable framework for assessing phyllosilicate evolution in the Pantanal and in other soil–lake systems subjected to strong hydrogeochemical gradients.
The results further indicate that the observed mineral assemblages are best interpreted as the outcome of superimposed pedogenetic processes operating under spatially variable and temporally dynamic hydrogeochemical conditions, rather than as products of a single transformation pathway. In this context, soil profiles act as integrative records of soil–water interactions, capturing the combined effects of mineral inheritance and ongoing transformation within a reworked alluvial system. This perspective reinforces the importance of considering process superposition and environmental heterogeneity when interpreting phyllosilicate evolution in tropical wetland settings.
Supplementary Materials
The following supporting information can be downloaded at: https://www.mdpi.com/article/10.3390/min16050466/s1, Figure S1. Representative X-ray diffractograms; Figure S2. FTIR spectra highlighting main absorption bands; File S1. COD reference files used for mineral interpretation.
Author Contributions
Conceptualization, A.R.C.-S. and C.R.M.; methodology, A.R.C.-S., D.A.I., I.N.T. and C.R.M.; software, A.R.C.-S., D.A.I. and I.N.T.; validation, Y.L. and C.R.M.; formal analysis, A.R.C.-S., D.A.I. and C.R.M.; investigation, A.R.C.-S., Y.L. and C.R.M.; resources, A.R.C.-S., A.J.M. and C.R.M.; data curation, A.R.C.-S.; writing—original draft preparation, A.R.C.-S. and C.R.M.; writing—review and editing, A.R.C.-S. and C.R.M.; visualization, A.R.C.-S.; supervision, C.R.M.; project administration, A.R.C.-S., A.J.M. and C.R.M.; funding acquisition, A.R.C.-S., A.J.M. and C.R.M. All authors have read and agreed to the published version of the manuscript.
Funding
This study was financed, in part, by the São Paulo Research Foundation (FAPESP) and National Council for Scientific and Technological Development (CNPq), Brazil. FAPESP Process Numbers are 2016/14225-7, 2019/21157-1, 2021/05631-5 and CNPq Project 2023/1813. The APC was funded by FUSP.
Data Availability Statement
Data are contained within the article and Supplementary Materials.
Acknowledgments
The authors acknowledge the reviewers and the Editorial Board for their time and expertise in evaluating this manuscript and extend their gratitude to all researchers who shared their knowledge and insights on the subjects covered in this work.
Conflicts of Interest
The authors declare no conflicts of interest.
Abbreviations
The following abbreviations are used in this manuscript:
| Al | Aluminum |
| C+S | Clay plus silt content |
| Cal | Calcite |
| Chl | Chlorite |
| COD | Crystallography Open Database |
| Dol | Dolomite |
| DOM | Dissolved organic matter |
| DOM-Al-Si | Organic ternary association of organic matter, aluminum and silica |
| Dw | Downslope |
| Ex | Expansive 2:1 phyllosilicate subgroup |
| F1 | Factorial axis 1 |
| F2 | Factorial axis 2 |
| F3 | Factorial axis 3 |
| FL | Freshwater lake |
| Fsp | Feldspars |
| FTIR | Fourier transform infrared spectroscopy |
| G | Glycolated |
| Gth | Goethite |
| H | Heated at 550° |
| HQI | Hit Quality Index |
| ICP-OES | Inductively coupled plasma optical emission spectroscopy |
| Ilt | Illite |
| Ilt-Sme | Illite–Smectite mixed-layer mineral |
| K | Potassium |
| KBr | Potassium bromide |
| KCl | Potassium chloride |
| Kln | Kaolinite |
| Md, Mid | Midslope |
| Mg | Magnesium |
| MgCl2 | Magnesium chloride |
| MLM | Mixed-layer mineral structures; mixed-layer phyllosilicate subgroup |
| Mnt | Montmorillonite |
| Mnt-Vrm | Montmorillonite–vermiculite mixed-layer mineral |
| Ms | Muscovite |
| N | Natural condition |
| Na | Sodium |
| NaClO | Sodium hypochlorite |
| NEx | Non-expansive 2:1 phyllosilicate subgroup |
| ODFE | Oven-dried fine earth |
| OM | Organic matter |
| OMF | Organic matter free |
| PCA | Principal component analysis |
| PMi | Primary micas phyllosilicate subgroup |
| Qz | Quartz |
| rp | Pearson correlation coefficient |
| SAL | Saline–alkaline lake |
| ScA | Scale A |
| ScB | Scale B |
| ScC | Scale C |
| Sme | Smectite |
| T1 | Toposequence 1 |
| T4 | Toposequence 4 |
| T6 | Toposequence 6 |
| T7 | Toposequence 7 |
| Up | Upslope |
| USDA | United States Department of Agriculture |
| Var | Active variable |
| Vrm | Vermiculite |
| XRD | X-ray diffraction |
References
- Furquim, S.A.C.; Vidoca, T.T. Salt-Affected Soils of Pantanal Wetland. In Saline and Alkaline Soils in Latin America; Furquim, S.A.C., Vidoca, T.T., Eds.; Springer International Publishing: Cham, Switzerland, 2020; pp. 229–254. [Google Scholar] [CrossRef] [Scilit]
- Pellegrinetti, T.A.; Cotta, S.R.; Sarmento, H.; Costa, J.S.; Delbaje, E.; Montes, C.R.; Camargo, P.B.; Barbiero, L.; Rezende-Filho, A.T.; Fiore, M.F. Bacterial communities along environmental gradients in tropical soda lakes. Microb. Ecol. 2023, 85, 892–903. [Google Scholar] [CrossRef] [Scilit] [PubMed]
- Furquim, S.A.C.; Graham, R.C.; Barbiero, L.; Queiroz-Neto, J.P.; Vallès, V. Mineralogy and genesis of smectites in an alkaline-saline environment of Pantanal wetland, Brazil. Clays Clay Miner. 2008, 56, 579–595. [Google Scholar] [CrossRef] [Scilit]
- Furquim, S.A.C.; Graham, R.C.; Barbiero, L.; Queiroz-Neto, J.P.; Vidal-Torrado, P. Soil mineral genesis and distribution in a saline lake landscape of the Pantanal wetland, Brazil. Geoderma 2010, 154, 518–528. [Google Scholar] [CrossRef] [Scilit]
- Furquim, S.A.C.; Barbiero, L.; Graham, R.C.; Queiroz-Neto, J.P.; Ferreira, R.P.D.; Furian, S. Neoformation of micas in soils surrounding an alkaline-saline lake of Pantanal wetland, Brazil. Geoderma 2010, 158, 331–342. [Google Scholar] [CrossRef] [Scilit]
- Barbiero, L.; Rezende-Filho, A.; Furquim, S.A.C.; Furian, S.; Sakamoto, A.Y.; Valles, V.; Graham, R.C.; Fort, M.; Ferreira, R.P.D.; Queiroz-Neto, J. Soil morphological control of hydrogeochemistry in a saline and freshwater lake landscape in the Pantanal of Nhecolândia, Brazil. Geoderma 2008, 148, 91–106. [Google Scholar] [CrossRef] [Scilit]
- Merdy, P.; Gamrani, M.; Montes, C.R.; Rezende-Filho, A.T.; Barbiero, L.; Ishida, D.A.; Silva, A.R.C.; Melfi, A.J.; Lucas, Y. Processes and rates of formation defined by modelling in alkaline to acidic soil systems in Brazilian Pantanal wetland. Catena 2022, 210, 105876. [Google Scholar] [CrossRef] [Scilit]
- Costa-Silva, A.R.; Lucas, Y.; Rezende-Filho, A.T.; Ramos, M.D.; Merdy, P.; Ishida, D.A.; Barbiero, L.; Melfi, A.J.; Montes, C.R. Soils surrounding saline-alkaline lakes of Nhecolândia, Pantanal, Brazil: Toposequences, mineralogy and chemistry. Geoderma Reg. 2024, 36, e00746. [Google Scholar] [CrossRef] [Scilit]
- Furquim, S.A.C.; Santos, M.A.; Vidoca, T.T.; Balbino, M.A.; Cardoso, E.L. Salt-affected soils evolution and fluvial dynamics in the Pantanal wetland, Brazil. Geoderma 2017, 286, 139–152. [Google Scholar] [CrossRef] [Scilit]
- Andrade, G.R.P.; Furquim, S.A.C.; Nascimento, T.T.V.; Brito, A.C.; Camargo, G.R.; Souza, G.C. Transformation of clay minerals in salt-affected soils, Pantanal wetland, Brazil. Geoderma 2020, 371, 114380. [Google Scholar] [CrossRef] [Scilit]
- Oliveira, N.S.; Schiavo, J.A.; Pereira, M.G.; Coêlho, R.S.; Ozório, J.M.B.; Moraes, E.M.V. Pedogenesis of soils with accumulation of organic carbon in the subsurface horizons in a saline lake in the Pantanal wetland of Nhecolândia, Brazil. J. S. Am. Earth Sci. 2022, 117, 103816. [Google Scholar] [CrossRef] [Scilit]
- Assine, M.L.; Merino, E.R.; Pupim, F.N.; Warren, L.V.; Guerreiro, R.L.; Mcglue, M.M. Geology and Geomorphology of the Pantanal Basin. In Dynamics of the Pantanal Wetland in South America; Bergier, I., Assine, M.L., Eds.; Springer: Dordrecht, The Netherlands, 2015; pp. 23–50. [Google Scholar] [CrossRef] [Scilit]
- McGlue, M.M.; Guerreiro, R.L.; Bergier, I.; Silva, A.; Pupim, F.N.; Oberc, V.; Assine, M.L. Holocene stratigraphic evolution of saline lakes in Nhecolândia, southern Pantanal wetlands (Brazil). Quat. Res. 2017, 88, 472–490. [Google Scholar] [CrossRef] [Scilit]
- Guerreiro, R.L.; Bergier, I.; Mcglue, M.M.; Warren, L.V.; Abreu, U.G.P.; Abrahão, J.; Assine, M.L. The soda lakes of Nhecolândia: A conservation opportunity for the Pantanal wetlands. Perspect. Ecol. Conserv. 2019, 17, 9–18. [Google Scholar] [CrossRef] [Scilit]
- Barbiero, L.; Queiroz-Neto, J.P.; Ciornei, G.; Sakamoto, A.Y.; Capellari, B.; Fernandes, E.; Vallès, V. Geochemistry of water and ground water in the Nhecolândia, Pantanal of Mato Grosso, Brazil: Variability and associated processes. Wetlands 2022, 22, 528–540. [Google Scholar] [CrossRef] [Scilit]
- Barbiero, L.; Berger, G.; Rezende-Filho, A.T.; Meunier, J.-F.; Martins-Silva, E.R.; Furian, S. Organic Control of Dioctahedral and Trioctahedral Clay Formation in an Alkaline Soil System in the Pantanal Wetland of Nhecolândia, Brazil. PLoS ONE 2016, 11, e0159972. [Google Scholar] [CrossRef] [Scilit] [PubMed]
- Menezes, A.R.; Fontana, A.; Anjos, L.H.C.; Pereira, M.G.; Schiavo, J.A. Soils with dark subsurface horizons in saline basins in the Brazilian Pantanal. Rev. Bras. Ciênc. Solo 2022, 46, e210088. [Google Scholar] [CrossRef] [Scilit]
- Garrels, R.M.; Mackenzie, F.T. Origin of the chemical compositions of some springs and lakes. In Advances in Chemistry; Garrels, R.M., Mackenzie, F.T., Eds.; American Chemical Society: Washington, DC, USA, 1967; pp. 222–242. [Google Scholar] [CrossRef] [Scilit]
- Tardy, Y. Pétrologie des Latérites et des Sols Tropicaux; Masson: Paris, France, 1993; 459p. [Google Scholar]
- Tardy, Y.; Duplay, J.; Fritz, B. Stability Fields of Smectite and Illites As a Function of Temperature and Chemical Composition; SKB Technical Report; CNRS/ULP: Strasbourg, France, 1987; 40p. [Google Scholar]
- Barshad, I. Factors Affecting the Frequency Distribution of Clay Minerals in Soils. Clays Clay Miner. 1966, 14, 207. [Google Scholar] [CrossRef] [Scilit]
- Meunier, A.; Velde, B. Illite; Springer: Berlin/Heidelberg, Germany, 2004. [Google Scholar] [CrossRef] [Scilit]
- Meunier, A.; El Albani, A. The glauconite-Fe-illite-Fe-smectite problem: A critical review. Terra Nova 2007, 19, 95–104. [Google Scholar] [CrossRef] [Scilit]
- Furian, S.; Curti-Martins, E.R.; Parizotto, T.M.; Rezende-Filho, A.T.; Victoria, R.L.; Barbiero, L. Chemical diversity and spatial variability in myriad lakes in Nhecolândia in the Pantanal wetlands of Brazil. Limnol. Oceanogr. 2013, 58, 2249–2261. [Google Scholar] [CrossRef] [Scilit]
- Vidoca, T.T. Gênese de Argilominerais em Solos Afetados Por Sais no Entorno de Lagoas Salobras do Pantanal da Nhecolândia. Master’s Thesis, Universidade de São Paulo, São Paulo, Brazil, 2020. [Google Scholar] [CrossRef] [Scilit]
- Boulet, R.; Humbel, F.-X.; Lucas, Y. Analyse structurale et cartographie en pédologie. I- Prise en compte de l’organisation bidimensionnelle de la couverture pédologique: Les études de toposéquences et leurs principaux apports à la connaissance des sols. Cah. ORSTOM Série Pédol. 1982, 19, 309–321. [Google Scholar]
- Pansu, M.; Gautheyrou, J. Particle size analysis. In Handbook of Soil Analysis; Springer: Berlin/Heidelberg, Germany, 2006; pp. 15–63. [Google Scholar] [CrossRef]
- USDA. Soil Mechanics Level 1. In USDA Soil Textural Classification Study Guide; USDA Soil Conservation Service: Washington, DC, USA, 1987. [Google Scholar]
- Jackson, M.L. Soil Chemical Analysis Advanced Course; Department of Soil Science University: Madison, WI, USA, 1985; 894p. [Google Scholar]
- Anderson, J.U. An improved pretreatment for mineralogical analysis of samples containing organic matter. Clays Clay Miner. 1963, 10, 380–388. [Google Scholar] [CrossRef] [Scilit]
- Madejová, J. FTIR techniques in clay mineral studies. Vib. Spectrosc. 2003, 31, 1–10. [Google Scholar] [CrossRef] [Scilit]
- Russell, J.D.; Fraser, A.R. Infrared Methods. In Clay Mineralogy: Spectroscopic and Chemical Determinative Methods; Wilson, M.J., Ed.; Chapman and Hall: London, UK, 1994; pp. 11–67. [Google Scholar] [CrossRef] [Scilit]
- Ekosse, G.I.E. Fourier Transform Infrared Spectrophotometry and X-ray powder Diffractometry as Complementary Techniques in characterizing Clay size fraction of Kaolin. J. Appl. Sci. Environ. Manag. 2005, 9, 43–48. [Google Scholar] [CrossRef] [Scilit]
- Vaculíková, L.; Plevová, E. Identification of clay minerals and micas in sedimentary rocks. Acta Geodyn. Geomater. 2005, 2, 167–175. [Google Scholar]
- Saikia, B.J.; Parthasarathy, G.; Sarmah, N.C. Fourier transform infrared spectroscopic estimation of crystallinity in SiO2 based rocks. Bull. Mater. Sci. 2008, 31, 775–779. [Google Scholar] [CrossRef] [Scilit]
- Ji, J.; Ge, Y.; Balsam, W.; Damuth, J.E.; Chen, J. Rapid identification of dolomite using a Fourier Transform Infrared Spectrophotometer (FTIR): A fast method for identifying Heinrich events in IODP Site U1308. Mar. Geol. 2009, 258, 60–68. [Google Scholar] [CrossRef] [Scilit]
- Theodosoglou, E.; Koroneus, A.; Soldatos, T.; Zorba, T.; Paraskevopoulos, K.M. Comparative Fourier transform infrared and x-ray powder diffraction analysis of naturally occurred k-feldspars. Bull. Geol. Soc. Greece 2010, 43, 2752–2761. [Google Scholar] [CrossRef] [Scilit]
- Lainé, M.; Balan, E.; Allard, T.; Paineau, E.; Jeunesse, P.; Mostafavi, M.; Robert, J.-L.; Le Caër, S. Reaction mechanisms in swelling clays under ionizing radiation: Influence of the water amount and of the nature of the clay mineral. RSC Adv. 2017, 7, 526–534. [Google Scholar] [CrossRef] [Scilit]
- Acevedo, N.I.A.; Rocha, M.C.G.; Bertolino, L.C. Mineralogical characterization of natural clays from Brazilian Southeast region for industrial applications. Cerâmica 2017, 63, 253–262. [Google Scholar] [CrossRef] [Scilit]
- Zviagina, B.B.; Drits, V.A.; Dorzhieva, O.V. Distinguishing Features and Identification Criteria for K-Dioctahedral 1M Micas (Illite-Aluminoceladonite and Illite-Glauconite-Celadonite Series) from Middle-Infrared Spectroscopy Data. Minerals 2020, 10, 153. [Google Scholar] [CrossRef] [Scilit]
- Jozanikohan, G.; Abarghooei, M.N. The Fourier transform infrared spectroscopy (FTIR) analysis for the clay mineralogy studies in a clastic reservoir. J. Pet. Explor. Prod. Technol. 2022, 12, 2093–2106. [Google Scholar] [CrossRef] [Scilit]
- Tinti, A.; Tugnoli, V.; Bonora, S.; Francioso, O. Recent applications of vibrational mid-Infrared (IR) spectroscopy for studying soil components: A review. J. Cent. Eur. Agric. 2015, 16, 1–22. [Google Scholar] [CrossRef] [Scilit]
- Margenot, A.J.; Calderón, F.J.; Parikh, S.J. Limitations and potential of spectral subtractions in Fourier-transform infrared spectroscopy of soil samples. Soil Sci. Soc. Am. J. 2016, 80, 10–26. [Google Scholar] [CrossRef] [Scilit]
- Boruta, M. FT-IR Search Algorithm—Assessing the Quality of a Match. Spectroscopy Online 2012. Available online: https://www.spectroscopyonline.com/view/ft-ir-search-algorithm-assessing-quality-match (accessed on 18 April 2026).
- Wilson, M.J. X-ray powder diffraction methods. In A Handbook of Determinative Methods in Clay Mineralogy; Wilson, M.J., Ed.; Chapman and Hall: New York, NY, USA, 1987; pp. 26–98. [Google Scholar]
- EMBRAPA. Manual de Métodos de Análise de Solo, 3rd ed.; Embrapa: Brasília, Brazil, 2017; Available online: https://www.embrapa.br/busca-de-publicacoes/-/publicacao/1085209/manual-de-metodos-de-analise-de-solo (accessed on 20 April 2026).
- Jolliffe, I.T. Principal Component Analysis, 2nd ed.; Springer: New York, NY, USA, 2002. [Google Scholar]
- Whitney, D.L.; Evans, B.W. Abbreviations for names of rock-forming minerals. Am. Mineral. 2010, 95, 185–187. [Google Scholar] [CrossRef] [Scilit]
- Lucas, J.; Camez, T.; Millot, G. Détermination pratique aux rayons X des minéraux argileux simples et interstratifies. Bull. Serv. Cart. Géologique D’alsace Lorraine 1959, 12, 21–31. [Google Scholar] [CrossRef] [Scilit]
- Barshad, I.; Kishk, F.M. Chemical composition of soil vermiculite clays as related to their genesis. Contrib. Mineral. Petrol. 1969, 24, 136–155. [Google Scholar] [CrossRef] [Scilit]
- Jones, B.F. Clay mineral diagenesis in lacustrine sediments. In Studies in Diagenesis; Mumpton, F.A., Ed.; US Geological Survey: Washington, DC, USA, 1986; pp. 291–300. [Google Scholar]
- Merdy, P.; Meunier, J.-D.; Ziarelli, F.; Lucas, Y. Evidence of humic acid-aluminium-silicon complexes under controlled conditions. Sci. Total Environ. 2022, 829, 154601. [Google Scholar] [CrossRef] [Scilit]
- Bibi, I.; Singh, B.; Silvester, E. Dissolution of illite in saline-acidic solutions at 25 °C. Geochim. Cosmochim. Acta 2011, 75, 3237–3249. [Google Scholar] [CrossRef] [Scilit]
- Lynch, F.L.; Mack, L.E.; Land, L.S. Burial diagenesis of illite/smectite in shales and the origins of authigenic quartz and secondary porosity in sandstones. Geochim. Cosmochim. Acta 1997, 61, 1995–2006. [Google Scholar] [CrossRef] [Scilit]
- Aubineau, J.; El Albani, A.; Bekker, A.; Somogyi, A.; Bankole, O.M.; Macchiarelli, R.; Meunier, A.; Riboulleau, A.; Reynaud, J.-Y.; Konhauser, K.O. Microbially induced potassium enrichment in Paleoproterozoic shales and implications for reverse weathering on early Earth. Nat. Commun. 2019, 10, 2670. [Google Scholar] [CrossRef] [Scilit] [PubMed]
- Gill, S.; Yemane, K. Illitization in a Paleozoic, peat-forming environment as evidence for biogenic potassium accumulation. Earth Planet. Sci. Lett. 1999, 170, 327–334. [Google Scholar] [CrossRef] [Scilit]

Disclaimer/Publisher’s Note: The statements, opinions and data contained in all publications are solely those of the individual author(s) and contributor(s) and not of MDPI and/or the editor(s). MDPI and/or the editor(s) disclaim responsibility for any injury to people or property resulting from any ideas, methods, instructions or products referred to in the content. |
© 2026 by the authors. Licensee MDPI, Basel, Switzerland. This article is an open access article distributed under the terms and conditions of the Creative Commons Attribution (CC BY) license.