


Abstract
Waste electrical and electronic equipment (WEEE) contains many useful materials like metals, strategic, and critical raw materials, etc., but at the same time it also contains hazardous substances like lead, chromium, cadmium, mercury, etc. WEEE is one of the fastest growing waste streams. Nowadays, recycling has become an essential tool in waste management. Eddy current separation is considered a clean and safe mechanical recycling technology and, therefore, it is imperative to use it wherever possible. The aim of this research was to study the efficiency of separating Al and Cu/brass from the heavy residue fraction of a zig-zag classifier at the end of the technological process of mechanical recycling, after dismantling, several stages of shredding, sieving, magnetic separation, and eddy current separation. The test was carried out on product samples taken from a WEEE recycling plant that still contain 13.29% Al and 4.29% Cu/brass fraction. Another aim was to study the influence of individual operating parameters of the eddy current separator and to determine optimal separation conditions on plant-derived samples. The results showed that it is possible to achieve concentrate quality with an Al and Cu/brass content of 100% at an extreme splitter setting (coded value −1.6732), but with a very low recovery (only 10.70%). It was shown that of the three operating parameters tested, the splitter position and the belt speed have a significant impact on both concentrate grade and recovery, while the internal magnetic rotor speed has no significant impact. Under optimal separation conditions, a concentrate grade of 75.29% was obtained with a recovery of 62.80%.
1. Introduction
In this digital age, we are surrounded by a vast array of devices that we use in our day-to-day lives. But, once these devices reach the end of their useful life, their disposal and recycling become a challenge. Production of electrical and electronic equipment (EEE) requires a variety of scarce metals along with the base metals, and material-wise, waste electrical and electronic equipment (WEEE) is one of the most complex waste streams [1]. Some 20–25 years ago, estimates of annual growth in e-waste were in the range of 3-5% [2]. Similarly, a more recent projection estimates annual WEEE growth rate at 2 million tonnes [3] which corresponds to a rate of about 4% per year [4]. Since 2010, the annual amount of e-waste generated worldwide has almost doubled, reaching 62 billion kg in 2022. Globally, the amount of EEE placed on market (POM) grew from 62 billion kg in 2010 to 96 billion kg in 2022. It is projected to increase to 120 billion kg in 2030 [5]. The ever-increasing technological development, population growth, living standard increase, and market expansion, along with the widespread availability of goods, indicate that those trends will continue in the future as well. WEEE is one of the fastest-growing waste streams [6,7], growing even faster than municipal waste [8].
WEEE produced in 2019 was equivalent to a value of 57 billion USD [9]. Because of this high economic value, WEEE is referred to as an urban mine as well [10]. Just 17.4% of WEEE was collected and recycled in 2019, which corresponds to about 9.3 million tonnes out of a total of 53.6 million tonnes produced that year [9] and a monetary value of about 10 billion USD, while 82.6% of WEEE went undocumented and was not recycled [11]. Therefore, about 47 billion USD worth of raw material ended up in landfills. Recycling 17.4% of WEEE in 2019 helped to reduce 15 Mt of CO2 equivalents in emissions and about 4 Mt of raw materials [9].
WEEE contains around 69 elements from the periodic table in varying amounts [12]. The composition of WEEE depends on the location, type of equipment and the year of production [13]. Van Yken et al. [14] have recently shown the average composition of the different types of materials present in the WEEE. On average, WEEE contains about 61% of metals, 20% of plastics and varying amounts of glass, ceramics, wood, and rubber-based materials. According to studies, WEEE contains from 15% [15] to 20% [14] of plastics. It can contain up to 60 different kinds of metals [16,17,18], including base and precious metals such as aluminium, gold, iron, silver, platinum, palladium, and cobalt [19]. Strategic and critical raw materials like copper and nickel are also present in WEEE [20]. Since the growing global need for minerals and metals, along with market price fluctuations and supply disruptions, has emphasised their crucial importance in sustaining the global economy [21], the European Commission has identified 17 strategic and 34 critical raw materials, including copper, aluminium and its key ores, that are essential to Europe’s economy, and incorporated under the European Critical Materials Act (Regulation (EU) 2024/1252 of the European Parliament and of the Council, 2024) [22]. Recovering valuable metals from e-waste provides an alternative source of high-value raw materials, which can successfully become part of industrial supply chains [23].
Besides the metals of interest, WEEE also contains some toxic metals and hazardous organic substances such as lead, chromium, cadmium, mercury, polybrominated biphenyl, and polybrominated diphenyl ether [24], that are harmful to human health and the environment [8]. It contains polymers which are hazardous because of their limited degradability [25]. If disposed of directly into the environment, these hazardous materials, including heavy metals from WEEE, can have serious impacts on ecosystems and pose a threat to human health [26,27,28]. Due to their composition, the printed wire boards in WEEE fail the Toxicity Characteristic Leaching Procedure (TCLP) test with a high level of lead leaching out [29]. Because of open burning practices, mechanical treatment and/or acid leaching treatment of WEEE in developing countries, significant amounts of pollutants in the bodies of workers and residents have been reported [28]. The metal recovery from WEEE is mostly performed by leaching, pyrolysis, or hydrometallurgical processes. All these processes produce gases that are harmful to the environment [30]. A study by Ghisellini et al. [20] showed that recovering metals from WEEE generates less environmental impacts than producing those from primary mining.
The importance of WEEE recycling arises from all the previously mentioned reasons: the strong annual increase in the amount of waste, the constant increase in EE equipment placed on the market, the composition of the waste (a large proportion of useful but also potentially hazardous materials), the potentially harmful impact on the environment, and significant energy savings (and thus reduced emissions into the environment) when recycling instead of obtaining metals from natural raw materials. Because of all of this, WEEE management, especially recycling, will continue to be an area of intensive research in the future. Addressing the main challenges associated with the management and recycling of WEEE, including inadequate legislation and enforcement, lack of adequate infrastructure, collection and sorting systems, and insufficient awareness and participation of consumers, requires an integrated approach that involves all stakeholders (producers, consumers, regulators, and recyclers), with a focus on the implementation of circular economy models aimed at secondary raw material recovery rather than relying on conventional landfill disposal or energy recovery practices [12,23,31,32].
Cost-effective WEEE recycling processes aligned with circular economy principles have an important role in environmental protection, resource conservation, and economic development. Nevertheless, realising these objectives requires appropriate regulatory frameworks, public awareness and participation, and innovative technological solutions including advanced mechanical, metallurgical, and chemical recovery methods [12,31,33,34]. Specifically, mechanical processing relies on physical separation to recover high-grade secondary fractions, while metallurgical and chemical methods enable the extraction and refining of precious and base metals from complex WEEE streams, thereby closing the material loop and reducing reliance on primary resources. Hydrometallurgical processes, used for recovering metal from metal-rich WEEE (especially printed circuit boards), provide a complementary route for WEEE recycling [35]. Furthermore, the integration of advanced sensor-based sorting methods, specifically automated material flow characterisation using RGB computer vision and machine learning, enables continuous, inline monitoring of purity, yield, and recovery [36]. This data-driven approach supports improved process monitoring and optimisation of sorting operations, providing adaptive quality control for complex waste streams.
An overview of mechanical recycling methods was given by Cherrington and Makenji [37], Chicardi et al. [21], and Serpe et al. [12]. Eddy current separation is considered a clean and safe mechanical recycling method [2,38,39]. Therefore, it is not surprising that this separation method has been of interest for research in numerous applications, and the principles on which it is based are an integral part of almost every published study related to it. A large part of those research deals with modelling the trajectory of individual grains in the eddy current separation and the forces acting on it. Rem et al. [40] showed a theoretical model for the particle magnetic moment regarding the effects of particle size, shape, and conductivity on the particle trajectory. Lungu and Schlett [41] experimented with small conductive particles of Pb and Cu, between 2 and 8 mm in size, in a vertical type of dynamic eddy current separator. They found that high values of the drum revolution are not needed to increase the separation efficiency, but an appropriate arrangement of the separation parameters is. Maraspin et al. [42] compared the trajectories of real scrap particles processed with an eddy current separator to computer simulations to investigate the effects of particle shape and particle–particle interaction, i.e., effects that are difficult to catch in a purely theoretical model. The results showed that the primary particle parameters are size, conductivity, and initial orientation. Lungu [38,43] used an angular drum eddy current separator for separating a Cu-Pb mixture of grain sizes between 2.5 and 4 mm and a Cu-Al mixture of grain sizes between 2 and 5 mm. The results showed that the maximum separation grade is obtained at an intermediate value of the drum revolution. Nagel [44] recently showed that force and torque calculations can be used to predict the corresponding kinematic trajectories. Jujun et al. [45] showed the models of eddy current force and movement behaviour of nonferrous metallic particle in eddy current separation. All these tests are a significant contribution to the understanding and modelling of eddy current separation. However, to the best of our knowledge, studies involving plant-derived samples have not yet been reported.
In contrast to the aforementioned studies, which focused on developing theoretical models of particle trajectories and the parameters influencing them, we decided to conduct research using industrial samples collected directly from the WEEE recycling plant. The aim of this study was to determine the efficiency of eddy current separation of aluminium and copper/brass from the residue fraction after the mechanical recycling process. Part of the research included determining the influence of the operating parameters of the eddy current separator (independent variables) on the separation efficiency. In addition, two models for calculating (predicting) concentrate grade and recovery (dependent variables) depending on the values of the operating parameters of the eddy current separator were set up. The results of this research can be applied in an industrial environment, since it was carried out on samples directly from the recycling plant, but can also be used in some future research.
2. Materials and Methods
2.1. Applied Material and Sample Preparation
Obtaining a sample that is both representative and reproducible from WEEE is extremely challenging because of the heterogeneous nature of the material [13]. Since the composition of WEEE depends on the location, type of equipment and the year of production, the research was carried out with the mixed residue of WEEE in cooperation with Spectra Media d.o.o. company (Donja Bistra, Croatia).
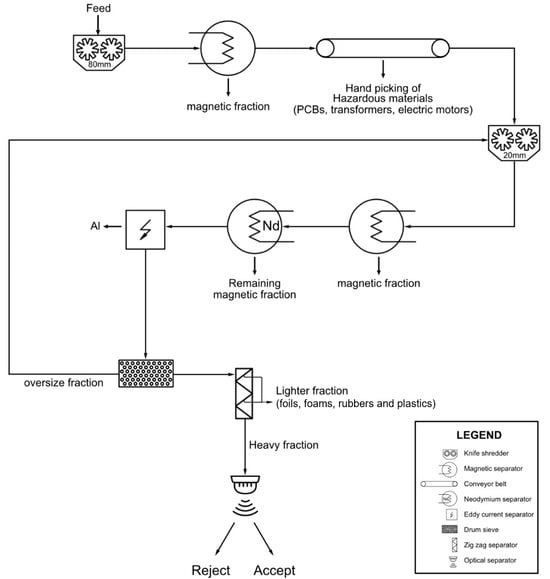
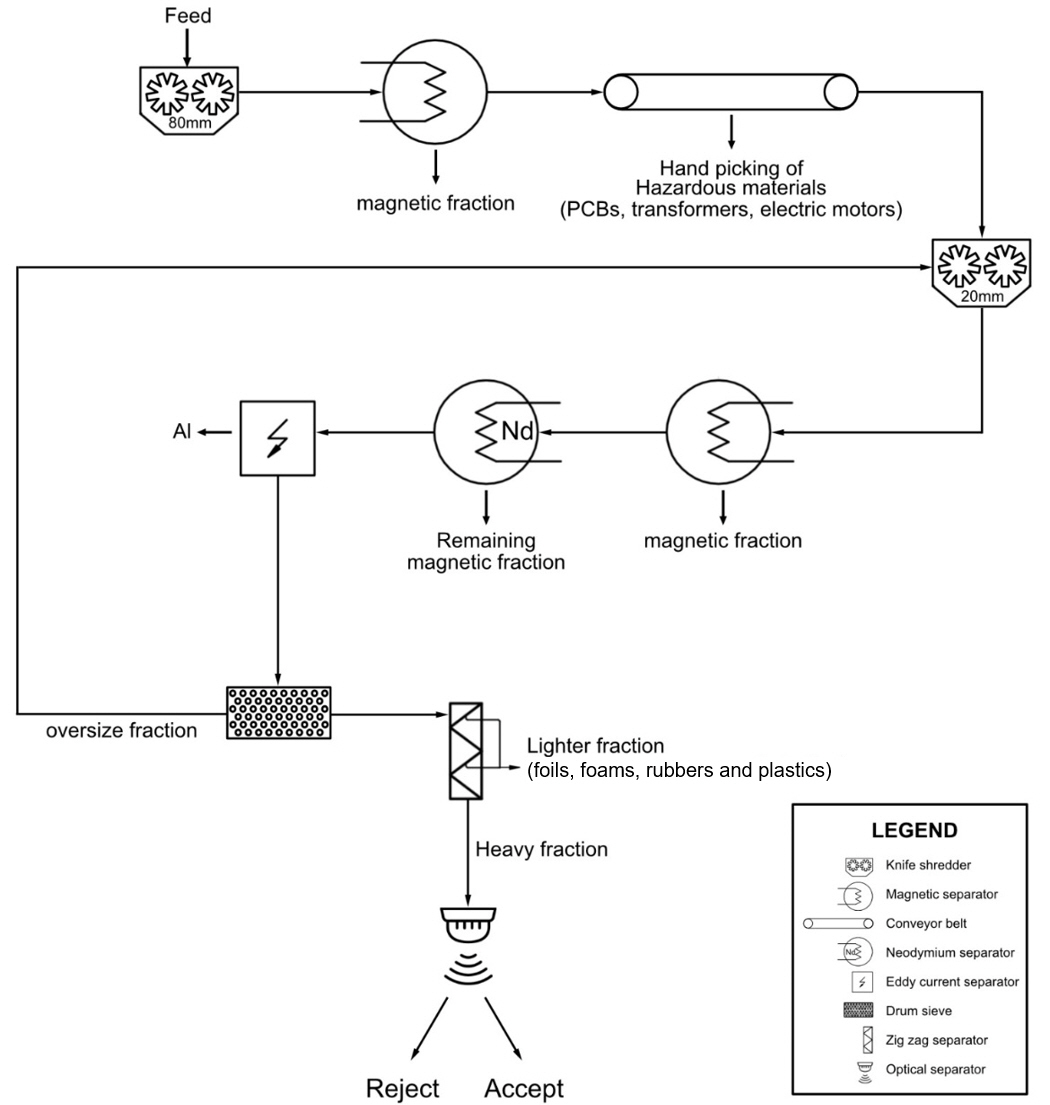
Following preliminary manual sorting, the waste material was shredded in a primary knife shredder into fragments smaller than 80 mm in size (Figure 1). After that, the material underwent magnetic separation to remove the magnetic fraction (iron and steel) from the waste stream, and then went to a conveyor belt where batteries, transformers, electric motors, rubbers, PCBs, etc., are removed by manual screening and picking. The rest of the material was transported to the secondary knife shredder which reduced the size of the material to below 20 mm. The shredded material went through the magnetic separator where the remaining iron was removed from it, and then through the neodymium magnetic separator where any remaining ferrous particles were removed. The non-magnetic stream then passed through an eddy current separator to separate aluminium and other light metals. The remaining fraction subsequently passed through a drum (trommel) screen where the oversize was conveyed back to the secondary shredder. The undersize entered a zig-zag air classifier for removing the light fraction from the material stream which includes foils, foams, rubbers, and plastics. Finally, the heavy fraction from the zig-zag separator was transported to the optical separator. This heavy fraction served as the feed for eddy current separation tests in this study.
Figure 1.
Flowsheet of the sample preparation process.
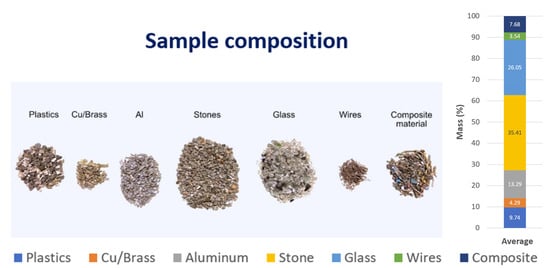
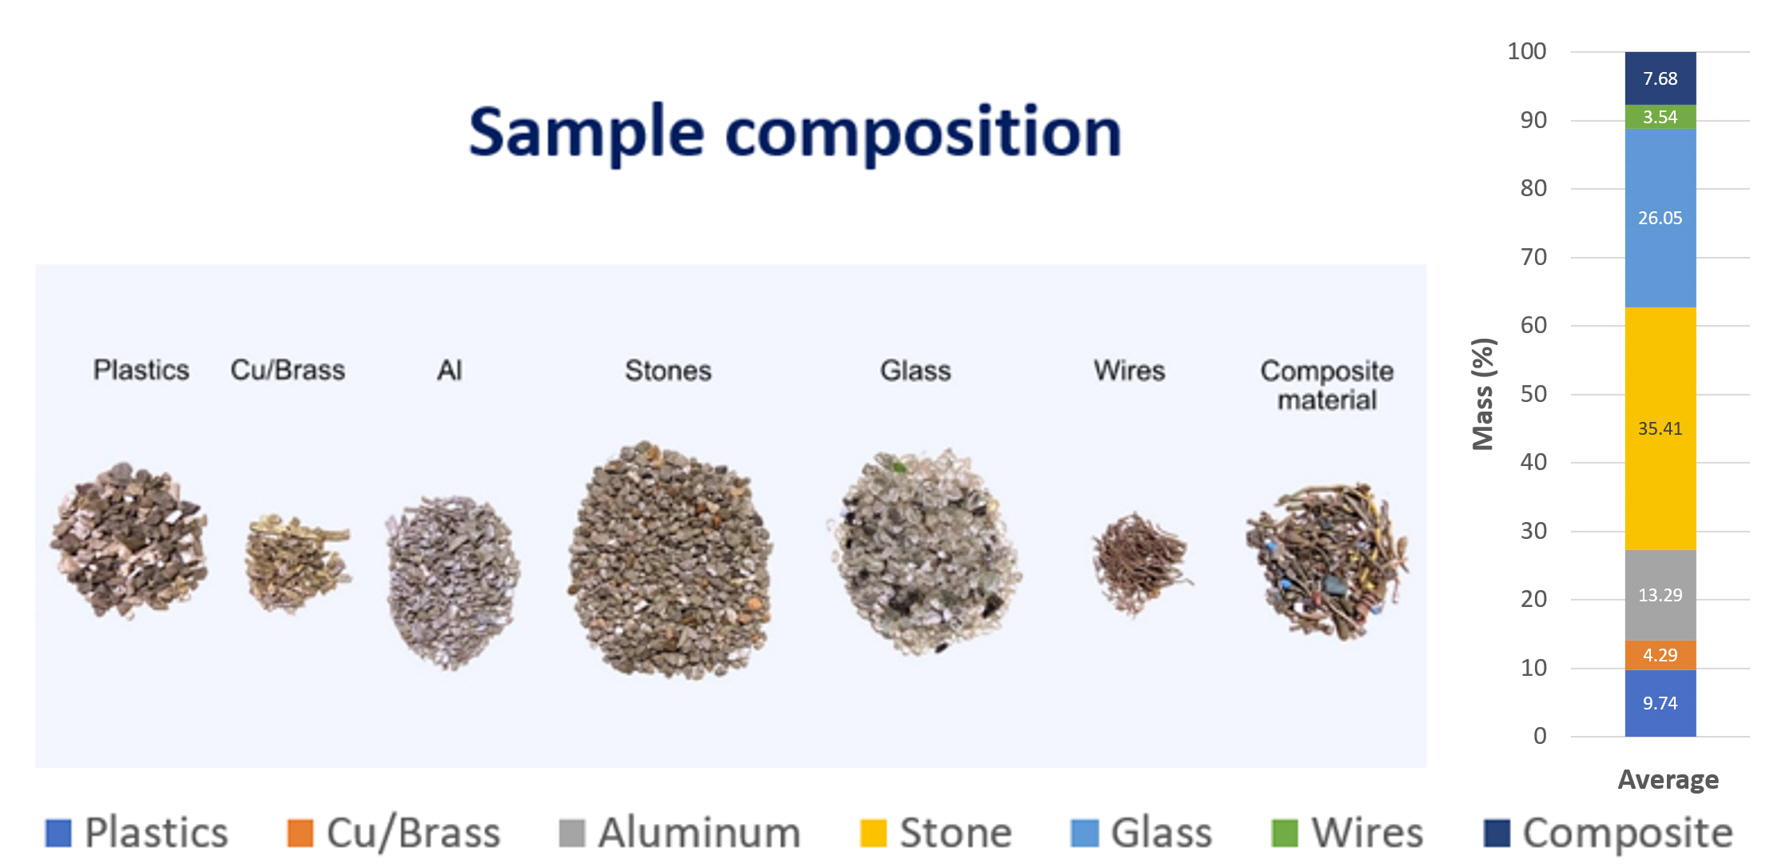
For feed sample characterisation in this study, three grab samples were taken from the heavy fraction separated by the zig-zag separator. The material was sorted manually by look-and-pick method into seven different fractions (Figure 2). The material contained plastics, glass, stones, aluminium, copper/brass, wires, and composite material. It was seen that the highest percentage was stones (35.41% avg.) and glass (26.05% avg.) in all feed samples followed by aluminium (13.29% avg.), plastics (9.74% avg.), composite material (7.68% avg.), Cu/brass (4.29% avg.), and wires (3.54% avg.). Composite material contained wires with insulations, printed circuit board parts, or any other material where two or more materials were joined together. The weight of the individual feed sample was 1 kg, so that after the test it was possible to manually separate all the individual materials in the output products (concentrate and tailings). It was decided to do manual picking instead of using software for photo determination of material composition, because there is the possibility of errors arising due to non-uniformity of the colour of the material when using such software (e.g., due to oxidation or other influences), uncertainty due to the thickness of the material layer (if the material is not widespread in one uniform layer), etc.
Figure 2.
Individual material fractions contained in the feed sample.
2.2. Testing Equipment
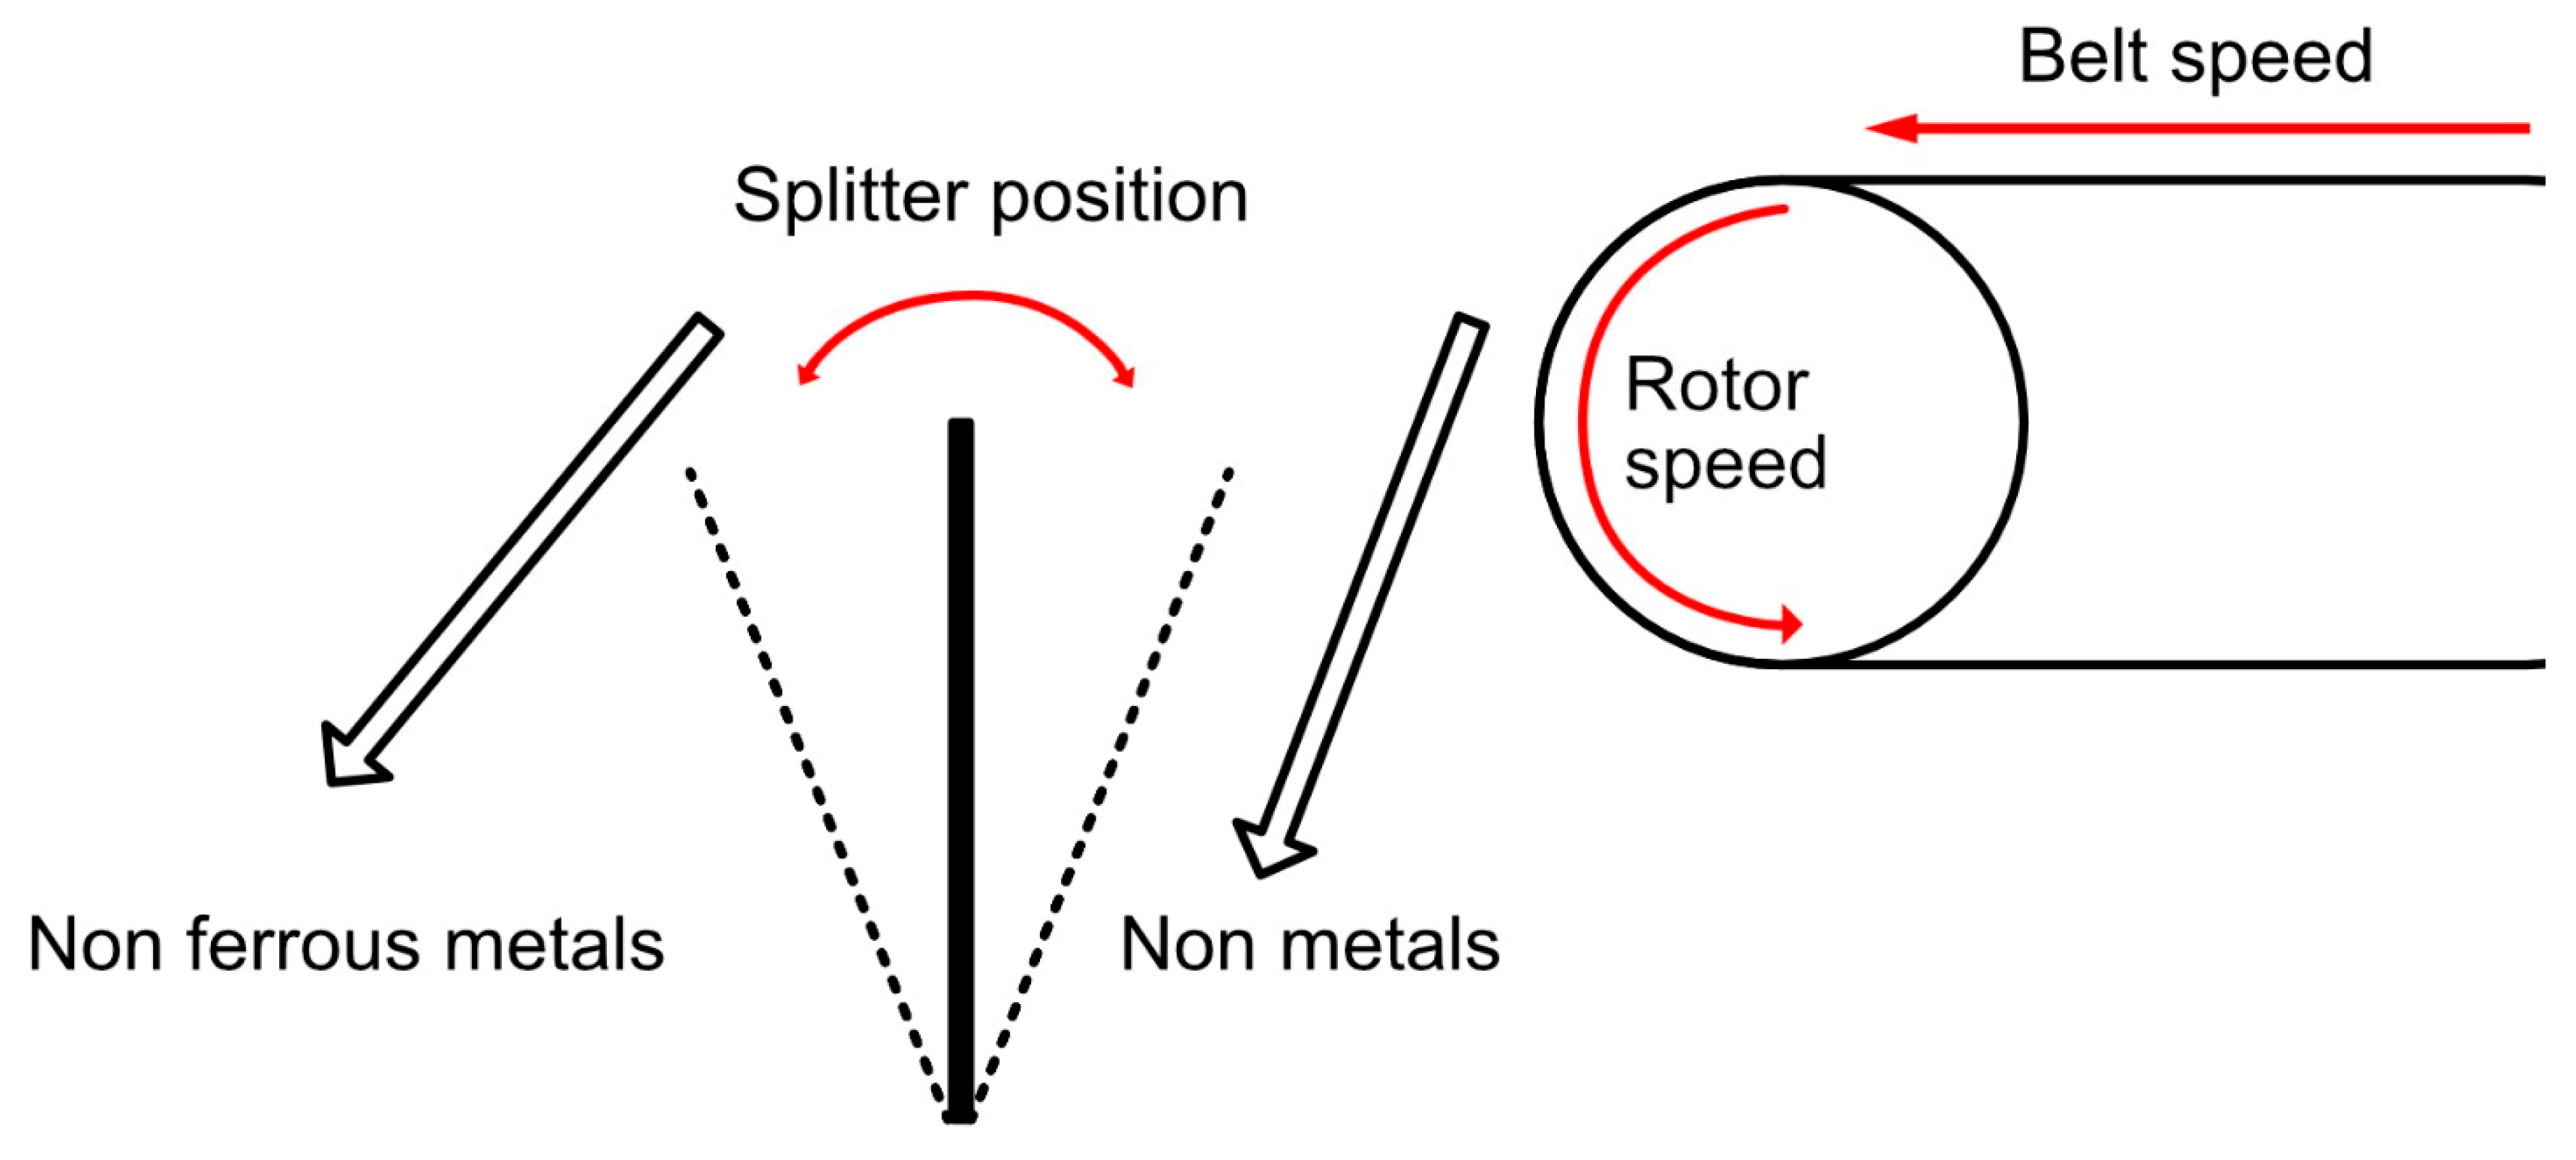
The eddy current separator (ECS) used in this research was a MagnaPower 300 model (Magnapower Equipment Ltd, Bromsgrove, UK), equipped with high-intensity non-deteriorating rare earth (Neodymium) magnets in ECS rotor. Eddy current separation is based on the Faraday’s law of electromagnetic induction and the interaction of the alternating magnetic field with the induced magnetic field which produces a repulsive force [46,47]. Upon interaction with the alternating magnetic field, a current known as an eddy current is produced in the conductor metals. The eddy current induces a magnetic field opposite to the alternating magnetic field, which generates a repulsive force on metal particles, known as Lorentz force. The magnitude of the repulsive force is different for metals of different electrical conductivity. Non-ferrous metal particles are deflected away from the drum (rotor), ferrous metal particles are attracted to the drum and brushed off, and non-metallics are drawn away from the drum by gravity [46,47].
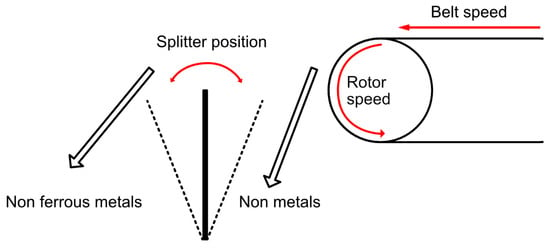
Three operating parameters that govern the separation process in an eddy current separator were tested (Figure 3). The belt speed is given in Hertz (Hz) and is shown on the display. It can be adjusted from 25 Hz to 50 Hz, where 25 Hz corresponds to a speed of 1.32 m/s while 50 Hz corresponds to 2.67 m/s. The splitter position also plays an important role in the separation process by ECS and can be adjusted between the “−5” position and the “5” position. At position “−5”, the splitter is farthest away from the drum, while at position “5” it is closest to the drum. The separation process is also affected by the speed of the internal magnetic rotor which induces an eddy current in particles on the drum (belt). The rotor speed can be adjusted up to 100 Hz (maximum speed) and is also shown on the display. According to the supplier, for most applications, speeds between 70% and 80% show the same performance as the maximum speed (100 Hz).
Figure 3.
Operating parameters and principle of the eddy current separator (adapted from MAGNAPower [48]).
2.3. Testing Procedure and Plan
To determine the influence of individual operating parameters, it was decided to use a central composite design (CCD) for designing the experiments. CCD enables reliable research of the influence of three parameters through 17 tests. To set central values of the tests covered by CCD, it was decided to conduct a series of preliminary tests. This was performed to understand the characteristics of the feed material such as its susceptibility and to optimise the testing central values of ECS operating parameters. Since the analysis of the sample composition showed that stone and glass are the predominant materials (their total mass content in the sample is 61.46%), the goal of the preliminary tests was to identify an approximate splitter position at which stone and glass will not end up in the concentrate bin (Figure 3, non-ferrous metals).
First preliminary test: Initially, the belt speed was set to 35 Hz (1.87 m/s), the splitter position to 2.5 while the internal magnetic rotor was switched off. In this case, most of the stones, glass, and plastics were collected in the concentrate bin.
Second preliminary test: The belt speed was then increased to 38.5 Hz (2.07 m/s). The splitter position was set to position 2, i.e., farther from the belt than in the first test. Some fraction of stone, glass, and plastic was found in the concentrate bin while most of it was collected in the tailings bin (Figure 3, non-metals).
Third preliminary test: The splitter position was changed to 1.5, while the belt speed remained the same (38.5 Hz). In this test, there was no stone in the concentrate bin, and only one glass particle and two plastic particles ended up in the concentrate bin.
Fourth preliminary test: For testing the metallic fractions, the magnetic rotor was turned on and the rotor speed was set to 70 Hz (according to supplier recommendation), while the splitter position and belt speed were maintained at 1.5 and 38.5 Hz, respectively. Most of the aluminium, about 40% of the wires, about 55% Cu/brass, and about 65% of the composite material were collected in the concentrate bin.
Based on the results of the preliminary testing, the following values of operating parameters were set as the central values (coded value “0”) of the CCD:
- -
- Splitter position: 1.5 (coded value “0”);
- -
- Belt speed: 38.5 Hz, i.e., 2.07 m/s (coded value “0”);
- -
- Rotor speed: 70 Hz or 70% of maximum speed (coded value “0”).
The “step” (value change) for belt speed, splitter position, and rotor speed were chosen to be 5 Hz, 1.5, and 10 Hz, respectively. This defined the test plan.
After the grain size analysis by sieving, the initial sample was manually sorted to make identical feed samples (according to average composition, Figure 2) for testing in accordance with CCD. The mass of the individual feed sample was 1 kg.
Particle size analysis of the initial sample was performed by using hand sieves with the mesh sizes of 2, 4, 8, and 10 mm. To make sure that all particles had a chance to go through the sieve, the sieve was shaken horizontally, vertically, and around the axis. This allowed the particles of different shapes to orient themselves along the mesh and thus pass through it.
The samples were tested in ECS by setting the corresponding values of the operating parameters (independent variables) according to the testing plan. After the test, the material was collected in two bins (Figure 3), namely concentrate (non-ferrous metals) and tailings (non-metals). Both concentrate and tailings were analysed for the individual products by sorting them manually into seven individual fractions (plastics, Al, Cu/brass, glass, stone, wires, and composite material). After weighing, it was possible to determine separation efficiency for each individual test. This procedure was performed for all 17 test runs.
2.4. Evaluation of Separation Efficiency
The evaluation of ECS efficiency was based on two performance indicators: grade of concentrate and recovery. The grade of concentrate, G, represents the percentage of metals (Al and Cu/brass) contained in the concentrate as the final product and can be expressed by the following equation (adapted from Wills and Finch [49]):
where G is the grade of concentrate in percentage, mAl/Cu is the mass of aluminium and copper/brass fractions in the concentrate in grams, and mC is the mass of the concentrate in grams. The recovery, R, represents the percentage of the metals (Al and Cu/brass) contained in the feed that is recovered into the concentrate and can be expressed by the following equation [49]:
where R is recovery in percentage, C is the mass of the concentrate in grams, c is the mass fraction of metals (aluminium and copper/brass) in the concentrate in percentage, F is the mass of the feed in grams, and f is the mass fraction of metals in the feed material in percentage.
3. Results and Discussion
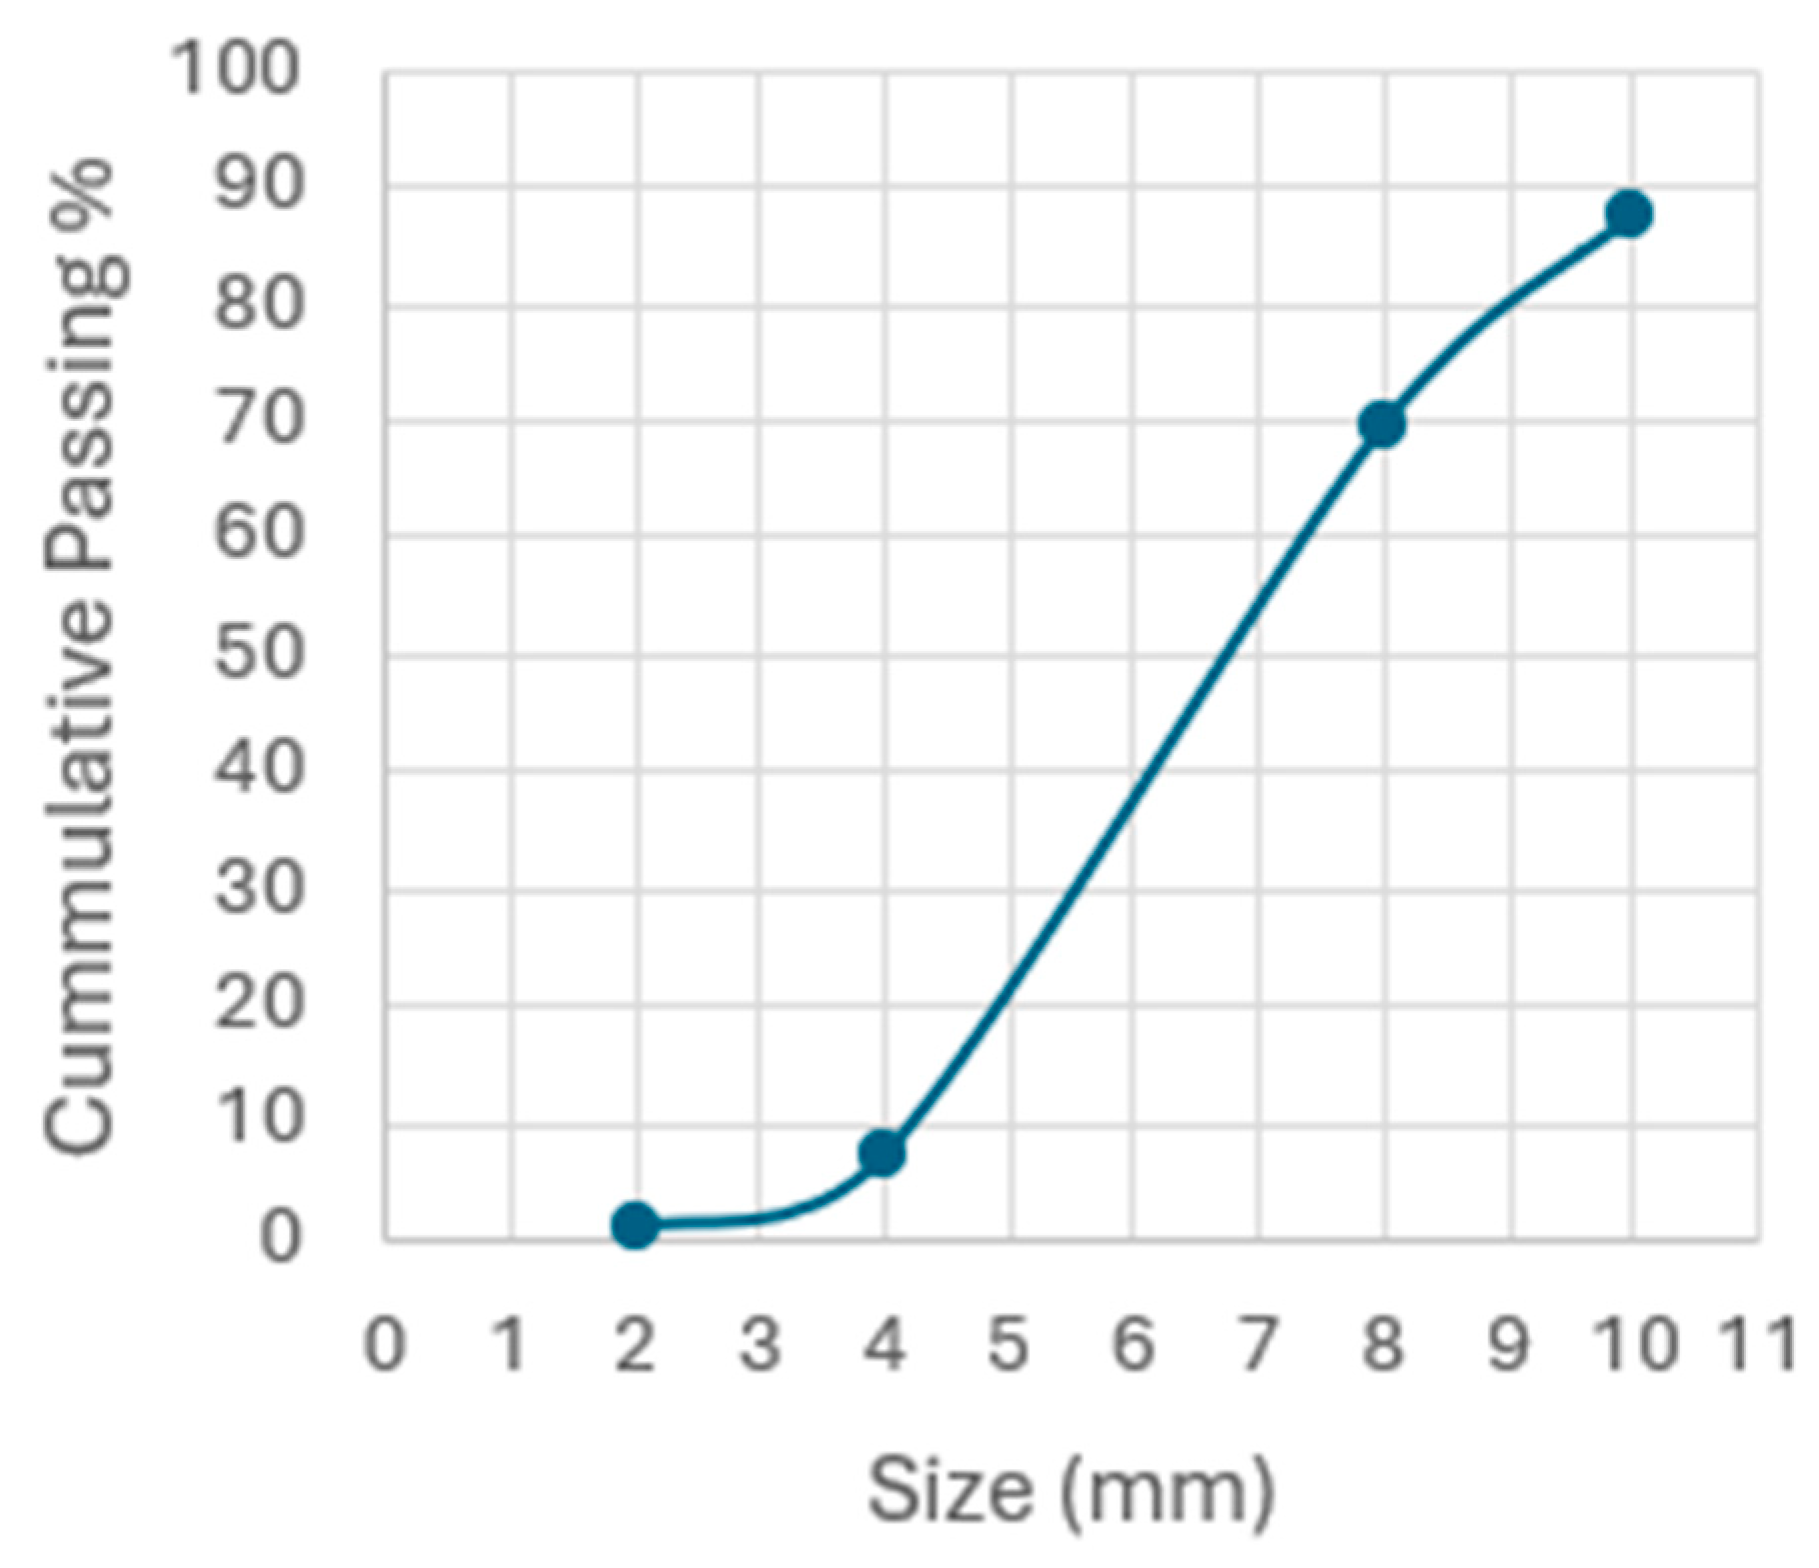
The results of grain size analysis of the average feed sample (Figure 4) show that 80% of the sample grains are larger, i.e., 20% of the grains are smaller than 4.8 mm (the D20 value for the cumulative passing percentage is 4.8 mm). The predominant grain size class in the sample is 8/4 mm with a mass content of 62.30 %, followed by the 10/8 mm grain size class with a content of 17.90 wt% and the +10 mm class with a content of 12.40 wt%. The total content of smaller grain size classes is 7.41% (6.33 % class 4/2 mm and 1.08 % class −2 mm) (Figure 4). This grain size distribution is in accordance with some earlier research [2]. According to Cui and Forssberg [2], in order to be separated, WEEE must be shredded to small or fine-sized particles, usually below 10 mm or even 5 mm. However, some previous research showed limitations of ECS regarding particle size. Namely, the separation becomes less efficient with the smaller particle size classes, and the separation recovery of particles below 5 mm decreases. If the material is comminuted to a particle size below 63 µm, these fines can easily be lost and are potentially hazardous [13].
Figure 4.
Grain size distribution of the feed sample.
The test conditions (values of operating parameters) and the results (concentrate grade and recovery) of separation tests are presented in Table 1. The operating parameter values are presented as both coded and actual values in the table. The aim of the testing was to determine the optimal separation conditions to achieve the highest possible grade of concentrate with the highest possible recovery, as well as the influence of operating parameters on grade and recovery. The grade and recovery values refer to Al and Cu/brass together and not to either of them individually (the metals were a valuable component in this research). The separation efficiency was evaluated based on the balance between concentrate grade and recovery, where maximum values of both are desired. However, the relationship between these two performance indicators is inverse (an increase in one indicator implies a decrease in the other), which means the optimal operating conditions imply compromise between grade and recovery.
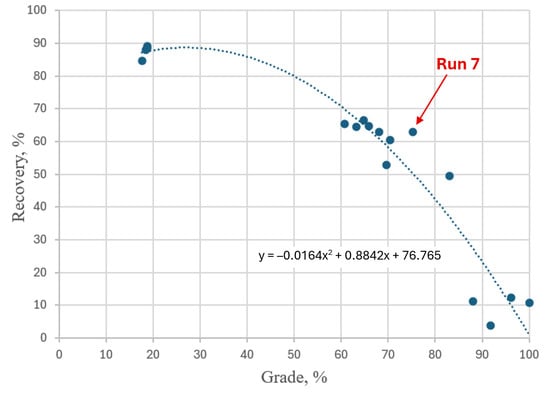
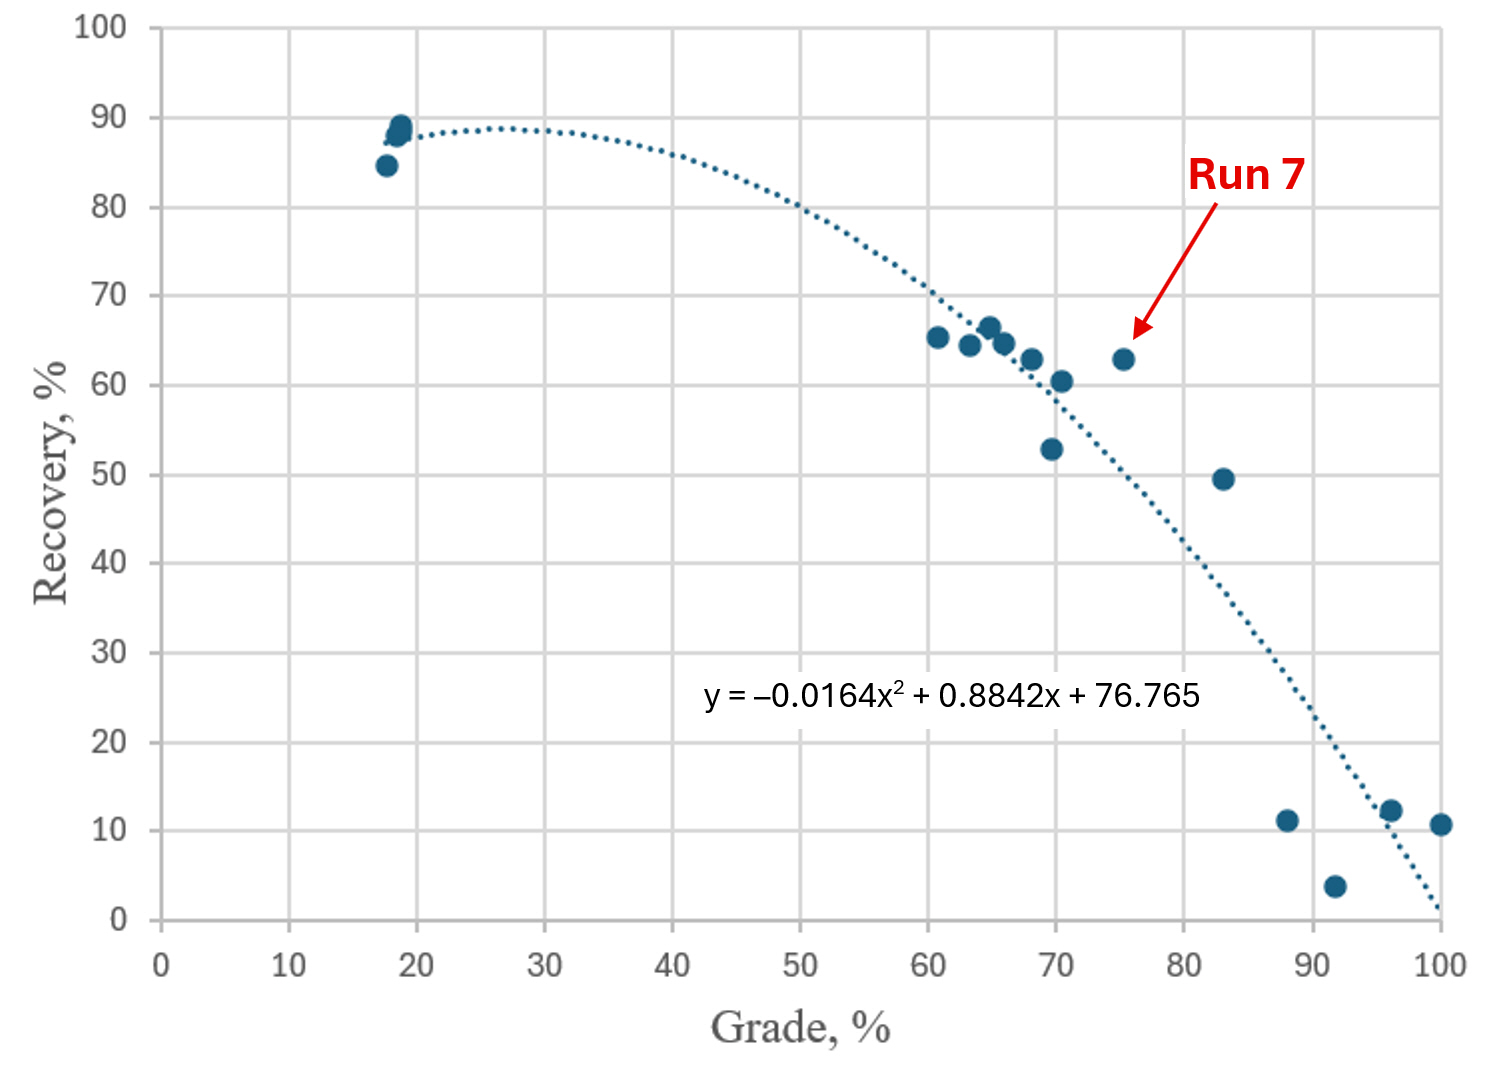
From Table 1, it can be seen that the values of grade and recovery vary significantly, depending on the conditions of separation (combination of operating parameter values). For example, the grade varied in the range from 17.65% (test no. 4) to 100% (test no. 13). There is a similar variation in recovery, from 3.79% (test no. 1) to 89.16% (test no. 9). From the standpoint of achieving a balance between the highest possible grade of concentrate and the highest possible recovery (optimal separation conditions), the best result was obtained in test run no. 7, with a grade of 75.29% and a recovery of 62.80%, as shown in the grade-recovery diagram in Figure 5. Although a grade of 100% is achievable under the conditions of the performed tests (test run no. 13), this certainly does not represent an optimal industrial solution, due to a very low recovery (only 10.70%).
Figure 5.
Grade-recovery curve showing the relationship between concentrate grade and Al and Cu/brass recovery across the experimental design, with the optimal separation conditions represented by the highlighted point (Run 7).
Test runs no. 5, 10, and 17 represent the centre-point tests of the testing plan. In these tests, the values of all independent variables were set to zero as a coded value. The results for the centre points are comparable as the independent variables are set to the same values. Although the composition of feed samples was the same, they differed in the individual grain size and shape, meaning no two samples were completely identical. Consequently, such heterogeneity of the feed samples led to certain variations in the results of these three centre-point tests (grade ranging from 60.67% to 68.06%, and recovery from 63.00% to 65.32%). However, these variations are relatively small compared to the overall response range of the entire experiment (grade: 17.65% to 100%, and recovery: 3.79% to 89.16%), which means they do not compromise the reliability of the developed models.
Table 1.
Plan and results of eddy current separation tests.
The influence of operating parameters was determined based on ANOVA statistical analysis (analysis of variance) which is performed by using Statistica software, version 14.3.0.6, by Cloud Software Group Inc. [50]. Figure 6 shows the graphical interpretation of analysis results, i.e., influence of the operating parameters on grade and recovery. It consists of two columns, the left one relating to concentrate grade and the right one relating to recovery, to make the results easier to compare. The predicted grade and recovery values outside the 0–100% range in peripheral regions of response surfaces shown in Figure 6 are the consequences of the extrapolation of the second-order polynomial models (quadratic equations) generated via Response Surface Methodology in Statistica, as quadratic functions naturally diverge or exhibit asymptotic tendencies in the zones outside the actual experimental matrix. However, the results of all actual experiments (grades and recoveries in all 17 runs) lie strictly within the physical 0–100% domain, depicted as small blue circles on the surface plots, with the lowest recovery being 3.79%.
According to Wills and Finch [49], it is confirmed that an increase in one of these two parameters results in the decrease in the other and vice versa. Figure 6 (top left) shows the change in grade with the change in internal rotor speed and belt speed, while the splitter position is kept constant at the coded value of zero. It can be seen that the grade increases with a decrease in belt speed and that this change is smaller in the higher speed range, while in the lower speed range, the change is larger. However, changing the rotor speed does not significantly affect the grade. Figure 6 (bottom left) shows the change in grade with changing the rotor speed and splitter position, while the belt speed is kept at the coded value of zero. As in the top left of Figure 6, it can be seen that the rotor speed has no significant effect on the grade. On the contrary, the influence of the splitter position is very large. The grade decreases by moving the splitter position from negative to positive values (i.e., by moving the splitter closer to the belt) and vice versa. Figure 6 (middle left) shows the change in grade with changing the splitter position and belt speed, while the rotor speed is kept constant at the coded value of zero. The influence of the belt speed depends on the splitter position. At a negative splitter position (farther from the belt), changing the belt speed has practically no influence on the grade, while increasing the splitter position to positive values (moving closer to the belt) the influence of the belt speed also increases, i.e., the closer the splitter position is to the belt (to value 5), the greater the increase in grade with decreasing belt speed.
Figure 6 (top right) shows the change in recovery with changing rotor and belt speed, while the splitter position is kept constant at the coded value of zero. It can be seen that the recovery increases with increasing belt speed. However, changing the rotor speed does not significantly affect the recovery. Figure 6 (bottom right) shows the change in recovery with changing rotor speed and splitter position, while the belt speed is kept at the coded value of zero. It can also be seen that the rotor speed has no significant effect on the recovery, and the influence of the splitter position is very large regardless of the rotor speed (throughout the entire tested range). In contrast to the grade, the recovery increases by moving the splitter position from negative to positive values (i.e., closer to the belt) and vice versa. Figure 6 (middle right) shows the change in recovery with changing the splitter position and belt speed, while rotor speed is kept at the coded value of zero. The influence of the splitter position depends on the belt speed. At lower belt speeds, the influence of changing the splitter position is much greater than at higher belt speeds. Likewise, the impact of changing the belt speed is much greater at negative values of the splitter position (farther from the belt) than at positive values (closer to the belt).
Figure 6.
Fitted response surfaces of the concentrate grade (left) and the recovery (right) as a function of operating parameters: (top) splitter position = 1.5 (coded value = 0); (middle) rotor speed = 70 Hz (coded value = 0); (bottom) belt speed = 38.5 Hz or 2.07 m/s (coded value = 0).
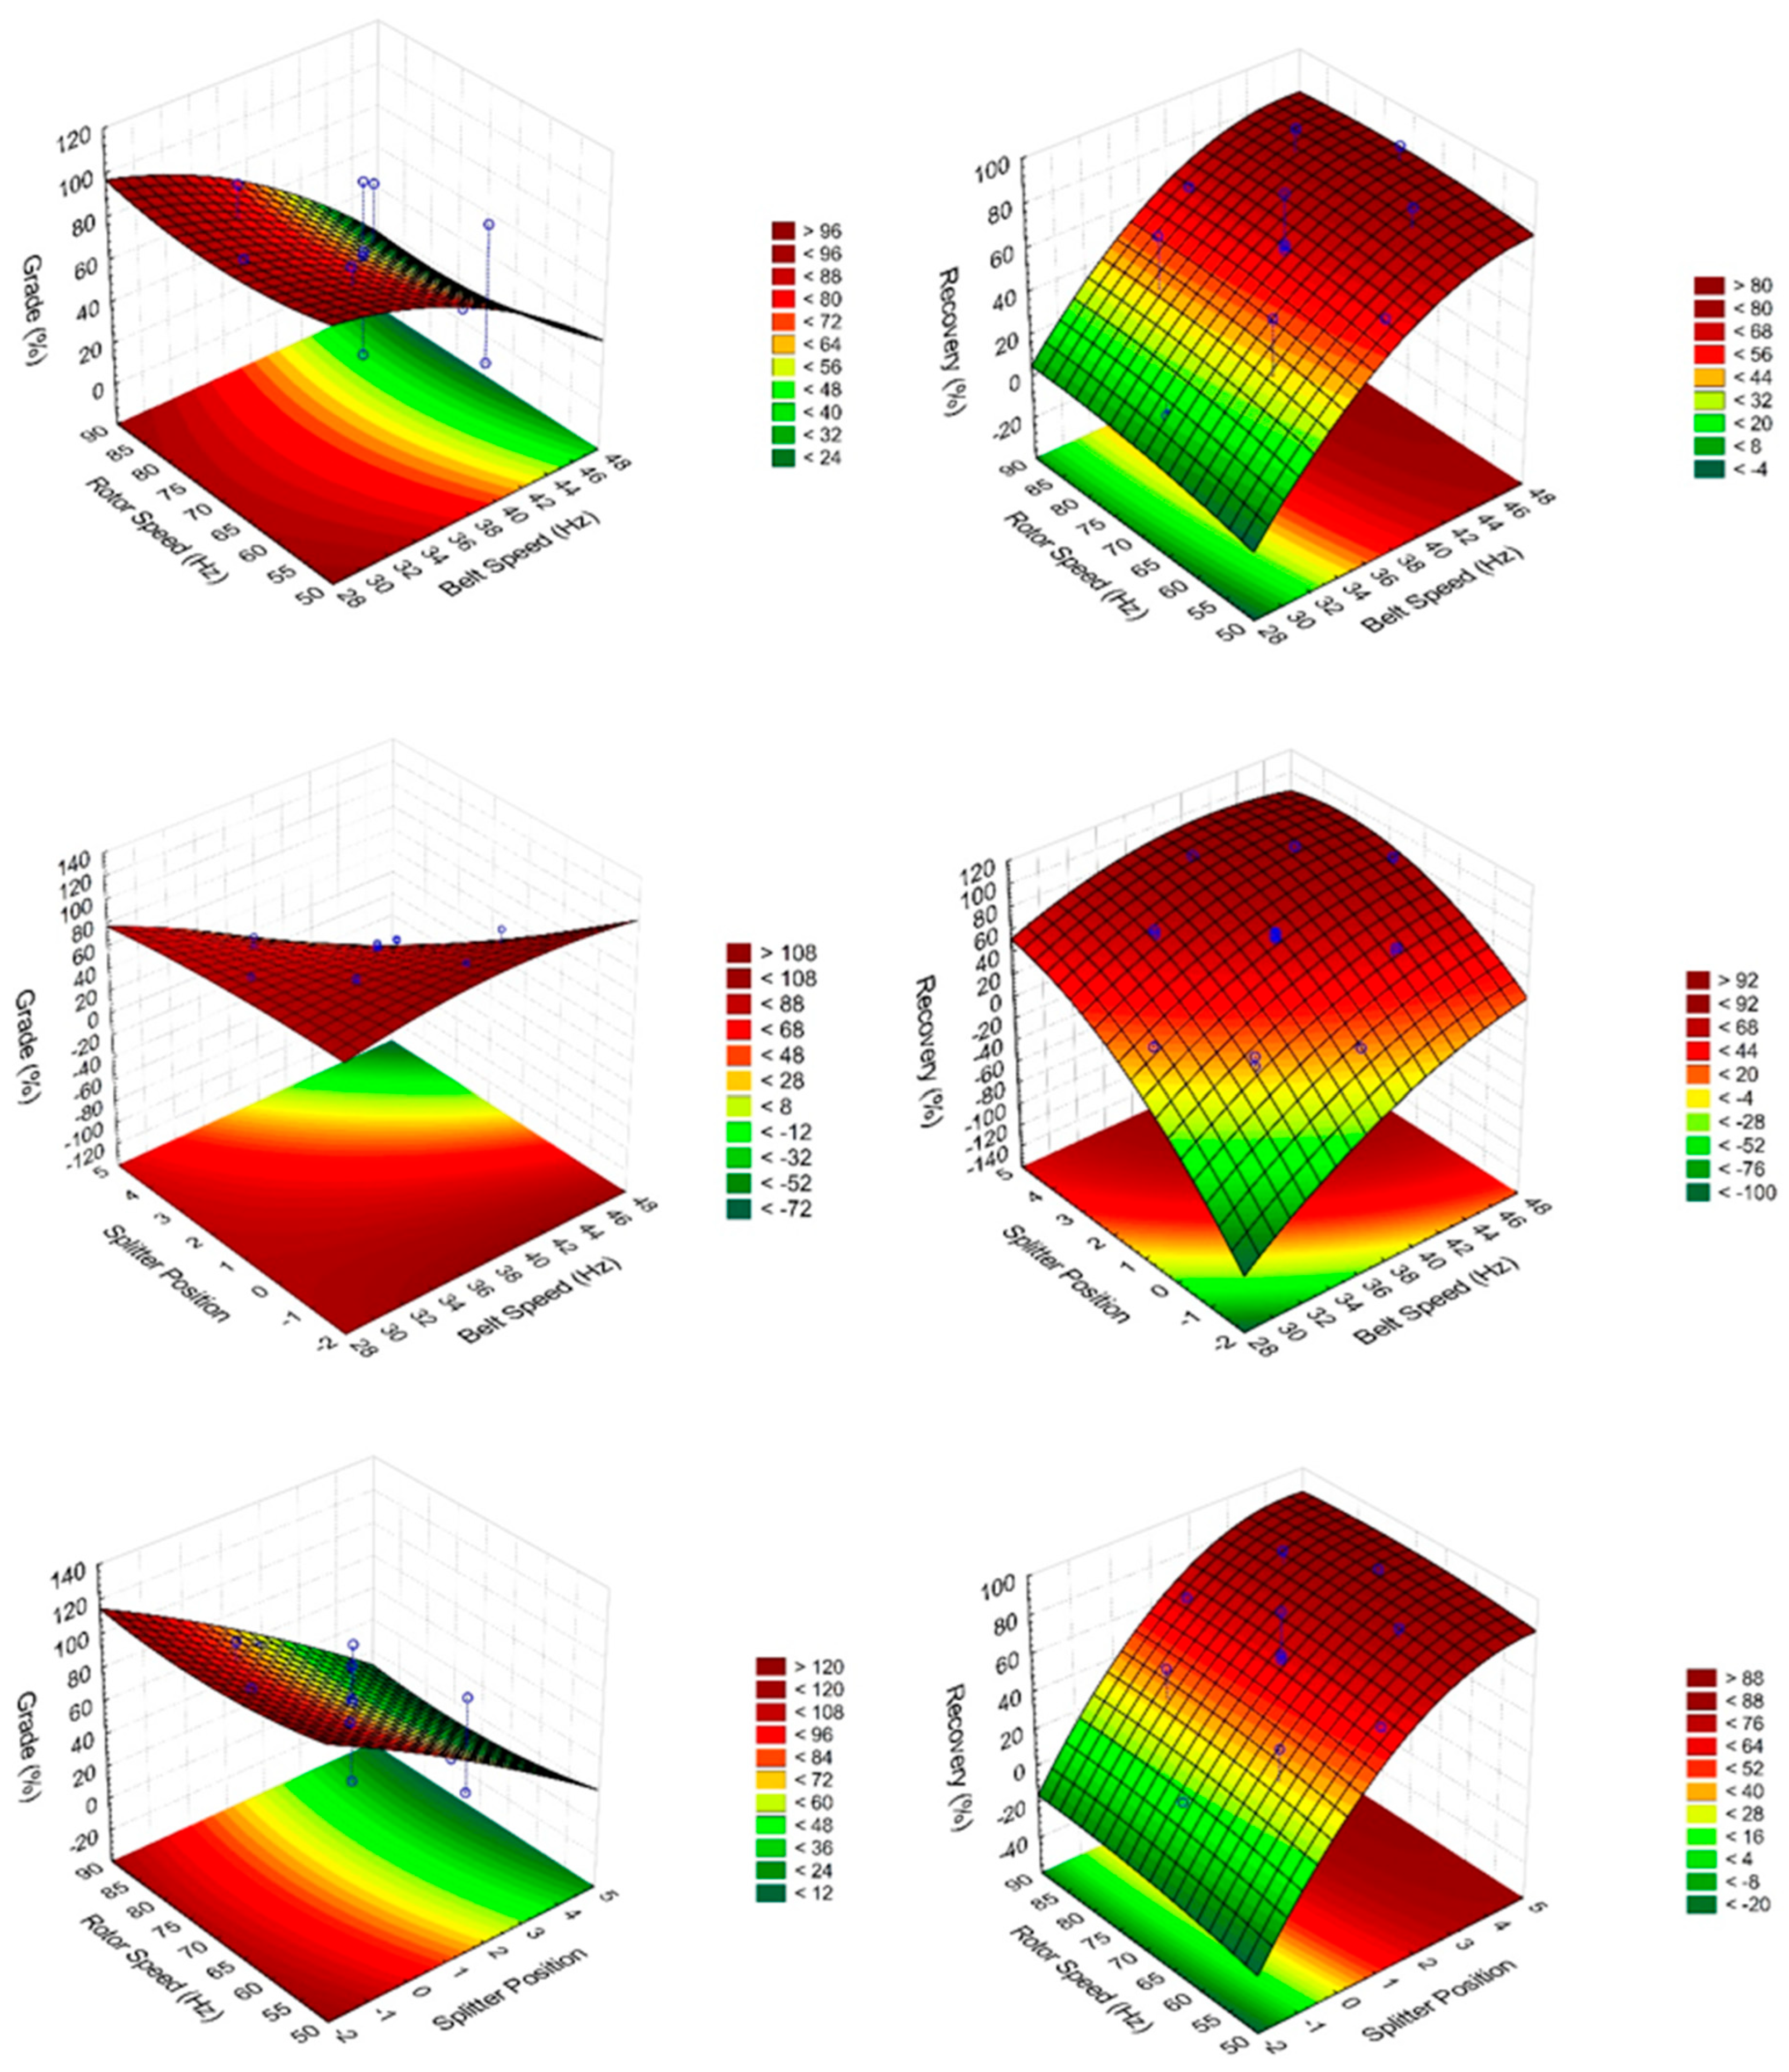
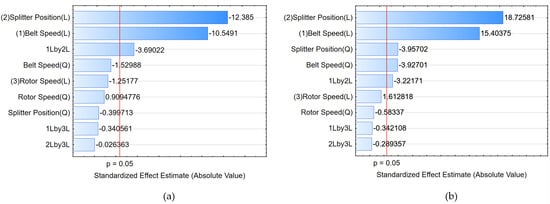
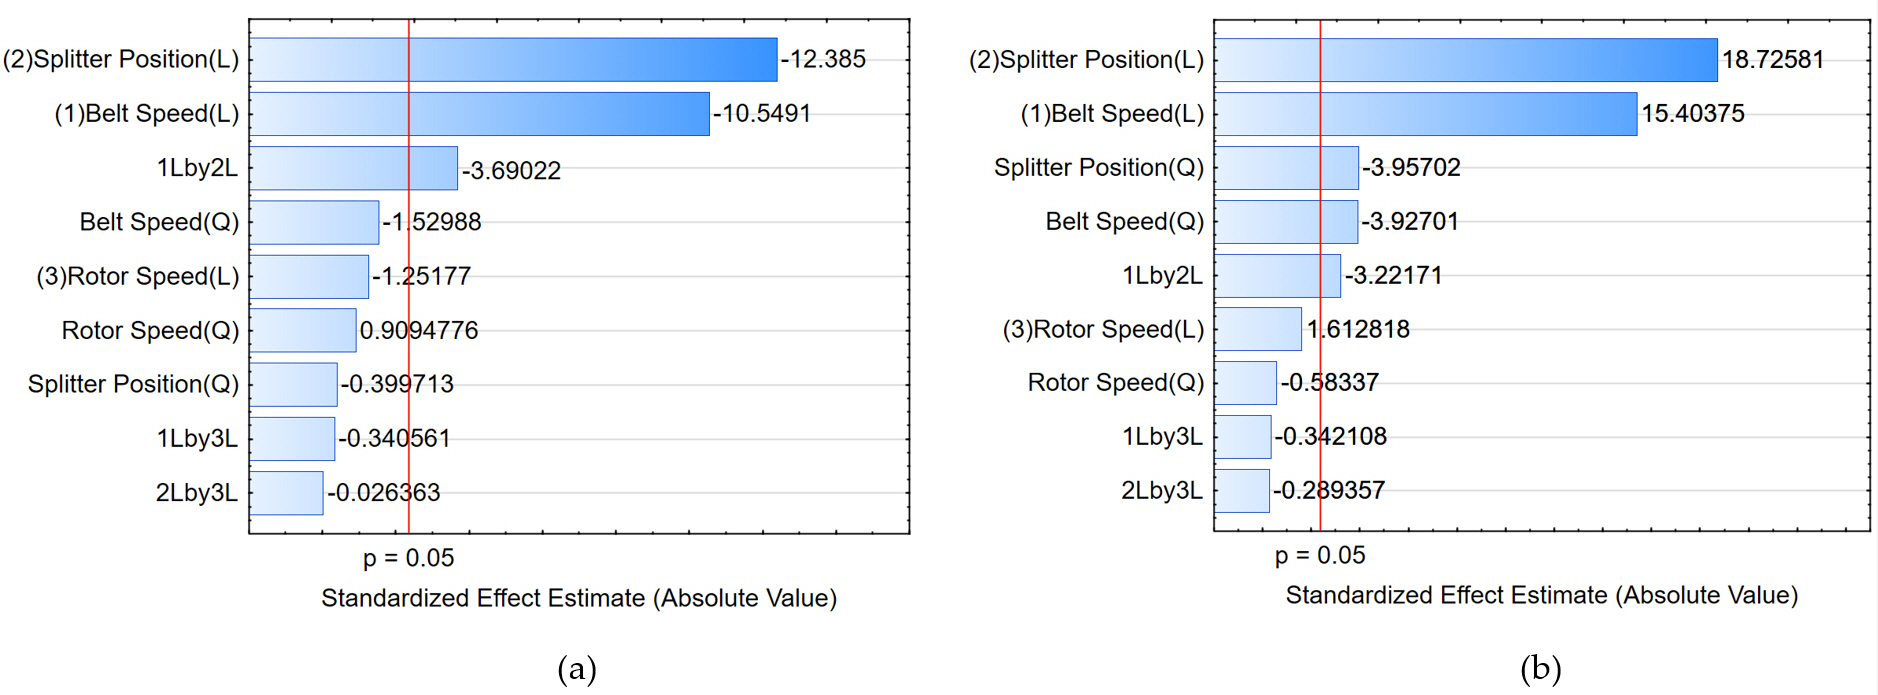
Figure 7 presents the significance of the effect (t-test values) of individual operating parameters and their interactions, and, with the determined level of significance (p = 0.05), it is easier to notice their effect on concentrate grade (Figure 7a) and recovery (Figure 7b). The splitter position and belt speed have a significant effect on both the concentrate grade and recovery, in such a way that, as previously stated, increasing the belt speed and moving the splitter position from negative to positive values (i.e., closer to the belt) results in a decrease in the grade of concentrate and at the same time an increase in recovery. The interaction of belt speed and splitter position also has a significant but much less pronounced effect on both grade and recovery. Neither rotor speed alone nor its interactions with the other two operating parameters have a significant effect on either grade or recovery.
Figure 7.
Significance estimates of the effects of operating variables and their interactions on the grade of concentrate (a) and the recovery (b).
Models of the dependence of grade (G) and recovery (R) on the values of operating parameters were set up based on the ANOVA statistical analysis:
where G is grade of the concentrate in percentage, R is recovery in percentage, x1 is the belt speed, x2 is splitter position, and x3 is the rotor speed, all in coded values. The models exhibited a strong goodness of fit, as indicated by high coefficients of determination obtained from the analysis (R2 = 0.976 and adjusted R2 = 0.945 for grade, R2 = 0.989, and adjusted R2 = 0.975 for recovery).
G = 64.57 − 18.67x1 − 2.95x12 − 22.11x2 − 0.80x22 − 2.22x3 + 1.75x32 − 8.57x1x2 − 0.79x1x3 − 0.06x2x3
R = 64.39 + 18.91x1 − 5.24x12 + 23.18 x2 − 5.46x22 + 1.98x3 − 0.78x32 − 5.19x1x2 − 0.55x1x3 − 0.47x2x3
As already concluded, with regard to the primary goal, i.e., separation of metals (Al and Cu/brass fractions) from the waste fraction after WEEE recycling, the best result was achieved in test no. 7 from the series of 17 tests (grade of 75.29% and recovery of 62.80%). Therefore, to assess the repeatability of the results under optimal conditions, it was decided to conduct another test under conditions identical to those of test no. 7:
- -
- Belt speed: 33.5 Hz, i.e., 1.79 m/s (coded value “−1”);
- -
- Splitter position: 3.0 (coded value “+1”);
- -
- Rotor speed: 60 Hz, i.e., 60% of the max. speed (coded value “−1”).
The results of this additional test were a grade of concentrate of 68.57% with a recovery of 66.58%, while the results obtained by the models were a grade of 70.79% and a recovery of 60.30%.
4. Conclusions
Grain size analysis of the residue after WEEE recycling has shown that the predominant grain size class is 8/4 mm with a content of 62.30 wt%, followed by the 10/8 mm grain size class with a content of 17.90 wt%, and the +10 mm class with a content of 12.40 wt%. Thus, 92.6% of the waste fraction grains are coarser than 4 mm.
Analysis of residue composition after WEEE recycling has shown that it contains plastics, glass, stones, aluminium, copper/brass, wires, and composite materials. The average mass fraction of metals is 17.58% (Al 13.29% avg. and Cu/brass 4.29% avg.). The predominant materials are stones (35.41% avg.) and glass (26.05% avg.).
The results of the separation tests conducted in an eddy current separator according to a CCD have shown that the values of grade (from 17.65% to 100%) and recovery (from 3.79% to 89.16%) vary significantly, depending on separation conditions.
Statistical analysis of the influence of individual operating parameters and their interactions showed that the splitter position and belt speed have a significant effect on both the concentrate grade and the recovery. Increasing the belt speed and moving the splitter position closer to the drum (belt) result in a decrease in concentrate grade and an increase in recovery.
The interaction of belt speed and splitter position has a significant but much less pronounced effect on both grade and recovery. Neither rotor speed nor its interactions with the other two operating parameters have a significant effect on either grade or recovery.
Under optimal eddy current separation conditions (combination of belt speed, rotor speed, and splitter position), a concentrate grade of 75.29%, and a recovery of 62.80% were achieved. Achieving a grade (Al and Cu/brass content in the concentrate) of 100% is possible, however, with a recovery of only 10.70%.
Author Contributions
Conceptualization, G.B.; Methodology, G.B. and I.S.; Investigation, G.B., I.S. and A.R.; Formal analysis, I.S. and A.R.; Resources, G.B.; Writing—original draft, G.B., I.S. and A.R.; Writing—review and editing, G.B. and I.S.; Validation, G.B. and I.S.; Supervision, G.B. All authors have read and agreed to the published version of the manuscript.
Funding
This research was supported by the Virtulab project (grant number: KK.01.1.1.02.0022) co-funded by the European Regional Development Fund, and the University of Zagreb (short-term financial support for research, 2018; grant number: 113400121).
Data Availability Statement
Data are contained within the article. Further inquiries can be directed to the corresponding author.
Acknowledgments
The authors would like to thank the employees of the company Spectra Media, primarily Oskar Ježovita for the time and effort invested in preparing the samples.
Conflicts of Interest
The authors declare no conflicts of interest.
References
- Andersson, M.; Söderman, M.L.; Sandén, B.A. Challenges of recycling multiple scarce metals: The case of Swedish Elv and Weee Recycling. Resour. Policy 2019, 63, 101403. [Google Scholar] [CrossRef] [Scilit]
- Cui, J.; Forssberg, E. Mechanical recycling of waste electric and electronic equipment: A review. J. Hazard. Mater. 2003, 99, 243–263. [Google Scholar] [CrossRef] [Scilit] [PubMed]
- Chaine, C.; Hursthouse, A.S.; Jandric, A.; McLean, B.; McLellan, I.; McMahon, B.; McNulty, J.; Miller, J.; Salhofer, S.; Viza, E. Optimized industrial sorting of WEEE plastics: Development of fast and robust h-XRF technique for hazardous components. Case Stud. Chem. Environ. Eng. 2023, 7, 100292. [Google Scholar] [CrossRef] [Scilit]
- Bressanelli, G.; Saccani, N.; Pigosso, D.C.A.; Perona, M. Circular economy in the WEEE industry: A Systematic Literature Review and a research agenda. Sustain. Prod. Consum. 2020, 23, 174–188. [Google Scholar] [CrossRef] [Scilit]
- Baldé, C.P.; Kuehr, R.; Yamamoto, T.; McDonald, R.; D’Angelo, E.; Althaf, S.; Bel, G.; Deubzer, O.; Fernandez-Cubillo, E.; Forti, V.; et al. The Global E-Waste Monitor 2024. United Nations Institute for Training and Research UNITAR. Available online: https://ewastemonitor.info/wp-content/uploads/2024/12/GEM_2024_EN_11_NOV-web.pdf (accessed on 9 November 2026).
- Nikolic, M.; Bergmann, G.; Schelte, N.; Severengiz, S. Closing the loop of small WEEE—Life cycle based approach for the evaluation of end-of-life strategies on the example of coffee machines. Resour. Conserv. Recycl. 2024, 23, 200220. [Google Scholar] [CrossRef] [Scilit]
- Zeng, X.L.; Mathews, J.A.; Li, J.H. Urban mining of e-waste is becoming more cost-effective than virgin mining. Environ. Sci. Technol. 2018, 52, 4835–4841. [Google Scholar] [CrossRef] [Scilit] [PubMed]
- Lahtela, V.; Hamod, H.; Kärki, T. Assessment of critical factors in Waste Electrical and Electronic Equipment (WEEE) plastics on the recyclability: A case study in Finland. Sci. Total Environ. 2022, 830, 155627. [Google Scholar] [CrossRef] [Scilit] [PubMed]
- Forti, V.; Baldé, C.P.; Kuehr, R.; Bel, G. The Global E-Waste Monitor 2020, Quantities, Flows, and the Circular Economy Potential. Available online: https://www.itu.int/en/ITU-D/Environment/Documents/Toolbox/GEM_2020_def.pdf (accessed on 9 November 2026).
- Jadhao, P.R.; Mishra, S.; Singh, A.; Pant, K.K.; Nigam, K.D.P. A sustainable route for the recovery of metals from waste printed circuit boards using methanesulfonic acid. J. Environ. Manag. 2023, 335, 117581. [Google Scholar] [CrossRef] [Scilit] [PubMed]
- Pan, X.; Wong, C.W.Y.; Li, C. Circular economy practices in the Waste Electrical and Electronic Equipment (WEEE) industry: A systematic review and future research agendas. J. Clean. Prod. 2022, 365, 132671. [Google Scholar] [CrossRef] [Scilit]
- Serpe, A.; Purchase, D.; Bisschop, L.; Chatterjee, D.; De Gioannis, G.; Garelick, H.; Kumar, A.; Peijnenburg, W.J.G.M.; Piro, V.M.I.; Cera, M.; et al. 2002–2022: 20 years of e-waste regulation in the European Union and the worldwide trends in legislation and innovation technologies for a circular economy. RSC Sustain. 2025, 3, 1039–1083. [Google Scholar] [CrossRef] [Scilit]
- Hubau, A.; Chagnes, A.; Minier, M.; Touzé, S.; Chapron, S.; Guezennec, A.G. Recycling-oriented methodology to sample and characterize the metal composition of waste printed circuit boards. Waste Manag. 2019, 91, 62–71. [Google Scholar] [CrossRef] [Scilit] [PubMed]
- Van Yken, J.; Boxall, N.J.; Cheng, K.Y.; Nikoloski, A.N.; Moheimani, N.R.; Kaksonen, A.H. E-waste recycling and resource recovery: A review on technologies, barriers and enablers with a focus on Oceania. Metals 2021, 11, 1313. [Google Scholar] [CrossRef] [Scilit]
- Gulliani, S.; Volpe, M.; Messineo, A.; Volpe, R. Recovery of metals and valuable chemicals from waste electric and electronic materials: A critical review of existing technologies. RSC Sustain. 2023, 1, 1085–1108. [Google Scholar] [CrossRef] [Scilit]
- Debnath, B.; Chowdhury, R.; Ghosh, S.K. Sustainability of metal recovery from e-waste. Front. Environ. Sci. Eng. 2018, 12, 2. [Google Scholar] [CrossRef] [Scilit]
- Deubzer, O.; Herreras, L.; Hajosi, E.; Hilbert, I.; Buchert, M.; Wuisan, L.; Zonneveld, N. Baseline and Gap/Obstacle Analysis of Standards and Regulations. CEWASTE Voluntary Certification Scheme for Waste Treatment. Available online: https://cewaste.eu/wp-content/uploads/2020/03/CEWASTE_Deliverable-D1.1_191001_FINAL-Rev.200305.pdf (accessed on 9 November 2026).
- Liu, K.; Tan, Q.; Yu, J.; Wang, M. A global perspective on e-waste recycling. Circ. Econ. 2023, 2, 100028. [Google Scholar] [CrossRef] [Scilit]
- Andersen, T.; Jæger, B.; Mishra, A. Circularity in waste electrical and electronic equipment (WEEE) directive. Comparison of a manufacturer’s Danish and Norwegian operations. Sustainability 2020, 12, 5236. [Google Scholar] [CrossRef] [Scilit]
- Ghisellini, P.; Passaro, R.; Ulgiati, S. Environmental and social life cycle assessment of Waste Electrical and electronic equipment management in Italy according to EU Directives. Environments 2023, 10, 106. [Google Scholar] [CrossRef] [Scilit]
- Chicardi, E.; Lopez-Paneque, A.; García-Orta, V.H.G.; Sepúlveda-Ferrer, R.E.; Gallardo, J.M. Enrichment Methods for Metal Recovery from Waste from Electrical and Electronic Equipment: A Brief Review. Metals 2025, 15, 140. [Google Scholar] [CrossRef] [Scilit]
- European Parliament and Council of the European Union. Regulation (EU) 2024/1252 of 11 April 2024. Off. J. Eur. Union 2024. OJ L. Available online: https://eur-lex.europa.eu/eli/reg/2024/1252/oj/eng (accessed on 9 November 2026).
- Hossain, R.; Sahajwalla, V. Current recycling innovations to utilize e-waste in sustainable green metal manufacturing. Phil. Trans. R. Soc. A 2024, 382, 20230239. [Google Scholar] [CrossRef] [Scilit] [PubMed]
- ECS Environment Limited. Hazardous Substances in e-Waste. Available online: https://www.ecsenvironment.com/what-is-e-waste/hazardous-substances-in-e-waste/ (accessed on 9 November 2026).
- Diedler, S.; Hobohm, J.; Batinic, B.; Kalverkamp, M.; Kutcha, K. WEEE data management in Germany and Serbia. Glob. NEST J. 2018, 20, 751–757. [Google Scholar] [CrossRef] [Scilit]
- Wang, R.; Xu, Z. Recycling of non-metallic fractions from Waste Electrical and Electronic Equipment (WEEE): A Review. Waste Manag. 2014, 34, 1455–1469. [Google Scholar] [CrossRef] [Scilit] [PubMed]
- He, J.; Duan, C. Recovery of metallic concentrations from waste printed circuit boards via reverse floatation. Waste Manag. 2017, 60, 618–628. [Google Scholar] [CrossRef] [Scilit] [PubMed]
- Vaccari, M.; Vinti, G.; Cesaro, A.; Belgiorno, V.; Salhofer, S.; Dias, M.I.; Jandric, A. WEEE treatment in developing countries: Environmental pollution and Health Consequences—An overview. Int. J. Environ. Res. Public Health 2019, 16, 1595. [Google Scholar] [CrossRef] [Scilit] [PubMed]
- Niu, X.; Li, Y. Treatment of waste printed wire boards in electronic waste for safe disposal. J. Hazard. Mater. 2007, 145, 410–416. [Google Scholar] [CrossRef] [Scilit] [PubMed]
- Hadi, P.; Xu, M.; Lin, C.S.K.; Hui, C.-W.; McKay, G. Waste printed circuit board recycling techniques and product utilization. J. Hazard. Mater. 2015, 283, 234–243. [Google Scholar] [CrossRef] [Scilit] [PubMed]
- Fernando, P.R.; Huang, X.; Dasanayaka, C.H.; McMillan, A.J.; Abeykoon, C. Recycling of end-of-life vehicles and electrical and electronic equipment waste: Current state-of-the-art, challenges and opportunities in a circular economy. Sustain. Horiz. 2026, 20, 100194. [Google Scholar] [CrossRef] [Scilit]
- Perez-Martinez, B.B.; Lopez-Urionabarrenechea, A.; Serras-Malillos, A.; Acha, E.; Martínez-Santos, M.; Caballero, B.M.; Iturrondobeitia, M.; Afonso, H. Recycling of plastic-rich streams from waste electrical and electronic equipment (WEEE) sorting plants: An in-depth study of pyrolysis potential through product characterization and life cycle assessment (LCA). Energy Convers. Manag. 2025, 329, 119633. [Google Scholar] [CrossRef] [Scilit]
- Shahabuddin, M.; Uddin, M.N.; Chowdhury, J.I.; Ahmed, S.F.; Uddin, M.N.; Mofijur, M.; Uddin, M.A. A review of the recent development, challenges, and opportunities of electronic waste (e-waste). Int. J. Environ. Sci. Technol. 2022, 20, 4513–4520. [Google Scholar] [CrossRef] [Scilit]
- Zhang, L.; Xu, Z. A review of current progress of recycling technologies for metals from waste electrical and electronic equipment. J. Clean. Prod. 2016, 127, 19–36. [Google Scholar] [CrossRef] [Scilit]
- Ishak, K.E.H.K.; Ismail, S.; Razak, M.I.B.A. Recovery of copper and valuable metals from E-waste via hydrometallurgical method. Mater. Today Proc. 2022, 66, 3077–3081. [Google Scholar] [CrossRef] [Scilit]
- Vogelgesang, M.; Lopes, A.C.P.; Ionescu, E.; Schebek, L. Material flow composition dataset: RGB-camera-based single-particle images and particle mass data of shredded WEEE. Data Brief 2026, 64, 112413. [Google Scholar] [CrossRef] [Scilit] [PubMed]
- Cherrington, R.; Makenji, K. Chapter 10—Mechanical methods of recycling plastics from WEEE. In Waste Electrical and Electronic Equipment (WEEE) Handbook, 2nd ed.; Goodship, V., Stevels, A., Huisman, J., Eds.; Elsevier Ltd.: Duxford, UK, 2019; pp. 283–310. [Google Scholar]
- Lungu, M. Separation of small non-ferrous particles using an angular rotary drum eddy-current separator with permanent magnets. Int. J. Miner. Process. 2005, 78, 22–30. [Google Scholar] [CrossRef] [Scilit]
- Rolicz, P. Eddy currents generated in a system of two cylindrical conductors by a transverse alternating magnetic field. Electr. Power Syst. Res. 2009, 79, 295–300. [Google Scholar] [CrossRef] [Scilit]
- Rem, P.C.; Leest, P.A.; Van den Akker, A.J. A model for eddy current separation. Int. J. Miner. Process. 1997, 49, 193–200. [Google Scholar] [CrossRef] [Scilit]
- Lungu, M.; Schlett, Z. Vertical drum eddy-current separator with permanent magnets. Int. J. Miner. Process. 2001, 63, 207–216. [Google Scholar] [CrossRef] [Scilit]
- Maraspin, F.; Bevilacqua, P.; Rem, P. Modelling the throw of metals and nonmetals in eddy current separations. Int. J. Miner. Process. 2004, 73, 1–11. [Google Scholar] [CrossRef] [Scilit]
- Lungu, M. Separation of small nonferrous particles using a two successive steps eddy-current separator with permanent magnets. Int. J. Miner. Process. 2009, 93, 172–178. [Google Scholar] [CrossRef] [Scilit]
- Nagel, J.R. An analytic model for eddy current separation. Miner. Eng. 2018, 127, 277–285. [Google Scholar] [CrossRef] [Scilit]
- Jujun, R.; Yiming, Q.; Zhenming, X. Environment-friendly technology for recovering nonferrous metals from e-waste: Eddy current separation. Resour. Conserv. Recycl. 2014, 87, 109–116. [Google Scholar] [CrossRef] [Scilit]
- Rao, S.R. Resource Recovery and Recycling from Metallurgical Wastes, 1st ed.; Elsevier: Oxford, UK, 2006; p. 580. [Google Scholar]
- Wang, D.; Ma, X.; Zhi, X.; Zhang, S. Research Review of Scrap Metals Eddy Current Separation Technology. Sens. Transducers 2013, 158, 242–248. [Google Scholar]
- MAGNAPower. Eddy Current Separator ECS300-1000; MAGNAPower Equipment Limited: Worcestershire, UK, 2020. [Google Scholar]
- Wills, B.A.; Finch, J.A. Wills’ Mineral Processing Technology. An Introduction to the Practical Aspects of Ore Treatment and Mineral Recovery, 8th ed.; Butterworth-Heinemann, Elsevier: Oxford, UK, 2016; p. 512. [Google Scholar]
- Cloud Software Group Inc. Statistica Electronic Manual, Statistica for Windows, version 14.3.0.6; Data Science Workbench: Fort Lauderdale, FL, USA, 2025. [Google Scholar]
Disclaimer/Publisher’s Note: The statements, opinions and data contained in all publications are solely those of the individual author(s) and contributor(s) and not of MDPI and/or the editor(s). MDPI and/or the editor(s) disclaim responsibility for any injury to people or property resulting from any ideas, methods, instructions or products referred to in the content. |
© 2026 by the authors. Licensee MDPI, Basel, Switzerland. This article is an open access article distributed under the terms and conditions of the Creative Commons Attribution (CC BY) license.